Name: ___________________________________ Date: _______________________________ …BLM 4–1... Principles of Mathematics 10: Teacher’s Resource Copyright © 2007 McGraw-Hill Ryerson Limited BLM 4–1 Get Ready Get Ready Scatter Plots 1. The scatter plot shows the height of a maple tree over a period of 7 years. a) Identify the independent variable and the dependent variable. b) Describe the relationship between the variables. c) Predict the height of the tree after 10 years. Translations and Reflections 2. a) Translate the square 2 units up and 3 units to the right. b) Reflect the triangle in the line of reflection and then translate it 2 units to the right. 3. a) Plot the rectangle with vertices (−3, 1), (2, 1), (2, −3), and (−3, −3) on a coordinate grid. b) On the same grid, plot the image of the rectangle after a reflection in the y-axis. c) On the same grid, plot the image of your rectangle in part b) after a translation of 2 units left and 1 unit up. Operations With Powers 4. Use the exponent laws to write each as a single power. a) 2 2 × 2 3 b) 3 4 × 3 6 c) ( ) ( ) 3 2 1 1 5 5 × d) (− 4) 4 ÷ (− 4) 2 e) (3 2 ) 4 f) 5 6 ÷ (5 2 ) 3 g) ( ) ( ) 4 3 2 2 3 3 ÷ h) (−2) 4 ÷ (−2) 3 5. Use the exponent laws to write each as a single power. a) 3 4 × 3 3 ÷ 3 2 b) (−7) 2 × (−7) ÷ (−7) 2 c) (2 3 ) 5 ÷ (2 4 ) 2 × 2 d) ( ) ( ) ( ) 8 4 2 3 3 3 4 4 4 ÷ ÷ e) 5 3 2 0.1 0.1 0.1 ÷ f) 24 3 2 [( 0.4) ] ( 0.4) ( 0.4) − − ×−

Welcome message from author
This document is posted to help you gain knowledge. Please leave a comment to let me know what you think about it! Share it to your friends and learn new things together.
Transcript

Name: ___________________________________ Date: _______________________________
…BLM 4–1...
Principles of Mathematics 10: Teacher’s Resource Copyright © 2007 McGraw-Hill Ryerson Limited BLM 4–1 Get Ready
Get Ready
Scatter Plots 1. The scatter plot shows the height of a maple
tree over a period of 7 years.
a) Identify the independent variable and the
dependent variable. b) Describe the relationship between the
variables. c) Predict the height of the tree after 10 years.
Translations and Reflections 2. a) Translate the square 2 units up and 3 units
to the right.
b) Reflect the triangle in the line of reflection
and then translate it 2 units to the right.
3. a) Plot the rectangle with vertices (−3, 1), (2, 1), (2, −3), and (−3, −3) on a coordinate grid.
b) On the same grid, plot the image of the rectangle after a reflection in the y-axis. c) On the same grid, plot the image of your
rectangle in part b) after a translation of 2 units left and 1 unit up.
Operations With Powers 4. Use the exponent laws to write each as a single
power. a) 22 × 23
b) 34 × 36
c) ( ) ( )3 21 15 5×
d) (− 4)4 ÷ (− 4)2 e) (32)4
f) 56 ÷ (52)3
g) ( ) ( )4 32 23 3÷
h) (−2)4 ÷ (−2)3
5. Use the exponent laws to write each as a single power.
a) 34 × 33 ÷ 32
b) (−7)2 × (−7) ÷ (−7)2 c) (23)5 ÷ (24)2 × 2
d) ( ) ( ) ( )8 4 23 3 34 4 4÷ ÷
e) 5 3
20.1 0.1
0.1÷
f) 2 4
3 2[( 0.4) ]
( 0.4) ( 0.4)−
− × −

Name: ___________________________________ Date: _______________________________
…BLM 4–3...
Principles of Mathematics 10: Teacher’s Resource Copyright © 2007 McGraw-Hill Ryerson Limited BLM 4–3 Section 4.1 Practice Master
Section 4.1 Practice Master
1. Which scatter plot(s) could be modelled using a curve instead of a line of best fit? Explain. a)
b)
2. State whether each line of best fit is a good model for the data. Justify your answer.
a)
b)
3. Are the relations in question 2 linear or non-linear? Explain.
4. a) Complete the table of values for the relation between the area of a circle and its diameter. Then, make a scatter plot of the data.
Diameter (cm) A = πr2 (cm2) 1 2 3 4 5 6
b) Describe the relation. c) Draw a curve of best fit for the data. d) Use your model to predict the area for a
diameter of 2.5 cm. e) Use your model to predict the area for a
diameter of 8 cm. 5. a) Complete the table for the surface area of a
cube.
Side Length, s (cm)
Surface Area, SA = 6s2 (cm2)
1 2 3 4 5 6 7 8
b) Make a scatter plot of the data. c) Describe the relation. d) Draw a curve of best fit for the data. e) Use your model to predict the surface area
for a side length of 7.5 cm. f) Explain why the graph is non-linear.

Name: ___________________________________ Date: _______________________________
…BLM 4–4...
Principles of Mathematics 10: Teacher’s Resource Copyright © 2007 McGraw-Hill Ryerson Limited BLM 4–4 Finite Differences Tables
Finite Differences Tables

Name: ___________________________________ Date: _______________________________
…BLM 4–6...
Principles of Mathematics 10: Teacher’s Resource Copyright © 2007 McGraw-Hill Ryerson Limited BLM 4–6 Section 4.2 Practice Master
Section 4.2 Practice Master
1. The table gives the approximate height of a cannonball for a 6-s flight.
Time, t (s) Height, h (m) 0 0 1 25 2 40 3 45 4 40 5 25 6 0
a) Sketch a graph of the quadratic relation. b) Describe the flight path of the cannonball. c) Identify the axis of symmetry and the
vertex. d) What is the maximum height that the
cannonball reached? e) Verify that h = −5t2 + 30t can be used to
model the flight path of the cannonball. 2. Use finite differences to determine whether
each relation is linear, quadratic, or neither. a) x y b) x y 0 3 − 4 5 1 6 −2 10 2 9 0 20 3 12 2 30 4 15 4 40
c) x y d) x y 1 1 −5 −125 3 9 −3 −27 5 25 −1 −1 7 49 1 1 9 81 3 27
3. A girl is skipping rope when a picture is taken of her. At the instant the picture is taken, her hands are 1 m apart and the centre of the rope is directly above her head, 2 m above her hands. a) Use this information to graph the relation
modelling the shape of the rope. The positions of her hands are the x-intercepts, and the centre of the rope is the y-intercept.
b) Describe the shape of the arch that the rope makes.
4. A ball is thrown upward with an initial velocity of 10 m/s. Its approximate height, h, in metres, above the ground after t seconds is given by the relation h = −5t2 + 10t + 35. a) Sketch a graph of the quadratic relation. b) Describe the flight path of the ball. c) Find the maximum height of the ball. d) How long does it take the ball to reach this
maximum height? 5. The table shows the height of a ball as it
moves, where x represents the distance along the ground and h represents the height above the ground, in metres.
Distance (m) Height (m) 0 12 1 14 2 14 3 12 4 8 5 2
a) Sketch a graph of the quadratic relation. b) Describe the flight path of the ball. c) Identify the axis of symmetry, and explain
why it is the axis of symmetry. d) Identify the vertex. e) What is the maximum height of the ball? f) Verify that h = −x2 + 3x + 12 can be used to
model the flight path of the ball.

Name: ___________________________________ Date: _______________________________
…BLM 4–8...
Principles of Mathematics 10: Teacher’s Resource Copyright © 2007 McGraw-Hill Ryerson Limited BLM 4–8 Section 4.3 Practice Master
Section 4.3 Practice Master
1. For each part, sketch the graph of all four quadratic relations on the same set of axes. a) 2= 2y x− 2= 2y x
21= 2y x−
21= 2y x
b) y = (x + 4)2 y = (x − 3)2 y = (x + 8)2 y = (x − 7)2 c) y = x2 − 2 y = x2 + 2 y = x2 − 0.5 y = −x2 + 0.5
2. For each relation, i) sketch a graph of the parabola ii) label three points on the parabola iii) describe the transformations from the
graph of y = x2
a) 21= 3y x−
b) y = −x2 + 6 3. Write an equation for the quadratic relation
that results from each transformation. a) The graph of y = x2 is translated 5 units
upward. b) The graph of y = x2 is translated 9 units
downward. c) The graph of y = x2 is translated 6 units to
the right. d) The graph of y = x2 is translated 10 units to
the left.
4. Write an equation for the quadratic relation that results from each transformation. a) The graph of y = x2 is reflected in the
x-axis. b) The graph of y = x2 is reflected in the
y-axis. c) The graph of y = x2 is compressed vertically
by a factor of 12 .
d) The graph of y = x2 is stretched vertically by a factor of 6.
5. The relation h = −2.5x2 + 2.5 can be used to
model a grasshopper’s jump. h represents the height and x represents the horizontal distance travelled, where −1 ≤ x ≤ 1, with all measurements in centimetres. a) Graph the relation. b) Determine the maximum height of the
jump. c) Write a second equation to model the
jump of a second grasshopper if it reaches a maximum height of 3.0 cm. Assume that the second grasshopper starts and lands at the same positions as the first.
6. The height, h, in metres, t seconds after a flare
is launched from a boat can be modelled by the relation h = −5.25(t − 4)2 + 86. a) What was the maximum height of the flare? b) What was its height when it was fired? c) How long after it was fired did the flare hit
the water, to the nearest second? 7. A parabola y = ax2 + k passes through the
points (1, 5) and (3, 29). Find the values of a and k.

Name: ___________________________________ Date: _______________________________
…BLM 4–9...
Principles of Mathematics 10: Teacher’s Resource Copyright © 2007 McGraw-Hill Ryerson Limited BLM 4–9 Section 4.4 Practice Master
Section 4.4 Practice Master
1. Copy and complete the table for each parabola. Replace the heading for the second column with the equation for the parabola.
a) y = (x − 3)2 + 2 b) 21= ( 1) 43y x + −
c) y = −2(x + 4)2 + 3
Property y = a(x − h)2 + k vertex axis of symmetry stretch or compression direction of opening values that x may take values that y may take
2. Sketch each parabola in question 1.
3. Write an equation for the parabola that satisfies each set of conditions.
a) vertex (3, 4), opening downward with a vertical stretch by a factor of 3
b) vertex (−1, 2), opening upward with
a vertical compression by a factor of 12
c) vertex (−2, − 4), opening downward with no vertical stretch
4. Write an equation for each parabola. a)
b)
c)
5. Find an equation for the parabola with vertex (−3, 1) that passes through the point (−2, −1).
6. A rocket travels according to the equation h = − 4.9(t − 6)2 + 182, where h is the height, in metres, above the ground and t is the time, in seconds.
a) Sketch a graph of the rocket’s motion. b) Find the maximum height of the rocket. c) How long does it take the rocket to reach
its maximum height? d) How high was the rocket above the ground
when it was fired?

Name: ___________________________________ Date: _______________________________
…BLM 4–11...
Principles of Mathematics 10: Teacher’s Resource Copyright © 2007 McGraw-Hill Ryerson Limited BLM 4–11 Section 4.5 Practice Master
Section 4.5 Practice Master
1. Sketch each parabola. Label the vertex and the x-intercepts. a) y = (x + 2)(x − 4) b) y = −(x − 6)(x + 4) c) y = 2(x + 8)(x + 2)
d) 1= ( 3)( 7)2
y x x− − −
2. Determine an equation in the form y = a(x − r)(x − s) to represent each parabola by considering the vertex and the x-intercepts. a)
b)
3. Consider the quadratic relation y = (x − 3)2. a) Sketch the parabola. b) Write the coordinates of the vertex. c) How many x-intercepts does the parabola
have? 4. The path of a rocket is given by the relation h = −5(x − 2)(x − 12), where x represents the horizontal distance, in metres, the rocket travels and h represents the height, in metres, above the ground of the rocket at this horizontal distance. a) Sketch the path of the rocket. b) What is the maximum height of the rocket? c) What is the horizontal distance when this
occurs? d) What is the height of the rocket at a
horizontal distance of 5 m? e) Find another horizontal distance where the
height is the same as in part d). 5. The path of a kicked football can be modelled
by the relation h = −0.02x(x − 45), where h represents the height, in metres, above the ground and x represents the horizontal distance, in metres, measured from the kicker. a) When the ball hits the ground, how far has
it travelled? b) If the goal post is 40 m away, will the kick
clear the 3-m-high crossbar for a field goal?

Name: ___________________________________ Date: _______________________________
…BLM 4–12...
Principles of Mathematics 10: Teacher’s Resource Copyright © 2007 McGraw-Hill Ryerson Limited BLM 4–12 Section 4.6 Practice Master
Section 4.6 Practice Master
1. Rewrite each power with a positive exponent. a) 2−3 b) 4−1 c) 3−2
d) (− 4)−2 e) −3−2 f) (−14)−3
2. Evaluate.
a) 4−2 b) 30 c) 10− 4 d) (−3)−2 e) −8−2 f) −70
g) ( ) 313
− h) ( ) 23
7
−−
3. Evaluate.
a) 34 + 3−1 b) 20 − 2−2 c) (3 + 2)0 d) 9 + 9−2 + 90
4. Determine the value of x that makes each
statement true.
a) 4 1= 16x− b) ( )1 1=3 81
x
c) ( )3 64=4 27
x d) 15 = 25
x
5. The half-life of radon-222 is 4 days.
Determine the remaining mass of 300 mg of radon-222 after a) 8 days b) 12 days c) 20 days
6. A culture of bacteria in a biology lab contains 2000 bacteria cells. The number of cells in the culture doubles every day. This can be expressed by the equation N = 2000 × 2t, where N represents the number of bacteria cells and t represents the time, in days. a) Find the number of cells in the culture after
2 days and after 1 week. b) How many cells were in the culture 2 days
ago? Hint: 2 days ago means t = −2. c) What does t = 0 indicate?
7. The number, N, of radium atoms remaining in
a sample that started at 400 atoms can be
represented by the equation 1600= 400 2t
N−
× , where t is the time, in years. a) What is the half-life of radium? b) How many atoms are left after 3200 years? c) What does t = 0 represent? d) What do negative values of t represent?
8. The half-life of beryllium-11 is 13.81 s.
Determine the remaining mass of 3200 g of beryllium-11 after a) 27.62 s b) 41.43 s c) 55.24 s

Name: ___________________________________ Date: _______________________________
…BLM 4–14... (page 1)
Principles of Mathematics 10: Teacher’s Resource Copyright © 2007 McGraw-Hill Ryerson Limited BLM 4–14 Chapter 4 Review
Chapter 4 Review
4.1 Investigate Non-Linear Relations 1. Identify whether each scatter plot can be
modelled using a line of best fit or a curve of best fit. a)
b)
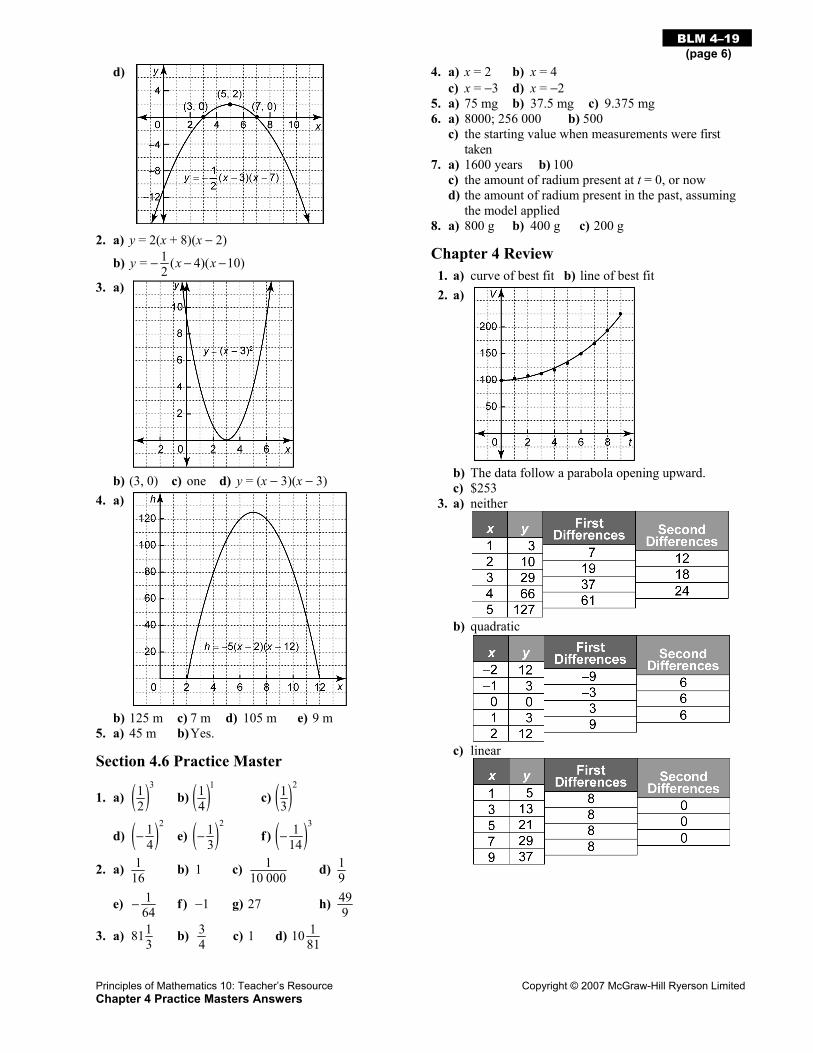
2. Use the data in the table to answer the questions below.
Time (years) Value of the
Investment ($) 0 100 1 105 2 108 3 114 4 121 5 135 6 150 7 171 8 195 9 225
a) Make a scatter plot of the data and draw a curve of best fit.
b) Describe the relation between value and time.
c) Use your curve of best fit to estimate the value of the investment after 10 years.
4.2 Quadratic Relations 3. Use finite differences to determine whether
each relation is linear, quadratic, or neither.
a) x y 1 3 2 10 3 29 4 66 5 127
b) x y −2 12 −1 3 0 0 1 3 2 12
c) x y 1 5 3 13 5 21 7 29 9 37
4. Susan throws a rock off a cliff that is 210 m tall. The height, h, in metres, of the rock above the ground can be related to the time, t, in seconds by the equation h = −5t2 + 10t + 210. a) Graph the relation. b) What is the maximum height of the rock? c) When does the rock reach its maximum
height?

Name: ___________________________________ Date: _______________________________
…BLM 4–14... (page 2)
Principles of Mathematics 10: Teacher’s Resource Copyright © 2007 McGraw-Hill Ryerson Limited BLM 4–14 Chapter 4 Review
4.3 Investigate Transformations of Quadratics and 4.4 Graph y = a(x − h)2 + k 5. Sketch the graph of each parabola and
describe its transformations from the relation y = x2. a) y = (x + 3)2 b) y = x2 + 2
c) 21= 3y x d) y = −3x2
6. Copy and complete the table for each parabola. Replace the heading for the second column with the equation for the parabola.
a) y = (x + 2)2 + 3 b) y = 4(x − 5)2 − 1
c) 21= ( 2) 33y x− + −
d) y = −(x − 3)2 − 4 Property y = a(x − h)2 + k
vertex
axis of symmetry stretch or compression
direction of opening values that x may take
values that y may take
7. Sketch each parabola in question 6.
8. A store can increase revenue by increasing the price of its T-shirts. The revenue, R, in dollars, can be modelled by the relation R = −50(d − 3.5)2 + 4000, where d represents the dollar increase in price. a) Graph the relation for 0 ≤ d ≤ 10. b) What is the maximum revenue? c) What dollar increase corresponds to the
maximum revenue?
4.5 Quadratic Relations of the Form y = a(x − r)(x − s) 9. Sketch a graph for each quadratic relation.
Label the vertex and the x-intercepts. a) y = −(x − 2)(x + 6)
b) 1= ( 8)( 2)2y x x+ −
c) y = x(x + 10)
10. The path of a jet plane in training manoeuvres is given by the relation h = −5(t + 20)(t − 100), where h represents the height, in metres, above the ground and t is time, in seconds. a) Sketch a graph for this relation. b) At what time does the plane reach its
maximum height? c) What is the maximum height?
4.6 Negative and Zero Exponents 11. Evaluate.
a) 6−3 b) 8−2
c) ( )023− − d) ( ) 41
2
−
e) (−3)−2 f) ( ) 335
−−
g) −70 h) ( ) 313
−−
12. Evaluate. a) 62 − 6−1 b) (4 + 5)0 c) 4−2 + 4−1
13. Solve for x.
a) 13 = 27x b) ( )2 25=5 4
x c) 3 27= 64x−
14. The half-life of sodium-24 is 16 h. a) What fraction of a sample of sodium-24
will remain after 32 h? b) What fraction of a sample of sodium-24
will remain after 4 days? c) Write the fractions in parts a) and b) with
a negative exponent with a base of 2.

Name: ___________________________________ Date: _______________________________
…BLM 4–16... (page 1)
Principles of Mathematics 10: Teacher’s Resource Copyright © 2007 McGraw-Hill Ryerson Limited BLM 4–16 Chapter 4 Practice Test
Chapter 4 Practice Test
1. The equation of the axis of symmetry for the parabola defined by y = −2(x − 6)2 + 2 is A x = −6 B y = 2 C x = 6 D y = −2
2. The x-intercepts of the parabola
y = 5(x − 6)(x + 4) are A 4 and 6 B 5 and 6 C 5, 6, and − 4 D 6 and − 4
3. −50 is equal to A −5 B 5 C −1 D 1
4. An equation for the parabola y = x2 after it is
reflected in the x-axis and translated 3 units to the right and 4 units down is A y = −(x − 3)2 + 4 B y = −(x − 3)2 − 4 C y = (x − 3)2 − 4 D y = (x + 3)2 + 4
5. The fraction of the surface area of a pond
covered by algae cells doubles every week. Today the pond surface is fully covered with algae. When was the pond half-covered? A yesterday B 1 week ago C 1 month ago D it depends on the size of the pond
6. Evaluate.
a) ( ) 21 34
−+ b) 3−1 + 1−3
c) 2−2 + 3−2 d) (3−2 − 4−1)0
7. The table shows the growth pattern for Michael, measured every 3 months for the past 2 years since his 8th birthday.
Month Height (cm) 0 135 3 138 6 139 9 141 12 143 15 145 18 146 21 148 24 151
a) Plot the points on a grid and draw a line or curve of best fit.
b) What type of relation does this line or curve of best fit represent?
c) Use the graph to determine Michael’s height in another year from the end of the data.
d) What assumption do you need to make to answer part c)?
8. For the parabola 21= ( 3) 12y x− − − , state
a) the equation of the axis of symmetry b) the stretch or compression factor relative
to y = x2 c) the direction of opening d) the values x may take e) the values y may take
9. Sketch an example of a linear relation, a
quadratic relation, and a relation that is neither linear nor quadratic. Label each graph.

Name: ___________________________________ Date: _______________________________
…BLM 4–16... (page 2)
Principles of Mathematics 10: Teacher’s Resource Copyright © 2007 McGraw-Hill Ryerson Limited BLM 4–16 Chapter 4 Practice Test
10. Use finite differences to determine whether each relationship is linear, quadratic, or neither. a) x y
1 −8 2 −5 3 −2 4 1 5 4 b) x y
−2 51 −1 33 0 19 1 9 2 3
11. A flying bird drops a seed. The height, h, in
metres, of the seed above the ground can be modelled by the relation h = −5t2 + 125, where t is in seconds. a) Sketch the relation. b) How far above the ground is the bird when
it drops the seed? c) How long does the seed take to hit the
ground? 12. The path of a flying disc can be modelled by
the relation h = −0.0625d(d − 112), where h is the height, in metres, above the ground, and d is the horizontal distance, in metres. a) Sketch a graph of the relation. b) At what horizontal distance does the disc
land on the ground? c) At what horizontal distance does the disc
reach its maximum height? d) What is the maximum height?
13. Richard plans to divide his money among his six children when he dies, according to the following formula:
The oldest child will get 12 of the estate, the
second-oldest child will get 12 of what is left,
the third child will get 12 of what is left after
the first two children get their inheritance, and so on down the line. a) What fraction of the estate will each child
get? b) If Richard dies with a net worth of
$6.4 million, how much will each child get?
c) Will there be any money left over once the estate is settled? If so, how much remains?
14. To increase revenue, a sports store has
decided to increase the cost of a baseball glove. They expect that for every $5 increase in price from the current price of $40, three fewer gloves will be sold per week than the current 60 per week.
The revenue relation is R = (60 − 3x)(40 + 5x), where R represents the revenue, in dollars, and x represents the number of price increases. a) Graph the relation and label the
x-intercepts. b) Determine the maximum revenue per
week for the store. c) How many times was the price increased
for this maximum revenue? d) What is the price of a glove when revenue
is at its maximum? e) How many gloves were sold per week to
generate this maximum revenue?

Name: ___________________________________ Date: _______________________________
…BLM 4–17... (page 1)
Principles of Mathematics 10: Teacher’s Resource Copyright © 2007 McGraw-Hill Ryerson Limited BLM 4–17 Chapter 4 Test
Chapter 4 Test
1. Sketch a graph for each parabola. Label the coordinates of the vertex and the equation of the axis of symmetry. a) y = −3x2 − 4 b) y = −2(x − 1)2 + 3
c) 21= ( 5) 24y x + − 2. Sketch a graph for each relation. Label the
x-intercepts and the vertex. a) y = −5(x − 5)(x + 1) b) y = 2(x + 3)(x − 4)
3. Evaluate
a) 22 − 20 + 2−2 b) (22)−2 c) (30 − 40 + (−3)−2)0 d) (30 − 40 + (−3)−2)−1
4. Determine an equation to represent each
parabola. a)
b)
5. Use finite differences to determine whether
each relationship is linear, quadratic, or neither. a) x y
−5 17 −4 7 −3 1 −2 −1 −1 1
b) x y −1 −1 0 0 1 1 2 8 3 27
c) x y 2 26 4 33 6 40 8 47 10 54

Name: ___________________________________ Date: _______________________________
…BLM 4–17... (page 2)
Principles of Mathematics 10: Teacher’s Resource Copyright © 2007 McGraw-Hill Ryerson Limited BLM 4–17 Chapter 4 Test
6. The table shows the growth pattern of a circular oil spill in calm water as oil spills out of the ruptured tank of a tanker. The spill began at time t = 0.
Time, t (h) Radius, r (m) Area, A (m2) 0 2.3 16.6 1 3.1 30.2 2 4.0 50.2 3 4.7 69.4 4 5.5 95.0 5 6.3 6 7.3 7 7.8 8 8.9
a) Complete the Area column using the formula A = πr2. Round your answers to the nearest tenth.
b) Make a scatter plot of the data in the first two columns. Draw a line or curve of best fit.
c) Make a scatter plot of the data in the first and third columns. Draw a line or curve of best fit.
d) Use your graph in part b) to determine the radius of the oil spill after 10 h. Then, use the formula A = πr2 to find the area at this time.
e) Use your graph in part c) to determine the area after 10 h. Then, compare this area with the area you calculated in part d).
7. Lucy throws a stone from the top of a cliff
into the water below. The height h, in metres, of the stone after t seconds is given by the relation h = −4.9t2 + 5t + 100. a) Sketch a graph of the quadratic relation. b) Describe the flight path of the stone. c) Find the maximum height of the stone. d) How long does it take the stone to reach
this maximum height?
8. A parabola y = ax2 + k passes through the points (1, 3) and (2, −3). Find the values of a and k.
9. The half-life a radioactive material is
3 weeks. Determine the mass of 500 mg of the material that is still radioactive after a) 6 weeks b) 12 weeks c) 18 weeks
10. The path of a ball as it travels through
the air after being fired out of a cannon can be modelled by the equation h = −0.05d(d − 220), where h is the height, in metres, above the ground and d is the horizontal distance, in metres. a) Sketch a graph of the relation. b) At what horizontal distance does the ball
land? c) At what horizontal distance does the ball
reach its maximum height? d) What is the maximum height?

…BLM 4–19... (page 1)
Principles of Mathematics 10: Teacher’s Resource Copyright © 2007 McGraw-Hill Ryerson Limited Chapter 4 Practice Masters Answers
BLM Answers
Get Ready 1. a) independent: time in years, dependent: height in
centimetres b) linear relationship c) 536 cm
2. a)
b)
3. a), b), c)
4. a) 25 b) 310 c) ( )515
d) (−4)2 e) 83 f) 50
g) ( )123 h) (−2)1
5. a) 35 b) (−7)1 c) 28 d) ( )234
e) 0.10 f) (−0.4)3
Section 4.1 Practice Master 1. The data in part b) could be modelled using a curve of
best fit, because the data follow a curve, not a straight line.
2. a) Yes, all data points are evenly spread around the line. b) No, this should be a curve of best fit, as the data are
not linear. 3. Part a) is linear; part b) is non-linear. 4. a), c)
Radius, r (cm) Area, A = πr2 (cm2) 1 3.14 2 12.56 3 28.26 4 50.24 5 78.5 6 113.04
b) quadratic d) 20 cm2 e) 200 cm2
5. a), d)
Side Length, s (cm)
Surface Area, SA = 6s2 (cm2)
1 6 2 24 3 54 4 96 5 150 6 216 7 294 8 384

…BLM 4–19... (page 2)
Principles of Mathematics 10: Teacher’s Resource Copyright © 2007 McGraw-Hill Ryerson Limited Chapter 4 Practice Masters Answers
b)
c) quadratic e) 340 cm2
f) Since the data are based on area, there is a squared term in the expression.
Section 4.2 Practice Master 1. a)
b) The flight path of the cannonball is a parabola
opening downward, starting at an initial height of 0 m, rising to 45 m, and then falling to the ground.
c) x = 3, (3, 45) d) 45 m e) Graph the equation h = −5t2 + 30t to verify that it
passes through the points in the table.
2. a) linear
b) neither
c) quadratic
d) neither
3. a) This is a parabola with x-intercepts −1 and 1 and
vertex (0, 2).
b) The shape of the rope is a parabola opening
downward.

…BLM 4–19... (page 3)
Principles of Mathematics 10: Teacher’s Resource Copyright © 2007 McGraw-Hill Ryerson Limited Chapter 4 Practice Masters Answers
4. a)
b) The flight path of the ball is a parabola opening
downward, starting at an initial height of 35 m, rising to about 40 m, and then falling to the ground.
c) 40 m d) 1 s 5. a)
b) The flight path of the ball is a parabola opening downward, starting at an initial height of 12 m, rising to just over 14 m, and then falling to the ground.
c) x = 1.5; points on the left side of the line x = 1.5 are reflections of points on the right side of the line
d) (1.5, 14.25) e) 14.25 m f) Test the points in the table in the equation
h = −x2 + 3x + 12. For example, test the point (2, 14):
L.S. = h R.S. = −x2 + 3x + 12 = 14 = −(2)2 + 3(2) + 12 = −4 + 6 + 12 = 14 L.S. = R.S.
The point (2, 14) is on the parabola h = −x2 + 3x + 12.
Section 4.3 Practice Master 1. a)
b)
c)

…BLM 4–19... (page 4)
Principles of Mathematics 10: Teacher’s Resource Copyright © 2007 McGraw-Hill Ryerson Limited Chapter 4 Practice Masters Answers
2. a) 21= 3y x− i), ii) Labelled points may vary.
iii) reflection in the x-axis; compression by a factor
of 13
b) i), ii) Labelled points may vary.
iii) reflection in the x-axis; translation of 6 units
upward 3. a) y = x2 + 5 b) y = x2 − 9 c) y = (x − 6)2 d) y = (x + 10)2
4. a) y = −x2 b) y = x2 c) 21= 2y x d) y = 6x2
5. a)
b) 2.5 cm c) h = −3.0x2 + 3.0 6. a) 86 m b) 2 m c) 8 s 7. a = 3, k = 2
Section 4.4 Practice Master 1. a) Property y = (x − 3)2 + 2 vertex (3, 2) axis of symmetry x = 3 stretch or compression none direction of opening upward values that x may take all real numbers values that y may take y ≥ 2
b)
Property y x 21= ( +1) -- 43
vertex (−1, −4) axis of symmetry x = −1 stretch or compression vertical
compression of
factor 13
direction of opening upward values that x may take all real numbers values that y may take y ≥ −4
c) Property y = −2(x + 4)2 + 3 vertex (−4, 3) axis of symmetry x = −4 stretch or compression vertical stretch of
factor 2 direction of opening downward values that x may take all real numbers values that y may take y ≤ 3
2. a)
b)

…BLM 4–19... (page 5)
Principles of Mathematics 10: Teacher’s Resource Copyright © 2007 McGraw-Hill Ryerson Limited Chapter 4 Practice Masters Answers
c)
3. a) y = −3(x − 3)2 + 4
b) 21= ( 1) 22y x + +
c) y = −(x + 2)2 − 4 4. a) y = (x + 3)2 − 1 b) y = 2(x − 4)2 + 2
c) 21= ( 2) 43y x− + +
5. y = −2(x + 3)2 + 1 6. a)
b) 182 m c) 6 s d) 5.6 m
Section 4.5 Practice Master 1. a)
b)
c)
…BLM 4–19... (page 6)
Principles of Mathematics 10: Teacher’s Resource Copyright © 2007 McGraw-Hill Ryerson Limited Chapter 4 Practice Masters Answers
d)
2. a) y = 2(x + 8)(x − 2)
b) 1= ( 4)( 10)2y x x− − −
3. a)
b) (3, 0) c) one d) y = (x − 3)(x − 3) 4. a)
b) 125 m c) 7 m d) 105 m e) 9 m 5. a) 45 m b) Yes.
Section 4.6 Practice Master
1. a) ( )312 b) ( )11
4 c) ( )213
d) ( )214− e) ( )21
3− f) ( )3114−
2. a) 116 b) 1 c) 1
10 000 d) 19
e) 164− f) −1 g) 27 h) 49
9
3. a) 1813 b) 34 c) 1 d) 110 81
4. a) x = 2 b) x = 4 c) x = −3 d) x = −2 5. a) 75 mg b) 37.5 mg c) 9.375 mg 6. a) 8000; 256 000 b) 500 c) the starting value when measurements were first
taken 7. a) 1600 years b) 100 c) the amount of radium present at t = 0, or now d) the amount of radium present in the past, assuming
the model applied 8. a) 800 g b) 400 g c) 200 g
Chapter 4 Review 1. a) curve of best fit b) line of best fit 2. a)
b) The data follow a parabola opening upward. c) $253 3. a) neither
b) quadratic
c) linear

…BLM 4–19... (page 7)
Principles of Mathematics 10: Teacher’s Resource Copyright © 2007 McGraw-Hill Ryerson Limited Chapter 4 Practice Masters Answers
4. a)
b) 215 m c) after 1 s 5. a)
translation of 3 units to the left
b)
translation of 2 units upward c)
vertical compression by a factor of 1
3
d)
reflection in the x-axis and vertical stretch by a
factor of 3 6. a) Property y = (x + 2)2 + 3 vertex (−2, 3) axis of symmetry x = −2 stretch or compression none direction of opening upward values that x may take all real numbers values that y may take y ≥ 3 b) Property y = 4(x − 5)2 − 1 vertex (5, −1) axis of symmetry x = 5 stretch or compression vertical stretch
of factor 4 direction of opening upward values that x may take all real numbers values that y may take y ≥ −1 c)
Property y x 21= -- ( +2) -- 33
vertex (−2, −3) axis of symmetry x = −2 stretch or
compression vertical compression of
factor 13
direction of opening
downward
values that x may take
all real numbers
values that y may take
y ≤ −3
d) Property y = −(x − 3)2 − 4 vertex (3, − 4) axis of symmetry x = 3 stretch or compression None direction of opening Downward values that x may take all real numbers values that y may take y ≤ − 4

…BLM 4–19... (page 8)
Principles of Mathematics 10: Teacher’s Resource Copyright © 2007 McGraw-Hill Ryerson Limited Chapter 4 Practice Masters Answers
7. a)
b)
c)
d)
8. a)
b) $4000 c) $3.50
9. a)
b)

…BLM 4–19... (page 9)
Principles of Mathematics 10: Teacher’s Resource Copyright © 2007 McGraw-Hill Ryerson Limited Chapter 4 Practice Masters Answers
c)
10.
b) 40 s c) 18 000 m
11. a) 1216 b) 1
64 c) −1
d) 16 e) 19 f) 125
27−
g) −1 h) −27
12. a) 535 6 b) 1 c) 516
13. a) x = −3 b) x = −2 c) 4= 3x
14. a) 14 b) 1
64 c) 2−2; 2−6
Chapter 4 Practice Test 1. C 2. D 3. C 4. B 5. B
6. a) 19 b) 113 c) 1336 d) 1
7. a)
b) The data follow a linear pattern. c) about 158 cm d) Assume that Michael continues to grow at the same
rate, following a linear pattern.
8. a) x = 3 b) compression factor of 12
c) down d) all real numbers e) y ≤ −1 9. Answers may vary. For example:
10. a) linear
b) quadratic

…BLM 4–19... (page 10)
Principles of Mathematics 10: Teacher’s Resource Copyright © 2007 McGraw-Hill Ryerson Limited Chapter 4 Practice Masters Answers
11. a)
b) 125 m c) 5 s
12. a)
b) 112 m c) 56 m d) 196 m
13. a) 12 , 1
4 , 18 , 1
16 , 132 , 1
64
b) $3 200 000, $1 600 000, $800 000, $400 000, $200 000, $100 000
c) Yes. $100 000
14. a)
b) $2940 c) 6 d) $70 e) 42
Chapter 4 Test 1. a)
b)
c)

…BLM 4–19... (page 11)
Principles of Mathematics 10: Teacher’s Resource Copyright © 2007 McGraw-Hill Ryerson Limited Chapter 4 Practice Masters Answers
2. a)
b)
3. a) 13 4 b) 1 c) 1 d) 9
4. a) y = 2(x − 1)2 − 4 b) y = 13
− (x + 3)2 + 2
5. a) quadratic
b) neither
c) linear
6. a) Time, t (h)
Radius, r (m)
Area, A (m2)
0 2.3 16.6 1 3.1 30.2 2 4.0 50.2 3 4.7 69.4 4 5.5 95.0 5 6.3 124.7 6 7.3 167.4 7 7.8 191.1 8 8.9 248.8
b)

…BLM 4–19... (page 12)
Principles of Mathematics 10: Teacher’s Resource Copyright © 2007 McGraw-Hill Ryerson Limited Chapter 4 Practice Masters Answers
c)
d) 10.4 m; 339.8 m2
e) 339.7 m2; The areas are very close. The difference may be due to rounding.
7. a)
b) The stone follows the path of a parabola opening
downward. c) about 101.3 m d) about 0.5 s
8. a = −2, k = 3 9. a) 125 mg b) 31.25 mg c) 7.8125 mg 10. a)
b) 220 m c) 110 m d) 605 m
Related Documents