Article Piwi Modulates Chromatin Accessibility by Regulating Multiple Factors Including Histone H1 to Repress Transposons Graphical Abstract Highlights d Piwi forms a complex with H1 to regulate H1 association to target transposon loci d H1 regulates Piwi target transposons independently of H3K9me3 modification d Piwi transcriptionally silences its targets by modulating chromatin accessibility d H1 and HP1a interdependently regulate chromatin accessibility at Piwi target loci Authors Yuka W. Iwasaki, Kensaku Murano, Hirotsugu Ishizu, ..., Mikiko C. Siomi, Haruhiko Siomi, Kuniaki Saito Correspondence [email protected] (H.S.), [email protected] (K.S.) In Brief Piwi-piRNA complexes silence transposons in animal gonads. Iwasaki et al. identify linker histone H1 as a component of nuclear Piwi-piRNA complexes and show that Piwi-piRNA complexes require both H1 and HP1a to repress targets and that the transcriptional silencing is correlated with the chromatin state rather than H3K9me3 marks. Accession Numbers GSE81434 Iwasaki et al., 2016, Molecular Cell 63, 408–419 August 4, 2016 ª 2016 Elsevier Inc. http://dx.doi.org/10.1016/j.molcel.2016.06.008

Welcome message from author
This document is posted to help you gain knowledge. Please leave a comment to let me know what you think about it! Share it to your friends and learn new things together.
Transcript

Article
Piwi Modulates Chromatin
Accessibility byRegulating Multiple Factors Including Histone H1 toRepress TransposonsGraphical Abstract
Highlights
d Piwi forms a complex with H1 to regulate H1 association to
target transposon loci
d H1 regulates Piwi target transposons independently of
H3K9me3 modification
d Piwi transcriptionally silences its targets by modulating
chromatin accessibility
d H1 and HP1a interdependently regulate chromatin
accessibility at Piwi target loci
Iwasaki et al., 2016, Molecular Cell 63, 408–419August 4, 2016 ª 2016 Elsevier Inc.http://dx.doi.org/10.1016/j.molcel.2016.06.008
Authors
Yuka W. Iwasaki, Kensaku Murano,
Hirotsugu Ishizu, ..., Mikiko C. Siomi,
Haruhiko Siomi, Kuniaki Saito
[email protected] (H.S.),[email protected] (K.S.)
In Brief
Piwi-piRNA complexes silence
transposons in animal gonads. Iwasaki
et al. identify linker histone H1 as a
component of nuclear Piwi-piRNA
complexes and show that Piwi-piRNA
complexes require both H1 and HP1a to
repress targets and that the
transcriptional silencing is correlatedwith
the chromatin state rather than H3K9me3
marks.
Accession Numbers
GSE81434

Molecular Cell
Article
Piwi Modulates Chromatin Accessibilityby Regulating Multiple Factors Including Histone H1to Repress TransposonsYukaW. Iwasaki,1 KensakuMurano,1 Hirotsugu Ishizu,2 Aoi Shibuya,1 Yumiko Iyoda,1Mikiko C. Siomi,2 Haruhiko Siomi,1,*and Kuniaki Saito1,*1Department of Molecular Biology, Keio University School of Medicine, Tokyo 160-8582, Japan2Department of Biological Sciences, Graduate School of Science, The University of Tokyo, Tokyo 113-0032, Japan*Correspondence: [email protected] (H.S.), [email protected] (K.S.)
http://dx.doi.org/10.1016/j.molcel.2016.06.008
SUMMARY
PIWI-interacting RNAs (piRNAs) mediate transcrip-tional and post-transcriptional silencing of transpos-able element (TE) in animal gonads. In Drosophilaovaries, Piwi-piRNA complexes (Piwi-piRISCs) re-press TE transcription by modifying the chromatinstate, such as by H3K9 trimethylation. Here, wedemonstrate that Piwi physically interacts with linkerhistone H1. Depletion of Piwi decreasesH1 density ata subset of TEs, leading to their derepression.Silencing at these loci separately requires H1 andH3K9me3 and heterochromatin protein 1a (HP1a).Loss of H1 increases target loci chromatin accessi-bility without affecting H3K9me3 density at theseloci, while loss of HP1a does not impact H1 density.Thus, Piwi-piRISCs require both H1 and HP1a torepress TEs, and the silencing is correlated with thechromatin state rather than H3K9me3 marks. Thesefindings suggest that Piwi-piRISCs regulate the inter-action of chromatin components with target loci tomaintain silencing of TEs through the modulation ofchromatin accessibility.
INTRODUCTION
Movement of mobile DNA elements such as transposable ele-
ments (TEs) can result in deleterious mutations on the host
genome (Goodier and Kazazian, 2008). piRNAs are a class of
small non-coding RNAs that associate with PIWI proteins and
guide piRNA-induced silencing complexes (piRISCs) to target
and repress TEs (Ge and Zamore, 2013; Iwasaki et al., 2015).
PIWI proteins and piRNAs are expressed almost exclusively
in the animal germline, and defects of Piwi-piRNA silencing
result in activation of TEs and a sterile phenotype, underlining
the importance of TE regulation and maintenance of genome
integrity.
Among three PIWI proteins expressed in the Drosophila ovary,
Aubergine (Aub) and AGO3 cleave complementary TE tran-
scripts by small RNA-guided endoribonuclease (Slicer) activity
408 Molecular Cell 63, 408–419, August 4, 2016 ª 2016 Elsevier Inc.
in the cytoplasm of germline cells (Brennecke et al., 2007; Guna-
wardane et al., 2007). In contrast, Piwi is located in the nucleus of
both germline cells and surrounding somatic cells (Cox et al.,
2000). TE silencing by Piwi operates at the transcriptional level
in a slicer-independent manner (Klenov et al., 2011; Le Thomas
et al., 2013; Rozhkov et al., 2013; Saito et al., 2010; Sienski
et al., 2012; Wang and Elgin, 2011). piRNAs form a complex
with Piwi at the cytoplasmic Yb-body, and only Piwi proteins
loadedwith a piRNA are imported into the nucleus to silence their
targets. Within the nucleus, Piwi-piRISCs repress TEs transcrip-
tionally, and H3K9 trimethylation (H3K9me3) coincides with
silenced TEs. Piwi is expressed in the cell line Ovarian Somatic
Cell (OSC) (Saito et al., 2009). Earlier studies showed that OSC
reproduces the Piwi-piRNA pathway observed in somatic cells
of Drosophila ovaries (Donertas et al., 2013; Ishizu et al., 2015;
Muerdter et al., 2013; Ohtani et al., 2013; Post et al., 2014; Saito
et al., 2009, 2010; Sienski et al., 2012), and therefore the cell line
represents a very powerful system to elucidate how Piwi-piR-
ISCs repress TEs.
Heterochromatin is characterized by H3K9me3 repressive
epigenetic marks (Nakayama et al., 2001; Rea et al., 2000;
Schotta et al., 2002), associated with Heterochromatin protein
1 (HP1a in Drosophila) (Bannister et al., 2001; Eissenberg et al.,
1990; Lachner et al., 2001). Spread of H3K9me3 marks leads
to heterochromatin formation on target TE loci (Le Thomas
et al., 2013; Rozhkov et al., 2013; Sienski et al., 2012; Wang
and Elgin, 2011). Maelstrom (Mael), DmGTSF1/Asterix (Arx),
and HP1a are putative Piwi cofactors (Brower-Toland et al.,
2007; Czech et al., 2013; Donertas et al., 2013; Le Thomas
et al., 2013; Muerdter et al., 2013; Ohtani et al., 2013; Sienski
et al., 2012;Wang and Elgin, 2011), and recent genetic screening
studies suggested several other factors are involved in Piwi-
mediated transcriptional silencing (Czech et al., 2013; Handler
et al., 2013;Muerdter et al., 2013).Mael andDmGTSF1/Arx regu-
late RNA polymerase II recruitment and RNA levels of Piwi target
TEs (Donertas et al., 2013; Muerdter et al., 2013; Ohtani et al.,
2013; Sienski et al., 2012). HP1a regulates many TEs including
those targeted by Piwi, and loss of Piwi reduces HP1a associa-
tion to Piwi target TE loci (Brower-Toland et al., 2007; Le Thomas
et al., 2013;Wang and Elgin, 2011). However, depletion of piRNA
pathway genes leads to different outcomes at the level of
H3K9me3 (Donertas et al., 2013; Klenov et al., 2014; Muerdter
et al., 2013; Ohtani et al., 2013; Sienski et al., 2012). Piwi

Figure 1. H1 Physically Associates with Nuclear Piwi
(A) Silver staining of nuclear protein components in the anti-Piwi immuno-
precipitated complex. Immunoprecipitation was performed usingOSC nuclear
extracts under stringent conditions. h.c., heavy chain; l.c., light chain of the
antibody.
(B) Western blot showing H1, Piwi, H3, H2A, and HP1a protein levels in
the nuclear complex immunoprecipitated from OSCs using indicated anti-
bodies. Mouse immunogloublin G (IgG) (n.i.) was used for control immuno-
precipitations.
See also Figures S1 and S2.
knockdown (KD) or DmGTSF1/Arx-KD decreases H3K9me3
levels at Piwi target TE loci, whereasMael-KD does not, suggest-
ing that H3K9me3 per se is not the final silencing mark for tran-
scriptional gene silencing mediated by Piwi-piRNA complexes.
Thus, it is unclear how H3K9me3 mark contributes to Piwi-piR-
ISC-mediated TE silencing, and the final effector of this tran-
scriptional silencing pathway is unknown.
Chromatin compaction by heterochromatin results in repres-
sion of genes encoded at corresponding regions (Li and Rein-
berg, 2011). Linker histone H1 confers higher-order organization
to chromatin by direct binding with nucleosomes, making genes
inaccessible to specific transcription factors to prevent their
expression (Buttinelli et al., 1999; Laybourn and Kadonaga,
1991; Pennings et al., 1994). However, interaction of H1 with nu-
cleosomes is only transient; its nucleosome residing time is
modulated by posttranslational modifications in H1 or by nuclear
proteins that interact with H1 or compete with H1 for nucleo-
some binding sites (Bustin et al., 2005; Misteli et al., 2000).
Recently, H1 was reported to be required for TE repression in
Drosophila (Lu et al., 2013; Vujatovic et al., 2012). H1 may recruit
Su(var)3-9 methyltransferase to TE loci, resulting in the addition
of H3K9me3 marks (Lu et al., 2013). However, a systematic un-
derstanding of how H1 is recruited to specific TE loci and how
H3K9me3 modification induces TE silencing is unclear.
In this study, we identified H1 as a component of a nuclear Piwi
complex. UsingOSCs, we found that loss of Piwi results in a spe-
cific decrease of H1 density at Piwi target TE loci and their sur-
rounding genomic regions, suggesting that Piwi enforces asso-
ciation of H1 to its target TE loci. Depletion of H1 derepresses
a variety of TEs and their surrounding genes, including those nor-
mally silenced by Piwi-piRISCs, without affecting the density of
H3K9me3 mark and HP1a at target TE loci. We demonstrated
that chromatin accessibility at Piwi target TE loci is modulated
by H1. Notably, depletion of HP1a also resulted in increased
chromatin accessibility at Piwi target TE loci. These findings sug-
gest that Piwi-piRISCs adopt interdependent actions of H1 and
HP1a to maintain silencing of the TE state by modulating the
chromatin state.
RESULTS
Piwi Forms a Complex with Linker Histone H1To gain insights into the molecular pathway leading to Piwi-piR-
ISC-mediated TE silencing, we immunopurified Piwi-associated
complexes from OSC nuclear lysates. These complexes were
subjected to SDS-PAGE gel electrophoresis followed by silver
staining. Several specific protein bands were observed, and
mass spectrometric analyses identified a 34-kDa band as linker
histone H1, suggesting that H1 associates with Piwi in the nu-
cleus (Figures 1A and S1A). To confirm the H1-Piwi association,
we produced a specific monoclonal antibody against H1. West-
ern blotting showed a discrete band at 34 kDa in OSC and ovary
lysates but not in OSCs where H1 was depleted by RNAi, indi-
cating that the antibody specifically recognizes H1 (Figure S1B).
Using the antibody, we immunopurified H1-associated com-
plexes from OSC nuclear lysates or Drosophila ovary lysates.
Western blots of immunoprecipitates confirmed that Piwi, but
not the core nucleosome proteins, histone H3 and H2A or
HP1a, was present in the H1-associated complex (Figures 1B,
S1C, and S1D). Thus, although H1 is a highly charged abundant
nuclear protein, it specifically interacts with Piwi (Figure S1E).
We also performed an in vitro pull-down assay using recombi-
nant H1 fused to glutathione S-transferase (GST-H1) and crude
OSC lysates (Figure S1F). Piwi was detected in GST-H1 pull-
down products, confirming the association in vitro. Because it
is unlikely that GST-H1 is modified at specific H1 amino acid
residues, which may occur in vivo (Bonet-Costa et al., 2012),
specific protein modifications do not appear to require this inter-
action. Moreover, the addition of DNase or RNase did not affect
interactions between H1 and Piwi (Figure S1G).
H1 Is Required for TE SilencingTo explore whether H1 is involved in Piwi-piRISC-mediated tran-
scriptional silencing of TEs in OSCs, we depleted H1 by RNAi
(Figure S2A). We isolated total RNA from 4-day KD samples, per-
formed RNA-sequencing (RNA-seq) analysis, and compared
RNA expression profiles with control EGFP RNAi. Overall, 82
(63.6%) TE transcripts of 129 annotated TEs were increased
>2-fold, whereas 999 (7.1%) protein-coding genes were upregu-
lated >2-fold in H1-depleted cells, revealing a major repressive
effect of H1 on OSC TE expression (Figure 2A). Furthermore,
qRT-PCR of mdg1, a TE regulated by the somatic Piwi-piRNA
Molecular Cell 63, 408–419, August 4, 2016 409

Figure 2. H1 Is Essential for Silencing of TEs Targeted by the Piwi-piRNA Pathway
(A) Scatterplot of RPKM values (log2) for 129 TEs (left) or 14,145 Pol II-regulated genes (right) in EGFP-KD (control, x axis) or H1-KD (y axis) samples examined by
RNA-seq. Red diagonal lines indicate 2-fold change.
(B) Scatterplot as in (A) for EGFP-KD (x axis) or Piwi-KD (y axis) samples. Blue diagonal lines indicate 2-fold change.
(C) Venn diagram displaying the number of >2-fold upregulated TEs upon depletion of Piwi (blue) or H1 (red).
(D) Boxplots showing fold changes in the expression of group I, II, and III TEs based on RNA-seq upon Piwi (left)- or H1 (center)-KD. Boxplot on the right shows
frequency of piRNAs targeting group I, II, and III TEs. Boxplot whiskers showmaxima andminima. p values were calculated byWilcoxon rank-sum test, and y axis
is log2 scale. n.s.; not significant (p > 0.05).
(E) Boxplots, as in (D), show average number of TEs inserted in euchromatin (left) or ratio of euchromatin-inserted TEs (right) in group I, II, and III TEs.
(F) MA plot showing changes in RNA abundance for set of Pol II-regulated genes upon H1 (left)- or Piwi (right)-KD based on RNA-seq. Twenty-two genes with TE
insertions either in the gene body or close proximity (<5 kb away) and upregulated <4-fold in Piwi-KD cells are plotted in red (left) or blue (right), while other genes
are plotted in gray.
See also Figures S2 and S3.
pathway (Sienski et al., 2012), confirmed that its expression was
activated as much as 80-fold in H1-KD cells (Figure S2B). Under
conditions where endogenous H1 was depleted, expression of
myc-H1r, which was designed to be RNAi insensitive, rescued
mdg1 repression (Figure S2C). Thus, activation of TE expression
results from H1 protein decrease in OSCs. H1 loss did not
affect the nuclear localization of Piwi (Figure S2D). Moreover,
expression levels of piRNAs, which were severely decreased
by the loss of Piwi were unaffected by H1 loss (Figure S2E).
410 Molecular Cell 63, 408–419, August 4, 2016
We confirmed this by deep sequencing of Piwi-associated piR-
NAs upon control (EGFP) and H1-KD (Figures S2F and S2G).
Levels of piRNAsmapped to the somatic piRNA cluster flamenco
and the genic piRNA locus traffic jam, and those mapped to TEs
remained unchanged upon H1-KD (Figures S2H–S2J), indicating
that general piRNA biogenesis does not require H1. An exception
was an increase of piRNAsmapped to roo, which was consistent
with a previous study (Lu et al., 2013). Expression of roo TE, how-
ever, was unchanged by either H1- or Piwi-KD (Figure S3). These

results suggest that H1 is involved in the silencing step, rather
than piRNA biogenesis, of the Piwi-piRNA pathway.
We delineated the region of H1 responsible for TE silencing.
H1 is a tripartite protein consisting of a central globular DNA-
binding domain flanked by lysine-rich regions at both N- and
C-terminal domains (Figure S2K). Absence of C-terminal or
N-terminal regions had no effect on nuclear localization (Fig-
ure S2L), and deletion of the C-terminal but not N-terminal region
failed to rescue mdg1 repression, indicating the requirement of
the C-terminal region for TE silencing (Figure S2M). This C-termi-
nal region of the H1 protein is sufficient for Piwi binding (Fig-
ure S2N). However, the same region of H1 is also known to be
important for condensing chromatin in general (Zhou et al.,
2013, 2015). We also found that the N-terminal region (amino
acids 1–130) of the Piwi protein is essential for H1 interaction
(Figure S2O). The N-terminal region (amino acids 1–72) of Piwi
is known to be responsible for its nuclear localization (Saito
et al., 2009), and, as we expected, Piwi lacking the N-terminal re-
gion (amino acids 1–130) was unable to localize to the nucleus
(data not shown). These results show that the C-terminal region
of H1 and the N-terminal region of Piwi interact with each other.
However, it is difficult to definitively rule out the possibility that
the regions responsible for this interaction are also essential
for other functions.
H1 Regulates TEs, Including Those Targeted by thePiwi-piRNA PathwayOver 60% of TE transcripts were increased >2-fold in H1-
depleted cells (Figure 2A). To compare transcript levels in H1-
or Piwi-depleted OSCs, we analyzed our RNA-seq data. Consis-
tent with previous studies (Ohtani et al., 2013; Sienski et al.,
2012), only a limited number of TE families (30/129, 23.3%)
were increased >2-fold upon Piwi-KD (Figure 2B), almost all of
which (27/30, 90%) were increased in H1-KD cells (Figures 2A–
2C). Based on RNA-seq data, we classified TEs into three
groups. TEs without mapped reads were excluded, because
they are likely to be ‘‘dead’’ TEs. Thirteen TEs in group I exhibited
>6-fold increase ofmRNA expression in Piwi-KD cells. The 6-fold
increase was used as a threshold based on the average fraction
of piRNA frequency per TEs (Figure S3A, top). Of the remaining
TEs, 29 upregulated expression >6-fold in H1-KD and were clas-
sified as group II. Other TEs (n = 76) were categorized as group III
and underwent moderate changes of expression upon Piwi- or
H1-KD (Figure S3B). Importantly, the Piwi-KD fold-change
threshold was compatible with the fraction of TEs regulated by
H1 (Figure S3A, bottom), supporting that H1 correlates with
Piwi-regulated TE silencing and has a role in the piRNA pathway.
Group II TEs were significantly repressed by H1 but not Piwi,
implying that H1 may discriminate TEs in a piRNA-dependent
(group I) or -independent manner (group II), while some TEs
were independent of regulation by Piwi or H1 (group III) (Figures
2D and S3C). Selected examples of each group were analyzed
by qRT-PCR to confirm the RNA-seq data (Figure S3D).
Both group I and group II TEs were regulated by H1, but only
group I TEs were targeted by piRNAs (Figure 2D). Thus, we
investigated features to separate these two groups. Most TEs
in group I were long terminal repeat (LTR) elements (92.3%),
except for the DNA element transib2 (Figure S3C). In contrast,
only 58.6% of group II TEs were LTR elements. Genomic inser-
tion sites and numbers of each TE indicated that group I TEs
had significantly larger numbers of insertions in euchromatin
regions compared to group II TEs (p < 10�4) (Figure 2E, left).
Additionally, the ratio of euchromatic insertions against the
total number of the genomic insertions was higher for group I
TEs (p < 10�3) (Figure 2E, right). Thus, group I TEs are mostly
LTR elements, which accumulate in euchromatic regions,
whereas group II TEs tend to consist of various elements inserted
in both euchromatic and heterochromatic regions.
Depletion of piRISC components influences the expression of
a subset of protein-coding genes near TE insertions (Ohtani
et al., 2013; Sienski et al., 2012). To assess the role of H1, we
analyzed RNA-seq data of 22 genes, for which TE insertions
were either in the gene body or in close proximity (<5 kb away)
and which were upregulated in Piwi-KD OSCs (Sienski et al.,
2012). As expected, >90% (20 of 22) of genes with a 4-fold
change upon Piwi-KD were also highly upregulated upon
H1-KD (Figure 2F). Moreover, variation in expression of TE
neighboring genes was highly comparable between H1- and
Piwi-KD cells (r = 0.95; Figure S3E). Collectively, these data
strongly support the notion that H1 is a component of the Piwi-
piRNA-mediated silencing pathway.
Piwi Regulates Association of H1 to Piwi-piRNA TargetTE LociTo elucidate how H1 functions in Piwi-mediated TE silencing, we
verified H1 binding to chromatin in OSCs. Because H1 associa-
tion with DNA inhibits nucleosome mobility and transcription
in vitro (Laybourn and Kadonaga, 1991; Pennings et al., 1994),
and that H1 is required for Piwi-dependent transcriptional
silencing (Figure 2), we hypothesized that Piwi may act upstream
of H1 by regulating its association with the target TE locus. To
test this, we studied the association of H1 with TE loci using
chromatin immunoprecipitation sequencing (ChIP-seq) analysis
under Piwi-KD. Piwi-KD reduced H1 density throughout the
entire TE consensus sequences on group I but not group II or
III TEs (Figure 3A). We further confirmed the group I TE (mdg1)-
specific decrease in the H1 ChIP signal upon Piwi-KD by ChIP-
qPCR analyses (Figure S4A). These data indicated that Piwi is
specifically required for H1 to associate with group I TEs.
Previously, Piwi-KD was shown to increase the occupancy of
Pol II within an�15-kb region flanking euchromatic TE insertions
(Sienski et al., 2012).We analyzed theH1density in regions flank-
ing euchromatic TE insertions and found that the �15-kb exten-
sion featurewas also observed inH1density (Figure 3B) on group
I, but not group II or group III TE insertions, indicating that the H1
association with group I TEs is controlled by the Piwi-piRNA
pathway. Because we focused on several representative TEs in
each group (Figures 3A and 3B), we analyzed ChIP-seq data of
the complete set of group I, II, and III TEs to determine whether
Piwi-regulated H1 association with TE loci was reflected within
the entire set of group I TEs. Comparison of ChIP-seq signal
fold changes demonstrated a significant decrease in H1 occu-
pancy upon Piwi loss for group I TEs compared with group III
TEs (p < 0.02) (Figure 3C). Moreover, H1 occupancy was further
decreased (p < 10�3) when we collected TEs derepressed >20-
fold upon Piwi loss (group I-20; Figure S3C). By contrast, no
Molecular Cell 63, 408–419, August 4, 2016 411
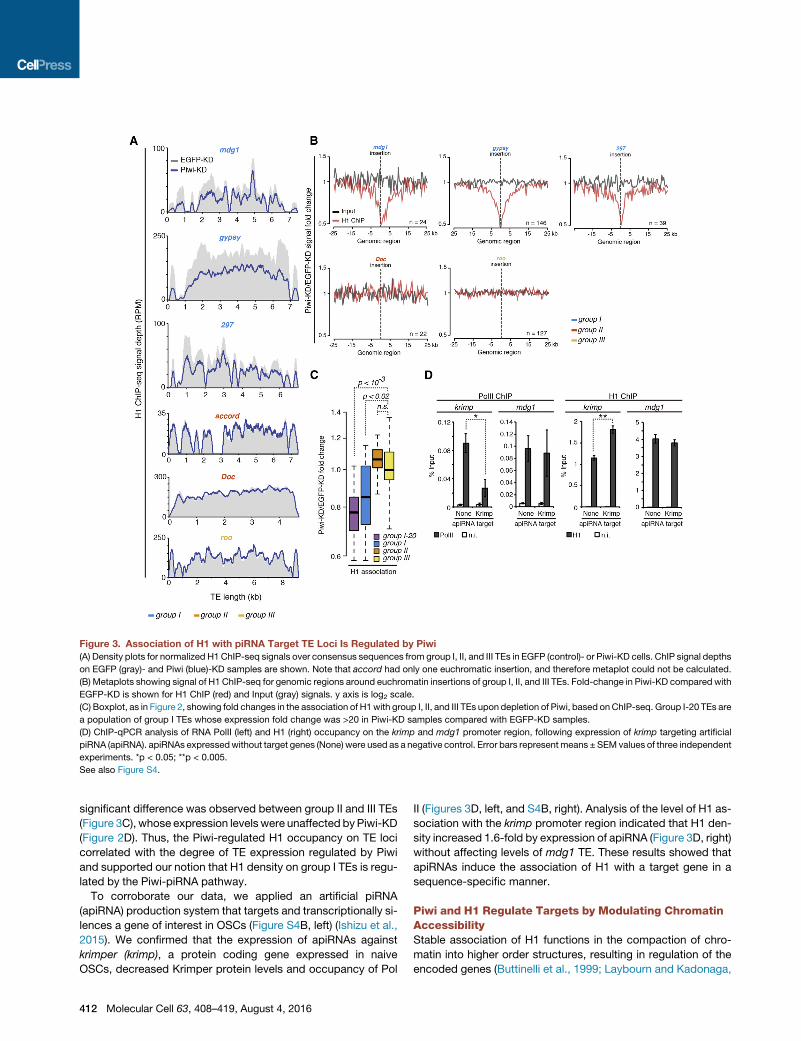
Figure 3. Association of H1 with piRNA Target TE Loci Is Regulated by Piwi
(A) Density plots for normalized H1ChIP-seq signals over consensus sequences from group I, II, and III TEs in EGFP (control)- or Piwi-KD cells. ChIP signal depths
on EGFP (gray)- and Piwi (blue)-KD samples are shown. Note that accord had only one euchromatic insertion, and therefore metaplot could not be calculated.
(B) Metaplots showing signal of H1 ChIP-seq for genomic regions around euchromatin insertions of group I, II, and III TEs. Fold-change in Piwi-KD compared with
EGFP-KD is shown for H1 ChIP (red) and Input (gray) signals. y axis is log2 scale.
(C) Boxplot, as in Figure 2, showing fold changes in the association of H1with group I, II, and III TEs upon depletion of Piwi, based onChIP-seq. Group I-20 TEs are
a population of group I TEs whose expression fold change was >20 in Piwi-KD samples compared with EGFP-KD samples.
(D) ChIP-qPCR analysis of RNA PolII (left) and H1 (right) occupancy on the krimp and mdg1 promoter region, following expression of krimp targeting artificial
piRNA (apiRNA). apiRNAs expressedwithout target genes (None) were used as a negative control. Error bars represent means ±SEM values of three independent
experiments. *p < 0.05; **p < 0.005.
See also Figure S4.
significant difference was observed between group II and III TEs
(Figure 3C), whose expression levels were unaffected byPiwi-KD
(Figure 2D). Thus, the Piwi-regulated H1 occupancy on TE loci
correlated with the degree of TE expression regulated by Piwi
and supported our notion that H1 density on group I TEs is regu-
lated by the Piwi-piRNA pathway.
To corroborate our data, we applied an artificial piRNA
(apiRNA) production system that targets and transcriptionally si-
lences a gene of interest in OSCs (Figure S4B, left) (Ishizu et al.,
2015). We confirmed that the expression of apiRNAs against
krimper (krimp), a protein coding gene expressed in naive
OSCs, decreased Krimper protein levels and occupancy of Pol
412 Molecular Cell 63, 408–419, August 4, 2016
II (Figures 3D, left, and S4B, right). Analysis of the level of H1 as-
sociation with the krimp promoter region indicated that H1 den-
sity increased 1.6-fold by expression of apiRNA (Figure 3D, right)
without affecting levels of mdg1 TE. These results showed that
apiRNAs induce the association of H1 with a target gene in a
sequence-specific manner.
Piwi and H1 Regulate Targets by Modulating ChromatinAccessibilityStable association of H1 functions in the compaction of chro-
matin into higher order structures, resulting in regulation of the
encoded genes (Buttinelli et al., 1999; Laybourn and Kadonaga,

Figure 4. Piwi and H1 Modify Chromatin Accessibility to Silence Their Target TEs(A) RNA-seq and ATAC-seq signal densities at genomic regions neighboring mdgI insertion are shown for OSCs with EGFP (control)- Piwi- or H1-KD. FlyBase
protein-coding genes are indicated at the top, together with chromosome position.
(B) Read enrichments for three groups of TEs upon Piwi or H1-KD. Distributions of paired-end sequencing fragment sizes were calculated, and reads were
normalized by percent maximal within each group of TEs. Enrichment was calculated relative to the genome-wide set of fragment sizes.
(C) Density plots for normalized ATAC-seq signals over consensus sequences from group I, II, and III TEs in EGFP-, Piwi- or H1-KD cells. ATAC-seq signal depths
on EGFP (black)-, Piwi (blue)-, and H1 (pink)-KD samples are shown. LTR regions are shown by red line under x axis.
(D) Metaplots showing signal of ATAC-seq signal for genomic regions around euchromatin insertions of group I, II, and III TEs. Fold change in Piwi (blue)- or H1
(pink)-KD compared to EGFP-KD is shown. y axis is log2 scale.
See also Figure S4.
1991; Pennings et al., 1994). We hypothesized that Piwi-
mediated recruitment of H1 resulted in chromatin compaction,
leading to downregulation of Piwi-piRNA target TE expression.
We performed transposase-accessible chromatin (ATAC)-seq
analysis (Buenrostro et al., 2013) to profile open chromatin
structures. ATAC-seq probe chromatin accessibility with Tn5
transposase, which integrates into accessible chromatin re-
gions. Therefore, genomic regions with open chromatin regions,
such as transcription start sites (TSSs), result in accumulated
ATAC-seq reads, whereas chromatin-dense regions result in
decreased ATAC-seq signals (Figure 4A). Notably, only TSSs
and not the gene body of transcribed genes had increased
ATAC-seq signals, suggesting that ATAC-seq may be used
to detect TSSs of coding genes. Indeed, we determined
Molecular Cell 63, 408–419, August 4, 2016 413
ATAC-seq peaks from EGFP-, Piwi-, and H1-KD samples, and
peaks commonly detected in EGFP- and Piwi/H1-KD samples
were enriched in genomic regions neighboring TSSs (Fig-
ure S4C). In contrast, most peaks detected specifically in Piwi/
H1-KD samples corresponded to intron or intergenic regions
where TEs are enriched, rather than TSSs neighboring regions
of genes (Figures S4C and S4D). Therefore, we further analyzed
ATAC-seq signals at TE regions. First, we checked ATAC-seq
fragment size, because accessible chromatin regions are en-
riched for short fragments, whereas regions with low chromatin
accessibility are depleted of short fragments and enriched for
phased multinucleosomal inserts (Buenrostro et al., 2013). The
increase of short fragments for group I TEs after depletion of
Piwi or H1 was detected, suggesting that Piwi and H1 are
responsible for the regulation of chromatin accessibility at group
I TEs. In contrast, increased shorter fragments were observed
only in H1-KD samples for group II TEs, and Piwi or H1-KD did
not affect the fraction size for group III TEs (Figure 4B). At steady
state (EGFP-KD sample), shorter fragments were relatively un-
der-represented in group II TEs compared to group I TEs. In
agreement with the result showing that group I consists of larger
fractions of TEs with euchromatic insertions (Figure 2E), these
data suggest that group I TEs are located at regions with higher
chromatin accessibility compared to group II TEs. Group III TEs
tend to consist of TEs with shorter ATAC-seq fragment sizes,
suggesting that these TEs are inserted in open chromatin re-
gions. Group III TEs may be more ancient, degenerated TEs
with lower transcriptional activity caused by mutations in their
promoter region, or regulation by other mechanisms, and no
longer pose a threat to Drosophila.
Distributions of ATAC-seq fragments within TE consensus se-
quences were analyzed upon Piwi and H1-KD. Depletion of Piwi
and H1 increased ATAC-seq signal density for group I TEs (p <
10�5, p < 10�3) (Figures 4C and S4E). Increased ATAC-seq sig-
nals in Piwi- and H1-KD suggest that both modify chromatin
accessibility at group I TE loci. Although the distribution of
ATAC-seq fragments on each TE consensus sequence suggests
a greater effect of Piwi than H1 on chromatin accessibility (Fig-
ure 4C), this may be explained by differences in efficiency of
RNAi-KD (Figure S2A) or the other factor acting in parallel with
H1 for modulation of chromatin accessibility. The distributions
of ATAC-seq reads upon Piwi/H1-KD were commonly increased
at LTR regions for each member of group I TEs. However, the
distribution on the internal portion differed among TEs. We also
profiled chromatin accessibility in regions flanking euchromatic
TE insertions and found that the �5-kb extension feature was
observed in ATAC-seq tag density (Figure 4D) on group I, but
not group II or group III TE insertions, consistent with the result
of H1-ChIP-seq analysis. This indicated that the effect on the
state of chromatin also spreads to the flanking region of group
I, but not group II or group III TE insertions. Together, these re-
sults show that the Piwi-piRNA pathway regulates its targets
by recruiting H1 to modify chromatin accessibility.
H1 Is Required for TE Silencing but Not H3K9me3ModificationTo address how H1 affects chromatin states, we analyzed
H3K9me3 signals by ChIP-seq. Consistent with previous studies
414 Molecular Cell 63, 408–419, August 4, 2016
(Ohtani et al., 2013; Sienski et al., 2012), Piwi-KD significantly
decreased H3K9me3 signals on group I TE loci (Figure 5A). By
contrast, we observed only a slight difference in H3K9me3 den-
sity between H1-KD and EGFP-KD on group I TEs (p < 0.04) (Fig-
ures 5A and S5A, right). Moreover, no significant differences
were observed for group I-20 TEs compared with group III TEs
(Figure S5A, right), showing that, unlike Piwi-KD (Figure S5A,
left), H1-KD does not significantly affect H3K9me3 levels.
Meta-analysis of TE insertion sites and closer inspection of loci
that harbor TE insertions showed that H1-KD does not affect
H3K9me3 signals (Figures 5B and 5C), in contrast with earlier
models suggesting that H1 recruits H3K9 methyltransferase
Su(var)3-9 to chromatin (Lu et al., 2013). Increased Pol II occu-
pancy on group I TEs in H1-KD cells (Figure S5B), and upregula-
tion of TEs and their neighboring genes coupled with open chro-
matin structure and unaffected H3K9me3 marks upon depletion
of H1, suggests that modulation of chromatin accessibility by H1
is responsible for transcriptional silencing, and that H3K9me3 it-
self is not the final silencing mark.
Several factors have been identified in the Piwi-piRNA
pathway, including Mael and HP1a, which regulate expression
of Piwi-piRNA target TEs but not H3K9me3 marks (Le Thomas
et al., 2013; Sienski et al., 2012; Wang and Elgin, 2011). Because
H1 acts downstream of or in parallel to H3K9me3, we analyzed
the relationship between H1 and these factors within the Piwi-
piRNA pathway. We performed H1 ChIP-seq analysis upon
depletion of Mael or HP1a. Mael-KD did not result in a significant
decrease of H1 ChIP-seq signals distributed at group I, II, and III
TEs, and effects on neighboring regions of group I TE insertion
sites were limited (Figures S5C–S5F). HP1a-KD resulted in a
relatively mild decrease of H1 distribution at group I TEs and their
neighboring regions (Figures S5G–S5J). For example, reads
mapped to mdg1, gypsy, or 297 consensus TE decreased to
83.0%, 78.3%, or 76.0% upon HP1a-KD, where it decreased
to 64.3%, 58.4%, or 69.7% upon Piwi-KD (Figures 3A and
S5G). Additionally, Mael andHP1awere not detected in the com-
plex containing Piwi and H1 (Figures 1B and S1E), suggesting
that recruitment of H1 to group I TE loci is independent of Mael
or HP1a.
H1 and HP1a Interdependently Modulate ChromatinAccessibility in the Piwi-piRNA PathwayPreviously, it was shown that H1 interacts with HP1a inmammals
and Drosophila (Hale et al., 2006; Lu et al., 2013; Nielsen et al.,
2001) and that H3K9me stabilizes the binding of HP1a to chro-
matin using mammals and yeast models (Bannister et al.,
2001; Jacobs and Khorasanizadeh, 2002; Lachner et al., 2001;
Nakayama et al., 2001). To analyze whether HP1a in the Piwi-
piRNA pathway is regulated by H1 or H3K9me3 marks, we per-
formed HP1a ChIP-seq analysis upon Piwi- or H1-KD. Consis-
tent with previous studies showing that association of HP1a on
several Piwi target TEs are regulated by Piwi (Wang and Elgin,
2011), and recruitment of HP1a to artificial piRNA target loci
(Le Thomas et al., 2013), we observed the downregulation of
HP1a signals upon Piwi-KD specifically at group I TEs (p <
10�3) (Figures 6A and S6A), suggesting that HP1a also acts
downstream of Piwi. However, H1-KD did not affect HP1a signal
levels at the same loci (Figures 6A and S6A), and the effect of

Figure 5. H1 Is Responsible for Transcriptional Silencing and Chromatin Accessibility but Not for H3K9me3 Marks
(A) Density plots for normalized H3K9me3 ChIP-seq signals over consensus sequences from group I, II, and III TEs in EGFP (control)-, Piwi-, or H1-KD cells. ChIP
signal depths on EGFP (gray)-, Piwi (blue)-, and H1 (red)-KD samples are shown. x axis of LTR regions are highlighted in red.
(B) Metaplots showing H3K9me3 ChIP-seq signal for genomic regions around euchromatin insertions of group I, II, and III TEs. Normalized ChIP-seq reads in
EGFP (gray)-, Piwi (blue)-, and H1 (red)-KD are shown.
(C) RNA levels (RNA-seq signal density), H1 association (H1 ChIP-seq signal density), H3K9me3 association (H3K9me3 ChIP-seq signal density), and chromatin
structure (ATAC-seq signal density) at the genomic region flanking the gypsy insertion (red dashed line) are shown for OSCs with EGFP-, Piwi-, and H1-KD.
FlyBase protein-coding genes are indicated at the top, together with chromosome position.
See also Figure S5.
HP1a-KD on H1 distribution was limited compared to that of Piwi
(Figures 3 and S5G–S5J). A similar effect was observed bymeta-
analysis of genomic regions surrounding euchromatic TE inser-
tions (Figures 6B and S5H). Importantly, we observed a synergis-
tic effect on the derepression of mdg1 upon H1- and HP1a-KD
(Figures 6C and S6B). These data suggest that H1 and HP1a
play an interdependent role in the effector step of the Piwi-piRNA
pathway.
Distribution of HP1a ChIP-seq signals upon Piwi- and H1-KD
(Figures 6A and 6B) was similar to H3K9me3 ChIP-seq signals
upon Piwi- or H1-KD (Figures 5A and 5B). Therefore, we studied
the relationship between HP1a and H3K9me3 marks. We deter-
mined H3K9me3 peaks using H3K9me3 ChIP-seq data and
analyzed the overlap of HP1a and H1 ChIP-seq signals, by dis-
playing HP1a and H1 signals in a metaplot centered on
H3K9me3 peak summit. Significant enrichment of HP1a signals
was observed at H3K9me3 peaks, suggesting, as expected, that
HP1a is probably recruited by H3K9me3 marks (Figure 6D). In
contrast, H1 was not accumulated at H3K9me3-enriched sites
(Figure 6D). Additionally, as previously reported (Sienski et al.,
2012), obvious enrichment of H3K9me3 signals on TE loci and
flanking regions of TE insertions was observed. HP1a signal
was similarly enriched, whereas the enrichment was not de-
tected for H1 signals (Figure S6C). Combined with data showing
Molecular Cell 63, 408–419, August 4, 2016 415

Figure 6. HP1a Functions in Parallel to H1 to Silence Piwi-piRNA Target TEs
(A) Density plots for normalized HP1a ChIP-seq signals over consensus sequences from group I, II, and III TEs in EGFP (control)-, Piwi-, or H1-KD cells. ChIP
signal depths on EGFP (gray)-, Piwi (blue)-, and H1 (red)-KD samples are shown.
(B) Metaplots showing HP1a ChIP-seq signal for genomic regions around euchromatin insertions of group I, II, and III TEs. Normalized ChIP-seq reads in EGFP
(gray)-, Piwi (blue)-, and H1 (red)-KD are shown.
(C)mdg1mRNA levels were quantified by qRT-PCR upon depletion of EGFP, H1, HP1a, and Piwi. Amount of siRNA efficient for limited KD conditions of H1 and
HP1a were determined pre-experimentally. Error bars represent mean ± SEM values of three independent experiments.
(D) Metaplots of H3K9me3, HP1a, and H1 signals normalized to the Input signal for the 50-kb window flanking the H3K9me3 peak summit.
(E) Boxplot, as in Figure 3, showing fold changes in normalized ATAC-seq reads for group I, II, and III TEs upon depletion of Piwi or HP1a. Number of reads shorter
than 100 bp were counted.
See also Figures S5 and S6.
independency of HP1a and H1 distributions (Figures 6A–6C and
S5G–S5J), our data indicate that the H3K9me3 mark itself may
contribute to HP1a association, but not to H1 association with
chromatin.
To check the dependency on chromatin accessibility for TE
silencing by the Piwi-piRNA pathway, we performed ATAC-seq
experiments upon HP1a- and Mael-KD. As for H1, loss of
HP1a and Mael resulted in an increase of chromatin accessi-
bility, supporting our hypothesis that compaction of chromatin
structure is the final effector of Piwi-piRNA silencing (Figures
6E and S6D–S6J). Depletion of Mael did not alter H1 accumula-
tion (Figures S5C–S5F) or H3K9me3 levels (Sienski et al., 2012),
suggesting that Mael functions downstream or in parallel to H1
and H3K9me3 modifications to modify chromatin accessibility.
416 Molecular Cell 63, 408–419, August 4, 2016
Depletion of HP1a resulted in shorter ATAC-seq fragments
that mapped to group I TEs (Figure S6D), and reads mapped
to group I TEs significantly increased upon HP1a-KD (p < 10�5)
(Figures 6E and S6E). A similar effect was observed for flanking
euchromatic regions of group I TE insertion sites (Figure S6F).
Thus, HP1a is also indispensable for modification of chromatin
accessibility, leading to silencing of TEs in the Piwi-piRNA
pathway. As for H1, the impact of HP1a-KD on chromatin
accessibility was not as potent as for Piwi-KD (Figures 6E and
S6E). Because HP1a couples with H3K9me3 modification and
functions in parallel to H1, we propose that Piwi regulates inter-
dependent pathways, mediated by H1 and HP1a, to achieve
highly dense chromatin compaction to maintain TE silencing
(Figure S6K).

DISCUSSION
Modulation of Chromatin Accessibility by H1 andPiwi-piRNA PathwaysBased on our data, we propose amodel where the association of
Piwi-piRISCs with H1 enforces the sustained binding of H1 to
target TE chromatin, which is probably mediated by the base-
pairing of piRNAs with target nascent transcripts (Le Thomas
et al., 2013; Post et al., 2014; Rozhkov et al., 2013; Sienski
et al., 2012). This then exerts selective transcriptional silencing
of TEsmediated by the regulation of chromatin accessibility (Fig-
ure S6K). H1 is distributed evenly throughout chromatin with a
propensity for paucity at TSSs (Braunschweig et al., 2009), and
the distribution of ATAC-seq reads shows clear enrichment at
TSSs (Buenrostro et al., 2013). Consistently, our H1 ChIP-seq
reads were depleted and ATAC-seq reads were accumulated
at TSSs in OSCs (Figure S4C; data not shown). It is conceivable
that H1 distributes evenly throughout chromatin and only genes
depleted with H1 become transcriptionally active. We thus
postulate that Piwi-target TEs may actively remove H1 from their
chromatin loci by currently unknown mechanisms to activate
their transcription. Indeed, H1 is depleted at target TE loci in
Piwi-KD cells (Figure 3). Piwi-piRNA complexes actively recruit
H1 to target TE chromatin loci and stabilize its association to
modify the chromatin state at the loci to repress TEs.
Although H3K9me3 accumulation on target TE loci coincides
with the continual activities of the Piwi-piRNA complexes, our re-
sults show that H1 is involved, in parallel with H3K9me3, in Piwi-
piRISC-mediated TE silencing. The common feature of H1- and
H3K9me3-mediated transcriptional silencing is the compaction
of chromatin into higher-order structures. H3K9me3 modifica-
tion is required for binding of HP1, which initiates heterochro-
matin formation (Grewal and Jia, 2007). Our data show that
HP1a also regulates chromatin accessibility (Figures 6E and
S6D–S6F). HP1a slightly affects H1 binding on TE loci (Figures
S5G–S5J), suggesting that HP1a may stabilize chromatin forma-
tion, thereby maintaining H1 association with piRNA target loci.
Furthermore, Mael is also responsible for modifying chromatin
accessibility at Piwi target loci (Figures S6G–S6J). Thus, Piwi
regulatesmutually interdependent pathways that alter chromatin
formation, suggesting that each pathway may induce repressive
chromatin states to cooperatively reinforce TE silencing. This
supports an obligatory functional relationship between H1,
HP1a, and Mael as effectors of Piwi-mediated TE silencing.
Although most of the ATAC-seq peaks detected specifically in
Piwi/H1-KD samples corresponded to TEs (Figures 4 and S4C),
we also detected 84 genes with enriched ATAC-seq peaks in
both Piwi- and H1-KD samples. Of these 84 genes, 18 were
located near group I TEs. Gene Ontology analysis of the remain-
ing genes (66 genes) suggested enrichment of terms such as
‘‘development of primary sexual characteristics’’ and ‘‘sex differ-
entiation’’ (Figure S4D), whichmight be useful to study the role of
Piwi in germline development.
Molecular Mechanism of TE Silencing in the Piwi-piRNAPathwaySeveral important points remain to explain this pathway fully. Piwi
was shown to regulate the association of HP1a and H3K9methyl-
ationatpiRNA target locus (Brower-Tolandetal., 2007; LeThomas
et al., 2013; Wang and Elgin, 2011). Recently, Panoramix/Silencio
was demonstrated to be responsible for the recruitment of
H3K9me3 marks in this process (Yu et al., 2015; Sienski et al.,
2015).BecauseourdatasuggestH1andHP1a/H3K9me3 function
interdependently in the Piwi-piRNA pathway (Figure 6), we specu-
late that Piwi regulates H1 in parallel to Panoramix/Silencio and
H3K9me3, to modulate chromatin accessibility and induces
silencing of their target TEs. Further analysis is necessary to reveal
the precise relationship between H1 and Panoramix/Silencio.
The concept that H3K9me and HP1 serve as a recruiting plat-
form for various effectors, including HDACs, which, in turn,
mediate heterochromatic silencing, is well developed in the
S. pombe system (Grewal and Jia, 2007). Moreover, loss of
HDACs associated with the H3K9me-HP1 platform or defects
in RNAi components involved in targeting H3K9me result in
increased turnover of nucleosomes and loss of heterochromatic
repression (Aygun et al., 2013). Piwi-bound H1 and effectors
associated with H3K9me-HP1 might similarly prevent histone
turnover to repress TEs. The changes detected in ATAC-seq
may reflect changes in histone dynamics. Therefore, analysis
of the effects of H1 and Piwi on histone turnover may provide a
unifying theme underlying the assembly of repressive chromatin.
Piwi-piRNA complexes in OSCs repress only a subset of TEs
(Figure 2A), consistent with previous studies (Le Thomas et al.,
2013; Ohtani et al., 2013; Sienski et al., 2012). In line with a pre-
vious study (Lu et al., 2013), our data also suggest that H1 regu-
lates TEs other than those targeted by the Piwi-piRNA pathway
(Figure 2B), indicating that the overlap between TEs regulated
by Piwi and H1 is rather limited. Previously, H1 was shown to
regulate TEs ubiquitously, by recruiting H3K9 methyltransferase
Su(var)3-9 (Lu et al., 2013). Our results indicated that loss of H1
did not affect H3K9me3 marks on Piwi-piRNA target TEs (Fig-
ure 5). Additionally, loss of Su(var)3-9 did not affect mdg1
expression levels (data not shown), suggesting that piRNA-
mediated TE regulation differs from ubiquitous TE regulation by
H1, as far as Su(var)3-9 dependency is concerned. We therefore
hypothesize that the Piwi-piRNA pathway utilizes the ability of H1
to silence TEs in order to silence their targets.
Overall, we proposed chromatin accessibility functions as the
final effector of Piwi-piRNA-mediated TE silencing. Interdepen-
dent pathways are responsible for this: (1) recruitment of H1 by
Piwi, and (2) H3K9me3-mediated recruitment of HP1a. These
pathways coordinately regulate chromatin formation to regulate
genome-wide piRNA target TEs.
EXPERIMENTAL PROCEDURES
Cell Culture and Transfection
OSCs were cultured in Shields and Sang M3 Insect Medium (Sigma) supple-
mented with 10% fly extract, 10% fetal bovine serum, 0.6 mg/ml glutathione,
and 10mU/ml insulin as described (Niki et al., 2006; Saito et al., 2009). Transfec-
tionof siRNAswasperformedusingCell Line96-wellNucleofectorKitSFand96-
well Shuttle Device (Lonza). Details are given in the Supplemental Information.
Production of Anti-H1 Monoclonal Antibody
A 148-amino-acid C-terminal fragment of H1, fused with glutathione S-trans-
ferase (GST), was used as the antigen to immunize mice. Details are given in
the Supplemental Information.
Molecular Cell 63, 408–419, August 4, 2016 417

RNA-seq Analysis
Poly(A)+ RNA libraries were prepared as described (Ohtani et al., 2013) and
analyzed by Illumina HiSeq (Hokkaido Systems Science). This yielded
�20–25 million genome-mapped reads in each sample transfected with
siRNA. Computational analyses are described in Supplemental Information.
ChIP and ChIP-seq Analysis
ChIP was performed as described (Ohtani et al., 2013) with modifications. To
prepare ChIP-seq libraries, DNA fragments from the ChIP experiment were
sheared to �200 bases using Covaris S220. These were used for library prep-
aration with the NEBNext Ultra DNA Library Prep Kit for Illumina (NEB)
following the manufacturer’s protocol. Details are given in the Supplemental
Information.
ATAC Sequencing Analysis
ATAC sequencing (ATAC-seq) analysis was performed as described (Buenros-
tro et al., 2013, 2015) with somemodifications. Details are given in the Supple-
mental Information.
ACCESSION NUMBERS
The accession number for the deep sequencing datasets reported in this pa-
per is NCBI GEO: GSE81434.
SUPPLEMENTAL INFORMATION
Supplemental Information includes Supplemental Experimental Procedures,
six figures, and one table and can be found with this article online at http://
dx.doi.org/10.1016/j.molcel.2016.06.008.
AUTHOR CONTRIBUTIONS
Y.W.I., M.C.S., H.S., and K.S. conceived of the project and designed the ex-
periments. Y.W.I., K.M., H.I., and K.S. performed the experiments with the
help of A.S. and Y.I. Y.W.I. performed the computational analyses. Y.W.I.,
M.C.S., H.S., and K.S. analyzed the data and wrote the paper.
ACKNOWLEDGMENTS
We thank H. Ohtani, T. Hirano, A. Mashiko, and H. Hasuwa for technical assis-
tance, and S. Yamanaka and other members of the H.S. laboratory for discus-
sions and comments on the manuscript. We thank Dr. K. Shirahige (The Uni-
versity of Tokyo) for technical suggestions regarding ChIP-seq analyses. We
are grateful to Dr. H. Y. Chang (Stanford University) for generous advice and
scientific insights on studies using ATAC-seq. This work was supported by
the Funding Program for Next Generation World-Leading Researchers
(LS109) to K.S., Core Research for Evolutional Science and Technology
(CREST), the Japan Science and Technology Agency (JST) to M.C.S., and
Grants-in-Aid for Scientific Research, the Ministry of Education, Culture,
Sports, Science and Technology of Japan (MEXT) to Y.W.I., M.C.S., H.S.,
and K.S.
Received: December 16, 2015
Revised: May 13, 2016
Accepted: June 3, 2016
Published: July 14, 2016
REFERENCES
Aygun, O., Mehta, S., and Grewal, S.I. (2013). HDAC-mediated suppression of
histone turnover promotes epigenetic stability of heterochromatin. Nat. Struct.
Mol. Biol. 20, 547–554.
Bannister, A.J., Zegerman, P., Partridge, J.F., Miska, E.A., Thomas, J.O.,
Allshire, R.C., and Kouzarides, T. (2001). Selective recognition of methylated
lysine 9 on histone H3 by the HP1 chromo domain. Nature 410, 120–124.
418 Molecular Cell 63, 408–419, August 4, 2016
Bonet-Costa, C., Vilaseca, M., Diema, C., Vujatovic, O., Vaquero, A.,
Omenaca, N., Castejon, L., Bernues, J., Giralt, E., and Azorın, F. (2012).
Combined bottom-up and top-down mass spectrometry analyses of the
pattern of post-translational modifications of Drosophila melanogaster linker
histone H1. J. Proteomics 75, 4124–4138.
Braunschweig, U., Hogan, G.J., Pagie, L., and van Steensel, B. (2009). Histone
H1 binding is inhibited by histone variant H3.3. EMBO J. 28, 3635–3645.
Brennecke, J., Aravin, A.A., Stark, A., Dus, M., Kellis, M., Sachidanandam, R.,
and Hannon, G.J. (2007). Discrete small RNA-generating loci as master regu-
lators of transposon activity in Drosophila. Cell 128, 1089–1103.
Brower-Toland, B., Findley, S.D., Jiang, L., Liu, L., Yin, H., Dus, M., Zhou, P.,
Elgin, S.C.R., and Lin, H. (2007). Drosophila PIWI associates with chromatin
and interacts directly with HP1a. Genes Dev. 21, 2300–2311.
Buenrostro, J.D., Giresi, P.G., Zaba, L.C., Chang, H.Y., and Greenleaf, W.J.
(2013). Transposition of native chromatin for fast and sensitive epigenomic
profiling of open chromatin, DNA-binding proteins and nucleosome position.
Nat. Methods 10, 1213–1218.
Buenrostro, J.D., Wu, B., Chang, H.Y., and Greenleaf, W.J. (2015). ATAC-seq:
a method for assaying chromatin accessibility genome-wide. Curr. Protoc.
Mol. Biol. 109, 21–29.
Bustin, M., Catez, F., and Lim, J.H. (2005). The dynamics of histone H1 func-
tion in chromatin. Mol. Cell 17, 617–620.
Buttinelli, M., Panetta, G., Rhodes, D., and Travers, A. (1999). The role of his-
tone H1 in chromatin condensation and transcriptional repression. Genetica
106, 117–124.
Cox, D.N., Chao, A., and Lin, H. (2000). piwi encodes a nucleoplasmic factor
whose activity modulates the number and division rate of germline stem cells.
Development 127, 503–514.
Czech, B., Preall, J.B., McGinn, J., and Hannon, G.J. (2013). A transcriptome-
wideRNAi screen in theDrosophila ovary reveals factors of the germline piRNA
pathway. Mol. Cell 50, 749–761.
Donertas, D., Sienski, G., and Brennecke, J. (2013). Drosophila Gtsf1 is an
essential component of the Piwi-mediated transcriptional silencing complex.
Genes Dev. 27, 1693–1705.
Eissenberg, J.C., James, T.C., Foster-Hartnett, D.M., Hartnett, T., Ngan, V.,
and Elgin, S.C.R. (1990). Mutation in a heterochromatin-specific chromosomal
protein is associated with suppression of position-effect variegation in
Drosophila melanogaster. Proc. Natl. Acad. Sci. USA 87, 9923–9927.
Ge, D.T., and Zamore, P.D. (2013). Small RNA-directed silencing: the fly finds
its inner fission yeast? Curr. Biol. 23, R318–R320.
Goodier, J.L., and Kazazian, H.H., Jr. (2008). Retrotransposons revisited: the
restraint and rehabilitation of parasites. Cell 135, 23–35.
Grewal, S.I., and Jia, S. (2007). Heterochromatin revisited. Nat. Rev. Genet. 8,
35–46.
Gunawardane, L.S., Saito, K., Nishida, K.M., Miyoshi, K., Kawamura, Y.,
Nagami, T., Siomi, H., and Siomi, M.C. (2007). A slicer-mediated mechanism
for repeat-associated siRNA 50 end formation in Drosophila. Science 315,
1587–1590.
Hale, T.K., Contreras, A., Morrison, A.J., and Herrera, R.E. (2006).
Phosphorylation of the linker histone H1 by CDK regulates its binding to
HP1alpha. Mol. Cell 22, 693–699.
Handler, D., Meixner, K., Pizka, M., Lauss, K., Schmied, C., Gruber, F.S., and
Brennecke, J. (2013). The genetic makeup of the Drosophila piRNA pathway.
Mol. Cell 50, 762–777.
Ishizu, H., Iwasaki, Y.W., Hirakata, S., Ozaki, H., Iwasaki, W., Siomi, H., and
Siomi, M.C. (2015). Somatic Primary piRNA Biogenesis Driven by cis-Acting
RNA Elements and trans-Acting Yb. Cell Rep. 12, 429–440.
Iwasaki, Y.W., Siomi, M.C., and Siomi, H. (2015). PIWI-Interacting RNA: Its
Biogenesis and Functions. Annu. Rev. Biochem. 84, 405–433.
Jacobs, S.A., and Khorasanizadeh, S. (2002). Structure of HP1 chromodomain
bound to a lysine 9-methylated histone H3 tail. Science 295, 2080–2083.

Klenov, M.S., Sokolova, O.A., Yakushev, E.Y., Stolyarenko, A.D., Mikhaleva,
E.A., Lavrov, S.A., and Gvozdev, V.A. (2011). Separation of stem cell mainte-
nance and transposon silencing functions of Piwi protein. Proc. Natl. Acad.
Sci. USA 108, 18760–18765.
Klenov, M.S., Lavrov, S.A., Korbut, A.P., Stolyarenko, A.D., Yakushev, E.Y.,
Reuter, M., Pillai, R.S., and Gvozdev, V.A. (2014). Impact of nuclear Piwi elim-
ination on chromatin state in Drosophila melanogaster ovaries. Nucleic Acids
Res. 42, 6208–6218.
Lachner, M., O’Carroll, D., Rea, S., Mechtler, K., and Jenuwein, T. (2001).
Methylation of histone H3 lysine 9 creates a binding site for HP1 proteins.
Nature 410, 116–120.
Laybourn, P.J., and Kadonaga, J.T. (1991). Role of nucleosomal cores and his-
tone H1 in regulation of transcription by RNA polymerase II. Science 254,
238–245.
Le Thomas, A., Rogers, A.K., Webster, A., Marinov, G.K., Liao, S.E., Perkins,
E.M., Hur, J.K., Aravin, A.A., and Toth, K.F. (2013). Piwi induces piRNA-guided
transcriptional silencing and establishment of a repressive chromatin state.
Genes Dev. 27, 390–399.
Li, G., and Reinberg, D. (2011). Chromatin higher-order structures and gene
regulation. Curr. Opin. Genet. Dev. 21, 175–186.
Lu, X., Wontakal, S.N., Kavi, H., Kim, B.J., Guzzardo, P.M., Emelyanov, A.V.,
Xu, N., Hannon, G.J., Zavadil, J., Fyodorov, D.V., and Skoultchi, A.I. (2013).
Drosophila H1 regulates the genetic activity of heterochromatin by recruitment
of Su(var)3-9. Science 340, 78–81.
Misteli, T., Gunjan, A., Hock, R., Bustin, M., and Brown, D.T. (2000). Dynamic
binding of histone H1 to chromatin in living cells. Nature 408, 877–881.
Muerdter, F., Guzzardo, P.M., Gillis, J., Luo, Y., Yu, Y., Chen, C., Fekete, R.,
and Hannon, G.J. (2013). A genome-wide RNAi screen draws a genetic frame-
work for transposon control and primary piRNA biogenesis in Drosophila. Mol.
Cell 50, 736–748.
Nakayama, J., Rice, J.C., Strahl, B.D., Allis, C.D., and Grewal, S.I. (2001). Role
of histone H3 lysine 9 methylation in epigenetic control of heterochromatin as-
sembly. Science 292, 110–113.
Nielsen, A.L., Oulad-Abdelghani, M., Ortiz, J.A., Remboutsika, E., Chambon,
P., and Losson, R. (2001). Heterochromatin formation in mammalian cells:
interaction between histones and HP1 proteins. Mol. Cell 7, 729–739.
Niki, Y., Yamaguchi, T., and Mahowald, A.P. (2006). Establishment of stable
cell lines of Drosophila germ-line stem cells. Proc. Natl. Acad. Sci. USA 103,
16325–16330.
Ohtani, H., Iwasaki, Y.W., Shibuya, A., Siomi, H., Siomi, M.C., and Saito, K.
(2013). DmGTSF1 is necessary for Piwi-piRISC-mediated transcriptional
transposon silencing in the Drosophila ovary. Genes Dev. 27, 1656–1661.
Pennings, S., Meersseman, G., and Bradbury, E.M. (1994). Linker histones H1
and H5 prevent the mobility of positioned nucleosomes. Proc. Natl. Acad. Sci.
USA 91, 10275–10279.
Post, C., Clark, J.P., Sytnikova, Y.A., Chirn, G.W., and Lau, N.C. (2014). The
capacity of target silencing by Drosophila PIWI and piRNAs. RNA 20, 1977–
1986.
Rea, S., Eisenhaber, F., O’Carroll, D., Strahl, B.D., Sun, Z.W., Schmid, M.,
Opravil, S., Mechtler, K., Ponting, C.P., Allis, C.D., and Jenuwein, T. (2000).
Regulation of chromatin structure by site-specific histone H3 methyltrans-
ferases. Nature 406, 593–599.
Rozhkov, N.V., Hammell, M., and Hannon, G.J. (2013). Multiple roles for Piwi in
silencing Drosophila transposons. Genes Dev. 27, 400–412.
Saito, K., Inagaki, S., Mituyama, T., Kawamura, Y., Ono, Y., Sakota, E., Kotani,
H., Asai, K., Siomi, H., and Siomi, M.C. (2009). A regulatory circuit for piwi by
the large Maf gene traffic jam in Drosophila. Nature 461, 1296–1299.
Saito, K., Ishizu, H., Komai, M., Kotani, H., Kawamura, Y., Nishida, K.M., Siomi,
H., and Siomi, M.C. (2010). Roles for the Yb body components Armitage and
Yb in primary piRNA biogenesis in Drosophila. Genes Dev. 24, 2493–2498.
Schotta, G., Ebert, A., Krauss, V., Fischer, A., Hoffmann, J., Rea, S., Jenuwein,
T., Dorn, R., and Reuter, G. (2002). Central role of Drosophila SU(VAR)3-9 in
histone H3-K9 methylation and heterochromatic gene silencing. EMBO J.
21, 1121–1131.
Sienski, G., Donertas, D., andBrennecke, J. (2012). Transcriptional silencing of
transposons by Piwi and maelstrom and its impact on chromatin state and
gene expression. Cell 151, 964–980.
Sienski, G., Batki, J., Senti, K.A., Donertas, D., Tirian, L., Meixner, K., and
Brennecke, J. (2015). Silencio/CG9754 connects the Piwi-piRNA complex to
the cellular heterochromatin machinery. Genes Dev. 29, 2258–2271.
Vujatovic, O., Zaragoza, K., Vaquero, A., Reina, O., Bernues, J., and Azorın, F.
(2012). Drosophila melanogaster linker histone dH1 is required for transposon
silencing and to preserve genome integrity. Nucleic Acids Res. 40, 5402–5414.
Wang, S.H., and Elgin, S.C. (2011). Drosophila Piwi functions downstream of
piRNA production mediating a chromatin-based transposon silencing mecha-
nism in female germ line. Proc. Natl. Acad. Sci. USA 108, 21164–21169.
Yu, Y., Gu, J., Jin, Y., Luo, Y., Preall, J.B., Ma, J., Czech, B., and Hannon, G.J.
(2015). Panoramix enforces piRNA-dependent cotranscriptional silencing.
Science 350, 339–342.
Zhou, B.R., Feng, H., Kato, H., Dai, L., Yang, Y., Zhou, Y., and Bai, Y. (2013).
Structural insights into the histone H1-nucleosome complex. Proc. Natl. Acad.
Sci. USA 110, 19390–19395.
Zhou, B.R., Jiang, J., Feng, H., Ghirlando, R., Xiao, T.S., and Bai, Y. (2015).
Structural mechanisms of nucleosome recognition by linker histones. Mol.
Cell 59, 628–638.
Molecular Cell 63, 408–419, August 4, 2016 419
Related Documents