Excellence and equity in education OECD Parliamentary Days 9 February 2017 Andreas Schleicher Director for Education and Skills

Welcome message from author
This document is posted to help you gain knowledge. Please leave a comment to let me know what you think about it! Share it to your friends and learn new things together.
Transcript

Excellence and equityin educationOECD Parliamentary Days9 February 2017
Andreas SchleicherDirector for Education and Skills

Trends in science performance (PISA)
2006 2009 2012 2015450
470
490
510
530
550
570
OECD
450
470
490
510
530
550
570
OECD average
Stud
ent p
erfo
rman
ce
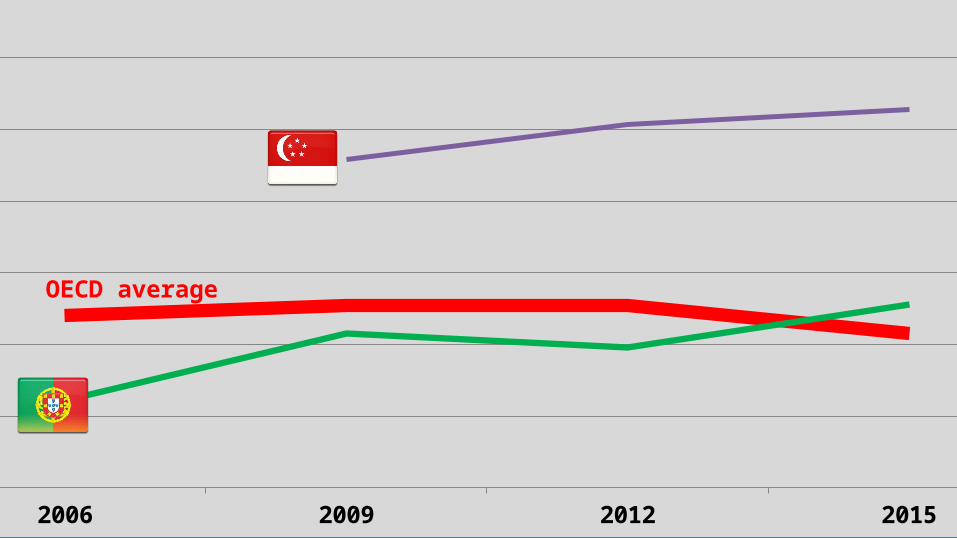
Trends in science performance (PISA)
450
470
490
510
530
550
570
2006 2009 2012 2015450
470
490
510
530
550
570
OECD average

350
400
450
500
550 SingaporeJapan
EstoniaChinese Tapei Finland Macao (China)CanadaViet Nam
Hong Kong (China)B-S-J-G (China) KoreaNew ZealandSloveniaAustraliaUnited KingdomGermanyNetherlands
SwitzerlandIrelandBelgium DenmarkPolandPortugal NorwayUnited StatesAustriaFrance
SwedenCzech Rep. Spain Latvia RussiaLuxembourg ItalyHungary LithuaniaCroatia IcelandIsraelMaltaSlovak Rep.
GreeceChile
Bulgaria
United Arab EmiratesUruguayRomania
Moldova TurkeyTrinidad and Tobago ThailandCosta Rica QatarColombia Mexico MontenegroJordanIndonesia BrazilPeru
LebanonTunisia
FYROM Kosovo AlgeriaDominican Rep. (332)
Mea
n sc
ienc
e pe
rfor
man
ce
Hig
her
perf
oman
ceScience performance and equity in PISA (2015)
Some countries combine excellence with equity
High performanceHigh equity
Low performanceLow equity
Low performanceHigh equity
High performanceLow equity
More equity

Poverty is not destiny - Science performanceby international deciles of the PISA index of economic, social and cultural status (ESCS)
Dom
inica
n Re
publ
ic 40
Koso
vo 1
0
FYRO
M 13
Mont
eneg
ro 1
1
Unite
d Ar
ab E
mira
tes 3
Leba
non
27Me
xico
53
Cost
a Ri
ca 3
8
Turk
ey 5
9
Thail
and
55
Icela
nd 1
Rom
ania
20
Bulg
aria
13
Russ
ia 5
Chile
27
Lithu
ania
12
Italy
15Sp
ain 3
1
Croa
tia 1
0
OECD
ave
rage
12
Malta
13
Maca
o (C
hina
) 22
Aust
ria 5
Luxe
mbo
urg
14
Czec
h Re
publ
ic 9
Aust
ralia
4
Cana
da 2
Kore
a 6
Switz
erlan
d 8
Slov
enia
5
Finlan
d 2
Viet
Nam
76
Japa
n 8
B-S-
J-G (C
hina
) 52
280
330
380
430
480
530
580
630
Bottom decile Second decile Middle decile Ninth decile Top decile
Scor
e po
ints
Figure I.6.7
% of students in the bottom international
deciles of ESCS
OECD median student

The global pool of top performers: A PISA perspectiveFigure I.2.18
United States (8.5%); 300k
B-S-J-G (China) (13.6%); 181k
Japan (15.3%); 174k
Germany (10.6%); 79k Viet Nam (8.3%); 72k
United Kingdom (10.9%); 68k
Korea (10.6%); 60k
France (8.0%); 59k
Russia (3.7%); 42k
Canada (12.4%); 41k
Chinese Taipei (15.4%); 39k
Australia (11.2%); Poland (7.3%);
Netherlands (11.1%)Italy (4.1%)Spain (5.0%) Brazil (0.7%)
Singapore (24.2%)Belgium (9.0%)
Finland (14.3%)
Switzerland (9.8%) Sweden (8.5%)
Portugal (7.4%) New Zealand (12.8%)
Israel (5.9%)Others
Share of top performers among 15-year-old students:
Less than 1%1 to 2.5%2.5 to 5% 5% to 7.5% 7.5% to 10%10% to 12.5% 12.5% to 15%More than 15%

Students expecting a career in scienceFigure I.3.2
Dom
inica
n Re
p. ..
.Jo
rdan
6
Mexi
co
6Le
bano
n 1
5Pe
ru
7Un
ited
Stat
es
13Tu
nisia
19
Slov
enia
16
Aust
ralia
15
Mala
ysia
4
Spai
n 1
1Ur
ugua
y 1
7Tr
inid
ad a
nd T
. 1
3CA
BA (A
rg.)
19
Bulg
aria
25
Koso
vo
7Ma
lta
11Ne
w Ze
alan
d 2
4Es
toni
a 1
5Be
lgiu
m
16FY
ROM
20
Icela
nd
22HK
G (C
hina
) 2
0Ita
ly
17Mo
ldov
a
7Mo
nten
egro
18
Luxe
mbo
urg
18
Maca
o (C
hina
) 1
0Sw
eden
21
Viet
Nam
13
Kore
a
7Sl
ovak
Rep
ublic
...
Finla
nd
24Cz
ech
Repu
blic
22
Neth
erla
nds
19
Indo
nesia
19
05
101520253035404550
Percentage of students who expect to work in science-related professional and technical occupations when they are 30Science-related technicians and associate pro-
fessionalsInformation and communication technology pro-fessionalsHealth professionals
%
% o
f stu
dent
s with
va
gue
or m
issin
g ex
-pe
ctati
ons

SingaporeCanadaSloveniaAustralia
United KingdomIreland
Portugal
Chinese TaipeiHong Kong (China)
New ZealandDenmark
JapanEstoniaFinland
Macao (China)Viet Nam
B-S-J-G (China)Korea
GermanyNetherlandsSwitzerland
BelgiumPoland
SwedenLithuaniaCroatiaIcelandGeorgiaMalta
United StatesSpainIsrael
United Arab Emirates
BrazilBulgaria
ChileColombiaCosta Rica
Dominican RepublicJordanKosovo
LebanonMexico
PeruQatar
Trinidad and TobagoTunisiaTurkey
Uruguay
Above-average science performance
Stronger than average beliefs in science
Above-average percentage of students expecting to work in a science-related occupation
Norway
Mul
tiple
out
com
es

Less
ons f
rom
PIS
A
Low impact on outcomes
High impact on outcomes
Low feasibility High feasibility
Money pits
Must haves
Low hanging fruits
Quick wins

Less
ons f
rom
PIS
A
Low impact on outcomes
High impact on outcomes
Low feasibility High feasibility
Money pits
Must haves
Low hanging fruits
Quick wins
Commitment to universal achievement
Gateways, instructional systems
Capacity at point of delivery
Incentive structures and accountability
Resources where they yield most
A learning systemCoherence

Learning time and science performanceFigure II.6.23
35 40 45 50 55 60300
350
400
450
500
550
600
Finland
Germany Switzerland
Japan Estonia
Sweden
NetherlandsNew Zealand
Macao(China)
Iceland
Hong Kong(China) Chinese Taipei
Uruguay
Singapore
Poland United States
IsraelBulgaria
Korea
Russia ItalyGreece
B-S-J-G (China)
Colombia
Chile
Mexico
BrazilCostaRica
TurkeyMontenegroPeru
QatarThailand
UnitedArab
Emirates
Tunisia
Dominican Republic
R² = 0.205109930113565
Total learning time in and outside of school
PISA
sci
ence
sco
re
OECD average
OECD average
OE
CD
ave
rage

Learning time and science performanceFigure II.6.23
Finla
ndGe
rman
ySw
itzer
land
Japa
nEs
toni
aSw
eden
Neth
erla
nds
New
Zeal
and
Aust
ralia
Czec
h Re
publ
icMa
cao
(Chi
na)
Unite
d Ki
ngdo
mCa
nada
Belg
ium
Fran
ceNo
rway
Slov
enia
Icela
ndLu
xem
bour
gIre
land
Latv
iaHo
ng K
ong
(Chi
na)
OECD
ave
rage
Chin
ese
Taip
eiAu
stria
Portu
gal
Urug
uay
Lithu
ania
Sing
apor
eDe
nmar
kHu
ngar
yPo
land
Slov
ak R
epub
licSp
ain
Croa
tiaUn
ited
Stat
esIsr
ael
Bulg
aria
Kore
aRu
ssia
Italy
Gree
ceB-
S-J-G
(Chi
na)
Colo
mbi
aCh
ileMe
xico
Braz
ilCo
sta
Rica
Turk
eyMo
nten
egro
Peru
Qata
rTh
aila
ndUn
ited
Arab
Em
ir...
Tuni
siaDo
min
ican
Repu
...
0
10
20
30
40
50
60
70
678910111213141516
Intended learning time at school (hours) Study time after school (hours) Score points in science per hour of total learning timeHours
Scor
e po
ints
in sc
ienc
e pe
r hou
r of t
otal
lear
ning
tim
e

Money gets us only so farSpending per student and learning outcomes
Figure II.6.2
0 20 40 60 80 100 120 140 160 180 200300
350
400
450
500
550
600
HungaryCosta Rica
Chinese Taipei
Chile
Brazil
Turkey
UruguayBulgaria
Mexico
Thailand MontenegroColombia Dominican Republic
Peru
Georgia
411.131522189847
Luxembourg
SwitzerlandNorwayAustria
Singapore
United States
United Kingdom
Malta
Sweden
Belgium
IcelandDenmark
Finland
Netherlands
Canada
JapanSlovenia
AustraliaGermany
IrelandFranceItaly
PortugalNew Zealand
Korea Spain
PolandIsrael
Estonia
Czech Rep.
LatviaSlovak Rep.
Russia
CroatiaLithuania
R² = 0.413999972734452
R² = 0.00700673877676472
Average spending per student from the age of 6 to 15 (in thousands USD, PPP)
Scie
nce
perf
orm
ance
(sc
ore
poin
ts)

Differences in educational resourcesbetween advantaged and disadvantaged schools
Figure I.6.14
CABA
(Arg
entin
a)Pe
ruUn
ited
Arab
Em
irate
sJo
rdan
Braz
ilTu
rkey
Dom
inica
n Re
publ
icUr
ugua
yB-
S-J-G
(Chi
na)
Japa
nLu
xem
bour
gPo
rtuga
lIta
lyCr
oatia
Alge
riaIsr
ael
Swed
enMo
ldov
aSl
oven
iaHu
ngar
yVi
et N
amSi
ngap
ore
Gree
ceCa
nada
Qata
rKo
sovo
Kore
aSw
itzer
land
Hong
Kon
g (C
hina
)FY
ROM
Alba
nia
Slov
ak R
epub
licEs
toni
aCo
sta
Rica
Latv
ia
-3
-2
-1
0
1Index of shortage of educational material
Mea
n in
dex
diffe
renc
e be
twee
n ad
-va
ntag
ed a
nd d
isadv
anta
ged
scho
ols
Disadvantaged schools have more resources than advantaged schools
Disadvantaged schools have fewer resources than advantaged schools

Student-teacher ratios and class sizeFigure II.6.14
15 20 25 30 35 40 45 505
10
15
20
25
30
CABA (Argentina)
JordanViet Nam
Poland
United States
Chile
Denmark
Hungary
B-S-G-J(China) Turkey
Georgia
ChineseTaipei
Mexico
Russia
Albania
Hong Kong(China)
Japan
Belgium
Algeria
Colombia
Peru
Macao(China)
Switzerland
Malta
Dominican Republic
Netherlands
Singapore
Brazil
Kosovo
Finland
ThailandR² = 0.24784962376208
Class size in language of instruction
Stud
ent-
teac
her
ratio High student-teacher
ratios and small class sizes
Low student-teacher ratios and large class
sizes
OECD average
OE
CD
ave
rage

Teacher professionalism
Knowledge base for teaching (initial education and incentives for professional development)
Autonomy: Teachers’ decision-making power over their work (teaching content, course offerings, discipline practices)
Peer networks: Opportunities for exchange and support needed to maintain high standards of teaching (participation in induction, mentoring, networks, feedback from direct observations)
Teacherprofessionalism

Teacher professionalism
Knowledge base for teaching (initial education and incentives for professional development)
Autonomy: Teachers’ decision-making power over their work (teaching content, course offerings, discipline practices)
Peer networks: Opportunities for exchange and support needed to maintain high standards of teaching (participation in induction, mentoring, networks, feedback from direct observations)

Technology can amplify innovative teaching
• As tools for inquiry-based pedagogies with learners as active participants
• Make it faster and more granular
• Collaborative platforms
for teachers to share andenrich teaching materials
• Well beyond textbooks, in multiple formats, with little time and space constraints
Expand access to content
Collaboration for knowledge creation
Support new pedagogies
Feedback

-2.0 -1.8 -1.6 -1.4 -1.2 -1.0 -0.8 -0.6 -0.4 -0.2 0.0 0.2 0.4 0.6 0.8 1.0 1.2 1.4 1.6 1.8 2.0450
460
470
480
490
500
510
520
Scor
e po
ints
Technology in schools and digital skills still don’t square
Source: Figure 6.5
Relationship between students’ skills in reading and computer use at school (average across OECD countries)
OECD average
Digital reading skills of 15-year-olds
Intensive technology useNo technology use

100 90 80 70 60 50 40 30 20 10
0%
Share of 15-year-olds without foundations (PISA science, 15-year-olds)
23841 bn$159 bn$ 5554 bn$

Routine cognitive skills
Conceptual understanding, complex ways of thinking, ways of working
Some students learn at high levels
All students need to learn at high levels
Student inclusion
Curriculum, instruction and assessment
Standardisation and compliance
High-level professional knowledge workers
Teacher quality
‘Tayloristic’, hierarchical
Flat, collegial
Work organisation
Primarily to authorities
Primarily to peers and stakeholders
Accountability
What it all meansThe old bureaucratic system The modern enabling system
Find out more about our work at www.oecd.org/pisa– All publications– The complete micro-level database
Email: [email protected]: SchleicherOECDWechat: AndreasSchleicher
and remember:Without data, you are just another person with an opinion
Thank you
Related Documents