Welcome message from author
This document is posted to help you gain knowledge. Please leave a comment to let me know what you think about it! Share it to your friends and learn new things together.
Transcript

PIRLS
Ina V.S. Mullis
Michael O. Martin
Eugenio J. Gonzalez
International Association for the Evaluation of Educational Achievement
International Study Center
International Achievement in theProcesses of Reading ComprehensionResults from PIRLS 2001 in 35 Countries

© 2004 International Associationfor the Evaluation of Educational Achievement (IEA)
International Achievements in the Processes of Reading Comprehension / by Michael O. Martin, Ina V.S. Mullis, and Eugene J. Gonzalez.
Publisher: International Study Center,Lynch School of Education, Boston College
ISBN: 1-889938-32-7
For more information about PIRLS contact:
PIRLS International Study CenterLynch School of EducationManresa HouseBoston CollegeChestnut Hill, MA 02467United States
tel: +1-617-552-1600fax: +1-617-552-1203
e-mail: [email protected]
http://pirls.bc.edu
Boston College is an equal opportunity, affi rmative action employer.
Printed and bound in the United States.
[Contents]
5 International Achievement in the Processes of Reading Comprehension
5 Introduction
7 Summary of Overall Achievement in Reading Literacy for the PIRLS Countries
8 Summary of Achievement in Reading for Literary and Informational Purposes
9 Exhibit 1: Distribution of Reading Achievement Overall and by Gender
12 Exhibit 2: Relative Difference in Performance Between Literary and Informational Purposes
13 Exhibit 3: Reading for Literary and Informational Purposes by Gender
14 Description of the PIRLS Reading Processes
15 Considerations in Producing the PIRLS Reading Process Scales
17 Achievement in PIRLS Reading Processes
18 Relative Strengths and Weaknesses in Reading Processes
19 Exhibit 4: Distribution of Reading Achievement for Retrieval and Straightforward Inferencing Processes
20 Exhibit 5: Multiple Comparisons of Average Reading Achievement for Retrieval and Straightforward Inferencing Processes
21 Exhibit 6: Distribution of Reading Achievement for Interpreting, Integrating, and Evaluating Processes
22 Exhibit 7: Multiple Comparisons of Average Reading Achievement for Interpreting, Integrating, and Evaluating Processes
23 Exhibit 8: Relative Difference in Performance Between Reading Processes
25 Gender Differences in Achievement for the Process Areas
25 Scaling Methodology
27 Exhibit 9: Reading for Processes by Gender
28 Exhibit 10: Correlation Between Reading for Retrieval and Straightforward Inferencing and Reading for Interpreting, Integrating and Evaluating Processes
29 References
31 Acknowledgements


[5]
International Achievement in the Processes of Reading Comprehension
Introduction
PIRLS (Progress in International Reading Literacy Study) is IEA’s newly-devel-oped assessment of students’ reading achievement at fourth grade. Designed to provide trends in reading achievement on a regular fi ve-year cycle, PIRLS 2001 has been completed with 35 countries participating and development of PIRLS 2006 is well underway. As described in the PIRLS 2001 Framework (Campbell, Kelly, Mullis, Martin, & Sainsbury, 2001), purposes for reading and processes of comprehension formed the foundation for the PIRLS 2001 written assess-ment with students’ attitudes and reading habits addressed through question-naires. More than half of the questions were in the constructed-response format, requiring students to generate and write their answers.
The achievement results from the initial assessment as well as con-siderable information from home, student, teacher, and school question-naires were reported in the PIRLS 2001 International Report (Mullis, Martin, Gonzalez, & Kennedy, 2003). PIRLS 2001 assessed two major reading pur-poses – literary and informational. Within the two major reading purposes,
[6] international achievement in the processes of reading comprehension
PIRLS assessed a range of four reading comprehension strategies. Because PIRLS is a curriculum-based study conducted with the aim of improving reading education and achievement, it was the intention from the inception of the study to report results for the two major types of reading students do in school. Indeed, on average across the participating countries, teachers reported that 84% of the students were asked to read fi ction (literary) at least weekly, including such genres as fables and fairy tales, stories, books, poems, and plays. Also, 56% were asked to read non-fi ction (informational) at least weekly, including such materials as descriptions of and explanation about things, people, or events; instructions or manuals about how things work; and charts, diagrams, and graphs.
In accordance with the study design based half on literary and half on informational reading materials, the PIRLS 2001 International Report con-tained achievement scales for reading literacy overall and for the two major purposes for reading. In planning PIRLS 2006, however, it seemed desirable to enhance the study by providing achievement results for the comprehension processes as well. To begin researching this possibility, the PIRLS International Study Center at Boston College undertook the project of scaling the PIRLS 2001 results by the comprehension processes. This paper describes our experi-ence and presents the results of scaling the PIRLS 2001 reading comprehension processes for the 35 countries.
The four processes specifi ed in the PIRLS 2001 Framework include:
• Focus on and retrieve explicitly stated information
• Make straightforward inferences
• Interpret and integrate ideas and information
• Examine and evaluate content, language, and textual elements
Since improving the assessment by providing information on com-prehension processes in addition to reading purposes is an important goal of PIRLS 2006, the PIRLS International Study Center began by researching the possibility of scaling the 2001 data by all four of the reading processes speci-

[7]international achievement in the processes of reading comprehension
fi ed in the framework. To complete the scaling, however, it was necessary to combine the processes into just two scales – one for the fi rst two processes and one for the second two processes.
As documented in the PIRLS 2001 Technical Report (Martin, Mullis, & Kennedy, 2003), all aspects of PIRLS were conducted with concerted atten-tion to quality. Countries met rigorous standards for sampling designed to prevent bias and ensure comparability. Translating the tests and question-naires involved a detailed iterative review process, and numerous training sessions were held in data-collection and scoring procedures. Prior to analysis, each country’s data were subjected to exhaustive checks for consistency and comparability across countries.
To place country achievement for the PIRLS 2001 comprehension pro-cesses in context, the fi ndings previously reported for the overall scale and the reading purposes are summarized in the next two sections.
Summary of Overall Achievement in Reading Literacy for the PIRLS Countries
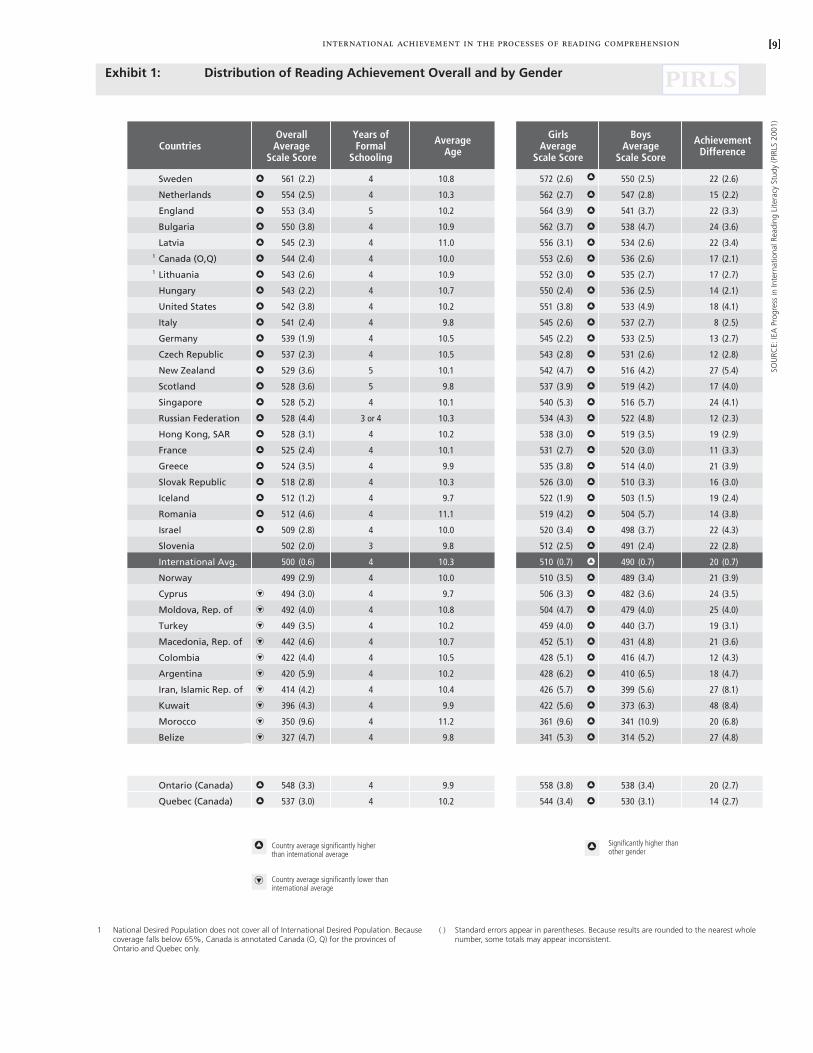
To recap the achievement results for reading literacy overall, Exhibit 1 pres-ents the 35 countries that participated in PIRLS 2001 in decreasing order of average (mean) scale score, together with an indication of whether the country average was signifi cantly higher or lower than the international average. (The international average of 500 is the mean of the average scale score of each of the participating countries.)
As shown in the left-hand portion of Exhibit 1, Sweden had the highest reading literacy achievement of all the countries participating in PIRLS 2001. Analyses to determine whether the differences in average achieve-ment between pairs of countries were statistically signifi cant indicated that The Netherlands, England, and Bulgaria were outperformed only by Sweden. Latvia, Canada, Lithuania, Hungary, the United States, Germany, and Italy also performed better than most of the other countries.

[8] international achievement in the processes of reading comprehension[8]
PIRLS devoted considerable effort to maximizing comparability across the grades and ages tested, but it is diffi cult given that students start formal schooling at different ages. More information may be found in the PIRLS 2001 Encyclopedia (Mullis, Martin, Kennedy, & Flaherty, 2002), which describes educational systems and reading literacy curricula in the PIRLS countries. Exhibit 1 shows that the grade tested in most countries represented the fourth year of formal schooling. Thus, solely for convenience, the grade tested is called the fourth grade. On average, students in most countries were 10 years old (aged from 10.0 to 10.9 years). Students in eight countries were younger (from 9.7 to 9.9 years); in Latvia, Romania, and Morocco, students were older (from 11.0 to 11.2 years).
The right-hand portion of Exhibit 1 presents the achievement results by gender. As can be seen, fourth-grade girls had signifi cantly higher reading achievement than boys in all countries.
Summary of Achievement in Reading for Literary and Informational Purposes
The PIRLS 2001 International Report also presented results for the two overarch-ing purposes for reading assessed by PIRLS:
• Reading for literary experience, and
• Reading to acquire and use information.
Essentially, the PIRLS assessment was designed so that half the pas-sages, time, and questions tested reading for literary purposes and half tested for informational purposes. In literary reading, the reader becomes involved in imagined events, settings, actions, consequences, characters, atmospheres, feelings, and ideas; bringing his or her own experiences, feelings, apprecia-tion of languages, and knowledge of literary forms to the text. In reading for information, the reader engages not with imagined worlds, but with aspects of the real universe. Through informational texts, one can understand how the world is and has been, and why things work as they do. These texts take many forms, but one major distinction is between chronological and non-chronological organization.
[9]international achievement in the processes of reading comprehension
SOU
RCE:
IEA
Pro
gres
s in
Inte
rnat
iona
l Rea
ding
Lite
racy
Stu
dy (P
IRLS
200
1)
[9]
CountriesYears of Formal
Schooling
Sweden 561 (2.2) 4 10.8 572 (2.6) 550 (2.5) 22 (2.6)
Netherlands 554 (2.5) 4 10.3 562 (2.7) 547 (2.8) 15 (2.2)
England 553 (3.4) 5 10.2 564 (3.9) 541 (3.7) 22 (3.3)
Bulgaria 550 (3.8) 4 10.9 562 (3.7) 538 (4.7) 24 (3.6)
Latvia 545 (2.3) 4 11.0 556 (3.1) 534 (2.6) 22 (3.4)1 Canada (O,Q) 544 (2.4) 4 10.0 553 (2.6) 536 (2.6) 17 (2.1)1 Lithuania 543 (2.6) 4 10.9 552 (3.0) 535 (2.7) 17 (2.7)
Hungary 543 (2.2) 4 10.7 550 (2.4) 536 (2.5) 14 (2.1)
United States 542 (3.8) 4 10.2 551 (3.8) 533 (4.9) 18 (4.1)
Italy 541 (2.4) 4 9.8 545 (2.6) 537 (2.7) 8 (2.5)
Germany 539 (1.9) 4 10.5 545 (2.2) 533 (2.5) 13 (2.7)
Czech Republic 537 (2.3) 4 10.5 543 (2.8) 531 (2.6) 12 (2.8)
New Zealand 529 (3.6) 5 10.1 542 (4.7) 516 (4.2) 27 (5.4)
Scotland 528 (3.6) 5 9.8 537 (3.9) 519 (4.2) 17 (4.0)
Singapore 528 (5.2) 4 10.1 540 (5.3) 516 (5.7) 24 (4.1)
Russian Federation 528 (4.4) 3 or 4 10.3 534 (4.3) 522 (4.8) 12 (2.3)
Hong Kong, SAR 528 (3.1) 4 10.2 538 (3.0) 519 (3.5) 19 (2.9)
France 525 (2.4) 4 10.1 531 (2.7) 520 (3.0) 11 (3.3)
Greece 524 (3.5) 4 9.9 535 (3.8) 514 (4.0) 21 (3.9)
Slovak Republic 518 (2.8) 4 10.3 526 (3.0) 510 (3.3) 16 (3.0)
Iceland 512 (1.2) 4 9.7 522 (1.9) 503 (1.5) 19 (2.4)
Romania 512 (4.6) 4 11.1 519 (4.2) 504 (5.7) 14 (3.8)
Israel 509 (2.8) 4 10.0 520 (3.4) 498 (3.7) 22 (4.3)
Slovenia 502 (2.0) 3 9.8 512 (2.5) 491 (2.4) 22 (2.8)
International Avg. 500 (0.6) 4 10.3 510 (0.7) 490 (0.7) 20 (0.7)
Norway 499 (2.9) 4 10.0 510 (3.5) 489 (3.4) 21 (3.9)
Cyprus 494 (3.0) 4 9.7 506 (3.3) 482 (3.6) 24 (3.5)
Moldova, Rep. of 492 (4.0) 4 10.8 504 (4.7) 479 (4.0) 25 (4.0)
Turkey 449 (3.5) 4 10.2 459 (4.0) 440 (3.7) 19 (3.1)
Macedonia, Rep. of 442 (4.6) 4 10.7 452 (5.1) 431 (4.8) 21 (3.6)
Colombia 422 (4.4) 4 10.5 428 (5.1) 416 (4.7) 12 (4.3)
Argentina 420 (5.9) 4 10.2 428 (6.2) 410 (6.5) 18 (4.7)
Iran, Islamic Rep. of 414 (4.2) 4 10.4 426 (5.7) 399 (5.6) 27 (8.1)
Kuwait 396 (4.3) 4 9.9 422 (5.6) 373 (6.3) 48 (8.4)
Morocco 350 (9.6) 4 11.2 361 (9.6) 341 (10.9) 20 (6.8)
Belize 327 (4.7) 4 9.8 341 (5.3) 314 (5.2) 27 (4.8)
Ontario (Canada) 548 (3.3) 4 9.9 558 (3.8) 538 (3.4) 20 (2.7)
Quebec (Canada) 537 (3.0) 4 10.2 544 (3.4) 530 (3.1) 14 (2.7)
OverallAverage
Scale Score
GirlsAverage
Scale Score
BoysAverage
Scale Score
AchievementDifference
AverageAge
Country average significantly lower thaninternational average
Country average significantly higher than international average
Significantly higher than other gender
1 National Desired Population does not cover all of International Desired Population. Because coverage falls below 65%, Canada is annotated Canada (O, Q) for the provinces of Ontario and Quebec only.
( ) Standard errors appear in parentheses. Because results are rounded to the nearest whole number, some totals may appear inconsistent.
Exhibit 1: Distribution of Reading Achievement Overall and by Gender PIRLS
[9]
SOU
RCE:
IEA
Pro
gres
s in
Inte
rnat
iona
l Rea
ding
Lite
racy
Stu
dy (P
IRLS
200
1)

[10] international achievement in the processes of reading comprehension
Each of these purposes for reading is usually associated with certain types of texts. For example, reading for literary experience is often accom-plished through reading fi ction, while reading to acquire and use information is generally associated with informative articles and instructional texts. The early reading of most young children centers on literary and narrative text types. In PIRLS 2001, the literary texts were narrative fi ction in the form of short stories. In addition, many young readers also enjoy acquiring information from books and other types of reading material. This kind of reading becomes more important as students develop their literacy abilities, and is increasingly required in order to learn across the curriculum. The informational texts in PIRLS included short informational materials involving text, maps, illustra-tions, diagrams, and photographs organized topically or chronologically.
The results for the two purposes were similar but not identical to the results overall. In reading for literary purposes, Sweden and England had the highest average achievement, with Sweden having signifi cantly higher mean achievement than the rest of the other participating countries and England performing signifi cantly better than all the other countries except The Neth-erlands, the United States and Bulgaria. Only Sweden outperformed The Netherlands, the United States, and Bulgaria. In reading for informational purposes, Sweden, The Netherlands, and Bulgaria had the highest average achievement. Sweden had signifi cantly higher achievement than the rest of the countries and The Netherlands and Bulgaria performed signifi cantly better than all the other countries except Latvia and England, who were out-performed only by Sweden.
[11]international achievement in the processes of reading comprehension
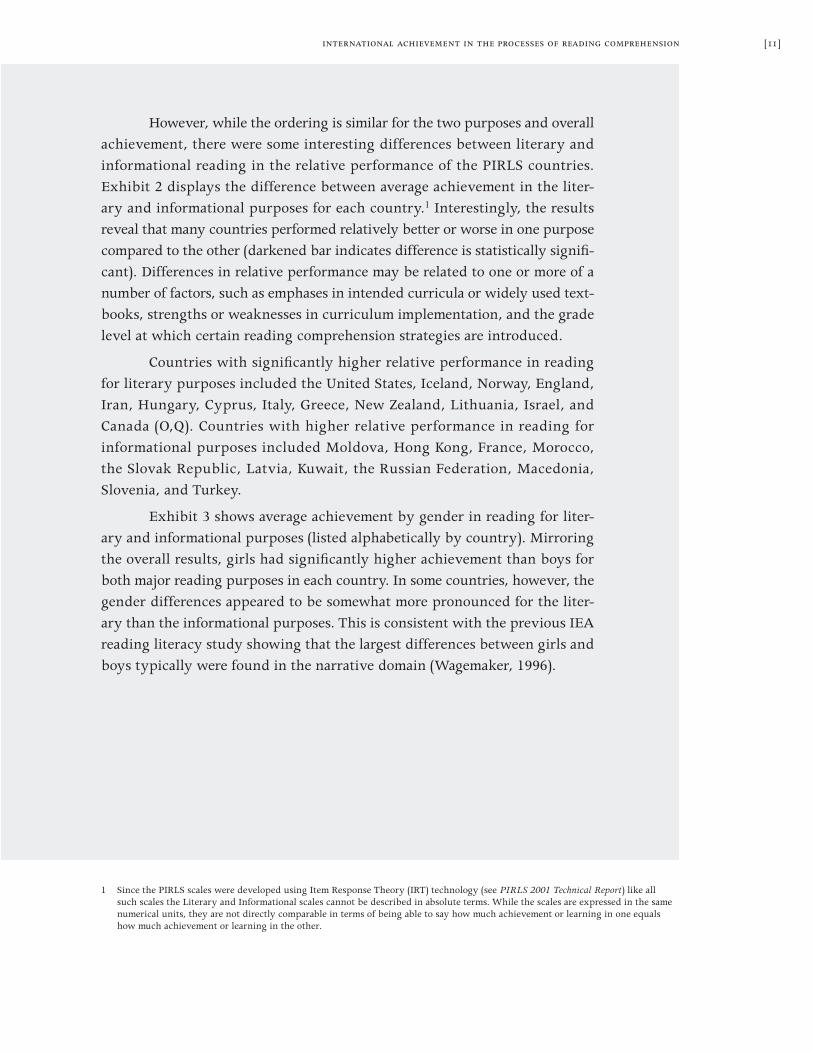
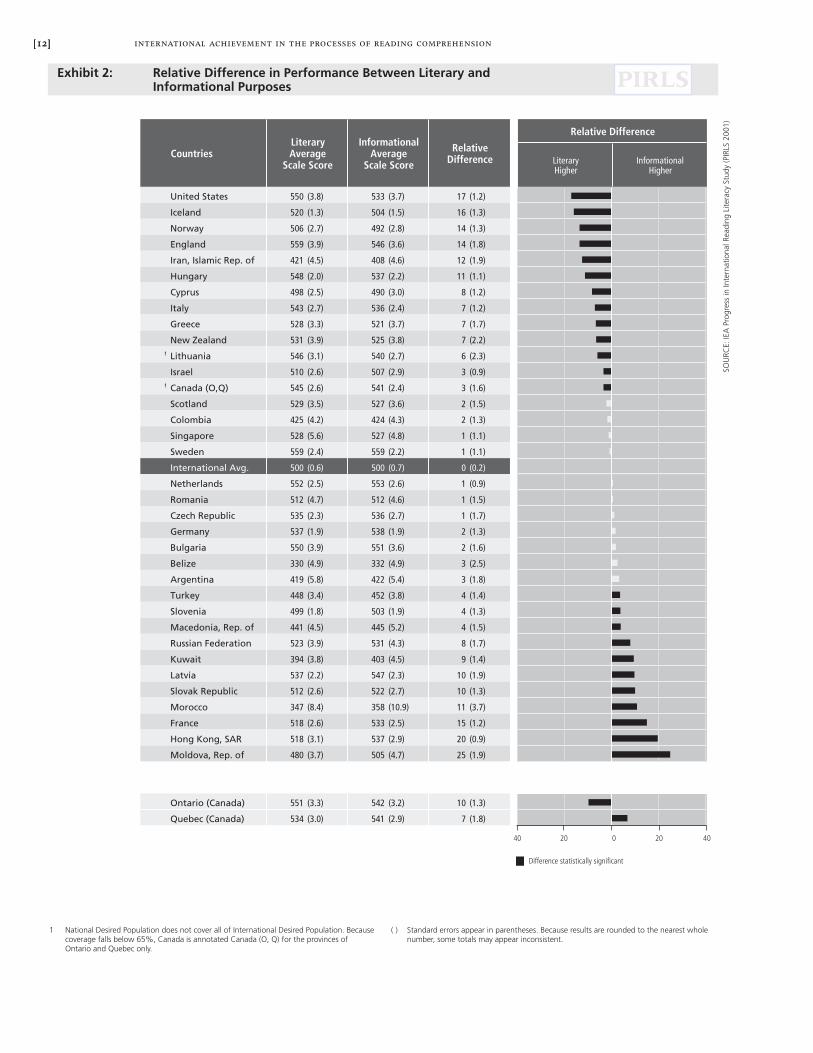
However, while the ordering is similar for the two purposes and overall achievement, there were some interesting differences between literary and informational reading in the relative performance of the PIRLS countries. Exhibit 2 displays the difference between average achievement in the liter-ary and informational purposes for each country.1 Interestingly, the results reveal that many countries performed relatively better or worse in one purpose compared to the other (darkened bar indicates difference is statistically signifi -cant). Differences in relative performance may be related to one or more of a number of factors, such as emphases in intended curricula or widely used text-books, strengths or weaknesses in curriculum implementation, and the grade level at which certain reading comprehension strategies are introduced.
Countries with signifi cantly higher relative performance in reading for literary purposes included the United States, Iceland, Norway, England, Iran, Hungary, Cyprus, Italy, Greece, New Zealand, Lithuania, Israel, and Canada (O,Q). Countries with higher relative performance in reading for informational purposes included Moldova, Hong Kong, France, Morocco, the Slovak Republic, Latvia, Kuwait, the Russian Federation, Macedonia, Slovenia, and Turkey.
Exhibit 3 shows average achievement by gender in reading for liter-ary and informational purposes (listed alphabetically by country). Mirroring the overall results, girls had signifi cantly higher achievement than boys for both major reading purposes in each country. In some countries, however, the gender differences appeared to be somewhat more pronounced for the liter-ary than the informational purposes. This is consistent with the previous IEA reading literacy study showing that the largest differences between girls and boys typically were found in the narrative domain (Wagemaker, 1996).
1 Since the PIRLS scales were developed using Item Response Theory (IRT) technology (see PIRLS 2001 Technical Report) like all such scales the Literary and Informational scales cannot be described in absolute terms. While the scales are expressed in the same numerical units, they are not directly comparable in terms of being able to say how much achievement or learning in one equals how much achievement or learning in the other.
[12] international achievement in the processes of reading comprehension
SOU
RCE:
IEA
Pro
gres
s in
Inte
rnat
iona
l Rea
ding
Lite
racy
Stu
dy (P
IRLS
200
1)
LiteraryHigher
InformationalHigher
United States 550 (3.8) 533 (3.7) 17 (1.2)
Iceland 520 (1.3) 504 (1.5) 16 (1.3)
Norway 506 (2.7) 492 (2.8) 14 (1.3)
England 559 (3.9) 546 (3.6) 14 (1.8)
Iran, Islamic Rep. of 421 (4.5) 408 (4.6) 12 (1.9)
Hungary 548 (2.0) 537 (2.2) 11 (1.1)
Cyprus 498 (2.5) 490 (3.0) 8 (1.2)
Italy 543 (2.7) 536 (2.4) 7 (1.2)
Greece 528 (3.3) 521 (3.7) 7 (1.7)
New Zealand 531 (3.9) 525 (3.8) 7 (2.2)1 Lithuania 546 (3.1) 540 (2.7) 6 (2.3)
Israel 510 (2.6) 507 (2.9) 3 (0.9)1 Canada (O,Q) 545 (2.6) 541 (2.4) 3 (1.6)
Scotland 529 (3.5) 527 (3.6) 2 (1.5)
Colombia 425 (4.2) 424 (4.3) 2 (1.3)
Singapore 528 (5.6) 527 (4.8) 1 (1.1)
Sweden 559 (2.4) 559 (2.2) 1 (1.1)
International Avg. 500 (0.6) 500 (0.7) 0 (0.2)
Netherlands 552 (2.5) 553 (2.6) 1 (0.9)
Romania 512 (4.7) 512 (4.6) 1 (1.5)
Czech Republic 535 (2.3) 536 (2.7) 1 (1.7)
Germany 537 (1.9) 538 (1.9) 2 (1.3)
Bulgaria 550 (3.9) 551 (3.6) 2 (1.6)
Belize 330 (4.9) 332 (4.9) 3 (2.5)
Argentina 419 (5.8) 422 (5.4) 3 (1.8)
Turkey 448 (3.4) 452 (3.8) 4 (1.4)
Slovenia 499 (1.8) 503 (1.9) 4 (1.3)
Macedonia, Rep. of 441 (4.5) 445 (5.2) 4 (1.5)
Russian Federation 523 (3.9) 531 (4.3) 8 (1.7)
Kuwait 394 (3.8) 403 (4.5) 9 (1.4)
Latvia 537 (2.2) 547 (2.3) 10 (1.9)
Slovak Republic 512 (2.6) 522 (2.7) 10 (1.3)
Morocco 347 (8.4) 358 (10.9) 11 (3.7)
France 518 (2.6) 533 (2.5) 15 (1.2)
Hong Kong, SAR 518 (3.1) 537 (2.9) 20 (0.9)
Moldova, Rep. of 480 (3.7) 505 (4.7) 25 (1.9)
Ontario (Canada) 551 (3.3) 542 (3.2) 10 (1.3)
Quebec (Canada) 534 (3.0) 541 (2.9) 7 (1.8)
Relative DifferenceLiteraryAverage
Scale Score
InformationalAverage
Scale Score
RelativeDifferenceCountries
Difference statistically significant
40 0 402020
1 National Desired Population does not cover all of International Desired Population. Because coverage falls below 65%, Canada is annotated Canada (O, Q) for the provinces of Ontario and Quebec only.
( ) Standard errors appear in parentheses. Because results are rounded to the nearest whole number, some totals may appear inconsistent.
Exhibit 2: Relative Difference in Performance Between Literary and Informational Purposes PIRLS
[12]
SOU
RCE:
IEA
Pro
gres
s in
Inte
rnat
iona
l Rea
ding
Lite
racy
Stu
dy (P
IRLS
200
1)

[13]international achievement in the processes of reading comprehension
SOU
RCE:
IEA
Pro
gres
s in
Inte
rnat
iona
l Rea
ding
Lite
racy
Stu
dy (P
IRLS
200
1)
Argentina 429 (6.2) 408 (6.2) 21 (4.6) 429 (6.0) 415 (5.9) 15 (4.9)
Belize 340 (5.3) 320 (5.6) 20 (5.1) 349 (5.1) 316 (5.9) 32 (5.0)
Bulgaria 563 (4.2) 535 (5.1) 28 (5.4) 561 (3.4) 541 (4.2) 20 (3.1)1 Canada (O,Q) 554 (3.0) 535 (2.7) 19 (2.2) 549 (3.0) 534 (2.6) 16 (2.7)
Colombia 431 (4.9) 419 (4.8) 12 (4.6) 430 (5.2) 417 (4.9) 12 (5.4)
Cyprus 512 (2.9) 485 (3.3) 26 (3.7) 500 (3.1) 480 (3.5) 20 (2.8)
Czech Republic 543 (2.7) 528 (2.7) 14 (2.8) 541 (3.3) 532 (3.1) 9 (3.5)
England 574 (4.9) 544 (4.0) 30 (4.3) 554 (4.0) 537 (4.0) 17 (3.5)
France 524 (2.9) 513 (3.2) 11 (3.2) 540 (2.9) 527 (3.1) 12 (3.3)
Germany 544 (2.1) 529 (2.4) 14 (2.5) 543 (2.5) 533 (2.1) 10 (2.6)
Greece 539 (3.8) 516 (3.7) 23 (3.5) 529 (3.9) 513 (4.4) 15 (3.8)
Hong Kong, SAR 528 (3.4) 507 (3.4) 21 (3.4) 546 (2.8) 529 (3.6) 17 (3.1)
Hungary 558 (2.1) 538 (2.6) 20 (2.5) 542 (2.5) 532 (2.8) 10 (3.0)
Iceland 531 (1.9) 509 (1.7) 21 (2.4) 512 (1.9) 496 (2.0) 16 (2.6)
Iran, Islamic Rep. of 433 (5.7) 406 (6.4) 28 (8.7) 419 (6.4) 395 (6.1) 24 (8.8)
Israel 521 (3.3) 498 (3.2) 23 (3.9) 518 (3.5) 495 (3.6) 23 (4.2)
Italy 549 (2.7) 538 (3.3) 11 (2.8) 539 (2.7) 533 (2.6) 6 (2.6)
Kuwait 416 (5.2) 373 (5.4) 43 (7.4) 430 (6.1) 378 (6.7) 52 (9.1)
Latvia 548 (2.8) 527 (2.2) 21 (2.4) 558 (2.8) 537 (2.6) 22 (2.8)1 Lithuania 554 (3.4) 536 (3.7) 18 (3.8) 548 (2.9) 532 (2.9) 16 (2.8)
Macedonia, Rep. of 453 (4.6) 430 (4.9) 22 (3.3) 454 (5.6) 437 (5.8) 17 (4.8)
Moldova, Rep. of 492 (4.3) 468 (3.6) 23 (3.4) 516 (5.5) 494 (4.7) 23 (4.5)
Morocco 358 (8.5) 340 (9.1) 19 (5.1) 370 (10.8) 349 (11.9) 20 (6.3)
Netherlands 561 (2.8) 544 (3.2) 17 (3.3) 559 (2.9) 547 (2.9) 11 (2.4)
New Zealand 546 (4.7) 517 (4.6) 30 (5.1) 536 (4.5) 514 (4.4) 21 (4.6)
Norway 519 (3.4) 494 (3.1) 24 (3.6) 499 (3.7) 486 (3.1) 14 (3.9)
Romania 518 (4.2) 505 (6.1) 13 (4.4) 519 (4.6) 506 (5.6) 13 (4.3)
Russian Federation 531 (3.9) 517 (4.3) 14 (2.9) 536 (4.5) 527 (4.6) 9 (2.8)
Scotland 538 (4.0) 519 (4.1) 19 (3.9) 534 (4.3) 520 (4.1) 14 (4.4)
Singapore 541 (5.7) 516 (6.0) 25 (4.2) 538 (4.9) 517 (5.3) 21 (3.8)
Slovak Republic 519 (2.9) 505 (2.9) 14 (2.8) 530 (2.8) 514 (3.4) 16 (3.3)
Slovenia 509 (2.4) 490 (2.4) 19 (3.1) 514 (2.6) 492 (2.5) 21 (3.4)
Sweden 572 (2.9) 547 (2.6) 25 (2.8) 568 (2.8) 550 (2.6) 18 (3.2)
Turkey 460 (3.8) 437 (3.6) 22 (2.9) 460 (4.6) 444 (4.2) 16 (4.5)
United States 558 (4.2) 542 (4.6) 16 (4.3) 541 (4.1) 525 (4.3) 16 (4.0)
International Avg. 511 (0.7) 490 (0.7) 21 (0.7) 509 (0.7) 491 (0.8) 18 (0.8)
Ontario (Canada) 563 (4.0) 540 (3.3) 24 (3.2) 550 (3.9) 533 (3.4) 17 (3.5)
Quebec (Canada) 541 (3.5) 526 (3.4) 15 (3.5) 546 (3.3) 535 (3.1) 10 (2.9)
Significantly higher than other gender
DifferenceBoys
AverageScale Score
Countries GirlsAverage
Scale ScoreDifference
InformationalLiterary
GirlsAverage
Scale Score
BoysAverage
Scale Score
1 National Desired Population does not cover all of International Desired Population. Because coverage falls below 65%, Canada is annotated Canada (O, Q) for the provinces of Ontario and Quebec only.
( ) Standard errors appear in parentheses. Because results are rounded to the nearest whole number, some totals may appear inconsistent.
Exhibit 3: Reading for Literary and Informational Purposes by Gender PIRLS
[14] international achievement in the processes of reading comprehension
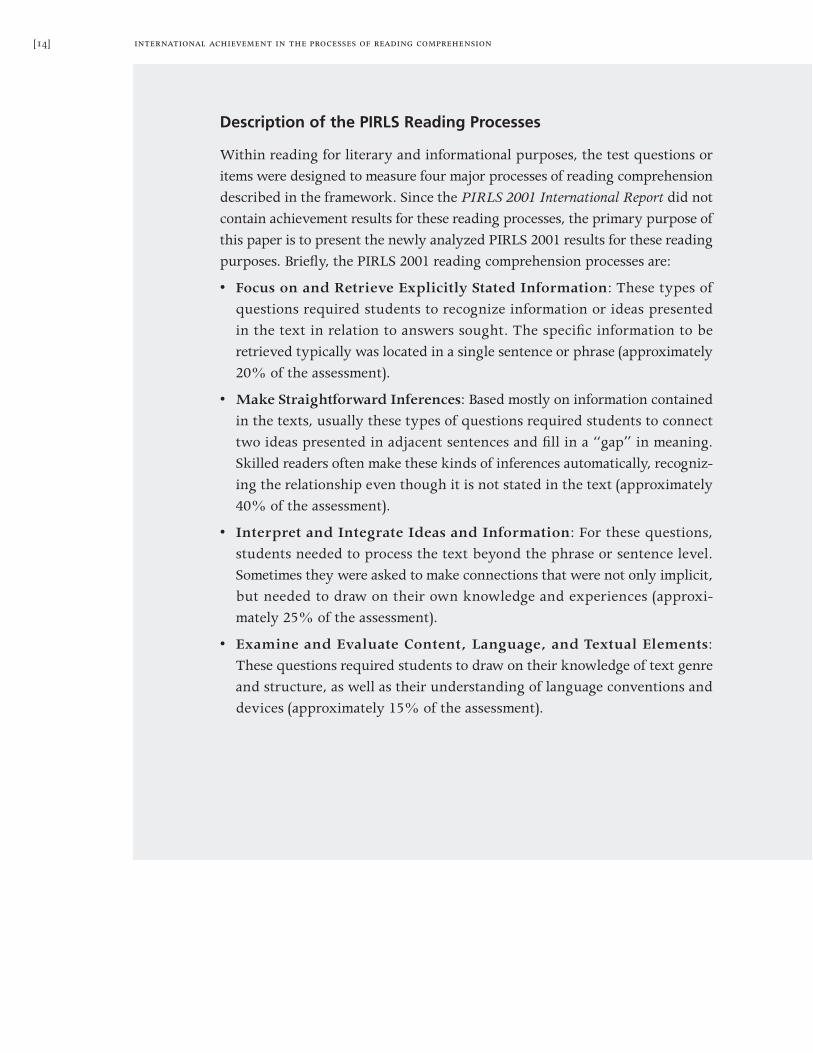
Description of the PIRLS Reading Processes
Within reading for literary and informational purposes, the test questions or items were designed to measure four major processes of reading comprehension described in the framework. Since the PIRLS 2001 International Report did not contain achievement results for these reading processes, the primary purpose of this paper is to present the newly analyzed PIRLS 2001 results for these reading purposes. Briefl y, the PIRLS 2001 reading comprehension processes are:
• Focus on and Retrieve Explicitly Stated Information: These types of questions required students to recognize information or ideas presented in the text in relation to answers sought. The specifi c information to be retrieved typically was located in a single sentence or phrase (approximately 20% of the assessment).
• Make Straightforward Inferences: Based mostly on information contained in the texts, usually these types of questions required students to connect two ideas presented in adjacent sentences and fi ll in a “gap” in meaning. Skilled readers often make these kinds of inferences automatically, recogniz-ing the relationship even though it is not stated in the text (approximately 40% of the assessment).
• Interpret and Integrate Ideas and Information: For these questions, students needed to process the text beyond the phrase or sentence level. Sometimes they were asked to make connections that were not only implicit, but needed to draw on their own knowledge and experiences (approxi-mately 25% of the assessment).
• Examine and Evaluate Content, Language, and Textual Elements: These questions required students to draw on their knowledge of text genre and structure, as well as their understanding of language conventions and devices (approximately 15% of the assessment).

[15]international achievement in the processes of reading comprehension
Considerations in Producing the PIRLS Reading Process Scales
In approaching the scaling task, several issues were considered. First, of course, was the PIRLS 2001 Framework specifying four major reading processes con-sidered necessary for fourth-grade students to be successful readers. An initial aim of the scaling was to provide results for all four processes. However, as noted above, the assessment did not contain an equal number of items in each process category. The number of items (score points) 2 available for scaling each process is noted below:
25 Focus on and Retrieve Explicitly Stated Information
27 Make Straightforward Inferences
31 Interpret and Integrate Ideas and Information
15 Examine and Evaluate Content, Language, and Textual Elements
Given the number of items available for analysis, it was anticipated that it would not be possible to create all four scales. Indeed the attempt to create four separate scales did not succeed because, in a number of countries, the scaling software was unable to determine a solution. The next step, then, was to consider combining some of the process categories.
In planning PIRLS 2006, National Research Coordinators (NRCs) were very much in favor creating process scales, which they felt would be an important addition to the assessment, although not one to be taken lightly since scaling by all four process areas would likely necessitate increasing the number of items in the assessment. With a view to conducting research on the PIRLS 2001 data and the possible need to combine process areas to create such scales, the NRCs made two different suggestions for reducing from four to three scales:
• Combine the retrieving and straightforward inferencing scales, since they are both essentially text based and can be considered similar. Leave the other two scales separate, because even though they require more reasoning skills they seem different.
2 The constructed-response items took three different forms: responses to one-point items were scored acceptable if they contained the necessary information, responses to two-point items were given full credit (2 points) and partial credit (1 point), and three-point items were given full credit (3 points) and two different levels of partial credit – satisfactory (2 points) and minimal (1 point).

[16] international achievement in the processes of reading comprehension
• Leave the retrieving and straightforward inferencing scales separate, because they may have enough items to support scaling and are important areas at the fourth grade. Combine the other two since they both require reasoning and the evaluate scale has very few items.
In addition to providing an additional perspective on the PIRLS results, another motivation for scaling the PIRLS 2001 comprehension processes was to facilitate comparisons between PIRLS and the OECD’s PISA 2000 for countries that participated in the two studies. PISA results are reported on a dimen-sion similar to the PIRLS processes. The concept of reading literacy in PISA had three dimensions: the type of reading task, the form and structure of the reading materials, and the use for which the text was constructed (OECD, 2002). According to PISA, competence is best understood in terms of the fi rst of these – type of reading task. The other two dimensions are considered properties of the reading task materials that were helpful in ensuring that a range of tasks was included in the tests.
A major difficulty in producing comparable information between PIRLS and PISA, however, is that since PIRLS is for fourth-grade students (typically 10 years old) and PISA is for 15-year-olds – the two studies empha-size different processes. Appropriately in view of the stage in schooling assessed (fourth grade), PIRLS devotes considerable effort to measuring stu-dents’ ability to locate and retrieve straightforward information. In PISA stu-dents are not assessed on the most basic reading skills, since it is assumed the most 15-year-olds have already acquired these skills.
Within the “type of reading task” dimension, the PISA 2000 assess-ment of reading literacy at age 15 included fi ve different categories of ques-tions. Students were expected to demonstrate their profi ciency in retrieving information, understanding texts at a general level, interpreting them, refl ecting on the content and form of texts in relation to their own knowledge of world, and evaluating and arguing their own point of view. However, given the high correlations between the fi ve categories, a more parsimonious model consist-ing of just three scales was adopted for reporting purposes (Turner, 2002). A “retrieving information” scale, which combines retrieving and understanding, reports on students’ ability to locate information in a text. An “interpreting
[17]international achievement in the processes of reading comprehension
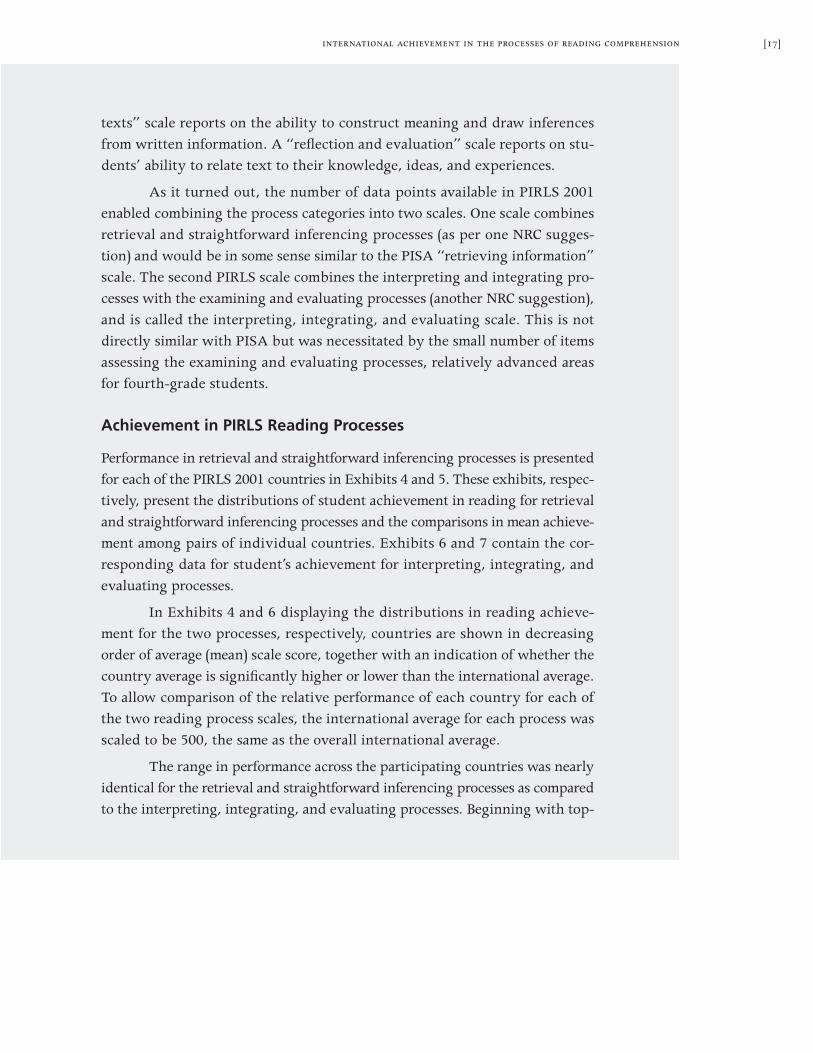
texts” scale reports on the ability to construct meaning and draw inferences from written information. A “refl ection and evaluation” scale reports on stu-dents’ ability to relate text to their knowledge, ideas, and experiences.
As it turned out, the number of data points available in PIRLS 2001 enabled combining the process categories into two scales. One scale combines retrieval and straightforward inferencing processes (as per one NRC sugges-tion) and would be in some sense similar to the PISA “retrieving information” scale. The second PIRLS scale combines the interpreting and integrating pro-cesses with the examining and evaluating processes (another NRC suggestion), and is called the interpreting, integrating, and evaluating scale. This is not directly similar with PISA but was necessitated by the small number of items assessing the examining and evaluating processes, relatively advanced areas for fourth-grade students.
Achievement in PIRLS Reading Processes
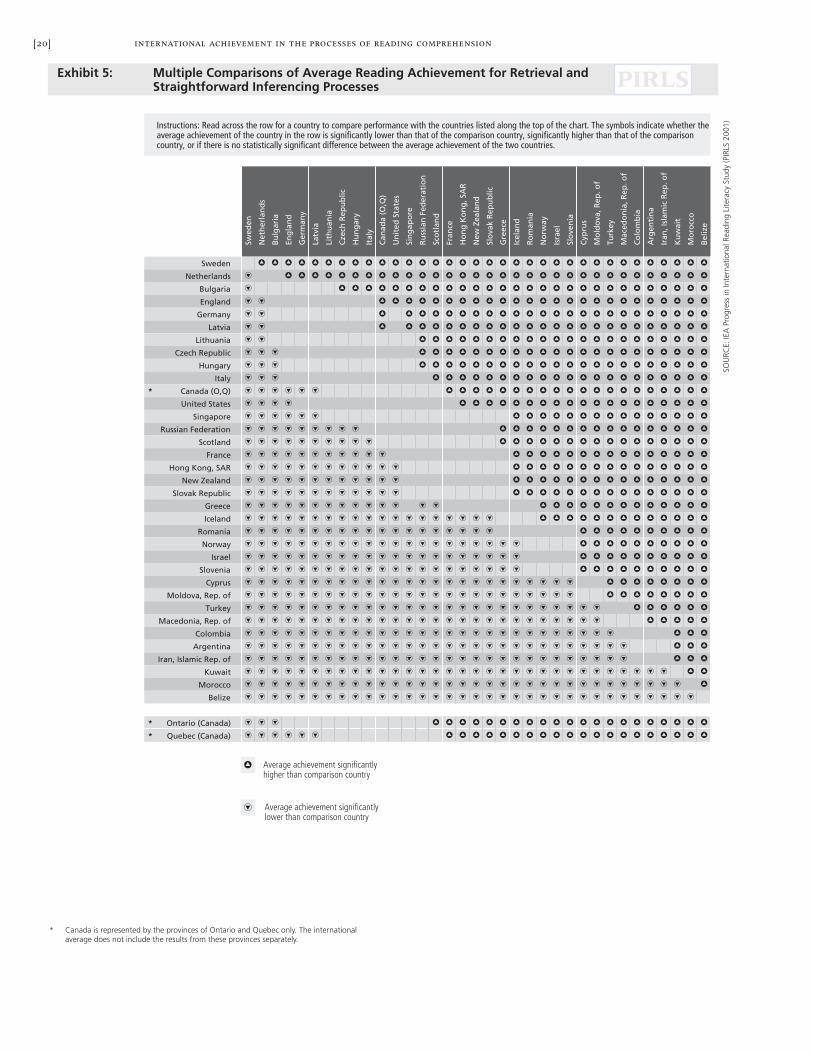
Performance in retrieval and straightforward inferencing processes is presented for each of the PIRLS 2001 countries in Exhibits 4 and 5. These exhibits, respec-tively, present the distributions of student achievement in reading for retrieval and straightforward inferencing processes and the comparisons in mean achieve-ment among pairs of individual countries. Exhibits 6 and 7 contain the cor-responding data for student’s achievement for interpreting, integrating, and evaluating processes.
In Exhibits 4 and 6 displaying the distributions in reading achieve-ment for the two processes, respectively, countries are shown in decreasing order of average (mean) scale score, together with an indication of whether the country average is signifi cantly higher or lower than the international average. To allow comparison of the relative performance of each country for each of the two reading process scales, the international average for each process was scaled to be 500, the same as the overall international average.
The range in performance across the participating countries was nearly identical for the retrieval and straightforward inferencing processes as compared to the interpreting, integrating, and evaluating processes. Beginning with top-

[18] international achievement in the processes of reading comprehension
performing Sweden, it can be seen that 21 countries had average achievement for the retrieving and straightforward inferencing processes that was above the international average. Four countries had achievement about at the international average, and the remaining 10 countries had average achievement below the international average. Interestingly, a few more countries (23) performed sig-nifi cantly above the international average for the interpreting, integrating, and evaluating processes and somewhat fewer (8) below the international average.
Exhibits 5 and 7 compare overall mean achievement among individual countries for the two process scales, respectively. These exhibits show whether or not the differences in average achievement between pairs of countries are statistically signifi cant. Selecting a country of interest and reading across the table, a triangle pointing up indicates signifi cantly higher performance than the comparison country listed across the top; absence of symbol indicates no signifi cant difference in performance; and a triangle pointing down indicates signifi cantly lower performance.
Sweden had the highest average achievement for the retrieval and straightforward inferencing processes. The Netherlands and Bulgaria outper-formed all the rest of the participating countries except Sweden. England, Germany, Latvia, and Lithuania also performed very well. For the interpreting, integrating, and evaluating processes, Sweden, England, The Netherlands, and Bulgaria all performed similarly. Also, Canada (O,Q) and the United States were outperformed only by Sweden.
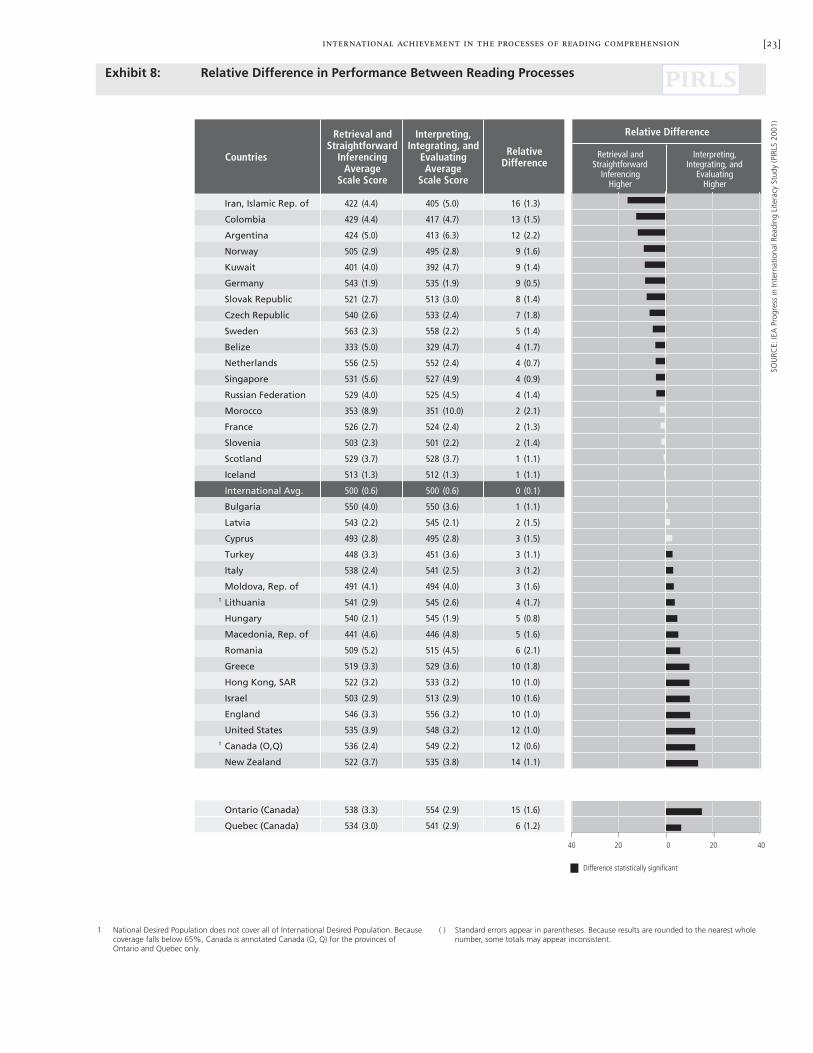
Relative Strengths and Weaknesses in Reading Processes
Exhibit 8 displays the difference for each country between average achievement in the retrieval and straightforward inferencing processes as compared to that for the interpreting, integrating, and evaluating processes. It is not appropriate to compare numerical scale scores directly between the two process scales, but it is possible to determine relative strengths of countries in the two different processes, on the basis of their relative rank-order positions on the respective scales. The results reveal that many countries performed relatively better or worse in one process compared to the other (darkened bar indicates difference is statistically signifi cant).

[19]international achievement in the processes of reading comprehension
SOU
RCE:
IEA
Pro
gres
s in
Inte
rnat
iona
l Rea
ding
Lite
racy
Stu
dy (P
IRLS
200
1)
Countries Reading Achievement Scale Score Years of Formal Schooling
AverageAge
Sweden 563 (2.3) 4 10.8
Netherlands 556 (2.5) 4 10.3
Bulgaria 550 (4.0) 4 10.9
England 546 (3.3) 5 10.2
Germany 543 (1.9) 4 10.5
Latvia 543 (2.2) 4 11.0 1 Lithuania 541 (2.9) 4 10.9
Czech Republic 540 (2.6) 4 10.5
Hungary 540 (2.1) 4 10.7
Italy 538 (2.4) 4 9.8 1 Canada (O,Q) 536 (2.4) 4 10.0
United States 535 (3.9) 4 10.2
Singapore 531 (5.6) 4 10.1
Russian Federation 529 (4.0) 3 or 4 10.3
Scotland 529 (3.7) 5 9.8
France 526 (2.7) 4 10.1
Hong Kong, SAR 522 (3.2) 4 10.2
New Zealand 522 (3.7) 5 10.1
Slovak Republic 521 (2.7) 4 10.3
Greece 519 (3.3) 4 9.9
Iceland 513 (1.3) 4 9.7
Romania 509 (5.2) 4 11.1
Norway 505 (2.9) 4 10.0
Israel 503 (2.9) 4 10.0
Slovenia 503 (2.3) 3 9.8
International Avg. 500 (0.6) 4 10.3
Cyprus 493 (2.8) 4 9.7
Moldova, Rep. of 491 (4.1) 4 10.8
Turkey 448 (3.3) 4 10.2
Macedonia, Rep. of 441 (4.6) 4 10.7
Colombia 429 (4.4) 4 10.5
Argentina 424 (5.0) 4 10.2
Iran, Islamic Rep. of 422 (4.4) 4 10.4
Kuwait 401 (4.0) 4 9.9
Morocco 353 (8.9) 4 11.2
Belize 333 (5.0) 4 9.8
Ontario (Canada) 538 (3.3) 4 9.9
Quebec (Canada) 534 (3.0) 4 10.2
AverageScale Score
200 300 400 500 600 700 800
5th 25th 75th 95th
Average and 95% Confidence Interval (±2SE)
Percentiles of Performance
Country average significantly lower thaninternational average
Country average significantly higher than international average
1 National Desired Population does not cover all of International Desired Population. Because coverage falls below 65%, Canada is annotated Canada (O, Q) for the provinces of Ontario and Quebec only.
( ) Standard errors appear in parentheses. Because results are rounded to the nearest whole number, some totals may appear inconsistent.
Exhibit 4: Distribution of Reading Achievement for Retrieval and Straightforward Inferencing Processes PIRLS
[20] international achievement in the processes of reading comprehension
SOU
RCE:
IEA
Pro
gres
s in
Inte
rnat
iona
l Rea
ding
Lite
racy
Stu
dy (P
IRLS
200
1)
Swed
en
Net
her
lan
ds
Bu
lgar
ia
Eng
lan
d
Ger
man
y
Latv
ia
Lith
uan
ia
Cze
ch R
epu
blic
Hu
ng
ary
Ital
y
Can
ada
(O,Q
)
Un
ited
Sta
tes
Sin
gap
ore
Ru
ssia
n F
eder
atio
n
Sco
tlan
d
Fran
ce
Ho
ng
Ko
ng
, SA
R
New
Zea
lan
d
Slo
vak
Rep
ub
lic
Gre
ece
Icel
and
Ro
man
ia
No
rway
Isra
el
Slo
ven
ia
Cyp
rus
Mo
ldo
va, R
ep. o
f
Turk
ey
Mac
edo
nia
, Rep
. of
Co
lom
bia
Arg
enti
na
Iran
, Isl
amic
Rep
. of
Ku
wai
t
Mo
rocc
o
Bel
ize
Sweden
Netherlands
Bulgaria
England
Germany
Latvia
Lithuania
Czech Republic
Hungary
Italy
* Canada (O,Q)
United States
Singapore
Russian Federation
Scotland
France
Hong Kong, SAR
New Zealand
Slovak Republic
Greece
Iceland
Romania
Norway
Israel
Slovenia
Cyprus
Moldova, Rep. of
Turkey
Macedonia, Rep. of
Colombia
Argentina
Iran, Islamic Rep. of
Kuwait
Morocco
Belize
* Ontario (Canada)
* Quebec (Canada)
Instructions: Read across the row for a country to compare performance with the countries listed along the top of the chart. The symbols indicate whether the average achievement of the country in the row is significantly lower than that of the comparison country, significantly higher than that of the comparison country, or if there is no statistically significant difference between the average achievement of the two countries.
Average achievement significantly higher than comparison country
Average achievement significantly lower than comparison country
Exhibit 5: Multiple Comparisons of Average Reading Achievement for Retrieval and Straightforward Inferencing Processes PIRLS
* Canada is represented by the provinces of Ontario and Quebec only. The international average does not include the results from these provinces separately.

[21]international achievement in the processes of reading comprehension
SOU
RCE:
IEA
Pro
gres
s in
Inte
rnat
iona
l Rea
ding
Lite
racy
Stu
dy (P
IRLS
200
1)
Countries Reading Achievement Scale Score Years of Formal Schooling
AverageAge
Sweden 558 (2.2) 4 10.8
England 556 (3.2) 5 10.2
Netherlands 552 (2.4) 4 10.3
Bulgaria 550 (3.6) 4 10.9 1 Canada (O,Q) 549 (2.2) 4 10.0
United States 548 (3.2) 4 10.2
Latvia 545 (2.1) 4 11.0 1 Lithuania 545 (2.6) 4 10.9
Hungary 545 (1.9) 4 10.7
Italy 541 (2.5) 4 9.8
New Zealand 535 (3.8) 5 10.1
Germany 535 (1.9) 4 10.5
Czech Republic 533 (2.4) 4 10.5
Hong Kong, SAR 533 (3.2) 4 10.2
Greece 529 (3.6) 4 9.9
Scotland 528 (3.7) 5 9.8
Singapore 527 (4.9) 4 10.1
Russian Federation 525 (4.5) 3 or 4 10.3
France 524 (2.4) 4 10.1
Romania 515 (4.5) 4 11.1
Israel 513 (2.9) 4 10.0
Slovak Republic 513 (3.0) 4 10.3
Iceland 512 (1.3) 4 9.7
Slovenia 501 (2.2) 3 9.8
International Avg. 500 (0.6) 4 10.3
Cyprus 495 (2.8) 4 9.7
Norway 495 (2.8) 4 10.0
Moldova, Rep. of 494 (4.0) 4 10.8
Turkey 451 (3.6) 4 10.2
Macedonia, Rep. of 446 (4.8) 4 10.7
Colombia 417 (4.7) 4 10.5
Argentina 413 (6.3) 4 10.2
Iran, Islamic Rep. of 405 (5.0) 4 10.4
Kuwait 392 (4.7) 4 9.9
Morocco 351 (10.0) 4 11.2
Belize 329 (4.7) 4 9.8
Ontario (Canada) 554 (2.9) 4 9.9
Quebec (Canada) 541 (2.9) 4 10.2
AverageScale Score
200 300 400 500 600 700 800
5th 25th 75th 95th
Average and 95% Confidence Interval (±2SE)
Percentiles of Performance
Country average significantly lower thaninternational average
Country average significantly higher than international average
1 National Desired Population does not cover all of International Desired Population. Because coverage falls below 65%, Canada is annotated Canada (O, Q) for the provinces of Ontario and Quebec only.
( ) Standard errors appear in parentheses. Because results are rounded to the nearest whole number, some totals may appear inconsistent.
Exhibit 6: Distribution of Reading Achievement for Interpreting, Integrating, and Evaluating Processes PIRLS

[22] international achievement in the processes of reading comprehension
SOU
RCE:
IEA
Pro
gres
s in
Inte
rnat
iona
l Rea
ding
Lite
racy
Stu
dy (P
IRLS
200
1)
Swed
en
Eng
lan
d
Net
her
lan
ds
Bu
lgar
ia
Can
ada
(O,Q
)
Un
ited
Sta
tes
Latv
ia
Lith
uan
ia
Hu
ng
ary
Ital
y
New
Zea
lan
d
Ger
man
y
Cze
ch R
epu
blic
Ho
ng
Ko
ng
, SA
R
Gre
ece
Sco
tlan
d
Sin
gap
ore
Ru
ssia
n F
eder
atio
n
Fran
ce
Ro
man
ia
Isra
el
Slo
vak
Rep
ub
lic
Icel
and
Slo
ven
ia
Cyp
rus
No
rway
Mo
ldo
va, R
ep. o
f
Turk
ey
Mac
edo
nia
, Rep
. of
Co
lom
bia
Arg
enti
na
Iran
, Isl
amic
Rep
. of
Ku
wai
t
Mo
rocc
o
Bel
ize
Sweden
England
Netherlands
Bulgaria
* Canada (O,Q)
United States
Latvia
Lithuania
Hungary
Italy
New Zealand
Germany
Czech Republic
Hong Kong, SAR
Greece
Scotland
Singapore
Russian Federation
France
Romania
Israel
Slovak Republic
Iceland
Slovenia
Cyprus
Norway
Moldova, Rep. of
Turkey
Macedonia, Rep. of
Colombia
Argentina
Iran, Islamic Rep. of
Kuwait
Morocco
Belize
* Ontario (Canada)
* Quebec (Canada)
Instructions: Read across the row for a country to compare performance with the countries listed along the top of the chart. The symbols indicate whether the average achievement of the country in the row is significantly lower than that of the comparison country, significantly higher than that of the comparison country, or if there is no statistically significant difference between the average achievement of the two countries.
Average achievement significantly higher than comparison country
Average achievement significantly lower than comparison country
Exhibit 7: Multiple Comparisons of Average Reading Achievement for Interpreting, Integrating, and Evaluating Processes PIRLS
* Canada is represented by the provinces of Ontario and Quebec only. The international average does not include the results from these provinces separately.
[23]international achievement in the processes of reading comprehension
SOU
RCE:
IEA
Pro
gres
s in
Inte
rnat
iona
l Rea
ding
Lite
racy
Stu
dy (P
IRLS
200
1)
Retrieval andStraightforward
InferencingHigher
Interpreting,Integrating, and
EvaluatingHigher
Iran, Islamic Rep. of 422 (4.4) 405 (5.0) 16 (1.3)
Colombia 429 (4.4) 417 (4.7) 13 (1.5)
Argentina 424 (5.0) 413 (6.3) 12 (2.2)
Norway 505 (2.9) 495 (2.8) 9 (1.6)
Kuwait 401 (4.0) 392 (4.7) 9 (1.4)
Germany 543 (1.9) 535 (1.9) 9 (0.5)
Slovak Republic 521 (2.7) 513 (3.0) 8 (1.4)
Czech Republic 540 (2.6) 533 (2.4) 7 (1.8)
Sweden 563 (2.3) 558 (2.2) 5 (1.4)
Belize 333 (5.0) 329 (4.7) 4 (1.7)
Netherlands 556 (2.5) 552 (2.4) 4 (0.7)
Singapore 531 (5.6) 527 (4.9) 4 (0.9)
Russian Federation 529 (4.0) 525 (4.5) 4 (1.4)
Morocco 353 (8.9) 351 (10.0) 2 (2.1)
France 526 (2.7) 524 (2.4) 2 (1.3)
Slovenia 503 (2.3) 501 (2.2) 2 (1.4)
Scotland 529 (3.7) 528 (3.7) 1 (1.1)
Iceland 513 (1.3) 512 (1.3) 1 (1.1)
International Avg. 500 (0.6) 500 (0.6) 0 (0.1)
Bulgaria 550 (4.0) 550 (3.6) 1 (1.1)
Latvia 543 (2.2) 545 (2.1) 2 (1.5)
Cyprus 493 (2.8) 495 (2.8) 3 (1.5)
Turkey 448 (3.3) 451 (3.6) 3 (1.1)
Italy 538 (2.4) 541 (2.5) 3 (1.2)
Moldova, Rep. of 491 (4.1) 494 (4.0) 3 (1.6)1 Lithuania 541 (2.9) 545 (2.6) 4 (1.7)
Hungary 540 (2.1) 545 (1.9) 5 (0.8)
Macedonia, Rep. of 441 (4.6) 446 (4.8) 5 (1.6)
Romania 509 (5.2) 515 (4.5) 6 (2.1)
Greece 519 (3.3) 529 (3.6) 10 (1.8)
Hong Kong, SAR 522 (3.2) 533 (3.2) 10 (1.0)
Israel 503 (2.9) 513 (2.9) 10 (1.6)
England 546 (3.3) 556 (3.2) 10 (1.0)
United States 535 (3.9) 548 (3.2) 12 (1.0)1 Canada (O,Q) 536 (2.4) 549 (2.2) 12 (0.6)
New Zealand 522 (3.7) 535 (3.8) 14 (1.1)
Ontario (Canada) 538 (3.3) 554 (2.9) 15 (1.6)
Quebec (Canada) 534 (3.0) 541 (2.9) 6 (1.2)
Relative DifferenceRetrieval andStraightforward
InferencingAverage
Scale Score
Interpreting,Integrating, and
EvaluatingAverage
Scale Score
RelativeDifferenceCountries
Difference statistically significant
40 0 402020
1 National Desired Population does not cover all of International Desired Population. Because coverage falls below 65%, Canada is annotated Canada (O, Q) for the provinces of Ontario and Quebec only.
( ) Standard errors appear in parentheses. Because results are rounded to the nearest whole number, some totals may appear inconsistent.
Exhibit 8: Relative Difference in Performance Between Reading Processes PIRLS
[24] international achievement in the processes of reading comprehension
Countries with signifi cantly higher relative performance in the retrieval and straightforward inferencing processes included Iran, Colombia, Argen-tina, Norway, Kuwait, Germany, Slovak Republic, Czech Republic, Sweden, Belize, The Netherlands, Singapore, and the Russian Federation. Countries with signifi cantly higher relative performance in the interpreting, integrat-ing, and evaluating processes included New Zealand, Canada (O,Q), United States, England, Israel, Hong Kong, Greece, Romania, Macedonia, Hungary, Lithuania, Moldova, Italy, and Turkey.
In developing descriptions of performance at the international bench-marks along the PIRLS achievement scale (lower quarter, median, upper quarter, and top 10%) for the PIRLS 2001 International Report, it was dis-covered that, for the passages in the assessment, students at the lower quarter benchmark demonstrated the most success on items requiring retrieval of explicitly stated details from the various literary and informational texts. However, students also had some success with some items requiring straight-forward inferences. In other words, lower performing students did better on the text based items. Yet, it is interesting to note that countries with relatively better performance in retrieval and straightforward inferencing processes included both higher and lower achieving countries. Five of the 10 countries performing below the international average, including Iran, Colombia, Argen-tina, Kuwait, and Belize, were relatively stronger in the text based comprehen-sion processes, but so were top-performing Sweden and The Netherlands.
Interestingly, the countries with relatively higher performance in the interpreting, integrating, and evaluating processes included two groups of rather similar countries. One group includes most of the English-speaking countries – New Zealand, Canada, United States, and England. The other group includes a number of the Eastern European countries – Romania, Macedonia, Hungary, and Moldova. This result suggests that curriculum or instructional approaches may also infl uence students’ relative achievement in these processes.
[25]international achievement in the processes of reading comprehension
Gender Differences in Achievement for the Process Areas
Listed alphabetically by country, Exhibit 9 shows average achievement by gender in reading for the retrieval and straightforward inferencing processes and for the interpreting, integrating, and evaluating processes. Completely con-sistent with the overall reading results and those for the literary and informa-tional reading purposes, girls had signifi cantly higher achievement than boys in every country for both types of processes. On average, the female advantage was similar for the two types of processes. However, the difference was somewhat more pronounced (at least 5 points larger) for the interpreting, integrating, and evaluating processes in more than half a dozen countries, including Argentina, Iran, Israel, Kuwait, Lithuania, Scotland, and the Slovak Republic.
Scaling Methodology
The PIRLS International Study Center used essentially the same procedures to develop scales for the PIRLS reading comprehension processes as were used to develop the scales for reading overall and for the literary and informational purposes. These procedures are documented in Chapter 11 of the PIRLS Techni-cal Report (Gonzalez, 2003). This scaling approach was developed originally by Educational Testing Service for use in the U.S. National Assessment of Educa-tional Progress and also is used for TIMSS.
In brief, the procedure used Item Response Theory (IRT) scaling with multiple imputation or “plausible valuable” methodology. For the two types of reading processes, student’s achievement was summarized using a family of 2- and 3-parameter IRT scaling models. For dichotomously scored items (correct or incorrect), a 3-parameter model was used with multiple-choice items and a 2-parameter model with constructed-response items (since the guessing parameter is not necessary). Generalized partial-credit models were used with polytomous constructed-response items having two or three score points.
The IRT scaling method produces a score by averaging the responses of each student to the items that he or she took which takes into account the dif-fi culty and discriminating power of each item. Such a method was necessary because PIRLS has a matrix-sampling design, whereby students responded

[26] international achievement in the processes of reading comprehension
to different passages and items depending on which of 9 test booklets they received. The IRT analysis provides a common scale on which performance can be compared across countries. For this analysis, achievement scales were produced for each of the two types of reading processes (retrieval and straight-forward inferencing processes and interpreting, integrating, and evaluating processes). Exhibit 10 presents the Pearson correlation coeffi cient indicating the linear relationship between the two types of reading processes in each of the PIRLS countries. The jackknife repeated replication (JRR) technique was used to provide estimates of the sampling errors of the scale means and percentages for the two types of reading processes.

[27]international achievement in the processes of reading comprehension
SOU
RCE:
IEA
Pro
gres
s in
Inte
rnat
iona
l Rea
ding
Lite
racy
Stu
dy (P
IRLS
200
1)
Argentina 431 (5.7) 418 (5.3) 13 (4.5) 422 (6.9) 402 (6.9) 20 (5.7)
Belize 347 (5.0) 320 (5.7) 26 (4.3) 341 (5.2) 317 (5.4) 25 (4.9)
Bulgaria 561 (4.1) 538 (4.9) 23 (4.1) 562 (3.4) 539 (4.3) 23 (3.3)1 Canada (O,Q) 544 (2.7) 529 (2.9) 16 (2.7) 558 (2.6) 540 (2.4) 18 (2.2)
Colombia 434 (5.0) 424 (4.7) 10 (4.3) 423 (5.3) 410 (5.4) 13 (5.2)
Cyprus 505 (2.9) 482 (4.0) 23 (4.2) 507 (3.0) 484 (3.6) 23 (3.4)
Czech Republic 548 (3.4) 533 (3.2) 15 (4.1) 539 (3.0) 528 (3.0) 11 (3.4)
England 556 (3.9) 535 (4.1) 21 (4.4) 568 (4.1) 544 (3.4) 23 (3.7)
France 533 (3.0) 520 (3.4) 13 (3.7) 530 (2.8) 519 (3.0) 11 (3.3)
Germany 549 (2.1) 538 (2.4) 11 (2.5) 541 (2.1) 528 (2.2) 13 (2.3)
Greece 529 (3.6) 509 (3.7) 21 (3.4) 540 (3.5) 518 (4.2) 21 (3.3)
Hong Kong, SAR 531 (3.2) 514 (3.6) 17 (3.0) 543 (3.2) 523 (3.8) 20 (3.4)
Hungary 546 (2.4) 533 (2.5) 13 (2.5) 552 (2.1) 537 (2.4) 15 (2.4)
Iceland 522 (2.0) 504 (1.7) 18 (2.8) 522 (1.7) 503 (1.9) 20 (2.5)
Iran, Islamic Rep. o 432 (5.7) 409 (6.0) 23 (8.0) 420 (6.3) 388 (6.6) 31 (8.8)
Israel 513 (3.5) 494 (3.7) 19 (4.2) 525 (3.3) 502 (4.1) 24 (4.5)
Italy 542 (2.8) 535 (2.8) 7 (2.8) 546 (2.9) 537 (2.6) 9 (2.4)
Kuwait 424 (5.5) 381 (5.6) 43 (7.8) 420 (5.9) 367 (7.0) 53 (9.0)
Latvia 554 (3.1) 533 (2.5) 21 (3.5) 556 (2.9) 535 (2.0) 21 (2.5)1 Lithuania 547 (3.3) 535 (3.3) 12 (3.5) 554 (3.4) 535 (3.0) 18 (3.9)
Macedonia, Rep. of 451 (5.2) 430 (4.8) 21 (3.7) 457 (5.7) 435 (4.8) 22 (4.5)
Moldova, Rep. of 503 (4.7) 478 (4.2) 24 (3.8) 506 (4.8) 482 (3.9) 24 (4.0)
Morocco 366 (8.7) 344 (10.0) 21 (6.0) 362 (10.2) 342 (11.0) 20 (7.1)
Netherlands 563 (3.0) 550 (3.0) 13 (3.2) 558 (2.5) 546 (2.6) 12 (1.9)
New Zealand 534 (5.0) 510 (4.4) 24 (5.8) 550 (4.6) 521 (4.4) 28 (4.9)
Norway 515 (3.6) 496 (3.7) 19 (4.3) 507 (3.4) 485 (3.3) 22 (3.6)
Romania 514 (5.3) 503 (6.0) 12 (4.3) 522 (4.4) 507 (5.6) 15 (4.4)
Russian Federation 535 (4.1) 524 (4.3) 12 (2.7) 532 (4.7) 519 (4.6) 13 (2.6)
Scotland 535 (3.8) 521 (4.7) 14 (4.2) 538 (3.9) 517 (4.2) 21 (3.7)
Singapore 544 (5.7) 520 (6.1) 24 (4.5) 538 (5.0) 516 (5.3) 22 (3.6)
Slovak Republic 529 (3.0) 514 (3.5) 14 (3.9) 523 (3.1) 504 (3.6) 19 (3.3)
Slovenia 514 (3.4) 492 (2.3) 22 (3.5) 512 (2.8) 490 (2.6) 21 (3.0)
Sweden 574 (2.8) 553 (2.7) 21 (3.1) 569 (2.6) 547 (2.5) 22 (2.7)
Turkey 458 (3.9) 440 (3.6) 18 (3.5) 461 (4.1) 441 (3.8) 20 (3.4)
United States 545 (4.2) 526 (4.7) 19 (4.3) 557 (3.4) 539 (3.8) 18 (3.3)
International Avg. 509 (0.7) 491 (0.7) 18 (0.8) 510 (0.7) 490 (0.7) 20 (0.7)
Ontario (Canada) 548 (4.1) 530 (3.4) 18 (3.6) 564 (3.3) 544 (3.0) 21 (2.4)
Quebec (Canada) 540 (3.5) 528 (3.1) 11 (3.0) 549 (3.5) 533 (2.9) 16 (3.1)
Significantly higher than other gender
Countries GirlsAverage
Scale ScoreDifference
Interpeting, Integrating, and EvaluatingRetrieval and Straightforward Inferencing
GirlsAverage
Scale Score
BoysAverage
Scale ScoreDifference
BoysAverage
Scale Score
1 National Desired Population does not cover all of International Desired Population. Because coverage falls below 65%, Canada is annotated Canada (O, Q) for the provinces of Ontario and Quebec only.
( ) Standard errors appear in parentheses. Because results are rounded to the nearest whole number, some totals may appear inconsistent.
Exhibit 9: Reading for Processes by Gender PIRLS

[28] international achievement in the processes of reading comprehension
SOU
RCE:
IEA
Pro
gres
s in
Inte
rnat
iona
l Rea
ding
Lite
racy
Stu
dy (P
IRLS
200
1)
Argentina 0.93
Belize 0.92
Bulgaria 0.93
Canada (O,Q) 0.93
Colombia 0.92
Cyprus 0.93
Czech Republic 0.88
England 0.94
France 0.92
Germany 0.94
Greece 0.88
Hong Kong, SAR 0.91
Hungary 0.92
Iceland 0.93
Iran, Islamic Rep. of 0.96
Israel 0.93
Italy 0.92
Kuwait 0.92
Latvia 0.91
Lithuania 0.88
Macedonia, Rep. of 0.95
Moldova, Rep. of 0.92
Morocco 0.90
Netherlands 0.90
New Zealand 0.92
Norway 0.92
Romania 0.93
Russian Federation 0.88
Scotland 0.91
Singapore 0.97
Slovak Republic 0.91
Slovenia 0.92
Sweden 0.92
Turkey 0.94
United States 0.96
International Median 0.92
PearsonCorrelationCoefficient
Countries
Exhibit 10: Correlation Between Reading for Retrieval and Straightforward Inferencing and Reading for Interpreting, Integrating and Evaluating Processes PIRLS

[29]international achievement in the processes of reading comprehension
References
Campbell, J.R., Kelly, D.L., Mullis, I.V.S., Martin, M.O., & Sainsbury, M. (2001). Framework and specifi cations for PIRLS assessment 2001 (2nd ed.). Chestnut Hill, MA: Boston College.
Gonzalez, E.J. (2003). Scaling the PIRLS reading assessment data. In M. Martin, I. Mullis, & A. Kennedy (Eds.), PIRLS 2001 technical report (pp. 151-168). Chestnut Hill, MA: Boston College.
Martin, M.O., Mullis, I.V.S., & Kennedy, A.M. (Eds.) (2003). PIRLS 2001 technical report. Chest-nut Hill, MA: Boston College.
Mullis, I.V.S., Martin, M.O., Kennedy, A.M., & Flaherty, C.L. (Eds.). (2002). PIRLS 2001 encyclo-pedia: A reference guide to reading education in the countries participating in IEA’s Progress in International Reading Literacy Study (PIRLS). Chestnut Hill, MA: Boston College.
Mullis, I.V.S., Martin, M.O., Gonzalez, E.J., & Kennedy, A.M. (2003). PIRLS 2001 international report: IEA’s study of reading literacy achievement in primary schools in 35 countries. Chestnut Hill, MA: Boston College.
OECD Directorate for Education (2001). Knowledge and skills for life: First results from PISA 2000. Paris: Organization for Economic Co-Operation and Development.
Turner, R. (2002). Profi ciency scales construction. In R. Adams, & M. Wu (Eds.), PISA 2000 technical report (pp. 195-216). Paris: Organization for Economic Co-Operation and Devel-opment.
Wagemaker, H. (Ed.). (1996). Are girls better readers? Amsterdam: International Association for the Evaluation of Educational Achievement.


[31]
Acknowledgements
The design and development of PIRLS 2001 was achieved through the col-laborative efforts of individuals around the world. Staff from the national research centers in each participating country, members of advisory commit-tees, the International Association for the Evaluation for Educational Achieve-ment (IEA) Consortium, funding agencies, and the International Study Center (ISC) at Boston College worked together to develop and implement the PIRLS 2001 assessment. This appendix acknowledges individuals and organizations for their contributions. Given that the development and implementation of PIRLS 2001 spanned approximately four years and has involved so many people and organizations, this list may not include all who contributed. Any omission is inadvertent.
Funding Agencies
Funding for the development of PIRLS 2001 was provided by the National Center for Education Statistics of the U.S. Department of Education (NCES), The World Bank, and the participating countries. Each participating country was responsible for funding national project costs and implementing PIRLS in accordance with the international procedures.

[32] acknowledgements
Management and Operations
PIRLS 2001 was conducted under the auspices of the IEA. The study is directed by Ina V.S. Mullis and Michael O. Martin, and managed centrally by the staff of the International Study Center at Boston College, Lynch School of Education. The PIRLS International Study Center worked closely with orga-nizations that were responsible for particular aspects of the study, the PIRLS advisory committees, and representatives of the participating countries. In the IEA Secretariat, Hans Wagemaker was responsible for overseeing fundraising and country participation. Barbara Malak, also of the IEA Secretariat, was responsible for managing the ambitious translation verifi cation effort and for recruiting international quality control monitors. Statistics Canada worked with countries to ensure that the international sampling procedures were fol-lowed, adapted the international design to national conditions, documented the national samples, and computed sampling weights. The National Founda-tion for Educational Research in England and Wales had major responsibility for developing the reading test, including collecting reading passages, devel-oping items and scoring guides, and conducting scoring training. The IEA Data Processing Center was responsible for processing and verifying the data from the 35 countries, and for constructing the international database.

[33]acknowledgements
IEA SecretariatAlejandro Tiana, IEA Chair
Hans Wagemaker, Executive Director
Barbara Malak, Manager Membership Relations
Juriaan Hartenberg, Financial Manager
PIRLS and TIMSS InternationalStudy Center at Boston CollegeIna V.S. Mullis, Co-Director
Michael O. Martin, Co-Director
Eugenio J. Gonzalez,Director of Operations and Data Analysis
Ann Kennedy, PIRLS Project Coordinator
Cheryl Flaherty, PIRLS Research Associate
Steven J. Chrostowski,TIMSS Project Coordinator
Ebru Erberber, TIMSS Research Associate
Dana Diaconu, TIMSS Research Associate
Monica Guidi, TIMSS Research Assistant
Maria José Ramirez, Graduate Assistant
Alka Arora, Graduate Assistant
Joseph Galia, Statistician Programmer
Isaac Li, Statistician Programmer
Keith Morgan, Publications Manager
Mario Pita, Data Graphics Specialist
Betty Hugh, Data Graphics Specialist
Susan Messner, Data Graphics Specialist
Marcie Petras, Manager of Offi ce Administration
Christine Hoage, Manager, Finance
Rita Holmes, Administrative Coordinator
Laura Misas, Administrative Coordinator
IEA Data Processing CenterDirk Hastedt, Co-Director
Pierre Foy, Senior Researcher
Ursula Itzlinger, Senior Researcher
Juliane Barth, Research Assistant
Statistics CanadaMarc Joncas, Senior Methodologist
National Foundation for Educational Research in England and WalesChris Whetton, Assistant Director
Marian Sainsbury, Principal Research Offi cer
Educational Testing ServicesJay Campbell, PIRLS Reading Coordinator
Ed Kulick, Psychometric Scaling Consultant
Matthias von Davier,Psychometric Scaling Consultant
WestatKeith Rust, Sampling Referee
American Institutes for ResearchEugene Johnson, Psychometric Design Consultant
[30] acknowledgements
PIRLS 2001 Advisory Committees
The PIRLS 2001 Reading Development Group (RDG) contributed their invaluable expertise to developing and reviewing the framework and reading test. The RDG also worked with the PIRLS Reading Coordinator, NFER, and ISC staff members to develop the descriptions of achievement at international benchmarks. The PIRLS 2001 Questionnaire Development Group (QDG) helped develop the PIRLS questionnaires, including writing items and reviewing drafts of all questionnaires.
PIRLS 2001 Reading Development GroupMarilyn Binkley National Center for Education Statistics United States
Karl Blueml Vienna School Board Austria
Sue Horner Qualifi cations and Curriculum Authority England
Pirjo Linnakylä University of Jyväskylä Finland
Martine Rémond Institut National de la Recherche Péda-gogique France
William Tunmer Massey University New Zealand
Tan See Keen Ministry of Education Singapore
PIRLS 2001 Questionnaire Development Group Annette Lafontaine Université de Liège Belgium
Michael Marshall University of British Columbia Canada
Ivana Prochazkova Institute for Information on Education Czech Republic
Monica Rosén Göteborg University Sweden
Graham Ruddock National Foundation for Educational Researchin England and Wales England
Maurice Walker Ministry of Education New Zealand

[31]acknowledgements
National Research Coordinators The PIRLS 2001 National Research Coordina-tors (NRCs) were responsible for the crucial task of implementing the study in their countries. They participated in every aspect of the work to ensure that the study was of high quality.
Argentina
Lilia Toranzos Ministerio de Educación
Belize
Rosalind Bradley Denise RobateauBelize Teachers’ Training College
Bulgaria
Georgi BishkovFelyanka KaftandjievaUniversity of Sofi a
Canada
Francine JaquesRobert Deschênes Education Quality & Accountability Offi ce (EQAO)
Louis-Philippe Gaudreault Jean-Louis Lebel Ministère de l’Éducation
Michael Marshall University of British Columbia
Colombia
Martha Rocha Claudia Saenz Servicio Nacional de Pruebas
Cyprus
Mary KoutseliniConstantinos PapanastasiouUniversity of Cyprus
Czech Republic
Iveta KramplovaIvana Prochazkova Institute for Information on Education
England
Liz Twist National Foundation for EducationalResearch (NFER)
France
Marc Colmant Ministère de l’Éducation Nationale
Germany
Wilfried BosKnut SchwippertEva-Maria Lankes University of Hamburg
Greece
Georgia Kontogiannopoulou-PolydoridesCostas Basbas University of Athens
Hong Kong, SAR
Tse Shek-Kam The University of Hong Kong
Hungary
Péter Vari Emese Felvégi National Institute of Public Education Centre for Evaluation Studies
Iceland
Einar Gudmundsson University of Iceland
Islamic Republic of Iran
Abdol’azim Karimi Ministry of Education
[32] acknowledgements
Israel
Elite Olshtain Hebrew University
Ruth Zuzovsky Tel Aviv University
Italy
Gabriella Pavan de GregorioNational Institute for the Evaluationof the Educational System (CEDE)
Kuwait
Mansour Hussein Ministry of Education
Latvia
Ieva Johansone University of Latvia
Lithuania
Aiste Mackeviciute Ministry of Education and Science
Republic of Macedonia
Bojana Naceva Pedagogical Institute of Macedonia
Moldova
Ilie Nasu Ministry of Education & Science
Morocco
Abdellah Belachkar Ministère de L’Education Nationale
The Netherlands
Mieke Van Diepen University of Nijmegen
New Zealand
Megan ChamberlainMaurice Walker Ministry of Education
Norway
Finn Egil Tønnessen Ragnar Gees Solheim Stavanger College
Romania
Gabriela Noveanu Institute for Educational Sciences
Russian Federation
Galina Kovalyova Institute of General Secondary Education
Scotland
Liz Levy Brian Semple Scottish Offi ce Education and Industry Department
Singapore
Siow-Chin Ng Ministry of Education
Slovak Republic
Zuzana Lukacková SPU-National Institute for Education
Slovenia
Marjeta Doupona-Horvat Center for IEA Studies Educational Research Institute
Sweden
Monica Rosén Göteborg University
Turkey
Yurdanur Atlioglu Educational Research and DevelopmentDirectorate (ERDD)
United States of America
Laurence Ogle Dawn Nelson National Center for Education Statistics (NCES)
Related Documents