Pipeline Technology Conference 2017, May 2-4, Berlin SIZING CRACK INDICATIONS FROM ULTRASONIC ILI: CHALLENGES AND OPTIONS Herbert Willems, Gerhard Kopp, Victor Haro NDT Global, Stutensee, Germany ABSTRACT Ultrasonic in-line inspection (ILI) tools for crack inspection using piezoelectric transducers are commercially available for more than two decades. These tools have proven very successful for the detection of various types of cracks or crack-like anomalies present in many pipelines worldwide. While the probability of detection (POD) of these tools is considered to be generally sufficient, the sizing of crack indications has some inherent limitations related to the inspection technology. The inspection itself is performed by using 45° shear waves in the pulse-echo mode and recording the reflections obtained from cracks or crack-like reflectors. In particular, the depth sizing of cracks is thus primarily based on the measurement of signal amplitudes. The signal amplitude, however, depends not only on the crack depth but also on additional parameters that need to be taken into account. Furthermore, the amplitude of the corner reflection is saturated for crack depths above a certain, probe dependent value that limits the sizing capabilities especially for thicker pipe wall. The objective of the paper is to explain to the users of ultrasonic ILI, on a physical basis, the potential and limits of crack sizing when using amplitude based crack inspection technologies. In order to do so, the principle of the inspection technology and the procedures used for length and depth sizing are explained in detail. The influence of a variety of variables (crack depth, inspection angle, tilt angle, skew angle etc.) on the reflection signal is examined by using experimental results as well as modelling results. Options that have potential to improve depth sizing for ultrasonic ILI are discussed. 1 INTRODUCTION The assessment of a pipeline's integrity in terms of safe operation pressure relies on the availability of precise input data on any pressure reducing anomalies in the pipeline (e.g. metal loss or cracking). This information is usually obtained from in-line inspection by using appropriate inspection tools for the given inspection task. In order to stay on the safe side the tolerances of defect sizing (length, depth) need to be taken into account for the calculation of the safe operation pressure. These tolerances are generally specified in the performance specification of the applied tool according to accepted industry standards [1]. Performance specifications are usually based on the results of pull tests (or loop tests) using a sufficiently high number of artificial defects. Artificial defects like e.g. crack-like defects can be manufactured very precisely e.g. by means of spark eroding. Thus, a large number of well-defined defects can be introduced into a test pipeline in order to ensure that the performance specification is statistically validated. The question may be posed whether the specified sizing tolerances as based on artificial defects apply one-to-one to natural defects. One option for addressing the issue is the use of test pipelines with natural defects, which is however very difficult to achieve in order to ensure statistically valid results. Another

Welcome message from author
This document is posted to help you gain knowledge. Please leave a comment to let me know what you think about it! Share it to your friends and learn new things together.
Transcript
Pipeline Technology Conference 2017, May 2-4, Berlin
SIZING CRACK INDICATIONS FROM ULTRASONIC ILI: CHALLENGES AND OPTIONS
Herbert Willems, Gerhard Kopp, Victor Haro NDT Global, Stutensee, Germany
ABSTRACT Ultrasonic in-line inspection (ILI) tools for crack inspection using piezoelectric
transducers are commercially available for more than two decades. These tools have proven very successful for the detection of various types of cracks or crack-like anomalies present in many pipelines worldwide. While the probability of detection (POD) of these tools is considered to be generally sufficient, the sizing of crack indications has some inherent limitations related to the inspection technology. The inspection itself is performed by using 45° shear waves in the pulse-echo mode and recording the reflections obtained from cracks or crack-like reflectors. In particular, the depth sizing of cracks is thus primarily based on the measurement of signal amplitudes. The signal amplitude, however, depends not only on the crack depth but also on additional parameters that need to be taken into account. Furthermore, the amplitude of the corner reflection is saturated for crack depths above a certain, probe dependent value that limits the sizing capabilities especially for thicker pipe wall.
The objective of the paper is to explain to the users of ultrasonic ILI, on a physical
basis, the potential and limits of crack sizing when using amplitude based crack inspection technologies. In order to do so, the principle of the inspection technology and the procedures used for length and depth sizing are explained in detail. The influence of a variety of variables (crack depth, inspection angle, tilt angle, skew angle etc.) on the reflection signal is examined by using experimental results as well as modelling results. Options that have potential to improve depth sizing for ultrasonic ILI are discussed.
1 INTRODUCTION
The assessment of a pipeline's integrity in terms of safe operation pressure relies on the availability of precise input data on any pressure reducing anomalies in the pipeline (e.g. metal loss or cracking). This information is usually obtained from in-line inspection by using appropriate inspection tools for the given inspection task. In order to stay on the safe side the tolerances of defect sizing (length, depth) need to be taken into account for the calculation of the safe operation pressure. These tolerances are generally specified in the performance specification of the applied tool according to accepted industry standards [1]. Performance specifications are usually based on the results of pull tests (or loop tests) using a sufficiently high number of artificial defects. Artificial defects like e.g. crack-like defects can be manufactured very precisely e.g. by means of spark eroding. Thus, a large number of well-defined defects can be introduced into a test pipeline in order to ensure that the performance specification is statistically validated. The question may be posed whether the specified sizing tolerances as based on artificial defects apply one-to-one to natural defects. One option for addressing the issue is the use of test pipelines with natural defects, which is however very difficult to achieve in order to ensure statistically valid results. Another
Pipeline Technology Conference 2017, May 2-4, Berlin
option is based on the comparison of results from field verifications with ILI results. This approach was used in a recent study where a large amount of field data from different operators and the corresponding ILI data from several vendors were evaluated [2]. The overall results show that out-of-spec deviations between predicted and verified sizes (length, depth) are not unusual and some explanations are given to clarify the reasons.
In this paper, we want to address the same question in a detailed manner. Based on the understanding of the underlying measuring technique we explain potential error sources regarding the length and depth sizing of crack-like anomalies. The results presented in the following should be helpful to understand the causes of sizing differences and errors on a technical level. We will also discuss some promising directions towards improved depth sizing as based on experimental results and backed-up by modelling calculations.
2 PRINCIPLE OF INLINE CRACK INSPECTION USING SHEAR WAVES
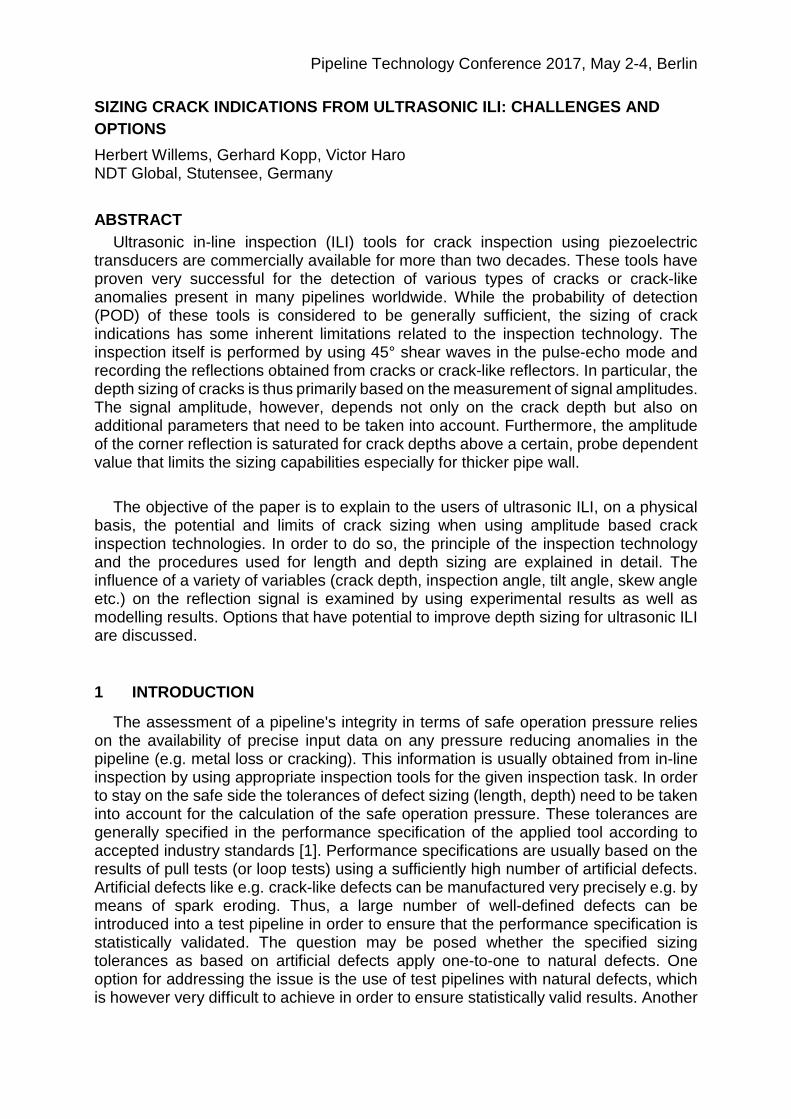
The inspection principle used for ultrasonic crack detection in pipelines is based on the well-established 45° shear wave method as illustrated in Fig. 1 [3].
Figure 1: Inspection geometry and A-scan signal (schematic)
An ultrasonic pulse (center frequency ≈ 4 MHz) is transmitted from the sensor through the liquid coupling medium into the pipe wall. The angle of incidence is selected such that a refracted shear wave is obtained propagating through the wall at an angle of approx. 45°. Using water as coupling medium, the angle of incidence is then approx. 18°. If the pulse hits a radial crack a strong reflection is obtained (corner reflection) that is received by the same sensor in the pulse-echo mode. Depending on the time-of-flight of the crack signal relative to the surface signal one can readily determine whether the crack is internal or external. Fig. 1 shows the situation where the transmitted pulse is already reflected at the internal pipe surface while the refracted shear wave is close to hitting the external crack. The received signal is displayed as an A-scan showing the measured reflection amplitudes as a function of time-of-flight (Fig. 1).

Pipeline Technology Conference 2017, May 2-4, Berlin
2.1 Inspection Angle
The amplitude of the crack signal depends on the propagation angle of the refracted shear wave. The path of the reflected signal includes the refraction from the liquid medium into the wall and vice versa as well as the reflection at the backwall and the reflection at the crack. This sound path is depicted in Fig. 2a together with the result of the calculated reflection amplitude for a (deep) crack as a function of the refraction angle β (Fig. 2b). The calculation is based on the plane wave approximation using formulas given in [3]. Fig. 2b also shows the result of modelling using the finite difference (FD) method. The agreement between both calculations is quite good. Some deviations become noticeable for refraction angles above 60° where the plane wave assumption is limited due to the finite wall thickness.
a) Inspection geometry
α – angle of incidence in water
β – refraction angle in steel
b) Angular dependency of reflection signal
Figure 2: a) Sound path of crack signal b) calculated signal amplitude as a function of refraction angle β for shear wave in steel (blue line: plane wave calculation; red dots: modelling using the finite difference (FD) method)
From Fig. 2b, we can conclude that the inspection provides a rather homogeneous
crack response within an angular range from approx. 38° to 55°. The strong drop of the reflection amplitude around 30° and 60° is caused by the mode conversion from shear wave to longitudinal wave taking place at β ≈ 30° at the backwall and around β ≈ 60° (= 90° - 30°) at the crack side. Inspection angles outside the highlighted angle range in Fig. 2b (green area) have to be avoided. At the upper side of the diagram shown in Fig. 2b the angle of incidence is indicated as calculated from the law of refraction for water with a velocity of 1.45 mm/µs. In this case, the angle of incidence should be between 17° and 20° to ensure a proper inspection angle around 45°. Assuming an angle of incidence of 17° and a refraction angle within 40° to 50°, an ultrasonic velocity range from approx. 1.24 mm/µs to 1.47 mm/µs is obtained, which covers the velocity of most crude oils (the typical velocity in crude oil is around 1.34 mm/µs resulting in a refraction angle of 45° at 17° incidence). If the velocity of the medium to be inspected is outside the described range, the angle of incidence needs to be modified accordingly. In practice, this means that a new sensor carrier has to be constructed.
Pipeline Technology Conference 2017, May 2-4, Berlin
2.2 Sensitivity
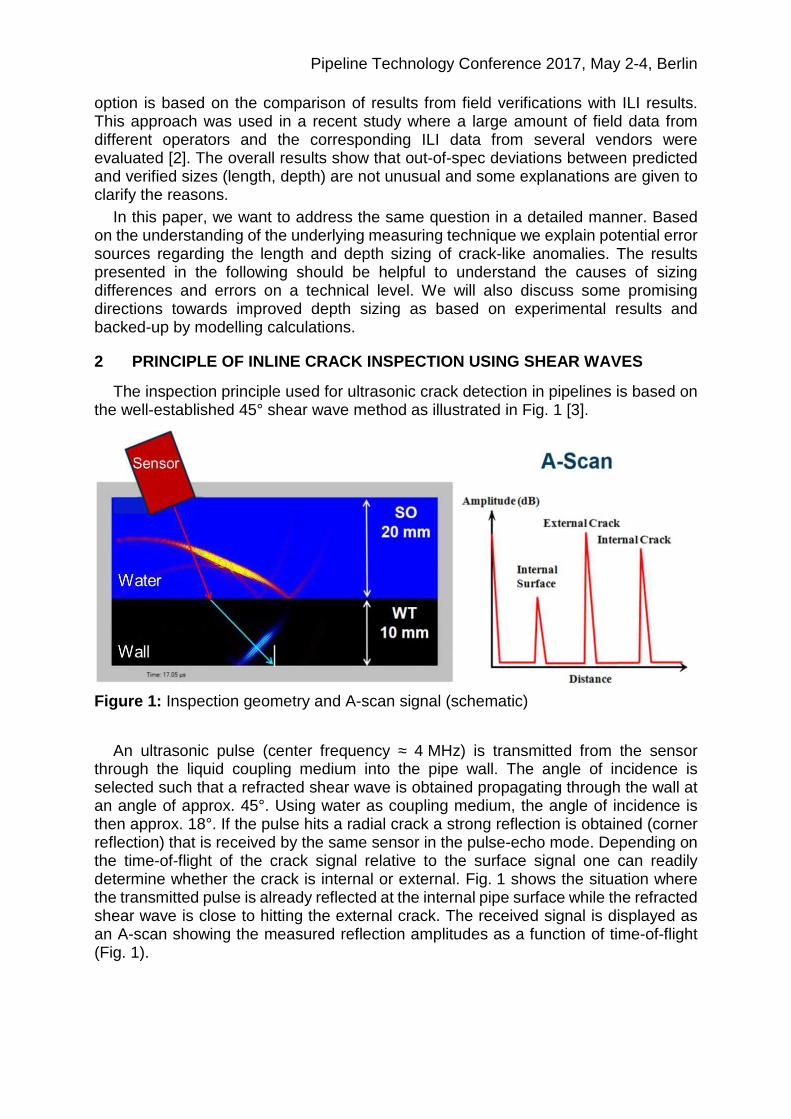
The first objective of in-line crack inspection is the reliable detection of crack-like features where the main focus is on radial, surface-breaking cracks. Regarding crack depth, ILI vendors typically specify a detection limit of 1 mm at a probability of detection (POD) of 90%. The required inspection sensitivity is provided by high gain ultrasonic electronics in combination with appropriate ultrasonic transducers. A typical sensitivity range of ultrasonic crack signals is explained in Fig. 3 where a reflection signal (corner reflection) from a crack is displayed at a logarithmic scale. A reflection amplitude of about 60 dB is assumed in this example corresponding to a "deeper" crack. For a crack depth of 1 mm, an amplitude drop of approx. 14 dB has to be considered (see section 3.2). In addition, we assume a noise level of 10 dB (background noise) and a minimum signal-to-noise ratio of 10 dB for the detection of crack-like indications. As a result, a remaining gain reserve of approx. 26 dB (corresponding to a factor of 20) is typically available in order to account for unfavorable conditions that may result in reduction of the signal amplitude. In section 3.2, we will address several examples of practical relevance that may cause amplitude decrease.
Figure 3: Crack indication and typical signal range for in-line crack inspection
3 SIZING OF CRACK INDICATIONS
The sizing of crack indications basically comprises the measurement of the length and the (maximum) depth of cracks. This activity is part of the data analysis process usually performed after an in-line inspection. The results are documented in a feature list, which is part of the inspection report. Based on these results, field verification work takes place in order to repair or replace any pipe joints containing severe defects. The field verification of the defects is carried out by means of standard non-destructive technologies (mainly ultrasonic methods and for external cracks magnetic particle inspection (MPI) or dye penetrant). Furthermore, field verification can be applied in order to check the performance of ILI tools [2]. It is not unusual that the data from field verification differ from the ILI data outside of the specification. In the following sections, we show that such differences can be explained quite often by a better understanding of ultrasonic inspection details and the underlying measuring process.

Pipeline Technology Conference 2017, May 2-4, Berlin
3.1 Length Sizing
The length sizing of crack-like indications in the field is usually performed by MPI, which provides a (for practical purposes) exact measurement of the surface length of external cracks down to depths of about a tenth of a millimeter. The ultrasonic measurement of crack length is based on the recorded reflection signals from the crack. In the following, we start with a description of the length sizing of artificial cracks as such cracks are usually used for establishing the sizing tolerance of ILI tools.
3.1.1 Artificial Cracks
Artificial crack-like defects (notches) generally have a well-defined geometry such as e.g. rectangular shape or semi-elliptical shape. The width of EDM notches is typically 0.5 mm (EDM - Electrical Discharge Machining). Examples of the depth profile of such notches are shown in Fig. 3.a. During axial crack inspection, the ultrasonic probes are moving along the crack and the reflection signals are recorded. The calculated signal amplitudes as obtained with a transducer diameter of 15 mm are depicted in Fig. 3b. When the center of the ultrasonic beam hits the start or the end of the rectangular crack the amplitude drop is exactly 6 dB (factor of two). By measuring the length of this crack at a sensitivity level of -6 dB, we obtain the exact length while the length of the elliptical crack would be slightly undersized at the same sensitivity level. Since the actual sensitivity level is however much lower (e.g. -18 dB) the measured length of the indication at that level is slightly larger than the surface length. Thus, we expect some oversizing for crack-like defects with "steep" ends. The deviation from the correct length is, however, within the specified tolerance of ± 10 mm.
a) Depth profile of artificial cracks with a surface length of 40 mm
b) Amplitude profile
Figure 3: a) Depth profile of artificial cracks b) Corresponding ultrasonic amplitude profiles when scanning along the crack; the highlighted areas indicate the approximate sensitivity level for recording crack-like indications.
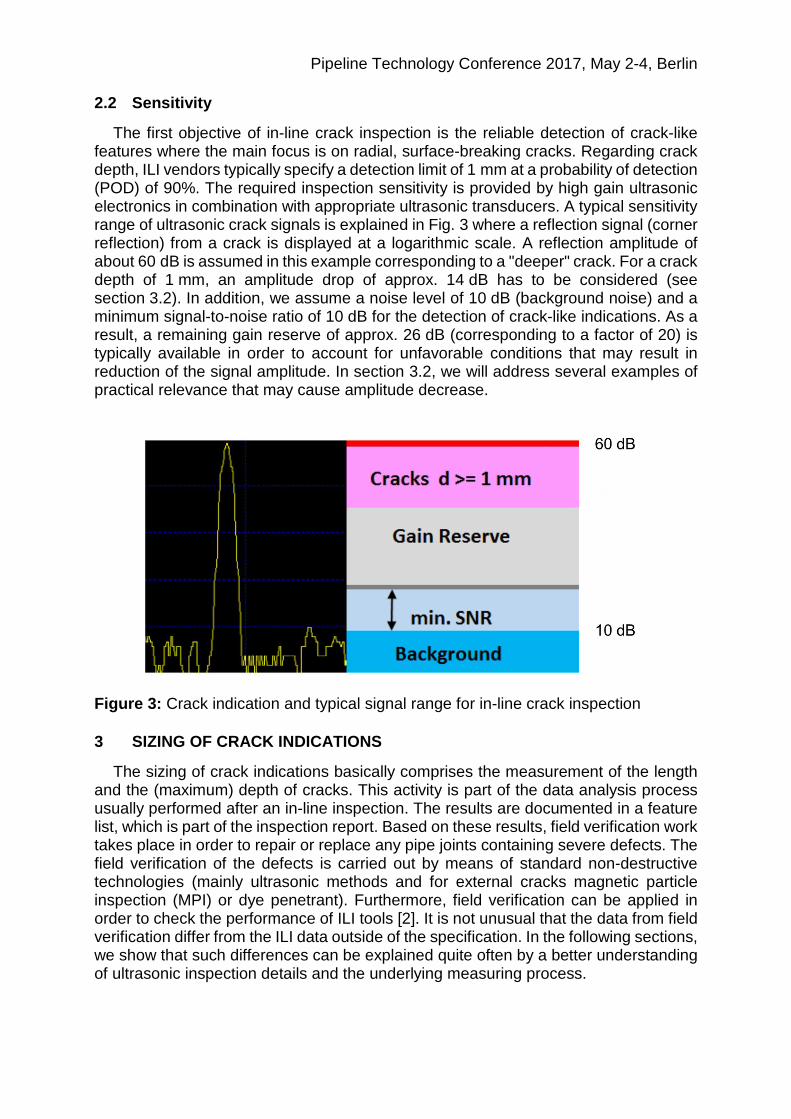
Fig. 4 shows examples of C-scans obtained from test spools with artificial cracks. The crack-like indications are boxed automatically and, if necessary, adjusted manually during data analysis. The length of the boxes represents the crack length in case of single cracks. As can be noticed, these indications are very well defined with regard to their length.
Pipeline Technology Conference 2017, May 2-4, Berlin
a) C-scan showing test spool with 67 EDM notches
b) C-scan showing group of 9 defects
Figure 4: C-scans showing artificial crack-like defects to demonstrate the precision of length sizing. Here, the axial resolution is 3 mm.
3.1.2 Cracks with shallow ends
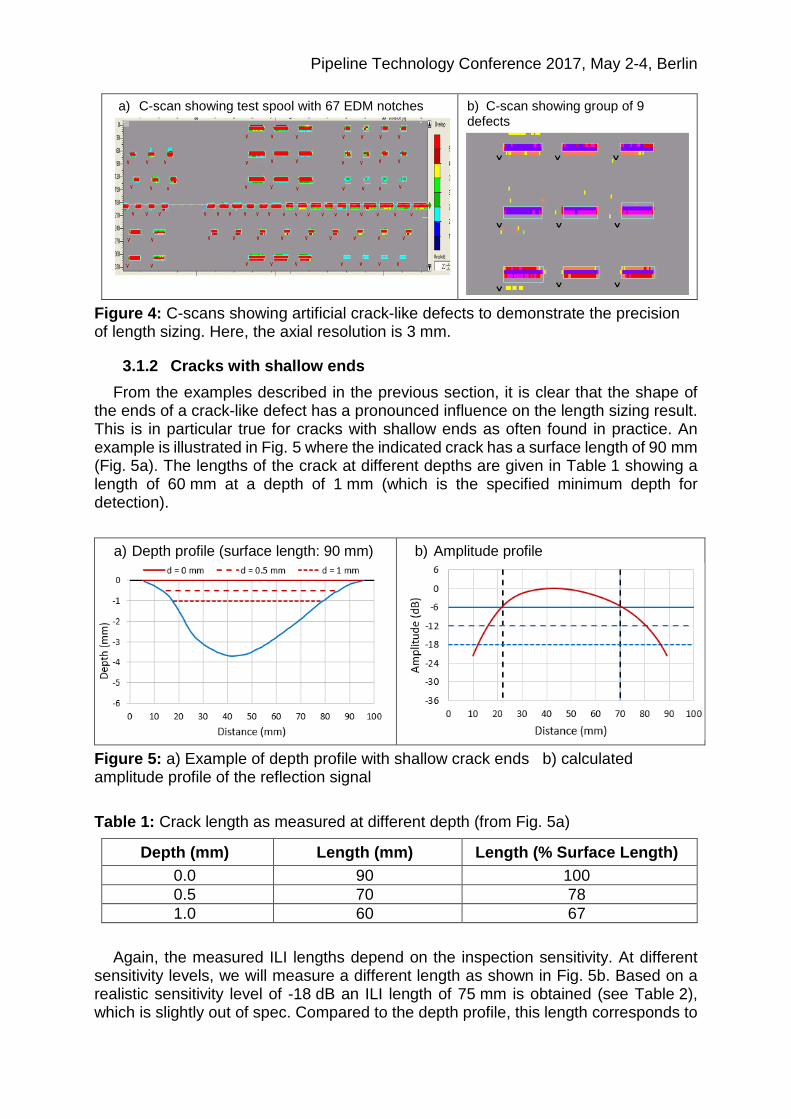
From the examples described in the previous section, it is clear that the shape of the ends of a crack-like defect has a pronounced influence on the length sizing result. This is in particular true for cracks with shallow ends as often found in practice. An example is illustrated in Fig. 5 where the indicated crack has a surface length of 90 mm (Fig. 5a). The lengths of the crack at different depths are given in Table 1 showing a length of 60 mm at a depth of 1 mm (which is the specified minimum depth for detection).
a) Depth profile (surface length: 90 mm)
b) Amplitude profile
Figure 5: a) Example of depth profile with shallow crack ends b) calculated amplitude profile of the reflection signal
Table 1: Crack length as measured at different depth (from Fig. 5a)
Depth (mm) Length (mm) Length (% Surface Length) 0.0 90 100 0.5 70 78 1.0 60 67
Again, the measured ILI lengths depend on the inspection sensitivity. At different sensitivity levels, we will measure a different length as shown in Fig. 5b. Based on a realistic sensitivity level of -18 dB an ILI length of 75 mm is obtained (see Table 2), which is slightly out of spec. Compared to the depth profile, this length corresponds to
Pipeline Technology Conference 2017, May 2-4, Berlin
the crack length measured at a depth of approx. 0.5 mm. In summary, we can state that the length of cracks with shallow ends where the depth is less than approx. 0.5 mm will be undersized. Similar findings were reported in a PRCI study on the performance verification of ultrasonic ILI taking into account a large number of field verifications [2].
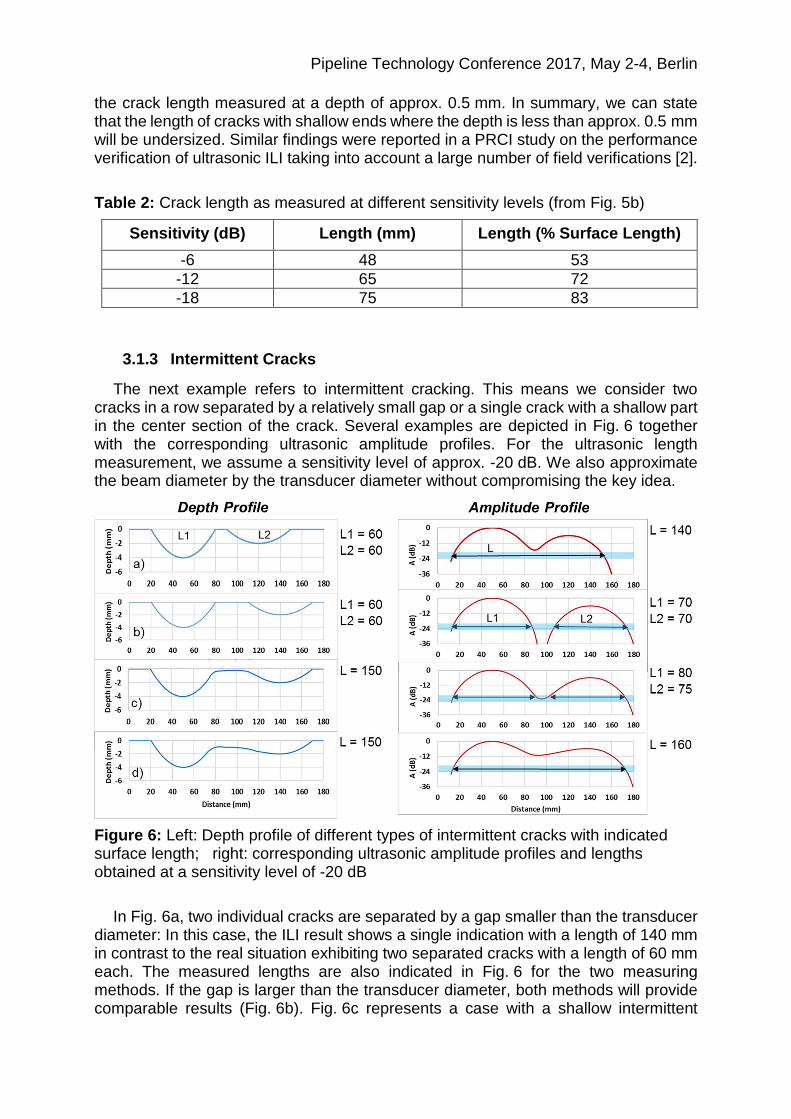
Table 2: Crack length as measured at different sensitivity levels (from Fig. 5b)
Sensitivity (dB) Length (mm) Length (% Surface Length)
-6 48 53 -12 65 72 -18 75 83
3.1.3 Intermittent Cracks
The next example refers to intermittent cracking. This means we consider two cracks in a row separated by a relatively small gap or a single crack with a shallow part in the center section of the crack. Several examples are depicted in Fig. 6 together with the corresponding ultrasonic amplitude profiles. For the ultrasonic length measurement, we assume a sensitivity level of approx. -20 dB. We also approximate the beam diameter by the transducer diameter without compromising the key idea.
Figure 6: Left: Depth profile of different types of intermittent cracks with indicated surface length; right: corresponding ultrasonic amplitude profiles and lengths obtained at a sensitivity level of -20 dB
In Fig. 6a, two individual cracks are separated by a gap smaller than the transducer
diameter: In this case, the ILI result shows a single indication with a length of 140 mm in contrast to the real situation exhibiting two separated cracks with a length of 60 mm each. The measured lengths are also indicated in Fig. 6 for the two measuring methods. If the gap is larger than the transducer diameter, both methods will provide comparable results (Fig. 6b). Fig. 6c represents a case with a shallow intermittent
Pipeline Technology Conference 2017, May 2-4, Berlin
section. Here, the ILI result will probably show two separate indications as the depth of the intermittent section is below the sensitivity level of the ultrasonic measurement. If we increase the depth of the intermittent section above the sensitivity level (Fig. 6d), the ILI result will show one indication with the length being within the specified tolerance.
If we compare the MPI results with the ILI results, we notice some considerable differences in the length results for the examples shown in Fig. 6a and Fig. 6c. During a field verification, such discrepancies might cause some confusion. Their explanation, however, in terms of the inspection sensitivity is quite straightforward.
3.2 Depth Sizing
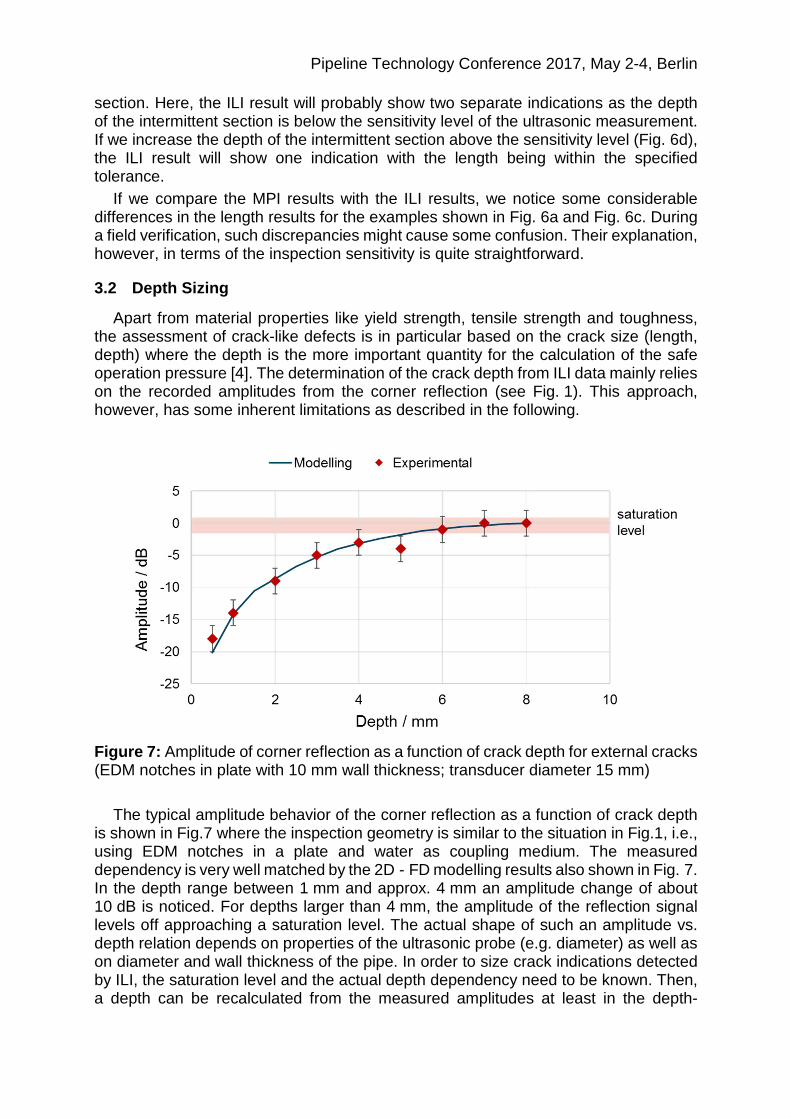
Apart from material properties like yield strength, tensile strength and toughness, the assessment of crack-like defects is in particular based on the crack size (length, depth) where the depth is the more important quantity for the calculation of the safe operation pressure [4]. The determination of the crack depth from ILI data mainly relies on the recorded amplitudes from the corner reflection (see Fig. 1). This approach, however, has some inherent limitations as described in the following.
Figure 7: Amplitude of corner reflection as a function of crack depth for external cracks (EDM notches in plate with 10 mm wall thickness; transducer diameter 15 mm)
The typical amplitude behavior of the corner reflection as a function of crack depth is shown in Fig.7 where the inspection geometry is similar to the situation in Fig.1, i.e., using EDM notches in a plate and water as coupling medium. The measured dependency is very well matched by the 2D - FD modelling results also shown in Fig. 7. In the depth range between 1 mm and approx. 4 mm an amplitude change of about 10 dB is noticed. For depths larger than 4 mm, the amplitude of the reflection signal levels off approaching a saturation level. The actual shape of such an amplitude vs. depth relation depends on properties of the ultrasonic probe (e.g. diameter) as well as on diameter and wall thickness of the pipe. In order to size crack indications detected by ILI, the saturation level and the actual depth dependency need to be known. Then, a depth can be recalculated from the measured amplitudes at least in the depth-

Pipeline Technology Conference 2017, May 2-4, Berlin
sensitive range below 4 mm. It should be mentioned that a crack-like reflector is usually picked up by several sensors from either inspection side during a crack inspection run. By using the amplitude information available from all the contributing sensors, the depth estimation can be refined to some extent.
The question arises what happens with the signal amplitude when we change the situation from an ideal crack-like reflector like an EDM notch to a real crack which might have a more irregular shape as well as deviations from the ideal geometry (e.g. tilt angle or skew angle). Some of these issues are addressed in the next sections.
3.2.1 Influence of tilt angle
The definition of tilt angle and skew angle is illustrated in Fig.8. The tilt angle describes the deviation from the radial direction while the skew angle is defined by the deviation from the axial direction (in case of axial cracks). Tilted crack-like defects may occur in pipelines in particular in connection with submerged arc welded pipe e.g. along the tilted fusion zone.
a) Radial crack
b) Radial crack + tilt + skew
Figure 8: Explanation of tilt angle and skew angle
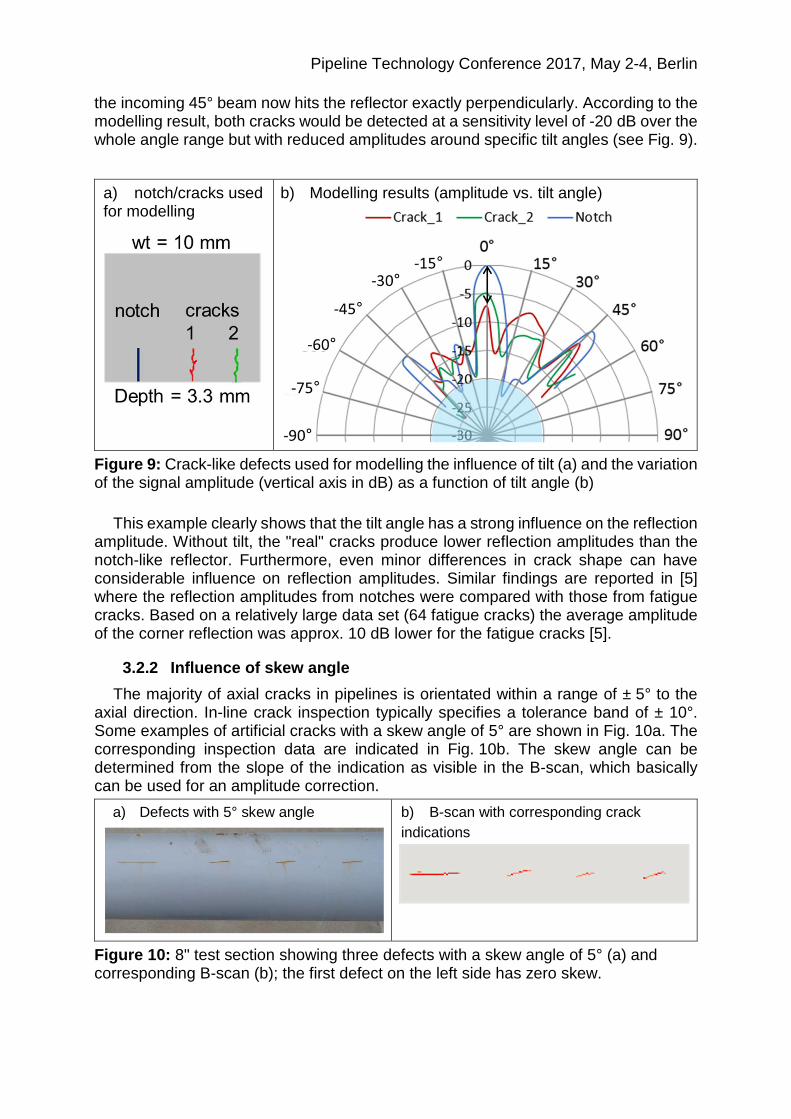
In order to examine the influence of the tilt angle, we have used 2D-FD modelling. The tilt angle was varied from -55° to +55° in steps of 5° and the amplitude of the corner reflection was determined from the resulting A-scans. Here, positive angles indicate a tilting away from the ultrasonic probe. Three complete angular scans were performed using three different external reflectors with the same depth of 3.3 mm in a plate with 10 mm wall thickness (see Fig. 9a):
• Reflector 1: notch • Reflector 2: crack 1 based on a real radial crack with branching • Reflector 3: crack 2: same as crack 1 without branching
The results using 45° shear wave inspection are depicted in the polar diagram
shown in Fig. 9b. As expected, the highest amplitude is obtained at zero tilt for all the three reflectors. Compared to the notch being an ideal reflector both cracks produce lower amplitudes due to the irregular deviations from the radial orientation. The amplitude drop is approx. 7 dB for crack 1 (with branching) and 5 dB for crack 2 (without branching). For negative tilt, the signal level is quite low (around -10 dB to - 20 dB) for all reflectors over the entire angle range. For positive tilt, some amplitude drop is noticed at even small angles, followed by a range showing large differences between notch and cracks. A second peak shows up at 45° for all reflectors because
Pipeline Technology Conference 2017, May 2-4, Berlin
the incoming 45° beam now hits the reflector exactly perpendicularly. According to the modelling result, both cracks would be detected at a sensitivity level of -20 dB over the whole angle range but with reduced amplitudes around specific tilt angles (see Fig. 9).
a) notch/cracks used for modelling
b) Modelling results (amplitude vs. tilt angle)
Figure 9: Crack-like defects used for modelling the influence of tilt (a) and the variation of the signal amplitude (vertical axis in dB) as a function of tilt angle (b)
This example clearly shows that the tilt angle has a strong influence on the reflection
amplitude. Without tilt, the "real" cracks produce lower reflection amplitudes than the notch-like reflector. Furthermore, even minor differences in crack shape can have considerable influence on reflection amplitudes. Similar findings are reported in [5] where the reflection amplitudes from notches were compared with those from fatigue cracks. Based on a relatively large data set (64 fatigue cracks) the average amplitude of the corner reflection was approx. 10 dB lower for the fatigue cracks [5].
3.2.2 Influence of skew angle
The majority of axial cracks in pipelines is orientated within a range of ± 5° to the axial direction. In-line crack inspection typically specifies a tolerance band of ± 10°. Some examples of artificial cracks with a skew angle of 5° are shown in Fig. 10a. The corresponding inspection data are indicated in Fig. 10b. The skew angle can be determined from the slope of the indication as visible in the B-scan, which basically can be used for an amplitude correction.
a) Defects with 5° skew angle
b) B-scan with corresponding crack indications
Figure 10: 8" test section showing three defects with a skew angle of 5° (a) and corresponding B-scan (b); the first defect on the left side has zero skew.

Pipeline Technology Conference 2017, May 2-4, Berlin
For this investigation, the modelling was conducted with the CIVA software [6] covering an angle range from 0° to 12° with steps of 2°. In this case, 3D modelling is required as the skew angle causes an asymmetric geometry preventing the use of 2D modelling. The result for the amplitude of the corner reflection for a 3 mm deep reflector is shown in Fig. 11 together with measuring results from a test spool with 8-inch diameter. The modelling predicts somewhat larger amplitude drops with increasing skew angle as compared to the measurement. However, regarding the scatter in the measuring data of approx. ± 3 dB resulting from a larger set of defects the agreement is considered to be quite reasonable. Based on a sensitivity level of - 20 dB, the detection up to a skew angle of 10° is ensured in accordance with experience. It is also important to note that a notch-like reflector represents the worst case for the skew effect, as the directivity pattern of real cracks is usually much wider causing some back reflections towards the ultrasonic probe even at larger skew angles.
Figure 11: Amplitude of corner reflection vs. skew angle as obtained for an 8"- pipe (wt = 6.5 mm); a sensitivity level of approx. -20 dB is highlighted.
3.2.3 Influence of pressure & temperature
The ultrasonic velocity in liquids generally depend on the actual pressure P and especially on the temperature T. During an inspection run, P and T of the pipeline medium can change more or less thus causing a change of the ultrasonic velocity. As a result, the refraction angle in the pipe wall and in turn the reflection amplitude will change accordingly (see Fig. 2). Since the velocity as well as P&T are continuously recorded during an inspection run, the effect on the saturation amplitude is taken into account if necessary [7]. Fortunately, this influence is rather small for media like water or crude oil, and it can be neglected for most inspections.
3.2.4 Other Influences
Due to space limitations, we cannot present a detailed description of further factors that play a role in this context. Examples of these are:
• Variation of the manufacturing related sensor sensitivity • Amplitude dependency on the distance between sensor and reflector (only
for axial crack inspection) • Cracks interacting with other anomalies (e.g. dents)
Pipeline Technology Conference 2017, May 2-4, Berlin
4 OPTIONS FOR IMPROVING DEPTH SIZING
In the previous section, we have demonstrated how the amplitude of the corner reflection is affected by several characteristics of crack-like reflectors. When analyzing crack data from ILI, some of the considered characteristics (e.g. true crack shape, tilt angle) are not accessible, i.e., they cannot be taken into account for depth sizing. Therefore, one may expect some undersizing for certain situations, if the depth sizing is solely based on the corner reflection. The main disadvantage of using the amplitude of the corner reflection for depth sizing is, however, its insensitivity to deeper cracks because of the saturation effect (see Fig. 7). As the deeper cracks are most relevant for safe pipeline operation, it is of utmost importance that such cracks shall be detected with highest priority by in-line crack inspection. One of the characteristics of ultrasonic PE-inspection that is in particular sensitive to deeper cracks is related to the reflection taking place via the wall side opposite to the crack. In contrast to the direct corner reflection, we refer to this echo in the following by the acronym ICE (indirect crack echo).
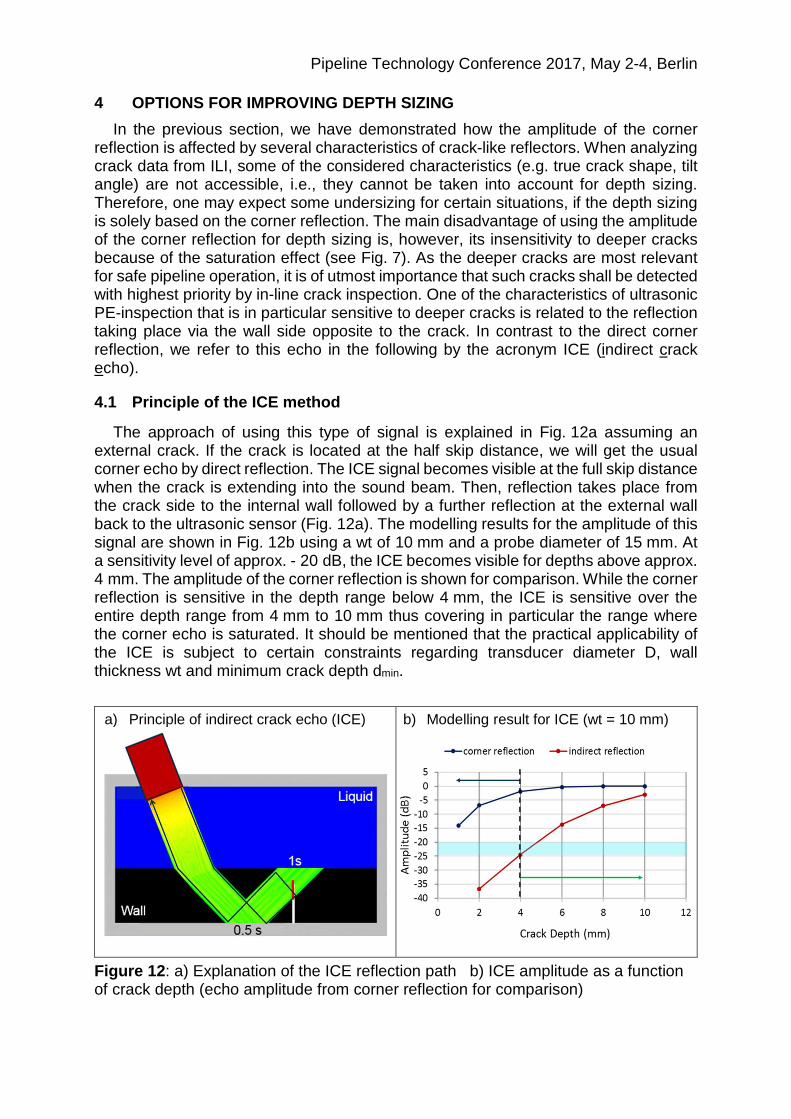
4.1 Principle of the ICE method
The approach of using this type of signal is explained in Fig. 12a assuming an external crack. If the crack is located at the half skip distance, we will get the usual corner echo by direct reflection. The ICE signal becomes visible at the full skip distance when the crack is extending into the sound beam. Then, reflection takes place from the crack side to the internal wall followed by a further reflection at the external wall back to the ultrasonic sensor (Fig. 12a). The modelling results for the amplitude of this signal are shown in Fig. 12b using a wt of 10 mm and a probe diameter of 15 mm. At a sensitivity level of approx. - 20 dB, the ICE becomes visible for depths above approx. 4 mm. The amplitude of the corner reflection is shown for comparison. While the corner reflection is sensitive in the depth range below 4 mm, the ICE is sensitive over the entire depth range from 4 mm to 10 mm thus covering in particular the range where the corner echo is saturated. It should be mentioned that the practical applicability of the ICE is subject to certain constraints regarding transducer diameter D, wall thickness wt and minimum crack depth dmin.
a) Principle of indirect crack echo (ICE)
b) Modelling result for ICE (wt = 10 mm)
Figure 12: a) Explanation of the ICE reflection path b) ICE amplitude as a function of crack depth (echo amplitude from corner reflection for comparison)

Pipeline Technology Conference 2017, May 2-4, Berlin
For inspection of components with thicker wall the so-called tandem method using separate transmitter and receiver probes at an appropriate distance is often applied in ultrasonic testing to pick up ICE signals e.g. from embedded defects that otherwise would be missed by the PE inspection because of geometrical reasons [8].
4.2 Depth sizing of axial cracks using ICE
In order to reliably pick up the ICE signal during axial crack inspection a high circumferential resolution, i.e. sensor distance in circumferential direction, is required. The circumferential resolution of approx. 10 mm of standard crack tools is usually not optimal for this purpose. With the availability of latest high-resolution UCx tools offering a circumferential resolution of approx. 5 mm, the challenge of improving depth sizing for axial crack inspection can be readdressed.
Figure 13: ICE amplitude as a function of remaining wt for different pipe diameters and different wall thicknesses (test results from external EDM notches)
Extensive experimental testing supported by comprehensive modelling
calculations was conducted to check the suitability of this approach. Fig. 13 summarizes results from some pull tests as obtained for different pipe diameters and different wall thicknesses showing the ICE amplitude as a function of the remaining wall thickness. Obviously, a significant relationship can be noticed for all the investigated test conditions. The ICE information can be considered as being complimentary to the information gained from the corner reflection. A combination of both quantities provides an important step forward with regard to improved depth sizing and extended depth range.

Pipeline Technology Conference 2017, May 2-4, Berlin
4.3 Depth sizing of circumferential cracks using ICE
The ICE method is in particular appropriate for circumferential crack inspection where the ultrasonic probe is moving at high axial resolution (e.g. 1 mm shot distance) across a circumferential crack. First ILI results showing the potential of this approach for circumferential crack inspection were reported in [9] where the ICE signal was used to identify deeper cracks.
The ICE amplitude as determined from FD modelling is depicted in Fig. 14a as a function of the crack depth. A nearly homogenous sensitivity of the amplitude can be noticed over the whole depth range above 20% wt. ILI results obtained from a test pipeline containing a large set of fatigue cracks [5] are also presented in Fig. 14a showing a good agreement with the modelling results. Based on a set of 64 fatigue cracks, all cracks with a depth > 30 % wt exhibited the ICE signal with not a single miss. In the two B-scan examples indicated in Fig. 14b, the ICE amplitude from a 62% deep crack is about 6 dB below the corner reflection while there is no indication visible from the 22% crack. Due to the high axial resolution, the maximum amplitude of the ICE signal is recorded very precisely as can be seen from the amplitude dynamics in Fig. 14b.
a) Inspection data & modelling results
b) Inspection examples
Figure 14: a) Inspection data & modelling results showing the ICE amplitude as a function of crack depth; b) amplitude dynamics (top) and B-scans as obtained from fatigue cracks (bottom) when scanning across the cracks; note the ICE indication from the deeper crack at the full skip position.
5 CONCLUSIONS
From the presented results on the sizing of crack-like indications as provided by in-line inspection using the PE technique, the following conclusions can be drawn:
Length sizing. The length sizing of ultrasonic crack indications depends on the sensitivity level used for the recording. This length is usually not directly comparable with the surface length measured e.g. by MPI. In case of cracks with "steep ends", an agreement within the specified tolerance is expected while cracks with shallow ends (depth smaller than approx. 0.5 mm) will be undersized as this depth range is usually

Pipeline Technology Conference 2017, May 2-4, Berlin
below the sensitivity level. Due to the same reason, intermittent cracks can be either undersized or oversized depending on gap length or on the depth of shallow sections.
Depth sizing. The amplitude of ultrasonic indications from crack-like reflectors depends on various factors. Compared to smooth crack surfaces (e.g. EDM notches) irregular surfaces will result in reduced amplitudes, which may cause undersizing. This is also true for tilted cracks, where the dependency of the amplitude on the tilt angle can be rather complicated. A skew angle also reduces the reflection amplitude. However, the skew angle can be derived from the B-scan data thus allowing for appropriate amplitude correction.
Options for improvement of depth sizing. Apart from the corner reflection, some additional signals may be recorded in PE mode, which can be used for improving depth sizing. A promising approach is based on the indirect reflection signal from the crack side (ICE), which represents an important criterion in particular for deeper cracks. While this type of signal has already been used in the past for circumferential crack inspection, its use for the much wider application range of axial crack inspection is now becoming available with the latest high-resolution UCx tools.
6 REFERENCES
[1] Pipeline Operators Forum (POF), Specifications and requirements for in-line inspection of pipelines, 2016.
[2] Skow, J., LeBlanc, L., In-line inspection tool performance evaluation using field excavation data; International Pipeline Conference IPC, Paper IPC2014-33755, Calgary, September 29-October 3, 2014.
[3] Krautkrämer, J., Krautkrämer, H., Ultrasonic Testing of Materials, Springer-Verlag Berlin Heidelberg, 1990.
[4] Jäger, C., Willems, H., Barbian, O.A., Uzelac, N., How the uncertainties of ILI data affect pipeline crack assessment, International Pipeline Conference IPC 2012, Paper IPC2012-90480, September 24-28, Calgary, 2012.
[5] Kristiansen, T.S., Willems, H., Bjørgen, H.P., Wieme, G., Ultrasonic tethered tool for inspection of weld cracks in offshore pipelines: tool qualification and first inspection results, 10th Pipeline Technology Conference, Berlin, June 8-10, 2015.
[6] http://www.extende.com/ultrasonic-testing-with-civa [7] Willems, H., Kopp, G., Meinzer, T., Recent advancements in ultrasonic in-line
inspection, 11th Pipeline Technology Conference, Berlin, June 23-25, 2016. [8] Berke, M., Nondestructive Material Testing with Ultrasonics - Introduction to the
Basic Principles, NDT.net, Vol. 5 No. 09, September 2000. [9] Willems, H., Barbian, O.A., State of In-Line Weld Inspection in Pipelines using
Ultrasonics, Rio Pipeline Conference & Exposition, Rio de Janeiro, October 2 - 4, 2007.
Related Documents