Pipeline Stress Analysis for New and Existing Lines by: Kenny T. Farrow, PhD, PE, PEng Ken Zhang, PhD, PEng HOUSTON | CINCINNATI | NEW ORLEANS | CALGARY | SINGAPORE

Welcome message from author
This document is posted to help you gain knowledge. Please leave a comment to let me know what you think about it! Share it to your friends and learn new things together.
Transcript

Pipeline Stress Analysisfor New and Existing Lines
by: Kenny T. Farrow, PhD, PE, PEng Ken Zhang, PhD, PEng
HOUSTON | CINCINNATI | NEW ORLEANS | CALGARY | SINGAPORE

Page | 1
Pipeline Stress Analysis for New and Existing Lines
Kenny T. Farrow, PhD, PE, PEng and Ken Zhang, PhD, PEng
Recent increases in oil and natural gas production and consumption worldwide (e.g., Asia-Pacific, Middle East, and China) have
contributed to the high demand for new construction and in-service uprates of pipeline systems. This increasing demand adds to the
already existing need for pipeline expansion due to the shale gas development boom in North America.
THREE-DIMENSIONAL FULL LINE STRESS ANALYSIS
Stress Engineering Services (SES) has responded to this demand by assisting operators across North America with detailed pipeline
stress analysis for designing new lines and retrofitting existing lines. Typically, these analyses are performed only for previously identified
critical sections of pipeline and are two-dimensional, i.e., neglecting elevation changes along the line. This leads to an analysis that is
typically conservative. SES recommends three-dimensional stress analysis of the entire line because this approach more closely
approximates the actual structural behavior throughout the pipeline. More importantly, three-dimensional stress analysis takes into
account the additional flexibility of and interaction between horizontal and vertical bends, thereby eliminating unnecessary conservatism
inherent in two-dimensional section models.
Three-dimensional analysis of cross-country pipeline
PIPELINE CODE AND DETAILED ASSESSMENTS
SES has extensive experience with performing pipeline stress analysis based on the particular code requirements (e.g., B31.3, B31.4,
B31.8, CSA Z662, etc.) prescribed by the local regulating body. This experience includes assisting midstream companies with interpreting
code and regulatory requirements to define project-specific acceptance criteria. Specifically, it is beneficial to perform comprehensive
analyses that balance the requirements of codes, safe operations, construction efficiency, hazard mitigation, and cost. Below are a few
examples of detailed assessments conducted by SES:
Pipelines are typically constructed using a combination of “roping” (grading the right of way to reduce the number of required
factory and field bends) and “bending” (using field bends to accommodate undulations discovered along the right of way during
construction). The benefits of roping include defining during the pre-installation phase the optimal pipeline profile to reduce global
buckling risk, minimizing trenching cost, and enhancing construction efficiency. SES can perform roping analysis to determine
pipeline vertical alignment.

Page | 2
Roping analysis
Stress intensity factors (SIFs) and flexibility factors used in codes for elbows and tees are typically conservative. To reduce the
level of conservatism, SES performs detailed finite element analysis (FEA) to more accurately estimate these factors.
SES has developed seamless modeling and analysis methods using in-line inspection (ILI) and inertial measurement unit (IMU)
data to more accurately determine the fitness for service (FFS) of pipe defects by integrating global pipeline and local defect
models.
0%
1%
2%
3%
4%
5%
6%
7%
0 5 10 15 20 25 30 35 40 45
Ova
lity
(%)
Axial Distance (in)
𝑜𝑣𝑎𝑙𝑖𝑡𝑦 =𝐷𝑚𝑎𝑥 − 𝐷𝑚𝑖𝑛
𝐷× 100%
flow direction

Page | 3
Detailed local defect analysis (Level 3 fitness-for-service assessment)
In addition to a typical stress-based design, SES can incorporate strain-based design, strain capacity determination, risk-based
analysis, and analysis validation through field monitoring to provide a more rational and efficient design.
With the goal of streamlining the pipeline design or retrofit process, SES can provide a packaged solution of traditional pipeline
code stress analysis and advanced analysis of pipe stress/strain demand due to geohazards (e.g., landslides, weak soils,
subsidence, seismic, frost heave, etc.) and construction activities to ensure safe operation and ultimately reduce engineering
cost.
Geohazard analysis of pipeline floating in muskeg
As part of this holistic design and analysis approach, SES has the capability to perform assessments of mainline, terminal and
station piping, and the interface between the two systems.
SOIL PROPERTIES ALONG A PIPELINE ROUTE
A three-dimensional pipeline stress analysis is most beneficial when the actual soil properties along the line are closely modeled. This
detailed modeling is particularly challenging because pipelines typically cover distances on the order of hundreds of miles. In addition,
detailed geotechnical work (e.g., desktop analysis, bore-hole data, soil testing, field verification, probing, etc.)—while ideal for this
analysis—is typically unavailable for the entire length of the line.
For cases where site-specific geotechnical data are unavailable, soil approximation along the pipeline route can be achieved by using
publicly available soil survey data. In most cases, the databases contain information for subsurface soil as deep as 1.5 to 2.0 meters (3
to 6 ft), which is considered sufficient for stress analyses of cross-country pipelines. SES has developed a procedure that efficiently
assigns soil properties for a pipeline stress analysis. Data processing is used to group the soil classifications based on various contents
of clay, loam, and sand. This data processing incorporates statistical approximation and geographic information systems (GIS) tools.
Future development of this soil terrain analysis will include incorporating our roping analysis to more accurately estimate soil properties
according to pipe depth. An example of post-processed soil information for Wisconsin and Illinois is illustrated below. Soil properties are
assigned for each soil classification, and these properties can then be extracted and incorporated into a pipeline stress analysis.

Page | 4
Soil classification along entire length of a pipeline
After the soil properties are determined along the length of the pipeline, locations can be identified that are particularly sensitive to the
assumed behavior of the soil. For these identified locations, advanced numerical modeling for local pipe/soil interaction can be performed
to improve constitutive soil models. As shown in the figure below, a continuum soil model can be implemented to evaluate the local
behavior at critical locations.
Continuum soil analysis to assess local response at critical location
Page | 5
EFFICIENT PIPELINE MODEL BUILDER
Based on years of experience in stress analysis of pipelines, SES has developed methods to rapidly build full-length, cross-country
pipeline models using supplied tally and/or ILI data, combined with soil property mapping based on the methodology discussed above.
This approach can be used for commercially available software packages such as AutoPIPE (linear-elastic analysis) or Abaqus (linear-
elastic and elastic-plastic analyses). For example, using Abaqus, the developed approach builds the input deck containing all of the
information required to begin assigning specific boundary conditions, loads, etc. for a complete pipeline analysis.
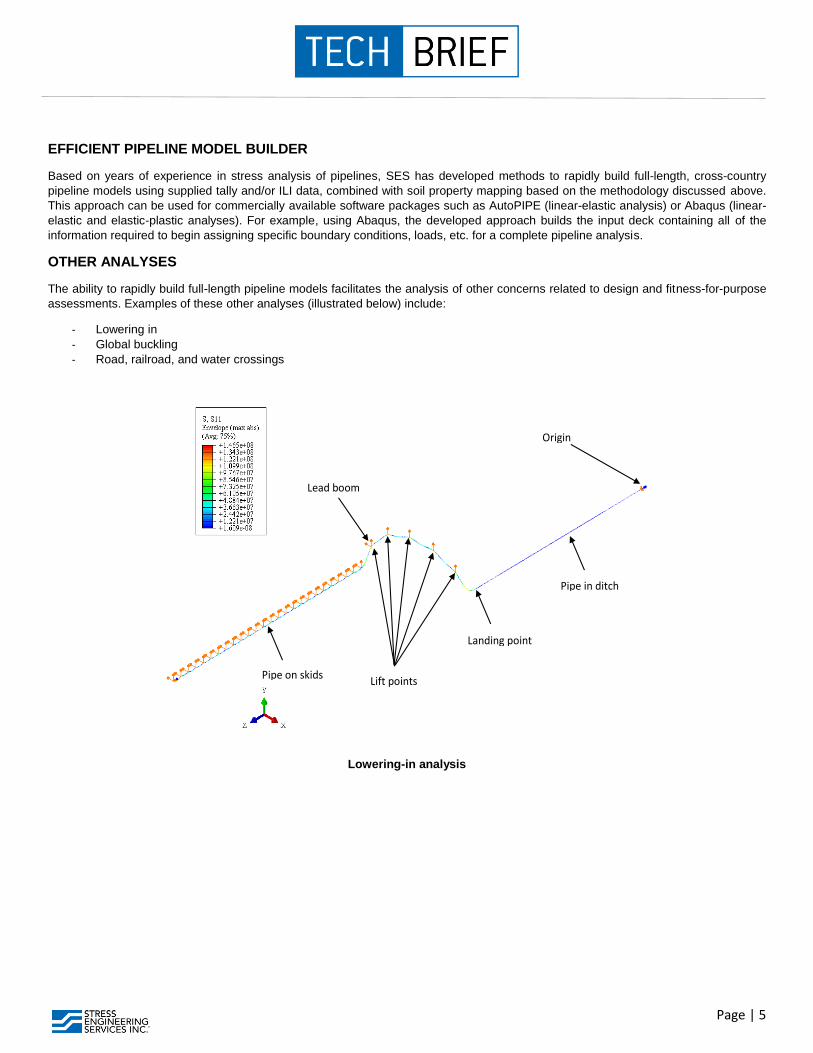
OTHER ANALYSES
The ability to rapidly build full-length pipeline models facilitates the analysis of other concerns related to design and fitness-for-purpose
assessments. Examples of these other analyses (illustrated below) include:
- Lowering in
- Global buckling
- Road, railroad, and water crossings
Lowering-in analysis
Lift points
Lead boom
Pipe in ditch
Landing point
Pipe on skids
Origin

Page | 6
Global pipeline buckling analysis
Water crossing analysis
SUMMARY
Recent increases in oil and natural gas production and consumption have increased the demand for new construction and in-service
uprating of pipeline systems. Based on our 25+ years of experience in subsea and onshore (aboveground and buried) pipelines, SES
has developed a procedure to rapidly build, assess, and recommend cost-effective mitigation strategies for new and existing lines. In the
design and fitness-for-purpose assessments of pipelines, SES believes that it is beneficial to consider full three-dimensional models to
closely approximate the actual structural behavior of the pipeline and, more importantly, take into account the actual flexibility of and
interaction between horizontal and vertical bends. These full-line models allow us to provide our clients a comprehensive solution that
can seamlessly address more detailed analyses when needed, such as global buckling, geohazards, crossings, roping, and Level 3
fitness-for-service assessments.
Related Documents