174 Chapter 5 Pipe sizing Pipes and fittings should be sized so that the flow rates for individual draw-offs are equal to the design flow rates shown in table 5.1. During simultaneous discharges, flows from taps should not be less than the minimum flow rates shown in table 5.1. BS 6700 recommends that flow velocities should not exceed 3 m/s. BS EN 805 recommends 0.5 m/s to 2 m/s with a maximum of 3.5 m/s in exceptional circumstances. Filling times for cisterns may range from 1 to 4 hours depending on their capacity and the flow rate available from the local water supply. In dwellings the filling time should not exceed 1 hour. Design flow rates may be calculated by dividing the cistern capacity by the required filling time. Table 5.1 Design flow rates and loading units Outlet fitting Design flow rate Minimum Loading flow rate units l/s l/s WC flushing cistern single or dual flush – 0.13 0.05 2 to fill in 2 minutes WC trough cistern 0.15 per WC 0.10 2 Wash basin tap size 1–2 – DN 15 0.15 per tap 0.10 1.5 to 3 Spray tap or spray mixer 0.05 per tap 0.03 – Bidet 0.20 per tap 0.10 1 Bath tap, nominal size 3–4 – DN 20 0.30 0.20 10 Bath tap, nominal size 1 – DN 25 0.60 0.40 22 Shower head (will vary with type of head) 0.20 hot or cold 0.10 3 Sink tap, nominal size 1–2 – DN 15 0.20 0.10 3 Sink tap, nominal size 3–4 – DN 20 0.30 0.20 5 Sink tap, nominal size 1 – DN 20 0.60 0.40 – Washing machine size – DN 15 0.20 hot or cold 0.15 Dishwasher size – DN 15 0.15 0.10 3 Urinal flushing cistern 0.004 per position served 0.002 – Pressure flushing valve for WC or urinal 1.5 1.2 – Notes: (1) Flushing troughs are advisable where likely use of WCs is more than once per minute. (2) Mixer fittings use less water than separate taps, but this can be disregarded in sizing. (3) Flow rates to shower mixers vary according to type fitted. Manufacturers should be consulted. (4) Manufacturers should be consulted for flow rates to washing machines and dishwashers for other than a single dwelling. (5) For cistern fed urinals demand is very low and can usually be ignored. Alternatively, use the continuous flow. (6) Loading units should not be used for outlet fittings having high peak demands, e.g. those in industrial

Welcome message from author
This document is posted to help you gain knowledge. Please leave a comment to let me know what you think about it! Share it to your friends and learn new things together.
Transcript

174
Chapter 5
Pipe sizingPipes and fittings should be sized so that the flow rates for individual draw-offs are equal tothe design flow rates shown in table 5.1. During simultaneous discharges, flows from tapsshould not be less than the minimum flow rates shown in table 5.1.BS 6700 recommends that flow velocities should not exceed 3 m/s. BS EN 805 recommends0.5 m/s to 2 m/s with a maximum of 3.5 m/s in exceptional circumstances. Fillingtimes for cisterns may range from 1 to 4 hours depending on their capacity and the flowrate available from the local water supply. In dwellings the filling time should not exceed1 hour.Design flow rates may be calculated by dividing the cistern capacity by the requiredfilling time.Table 5.1 Design flow rates and loading unitsOutlet fitting Design flow rate Minimum Loadingflow rate unitsl/s l/sWC flushing cistern single or dual flush – 0.13 0.05 2to fill in 2 minutesWC trough cistern 0.15 per WC 0.10 2Wash basin tap size 1–2 – DN 15 0.15 per tap 0.10 1.5 to 3Spray tap or spray mixer 0.05 per tap 0.03 –Bidet 0.20 per tap 0.10 1Bath tap, nominal size 3–4 – DN 20 0.30 0.20 10Bath tap, nominal size 1 – DN 25 0.60 0.40 22Shower head (will vary with type of head) 0.20 hot or cold 0.10 3Sink tap, nominal size 1–2 – DN 15 0.20 0.10 3Sink tap, nominal size 3–4 – DN 20 0.30 0.20 5Sink tap, nominal size 1 – DN 20 0.60 0.40 –Washing machine size – DN 15 0.20 hot or cold 0.15Dishwasher size – DN 15 0.15 0.10 3Urinal flushing cistern 0.004 per position served 0.002 –Pressure flushing valve for WC or urinal 1.5 1.2 –Notes:(1) Flushing troughs are advisable where likely use of WCs is more than once per minute.(2) Mixer fittings use less water than separate taps, but this can be disregarded in sizing.(3) Flow rates to shower mixers vary according to type fitted. Manufacturers should be consulted.(4) Manufacturers should be consulted for flow rates to washing machines and dishwashers for other than a singledwelling.(5) For cistern fed urinals demand is very low and can usually be ignored. Alternatively, use the continuous flow.(6) Loading units should not be used for outlet fittings having high peak demands, e.g. those in industrialinstallations. In these cases use the continuous flow.(7) BS 6700 does not give loading units for sink tap DN 20 or pressure flushing valve for WCs or urinals.HAC_C05.qxd 7/24/08 9:35 Page 174Pipe Sizing 175Correct pipe sizes will ensure adequate flow rates at appliances and avoid problemscaused by oversizing and undersizing; see figure 5.1.Oversizing will mean:• additional and unnecessary installation costs;• delays in obtaining hot water at outlets;• increased heat losses from hot water distributing pipes.Undersizing may lead to:• inadequate delivery from outlets and possibly no delivery at some outlets during simultaneous
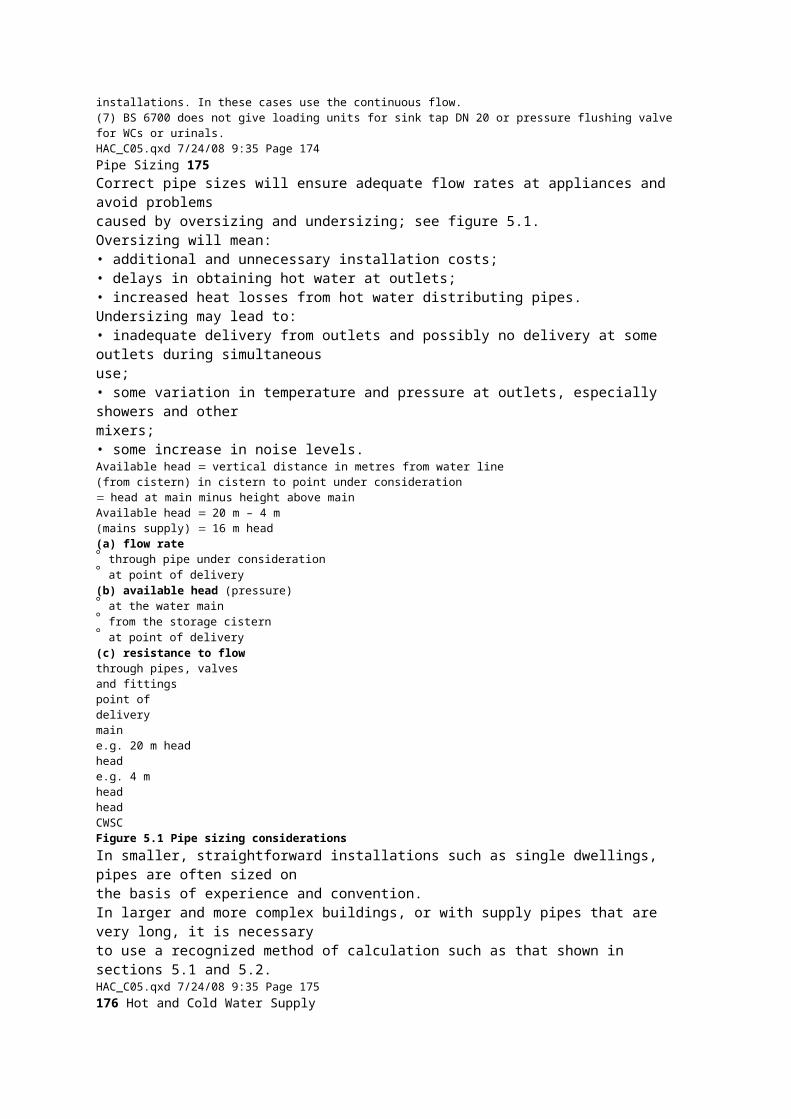
use;• some variation in temperature and pressure at outlets, especially showers and othermixers;• some increase in noise levels.Available head vertical distance in metres from water line(from cistern) in cistern to point under considerationhead at main minus height above mainAvailable head 20 m – 4 m(mains supply) 16 m head(a) flow rate
through pipe under consideration
at point of delivery(b) available head (pressure)
at the water main
from the storage cistern
at point of delivery(c) resistance to flowthrough pipes, valvesand fittingspoint ofdeliverymaine.g. 20 m headheade.g. 4 mheadheadCWSCFigure 5.1 Pipe sizing considerationsIn smaller, straightforward installations such as single dwellings, pipes are often sized onthe basis of experience and convention.In larger and more complex buildings, or with supply pipes that are very long, it is necessaryto use a recognized method of calculation such as that shown in sections 5.1 and 5.2.HAC_C05.qxd 7/24/08 9:35 Page 175176 Hot and Cold Water SupplyBS EN 806-3 gives an alternative ‘simplified method’ of pipe sizing that can be used for‘standard installations’.5.1 Sizing procedure for supply pipesThe procedure below is followed by an explanation of each step with appropriate examples.(1) Assume a pipe diameter.(2) Determine the flow rate:(a) by using loading units;(b) for continuous flows;(c) obtain the design flow rate by adding (a) and (b).(3) Determine the effective pipe length:(d) work out the measured pipe length;(e) work out the equivalent pipe length for fittings;(f) work out the equivalent pipe length for draw-offs;(g) obtain the effective pipe length by adding (d), (e) and (f).(4) Calculate the permissible loss of head:(h) determine the available head:(i) determine the head loss per metre run through pipes;(j) determine the head loss through fittings;(k) calculate the permissible head loss.

(5) Determine the pipe diameter:(l) decide whether the assumed pipe size will give the design flow rate in (c) withoutexceeding the permissible head loss in (k).Explanation of the procedureAssume a pipe diameter (1)In pipe sizing it is usual to make an assumption of the expected pipe size and then provewhether or not the assumed size will carry the required flow.Determine the flow rate (2)In most buildings it is unlikely that all the appliances installed will be used simultaneously.As the number of outlets increases the likelihood of them all being used at the same timedecreases. Therefore it is economic sense to design the system for likely peak flows based onprobability theory using loading units, rather than using the possible maximum flow rate.(a) Loading units. A loading unit is a factor or number given to an appliance which relatesthe flow rate at its terminal fitting to the length of time in use and the frequency of usefor a particular type and use of building (probable usage). Loading units for variousappliances are given in table 5.1.By multiplying the number of each type of appliance by its loading unit and addingthe results, a figure for the total loading units can be obtained. This is converted to adesign flow rate using figure 5.2.An example using loading units is given in figure 5.3.HAC_C05.qxd 7/24/08 9:35 Page 176Pipe Sizing 177(b) Continuous flows. For some appliances, such as automatic flushing cisterns,the flow rate must be considered as a continuous flow instead of applyingprobability theory and using loading units. For such appliances the fulldesign flow rate for the outlet fitting must be used, as given in table 5.1.However, in the example shown in figure 5.3, the continuous flow for thetwo urinals of 0.008 l/s (from table 5.1) is negligible and can be ignored fordesign purposes.(c) Design flow rate. The design flow rate for a pipe is the sum of the flow ratedetermined from loading units (a) and the continuous flows (b).Determine the effective pipe length (3)(d) Find the measured pipe length. Figure 5.4 is an example showing how themeasured pipe length is found.8000 30252015108654321.51.00.80.60.50.40.350002000

1000500400300200100502010Loading unitsFlow rate in litres per secondFigure 5.2Conversionchart – loadingunits to flow rate6 wash basins 5 WCs5 WCscleaners’ sink2 urinal bowls6 wash basins sink12 wash basins 11–2
1810 WCs 2 202 urinal bowls — —2 cleaners’ sinks 3 6Total loading units 44Therefore, from figure 5.2, the required flow rate for the system is 0.7 l/s.Figure 5.3 Example of use of loading unitsAssumed pipe diameter 20 mm.double check valveassemblystopvalve1 mpipe bend0.25 mdrawofftapselbows0.5 m3 mMeasured pipe length 4.75 m.Note There is no need to consider both branch pipes to taps.Figure 5.4 Example of measured pipe lengthHAC_C05.qxd 7/24/08 9:35 Page 177178 Hot and Cold Water Supply(e, f ) Find the equivalent pipe lengths for fittings and draw-offs. For convenience thefrictional resistances to flow through fittings are expressed in terms of pipe lengthshaving the same resistance to flow as the fitting. Hence the term ‘equivalent pipe length’(see table 5.2).For example, a 20 mm elbow offers the same resistance to flow as a 20 mm pipe0.8 m long.Figure 5.5 shows the equivalent pipe lengths for the fittings in the example in figure 5.4.(g) Effective pipe length. The effective pipe length is the sum of the measured pipe length(d) and the equivalent pipe lengths for fittings (e) and draw-offs (f ).Therefore, for the example shown in figure 5.4 the effective pipe length would be:Measured pipe length 4.75 mEquivalent pipe lengthselbows 2 0.8 1.6 mtee 1 1.0 1.0 mstopvalve1 7.0 7.0 mtaps 2 3.7 7.4 m

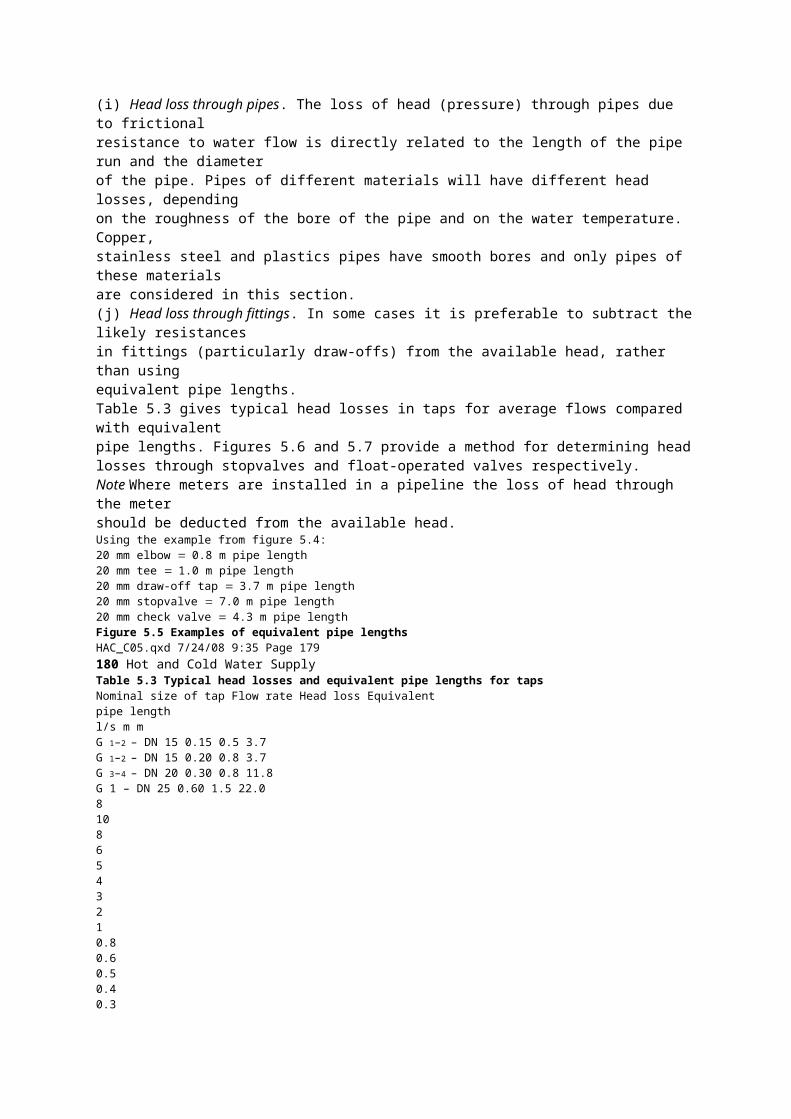
check valves 2 4.3 8.6 mEffective pipe length 30.35 mPermissible loss of head (pressure) (4)Pressure can be expressed in the following ways.(i) In pascals, the pascal (Pa) being the SI unit for pressure.(ii) As force per unit area, N/m2.1 N/m2 1 pascal (Pa).Table 5.2 Equivalent pipe lengths (copper, stainless steel and plastics)Bore of pipe Equivalent pipe lengthElbow Tee Stopvalve Check valvemm m m m m12 0.5 0.6 4.0 2.520 0.8 1.0 7.0 4.325 1.0 1.5 10.0 5.632 1.4 2.0 13.0 6.040 1.7 2.5 16.0 7.950 2.3 3.5 22.0 11.565 3.0 4.5 – –73 3.4 5.8 34.0 –Notes:(1) For tees consider change of direction only. For gate valves losses are insignificant.(2) For fittings not shown, consult manufacturers if significant head losses are expected.(3) For galvanized steel pipes in a small installation, pipe sizing calculations may be based on the data in thistable for equivalent nominal sizes of smooth bore pipes. For larger installations, data relating specifically togalvanized steel should be used. BS 6700 refers to suitable data in the Plumbing Engineering Services DesignGuide published by the Institute of Plumbing.HAC_C05.qxd 7/24/08 9:35 Page 178Pipe Sizing 179(iii) As a multiple of atmospheric pressure (bar).Atmospheric pressure 100 kN/m2 100 kPa 1 bar.(iv) As metres head, that is, the height of the water column from the water level to thedraw-off point.1 m head 9.81 kN/m2 9.81 kPa 98.1 mb.In the sizing of pipes, any of these units can be used. BS 6700 favours the pascal. However,this book retains the use of metres head, giving a more visual indication of pressure thatcompares readily to the height and position of fittings and storage vessels in the building.(h) Available head. This is the static head or pressure at the pipe or fitting under consideration,measured in metres head (see figure 5.1).(i) Head loss through pipes. The loss of head (pressure) through pipes due to frictionalresistance to water flow is directly related to the length of the pipe run and the diameterof the pipe. Pipes of different materials will have different head losses, dependingon the roughness of the bore of the pipe and on the water temperature. Copper,stainless steel and plastics pipes have smooth bores and only pipes of these materialsare considered in this section.(j) Head loss through fittings. In some cases it is preferable to subtract the likely resistancesin fittings (particularly draw-offs) from the available head, rather than usingequivalent pipe lengths.Table 5.3 gives typical head losses in taps for average flows compared with equivalent

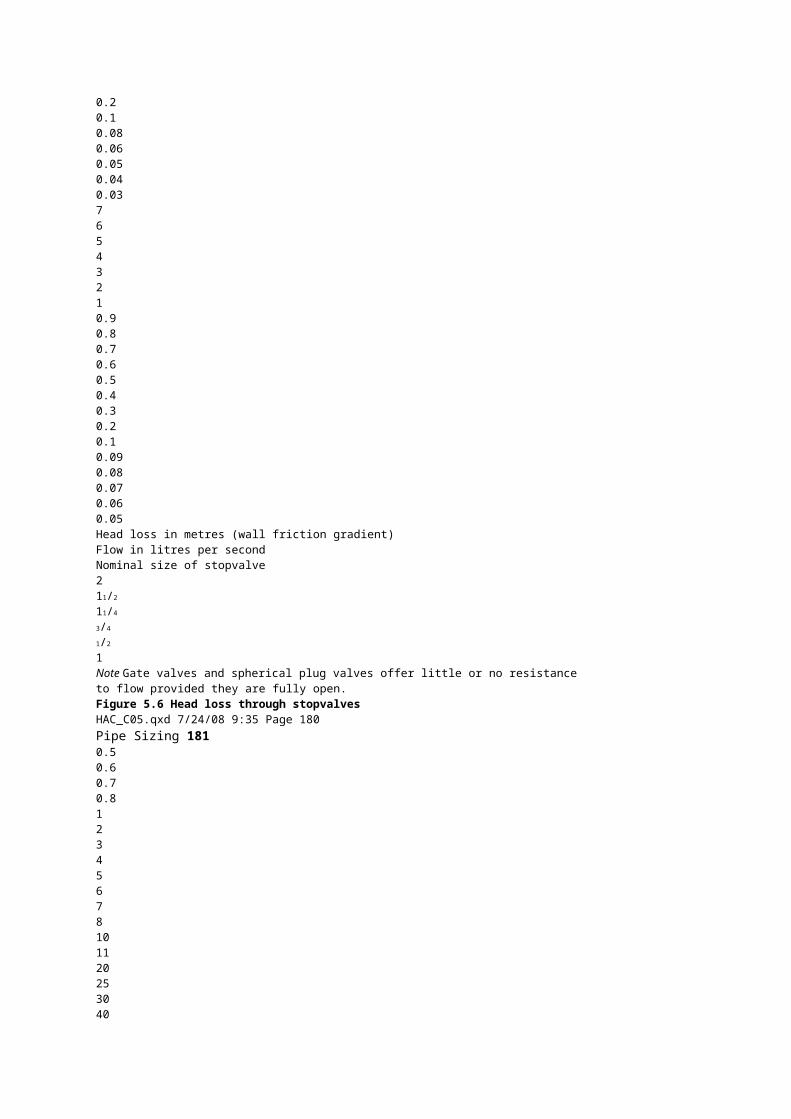
pipe lengths. Figures 5.6 and 5.7 provide a method for determining headlosses through stopvalves and float-operated valves respectively.Note Where meters are installed in a pipeline the loss of head through the metershould be deducted from the available head.Using the example from figure 5.4:20 mm elbow 0.8 m pipe length20 mm tee 1.0 m pipe length20 mm draw-off tap 3.7 m pipe length20 mm stopvalve 7.0 m pipe length20 mm check valve 4.3 m pipe lengthFigure 5.5 Examples of equivalent pipe lengthsHAC_C05.qxd 7/24/08 9:35 Page 179180 Hot and Cold Water SupplyTable 5.3 Typical head losses and equivalent pipe lengths for tapsNominal size of tap Flow rate Head loss Equivalentpipe lengthl/s m mG 1–2 – DN 15 0.15 0.5 3.7G 1–2 – DN 15 0.20 0.8 3.7G 3–4 – DN 20 0.30 0.8 11.8G 1 – DN 25 0.60 1.5 22.081086543210.80.60.50.40.30.20.10.080.060.050.040.0376543210.90.80.70.60.50.40.30.20.10.090.080.070.060.05Head loss in metres (wall friction gradient)Flow in litres per secondNominal size of stopvalve211/2
11/4
3/4
1/2
1Note Gate valves and spherical plug valves offer little or no resistanceto flow provided they are fully open.Figure 5.6 Head loss through stopvalvesHAC_C05.qxd 7/24/08 9:35 Page 180Pipe Sizing 1810.50.60.70.81234567810112025304050Head of water in metres (pressure)Diameter of orificeFlow through orifice in litres per secondMillimetresInches3520151086543210.80.60.50.40.30.20.10.080.060.050.040.030.020.0111/4
130252015108654315/16
3/4
5/8
1/2
3/8
1/4
3/16
1/8
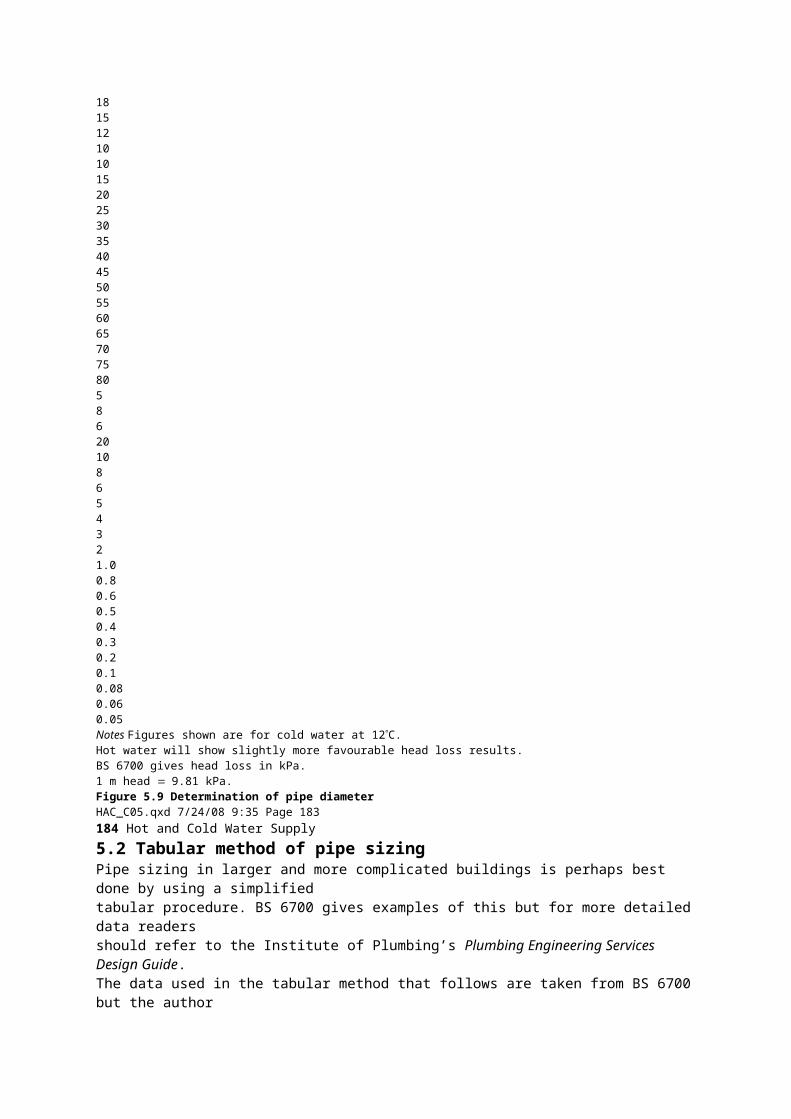
Based on Q AV0.75V 2gHQ is flow (l/s)A is cross sectional area of pipe (m2)V is velocity (m/s)g is acceleration due to gravity (m/s2)H is head of water (m)whereFigure 5.7 Head loss through float-operated valvesHAC_C05.qxd 7/24/08 9:35 Page 181182 Hot and Cold Water Supply(k) Permissible head loss. This relates the available head to the frictional resistances in thepipeline. The relationship is given by the formula:Permissible head loss (m/m run) This formula is used to determine whether the frictional resistance in a pipe will permitthe required flow rate without too much loss of head or pressure. Figure 5.8 illustratesthe permissible head loss for the example in figure 5.4.Available head (m)Effective pipe length (m)Pressure at taps 45 m headtee pipe benddraw-offtaps20 mm pipelineelbowsdouble check valveassemblystopvalveFlow rate for 2 taps 0.4 l/sPermissible head loss available head (45 m)effective pipe length (30.55 m)1.48 m/m runFigure 5.8 Example of permissible head lossDetermine the pipe diameter (5)In the example in figure 5.4 a pipe size of 20 mm has been assumed. This pipe size must givethe design flow rate without the permissible head loss being exceeded. If it does not, a freshpipe size must be assumed and the procedure worked through again.Figure 5.9 relates pipe size to flow rate, flow velocity and head loss. Knowing theassumed pipe size and the calculated design flow rate, the flow velocity and the head losscan be found from the figure as follows.(1) Draw a line joining the assumed pipe size (20 mm) and the design flow rate (0.4 l/s).(2) Continue this line across the velocity and head loss scales.(3) Check that the loss of head (0.12 m/m run) does not exceed the calculated permissiblehead loss of 1.48 m/m run.(4) Check that the flow velocity (1.4 m/s) is not too high by referring to table 5.4.HAC_C05.qxd 7/24/08 9:35 Page 182Pipe Sizing 183V is velocity (m/s)

d is diameter (mm)i is hydraulic gradientV 0.5545 d0.6935 i 0.5645
Lamont‘s smooth pipe formula S3:Where165432.521.51.00.750.50.250.10.800.600.500.400.300.200.100.080.060.050.040.030.020.010.0080.0070.0060.0050.0040.0030.0020.0010.00080.00060.00050.00040.00030.00020.0001Head loss in metres per metre runVelocity in metres per secondFormula applied between these limits onlyFlow in litres per secondOutside diameter of copper pipe in millimetresActual bore of pipe in millimetres50403076.167544235282218151210101520
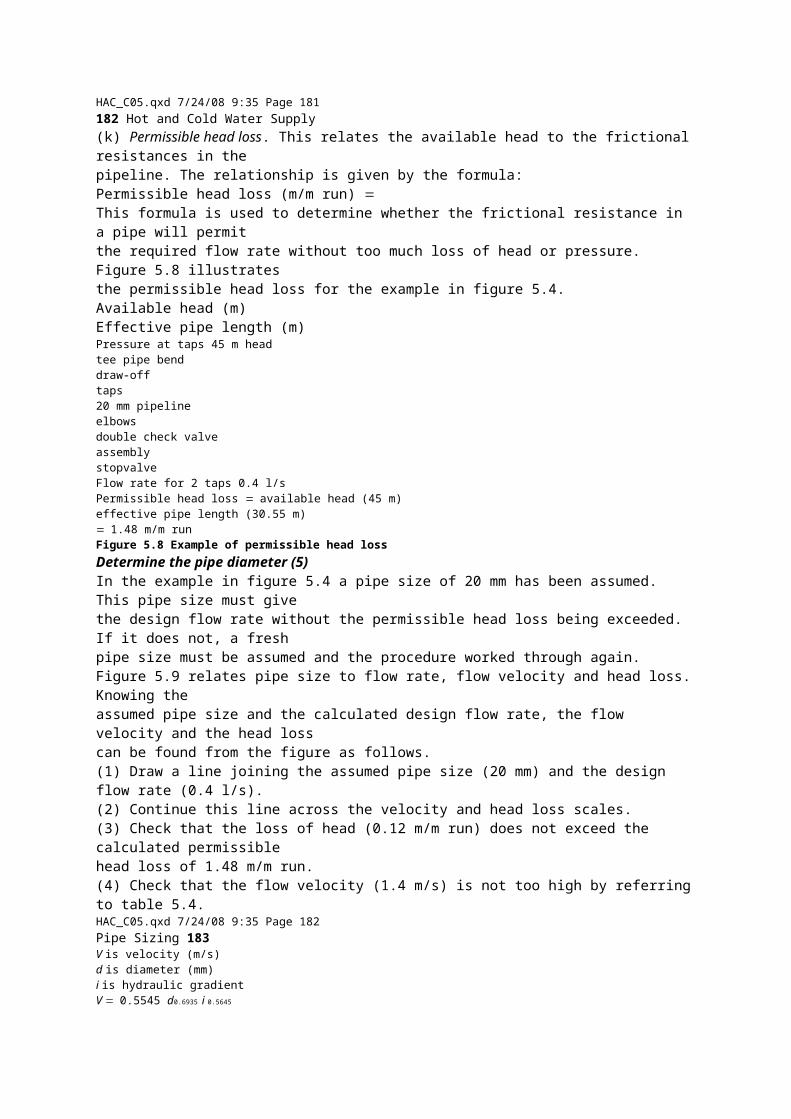
25303540455055606570758058620108654321.00.80.60.50.40.30.20.10.080.060.05Notes Figures shown are for cold water at 12C.Hot water will show slightly more favourable head loss results.BS 6700 gives head loss in kPa.1 m head 9.81 kPa.Figure 5.9 Determination of pipe diameterHAC_C05.qxd 7/24/08 9:35 Page 183184 Hot and Cold Water Supply
5.2 Tabular method of pipe sizingPipe sizing in larger and more complicated buildings is perhaps best done by using a simplifiedtabular procedure. BS 6700 gives examples of this but for more detailed data readersshould refer to the Institute of Plumbing’s Plumbing Engineering Services Design Guide.The data used in the tabular method that follows are taken from BS 6700 but the authorhas simplified the method compared with that given in the standard.The tabular method uses a work sheet which can be completed as each of the stepsis followed in the pipe sizing procedure. An example of the method follows with someexplanation of each step.Explanation of the tabular methodPipework diagram(1) Make a diagram of the pipeline or system to be considered (see figure 5.10).(2) Number the pipes beginning at the point of least head, numbering the main pipe runfirst, then the branch pipes.(3) Make a table to show the loading units and flow rates for each stage of the main run.Calculate and enter loading units and flow rates; see figure 5.10.Calculate flow demand

(1) Calculate maximum demand (see figure 5.10):• add up loading units for each stage (each floor level);• convert loading units to flow rates;• add up flow rates for each stage.(2) Calculate probable demand (see figure 5.10):• add up loading units for all stages;• convert total loading units to flow rate.(3) Calculate percentage demand (number of stages for which frictional resistances needbe allowed). See figure 5.12.Table 5.4 Maximum recommended flow velocitiesWater temperature Flow velocityPipes readily Pipes not readilyaccessible accessible°C m/s m/s10 3.0 2.050 3.0 1.570 2.5 1.390 2.0 1.0Note Flow velocities should be limited to reduce system noise.HAC_C05.qxd 7/24/08 9:35 Page 184Pipe Sizing 185Bib tap at 0.3 l/s in frequent use.servicing valvesdouble check valveassemblywc wb b0.5 m51 m2.4 m 2.4 m 2.4 m 2.8 m1 m12362 m1 m1 m3 m2 msink0.54tap0.5m1 m1 m0.5 m7wc wb bAssume draw-offs on each branchall to be at the same level.Size for largest draw-off at eachbranch, i.e. bath.++=21.51013.5+=0.350.30.65 l/s
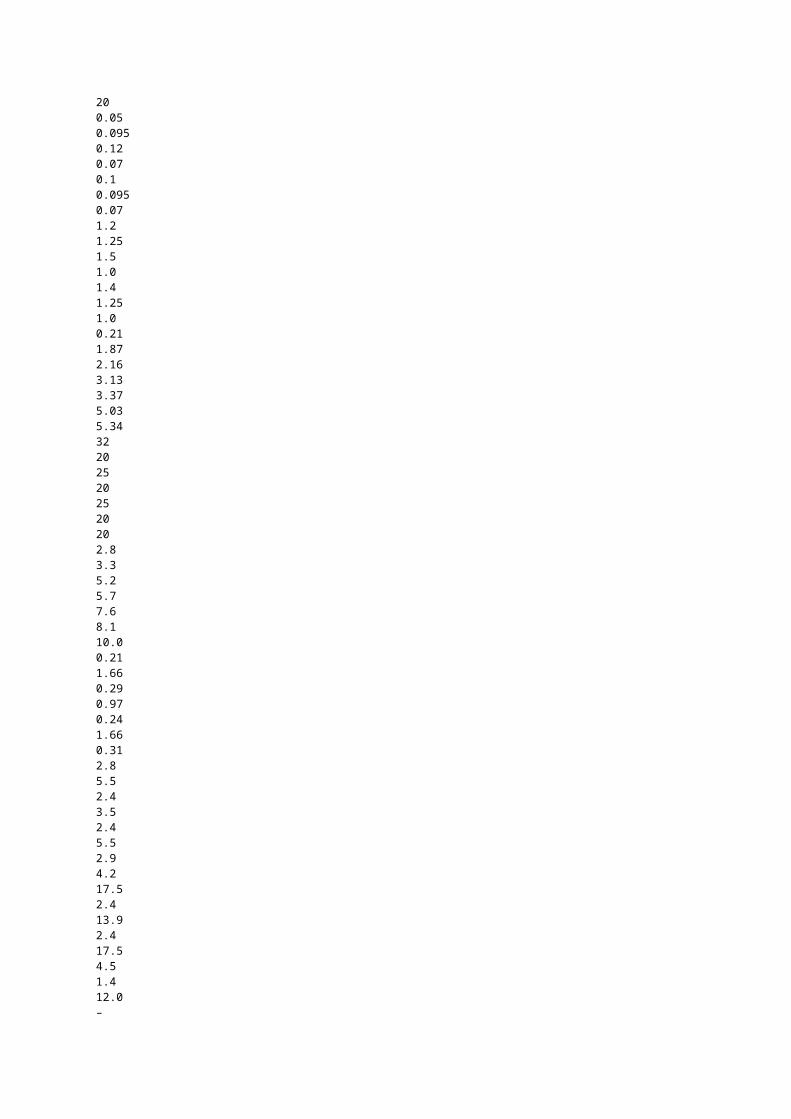
0.3 l/s+=313.516.5+=0.40.30.7 l/s+++=21.51016.530+=0.550.30.85 l/sCWSCloadingunitslitres persecondNote Figure is not to scale for convenience, water level incistern taken to be at base of cistern. Servicing valves assumedto be full-flow gate valves having no head losses.Refer also to figure 5.12.Figure 5.10 Pipe sizing diagramWork through the calculation sheetSee figure 5.11, using the data shown in figures 5.10 and 5.12.HAC_C05.qxd 7/24/08 9:35 Page 185186 Hot and Cold Water SupplyEnter pipe reference on calculation sheetDetermine loading unit(table 5.1)Convert loading units to flow rate(figure 5.2)Make assumption as to pipe size(inside diameter)Work out frictional resistance per metre(figure 5.9)Determine velocity of flow(figure 5.9)Consider frictional resistances in fittings(table 5.2 and figures 5.6 and 5.7)Measure length of pipe under considerationAdd totals in columns 7 and 8Head consumed – multiply column 5 by column 9Add head consumed in column 10 to progressivehead in previous row of column 11Record available head at point of deliveryCompare progressive head with availablehead to confirm pipe diameter or notNotes(1) Pipereference(2) Loadingunits(3) Flow rate(l/s)(4) Pipe size(mm diameter)

(5) Loss of head(m/m run)(6) Flow velocity(m/s)(7) Measured piperun (m)(8) Equivalent pipelength (m)(9) Effective pipelength (m)(10) Head consumed(m)(11) Progressivehead (m)(12) Availablehead (m)(13) Final pipesize (mm)(14) RemarksCalculation sheetThis is an example of a suitable calculation sheet with explanatory notes.Note If, for any pipe or series of pipes, it is found that theassumed pipe size gives a progressive head that is inexcess of the available head, or is noticeably low, it will benecessary to repeat the sizing operation using a revisedassumed pipe diameter.Figure 5.11 Calculation sheet – explanation of useHAC_C05.qxd 7/24/08 9:35 Page 186Pipe Sizing 187Calculation sheetRefer also to figure 5.10.(1) Pipereference(2) Loadingunits(3) Flow rate(l/s)(4) Pipe size(mm diameter)(5) Loss of head(m/m run)(6) Flow velocity(m/s)(7) Measured piperun (m)(8) Equivalent pipelength (m)(9) Effective pipelength (m)(10) Head consumed(m)(11) Progressivehead (m)(12) Availablehead (m)(13) Final pipesize (mm)(14) Remarks15263740.850.350.70.30.65

0.350.3322025202520200.050.0950.120.070.10.0950.071.21.251.51.01.41.251.00.211.872.163.133.375.035.34322025202520202.83.35.25.77.68.110.00.211.660.290.970.241.660.312.85.52.43.52.45.52.94.217.52.413.92.417.54.51.412.0–10.4–

12.01.63013.516.5313.513.5—Figure 5.12 Calculation sheet – example of useEstimated maximum demand 1.4 l/sProbable demand 0.85 l/sPercentage demand 60%Therefore only 60% of the installation need be considered.For example, if we were designing for a multi-storey building20 storeys high, only the first 12 storeys need to be calculated.However, in the example followed here, the whole system hasbeen sized because the last fitting on the run has a high flow ratein continuous use.For branches only the pipes to the largest draw-off, i.e. the bathtap, need be sized.10010.851.41001probable demandestimated maximum demandHAC_C05.qxd 7/24/08 9:35 Page 187188 Hot and Cold Water Supply
5.3 Sizing cold water storageIn Britain, cold water has traditionally been stored in both domestic and non-domesticbuildings, to provide a reserve of water in case of mains failure. However, in recent yearswe have seen an increase in the use of ‘direct’ pressure systems, particularly for hot waterservices where many combination boilers and unvented hot water storage vessels are nowbeing installed.BS 6700 no longer gives storage capacities for houses. The following figures are based onthe 1997 edition.Smaller houses cistern supplying cold water only – 100 l to 150 lcistern supplying hot and cold outlets – 200 l to 300 lLarger houses per person where cistern fills only – 80 lat night per person – 130 lHowever, in clause 5.3.9.4 it recommends a minimum storage capacity of 230 l where thecistern supplies both cold water outlets and hot water apparatus, which was a requirementof byelaws in the past. The author still favours the old byelaw requirements, which aremore specific and which still seem to be the normal capacity installed.Cold water storage cistern – 115 l minimumFeed cistern – No minimum but should be equal to thecapacity of the hot store vessel suppliedCombined feed and storage cistern – 230 l minimumFor larger buildings the capacity of the cold water storage cistern depends on:• type and use of buildings;

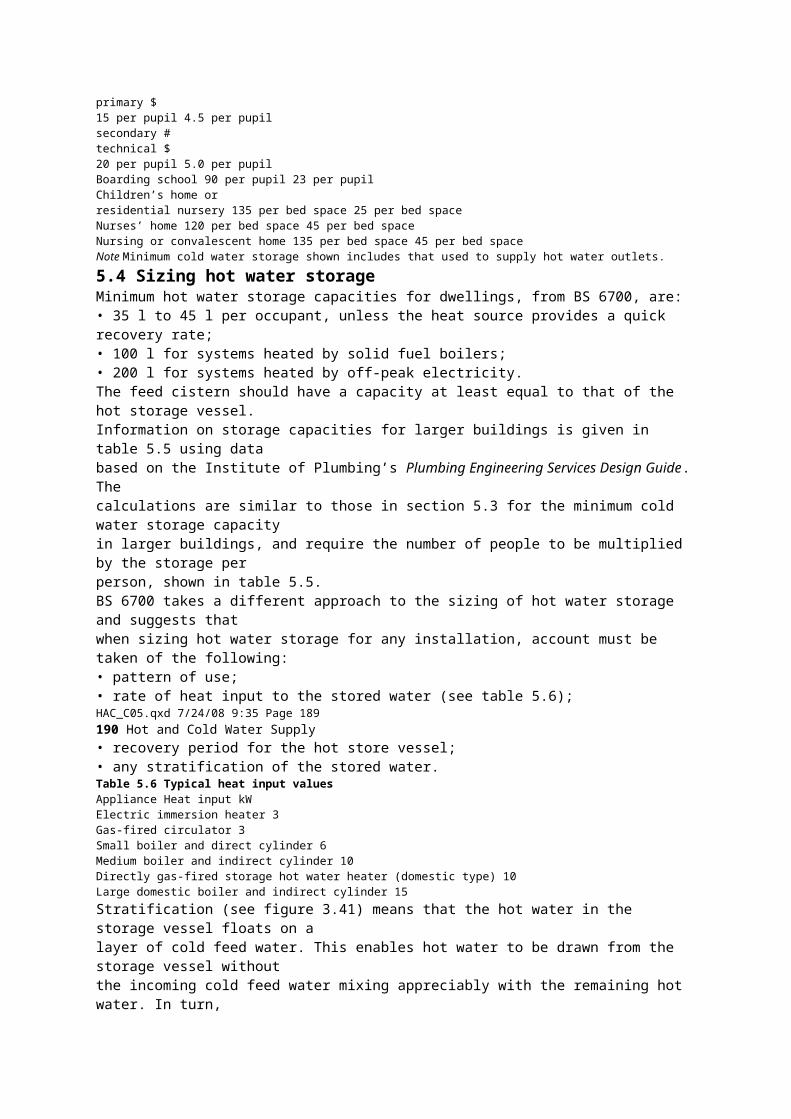
• number of occupants;• type and number of fittings;• frequency and pattern of use;• likelihood and frequency of breakdown of supply.These factors have been taken into account in table 5.5, which sets out minimum storagecapacities in various types of building to provide a 24-hour reserve capacity in case ofmains failure.Calculation of minimum cold water storage capacityDetermine the amount of cold water storage required to cover 24 hours interruptionof supply in a combined hotel and restaurant. Number of hotel guests 75, number ofrestaurant guests 350.Storage capacity number of guests storage per person from table 5.5Hotel storage capacity 75 200 15 000 lRestaurant storage capacity 350 7 2450 lTherefore total storage capacity required is 15 000 l 2450 l 17 450 lHAC_C05.qxd 7/24/08 9:35 Page 188Pipe Sizing 189Assuming 12-hour fill time, the design flow rate to the cistern would be:Design flow rate 17 450 l cistern capacity 12 hours17 540 (12 3600 seconds)0.4 l /sTable 5.5 Recommended minimum storage of hot and cold water for domestic purposesType of building Minimum cold Minimum hotwater storage water storagelitres (l) litres (l)Hostel 90 per bed space 32 per bed spaceHotel 200 per bed space 45 per bed spaceOffice premises:with canteen facilities 45 per employee 4.5 per employeewithout canteen facilities 40 per employee 4.0 per employeeRestaurant 7 per meal 3.5 per mealDay school:nursery #primary $15 per pupil 4.5 per pupilsecondary #technical $20 per pupil 5.0 per pupilBoarding school 90 per pupil 23 per pupilChildren’s home orresidential nursery 135 per bed space 25 per bed spaceNurses’ home 120 per bed space 45 per bed spaceNursing or convalescent home 135 per bed space 45 per bed spaceNote Minimum cold water storage shown includes that used to supply hot water outlets.
5.4 Sizing hot water storageMinimum hot water storage capacities for dwellings, from BS 6700, are:• 35 l to 45 l per occupant, unless the heat source provides a quick recovery rate;• 100 l for systems heated by solid fuel boilers;• 200 l for systems heated by off-peak electricity.The feed cistern should have a capacity at least equal to that of the hot storage vessel.Information on storage capacities for larger buildings is given in table 5.5 using databased on the Institute of Plumbing’s Plumbing Engineering Services Design Guide. Thecalculations are similar to those in section 5.3 for the minimum cold water storage capacityin larger buildings, and require the number of people to be multiplied by the storage perperson, shown in table 5.5.
BS 6700 takes a different approach to the sizing of hot water storage and suggests thatwhen sizing hot water storage for any installation, account must be taken of the following:• pattern of use;• rate of heat input to the stored water (see table 5.6);HAC_C05.qxd 7/24/08 9:35 Page 189190 Hot and Cold Water Supply• recovery period for the hot store vessel;• any stratification of the stored water.Table 5.6 Typical heat input valuesAppliance Heat input kWElectric immersion heater 3Gas-fired circulator 3Small boiler and direct cylinder 6Medium boiler and indirect cylinder 10Directly gas-fired storage hot water heater (domestic type) 10Large domestic boiler and indirect cylinder 15Stratification (see figure 3.41) means that the hot water in the storage vessel floats on alayer of cold feed water. This enables hot water to be drawn from the storage vessel withoutthe incoming cold feed water mixing appreciably with the remaining hot water. In turn,this allows a later draw-off of water at a temperature close to the design storage temperature,with less frequent reheating of the contents of the storage vessel and savings in heatingcosts and energy.Stratification is most effective when cylinders and tanks are installed vertically ratherthan horizontally, with a ratio of height to width or diameter of at least 2:1.The cold feed inlet should be arranged to minimize agitation and hence mixing, by beingof ample size and, if necessary, fitted with a baffle to spread the incoming water.Stratification is used to good effect in off-peak electric water heaters (see figure 5.13). Inthis case no heat is normally added to the water during the daytime use and consequentlyvery little mixing of hot and cold water takes place. In other arrangements the heating ofthe water will induce some mixing.Calculation of hot water storage capacityAs noted above, the storage capacity required in any situation depends on the rate of heatinput to the stored hot water and on the pattern of use. For calculating the required storagecapacity BS 6700 provides a formula for the time M (in min) taken to heat a quantity ofwater through a specified temperature rise:MVT/(14.3P)whereV is the volume of water heated (in l);T is the temperature rise (in °C);P is the rate of heat input to the water (in kW).This formula can be applied to any pattern of use and whether stratification of the storedwater takes place or not. It ignores heat losses from the hot water storage vessel, since over

the relatively short times involved in reheating water after a draw-off has taken place, theireffect is usually small.HAC_C05.qxd 7/24/08 9:35 Page 190Pipe Sizing 191The application of this formula to the sizing of hot water cylinders is best illustrated bythe following examples, in which figures have been rounded.In these examples a small dwelling with one bath installed has been assumed. Maximumrequirement: 1 bath (60 l at 60°C plus 40 l cold water) plus 10 l hot water at 60°C forkitchen use, followed by a second bath fill after 25 min.Thus a draw-off of 70 l at 60°C is required, followed after 25 min by 100 l at 40°C,which may be achieved by mixing hot at 60°C with cold at 10°C.Example 1 Assuming good stratificationGood stratification could be obtained, for example, by heating with a top entry immersionheater. With a rate of heat input of 3 kW, the time to heat the 60 l for the second bathfrom 10°C to 60°C is:MVT/(14.3P)M(60 50)/(14.3 3)M70 minmore eventemperaturethroughoutcylinderhot at topwarmcold at bottom(a) Bottom entry heaterWith a bottom entry immersion heater mixing will occur whenthe water is being heated.(b) Top entry heaterWith top entry immersion heater stratification will preventmixing.(c) Twin entry immersion heaterWith a twin entry immersion heater the top entry element canprovide economical energy consumption for normal use withthe bottom entry element operating when large quantities ofwater are needed, for example, for bathing and washing.With off-peak heaters the top element can be brought into useduring on-peak periods when needed to top up hot water, andstratification will ensure that on-peak electricity is not used toexcess.hotwarmcoldFigure 5.13 Effects of stratificationHAC_C05.qxd 7/24/08 9:35 Page 191192 Hot and Cold Water SupplySince the second bath is required after 25 min, it has to be provided from storage. But in the25 min the volume of water heated to 60°C is:V M(14.3)/TV (25 14.3 3)/50V 21 lTherefore the minimum required storage capacity is:70 6 −21 109 lExample 2 Assuming good mixing of the stored waterGood mixing of the stored water would occur, for example, with heating by a primary coil

in an indirect cylinder.Immediately after drawing off 70 l at 60°C for the first bath and kitchen use, the heatenergy in the remaining water plus the heat energy in the 70 l replacement at 10°C equalsthe heat energy of the water in the full cylinder.The heat energy of a quantity of water is the product of its volume and temperature.Then, if V is the minimum size of the storage cylinder and T is the water temperature in thecylinder after refilling with 70 l at 10°C:(V −70) 60 (70 10) VTT (60V −4200 700)/VT (60V −3500)/VT 60 −3500/VThe second bath is required after 25 min. Hence, with a rate of heat input of 3 kW:25 VT/(14.3 3)and the temperature rise T (25 14.3 3)/Vand T 1072.5/VA temperature of at least 40°C is required to run the second bath. Therefore the watertemperature of the refilled cylinder after the first draw-off of 70 l, plus the temperature riseafter 25 min, must be at least 40°C, or:(60 −3500/V) (1072.5V) 40 (or more)60 −2427.5/V4020 2427.5/VV122 lThese calculations, which may be carried out for any situation, show the value of promotingstratification wherever possible. They also show the savings in storage capacity that canbe made, without affecting the quality of service to the user, by increasing the rate of heatinput to the water. Results of similar calculations are shown in table 5.7 and are taken fromBS 6700.HAC_C05.qxd 7/24/08 9:35 Page 192Pipe Sizing 193
5.5 Legionella – implications in sizing storageIt has been common practice in the past for water suppliers to recommend cold waterstorage capacities to provide for 24 hours of interruption in supply. Table 5.5 in this bookand Table 1 of BS 6700 reflect this practice.Recent investigations into the cause and prevention of Legionella contamination suggestthat hot and cold water storage should be sized to cope with peak demand only, and that inthe past, storage vessels have often been over-sized.Reduced storage capacities would mean quicker turnover of water and less opportunityfor Legionella and other organisms to flourish.Stratification in hot water can lead to ideal conditions for bacteria to multiply, as thebase of some cylinders often remains within the 20°C temperature range. The base of thecylinder may also contain sediment and hard water scale which provide an ideal breedingground for bacteria.
Where, however, good mixing occurs, higher temperatures can be obtained at the cylinderbase during heating up periods. This is helpful because Legionella will not thrive for morethan 5 minutes at 60°C and are killed instantly at temperatures of 70°C or more.Table 5.7 Hot water storage vessels – minimum capacitiesHeat input Dwelling with 1 bath Dwelling with 2 baths*to waterWith With With Withstratification mixing stratification mixingkW litres (l) litres (l) litres (l) litres (l)3 109 122 165 2606 88 88 140 20010 70 70 130 13015 70 70 120 130Note * Maximum requirement of 130 l drawn off at 60°C (2 baths plus 10 l for kitchen use) followed by afurther bath (100 l at 40°C) after 30 min.HAC_C05.qxd 7/24/08 9:35 Page 193
Related Documents


