Welcome message from author
This document is posted to help you gain knowledge. Please leave a comment to let me know what you think about it! Share it to your friends and learn new things together.
Transcript

A BArro
efore anow for P
Ce
nd After Permissi
Pinellas C
enter for U
420T
Study ove Left T
Fin
Pre
PineCounty De
440 CClearwate
Pre
Pei‐Sung LiAld
Enrique
Urban TranUniversity02 E. FowlTampa, Flo
Ju
of ImplemTurns in
nal Report
epared for
ellas Countpartment Court Streeer, Florida
epared by
n, Ph.D., P.Edo Fabregas Gonzalez‐V
nsportatioy of South ler Avenueorida 3362
une, 2010
menting Pinellas
ty of Public Wet 33756
E., PTOE
Velez
n ResearchFlorida e, CUT10020‐5375
g Flashins County
Works
h (CUTR)
ng Yellowy, Florida
w a
ii
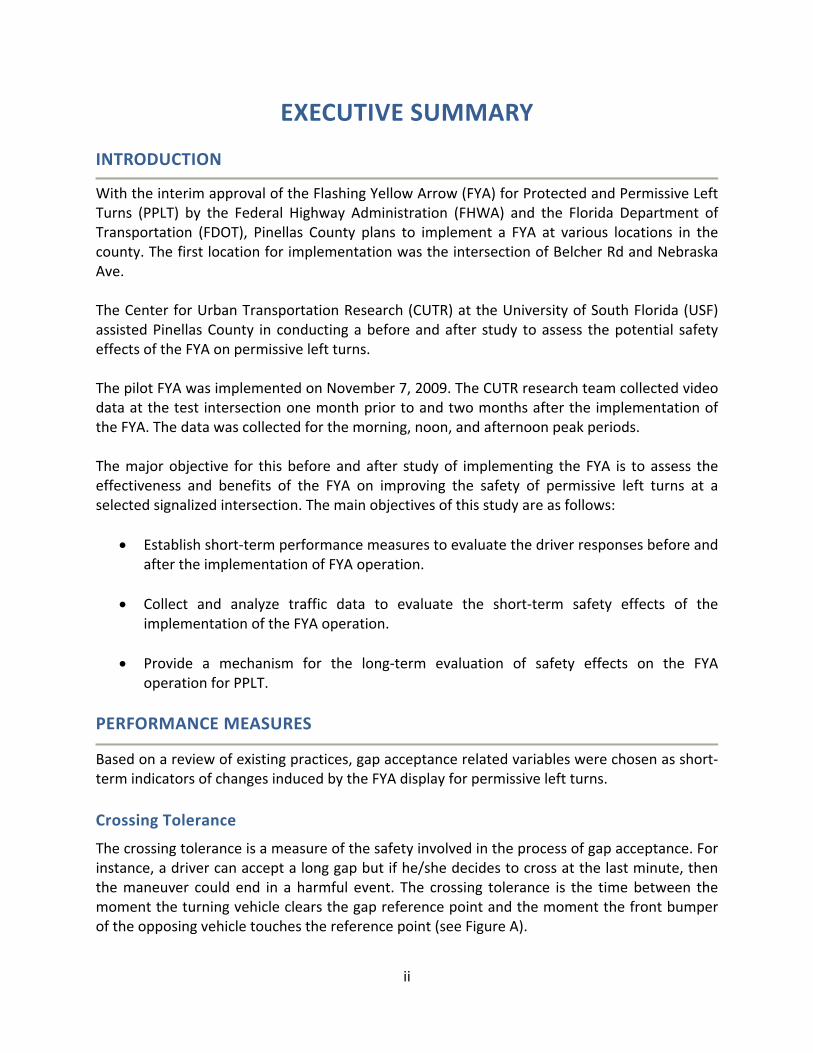
EXECUTIVE SUMMARY INTRODUCTION
With the interim approval of the Flashing Yellow Arrow (FYA) for Protected and Permissive Left Turns (PPLT) by the Federal Highway Administration (FHWA) and the Florida Department of Transportation (FDOT), Pinellas County plans to implement a FYA at various locations in the county. The first location for implementation was the intersection of Belcher Rd and Nebraska Ave. The Center for Urban Transportation Research (CUTR) at the University of South Florida (USF) assisted Pinellas County in conducting a before and after study to assess the potential safety effects of the FYA on permissive left turns. The pilot FYA was implemented on November 7, 2009. The CUTR research team collected video data at the test intersection one month prior to and two months after the implementation of the FYA. The data was collected for the morning, noon, and afternoon peak periods. The major objective for this before and after study of implementing the FYA is to assess the effectiveness and benefits of the FYA on improving the safety of permissive left turns at a selected signalized intersection. The main objectives of this study are as follows:
• Establish short‐term performance measures to evaluate the driver responses before and after the implementation of FYA operation.
• Collect and analyze traffic data to evaluate the short‐term safety effects of the
implementation of the FYA operation.
• Provide a mechanism for the long‐term evaluation of safety effects on the FYA operation for PPLT.
PERFORMANCE MEASURES
Based on a review of existing practices, gap acceptance related variables were chosen as short‐term indicators of changes induced by the FYA display for permissive left turns. Crossing Tolerance
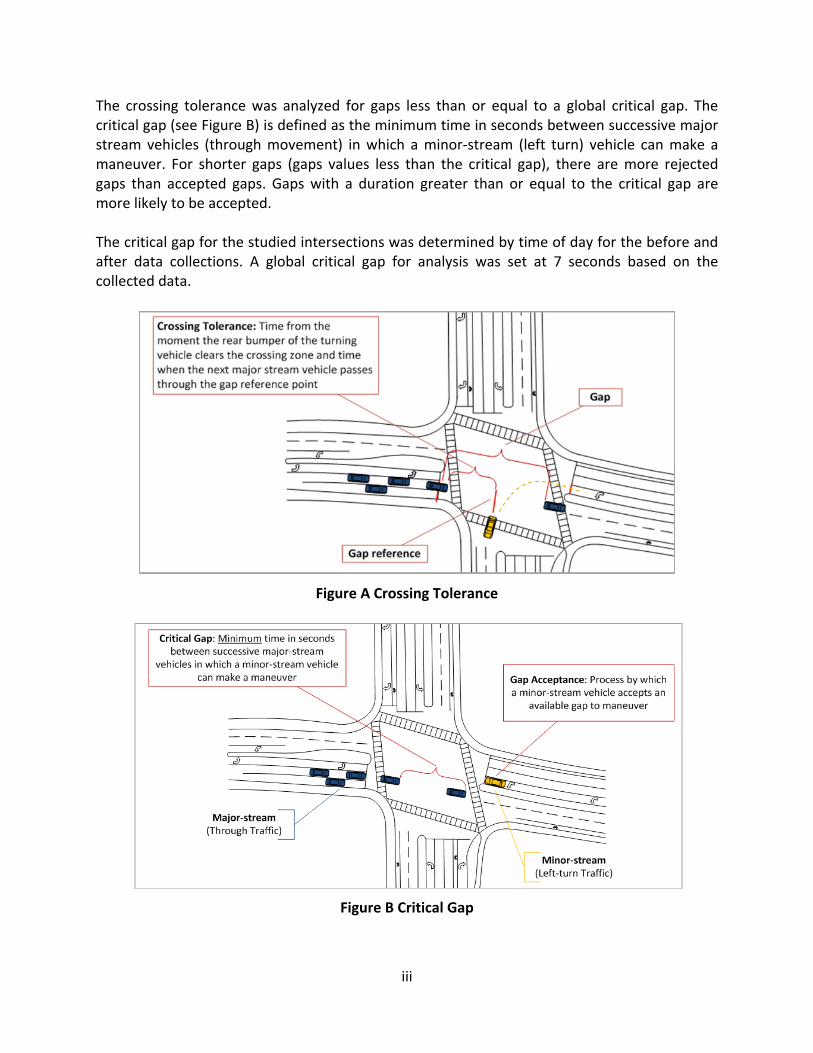
The crossing tolerance is a measure of the safety involved in the process of gap acceptance. For instance, a driver can accept a long gap but if he/she decides to cross at the last minute, then the maneuver could end in a harmful event. The crossing tolerance is the time between the moment the turning vehicle clears the gap reference point and the moment the front bumper of the opposing vehicle touches the reference point (see Figure A).
iii
The crossing tolerance was analyzed for gaps less than or equal to a global critical gap. The critical gap (see Figure B) is defined as the minimum time in seconds between successive major stream vehicles (through movement) in which a minor‐stream (left turn) vehicle can make a maneuver. For shorter gaps (gaps values less than the critical gap), there are more rejected gaps than accepted gaps. Gaps with a duration greater than or equal to the critical gap are more likely to be accepted. The critical gap for the studied intersections was determined by time of day for the before and after data collections. A global critical gap for analysis was set at 7 seconds based on the collected data.
Figure A Crossing Tolerance
Figure B Critical Gap
iv
RESULTS
The results of this study included a comparison of turning movement counts, and crossing tolerance analysis before and after the implementation of the FYA display. No major traffic conflicts were observed during the data collection periods for the before and after study. Traffic Patterns
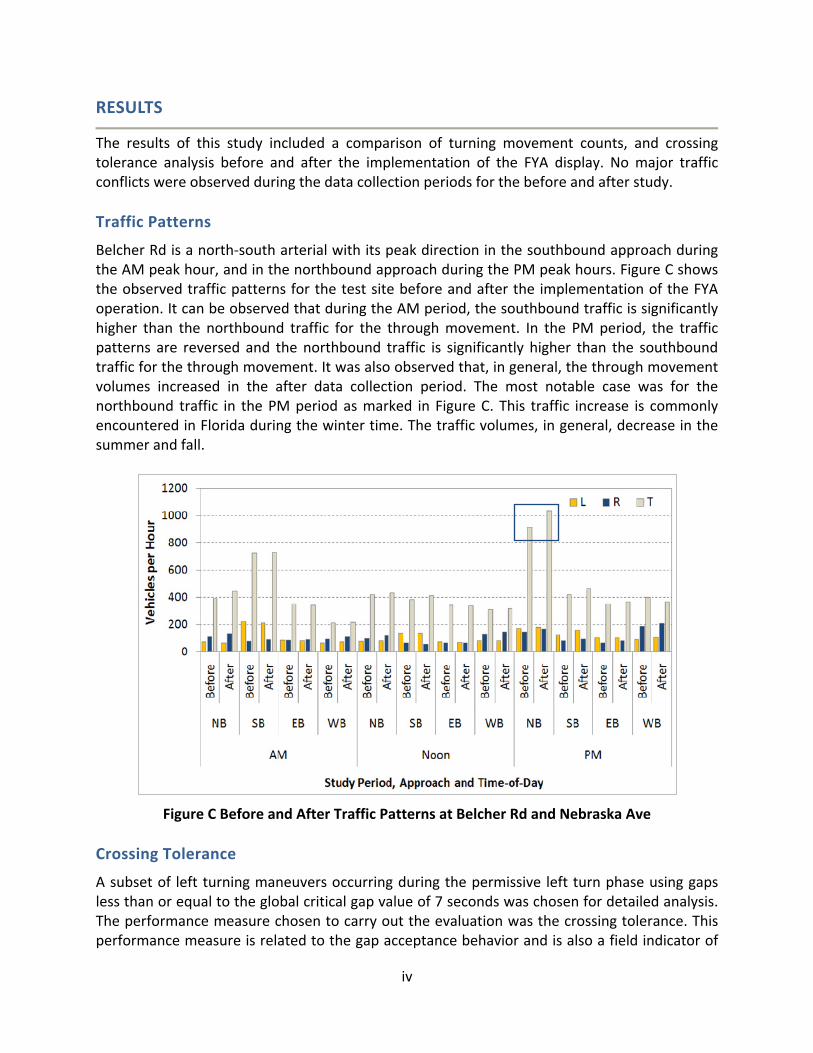
Belcher Rd is a north‐south arterial with its peak direction in the southbound approach during the AM peak hour, and in the northbound approach during the PM peak hours. Figure C shows the observed traffic patterns for the test site before and after the implementation of the FYA operation. It can be observed that during the AM period, the southbound traffic is significantly higher than the northbound traffic for the through movement. In the PM period, the traffic patterns are reversed and the northbound traffic is significantly higher than the southbound traffic for the through movement. It was also observed that, in general, the through movement volumes increased in the after data collection period. The most notable case was for the northbound traffic in the PM period as marked in Figure C. This traffic increase is commonly encountered in Florida during the winter time. The traffic volumes, in general, decrease in the summer and fall.
Figure C Before and After Traffic Patterns at Belcher Rd and Nebraska Ave Crossing Tolerance
A subset of left turning maneuvers occurring during the permissive left turn phase using gaps less than or equal to the global critical gap value of 7 seconds was chosen for detailed analysis. The performance measure chosen to carry out the evaluation was the crossing tolerance. This performance measure is related to the gap acceptance behavior and is also a field indicator of
v
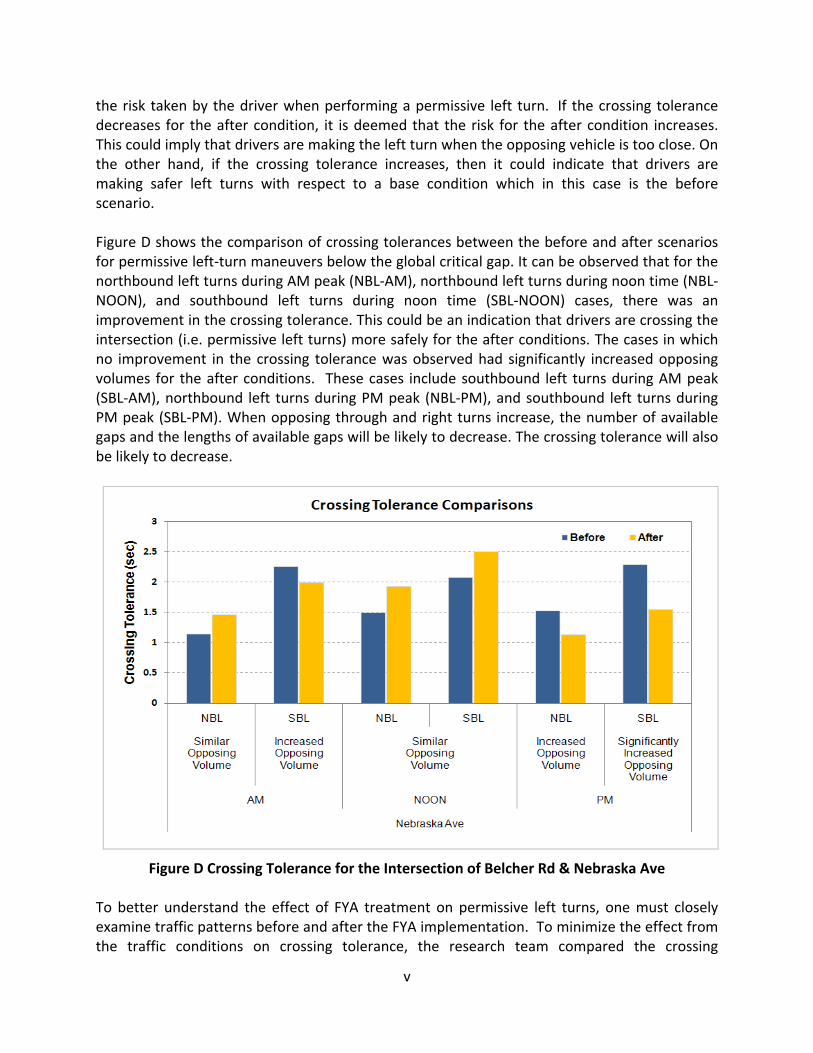
the risk taken by the driver when performing a permissive left turn. If the crossing tolerance decreases for the after condition, it is deemed that the risk for the after condition increases. This could imply that drivers are making the left turn when the opposing vehicle is too close. On the other hand, if the crossing tolerance increases, then it could indicate that drivers are making safer left turns with respect to a base condition which in this case is the before scenario. Figure D shows the comparison of crossing tolerances between the before and after scenarios for permissive left‐turn maneuvers below the global critical gap. It can be observed that for the northbound left turns during AM peak (NBL‐AM), northbound left turns during noon time (NBL‐NOON), and southbound left turns during noon time (SBL‐NOON) cases, there was an improvement in the crossing tolerance. This could be an indication that drivers are crossing the intersection (i.e. permissive left turns) more safely for the after conditions. The cases in which no improvement in the crossing tolerance was observed had significantly increased opposing volumes for the after conditions. These cases include southbound left turns during AM peak (SBL‐AM), northbound left turns during PM peak (NBL‐PM), and southbound left turns during PM peak (SBL‐PM). When opposing through and right turns increase, the number of available gaps and the lengths of available gaps will be likely to decrease. The crossing tolerance will also be likely to decrease.
Figure D Crossing Tolerance for the Intersection of Belcher Rd & Nebraska Ave To better understand the effect of FYA treatment on permissive left turns, one must closely examine traffic patterns before and after the FYA implementation. To minimize the effect from the traffic conditions on crossing tolerance, the research team compared the crossing
vi
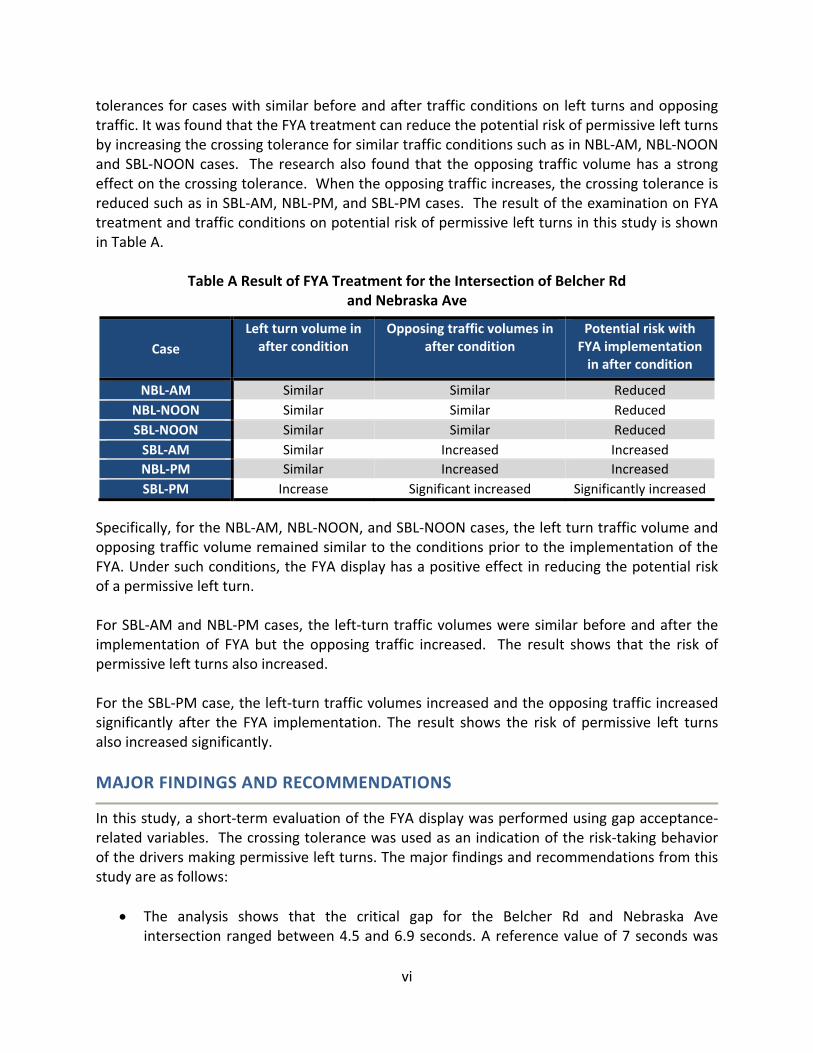
tolerances for cases with similar before and after traffic conditions on left turns and opposing traffic. It was found that the FYA treatment can reduce the potential risk of permissive left turns by increasing the crossing tolerance for similar traffic conditions such as in NBL‐AM, NBL‐NOON and SBL‐NOON cases. The research also found that the opposing traffic volume has a strong effect on the crossing tolerance. When the opposing traffic increases, the crossing tolerance is reduced such as in SBL‐AM, NBL‐PM, and SBL‐PM cases. The result of the examination on FYA treatment and traffic conditions on potential risk of permissive left turns in this study is shown in Table A.
Table A Result of FYA Treatment for the Intersection of Belcher Rd and Nebraska Ave
Case Left turn volume in after condition
Opposing traffic volumes in after condition
Potential risk with FYA implementation in after condition
NBL‐AM Similar Similar ReducedNBL‐NOON Similar Similar ReducedSBL‐NOON Similar Similar ReducedSBL‐AM Similar Increased IncreasedNBL‐PM Similar Increased IncreasedSBL‐PM Increase Significant increased Significantly increased
Specifically, for the NBL‐AM, NBL‐NOON, and SBL‐NOON cases, the left turn traffic volume and opposing traffic volume remained similar to the conditions prior to the implementation of the FYA. Under such conditions, the FYA display has a positive effect in reducing the potential risk of a permissive left turn. For SBL‐AM and NBL‐PM cases, the left‐turn traffic volumes were similar before and after the implementation of FYA but the opposing traffic increased. The result shows that the risk of permissive left turns also increased. For the SBL‐PM case, the left‐turn traffic volumes increased and the opposing traffic increased significantly after the FYA implementation. The result shows the risk of permissive left turns also increased significantly. MAJOR FINDINGS AND RECOMMENDATIONS
In this study, a short‐term evaluation of the FYA display was performed using gap acceptance‐related variables. The crossing tolerance was used as an indication of the risk‐taking behavior of the drivers making permissive left turns. The major findings and recommendations from this study are as follows:
• The analysis shows that the critical gap for the Belcher Rd and Nebraska Ave intersection ranged between 4.5 and 6.9 seconds. A reference value of 7 seconds was
vii
chosen to perform the gap acceptance analysis in this study. Below this value, most of the gaps are rejected and only a few accepted. Beyond the critical gap, most of the gaps are accepted and only a few are rejected.
• For this short‐term evaluation, the implementation of FYA at the test site shows a
potential to consistently and slightly reduce the risk of permissive left turns if traffic conditions remain similar after the implementation of FYA. Under the same traffic conditions, the FYA display seemed to help warn drivers to be more cautious when making permissive left turns.
• The study shows that the opposing through volume has a strong impact on permissive
left turn operation. Opposing right turns also have the potential impact. When the opposing traffic increases, the left turn vehicles are generally forced to accept shorter gaps. In the situations of heavy opposing traffic, the potential risk reduction induced by a signal display of FYA for permissive left turns may not be noticeable.
• The FYA for protected and permissive left turns is not widespread in Florida. It was observed that for most drivers, the FYA operation is a novelty or a special signal even after being in place for two or more months. For future implementation, educational campaigns are recommended to continue.
• For a long‐term evaluation, left‐turn related crash rates are the preferred performance measures to assess the benefits of FYA display for protected and permissive left turns. A follow‐up evaluation for the test site, based on future crash information, is recommended. It is suggested to monitor the implementation of FYA quarterly for the first two years. After that period, the intersection should be monitored annually.
In summary, from a comprehensive gap acceptance analysis, the potential risk of left turns and opposing through crashes at the Belcher Rd and Nebraska Ave intersection was slightly reduced after the implementation of the FYA, when the traffic remained similar to the conditions prior to the implementation of the FYA. The implementation of the FYA did not introduce new traffic conflicts. The risk‐taking behavior of the drivers was slightly reduced for moderate opposing traffic volumes. It is necessary to highlight that under heavy opposing traffic volume, drivers making permissive left turns will have fewer chances to find acceptable gaps to maneuver safely regardless of the permissive left turn signal display in use. The potential risk for permissive left turns is likely to be reduced through the implementation of FYA when the opposing volumes are low to moderate.
viii
TABLE OF CONTENTS
1 INTRODUCTION ............................................................................................................ 1
2 RELATED STUDIES ......................................................................................................... 2
3 PERFORMANCE MEASURES .......................................................................................... 3
3.1 CRASH DATA ........................................................................................................................... 3 3.2 TRAFFIC CONFLICTS .................................................................................................................. 3 3.3 OTHER EVENTS ........................................................................................................................ 6 3.4 GAP ACCEPTANCE .................................................................................................................... 7 3.5 CRITICAL GAP .......................................................................................................................... 8 3.6 CROSSING TOLERANCE .............................................................................................................. 9
4 RESEARCH APPROACH ................................................................................................ 10
4.1 SITE DESCRIPTION .................................................................................................................. 10 4.2 CONTROL SITE ....................................................................................................................... 11
5 DATA COLLECTION ..................................................................................................... 13
5.1 DATA COLLECTION METHODOLOGY ........................................................................................... 13 5.2 IMPLEMENTATION OF THE FLASHING YELLOW ARROW OPERATION .................................................. 15
6 RESULTS ..................................................................................................................... 18
6.1 TRAFFIC PATTERNS ................................................................................................................. 18 6.2 BEFORE AND AFTER COMPARISON OF TRAFFIC PATTERNS ............................................................... 19 6.3 TRAFFIC ACCIDENTS ................................................................................................................ 24 6.4 CONFLICT COUNTS ................................................................................................................. 25 6.5 GAP ACCEPTANCE .................................................................................................................. 26
6.5.1 Critical Gap ............................................................................................................... 26 6.5.2 Crossing Tolerance ................................................................................................... 29
7 CONCLUSIONS ............................................................................................................ 32
8 REFERENCES ............................................................................................................... 34
APPENDIX A ........................................................................................................................... 35
COMPARISON OF BEFORE‐AND‐AFTER TRAFFIC VOLUMES FOR THE INTERSECTION OF BELCHER RD AND TAMPA RD ............................................................................................................................ 35
APPENDIX B ........................................................................................................................... 41
ANALYSIS OF FACTORS INFLUENCING THE CROSSING TOLERANCE IN THE STUDY INTERSECTIONS ..................... 41
ix
LIST OF FIGURES
FIGURE 1 OPPOSING LEFT TURN CONFLICT ................................................................................................ 4
FIGURE 2 LEFT TURN SAME DIRECTION CONFLICT ....................................................................................... 4
FIGURE 3 LANE CHANGE SAME DIRECTION CONFLICT .................................................................................. 5
FIGURE 4 OPPOSING RIGHT‐TURN‐ON‐RED .............................................................................................. 5
FIGURE 5 LEFT TURN PEDESTRIAN/BICYCLE FAR/NEAR SIDE ......................................................................... 6
FIGURE 6 LEFT TURN LANE OVERFLOW .................................................................................................... 6
FIGURE 7 BACK UP TO STOP LINE ............................................................................................................ 7
FIGURE 8 GAP ACCEPTANCE CONCEPT ..................................................................................................... 7
FIGURE 9 CRITICAL GAP ......................................................................................................................... 8
FIGURE 10 DETERMINATION OF THE CRITICAL GAP ..................................................................................... 9
FIGURE 11 CROSSING TOLERANCE ........................................................................................................... 9
FIGURE 12 TEST AND CONTROL SITES .................................................................................................... 10
FIGURE 13 AERIAL VIEW OF TEST SITE (BELCHER RD & NEBRASKA AVE) ....................................................... 11
FIGURE 14 AERIAL VIEW OF CONTROL SITE (BELCHER RD & TAMPA RD) ...................................................... 12
FIGURE 15 INTERSECTION ZONES FOR DATA COLLECTION ........................................................................... 13
FIGURE 16 INTERSECTION ZONES DELINEATED IN THE DATA COLLECTION APPLICATION .................................... 14
FIGURE 17 DYNAMIC MESSAGE SIGN INDICATING THE OPERATION OF THE FYA ............................................. 15
FIGURE 18 ROAD SIGN INDICATING THE FYA OPERATION .......................................................................... 15
FIGURE 19 VEHICLES TURNING LEFT DURING FYA OPERATION (BELCHER RD & NEBRASKA AVE ‐ SOUTHBOUND
APPROACH) ...................................................................................................................... 16
FIGURE 20 FYA OPERATION (BELCHER RD & NEBRASKA AVE ‐ SOUTHBOUND APPROACH) .............................. 17
FIGURE 21 BEFORE AND AFTER TRAFFIC PATTERNS AT BELCHER RD AND NEBRASKA AVE ................................. 18
FIGURE 22 BEFORE AND AFTER TRAFFIC PATTERNS AT BELCHER RD AND TAMPA RD ....................................... 19
FIGURE 23 95% CONFIDENCE INTERVALS FOR THE 15‐MINUTE VOLUMES AND P‐VALUES (AM) FOR THE
INTERSECTION OF BELCHER RD & NEBRASKA AVE .................................................................... 21
FIGURE 24 95% CONFIDENCE INTERVALS FOR THE 15‐MINUTE VOLUMES AND P‐VALUES (NOON) FOR THE
INTERSECTION OF BELCHER RD & NEBRASKA AVE .................................................................... 22
x
FIGURE 25 95% CONFIDENCE INTERVALS FOR THE 15‐MINUTE VOLUMES AND P‐VALUES (PM) FOR THE
INTERSECTION OF BELCHER RD & NEBRASKA AVE .................................................................... 24
FIGURE 26 THREE‐YEAR BEFORE IMPLEMENTATION OF FYA ACCIDENT COUNTS FOR THE STUDY INTERSECTIONS .. 24
FIGURE 27 COMPARISON OF TRAFFIC ACCIDENTS PER MONTH BY INTERSECTION AND ACCIDENT TYPE ................ 25
FIGURE 28 GAP ACCEPTANCE/REJECTION CHARTS BY DIRECTION AND TIME‐OF‐DAY FOR THE INTERSECTION OF
BELCHER RD AND NEBRASKA AVE ......................................................................................... 27
FIGURE 29 GAP ACCEPTANCE/REJECTION CHARTS BY DIRECTION AND TIME‐OF‐DAY FOR THE INTERSECTION OF
BELCHER RD AND TAMPA RD ............................................................................................... 28
FIGURE 30 CROSSING TOLERANCE FOR THE INTERSECTION OF BELCHER RD & NEBRASKA AVE ........................... 29
xi
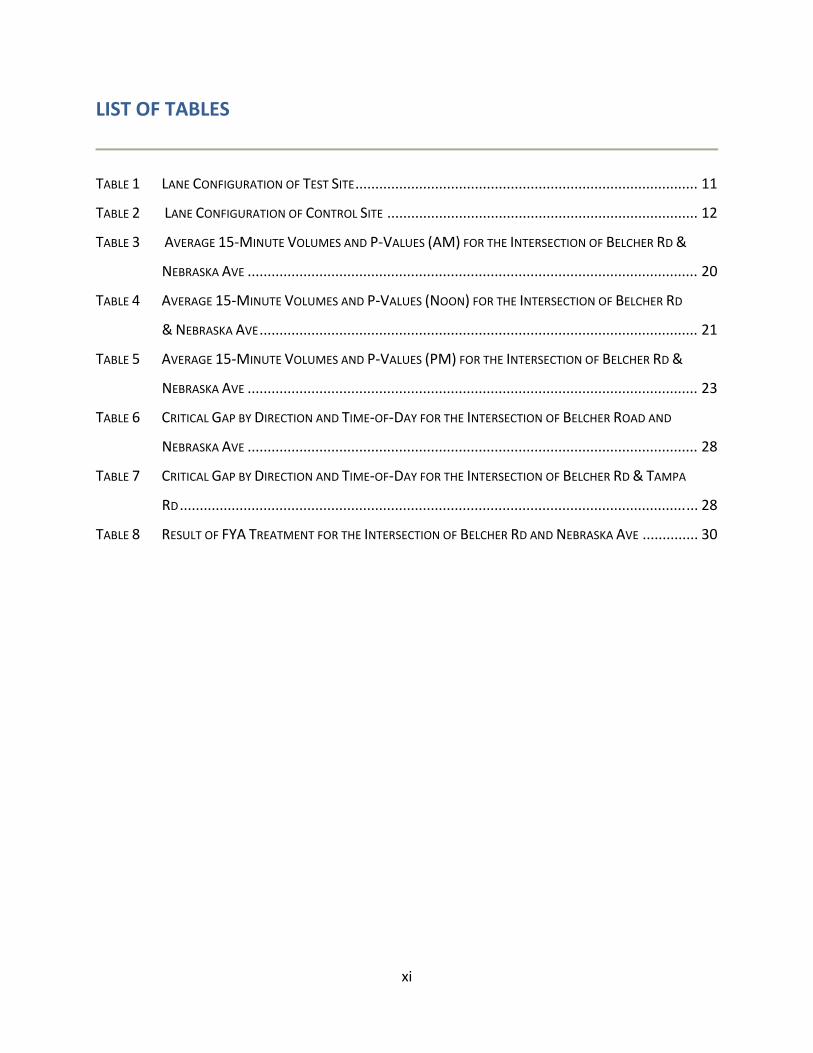
LIST OF TABLES
TABLE 1 LANE CONFIGURATION OF TEST SITE ...................................................................................... 11
TABLE 2 LANE CONFIGURATION OF CONTROL SITE .............................................................................. 12
TABLE 3 AVERAGE 15‐MINUTE VOLUMES AND P‐VALUES (AM) FOR THE INTERSECTION OF BELCHER RD &
NEBRASKA AVE ................................................................................................................. 20
TABLE 4 AVERAGE 15‐MINUTE VOLUMES AND P‐VALUES (NOON) FOR THE INTERSECTION OF BELCHER RD
& NEBRASKA AVE .............................................................................................................. 21
TABLE 5 AVERAGE 15‐MINUTE VOLUMES AND P‐VALUES (PM) FOR THE INTERSECTION OF BELCHER RD &
NEBRASKA AVE ................................................................................................................. 23
TABLE 6 CRITICAL GAP BY DIRECTION AND TIME‐OF‐DAY FOR THE INTERSECTION OF BELCHER ROAD AND
NEBRASKA AVE ................................................................................................................. 28
TABLE 7 CRITICAL GAP BY DIRECTION AND TIME‐OF‐DAY FOR THE INTERSECTION OF BELCHER RD & TAMPA
RD .................................................................................................................................. 28
TABLE 8 RESULT OF FYA TREATMENT FOR THE INTERSECTION OF BELCHER RD AND NEBRASKA AVE .............. 30
1
1 INTRODUCTION
With the interim approval of the Flashing Yellow Arrow (FYA) for Protected and Permissive Left Turns (PPLT) by the Federal Highway Administration (FHWA) and now by the Florida Department of Transportation (FDOT), Pinellas County is planning to implement an FYA at various locations in the county. The first location for implementation was the intersection of Belcher Rd and Nebraska Ave. The Center for Urban Transportation Research (CUTR) at the University of South Florida (USF) was hired by Pinellas County to conduct a before and after study to assess the potential safety effects of the FYA on permissive left turns. The FYA was implemented on November 7, 2009. The CUTR research team collected video data at the test intersection one month prior to and two months after the implementation of the FYA. The data was collected for the morning, noon, and evening periods. A nearby intersection (Belcher Rd and Tampa Rd) with similar variables was used as a control site for comparison. The major objective for this before and after study of implementing the FYA is to assess the effectiveness and benefits of the FYA to improve the safety of permissive left turns at selected signalized intersections. The main objectives of this study are as follows:
• Establish short‐term performance measures to evaluate the driver responses before and after the implementation of FYA operation.
• Collect and analyze traffic data to evaluate the short‐term safety effects of the
implementation of the FYA operation.
• Provide a mechanism for the long‐term evaluation of safety effects for the FYA operation for PPLT.

2
2 RELATED STUDIES
The National Cooperative Highway Research Program (NCHRP) Report 493 (Brehmer, Kacir, Noyce, and Manser, 2003) is the most comprehensive source of information on FYA indication for PPLT signal phasing. NCHRP Report 493 comprised extensive testing of signal displays, human factors, and field implementation of different green light configurations and FYA displays. The study recommended that FYA should be used with exclusive heads and placed over the left turn lane. This type of configuration was rated higher in terms of safety, drivers’ perception, and operations. The study also recommended incorporating FYA displays into the Manual of Uniform Traffic Control Devices (MUTCD). NCHRP Web‐Only Document 123 (Noyce, Bergh, and Chapman, 2007) summarized the results of a follow‐up study recommended by NCHRP Project 493. The study evaluated crash data from 50 intersections nationwide. One of the criteria for selecting the study intersections was data availability. Only intersections with at least one year of FYA implementation were chosen for analysis. Crash data was used as the main performance variable to evaluate the effectiveness of the FYA operation. The main findings of the follow‐up study for FYA operation are summarized as follows:
• Safety was improved at intersections that operated with PPLT before the field implementation of the FYA indication and continued with such operation afterwards.
• Safety was not improved at intersections that operated with protected only left turn phasing before the implementation of the protected and permissive operation with FYA.
Short‐term analysis involved conflict rate analysis, follow‐up headway, and driver hesitation as indicators of changes in the driver’s behavior due to FYA display for PPLT operation. For long term analyses, crash data was the main performance measure used to evaluate safety on field implementations of FYA signal displays. Drivers’ perceptions/reactions were measured under controlled conditions in a simulated environment. No naturalistic driving studies have been performed to evaluate drivers’ perceptions of FYA displays for PPLT. Binomial sign tests, Bayesian analysis, and linear models were used as statistical tools to evaluate the long‐term effects of the FYA implementation.
3
3 PERFORMANCE MEASURES
A comprehensive evaluation of FYA displays for PPLT operations was presented in the NCHRP Web‐Only Document 123 (Noyce et al., 2007). In general, traffic crashes are used as the main performance measure to evaluate the effect on traffic safety for FYA displays. In the present study, performance measures related to gap acceptance behavior were proposed. These measures were aimed at finding a consistent indication of short‐term behavioral changes due to the implementation of the FYA operation for PPLT. 3.1 Crash Data Crash data is the main performance measure for traffic safety evaluation. Ideally, crash data three years prior to and three years after the implementation of the FYA display should be used to produce a reliable assessment of its operation. The accident data should be carefully formatted to include only left‐turn‐related accidents. This is especially important for those accidents that may be influenced or caused by DUI (driving under the influence) or other circumstances that may affect the quality of the analysis. The most common harmful events that can be associated with permissive left turns are as follows: • Rear end collisions • Head‐on collisions • Angle collisions • Left turn collisions • Right‐turn collisions • Collisions with pedestrian/bicycle • Sideswipe collisions • Collisions with fixed object 3.2 Traffic Conflicts A traffic conflict is defined as a traffic event involving the interaction of two or more motor vehicles, where one or both drivers must take an evasive action (e.g., braking) to avoid a collision. When one of the road users does not take an evasive action, this event results in an accident. The definitions from traffic conflicts were adapted from Parker and Zegeer (1989). Traffic conflict counts were used to estimate traffic safety because crash rates were not available for the after period. The conflicts related to permissive left turns are as follows (Brehmer et al.,2003): • Opposing left turn • Left turn same direction • Lane‐change same direction • Opposing right‐turn‐on‐red • Left turn pedestrian/bicycle far/near side • Left turn lane overflow

4
Opposing Left Turn An opposing left turn conflict (see Figure 1) occurs when a vehicle makes a left turn, thus placing a through vehicle in the opposite direction in danger of a head‐on or right/left/angle‐side collision. In this conflict situation, the through vehicle is presumed to have the right‐of‐way, and this right‐of‐way is threatened by the left turn vehicle.
Figure 1 Opposing Left Turn Conflict
Left Turn Same Direction A left turn, same direction conflict occurs when the first vehicle slows to make a left turn placing the following vehicle in danger of a rear‐end collision (see Figure 2).
Figure 2 Left Turn Same Direction Conflict

5
Lane‐Change Same Direction A lane‐change conflict (see Figure 3) occurs when a vehicle initially attempting to make a left turn suddenly changes lanes to continue through the intersection, thus placing a through vehicle in the new lane in danger of a rear‐end or sideswipe collision.
Figure 3 Lane Change Same Direction Conflict
Opposing Right‐Turn‐on‐Red A right turn conflict (see Figure 4) occurs when an opposing vehicle makes a right turn, thus placing the left turn vehicle on the main street in jeopardy of a right/left‐side or rear‐end collision.
Figure 4 Opposing Right‐Turn‐on‐Red
Left Turn Pedestrian/Bicycle Far/Near Side Pedestrian (pedestrian or bicyclist) conflicts (see Figure 5) occur when a pedestrian crosses in front of a vehicle that has the right‐of‐way, thus creating a possible collision situation. The vehicle brakes or swerves, then continues through the intersection area. It is assumed that the

6
vehicle is causing the conflict. It is important to note that pedestrian’s movements on the right and left sides of the intersection are generally not considered to create conflict situations if the movements have the right‐of‐way, such as during a WALK phase.
Figure 5 Left Turn Pedestrian/Bicycle Far/Near Side
Left Turn Lane Overflow Left turn overflow (see Figure 6) occurs when the length of a left turn bay provides a smaller capacity than the traffic demand for left turns. This overflow blocks the straight‐through traffic lane placing a following vehicle in the same lane in danger of a rear‐end collision.
Figure 6 Left Turn Lane Overflow
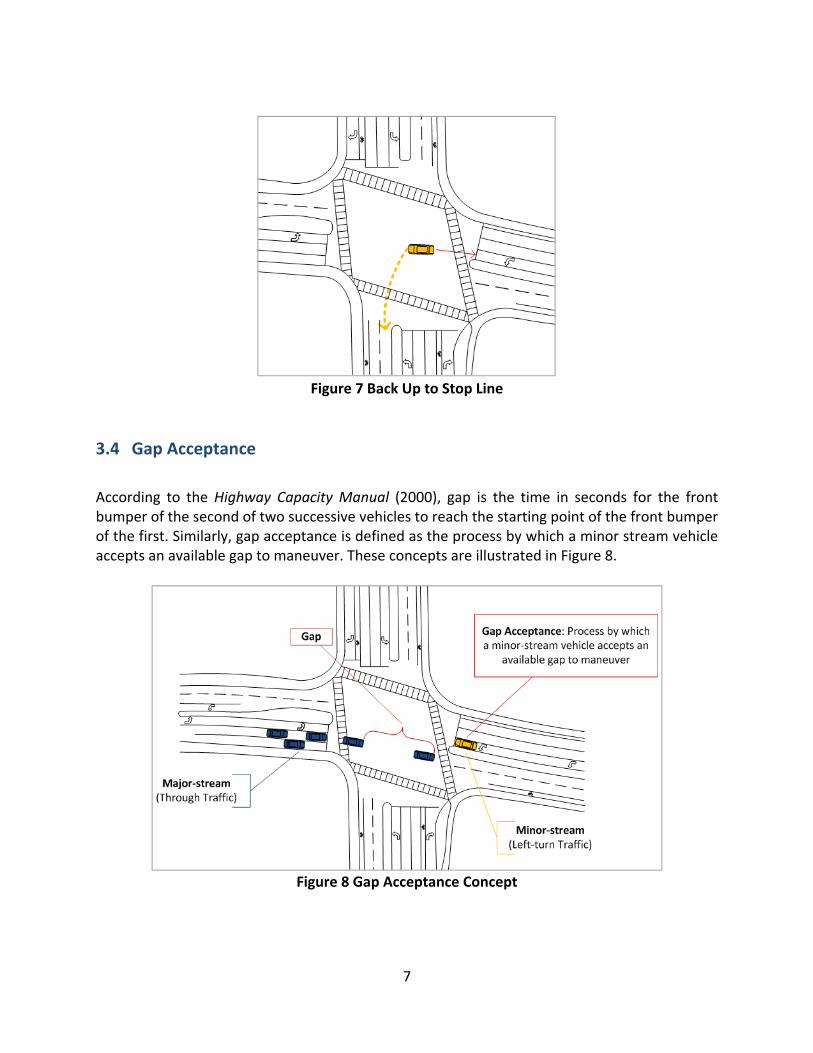
3.3 Other Events In addition to the main traffic conflicts, events of particular interest can be registered such as backing up to the stop line (see Figure 7). This could happen when a turning vehicle during a permissive phase gets trapped past the stop line but without crossing into the intersection. In some cases, the driver needs to back up to clear the intersection for the next movement.
7
Figure 7 Back Up to Stop Line
3.4 Gap Acceptance According to the Highway Capacity Manual (2000), gap is the time in seconds for the front bumper of the second of two successive vehicles to reach the starting point of the front bumper of the first. Similarly, gap acceptance is defined as the process by which a minor stream vehicle accepts an available gap to maneuver. These concepts are illustrated in Figure 8.
Figure 8 Gap Acceptance Concept
8
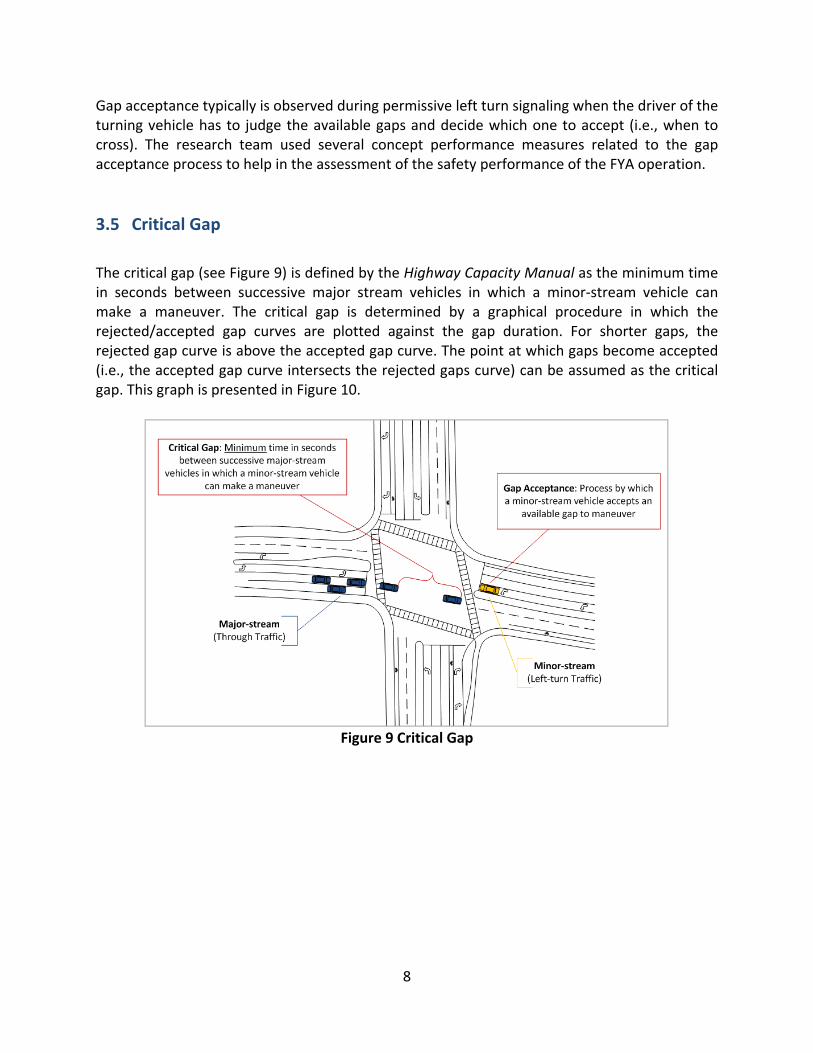
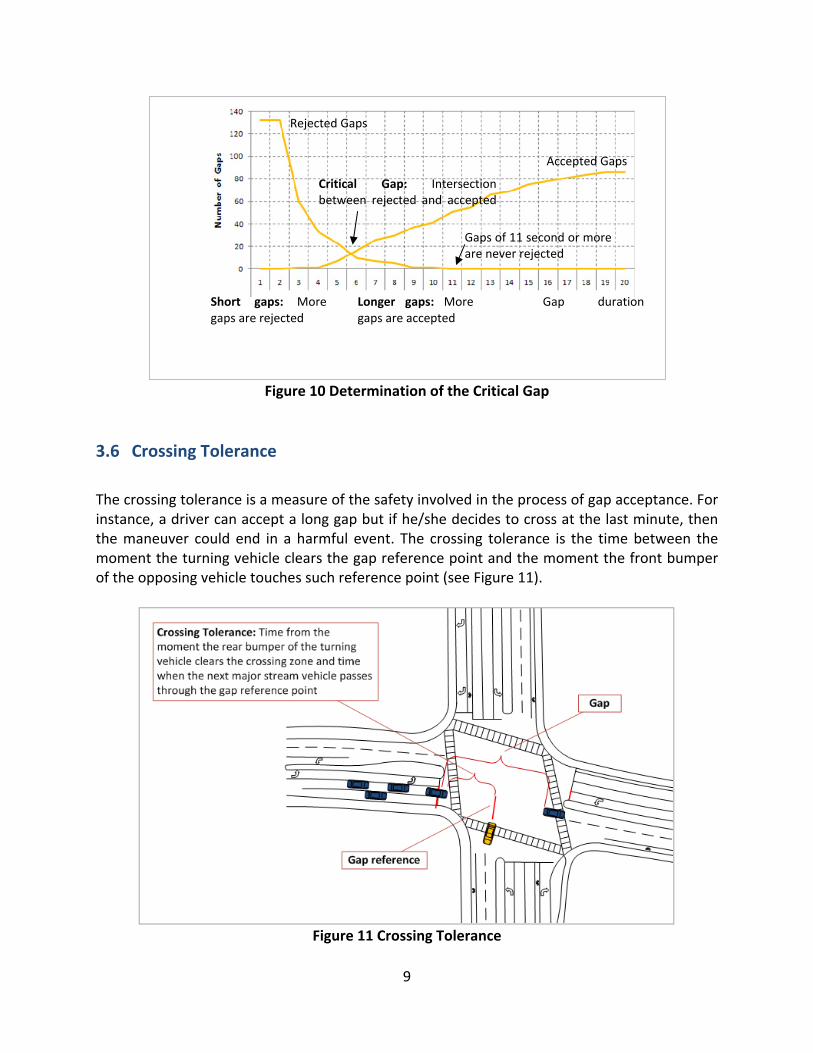
Gap acceptance typically is observed during permissive left turn signaling when the driver of the turning vehicle has to judge the available gaps and decide which one to accept (i.e., when to cross). The research team used several concept performance measures related to the gap acceptance process to help in the assessment of the safety performance of the FYA operation. 3.5 Critical Gap The critical gap (see Figure 9) is defined by the Highway Capacity Manual as the minimum time in seconds between successive major stream vehicles in which a minor‐stream vehicle can make a maneuver. The critical gap is determined by a graphical procedure in which the rejected/accepted gap curves are plotted against the gap duration. For shorter gaps, the rejected gap curve is above the accepted gap curve. The point at which gaps become accepted (i.e., the accepted gap curve intersects the rejected gaps curve) can be assumed as the critical gap. This graph is presented in Figure 10.
Figure 9 Critical Gap
9
Figure 10 Determination of the Critical Gap
3.6 Crossing Tolerance The crossing tolerance is a measure of the safety involved in the process of gap acceptance. For instance, a driver can accept a long gap but if he/she decides to cross at the last minute, then the maneuver could end in a harmful event. The crossing tolerance is the time between the moment the turning vehicle clears the gap reference point and the moment the front bumper of the opposing vehicle touches such reference point (see Figure 11).
Figure 11 Crossing Tolerance
Accepted Gaps
Rejected Gaps
Gap durationShort gaps: More gaps are rejected
Longer gaps: More gaps are accepted
Gaps of 11 second or moreare never rejected
Critical Gap: Intersectionbetween rejected and accepted
10
4 RESEARCH APPROACH
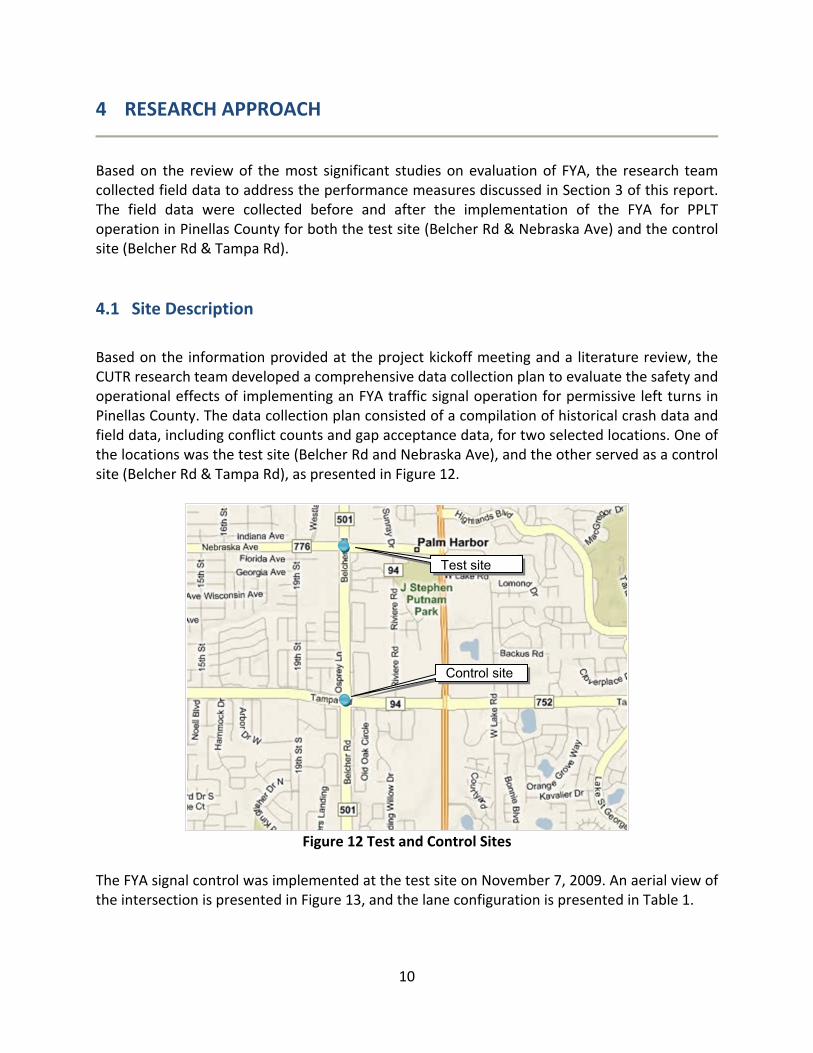
Based on the review of the most significant studies on evaluation of FYA, the research team collected field data to address the performance measures discussed in Section 3 of this report. The field data were collected before and after the implementation of the FYA for PPLT operation in Pinellas County for both the test site (Belcher Rd & Nebraska Ave) and the control site (Belcher Rd & Tampa Rd). 4.1 Site Description Based on the information provided at the project kickoff meeting and a literature review, the CUTR research team developed a comprehensive data collection plan to evaluate the safety and operational effects of implementing an FYA traffic signal operation for permissive left turns in Pinellas County. The data collection plan consisted of a compilation of historical crash data and field data, including conflict counts and gap acceptance data, for two selected locations. One of the locations was the test site (Belcher Rd and Nebraska Ave), and the other served as a control site (Belcher Rd & Tampa Rd), as presented in Figure 12.
Figure 12 Test and Control Sites
The FYA signal control was implemented at the test site on November 7, 2009. An aerial view of the intersection is presented in Figure 13, and the lane configuration is presented in Table 1.
Test site
Control site
11
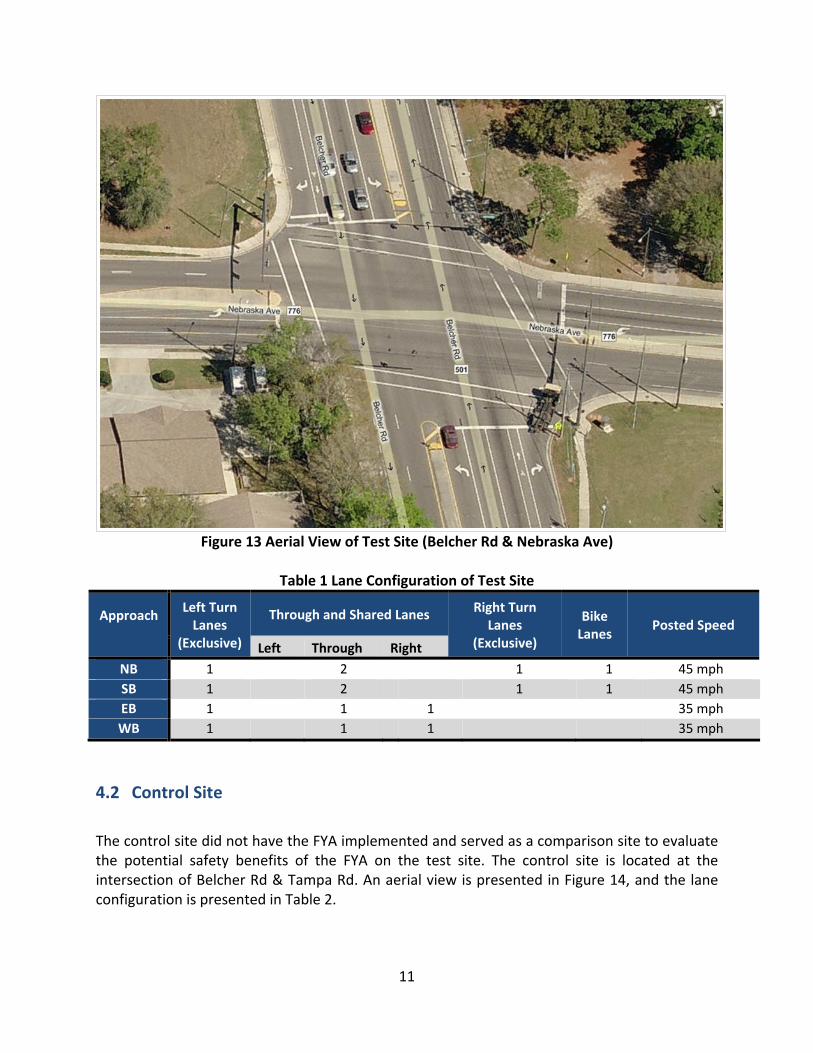
Figure 13 Aerial View of Test Site (Belcher Rd & Nebraska Ave)
Table 1 Lane Configuration of Test Site
Approach
Left Turn Lanes
(Exclusive)
Through and Shared Lanes Right Turn Lanes
(Exclusive)
Bike Lanes Posted Speed
Left Through RightNB 1 2 1 1 45 mphSB 1 2 1 1 45 mphEB 1 1 1 35 mphWB 1 1 1 35 mph
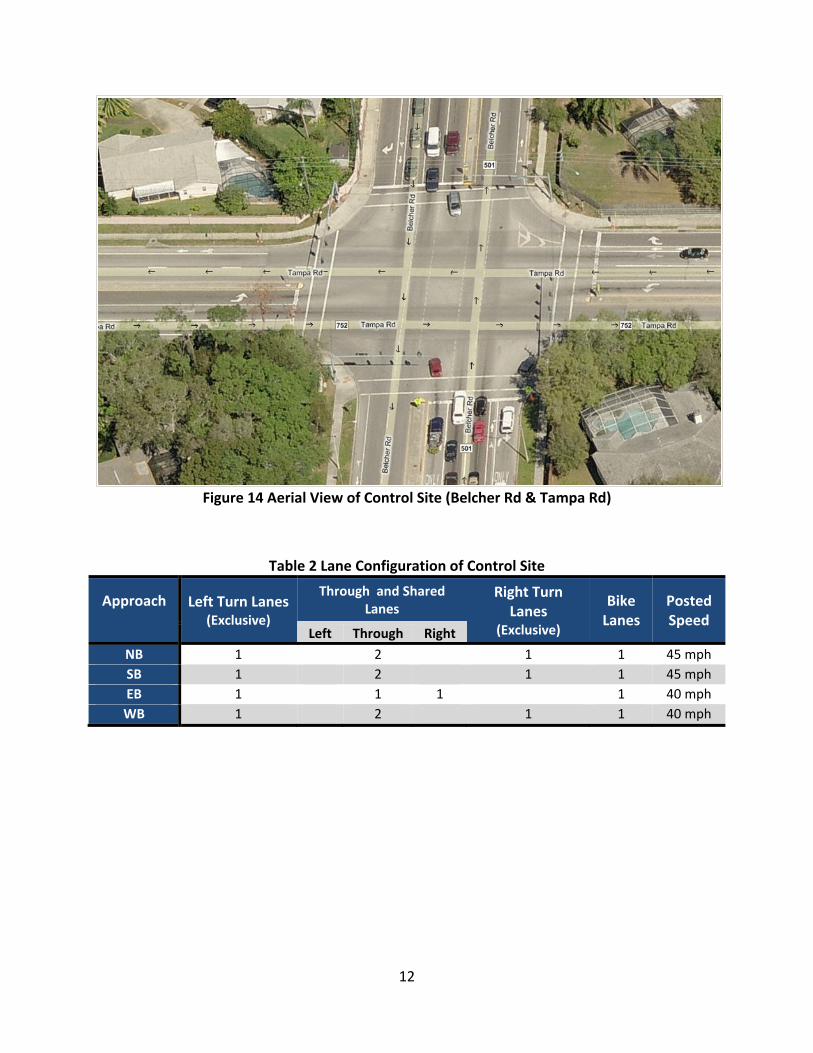
4.2 Control Site The control site did not have the FYA implemented and served as a comparison site to evaluate the potential safety benefits of the FYA on the test site. The control site is located at the intersection of Belcher Rd & Tampa Rd. An aerial view is presented in Figure 14, and the lane configuration is presented in Table 2.
12
Figure 14 Aerial View of Control Site (Belcher Rd & Tampa Rd)
Table 2 Lane Configuration of Control Site
Approach
Left Turn Lanes (Exclusive)
Through and Shared Lanes
Right Turn Lanes
(Exclusive)
Bike Lanes
Posted Speed
Left Through RightNB 1 2 1 1 45 mphSB 1 2 1 1 45 mphEB 1 1 1 1 40 mphWB 1 2 1 1 40 mph
13
5 Data Collection
This section presents the methodology used to obtain data on the selected performance measures. Initial field observations performed during the first weekday immediately after the implementation of the FYA display are presented. 5.1 Data Collection Methodology
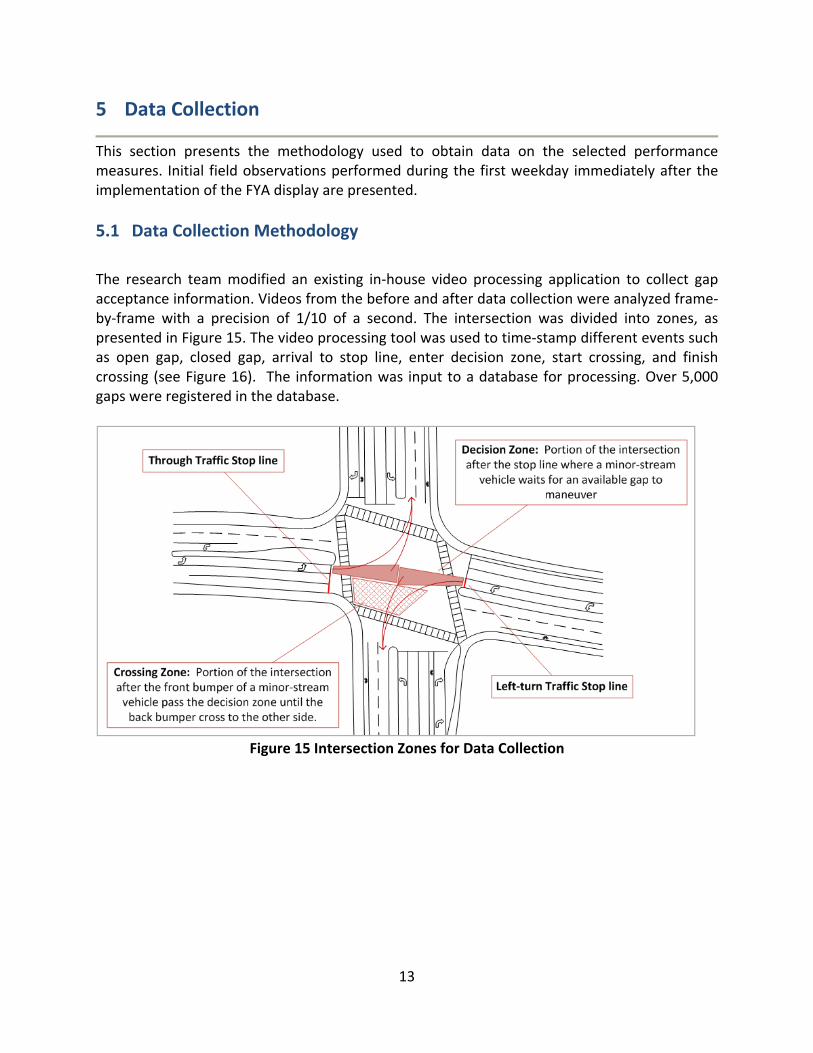
The research team modified an existing in‐house video processing application to collect gap acceptance information. Videos from the before and after data collection were analyzed frame‐by‐frame with a precision of 1/10 of a second. The intersection was divided into zones, as presented in Figure 15. The video processing tool was used to time‐stamp different events such as open gap, closed gap, arrival to stop line, enter decision zone, start crossing, and finish crossing (see Figure 16). The information was input to a database for processing. Over 5,000 gaps were registered in the database.
Figure 15 Intersection Zones for Data Collection

14
Figure 16 Intersection Zones Delineated in the Data Collection Application
15
5.2 Implementation of the Flashing Yellow Arrow Operation
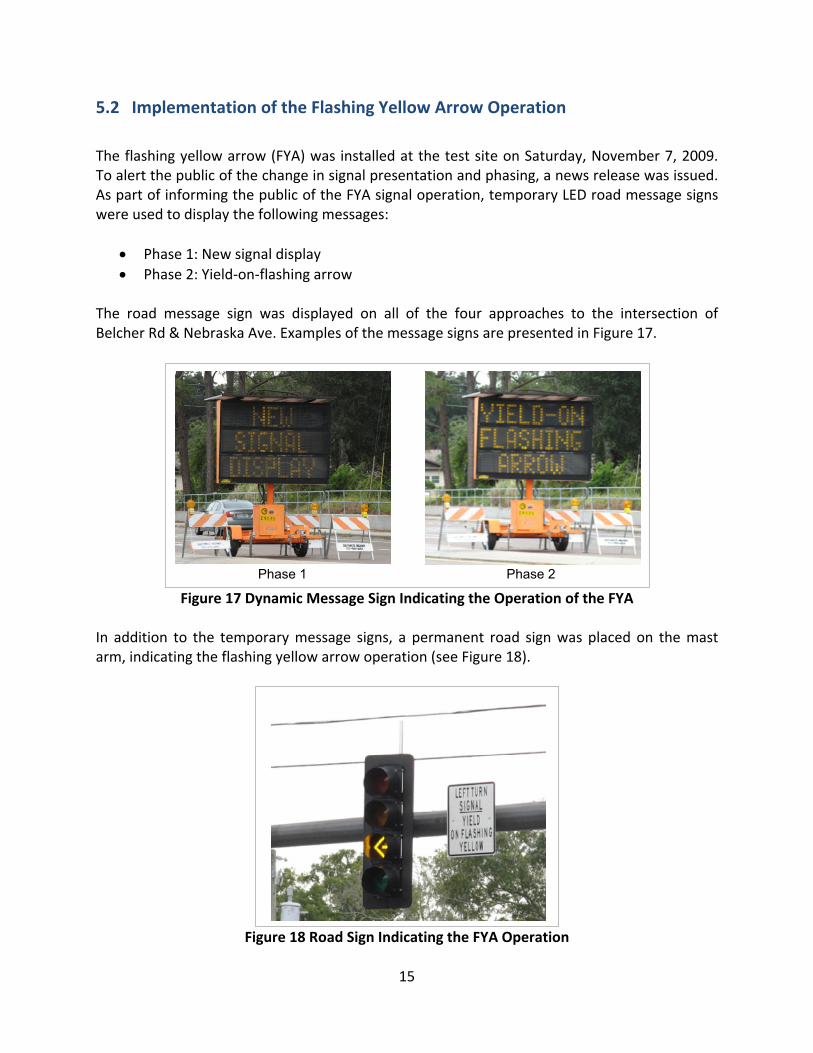
The flashing yellow arrow (FYA) was installed at the test site on Saturday, November 7, 2009. To alert the public of the change in signal presentation and phasing, a news release was issued. As part of informing the public of the FYA signal operation, temporary LED road message signs were used to display the following messages:
• Phase 1: New signal display • Phase 2: Yield‐on‐flashing arrow
The road message sign was displayed on all of the four approaches to the intersection of Belcher Rd & Nebraska Ave. Examples of the message signs are presented in Figure 17.
Figure 17 Dynamic Message Sign Indicating the Operation of the FYA
In addition to the temporary message signs, a permanent road sign was placed on the mast arm, indicating the flashing yellow arrow operation (see Figure 18).
Figure 18 Road Sign Indicating the FYA Operation
Phase 1 Phase 2
16
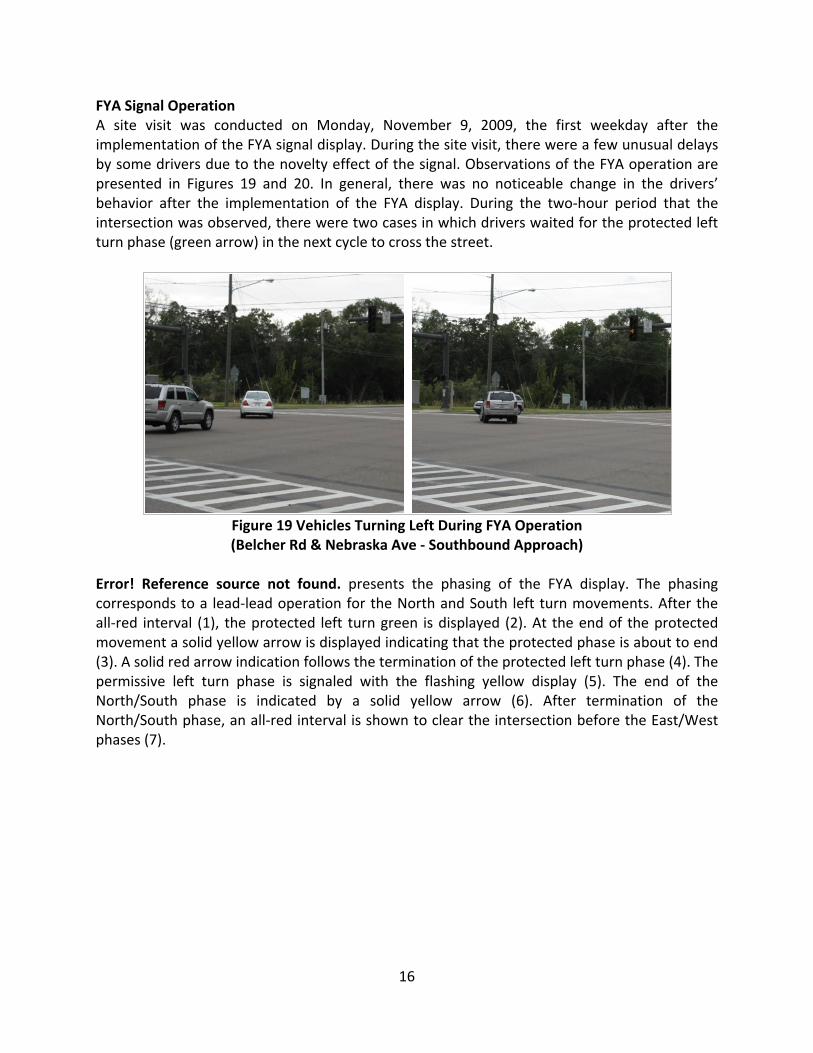
FYA Signal Operation A site visit was conducted on Monday, November 9, 2009, the first weekday after the implementation of the FYA signal display. During the site visit, there were a few unusual delays by some drivers due to the novelty effect of the signal. Observations of the FYA operation are presented in Figures 19 and 20. In general, there was no noticeable change in the drivers’ behavior after the implementation of the FYA display. During the two‐hour period that the intersection was observed, there were two cases in which drivers waited for the protected left turn phase (green arrow) in the next cycle to cross the street.
Figure 19 Vehicles Turning Left During FYA Operation (Belcher Rd & Nebraska Ave ‐ Southbound Approach)
Error! Reference source not found. presents the phasing of the FYA display. The phasing corresponds to a lead‐lead operation for the North and South left turn movements. After the all‐red interval (1), the protected left turn green is displayed (2). At the end of the protected movement a solid yellow arrow is displayed indicating that the protected phase is about to end (3). A solid red arrow indication follows the termination of the protected left turn phase (4). The permissive left turn phase is signaled with the flashing yellow display (5). The end of the North/South phase is indicated by a solid yellow arrow (6). After termination of the North/South phase, an all‐red interval is shown to clear the intersection before the East/West phases (7).

17
Figure 20 FYA Operation (Belcher Rd & Nebraska Ave ‐ Southbound Approach)
1. All red
2. Protected left turn (green arrow)
3. End of protected left turn (solid yellow arrow)
5. Permitted left turn (flashing yellow arrow)
6. All yellow (solid yellow arrow)
7. All red
4. End of protected left turn (solid red arrow)
18
6 RESULTS
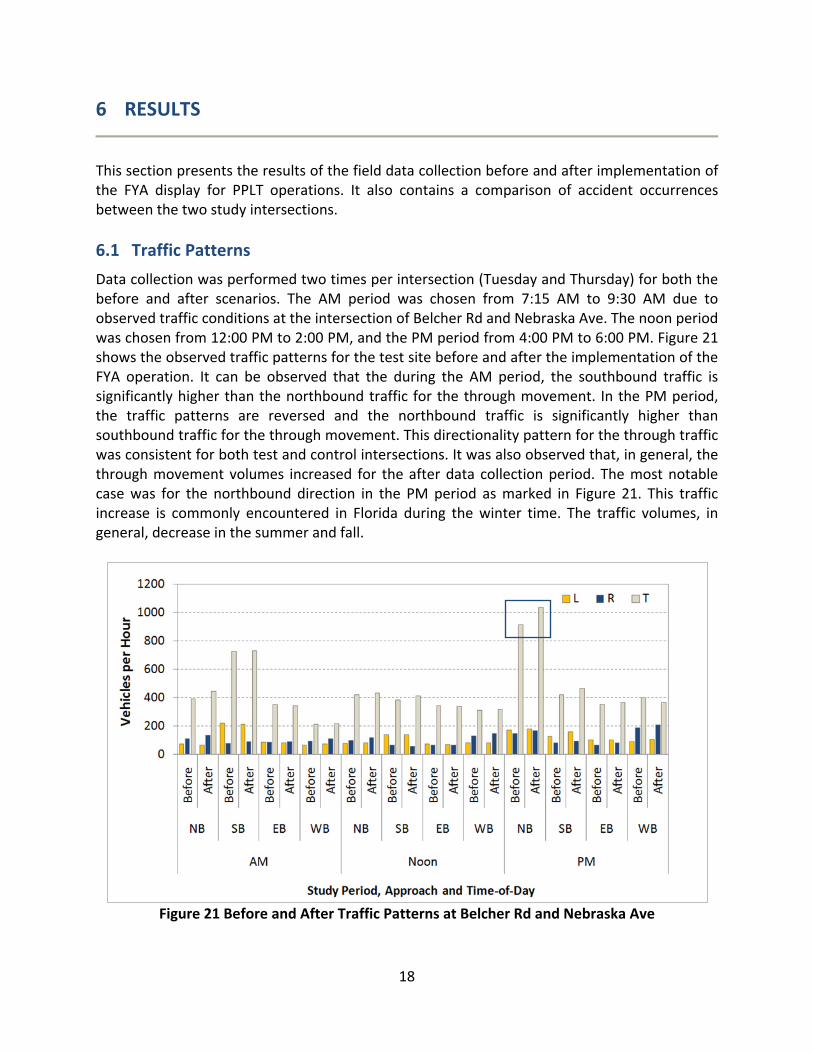
This section presents the results of the field data collection before and after implementation of the FYA display for PPLT operations. It also contains a comparison of accident occurrences between the two study intersections. 6.1 Traffic Patterns Data collection was performed two times per intersection (Tuesday and Thursday) for both the before and after scenarios. The AM period was chosen from 7:15 AM to 9:30 AM due to observed traffic conditions at the intersection of Belcher Rd and Nebraska Ave. The noon period was chosen from 12:00 PM to 2:00 PM, and the PM period from 4:00 PM to 6:00 PM. Figure 21 shows the observed traffic patterns for the test site before and after the implementation of the FYA operation. It can be observed that the during the AM period, the southbound traffic is significantly higher than the northbound traffic for the through movement. In the PM period, the traffic patterns are reversed and the northbound traffic is significantly higher than southbound traffic for the through movement. This directionality pattern for the through traffic was consistent for both test and control intersections. It was also observed that, in general, the through movement volumes increased for the after data collection period. The most notable case was for the northbound direction in the PM period as marked in Figure 21. This traffic increase is commonly encountered in Florida during the winter time. The traffic volumes, in general, decrease in the summer and fall.
Figure 21 Before and After Traffic Patterns at Belcher Rd and Nebraska Ave

19
Figure 22 shows the observed traffic patterns for the control site. It can be observed that the NB movement also increased for the after data collection for the PM period. A detailed statistical analysis is provided in Tables 3, 4, and 5 for the test intersection. For the control intersection, the traffic pattern comparison results are in Appendix A. Note that the Belcher Rd & Tampa Rd intersection was plotted using the before and after naming convention for consistency between the two figures. In the intersection at Tampa Rd, the permissive left turn is displayed with the traditional green ball indication.
Figure 22 Before and After Traffic Patterns at Belcher Rd and Tampa Rd
6.2 Before and After Comparison of Traffic Patterns
To obtain a better assessment of the impact of the FYA display, it is necessary to analyze the before and after conditions carefully. The effect of the FYA operation could be masked by changes in traffic patterns or other factors such as geometry. Table 3 and Figure 23 present a statistical analysis for the change in traffic patterns for 15‐minute volume counts for the intersection of Belcher Rd & Nebraska Ave. By examining the p‐values on Table 3, NBR is significant at a confidence level of 0.1. However, the second lowest p‐value is 0.14, corresponding to NBT. This means that the opposing traffic for the SBL increased almost to the point to become significant. Based on the confidence interval in Figure 23, it can be said that the 15‐minute traffic volumes could have increased significantly during some intervals making it difficult for the left turning vehicles to find wide gaps during the permissive phase.
20
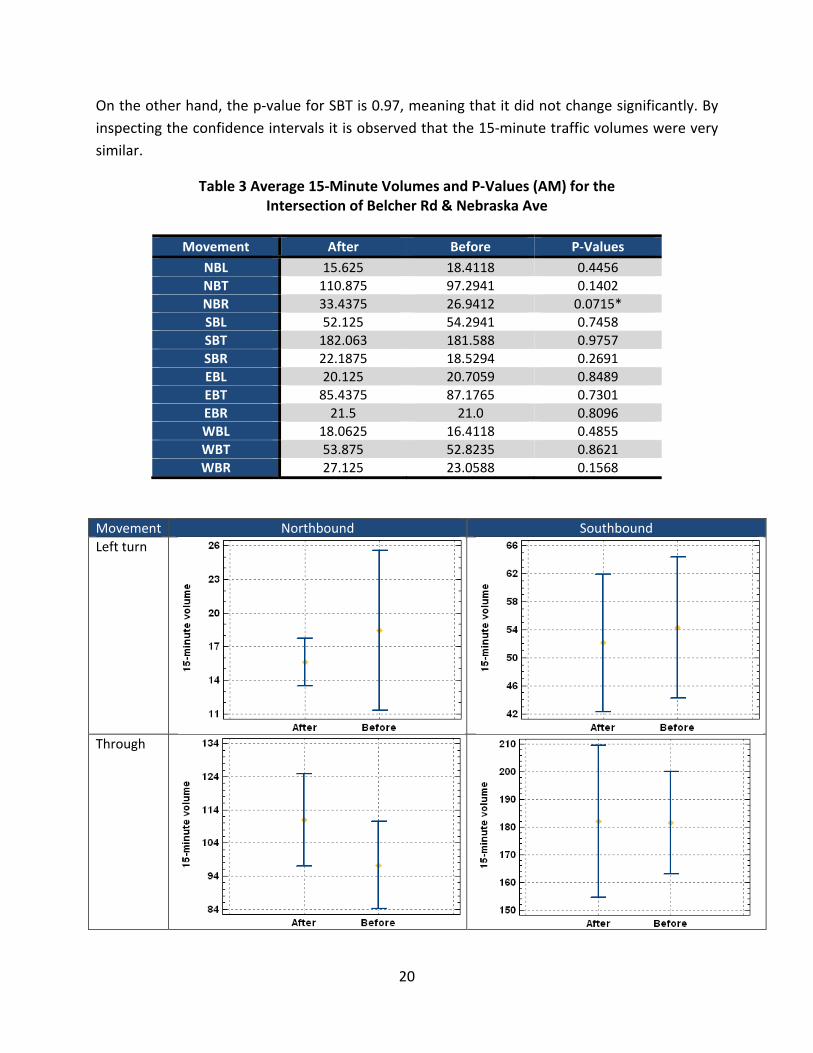
On the other hand, the p‐value for SBT is 0.97, meaning that it did not change significantly. By inspecting the confidence intervals it is observed that the 15‐minute traffic volumes were very similar.
Table 3 Average 15‐Minute Volumes and P‐Values (AM) for the Intersection of Belcher Rd & Nebraska Ave
Movement After Before P‐Values
NBL 15.625 18.4118 0.4456 NBT 110.875 97.2941 0.1402 NBR 33.4375 26.9412 0.0715* SBL 52.125 54.2941 0.7458 SBT 182.063 181.588 0.9757 SBR 22.1875 18.5294 0.2691 EBL 20.125 20.7059 0.8489 EBT 85.4375 87.1765 0.7301 EBR 21.5 21.0 0.8096 WBL 18.0625 16.4118 0.4855 WBT 53.875 52.8235 0.8621 WBR 27.125 23.0588 0.1568
Movement Northbound Southbound Left turn
Through
21
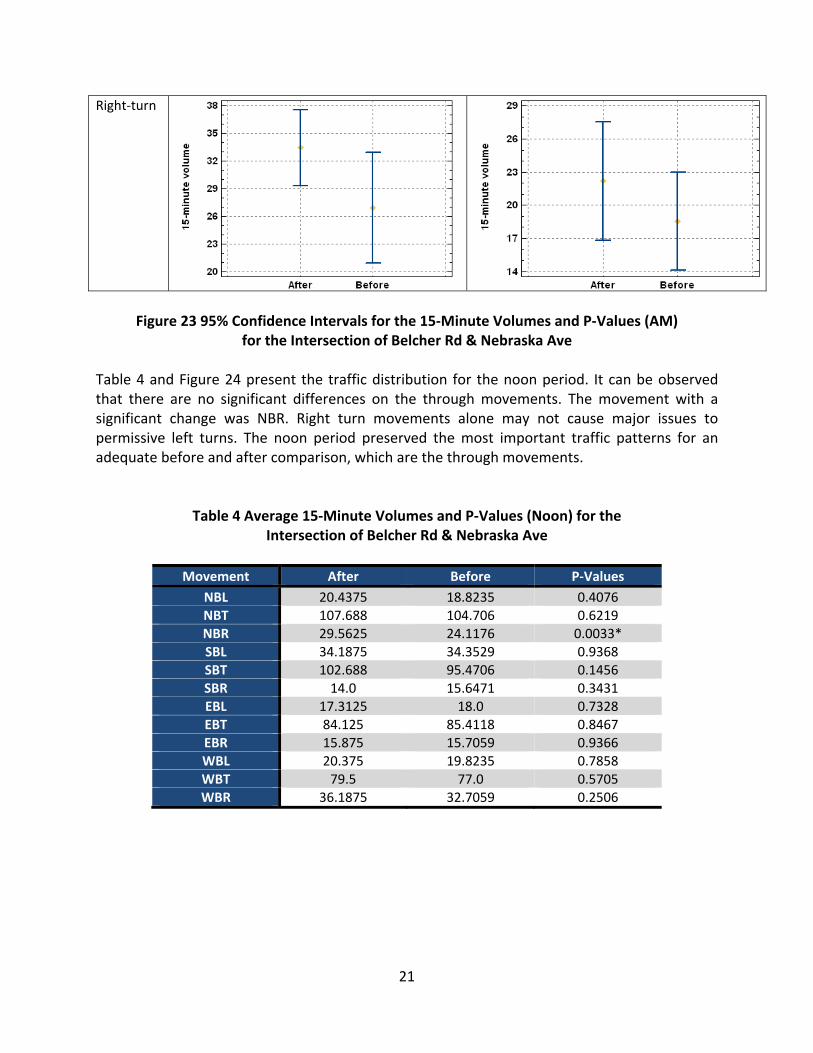
Right‐turn
Figure 23 95% Confidence Intervals for the 15‐Minute Volumes and P‐Values (AM)
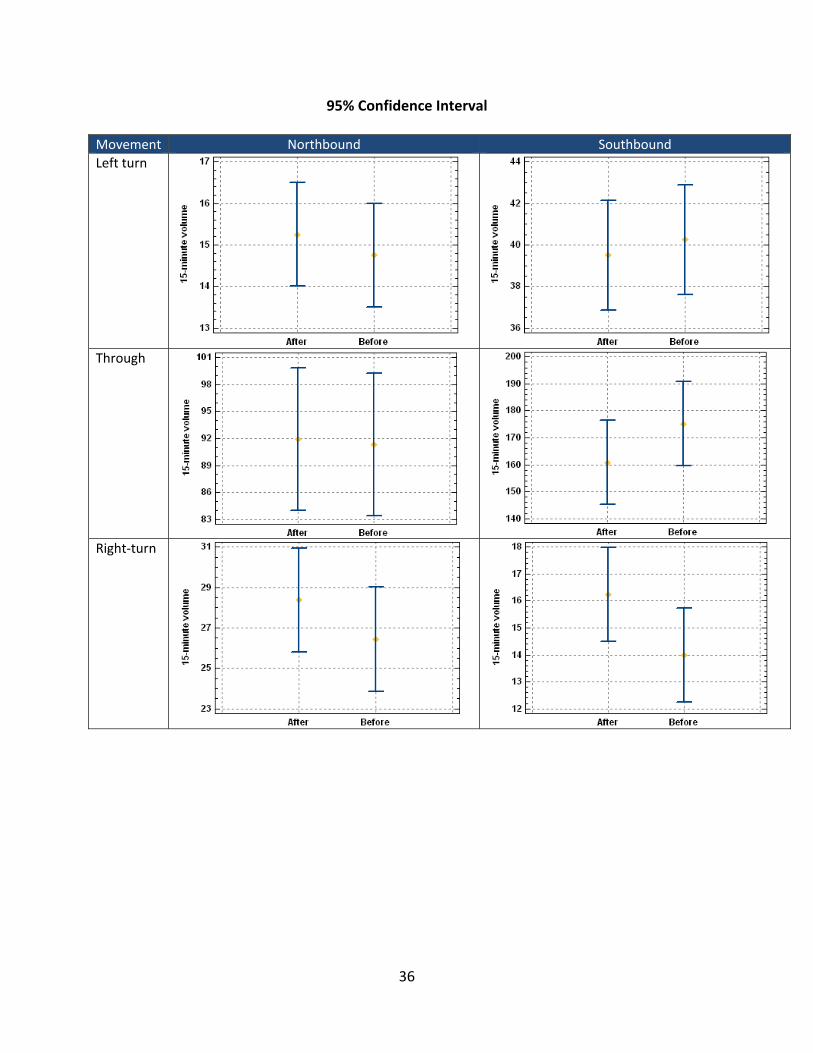
for the Intersection of Belcher Rd & Nebraska Ave Table 4 and Figure 24 present the traffic distribution for the noon period. It can be observed that there are no significant differences on the through movements. The movement with a significant change was NBR. Right turn movements alone may not cause major issues to permissive left turns. The noon period preserved the most important traffic patterns for an adequate before and after comparison, which are the through movements.
Table 4 Average 15‐Minute Volumes and P‐Values (Noon) for the Intersection of Belcher Rd & Nebraska Ave
Movement After Before P‐Values
NBL 20.4375 18.8235 0.4076 NBT 107.688 104.706 0.6219 NBR 29.5625 24.1176 0.0033* SBL 34.1875 34.3529 0.9368 SBT 102.688 95.4706 0.1456 SBR 14.0 15.6471 0.3431 EBL 17.3125 18.0 0.7328 EBT 84.125 85.4118 0.8467 EBR 15.875 15.7059 0.9366 WBL 20.375 19.8235 0.7858 WBT 79.5 77.0 0.5705 WBR 36.1875 32.7059 0.2506
22
Movement Northbound SouthboundLeft turn
Through
Right‐turn
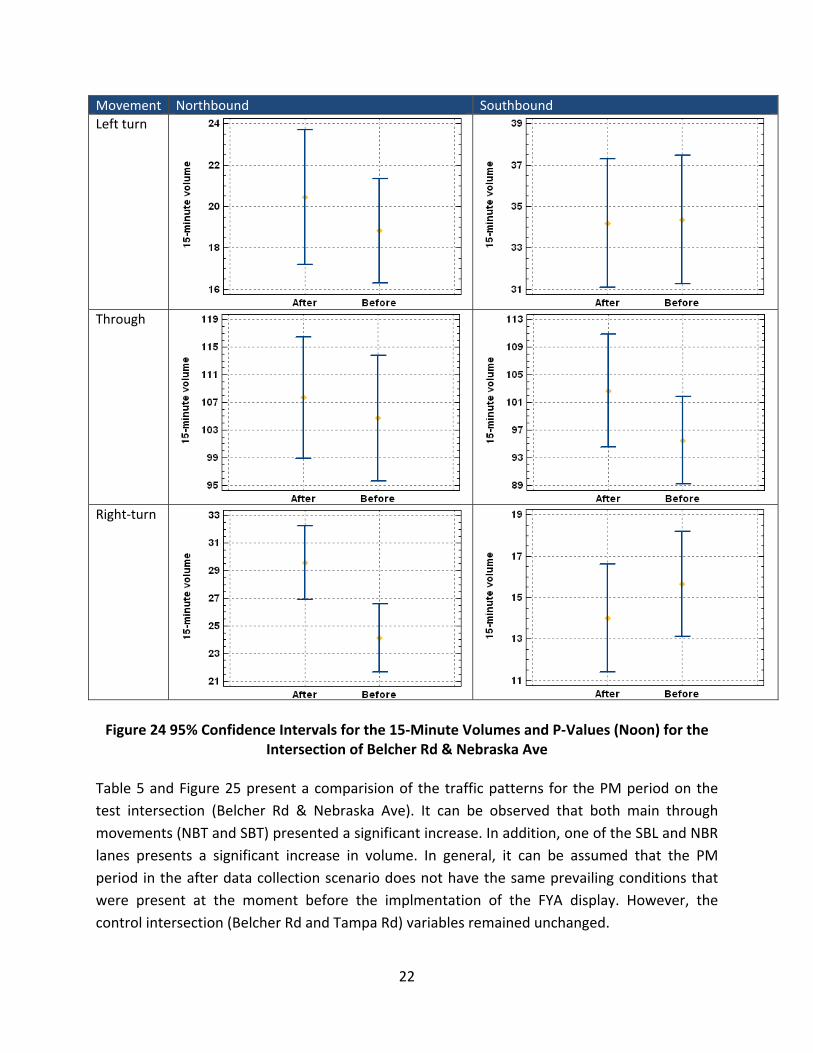
Figure 24 95% Confidence Intervals for the 15‐Minute Volumes and P‐Values (Noon) for the
Intersection of Belcher Rd & Nebraska Ave
Table 5 and Figure 25 present a comparision of the traffic patterns for the PM period on the test intersection (Belcher Rd & Nebraska Ave). It can be observed that both main through movements (NBT and SBT) presented a significant increase. In addition, one of the SBL and NBR lanes presents a significant increase in volume. In general, it can be assumed that the PM period in the after data collection scenario does not have the same prevailing conditions that were present at the moment before the implmentation of the FYA display. However, the control intersection (Belcher Rd and Tampa Rd) variables remained unchanged.
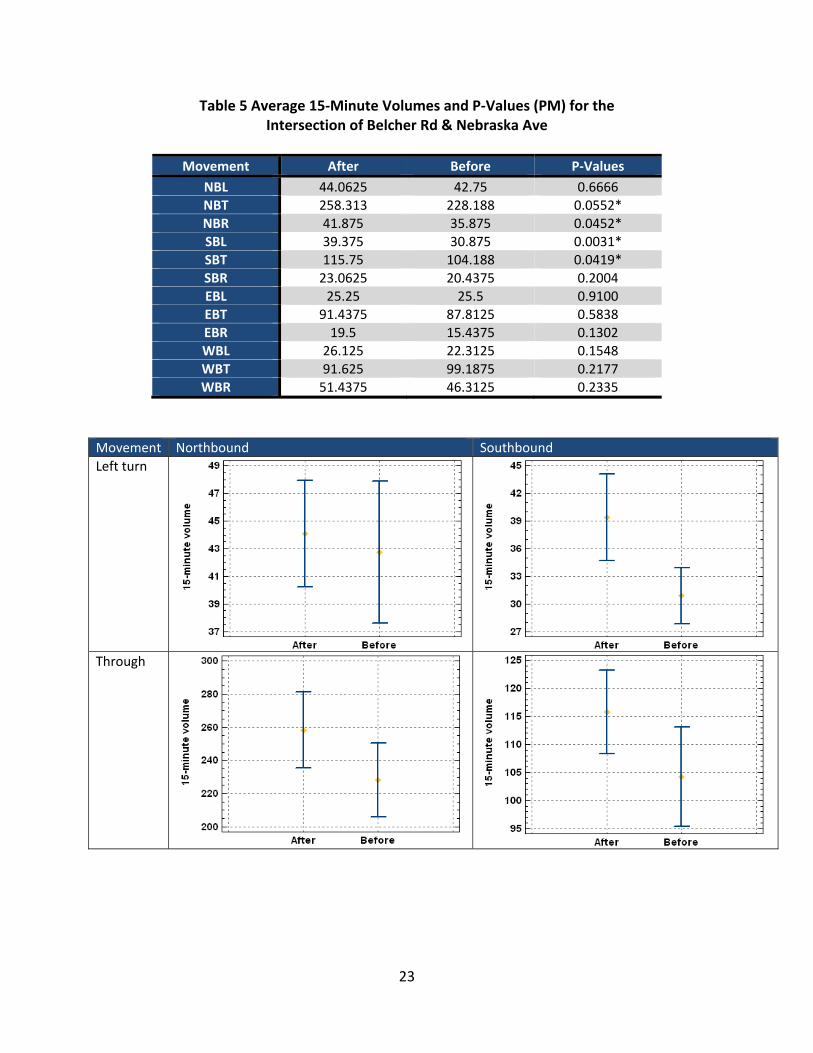
23
Table 5 Average 15‐Minute Volumes and P‐Values (PM) for the Intersection of Belcher Rd & Nebraska Ave
Movement After Before P‐Values
NBL 44.0625 42.75 0.6666 NBT 258.313 228.188 0.0552* NBR 41.875 35.875 0.0452* SBL 39.375 30.875 0.0031* SBT 115.75 104.188 0.0419* SBR 23.0625 20.4375 0.2004 EBL 25.25 25.5 0.9100 EBT 91.4375 87.8125 0.5838 EBR 19.5 15.4375 0.1302 WBL 26.125 22.3125 0.1548 WBT 91.625 99.1875 0.2177 WBR 51.4375 46.3125 0.2335
Movement Northbound SouthboundLeft turn
Through

24
Right‐turn
Figure 25 95% Confidence Intervals for the 15‐Minute Volumes and P‐Values (PM) for the
Intersection of Belcher Rd & Nebraska Ave 6.3 Traffic Accidents Crash data was obtained for the three‐year period prior to the implementation of the FYA display for PPLT operation. The data was then examined to include only left‐turn‐related accident records. Accident records involving non‐operational factors such as driving under the influence were excluded from the dataset. Figure 26 shows the accidents on both intersections by month. The figure also shows total accident counts divided into left‐turn‐related and other accidents.
Figure 26 Three‐Year Before Implementation of FYA Accident Counts for the Study Intersections
25
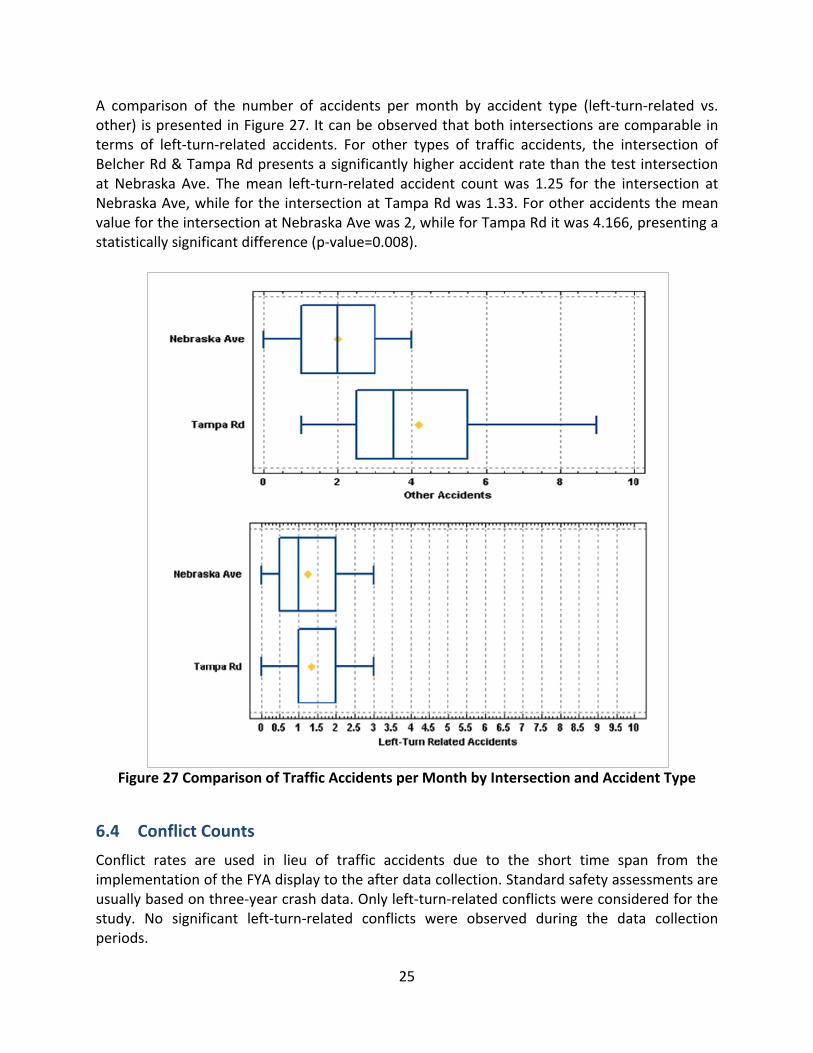
A comparison of the number of accidents per month by accident type (left‐turn‐related vs. other) is presented in Figure 27. It can be observed that both intersections are comparable in terms of left‐turn‐related accidents. For other types of traffic accidents, the intersection of Belcher Rd & Tampa Rd presents a significantly higher accident rate than the test intersection at Nebraska Ave. The mean left‐turn‐related accident count was 1.25 for the intersection at Nebraska Ave, while for the intersection at Tampa Rd was 1.33. For other accidents the mean value for the intersection at Nebraska Ave was 2, while for Tampa Rd it was 4.166, presenting a statistically significant difference (p‐value=0.008).
Figure 27 Comparison of Traffic Accidents per Month by Intersection and Accident Type
6.4 Conflict Counts
Conflict rates are used in lieu of traffic accidents due to the short time span from the implementation of the FYA display to the after data collection. Standard safety assessments are usually based on three‐year crash data. Only left‐turn‐related conflicts were considered for the study. No significant left‐turn‐related conflicts were observed during the data collection periods.

26
6.5 Gap Acceptance This section is devoted to the gap acceptance analysis. First, a common critical gap was determined for both intersections for the before and after scenarios and by time‐of‐day. This quantity was used to filter gap acceptance data to concentrate the analysis in the maneuvers that took place by accepting gaps shorter than the common critical gap. 6.5.1 Critical Gap The critical gap was found by the intersection of the gap rejection and gap acceptance curves. Notice that due to the computer‐assisted gap data collection, the research team was able to capture detailed gap information. This can be seen in the number of shorter gaps rejected in Figure 28.
Rejected gaps
Accepted gaps
Gap (secs) Gap (secs)
Gap (secs)Gap (secs)
Critical Gap

27
Figure 28 Gap Acceptance/Rejection Charts by Direction and
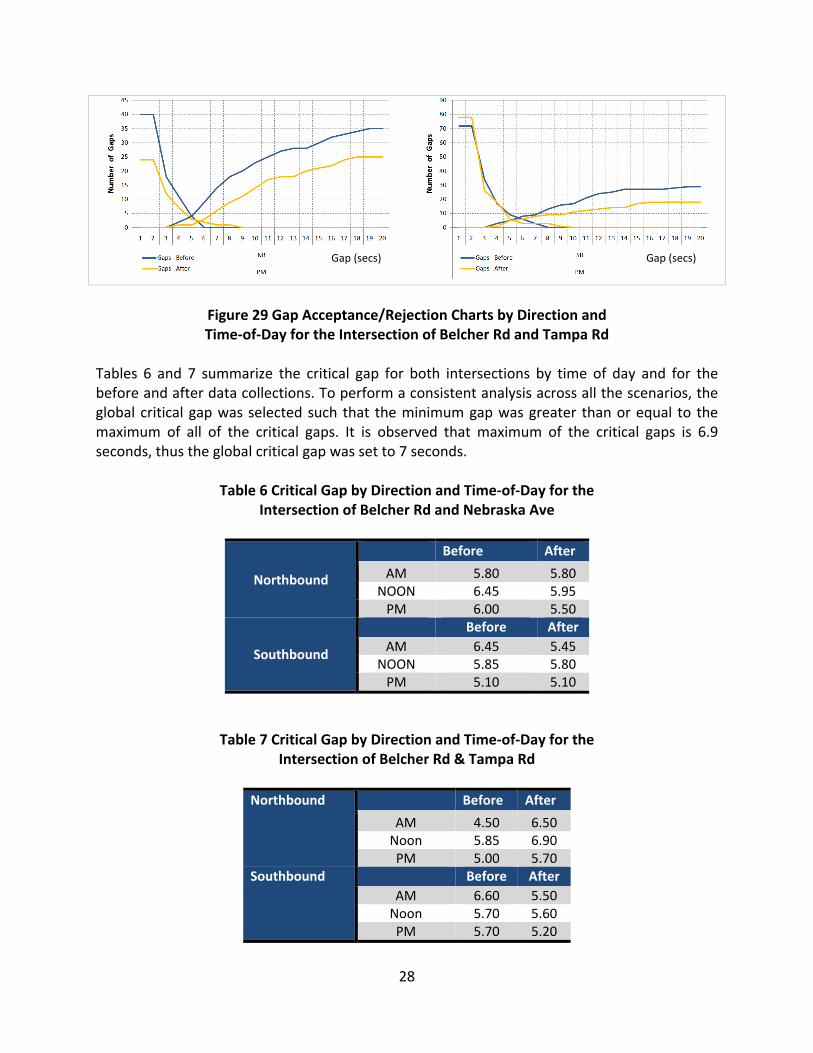
Time‐of‐Day for the Intersection of Belcher Rd and Nebraska Ave Figure 29 presents the gap rejection/acceptance curves used to determine the critical gap. The critical gap will determine the region where most of the gaps are likely to be accepted. The analysis and evaluation of the FYA benefits were applied to turning maneuvers that took place using the gaps below the critical gap.
Gap (secs) Gap (secs)
Rejected gaps
Accepted gaps
Gap (secs)
Critical Gap
Gap (secs)
Gap (secs)Gap (secs)
28
Figure 29 Gap Acceptance/Rejection Charts by Direction and Time‐of‐Day for the Intersection of Belcher Rd and Tampa Rd
Tables 6 and 7 summarize the critical gap for both intersections by time of day and for the before and after data collections. To perform a consistent analysis across all the scenarios, the global critical gap was selected such that the minimum gap was greater than or equal to the maximum of all of the critical gaps. It is observed that maximum of the critical gaps is 6.9 seconds, thus the global critical gap was set to 7 seconds.
Table 6 Critical Gap by Direction and Time‐of‐Day for the Intersection of Belcher Rd and Nebraska Ave
Northbound
Before After AM 5.80 5.80
NOON 6.45 5.95 PM 6.00 5.50
Southbound
Before After AM 6.45 5.45
NOON 5.85 5.80 PM 5.10 5.10
Table 7 Critical Gap by Direction and Time‐of‐Day for the Intersection of Belcher Rd & Tampa Rd
Northbound Before After
AM 4.50 6.50Noon 5.85 6.90PM 5.00 5.70
Southbound Before AfterAM 6.60 5.50Noon 5.70 5.60PM 5.70 5.20
Gap (secs) Gap (secs)

29
6.5.2 Crossing Tolerance A subset of left turning maneuvers occurring during the permissive left turn phase using gaps less than or equal to the global critical gap value of 7 seconds was chosen for analysis. The performance measure chosen to carry out the evaluation was the crossing tolerance. This performance measure is related to the gap acceptance behavior and is also a field indicator of the risk taken by the driver when performing a permissive left turn. If the crossing tolerance decreases for the after condition, it is deemed that the risk for the after condition increases. This could imply that drivers are making the left turn when the opposing vehicle is too close. On the other hand, if the crossing tolerance increases, then it is and indirect field indication that drivers are making safer left turns with respect to a base condition which in this case is the before scenario. Figure 30 shows the comparison of crossing tolerances between the before and after scenarios for permissive left‐turn maneuvers below the global critical gap. It can be observed that for the northbound left turns during AM peak (NBL‐AM), northbound left turns during noon time (NBL‐NOON), and southbound left turns during noon time (SBL‐NOON) cases, there was an improvement in the crossing tolerance. This could be an indication that drivers are crossing the intersection (i.e. permissive left turns) more safely for the after conditions.
Figure 30 Crossing Tolerance for the Intersection of Belcher Rd & Nebraska Ave

30
The cases in which no improvement in the crossing tolerance was observed had significantly increased opposing volumes for the after conditions. These cases include southbound left turns during AM peak (SBL‐AM), northbound left turns during PM peak (NBL‐PM), and southbound left turns during PM peak (SBL‐PM). When opposing through and right turns increase, the number of available gaps and the lengths of available gaps will be likely to decrease. The crossing tolerance will also be likely to decrease. To better understand the effect of FYA treatment on permissive left turns, one must closely examine traffic patterns before and after the FYA implementation. To minimize the effect from the traffic conditions on crossing tolerance, the research team compared the crossing tolerances for cases with similar before and after traffic conditions on left turns and opposing traffic. It was found that the FYA treatment can reduce the potential risk of permissive left turns by increasing the crossing tolerance for similar traffic conditions such as in NBL‐AM, NBL‐NOON, and SBL‐NOON cases. The research also found that the opposing traffic volume has a strong effect on the crossing tolerance. When the opposing traffic increases, the crossing tolerance is reduced such as in SBL‐AM, NBL‐PM, and SBL‐PM cases. The result of the examination on FYA treatment and traffic conditions on potential risk of permissive left turns in this study is shown in Table 8.
Table 8 Result of FYA Treatment for the Intersection of Belcher Rd and Nebraska Ave
Case Left turn volume in
after condition Opposing traffic volumes in
after condition Potential risk with FYA implementation in after condition
NBL‐AM Similar Similar ReducedNBL‐NOON Similar Similar ReducedSBL‐NOON Similar Similar ReducedSBL‐AM Similar Increased IncreasedNBL‐PM Similar Increased IncreasedSBL‐PM Increase Significant increased Significantly increased
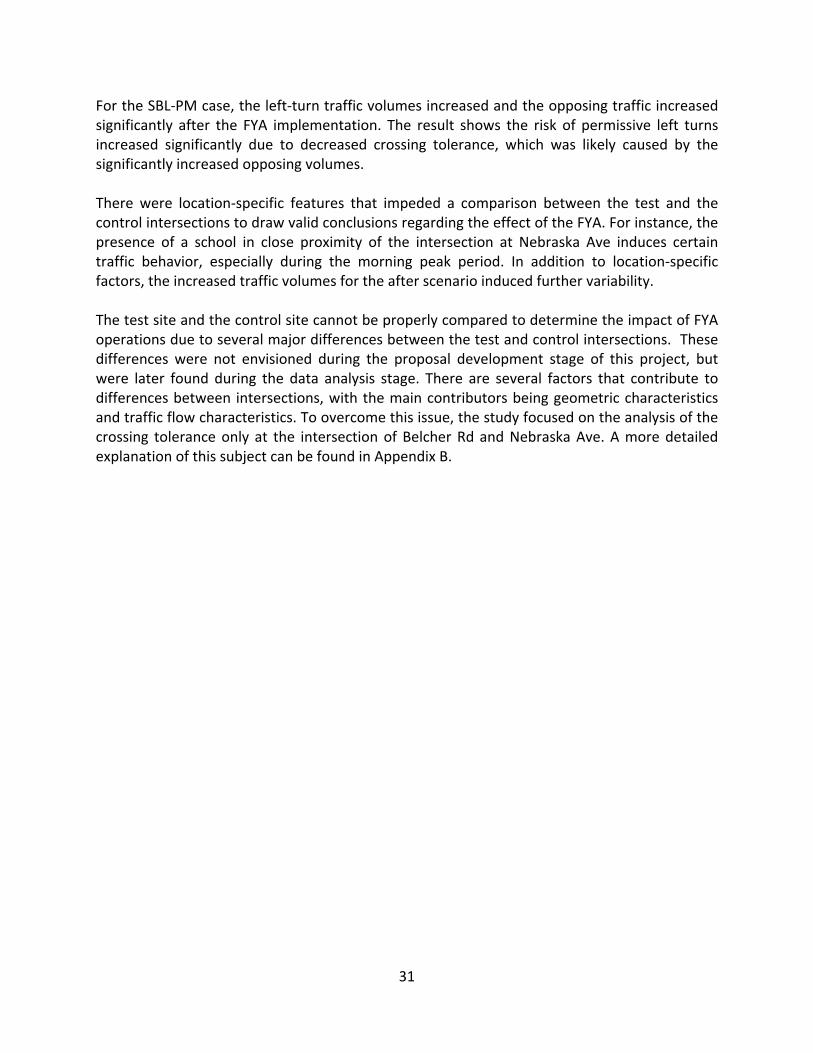
Specifically, for the NBL‐AM, NBL‐NOON and SBL‐NOON cases, the left turn traffic volume and opposing traffic volume remained similar to the conditions prior to the implementation of the FYA. Under such conditions, the FYA display has a positive effect in reducing the potential risk of a permissive left turn. For SBL‐AM and NBL‐PM cases, the left‐turn traffic volumes were similar before and after the implementation of FYA but the opposing traffic increased. The result shows that the risk of permissive left turns increased due to decreased crossing tolerance, which was likely caused by increased opposing volumes.
31
For the SBL‐PM case, the left‐turn traffic volumes increased and the opposing traffic increased significantly after the FYA implementation. The result shows the risk of permissive left turns increased significantly due to decreased crossing tolerance, which was likely caused by the significantly increased opposing volumes. There were location‐specific features that impeded a comparison between the test and the control intersections to draw valid conclusions regarding the effect of the FYA. For instance, the presence of a school in close proximity of the intersection at Nebraska Ave induces certain traffic behavior, especially during the morning peak period. In addition to location‐specific factors, the increased traffic volumes for the after scenario induced further variability. The test site and the control site cannot be properly compared to determine the impact of FYA operations due to several major differences between the test and control intersections. These differences were not envisioned during the proposal development stage of this project, but were later found during the data analysis stage. There are several factors that contribute to differences between intersections, with the main contributors being geometric characteristics and traffic flow characteristics. To overcome this issue, the study focused on the analysis of the crossing tolerance only at the intersection of Belcher Rd and Nebraska Ave. A more detailed explanation of this subject can be found in Appendix B.
32
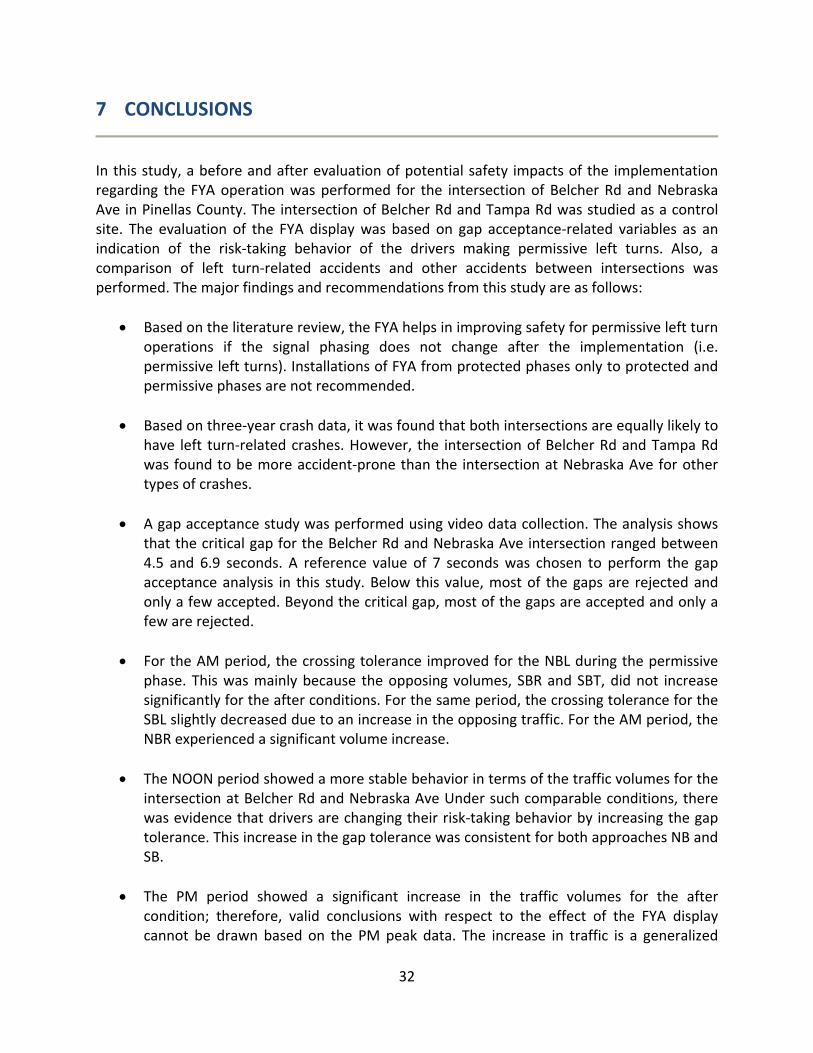
7 CONCLUSIONS
In this study, a before and after evaluation of potential safety impacts of the implementation regarding the FYA operation was performed for the intersection of Belcher Rd and Nebraska Ave in Pinellas County. The intersection of Belcher Rd and Tampa Rd was studied as a control site. The evaluation of the FYA display was based on gap acceptance‐related variables as an indication of the risk‐taking behavior of the drivers making permissive left turns. Also, a comparison of left turn‐related accidents and other accidents between intersections was performed. The major findings and recommendations from this study are as follows:
• Based on the literature review, the FYA helps in improving safety for permissive left turn operations if the signal phasing does not change after the implementation (i.e. permissive left turns). Installations of FYA from protected phases only to protected and permissive phases are not recommended.
• Based on three‐year crash data, it was found that both intersections are equally likely to
have left turn‐related crashes. However, the intersection of Belcher Rd and Tampa Rd was found to be more accident‐prone than the intersection at Nebraska Ave for other types of crashes.
• A gap acceptance study was performed using video data collection. The analysis shows
that the critical gap for the Belcher Rd and Nebraska Ave intersection ranged between 4.5 and 6.9 seconds. A reference value of 7 seconds was chosen to perform the gap acceptance analysis in this study. Below this value, most of the gaps are rejected and only a few accepted. Beyond the critical gap, most of the gaps are accepted and only a few are rejected.
• For the AM period, the crossing tolerance improved for the NBL during the permissive
phase. This was mainly because the opposing volumes, SBR and SBT, did not increase significantly for the after conditions. For the same period, the crossing tolerance for the SBL slightly decreased due to an increase in the opposing traffic. For the AM period, the NBR experienced a significant volume increase.
• The NOON period showed a more stable behavior in terms of the traffic volumes for the intersection at Belcher Rd and Nebraska Ave Under such comparable conditions, there was evidence that drivers are changing their risk‐taking behavior by increasing the gap tolerance. This increase in the gap tolerance was consistent for both approaches NB and SB.
• The PM period showed a significant increase in the traffic volumes for the after condition; therefore, valid conclusions with respect to the effect of the FYA display cannot be drawn based on the PM peak data. The increase in traffic is a generalized

33
seasonal effect across Florida. Since the FYA implementation took place in November 2009, the research team collected the after data three months after the implementation date in February 2010. This gave drivers the opportunity to become familiar with the new display.
• The intersection of Belcher Rd and Tampa Rd presented different geometric and traffic flow characteristics than the intersection of Belcher Rd and Nebraska Ave. These conditions impeded the direct comparison of these intersections to draw valid conclusions regarding the effectiveness of the FYA display.
• For this short‐term evaluation, the implementation of FYA at the test site shows a potential to consistently and slightly reduce the risk of permissive left turns if traffic conditions remain similar after the implementation of FYA. Under the same traffic conditions, the FYA display seemed to help warn drivers to be more cautious when making permissive left turns.
• The study shows that the opposing through volume has a strong impact on permissive
left turn operation. Opposing right turns also have the potential impact. When the opposing traffic increases, the left turn vehicles are generally forced to accept shorter gaps. In the situations of heavy opposing traffic, the potential risk reduction induced by a signal display of FYA may not be noticeable.
• The FYA for protected and permissive left turns is not widespread in Florida. It was observed that for most drivers the FYA operation is a novelty or a special signal even after being in place for two or more months. For future implementation, educational campaigns are recommended to continue.
• For a long‐term evaluation, left‐turn related crash rates are the preferred performance measures to assess the benefits of FYA display for protected and permissive left turns. A follow‐up evaluation for the test site, based on future crash information, is recommended. It is suggested to monitor the implementation of FYA quarterly for the first two years. After that period, the intersection should be monitored annually.
From a comprehensive gap acceptance analysis, the potential risk of left turns and opposing through crashes at the Belcher Rd and Nebraska Ave intersection was slightly reduced after the implementation of the FYA, when the traffic remained similar to the conditions prior to the implementation of the FYA. The implementation of the FYA did not introduce new traffic conflicts. The risk‐taking behavior of the drivers was slightly reduced for moderate opposing traffic volumes. It is necessary to highlight that under heavy opposing traffic volume, drivers making permissive left turns will have fewer chances to find acceptable gaps to maneuver safely regardless of the permissive left turn signal display in use. The potential risk for permissive left turns is likely to be reduced through the implementation of FYA when the opposing volumes are low to moderate.

34
8 REFERENCES
Noyce, D. A., Brergh, C. R., & Chapman, J. R. (2007). NCHRP web‐only document 123: Evaluation of the Flashing Yellow Arrow Permissive‐Only Left‐Turn Indication Field Implementation. Washington, D.C.: TRB, National Research Council. Brehmer, C. L., Kacir, K. C., Noyce, D. A., & Manser, M. P. (2003). NCRP report 493: Evaluation of Traffic Signal Displays for Protected/Permissive Left‐Turn Control. Washington, D.C.: TRB, National Research Council. Highway Capacity Manual (2000). Washington, D.C.: TRB, National Research Council. Parker, M. R., & Zegeer, C. V. (1989). Traffic Conflict Techniques for Safety and Operations Observer's Manual. Publication FHWA‐RD‐01‐113. FHWA, U.S. Department of Transportation.

35
Appendix A
Comparison of Before‐and‐After Traffic Volumes for the Intersection of Belcher Rd and Tampa Rd
Average 15‐Minute Volumes and P‐Values (AM)
Movement After Before P‐Values NBL 15.25 14.75 0.6860 NBT 91.9375 91.3125 0.9365 NBR 28.375 26.4375 0.4482 SBL 39.5 40.25 0.7741 SBT 160.813 175.188 0.3532 SBR 16.25 14.0 0.1973 EBL 29.875 28.25 0.5636 EBT 124.0 119.563 0.5058 EBR 25.9375 23.875 0.4781 WBL 38.625 38.1875 0.8756 WBT 104.25 103.875 0.9473 WBR 33.75 33.125 0.8813
36
95% Confidence Interval
Movement Northbound SouthboundLeft turn
Through
Right‐turn

37
Average 15‐Minute Volumes and P‐Values (Noon)
Movement After Before P‐Values NBL 23.9375 20.625 0.0680 NBT 101.75 86.5625 0.0050 NBR 29.625 29.4375 0.9428 SBL 30.5625 26.4375 0.1037 SBT 93.25 85.5625 0.1051 SBR 18.9375 17.75 0.4592 EBL 22.875 22.6875 0.9171 EBT 123.313 110.938 0.0367 EBR 19.125 15.3125 0.0219 WBL 30.5625 29.875 0.7810 WBT 131.938 119.0 0.0194 WBR 36.625 32.625 0.1186

38
95% Confidence Interval
Movement Northbound SouthboundLeft turn
Through
Right‐turn
39
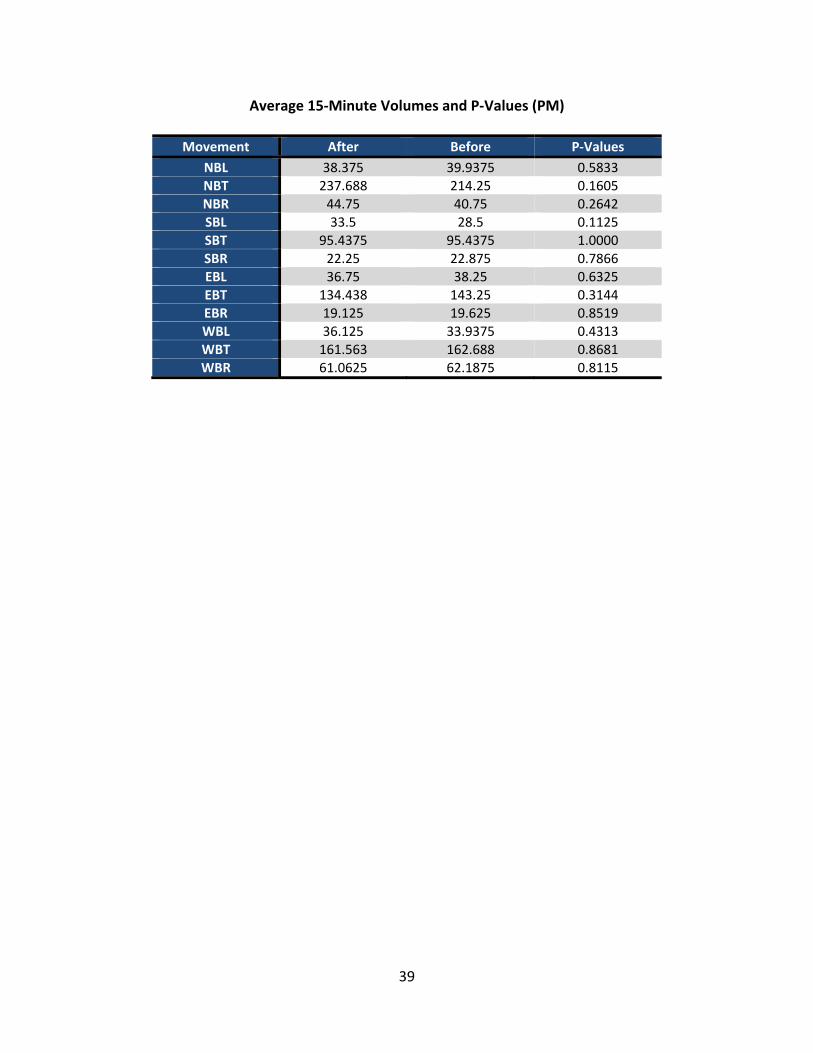
Average 15‐Minute Volumes and P‐Values (PM)
Movement After Before P‐Values NBL 38.375 39.9375 0.5833 NBT 237.688 214.25 0.1605 NBR 44.75 40.75 0.2642 SBL 33.5 28.5 0.1125 SBT 95.4375 95.4375 1.0000 SBR 22.25 22.875 0.7866 EBL 36.75 38.25 0.6325 EBT 134.438 143.25 0.3144 EBR 19.125 19.625 0.8519 WBL 36.125 33.9375 0.4313 WBT 161.563 162.688 0.8681 WBR 61.0625 62.1875 0.8115
40
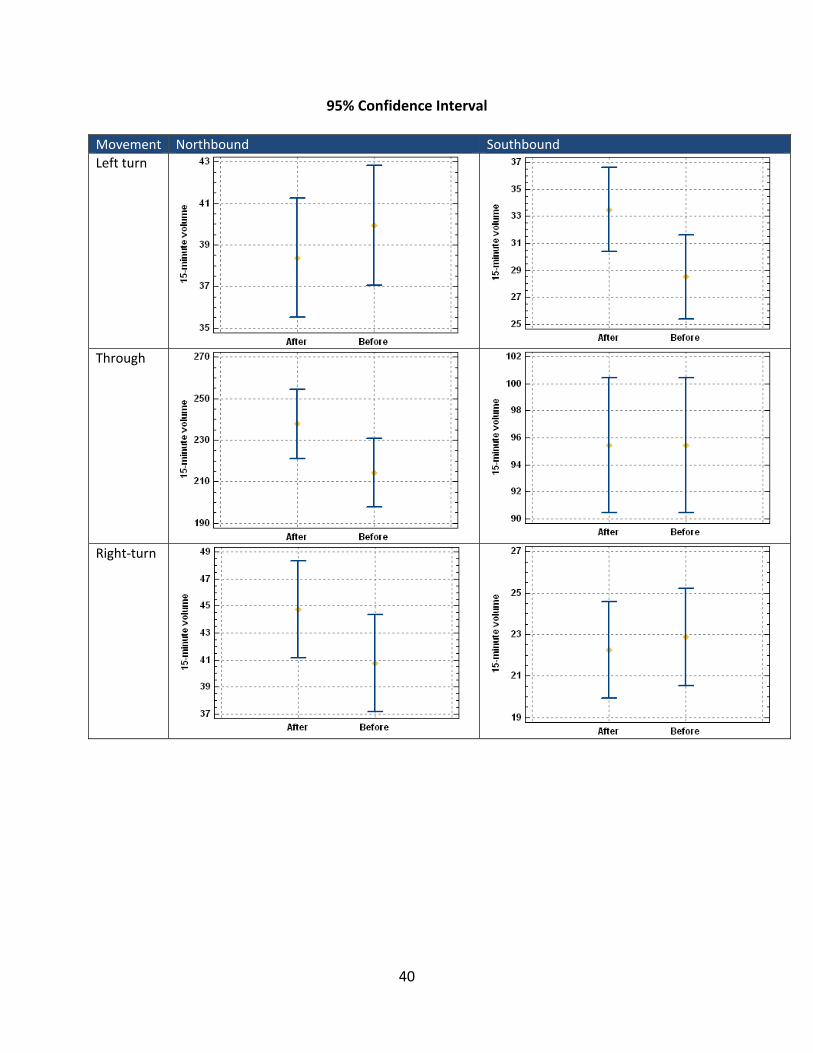
95% Confidence Interval
Movement Northbound SouthboundLeft turn
Through
Right‐turn

41
Appendix B
Analysis of Factors Influencing the Crossing Tolerance in the Study Intersections
The crossing tolerance comparison is presented in Figure B1 below for reference. It can be observed that for the control intersection (Belcher Rd and Tampa Rd), the crossing tolerance increased consistently in the after data collection period.
Figure B1 Crossing Tolerance Comparisons
Based on field observations and collected data, a direct comparison between the test intersection and the control intersection is not recommended. There are several factors that make a comparison improper to determine the impact of FYA operations. This document aims to explain some of the most influential factors and their possible effects on the observed behavior.
42
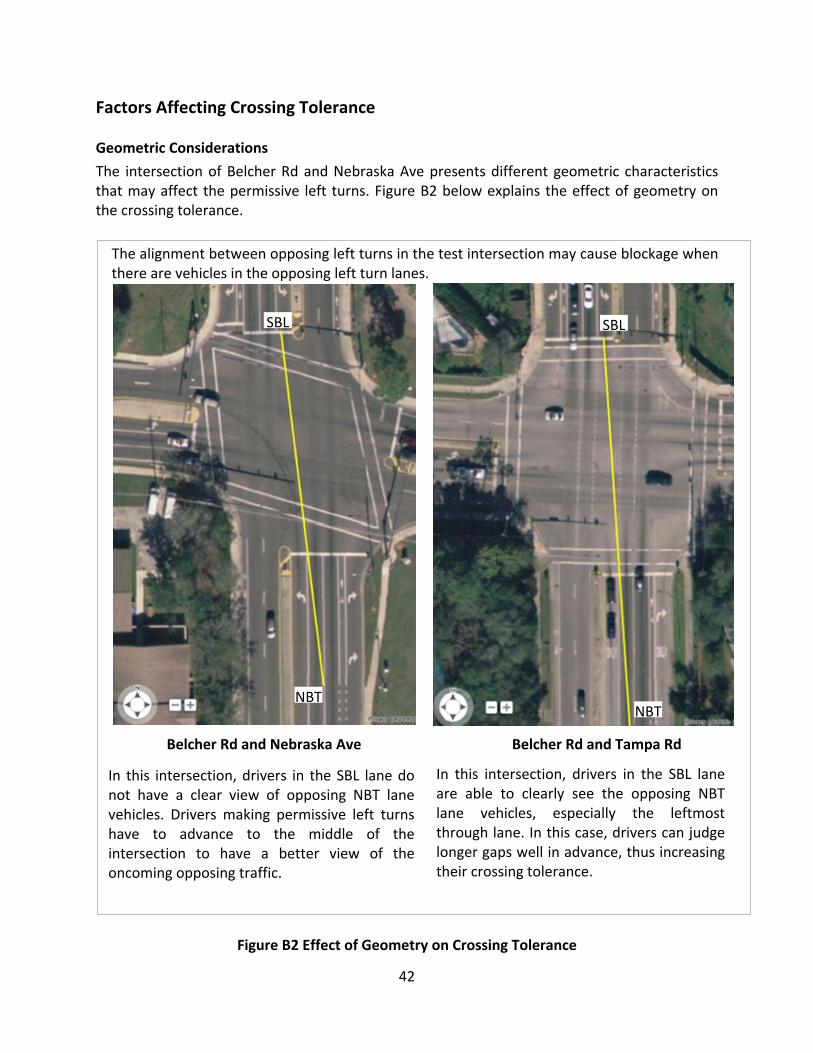
Factors Affecting Crossing Tolerance Geometric Considerations
The intersection of Belcher Rd and Nebraska Ave presents different geometric characteristics that may affect the permissive left turns. Figure B2 below explains the effect of geometry on the crossing tolerance.
Figure B2 Effect of Geometry on Crossing Tolerance
Belcher Rd and Nebraska Ave Belcher Rd and Tampa Rd
The alignment between opposing left turns in the test intersection may cause blockage whenthere are vehicles in the opposing left turn lanes.
In this intersection, drivers in the SBL lane donot have a clear view of opposing NBT lanevehicles. Drivers making permissive left turnshave to advance to the middle of theintersection to have a better view of theoncoming opposing traffic.
In this intersection, drivers in the SBL laneare able to clearly see the opposing NBTlane vehicles, especially the leftmostthrough lane. In this case, drivers can judgelonger gaps well in advance, thus increasingtheir crossing tolerance.
SBL
NBT
SBL
NBT
43
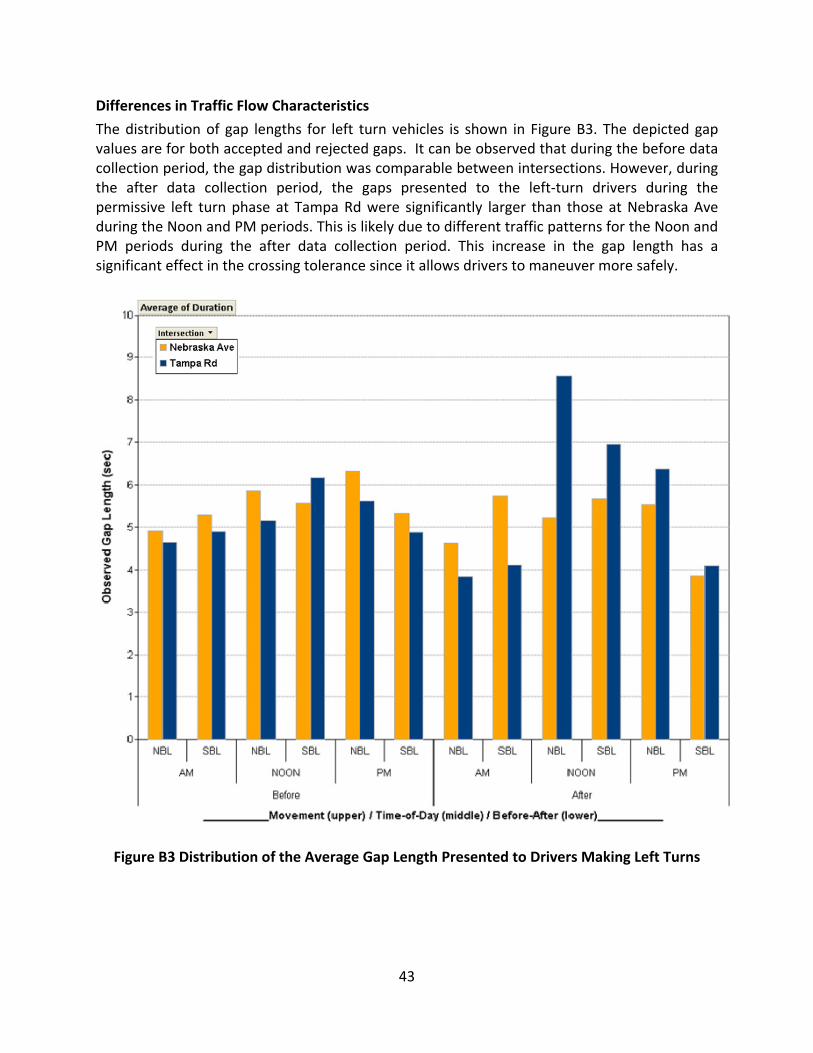
Differences in Traffic Flow Characteristics
The distribution of gap lengths for left turn vehicles is shown in Figure B3. The depicted gap values are for both accepted and rejected gaps. It can be observed that during the before data collection period, the gap distribution was comparable between intersections. However, during the after data collection period, the gaps presented to the left‐turn drivers during the permissive left turn phase at Tampa Rd were significantly larger than those at Nebraska Ave during the Noon and PM periods. This is likely due to different traffic patterns for the Noon and PM periods during the after data collection period. This increase in the gap length has a significant effect in the crossing tolerance since it allows drivers to maneuver more safely.
Figure B3 Distribution of the Average Gap Length Presented to Drivers Making Left Turns

44
Summary
• The test site and the control site cannot be properly compared to determine the impact of FYA operations due to several major differences between the test and control intersections. These differences were not envisioned during the proposal development stage of this project, but were later found during the data analysis stage. Based on the analysis of collected data, it was found that the intersection of Belcher Rd and Tampa Rd cannot serve as a good control site for this study.
• There are several factors that contribute to differences between intersections, with the main contributors being geometric characteristics and traffic flow characteristics. To overcome this issue, the study focused on the analysis of the crossing tolerance only at the intersection of Belcher Rd and Nebraska Ave.
• A direct comparison between intersections in general is not advisable due to the
presence of undetermined factors that are influencing the behavior of the drivers making left turns. A deeper understanding of the traffic patterns and driver behavior of the two intersections should be carefully studied before drawing conclusions from such comparisons.
• The collected data seems to show that the risk‐taking behavior will be apparently
reduced at the intersection of Belcher Rd and Tampa Rd without any treatment. From the analysis of gap data, it showed that longer gaps were presented to left‐turn vehicles for the after data collection period likely due to different traffic patterns at the intersection of Belcher Rd and Tampa Rd for the after period.
• The best way to determine the impact of the FYA implementation for this study was to minimize the impact of other variables except for the FYA display. To accomplish this goal, the researchers at CUTR selected cases with similar traffic volumes, moderate opposing traffic, and similar gap lengths presented to left‐turn vehicles before and after the implementation of FYA. The conclusions of this FYA study were mainly based on the comparison of risk‐taking behavior from the gap acceptance analysis before and after the FYA implementation with similar conditions at the intersection of Belcher Rd and Nebraska Ave.
Related Documents