MARCH 31, 2021 (UNAUDITED) PIMCO Equity Series Portfolio Holdings PIMCO Dividend and Income Fund PIMCO RAE Emerging Markets Fund PIMCO RAE Global ex-US Fund PIMCO RAE Global Fund PIMCO RAE International Fund PIMCO RAE US Fund PIMCO RAE US Small Fund PIMCO RAFI Dynamic Multi-Factor Emerging Markets Equity ETF PIMCO RAFI Dynamic Multi-Factor International Equity ETF PIMCO RAFI Dynamic Multi-Factor U.S. Equity ETF PIMCO RAFI ESG U.S. ETF PIMCO REALPATH Blend 2025 Fund PIMCO REALPATH Blend 2030 Fund PIMCO REALPATH Blend 2035 Fund PIMCO REALPATH Blend 2040 Fund PIMCO REALPATH Blend 2045 Fund PIMCO REALPATH Blend 2050 Fund PIMCO REALPATH Blend 2055 Fund PIMCO REALPATH Blend 2060 Fund PIMCO REALPATH Blend Income Fund Notes to Financial Statements

Welcome message from author
This document is posted to help you gain knowledge. Please leave a comment to let me know what you think about it! Share it to your friends and learn new things together.
Transcript
MARCH 31, 2021 (UNAUDITED)
PIMCO Equity Series
Portfolio Holdings
PIMCO Dividend and Income Fund
PIMCO RAE Emerging Markets Fund
PIMCO RAE Global ex-US Fund
PIMCO RAE Global Fund
PIMCO RAE International Fund
PIMCO RAE US Fund
PIMCO RAE US Small Fund
PIMCO RAFI Dynamic Multi-Factor Emerging Markets Equity ETF
PIMCO RAFI Dynamic Multi-Factor International Equity ETF
PIMCO RAFI Dynamic Multi-Factor U.S. Equity ETF
PIMCO RAFI ESG U.S. ETF
PIMCO REALPATH Blend 2025 Fund
PIMCO REALPATH Blend 2030 Fund
PIMCO REALPATH Blend 2035 Fund
PIMCO REALPATH Blend 2040 Fund
PIMCO REALPATH Blend 2045 Fund
PIMCO REALPATH Blend 2050 Fund
PIMCO REALPATH Blend 2055 Fund
PIMCO REALPATH Blend 2060 Fund
PIMCO REALPATH Blend Income Fund
Notes to Financial Statements
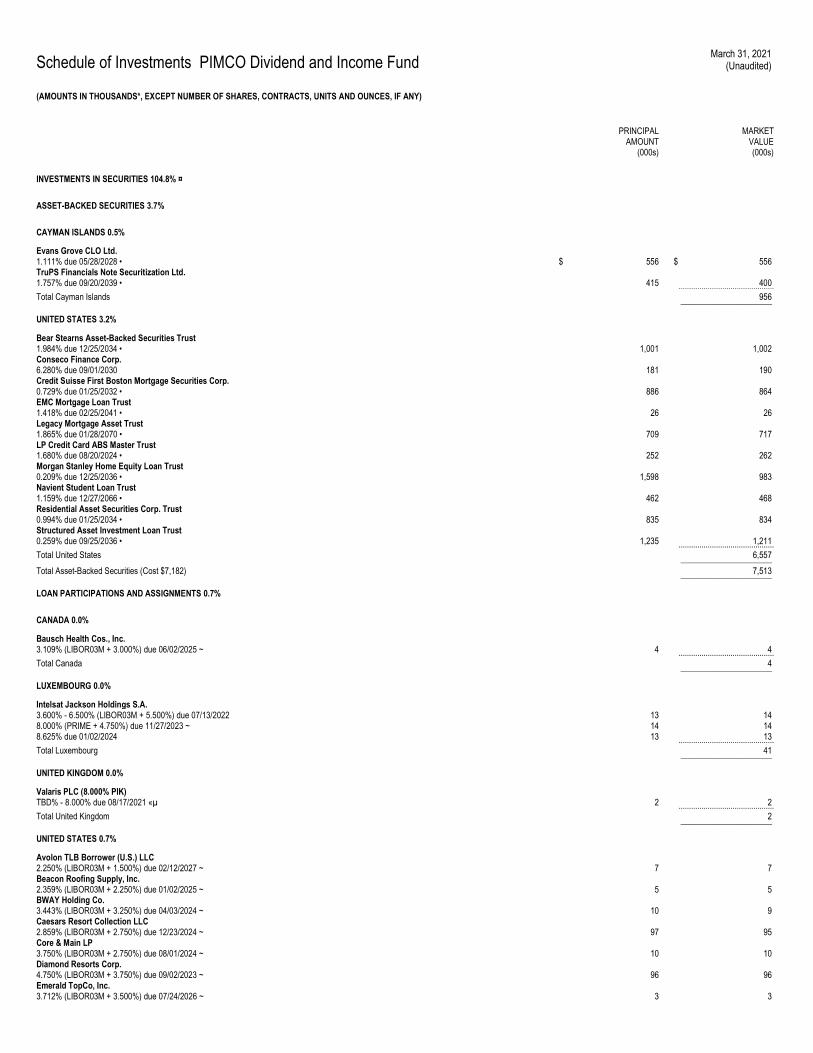
Schedule of Investments PIMCO Dividend and Income Fund March 31, 2021
(Unaudited)
(AMOUNTS IN THOUSANDS*, EXCEPT NUMBER OF SHARES, CONTRACTS, UNITS AND OUNCES, IF ANY)
PRINCIPAL AMOUNT
(000s)
MARKET VALUE (000s)
INVESTMENTS IN SECURITIES 104.8% ¤
ASSET-BACKED SECURITIES 3.7%
CAYMAN ISLANDS 0.5%
Evans Grove CLO Ltd. 1.111% due 05/28/2028 • $ 556 $ 556 TruPS Financials Note Securitization Ltd. 1.757% due 09/20/2039 • 415 400 .............................................. Total Cayman Islands 956 ______________________
UNITED STATES 3.2%
Bear Stearns Asset-Backed Securities Trust 1.984% due 12/25/2034 • 1,001 1,002 Conseco Finance Corp. 6.280% due 09/01/2030 181 190 Credit Suisse First Boston Mortgage Securities Corp. 0.729% due 01/25/2032 • 886 864 EMC Mortgage Loan Trust 1.418% due 02/25/2041 • 26 26 Legacy Mortgage Asset Trust 1.865% due 01/28/2070 • 709 717 LP Credit Card ABS Master Trust 1.680% due 08/20/2024 • 252 262 Morgan Stanley Home Equity Loan Trust 0.209% due 12/25/2036 • 1,598 983 Navient Student Loan Trust 1.159% due 12/27/2066 • 462 468 Residential Asset Securities Corp. Trust 0.994% due 01/25/2034 • 835 834 Structured Asset Investment Loan Trust 0.259% due 09/25/2036 • 1,235 1,211 .............................................. Total United States 6,557 ______________________
Total Asset-Backed Securities (Cost $7,182) 7,513 ______________________
LOAN PARTICIPATIONS AND ASSIGNMENTS 0.7%
CANADA 0.0%
Bausch Health Cos., Inc. 3.109% (LIBOR03M + 3.000%) due 06/02/2025 ~ 4 4 .............................................. Total Canada 4 ______________________
LUXEMBOURG 0.0%
Intelsat Jackson Holdings S.A. 3.600% - 6.500% (LIBOR03M + 5.500%) due 07/13/2022 13 14 8.000% (PRIME + 4.750%) due 11/27/2023 ~ 14 14 8.625% due 01/02/2024 13 13 .............................................. Total Luxembourg 41 ______________________
UNITED KINGDOM 0.0%
Valaris PLC (8.000% PIK) TBD% - 8.000% due 08/17/2021 «µ 2 2 .............................................. Total United Kingdom 2 ______________________
UNITED STATES 0.7%
Avolon TLB Borrower (U.S.) LLC 2.250% (LIBOR03M + 1.500%) due 02/12/2027 ~ 7 7 Beacon Roofing Supply, Inc. 2.359% (LIBOR03M + 2.250%) due 01/02/2025 ~ 5 5 BWAY Holding Co. 3.443% (LIBOR03M + 3.250%) due 04/03/2024 ~ 10 9 Caesars Resort Collection LLC 2.859% (LIBOR03M + 2.750%) due 12/23/2024 ~ 97 95 Core & Main LP 3.750% (LIBOR03M + 2.750%) due 08/01/2024 ~ 10 10 Diamond Resorts Corp. 4.750% (LIBOR03M + 3.750%) due 09/02/2023 ~ 96 96 Emerald TopCo, Inc. 3.712% (LIBOR03M + 3.500%) due 07/24/2026 ~ 3 3
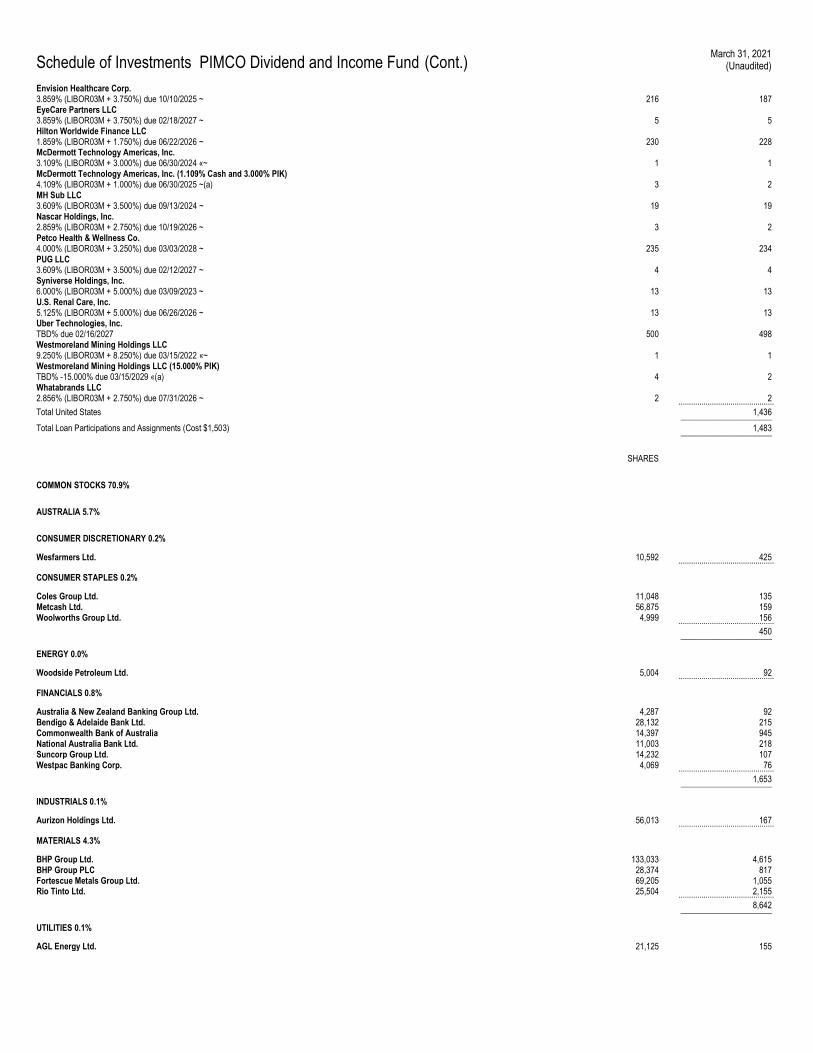
Schedule of Investments PIMCO Dividend and Income Fund (Cont.) March 31, 2021
(Unaudited)
Envision Healthcare Corp. 3.859% (LIBOR03M + 3.750%) due 10/10/2025 ~ 216 187 EyeCare Partners LLC 3.859% (LIBOR03M + 3.750%) due 02/18/2027 ~ 5 5 Hilton Worldwide Finance LLC 1.859% (LIBOR03M + 1.750%) due 06/22/2026 ~ 230 228 McDermott Technology Americas, Inc. 3.109% (LIBOR03M + 3.000%) due 06/30/2024 «~ 1 1 McDermott Technology Americas, Inc. (1.109% Cash and 3.000% PIK) 4.109% (LIBOR03M + 1.000%) due 06/30/2025 ~(a) 3 2 MH Sub LLC 3.609% (LIBOR03M + 3.500%) due 09/13/2024 ~ 19 19 Nascar Holdings, Inc. 2.859% (LIBOR03M + 2.750%) due 10/19/2026 ~ 3 2 Petco Health & Wellness Co. 4.000% (LIBOR03M + 3.250%) due 03/03/2028 ~ 235 234 PUG LLC 3.609% (LIBOR03M + 3.500%) due 02/12/2027 ~ 4 4 Syniverse Holdings, Inc. 6.000% (LIBOR03M + 5.000%) due 03/09/2023 ~ 13 13 U.S. Renal Care, Inc. 5.125% (LIBOR03M + 5.000%) due 06/26/2026 ~ 13 13 Uber Technologies, Inc. TBD% due 02/16/2027 500 498 Westmoreland Mining Holdings LLC 9.250% (LIBOR03M + 8.250%) due 03/15/2022 «~ 1 1 Westmoreland Mining Holdings LLC (15.000% PIK) TBD% -15.000% due 03/15/2029 «(a) 4 2 Whatabrands LLC 2.856% (LIBOR03M + 2.750%) due 07/31/2026 ~ 2 2 .............................................. Total United States 1,436 ______________________
Total Loan Participations and Assignments (Cost $1,503) 1,483 ______________________
SHARES
COMMON STOCKS 70.9%
AUSTRALIA 5.7%
CONSUMER DISCRETIONARY 0.2%
Wesfarmers Ltd. 10,592 425 ..............................................
CONSUMER STAPLES 0.2%
Coles Group Ltd. 11,048 135 Metcash Ltd. 56,875 159 Woolworths Group Ltd. 4,999 156 .............................................. 450 ______________________
ENERGY 0.0%
Woodside Petroleum Ltd. 5,004 92 ..............................................
FINANCIALS 0.8%
Australia & New Zealand Banking Group Ltd. 4,287 92 Bendigo & Adelaide Bank Ltd. 28,132 215 Commonwealth Bank of Australia 14,397 945 National Australia Bank Ltd. 11,003 218 Suncorp Group Ltd. 14,232 107 Westpac Banking Corp. 4,069 76 .............................................. 1,653 ______________________
INDUSTRIALS 0.1%
Aurizon Holdings Ltd. 56,013 167 ..............................................
MATERIALS 4.3%
BHP Group Ltd. 133,033 4,615 BHP Group PLC 28,374 817 Fortescue Metals Group Ltd. 69,205 1,055 Rio Tinto Ltd. 25,504 2,155 .............................................. 8,642 ______________________
UTILITIES 0.1%
AGL Energy Ltd. 21,125 155
Schedule of Investments PIMCO Dividend and Income Fund (Cont.) March 31, 2021
(Unaudited)
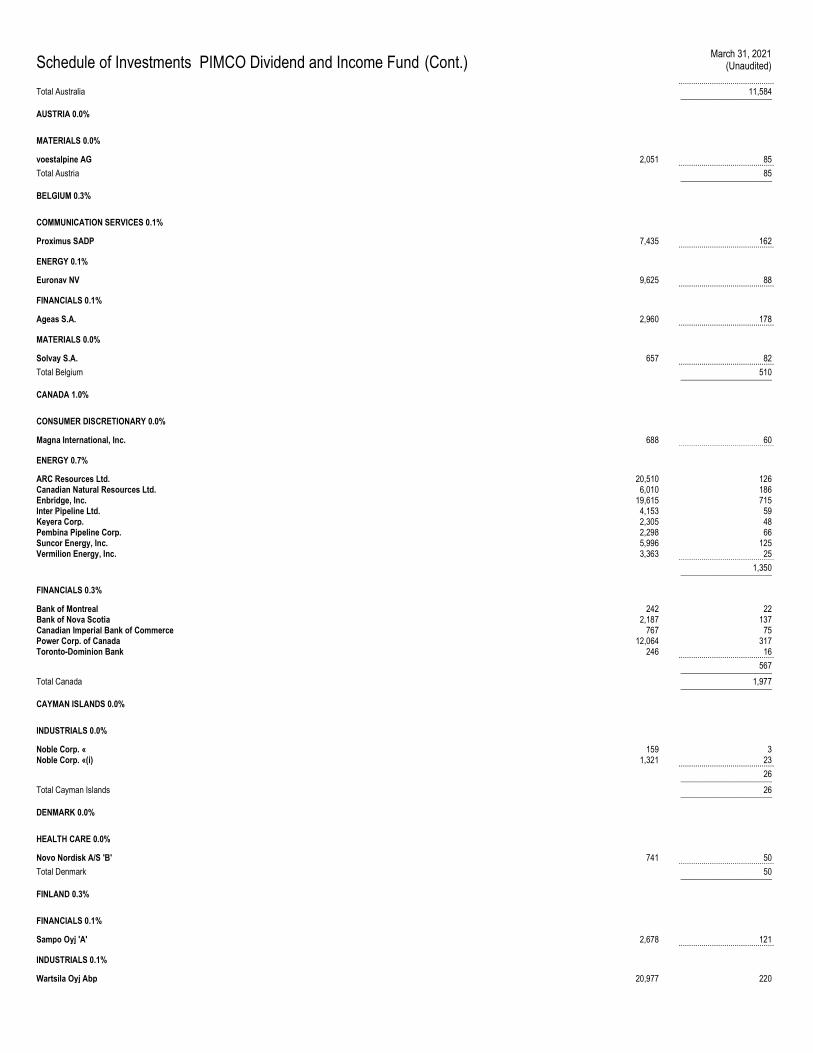
.............................................. Total Australia 11,584 ______________________
AUSTRIA 0.0%
MATERIALS 0.0%
voestalpine AG 2,051 85 .............................................. Total Austria 85 ______________________
BELGIUM 0.3%
COMMUNICATION SERVICES 0.1%
Proximus SADP 7,435 162 ..............................................
ENERGY 0.1%
Euronav NV 9,625 88 ..............................................
FINANCIALS 0.1%
Ageas S.A. 2,960 178 ..............................................
MATERIALS 0.0%
Solvay S.A. 657 82 .............................................. Total Belgium 510 ______________________
CANADA 1.0%
CONSUMER DISCRETIONARY 0.0%
Magna International, Inc. 688 60 ..............................................
ENERGY 0.7%
ARC Resources Ltd. 20,510 126 Canadian Natural Resources Ltd. 6,010 186 Enbridge, Inc. 19,615 715 Inter Pipeline Ltd. 4,153 59 Keyera Corp. 2,305 48 Pembina Pipeline Corp. 2,298 66 Suncor Energy, Inc. 5,996 125 Vermilion Energy, Inc. 3,363 25 .............................................. 1,350 ______________________
FINANCIALS 0.3%
Bank of Montreal 242 22 Bank of Nova Scotia 2,187 137 Canadian Imperial Bank of Commerce 767 75 Power Corp. of Canada 12,064 317 Toronto-Dominion Bank 246 16 .............................................. 567 ______________________
Total Canada 1,977 ______________________
CAYMAN ISLANDS 0.0%
INDUSTRIALS 0.0%
Noble Corp. « 159 3 Noble Corp. «(i) 1,321 23 .............................................. 26 ______________________
Total Cayman Islands 26 ______________________
DENMARK 0.0%
HEALTH CARE 0.0%
Novo Nordisk A/S 'B' 741 50 .............................................. Total Denmark 50 ______________________
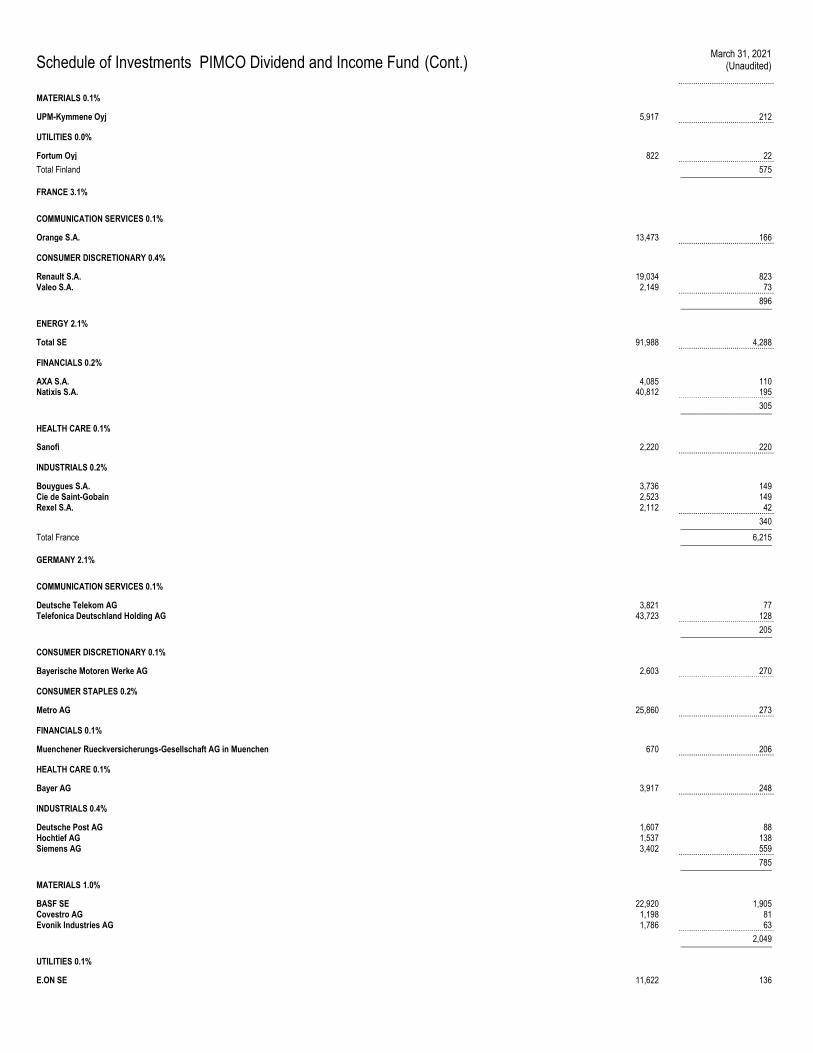
FINLAND 0.3%
FINANCIALS 0.1%
Sampo Oyj 'A' 2,678 121 ..............................................
INDUSTRIALS 0.1%
Wartsila Oyj Abp 20,977 220
Schedule of Investments PIMCO Dividend and Income Fund (Cont.) March 31, 2021
(Unaudited)
..............................................
MATERIALS 0.1%
UPM-Kymmene Oyj 5,917 212 ..............................................
UTILITIES 0.0%
Fortum Oyj 822 22 .............................................. Total Finland 575 ______________________
FRANCE 3.1%
COMMUNICATION SERVICES 0.1%
Orange S.A. 13,473 166 ..............................................
CONSUMER DISCRETIONARY 0.4%
Renault S.A. 19,034 823 Valeo S.A. 2,149 73 .............................................. 896 ______________________
ENERGY 2.1%
Total SE 91,988 4,288 ..............................................
FINANCIALS 0.2%
AXA S.A. 4,085 110 Natixis S.A. 40,812 195 .............................................. 305 ______________________
HEALTH CARE 0.1%
Sanofi 2,220 220 ..............................................
INDUSTRIALS 0.2%
Bouygues S.A. 3,736 149 Cie de Saint-Gobain 2,523 149 Rexel S.A. 2,112 42 .............................................. 340 ______________________
Total France 6,215 ______________________
GERMANY 2.1%
COMMUNICATION SERVICES 0.1%
Deutsche Telekom AG 3,821 77 Telefonica Deutschland Holding AG 43,723 128 .............................................. 205 ______________________
CONSUMER DISCRETIONARY 0.1%
Bayerische Motoren Werke AG 2,603 270 ..............................................
CONSUMER STAPLES 0.2%
Metro AG 25,860 273 ..............................................
FINANCIALS 0.1%
Muenchener Rueckversicherungs-Gesellschaft AG in Muenchen 670 206 ..............................................
HEALTH CARE 0.1%
Bayer AG 3,917 248 ..............................................
INDUSTRIALS 0.4%
Deutsche Post AG 1,607 88 Hochtief AG 1,537 138 Siemens AG 3,402 559 .............................................. 785 ______________________
MATERIALS 1.0%
BASF SE 22,920 1,905 Covestro AG 1,198 81 Evonik Industries AG 1,786 63 .............................................. 2,049 ______________________
UTILITIES 0.1%
E.ON SE 11,622 136
Schedule of Investments PIMCO Dividend and Income Fund (Cont.) March 31, 2021
(Unaudited)
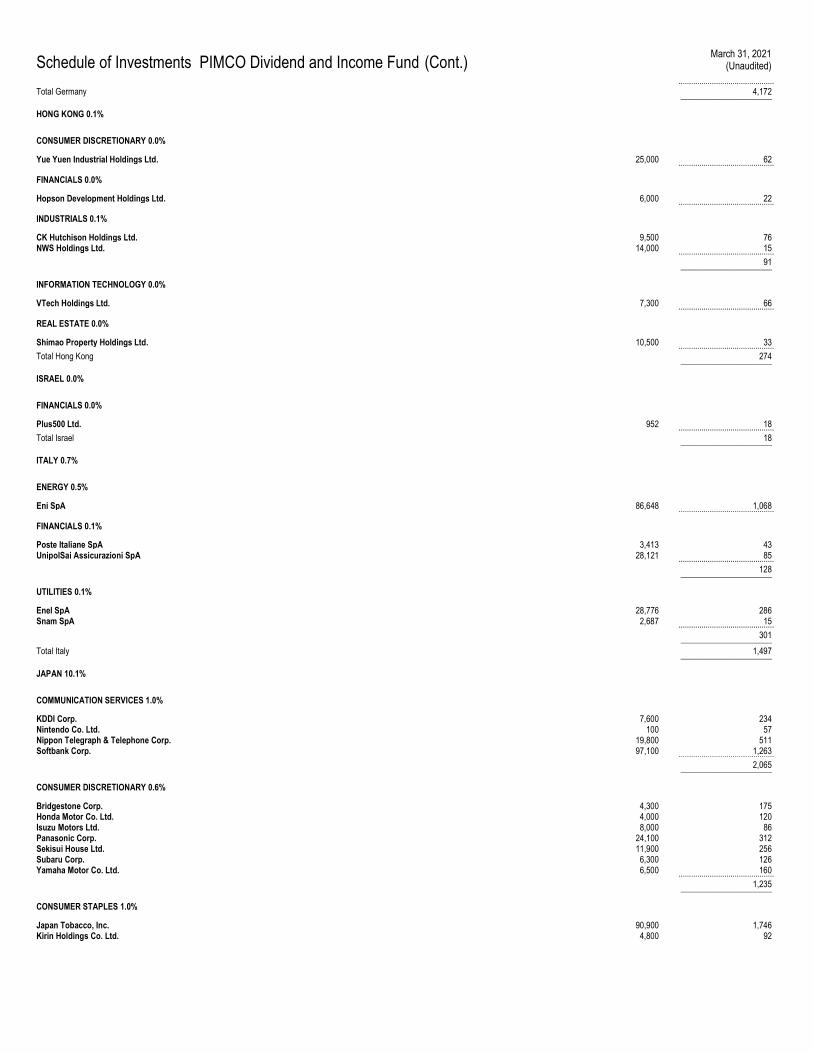
.............................................. Total Germany 4,172 ______________________
HONG KONG 0.1%
CONSUMER DISCRETIONARY 0.0%
Yue Yuen Industrial Holdings Ltd. 25,000 62 ..............................................
FINANCIALS 0.0%
Hopson Development Holdings Ltd. 6,000 22 ..............................................
INDUSTRIALS 0.1%
CK Hutchison Holdings Ltd. 9,500 76 NWS Holdings Ltd. 14,000 15 .............................................. 91 ______________________
INFORMATION TECHNOLOGY 0.0%
VTech Holdings Ltd. 7,300 66 ..............................................
REAL ESTATE 0.0%
Shimao Property Holdings Ltd. 10,500 33 .............................................. Total Hong Kong 274 ______________________
ISRAEL 0.0%
FINANCIALS 0.0%
Plus500 Ltd. 952 18 .............................................. Total Israel 18 ______________________
ITALY 0.7%
ENERGY 0.5%
Eni SpA 86,648 1,068 ..............................................
FINANCIALS 0.1%
Poste Italiane SpA 3,413 43 UnipolSai Assicurazioni SpA 28,121 85 .............................................. 128 ______________________
UTILITIES 0.1%
Enel SpA 28,776 286 Snam SpA 2,687 15 .............................................. 301 ______________________
Total Italy 1,497 ______________________
JAPAN 10.1%
COMMUNICATION SERVICES 1.0%
KDDI Corp. 7,600 234 Nintendo Co. Ltd. 100 57 Nippon Telegraph & Telephone Corp. 19,800 511 Softbank Corp. 97,100 1,263 .............................................. 2,065 ______________________
CONSUMER DISCRETIONARY 0.6%
Bridgestone Corp. 4,300 175 Honda Motor Co. Ltd. 4,000 120 Isuzu Motors Ltd. 8,000 86 Panasonic Corp. 24,100 312 Sekisui House Ltd. 11,900 256 Subaru Corp. 6,300 126 Yamaha Motor Co. Ltd. 6,500 160 .............................................. 1,235 ______________________
CONSUMER STAPLES 1.0%
Japan Tobacco, Inc. 90,900 1,746 Kirin Holdings Co. Ltd. 4,800 92
Schedule of Investments PIMCO Dividend and Income Fund (Cont.) March 31, 2021
(Unaudited)
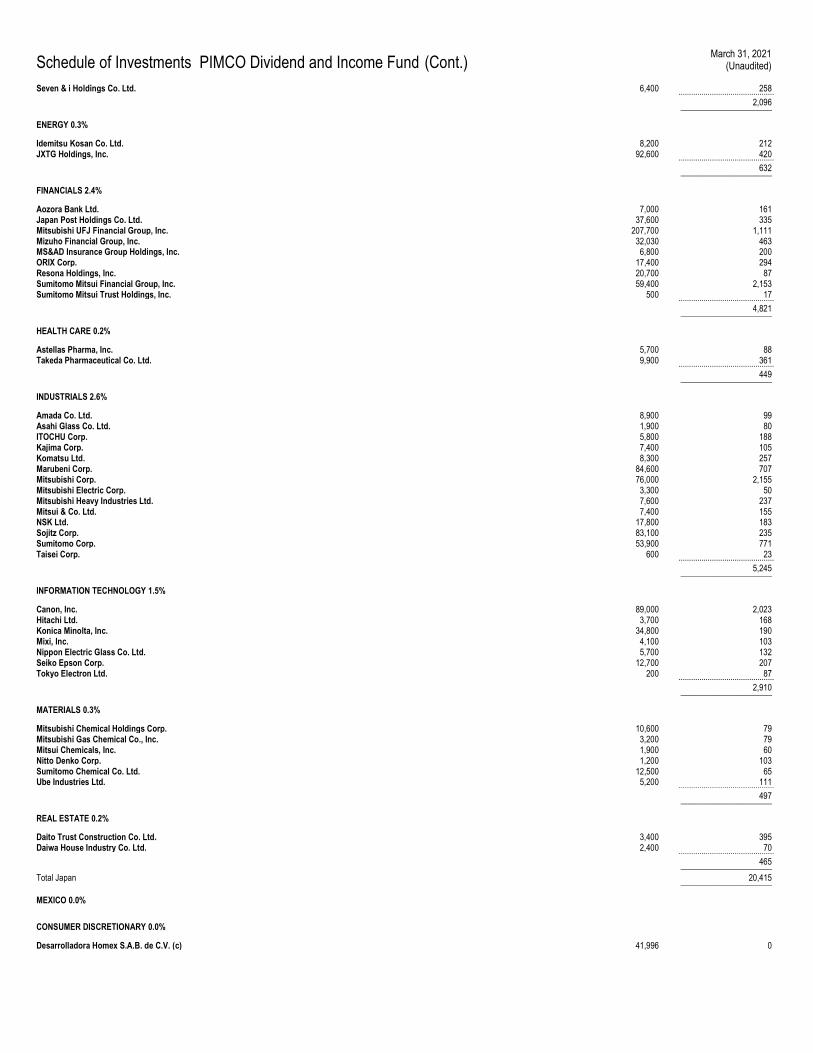
Seven & i Holdings Co. Ltd. 6,400 258 .............................................. 2,096 ______________________
ENERGY 0.3%
Idemitsu Kosan Co. Ltd. 8,200 212 JXTG Holdings, Inc. 92,600 420 .............................................. 632 ______________________
FINANCIALS 2.4%
Aozora Bank Ltd. 7,000 161 Japan Post Holdings Co. Ltd. 37,600 335 Mitsubishi UFJ Financial Group, Inc. 207,700 1,111 Mizuho Financial Group, Inc. 32,030 463 MS&AD Insurance Group Holdings, Inc. 6,800 200 ORIX Corp. 17,400 294 Resona Holdings, Inc. 20,700 87 Sumitomo Mitsui Financial Group, Inc. 59,400 2,153 Sumitomo Mitsui Trust Holdings, Inc. 500 17 .............................................. 4,821 ______________________
HEALTH CARE 0.2%
Astellas Pharma, Inc. 5,700 88 Takeda Pharmaceutical Co. Ltd. 9,900 361 .............................................. 449 ______________________
INDUSTRIALS 2.6%
Amada Co. Ltd. 8,900 99 Asahi Glass Co. Ltd. 1,900 80 ITOCHU Corp. 5,800 188 Kajima Corp. 7,400 105 Komatsu Ltd. 8,300 257 Marubeni Corp. 84,600 707 Mitsubishi Corp. 76,000 2,155 Mitsubishi Electric Corp. 3,300 50 Mitsubishi Heavy Industries Ltd. 7,600 237 Mitsui & Co. Ltd. 7,400 155 NSK Ltd. 17,800 183 Sojitz Corp. 83,100 235 Sumitomo Corp. 53,900 771 Taisei Corp. 600 23 .............................................. 5,245 ______________________
INFORMATION TECHNOLOGY 1.5%
Canon, Inc. 89,000 2,023 Hitachi Ltd. 3,700 168 Konica Minolta, Inc. 34,800 190 Mixi, Inc. 4,100 103 Nippon Electric Glass Co. Ltd. 5,700 132 Seiko Epson Corp. 12,700 207 Tokyo Electron Ltd. 200 87 .............................................. 2,910 ______________________
MATERIALS 0.3%
Mitsubishi Chemical Holdings Corp. 10,600 79 Mitsubishi Gas Chemical Co., Inc. 3,200 79 Mitsui Chemicals, Inc. 1,900 60 Nitto Denko Corp. 1,200 103 Sumitomo Chemical Co. Ltd. 12,500 65 Ube Industries Ltd. 5,200 111 .............................................. 497 ______________________
REAL ESTATE 0.2%
Daito Trust Construction Co. Ltd. 3,400 395 Daiwa House Industry Co. Ltd. 2,400 70 .............................................. 465 ______________________
Total Japan 20,415 ______________________
MEXICO 0.0%
CONSUMER DISCRETIONARY 0.0%
Desarrolladora Homex S.A.B. de C.V. (c) 41,996 0
Schedule of Investments PIMCO Dividend and Income Fund (Cont.) March 31, 2021
(Unaudited)
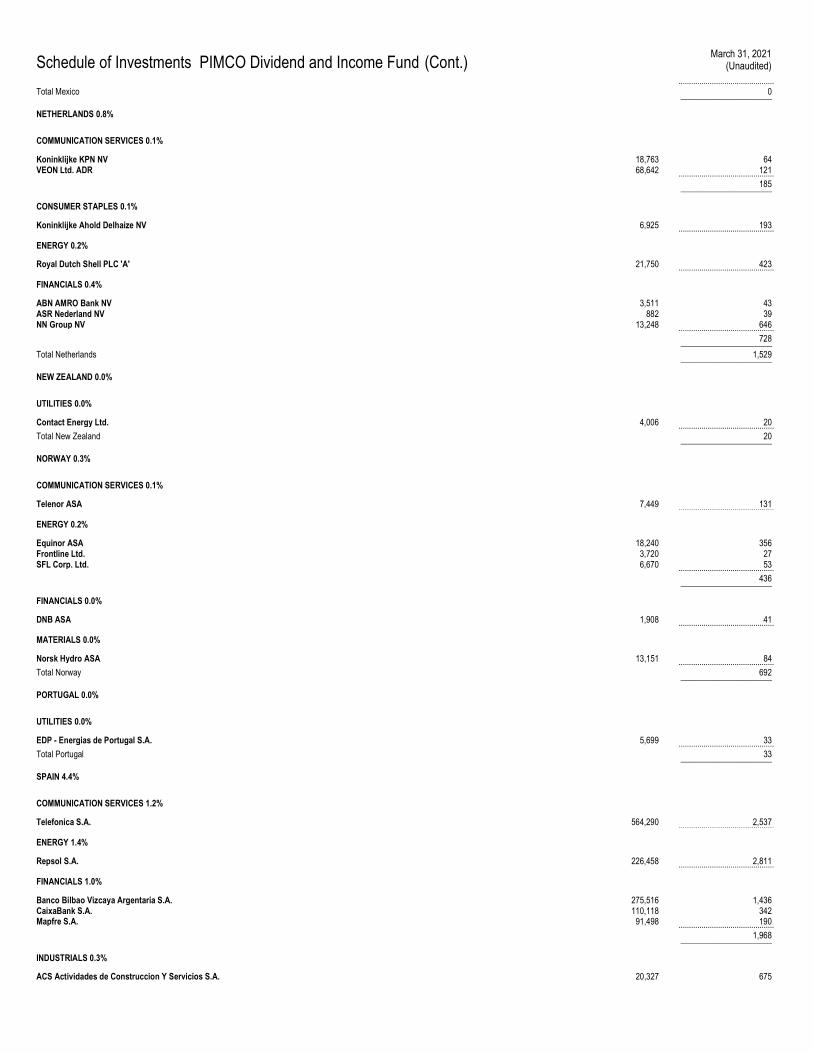
.............................................. Total Mexico 0 ______________________
NETHERLANDS 0.8%
COMMUNICATION SERVICES 0.1%
Koninklijke KPN NV 18,763 64 VEON Ltd. ADR 68,642 121 .............................................. 185 ______________________
CONSUMER STAPLES 0.1%
Koninklijke Ahold Delhaize NV 6,925 193 ..............................................
ENERGY 0.2%
Royal Dutch Shell PLC 'A' 21,750 423 ..............................................
FINANCIALS 0.4%
ABN AMRO Bank NV 3,511 43 ASR Nederland NV 882 39 NN Group NV 13,248 646 .............................................. 728 ______________________
Total Netherlands 1,529 ______________________
NEW ZEALAND 0.0%
UTILITIES 0.0%
Contact Energy Ltd. 4,006 20 .............................................. Total New Zealand 20 ______________________
NORWAY 0.3%
COMMUNICATION SERVICES 0.1%
Telenor ASA 7,449 131 ..............................................
ENERGY 0.2%
Equinor ASA 18,240 356 Frontline Ltd. 3,720 27 SFL Corp. Ltd. 6,670 53 .............................................. 436 ______________________
FINANCIALS 0.0%
DNB ASA 1,908 41 ..............................................
MATERIALS 0.0%
Norsk Hydro ASA 13,151 84 .............................................. Total Norway 692 ______________________
PORTUGAL 0.0%
UTILITIES 0.0%
EDP - Energias de Portugal S.A. 5,699 33 .............................................. Total Portugal 33 ______________________
SPAIN 4.4%
COMMUNICATION SERVICES 1.2%
Telefonica S.A. 564,290 2,537 ..............................................
ENERGY 1.4%
Repsol S.A. 226,458 2,811 ..............................................
FINANCIALS 1.0%
Banco Bilbao Vizcaya Argentaria S.A. 275,516 1,436 CaixaBank S.A. 110,118 342 Mapfre S.A. 91,498 190 .............................................. 1,968 ______________________
INDUSTRIALS 0.3%
ACS Actividades de Construccion Y Servicios S.A. 20,327 675
Schedule of Investments PIMCO Dividend and Income Fund (Cont.) March 31, 2021
(Unaudited)
..............................................
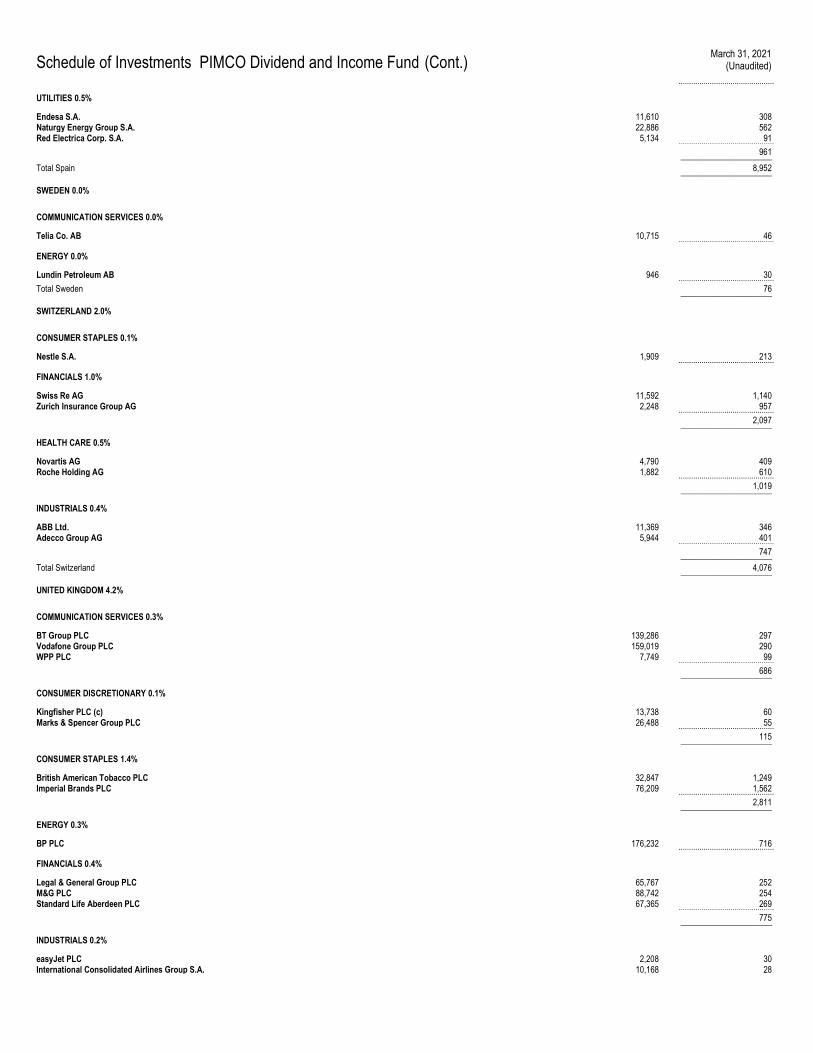
UTILITIES 0.5%
Endesa S.A. 11,610 308 Naturgy Energy Group S.A. 22,886 562 Red Electrica Corp. S.A. 5,134 91 .............................................. 961 ______________________
Total Spain 8,952 ______________________
SWEDEN 0.0%
COMMUNICATION SERVICES 0.0%
Telia Co. AB 10,715 46 ..............................................
ENERGY 0.0%
Lundin Petroleum AB 946 30 .............................................. Total Sweden 76 ______________________
SWITZERLAND 2.0%
CONSUMER STAPLES 0.1%
Nestle S.A. 1,909 213 ..............................................
FINANCIALS 1.0%
Swiss Re AG 11,592 1,140 Zurich Insurance Group AG 2,248 957 .............................................. 2,097 ______________________
HEALTH CARE 0.5%
Novartis AG 4,790 409 Roche Holding AG 1,882 610 .............................................. 1,019 ______________________
INDUSTRIALS 0.4%
ABB Ltd. 11,369 346 Adecco Group AG 5,944 401 .............................................. 747 ______________________
Total Switzerland 4,076 ______________________
UNITED KINGDOM 4.2%
COMMUNICATION SERVICES 0.3%
BT Group PLC 139,286 297 Vodafone Group PLC 159,019 290 WPP PLC 7,749 99 .............................................. 686 ______________________
CONSUMER DISCRETIONARY 0.1%
Kingfisher PLC (c) 13,738 60 Marks & Spencer Group PLC 26,488 55 .............................................. 115 ______________________
CONSUMER STAPLES 1.4%
British American Tobacco PLC 32,847 1,249 Imperial Brands PLC 76,209 1,562 .............................................. 2,811 ______________________
ENERGY 0.3%
BP PLC 176,232 716 ..............................................
FINANCIALS 0.4%
Legal & General Group PLC 65,767 252 M&G PLC 88,742 254 Standard Life Aberdeen PLC 67,365 269 .............................................. 775 ______________________
INDUSTRIALS 0.2%
easyJet PLC 2,208 30 International Consolidated Airlines Group S.A. 10,168 28
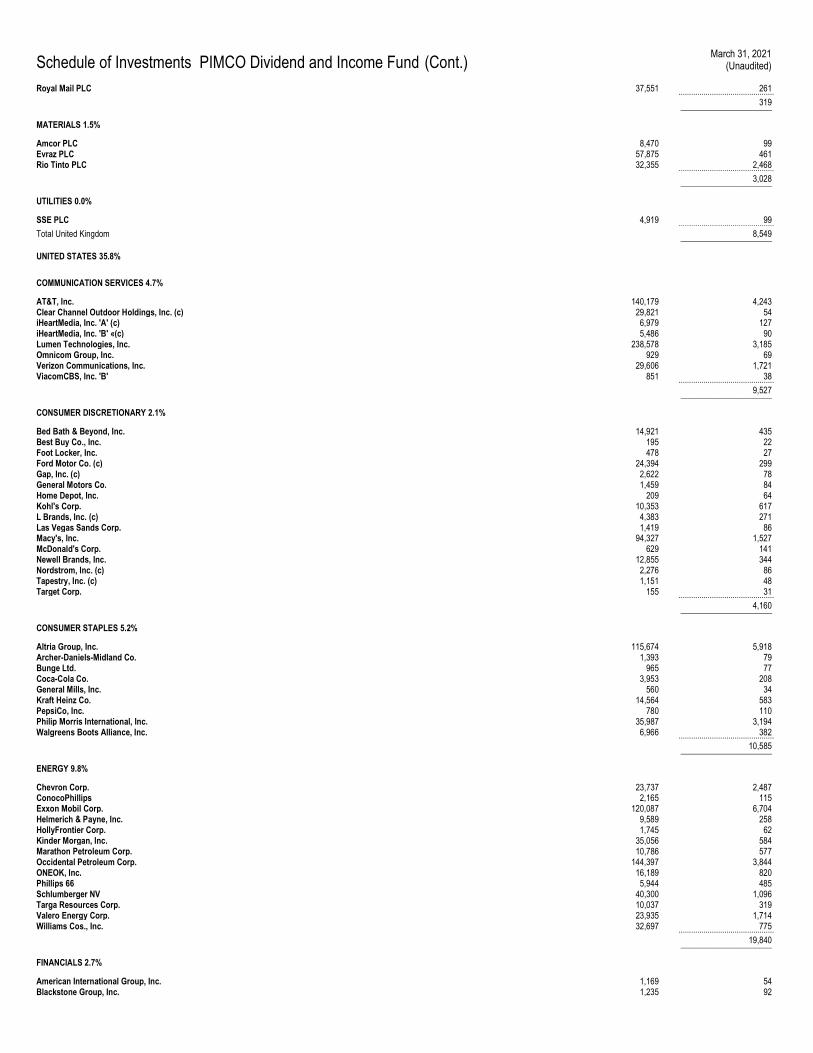
Schedule of Investments PIMCO Dividend and Income Fund (Cont.) March 31, 2021
(Unaudited)
Royal Mail PLC 37,551 261 .............................................. 319 ______________________
MATERIALS 1.5%
Amcor PLC 8,470 99 Evraz PLC 57,875 461 Rio Tinto PLC 32,355 2,468 .............................................. 3,028 ______________________
UTILITIES 0.0%
SSE PLC 4,919 99 .............................................. Total United Kingdom 8,549 ______________________
UNITED STATES 35.8%
COMMUNICATION SERVICES 4.7%
AT&T, Inc. 140,179 4,243 Clear Channel Outdoor Holdings, Inc. (c) 29,821 54 iHeartMedia, Inc. 'A' (c) 6,979 127 iHeartMedia, Inc. 'B' «(c) 5,486 90 Lumen Technologies, Inc. 238,578 3,185 Omnicom Group, Inc. 929 69 Verizon Communications, Inc. 29,606 1,721 ViacomCBS, Inc. 'B' 851 38 .............................................. 9,527 ______________________
CONSUMER DISCRETIONARY 2.1%
Bed Bath & Beyond, Inc. 14,921 435 Best Buy Co., Inc. 195 22 Foot Locker, Inc. 478 27 Ford Motor Co. (c) 24,394 299 Gap, Inc. (c) 2,622 78 General Motors Co. 1,459 84 Home Depot, Inc. 209 64 Kohl's Corp. 10,353 617 L Brands, Inc. (c) 4,383 271 Las Vegas Sands Corp. 1,419 86 Macy's, Inc. 94,327 1,527 McDonald's Corp. 629 141 Newell Brands, Inc. 12,855 344 Nordstrom, Inc. (c) 2,276 86 Tapestry, Inc. (c) 1,151 48 Target Corp. 155 31 .............................................. 4,160 ______________________
CONSUMER STAPLES 5.2%
Altria Group, Inc. 115,674 5,918 Archer-Daniels-Midland Co. 1,393 79 Bunge Ltd. 965 77 Coca-Cola Co. 3,953 208 General Mills, Inc. 560 34 Kraft Heinz Co. 14,564 583 PepsiCo, Inc. 780 110 Philip Morris International, Inc. 35,987 3,194 Walgreens Boots Alliance, Inc. 6,966 382 .............................................. 10,585 ______________________
ENERGY 9.8%
Chevron Corp. 23,737 2,487 ConocoPhillips 2,165 115 Exxon Mobil Corp. 120,087 6,704 Helmerich & Payne, Inc. 9,589 258 HollyFrontier Corp. 1,745 62 Kinder Morgan, Inc. 35,056 584 Marathon Petroleum Corp. 10,786 577 Occidental Petroleum Corp. 144,397 3,844 ONEOK, Inc. 16,189 820 Phillips 66 5,944 485 Schlumberger NV 40,300 1,096 Targa Resources Corp. 10,037 319 Valero Energy Corp. 23,935 1,714 Williams Cos., Inc. 32,697 775 .............................................. 19,840 ______________________
FINANCIALS 2.7%
American International Group, Inc. 1,169 54 Blackstone Group, Inc. 1,235 92
Schedule of Investments PIMCO Dividend and Income Fund (Cont.) March 31, 2021
(Unaudited)
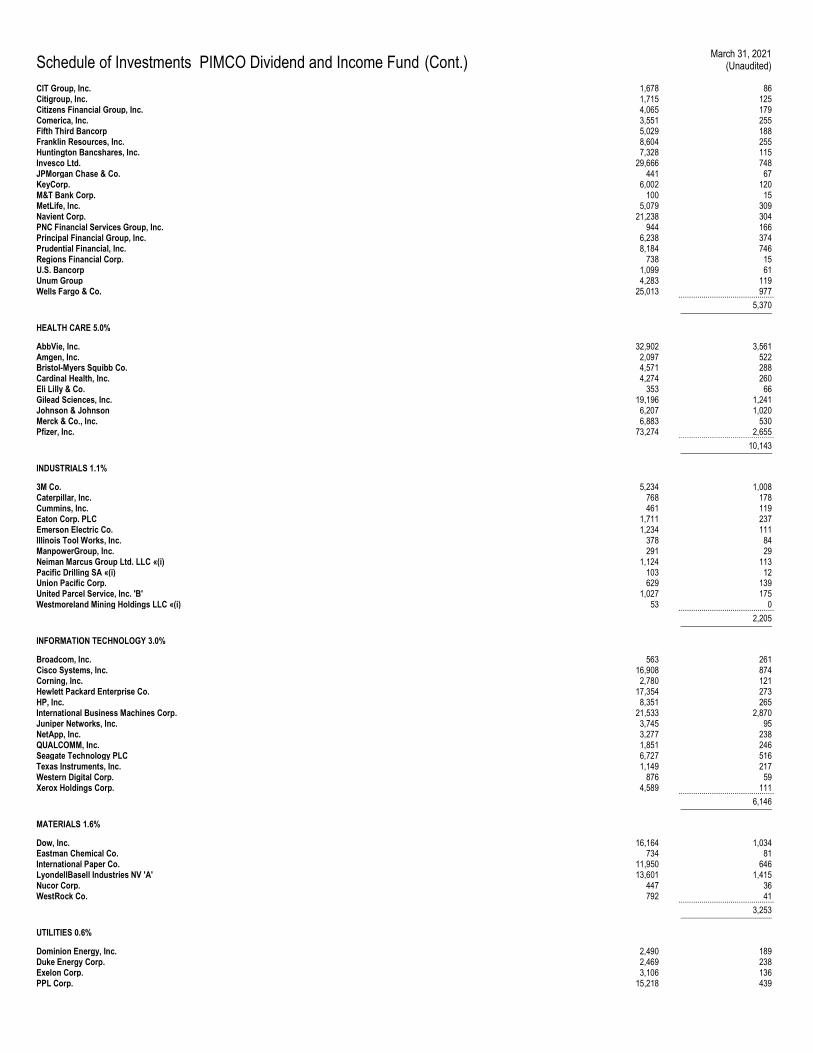
CIT Group, Inc. 1,678 86 Citigroup, Inc. 1,715 125 Citizens Financial Group, Inc. 4,065 179 Comerica, Inc. 3,551 255 Fifth Third Bancorp 5,029 188 Franklin Resources, Inc. 8,604 255 Huntington Bancshares, Inc. 7,328 115 Invesco Ltd. 29,666 748 JPMorgan Chase & Co. 441 67 KeyCorp. 6,002 120 M&T Bank Corp. 100 15 MetLife, Inc. 5,079 309 Navient Corp. 21,238 304 PNC Financial Services Group, Inc. 944 166 Principal Financial Group, Inc. 6,238 374 Prudential Financial, Inc. 8,184 746 Regions Financial Corp. 738 15 U.S. Bancorp 1,099 61 Unum Group 4,283 119 Wells Fargo & Co. 25,013 977 .............................................. 5,370 ______________________
HEALTH CARE 5.0%
AbbVie, Inc. 32,902 3,561 Amgen, Inc. 2,097 522 Bristol-Myers Squibb Co. 4,571 288 Cardinal Health, Inc. 4,274 260 Eli Lilly & Co. 353 66 Gilead Sciences, Inc. 19,196 1,241 Johnson & Johnson 6,207 1,020 Merck & Co., Inc. 6,883 530 Pfizer, Inc. 73,274 2,655 .............................................. 10,143 ______________________
INDUSTRIALS 1.1%
3M Co. 5,234 1,008 Caterpillar, Inc. 768 178 Cummins, Inc. 461 119 Eaton Corp. PLC 1,711 237 Emerson Electric Co. 1,234 111 Illinois Tool Works, Inc. 378 84 ManpowerGroup, Inc. 291 29 Neiman Marcus Group Ltd. LLC «(i) 1,124 113 Pacific Drilling SA «(i) 103 12 Union Pacific Corp. 629 139 United Parcel Service, Inc. 'B' 1,027 175 Westmoreland Mining Holdings LLC «(i) 53 0 .............................................. 2,205 ______________________
INFORMATION TECHNOLOGY 3.0%
Broadcom, Inc. 563 261 Cisco Systems, Inc. 16,908 874 Corning, Inc. 2,780 121 Hewlett Packard Enterprise Co. 17,354 273 HP, Inc. 8,351 265 International Business Machines Corp. 21,533 2,870 Juniper Networks, Inc. 3,745 95 NetApp, Inc. 3,277 238 QUALCOMM, Inc. 1,851 246 Seagate Technology PLC 6,727 516 Texas Instruments, Inc. 1,149 217 Western Digital Corp. 876 59 Xerox Holdings Corp. 4,589 111 .............................................. 6,146 ______________________
MATERIALS 1.6%
Dow, Inc. 16,164 1,034 Eastman Chemical Co. 734 81 International Paper Co. 11,950 646 LyondellBasell Industries NV 'A' 13,601 1,415 Nucor Corp. 447 36 WestRock Co. 792 41 .............................................. 3,253 ______________________
UTILITIES 0.6%
Dominion Energy, Inc. 2,490 189 Duke Energy Corp. 2,469 238 Exelon Corp. 3,106 136 PPL Corp. 15,218 439
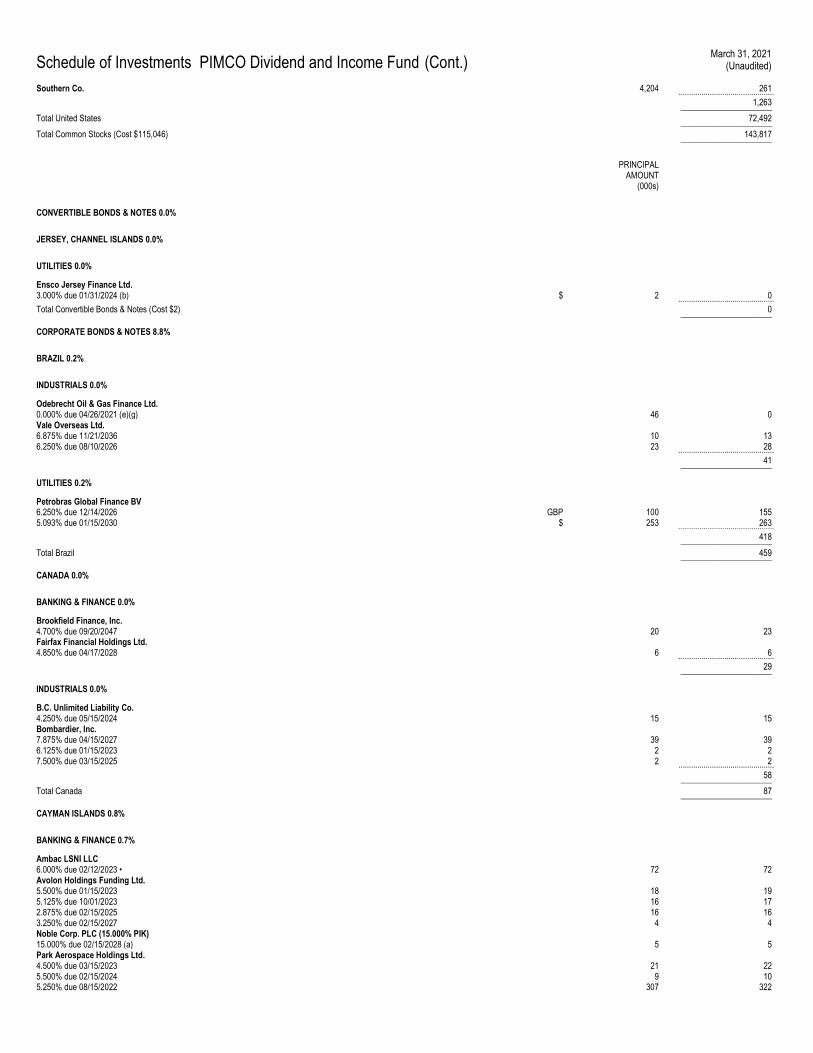
Schedule of Investments PIMCO Dividend and Income Fund (Cont.) March 31, 2021
(Unaudited)
Southern Co. 4,204 261 .............................................. 1,263 ______________________
Total United States 72,492 ______________________
Total Common Stocks (Cost $115,046) 143,817 ______________________
PRINCIPAL AMOUNT
(000s)
CONVERTIBLE BONDS & NOTES 0.0%
JERSEY, CHANNEL ISLANDS 0.0%
UTILITIES 0.0%
Ensco Jersey Finance Ltd. 3.000% due 01/31/2024 (b) $ 2 0 .............................................. Total Convertible Bonds & Notes (Cost $2) 0 ______________________
CORPORATE BONDS & NOTES 8.8%
BRAZIL 0.2%
INDUSTRIALS 0.0%
Odebrecht Oil & Gas Finance Ltd. 0.000% due 04/26/2021 (e)(g) 46 0 Vale Overseas Ltd. 6.875% due 11/21/2036 10 13 6.250% due 08/10/2026 23 28 .............................................. 41 ______________________
UTILITIES 0.2%
Petrobras Global Finance BV 6.250% due 12/14/2026 GBP 100 155 5.093% due 01/15/2030 $ 253 263 .............................................. 418 ______________________
Total Brazil 459 ______________________
CANADA 0.0%
BANKING & FINANCE 0.0%
Brookfield Finance, Inc. 4.700% due 09/20/2047 20 23 Fairfax Financial Holdings Ltd. 4.850% due 04/17/2028 6 6 .............................................. 29 ______________________
INDUSTRIALS 0.0%
B.C. Unlimited Liability Co. 4.250% due 05/15/2024 15 15 Bombardier, Inc. 7.875% due 04/15/2027 39 39 6.125% due 01/15/2023 2 2 7.500% due 03/15/2025 2 2 .............................................. 58 ______________________
Total Canada 87 ______________________
CAYMAN ISLANDS 0.8%
BANKING & FINANCE 0.7%
Ambac LSNI LLC 6.000% due 02/12/2023 • 72 72 Avolon Holdings Funding Ltd. 5.500% due 01/15/2023 18 19 5.125% due 10/01/2023 16 17 2.875% due 02/15/2025 16 16 3.250% due 02/15/2027 4 4 Noble Corp. PLC (15.000% PIK) 15.000% due 02/15/2028 (a) 5 5 Park Aerospace Holdings Ltd. 4.500% due 03/15/2023 21 22 5.500% due 02/15/2024 9 10 5.250% due 08/15/2022 307 322
Schedule of Investments PIMCO Dividend and Income Fund (Cont.) March 31, 2021
(Unaudited)
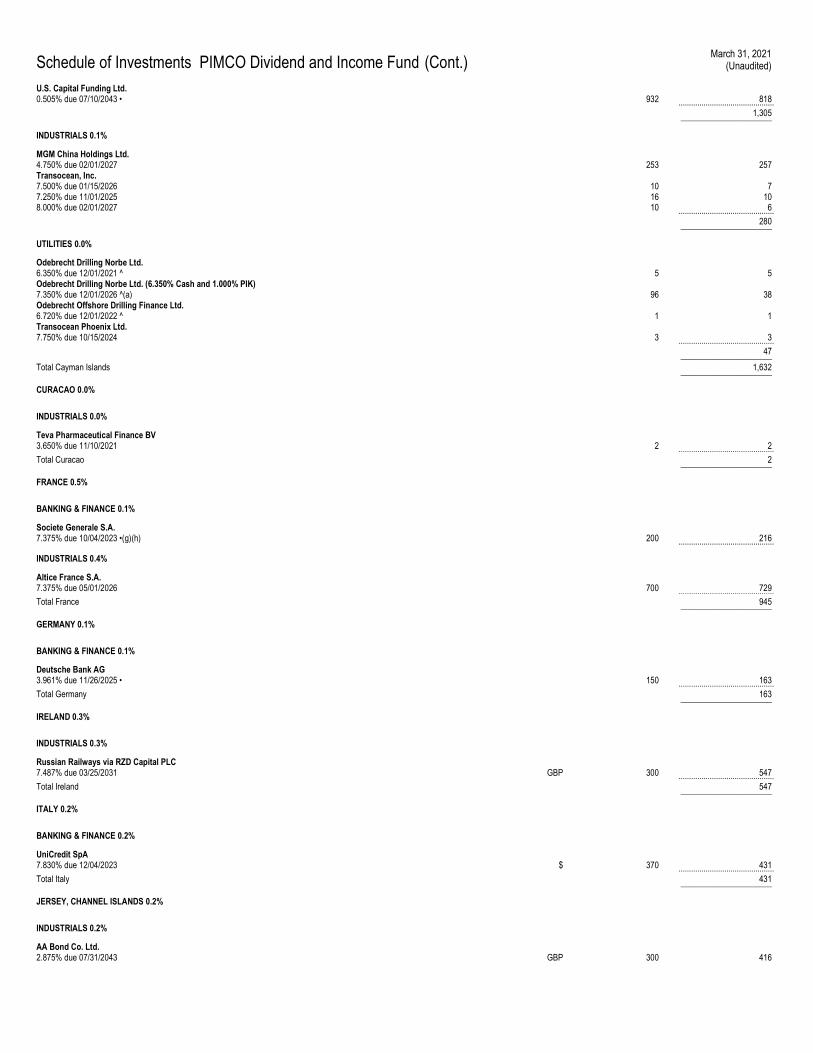
U.S. Capital Funding Ltd. 0.505% due 07/10/2043 • 932 818 .............................................. 1,305 ______________________
INDUSTRIALS 0.1%
MGM China Holdings Ltd. 4.750% due 02/01/2027 253 257 Transocean, Inc. 7.500% due 01/15/2026 10 7 7.250% due 11/01/2025 16 10 8.000% due 02/01/2027 10 6 .............................................. 280 ______________________
UTILITIES 0.0%
Odebrecht Drilling Norbe Ltd. 6.350% due 12/01/2021 ^ 5 5 Odebrecht Drilling Norbe Ltd. (6.350% Cash and 1.000% PIK) 7.350% due 12/01/2026 ^(a) 96 38 Odebrecht Offshore Drilling Finance Ltd. 6.720% due 12/01/2022 ^ 1 1 Transocean Phoenix Ltd. 7.750% due 10/15/2024 3 3 .............................................. 47 ______________________
Total Cayman Islands 1,632 ______________________
CURACAO 0.0%
INDUSTRIALS 0.0%
Teva Pharmaceutical Finance BV 3.650% due 11/10/2021 2 2 .............................................. Total Curacao 2 ______________________
FRANCE 0.5%
BANKING & FINANCE 0.1%
Societe Generale S.A. 7.375% due 10/04/2023 •(g)(h) 200 216 ..............................................
INDUSTRIALS 0.4%
Altice France S.A. 7.375% due 05/01/2026 700 729 .............................................. Total France 945 ______________________
GERMANY 0.1%
BANKING & FINANCE 0.1%
Deutsche Bank AG 3.961% due 11/26/2025 • 150 163 .............................................. Total Germany 163 ______________________
IRELAND 0.3%
INDUSTRIALS 0.3%
Russian Railways via RZD Capital PLC 7.487% due 03/25/2031 GBP 300 547 .............................................. Total Ireland 547 ______________________
ITALY 0.2%
BANKING & FINANCE 0.2%
UniCredit SpA 7.830% due 12/04/2023 $ 370 431 .............................................. Total Italy 431 ______________________
JERSEY, CHANNEL ISLANDS 0.2%
INDUSTRIALS 0.2%
AA Bond Co. Ltd. 2.875% due 07/31/2043 GBP 300 416
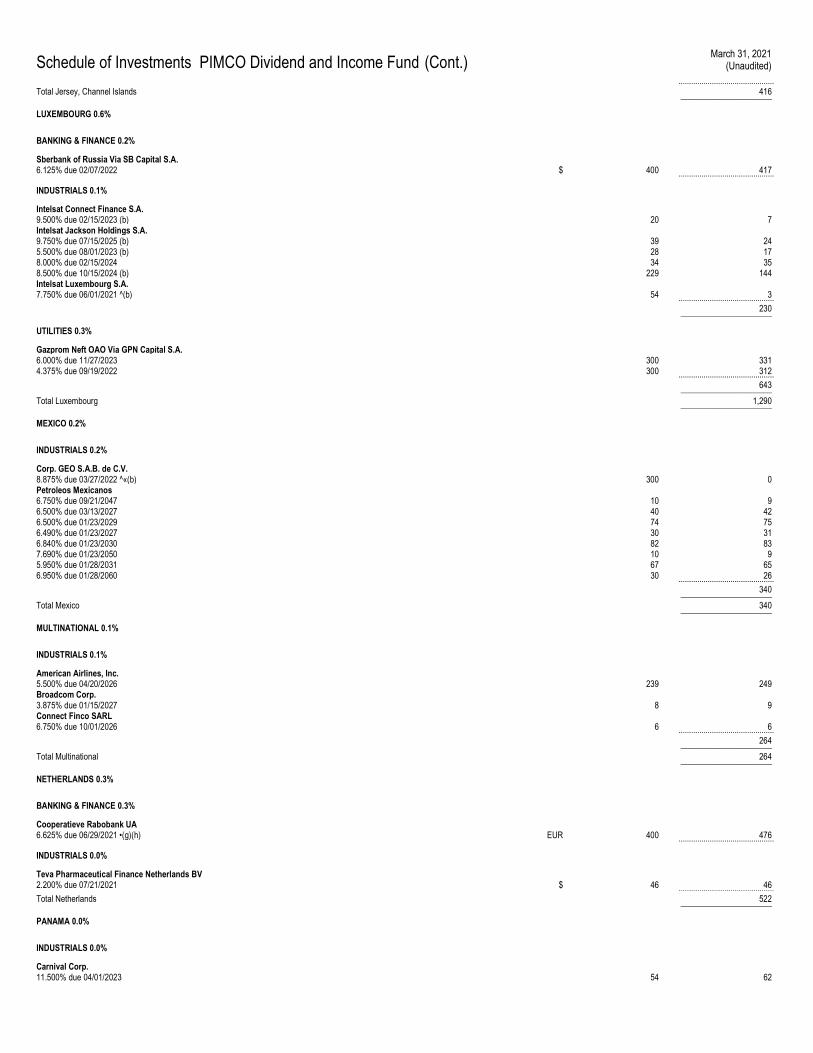
Schedule of Investments PIMCO Dividend and Income Fund (Cont.) March 31, 2021
(Unaudited)
.............................................. Total Jersey, Channel Islands 416 ______________________
LUXEMBOURG 0.6%
BANKING & FINANCE 0.2%
Sberbank of Russia Via SB Capital S.A. 6.125% due 02/07/2022 $ 400 417 ..............................................
INDUSTRIALS 0.1%
Intelsat Connect Finance S.A. 9.500% due 02/15/2023 (b) 20 7 Intelsat Jackson Holdings S.A. 9.750% due 07/15/2025 (b) 39 24 5.500% due 08/01/2023 (b) 28 17 8.000% due 02/15/2024 34 35 8.500% due 10/15/2024 (b) 229 144 Intelsat Luxembourg S.A. 7.750% due 06/01/2021 ^(b) 54 3 .............................................. 230 ______________________
UTILITIES 0.3%
Gazprom Neft OAO Via GPN Capital S.A. 6.000% due 11/27/2023 300 331 4.375% due 09/19/2022 300 312 .............................................. 643 ______________________
Total Luxembourg 1,290 ______________________
MEXICO 0.2%
INDUSTRIALS 0.2%
Corp. GEO S.A.B. de C.V. 8.875% due 03/27/2022 ^«(b) 300 0 Petroleos Mexicanos 6.750% due 09/21/2047 10 9 6.500% due 03/13/2027 40 42 6.500% due 01/23/2029 74 75 6.490% due 01/23/2027 30 31 6.840% due 01/23/2030 82 83 7.690% due 01/23/2050 10 9 5.950% due 01/28/2031 67 65 6.950% due 01/28/2060 30 26 .............................................. 340 ______________________
Total Mexico 340 ______________________
MULTINATIONAL 0.1%
INDUSTRIALS 0.1%
American Airlines, Inc. 5.500% due 04/20/2026 239 249 Broadcom Corp. 3.875% due 01/15/2027 8 9 Connect Finco SARL 6.750% due 10/01/2026 6 6 .............................................. 264 ______________________
Total Multinational 264 ______________________
NETHERLANDS 0.3%
BANKING & FINANCE 0.3%
Cooperatieve Rabobank UA 6.625% due 06/29/2021 •(g)(h) EUR 400 476 ..............................................
INDUSTRIALS 0.0%
Teva Pharmaceutical Finance Netherlands BV 2.200% due 07/21/2021 $ 46 46 .............................................. Total Netherlands 522 ______________________
PANAMA 0.0%
INDUSTRIALS 0.0%
Carnival Corp. 11.500% due 04/01/2023 54 62
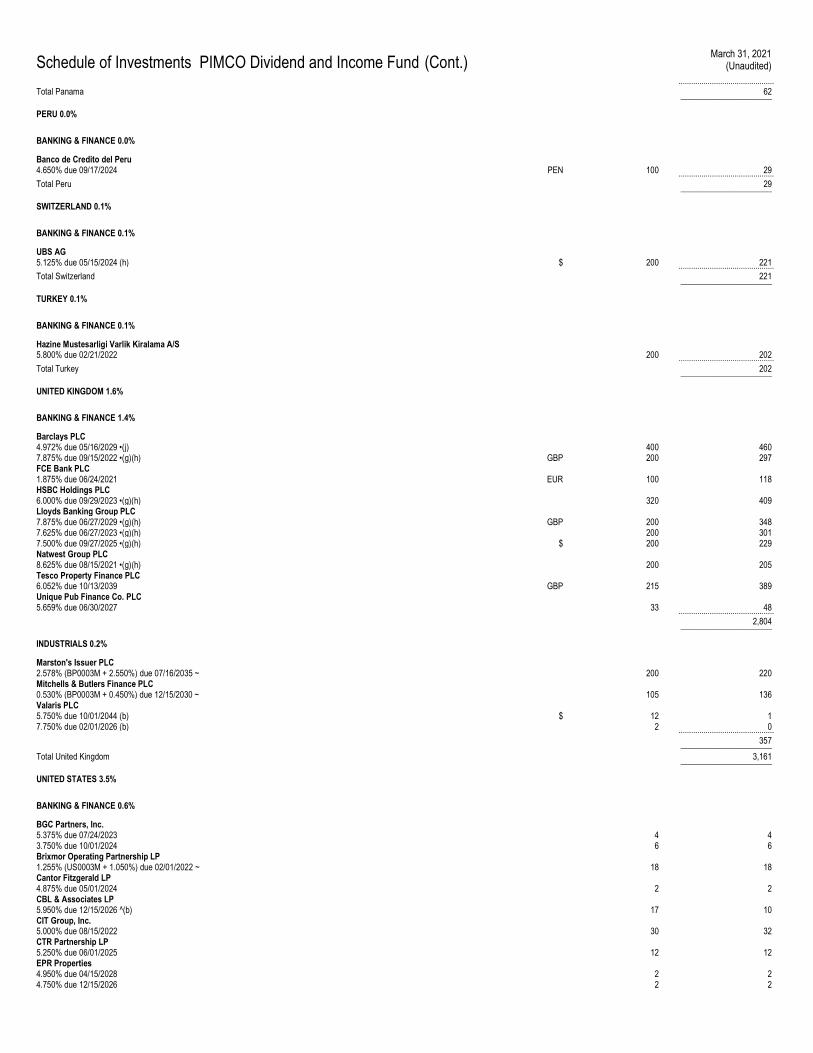
Schedule of Investments PIMCO Dividend and Income Fund (Cont.) March 31, 2021
(Unaudited)
.............................................. Total Panama 62 ______________________
PERU 0.0%
BANKING & FINANCE 0.0%
Banco de Credito del Peru 4.650% due 09/17/2024 PEN 100 29 .............................................. Total Peru 29 ______________________
SWITZERLAND 0.1%
BANKING & FINANCE 0.1%
UBS AG 5.125% due 05/15/2024 (h) $ 200 221 .............................................. Total Switzerland 221 ______________________
TURKEY 0.1%
BANKING & FINANCE 0.1%
Hazine Mustesarligi Varlik Kiralama A/S 5.800% due 02/21/2022 200 202 .............................................. Total Turkey 202 ______________________
UNITED KINGDOM 1.6%
BANKING & FINANCE 1.4%
Barclays PLC 4.972% due 05/16/2029 •(j) 400 460 7.875% due 09/15/2022 •(g)(h) GBP 200 297 FCE Bank PLC 1.875% due 06/24/2021 EUR 100 118 HSBC Holdings PLC 6.000% due 09/29/2023 •(g)(h) 320 409 Lloyds Banking Group PLC 7.875% due 06/27/2029 •(g)(h) GBP 200 348 7.625% due 06/27/2023 •(g)(h) 200 301 7.500% due 09/27/2025 •(g)(h) $ 200 229 Natwest Group PLC 8.625% due 08/15/2021 •(g)(h) 200 205 Tesco Property Finance PLC 6.052% due 10/13/2039 GBP 215 389 Unique Pub Finance Co. PLC 5.659% due 06/30/2027 33 48 .............................................. 2,804 ______________________
INDUSTRIALS 0.2%
Marston's Issuer PLC 2.578% (BP0003M + 2.550%) due 07/16/2035 ~ 200 220 Mitchells & Butlers Finance PLC 0.530% (BP0003M + 0.450%) due 12/15/2030 ~ 105 136 Valaris PLC 5.750% due 10/01/2044 (b) $ 12 1 7.750% due 02/01/2026 (b) 2 0 .............................................. 357 ______________________
Total United Kingdom 3,161 ______________________
UNITED STATES 3.5%
BANKING & FINANCE 0.6%
BGC Partners, Inc. 5.375% due 07/24/2023 4 4 3.750% due 10/01/2024 6 6 Brixmor Operating Partnership LP 1.255% (US0003M + 1.050%) due 02/01/2022 ~ 18 18 Cantor Fitzgerald LP 4.875% due 05/01/2024 2 2 CBL & Associates LP 5.950% due 12/15/2026 ^(b) 17 10 CIT Group, Inc. 5.000% due 08/15/2022 30 32 CTR Partnership LP 5.250% due 06/01/2025 12 12 EPR Properties 4.950% due 04/15/2028 2 2 4.750% due 12/15/2026 2 2
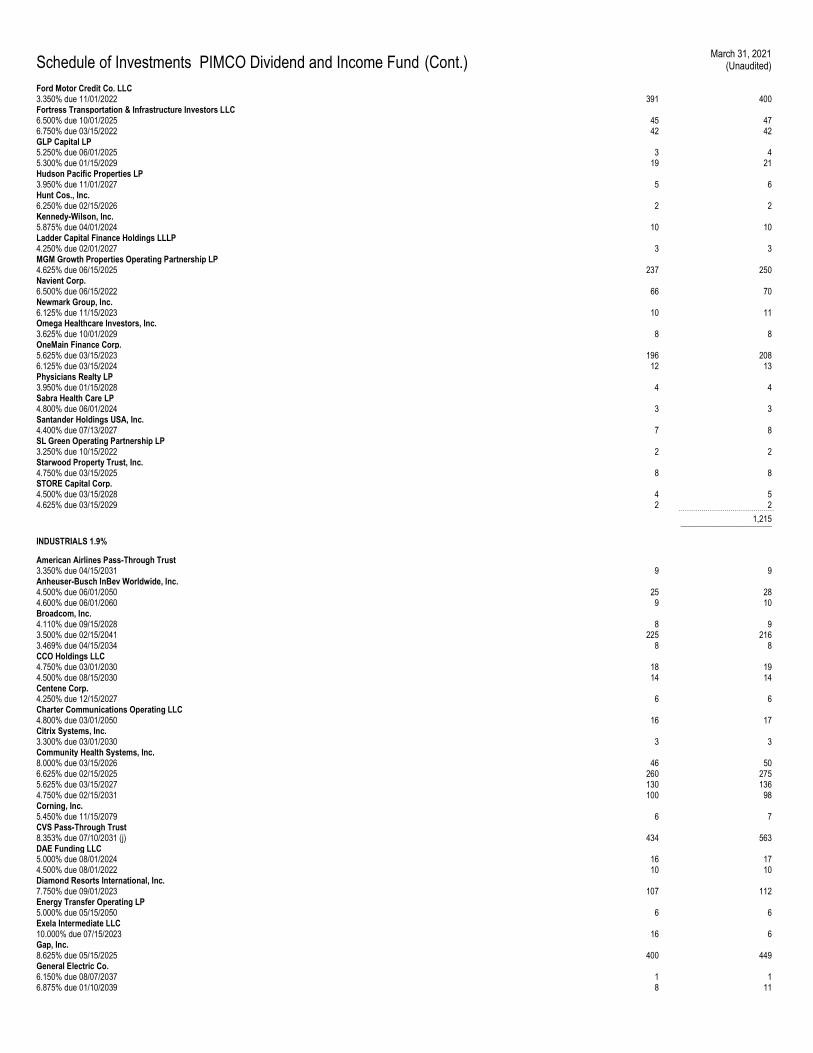
Schedule of Investments PIMCO Dividend and Income Fund (Cont.) March 31, 2021
(Unaudited)
Ford Motor Credit Co. LLC 3.350% due 11/01/2022 391 400 Fortress Transportation & Infrastructure Investors LLC 6.500% due 10/01/2025 45 47 6.750% due 03/15/2022 42 42 GLP Capital LP 5.250% due 06/01/2025 3 4 5.300% due 01/15/2029 19 21 Hudson Pacific Properties LP 3.950% due 11/01/2027 5 6 Hunt Cos., Inc. 6.250% due 02/15/2026 2 2 Kennedy-Wilson, Inc. 5.875% due 04/01/2024 10 10 Ladder Capital Finance Holdings LLLP 4.250% due 02/01/2027 3 3 MGM Growth Properties Operating Partnership LP 4.625% due 06/15/2025 237 250 Navient Corp. 6.500% due 06/15/2022 66 70 Newmark Group, Inc. 6.125% due 11/15/2023 10 11 Omega Healthcare Investors, Inc. 3.625% due 10/01/2029 8 8 OneMain Finance Corp. 5.625% due 03/15/2023 196 208 6.125% due 03/15/2024 12 13 Physicians Realty LP 3.950% due 01/15/2028 4 4 Sabra Health Care LP 4.800% due 06/01/2024 3 3 Santander Holdings USA, Inc. 4.400% due 07/13/2027 7 8 SL Green Operating Partnership LP 3.250% due 10/15/2022 2 2 Starwood Property Trust, Inc. 4.750% due 03/15/2025 8 8 STORE Capital Corp. 4.500% due 03/15/2028 4 5 4.625% due 03/15/2029 2 2 .............................................. 1,215 ______________________
INDUSTRIALS 1.9%
American Airlines Pass-Through Trust 3.350% due 04/15/2031 9 9 Anheuser-Busch InBev Worldwide, Inc. 4.500% due 06/01/2050 25 28 4.600% due 06/01/2060 9 10 Broadcom, Inc. 4.110% due 09/15/2028 8 9 3.500% due 02/15/2041 225 216 3.469% due 04/15/2034 8 8 CCO Holdings LLC 4.750% due 03/01/2030 18 19 4.500% due 08/15/2030 14 14 Centene Corp. 4.250% due 12/15/2027 6 6 Charter Communications Operating LLC 4.800% due 03/01/2050 16 17 Citrix Systems, Inc. 3.300% due 03/01/2030 3 3 Community Health Systems, Inc. 8.000% due 03/15/2026 46 50 6.625% due 02/15/2025 260 275 5.625% due 03/15/2027 130 136 4.750% due 02/15/2031 100 98 Corning, Inc. 5.450% due 11/15/2079 6 7 CVS Pass-Through Trust 8.353% due 07/10/2031 (j) 434 563 DAE Funding LLC 5.000% due 08/01/2024 16 17 4.500% due 08/01/2022 10 10 Diamond Resorts International, Inc. 7.750% due 09/01/2023 107 112 Energy Transfer Operating LP 5.000% due 05/15/2050 6 6 Exela Intermediate LLC 10.000% due 07/15/2023 16 6 Gap, Inc. 8.625% due 05/15/2025 400 449 General Electric Co. 6.150% due 08/07/2037 1 1 6.875% due 01/10/2039 8 11
Schedule of Investments PIMCO Dividend and Income Fund (Cont.) March 31, 2021
(Unaudited)
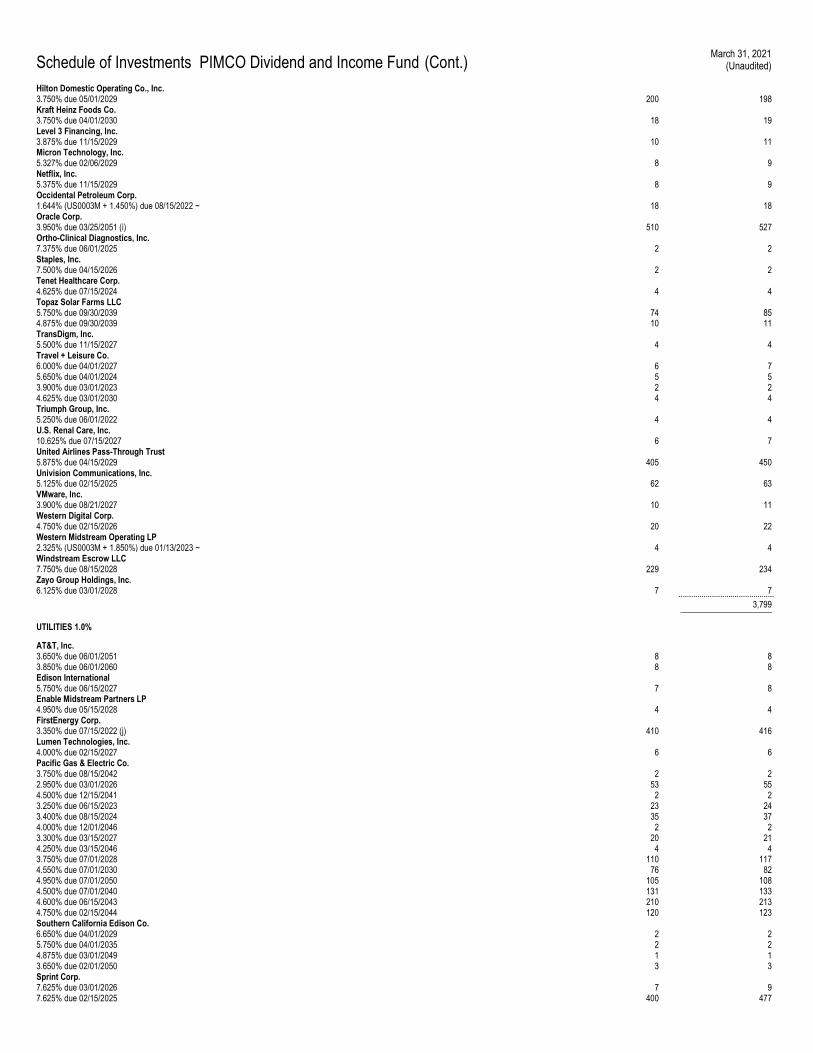
Hilton Domestic Operating Co., Inc. 3.750% due 05/01/2029 200 198 Kraft Heinz Foods Co. 3.750% due 04/01/2030 18 19 Level 3 Financing, Inc. 3.875% due 11/15/2029 10 11 Micron Technology, Inc. 5.327% due 02/06/2029 8 9 Netflix, Inc. 5.375% due 11/15/2029 8 9 Occidental Petroleum Corp. 1.644% (US0003M + 1.450%) due 08/15/2022 ~ 18 18 Oracle Corp. 3.950% due 03/25/2051 (i) 510 527 Ortho-Clinical Diagnostics, Inc. 7.375% due 06/01/2025 2 2 Staples, Inc. 7.500% due 04/15/2026 2 2 Tenet Healthcare Corp. 4.625% due 07/15/2024 4 4 Topaz Solar Farms LLC 5.750% due 09/30/2039 74 85 4.875% due 09/30/2039 10 11 TransDigm, Inc. 5.500% due 11/15/2027 4 4 Travel + Leisure Co. 6.000% due 04/01/2027 6 7 5.650% due 04/01/2024 5 5 3.900% due 03/01/2023 2 2 4.625% due 03/01/2030 4 4 Triumph Group, Inc. 5.250% due 06/01/2022 4 4 U.S. Renal Care, Inc. 10.625% due 07/15/2027 6 7 United Airlines Pass-Through Trust 5.875% due 04/15/2029 405 450 Univision Communications, Inc. 5.125% due 02/15/2025 62 63 VMware, Inc. 3.900% due 08/21/2027 10 11 Western Digital Corp. 4.750% due 02/15/2026 20 22 Western Midstream Operating LP 2.325% (US0003M + 1.850%) due 01/13/2023 ~ 4 4 Windstream Escrow LLC 7.750% due 08/15/2028 229 234 Zayo Group Holdings, Inc. 6.125% due 03/01/2028 7 7 .............................................. 3,799 ______________________
UTILITIES 1.0%
AT&T, Inc. 3.650% due 06/01/2051 8 8 3.850% due 06/01/2060 8 8 Edison International 5.750% due 06/15/2027 7 8 Enable Midstream Partners LP 4.950% due 05/15/2028 4 4 FirstEnergy Corp. 3.350% due 07/15/2022 (j) 410 416 Lumen Technologies, Inc. 4.000% due 02/15/2027 6 6 Pacific Gas & Electric Co. 3.750% due 08/15/2042 2 2 2.950% due 03/01/2026 53 55 4.500% due 12/15/2041 2 2 3.250% due 06/15/2023 23 24 3.400% due 08/15/2024 35 37 4.000% due 12/01/2046 2 2 3.300% due 03/15/2027 20 21 4.250% due 03/15/2046 4 4 3.750% due 07/01/2028 110 117 4.550% due 07/01/2030 76 82 4.950% due 07/01/2050 105 108 4.500% due 07/01/2040 131 133 4.600% due 06/15/2043 210 213 4.750% due 02/15/2044 120 123 Southern California Edison Co. 6.650% due 04/01/2029 2 2 5.750% due 04/01/2035 2 2 4.875% due 03/01/2049 1 1 3.650% due 02/01/2050 3 3 Sprint Corp. 7.625% due 03/01/2026 7 9 7.625% due 02/15/2025 400 477
Schedule of Investments PIMCO Dividend and Income Fund (Cont.) March 31, 2021
(Unaudited)
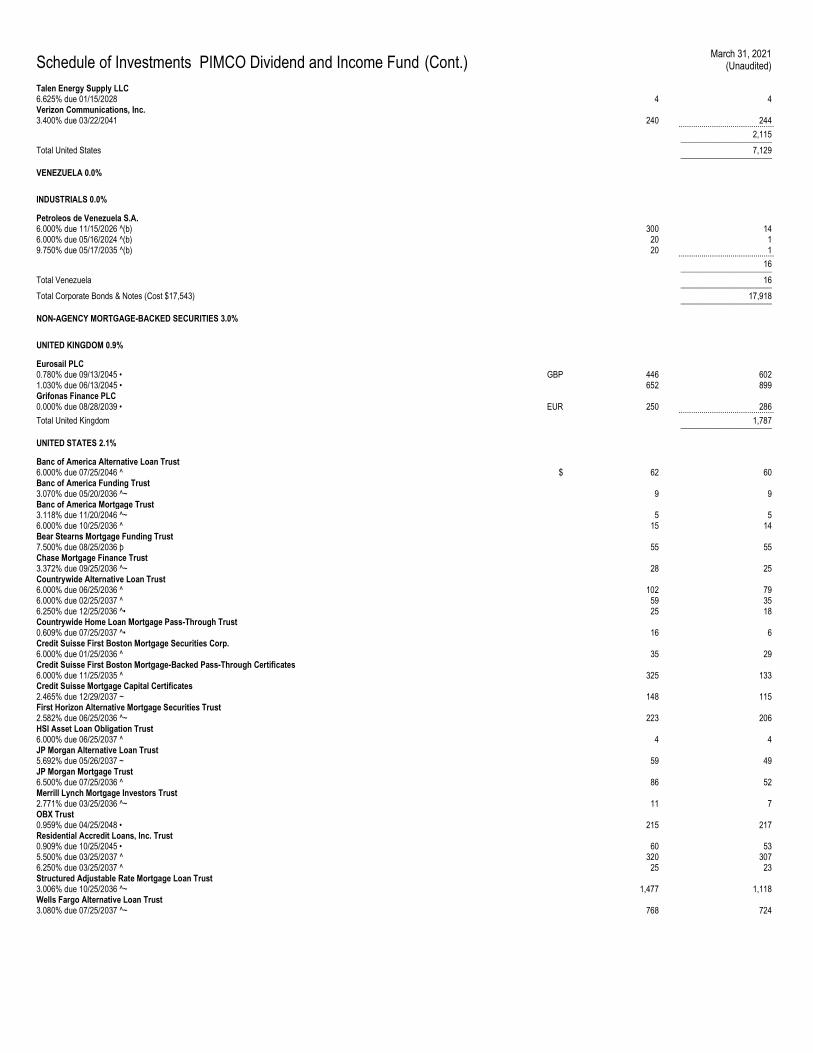
Talen Energy Supply LLC 6.625% due 01/15/2028 4 4 Verizon Communications, Inc. 3.400% due 03/22/2041 240 244 .............................................. 2,115 ______________________
Total United States 7,129 ______________________
VENEZUELA 0.0%
INDUSTRIALS 0.0%
Petroleos de Venezuela S.A. 6.000% due 11/15/2026 ^(b) 300 14 6.000% due 05/16/2024 ^(b) 20 1 9.750% due 05/17/2035 ^(b) 20 1 .............................................. 16 ______________________
Total Venezuela 16 ______________________
Total Corporate Bonds & Notes (Cost $17,543) 17,918 ______________________
NON-AGENCY MORTGAGE-BACKED SECURITIES 3.0%
UNITED KINGDOM 0.9%
Eurosail PLC 0.780% due 09/13/2045 • GBP 446 602 1.030% due 06/13/2045 • 652 899 Grifonas Finance PLC 0.000% due 08/28/2039 • EUR 250 286 .............................................. Total United Kingdom 1,787 ______________________
UNITED STATES 2.1%
Banc of America Alternative Loan Trust 6.000% due 07/25/2046 ^ $ 62 60 Banc of America Funding Trust 3.070% due 05/20/2036 ^~ 9 9 Banc of America Mortgage Trust 3.118% due 11/20/2046 ^~ 5 5 6.000% due 10/25/2036 ^ 15 14 Bear Stearns Mortgage Funding Trust 7.500% due 08/25/2036 þ 55 55 Chase Mortgage Finance Trust 3.372% due 09/25/2036 ^~ 28 25 Countrywide Alternative Loan Trust 6.000% due 06/25/2036 ^ 102 79 6.000% due 02/25/2037 ^ 59 35 6.250% due 12/25/2036 ^• 25 18 Countrywide Home Loan Mortgage Pass-Through Trust 0.609% due 07/25/2037 ^• 16 6 Credit Suisse First Boston Mortgage Securities Corp. 6.000% due 01/25/2036 ^ 35 29 Credit Suisse First Boston Mortgage-Backed Pass-Through Certificates 6.000% due 11/25/2035 ^ 325 133 Credit Suisse Mortgage Capital Certificates 2.465% due 12/29/2037 ~ 148 115 First Horizon Alternative Mortgage Securities Trust 2.582% due 06/25/2036 ^~ 223 206 HSI Asset Loan Obligation Trust 6.000% due 06/25/2037 ^ 4 4 JP Morgan Alternative Loan Trust 5.692% due 05/26/2037 ~ 59 49 JP Morgan Mortgage Trust 6.500% due 07/25/2036 ^ 86 52 Merrill Lynch Mortgage Investors Trust 2.771% due 03/25/2036 ^~ 11 7 OBX Trust 0.959% due 04/25/2048 • 215 217 Residential Accredit Loans, Inc. Trust 0.909% due 10/25/2045 • 60 53 5.500% due 03/25/2037 ^ 320 307 6.250% due 03/25/2037 ^ 25 23 Structured Adjustable Rate Mortgage Loan Trust 3.006% due 10/25/2036 ^~ 1,477 1,118 Wells Fargo Alternative Loan Trust 3.080% due 07/25/2037 ^~ 768 724
Schedule of Investments PIMCO Dividend and Income Fund (Cont.) March 31, 2021
(Unaudited)
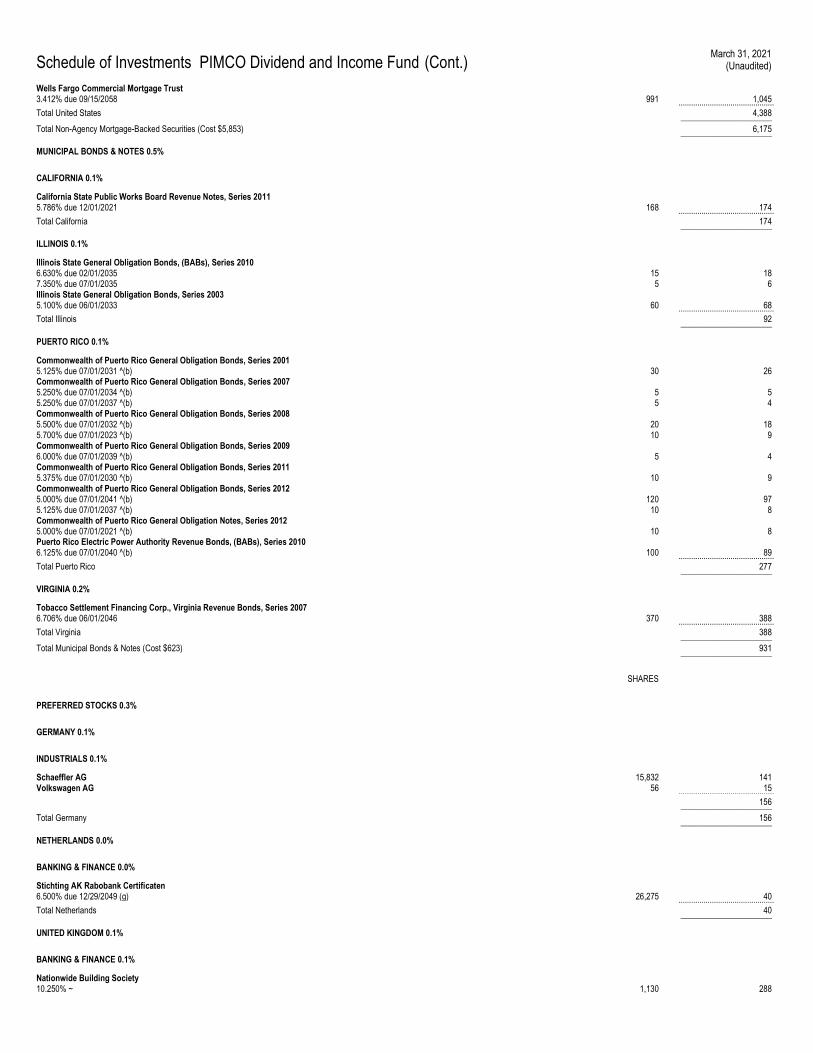
Wells Fargo Commercial Mortgage Trust 3.412% due 09/15/2058 991 1,045 .............................................. Total United States 4,388 ______________________
Total Non-Agency Mortgage-Backed Securities (Cost $5,853) 6,175 ______________________
MUNICIPAL BONDS & NOTES 0.5%
CALIFORNIA 0.1%
California State Public Works Board Revenue Notes, Series 2011 5.786% due 12/01/2021 168 174 .............................................. Total California 174 ______________________
ILLINOIS 0.1%
Illinois State General Obligation Bonds, (BABs), Series 2010 6.630% due 02/01/2035 15 18 7.350% due 07/01/2035 5 6 Illinois State General Obligation Bonds, Series 2003 5.100% due 06/01/2033 60 68 .............................................. Total Illinois 92 ______________________
PUERTO RICO 0.1%
Commonwealth of Puerto Rico General Obligation Bonds, Series 2001 5.125% due 07/01/2031 ^(b) 30 26 Commonwealth of Puerto Rico General Obligation Bonds, Series 2007 5.250% due 07/01/2034 ^(b) 5 5 5.250% due 07/01/2037 ^(b) 5 4 Commonwealth of Puerto Rico General Obligation Bonds, Series 2008 5.500% due 07/01/2032 ^(b) 20 18 5.700% due 07/01/2023 ^(b) 10 9 Commonwealth of Puerto Rico General Obligation Bonds, Series 2009 6.000% due 07/01/2039 ^(b) 5 4 Commonwealth of Puerto Rico General Obligation Bonds, Series 2011 5.375% due 07/01/2030 ^(b) 10 9 Commonwealth of Puerto Rico General Obligation Bonds, Series 2012 5.000% due 07/01/2041 ^(b) 120 97 5.125% due 07/01/2037 ^(b) 10 8 Commonwealth of Puerto Rico General Obligation Notes, Series 2012 5.000% due 07/01/2021 ^(b) 10 8 Puerto Rico Electric Power Authority Revenue Bonds, (BABs), Series 2010 6.125% due 07/01/2040 ^(b) 100 89 .............................................. Total Puerto Rico 277 ______________________
VIRGINIA 0.2%
Tobacco Settlement Financing Corp., Virginia Revenue Bonds, Series 2007 6.706% due 06/01/2046 370 388 .............................................. Total Virginia 388 ______________________
Total Municipal Bonds & Notes (Cost $623) 931 ______________________
SHARES
PREFERRED STOCKS 0.3%
GERMANY 0.1%
INDUSTRIALS 0.1%
Schaeffler AG 15,832 141 Volkswagen AG 56 15 .............................................. 156 ______________________
Total Germany 156 ______________________
NETHERLANDS 0.0%
BANKING & FINANCE 0.0%
Stichting AK Rabobank Certificaten 6.500% due 12/29/2049 (g) 26,275 40 .............................................. Total Netherlands 40 ______________________
UNITED KINGDOM 0.1%
BANKING & FINANCE 0.1%
Nationwide Building Society 10.250% ~ 1,130 288
Schedule of Investments PIMCO Dividend and Income Fund (Cont.) March 31, 2021
(Unaudited)
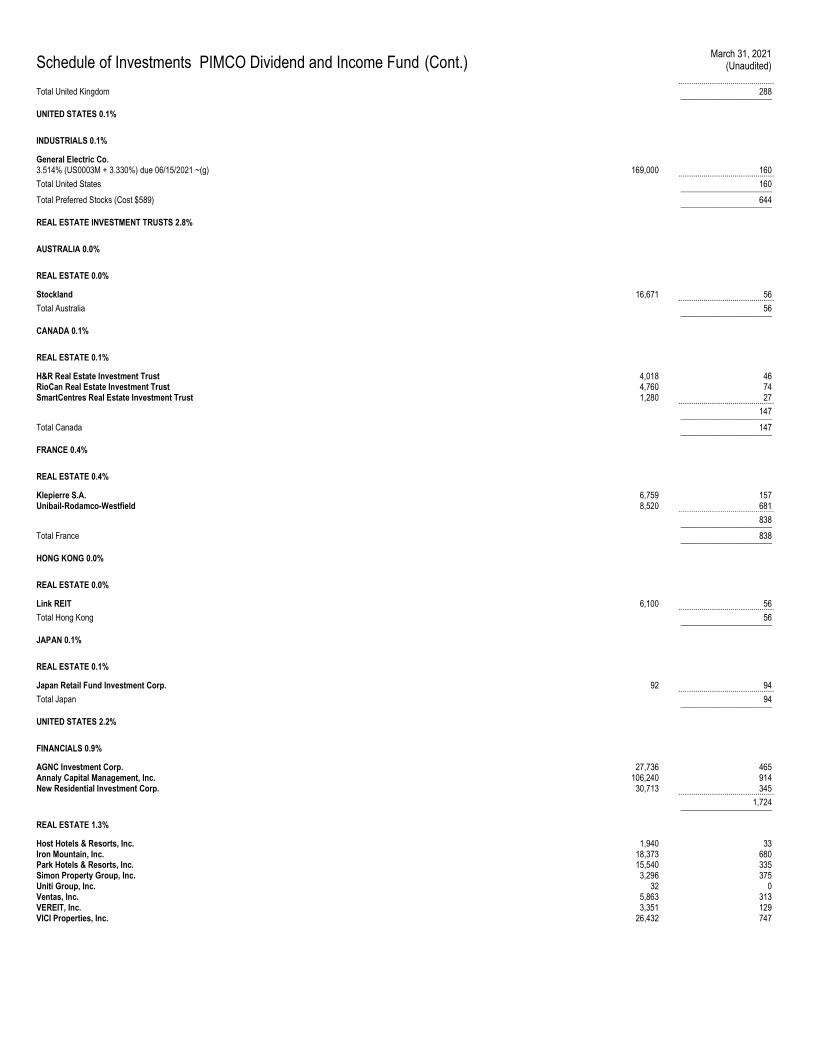
.............................................. Total United Kingdom 288 ______________________
UNITED STATES 0.1%
INDUSTRIALS 0.1%
General Electric Co. 3.514% (US0003M + 3.330%) due 06/15/2021 ~(g) 169,000 160 .............................................. Total United States 160 ______________________
Total Preferred Stocks (Cost $589) 644 ______________________
REAL ESTATE INVESTMENT TRUSTS 2.8%
AUSTRALIA 0.0%
REAL ESTATE 0.0%
Stockland 16,671 56 .............................................. Total Australia 56 ______________________
CANADA 0.1%
REAL ESTATE 0.1%
H&R Real Estate Investment Trust 4,018 46 RioCan Real Estate Investment Trust 4,760 74 SmartCentres Real Estate Investment Trust 1,280 27 .............................................. 147 ______________________
Total Canada 147 ______________________
FRANCE 0.4%
REAL ESTATE 0.4%
Klepierre S.A. 6,759 157 Unibail-Rodamco-Westfield 8,520 681 .............................................. 838 ______________________
Total France 838 ______________________
HONG KONG 0.0%
REAL ESTATE 0.0%
Link REIT 6,100 56 .............................................. Total Hong Kong 56 ______________________
JAPAN 0.1%
REAL ESTATE 0.1%
Japan Retail Fund Investment Corp. 92 94 .............................................. Total Japan 94 ______________________
UNITED STATES 2.2%
FINANCIALS 0.9%
AGNC Investment Corp. 27,736 465 Annaly Capital Management, Inc. 106,240 914 New Residential Investment Corp. 30,713 345 .............................................. 1,724 ______________________
REAL ESTATE 1.3%
Host Hotels & Resorts, Inc. 1,940 33 Iron Mountain, Inc. 18,373 680 Park Hotels & Resorts, Inc. 15,540 335 Simon Property Group, Inc. 3,296 375 Uniti Group, Inc. 32 0 Ventas, Inc. 5,863 313 VEREIT, Inc. 3,351 129 VICI Properties, Inc. 26,432 747
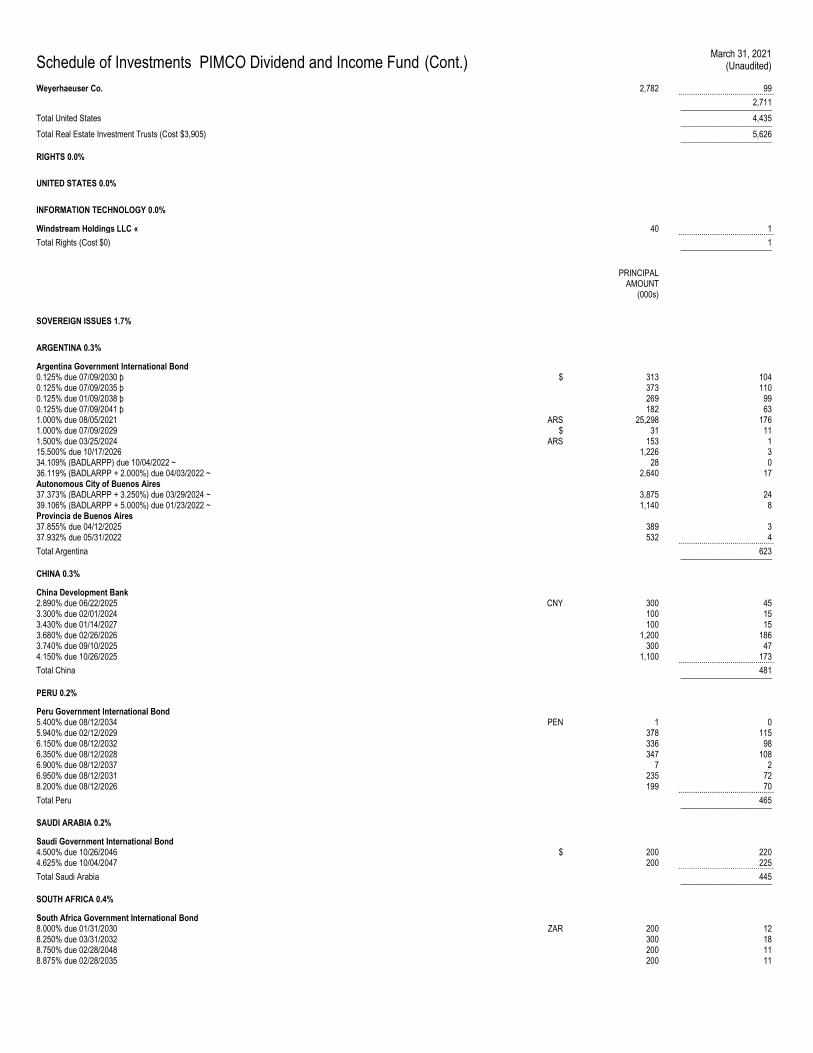
Schedule of Investments PIMCO Dividend and Income Fund (Cont.) March 31, 2021
(Unaudited)
Weyerhaeuser Co. 2,782 99 .............................................. 2,711 ______________________
Total United States 4,435 ______________________
Total Real Estate Investment Trusts (Cost $3,905) 5,626 ______________________
RIGHTS 0.0%
UNITED STATES 0.0%
INFORMATION TECHNOLOGY 0.0%
Windstream Holdings LLC « 40 1 .............................................. Total Rights (Cost $0) 1 ______________________
PRINCIPAL AMOUNT
(000s)
SOVEREIGN ISSUES 1.7%
ARGENTINA 0.3%
Argentina Government International Bond 0.125% due 07/09/2030 þ $ 313 104 0.125% due 07/09/2035 þ 373 110 0.125% due 01/09/2038 þ 269 99 0.125% due 07/09/2041 þ 182 63 1.000% due 08/05/2021 ARS 25,298 176 1.000% due 07/09/2029 $ 31 11 1.500% due 03/25/2024 ARS 153 1 15.500% due 10/17/2026 1,226 3 34.109% (BADLARPP) due 10/04/2022 ~ 28 0 36.119% (BADLARPP + 2.000%) due 04/03/2022 ~ 2,640 17 Autonomous City of Buenos Aires 37.373% (BADLARPP + 3.250%) due 03/29/2024 ~ 3,875 24 39.106% (BADLARPP + 5.000%) due 01/23/2022 ~ 1,140 8 Provincia de Buenos Aires 37.855% due 04/12/2025 389 3 37.932% due 05/31/2022 532 4 .............................................. Total Argentina 623 ______________________
CHINA 0.3%
China Development Bank 2.890% due 06/22/2025 CNY 300 45 3.300% due 02/01/2024 100 15 3.430% due 01/14/2027 100 15 3.680% due 02/26/2026 1,200 186 3.740% due 09/10/2025 300 47 4.150% due 10/26/2025 1,100 173 .............................................. Total China 481 ______________________
PERU 0.2%
Peru Government International Bond 5.400% due 08/12/2034 PEN 1 0 5.940% due 02/12/2029 378 115 6.150% due 08/12/2032 336 98 6.350% due 08/12/2028 347 108 6.900% due 08/12/2037 7 2 6.950% due 08/12/2031 235 72 8.200% due 08/12/2026 199 70 .............................................. Total Peru 465 ______________________
SAUDI ARABIA 0.2%
Saudi Government International Bond 4.500% due 10/26/2046 $ 200 220 4.625% due 10/04/2047 200 225 .............................................. Total Saudi Arabia 445 ______________________
SOUTH AFRICA 0.4%
South Africa Government International Bond 8.000% due 01/31/2030 ZAR 200 12 8.250% due 03/31/2032 300 18 8.750% due 02/28/2048 200 11 8.875% due 02/28/2035 200 11
Schedule of Investments PIMCO Dividend and Income Fund (Cont.) March 31, 2021
(Unaudited)
10.500% due 12/21/2026 10,200 787 .............................................. Total South Africa 839 ______________________
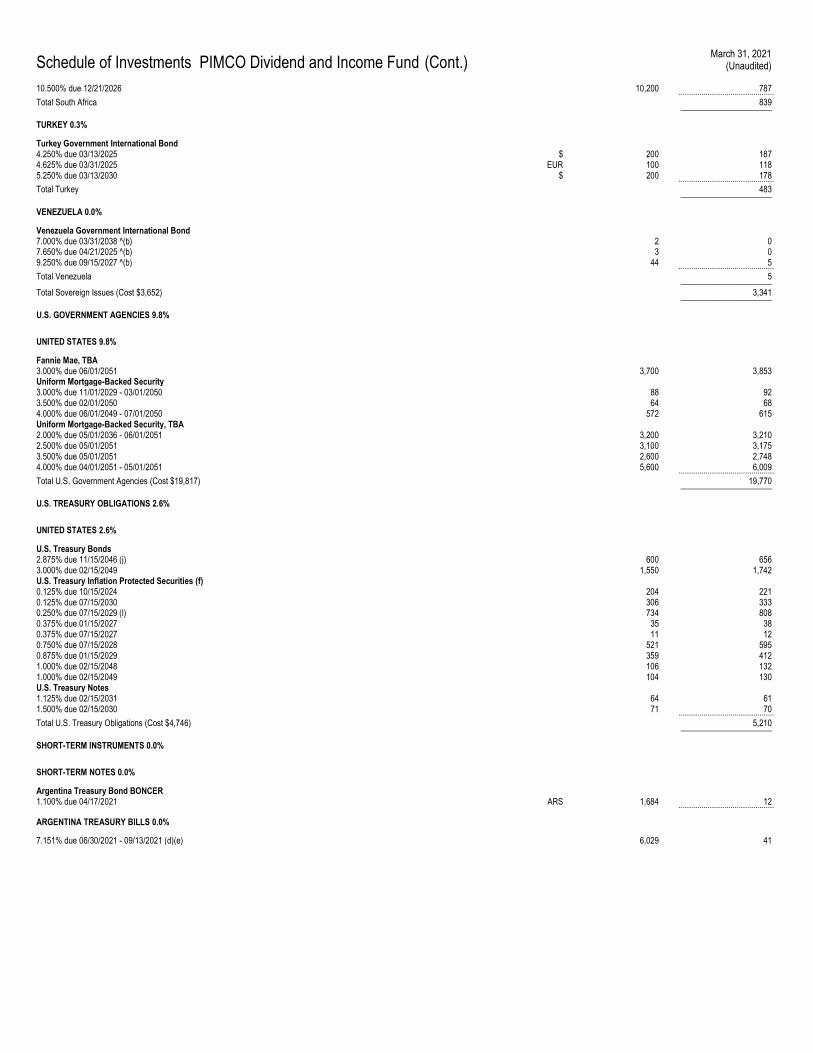
TURKEY 0.3%
Turkey Government International Bond 4.250% due 03/13/2025 $ 200 187 4.625% due 03/31/2025 EUR 100 118 5.250% due 03/13/2030 $ 200 178 .............................................. Total Turkey 483 ______________________
VENEZUELA 0.0%
Venezuela Government International Bond 7.000% due 03/31/2038 ^(b) 2 0 7.650% due 04/21/2025 ^(b) 3 0 9.250% due 09/15/2027 ^(b) 44 5 .............................................. Total Venezuela 5 ______________________
Total Sovereign Issues (Cost $3,652) 3,341 ______________________
U.S. GOVERNMENT AGENCIES 9.8%
UNITED STATES 9.8%
Fannie Mae, TBA 3.000% due 06/01/2051 3,700 3,853 Uniform Mortgage-Backed Security 3.000% due 11/01/2029 - 03/01/2050 88 92 3.500% due 02/01/2050 64 68 4.000% due 06/01/2049 - 07/01/2050 572 615 Uniform Mortgage-Backed Security, TBA 2.000% due 05/01/2036 - 06/01/2051 3,200 3,210 2.500% due 05/01/2051 3,100 3,175 3.500% due 05/01/2051 2,600 2,748 4.000% due 04/01/2051 - 05/01/2051 5,600 6,009 .............................................. Total U.S. Government Agencies (Cost $19,817) 19,770 ______________________
U.S. TREASURY OBLIGATIONS 2.6%
UNITED STATES 2.6%
U.S. Treasury Bonds 2.875% due 11/15/2046 (j) 600 656 3.000% due 02/15/2049 1,550 1,742 U.S. Treasury Inflation Protected Securities (f) 0.125% due 10/15/2024 204 221 0.125% due 07/15/2030 306 333 0.250% due 07/15/2029 (l) 734 808 0.375% due 01/15/2027 35 38 0.375% due 07/15/2027 11 12 0.750% due 07/15/2028 521 595 0.875% due 01/15/2029 359 412 1.000% due 02/15/2048 106 132 1.000% due 02/15/2049 104 130 U.S. Treasury Notes 1.125% due 02/15/2031 64 61 1.500% due 02/15/2030 71 70 .............................................. Total U.S. Treasury Obligations (Cost $4,746) 5,210 ______________________
SHORT-TERM INSTRUMENTS 0.0%
SHORT-TERM NOTES 0.0%
Argentina Treasury Bond BONCER 1.100% due 04/17/2021 ARS 1,684 12 ..............................................
ARGENTINA TREASURY BILLS 0.0%
7.151% due 06/30/2021 - 09/13/2021 (d)(e) 6,029 41
Schedule of Investments PIMCO Dividend and Income Fund (Cont.) March 31, 2021
(Unaudited)
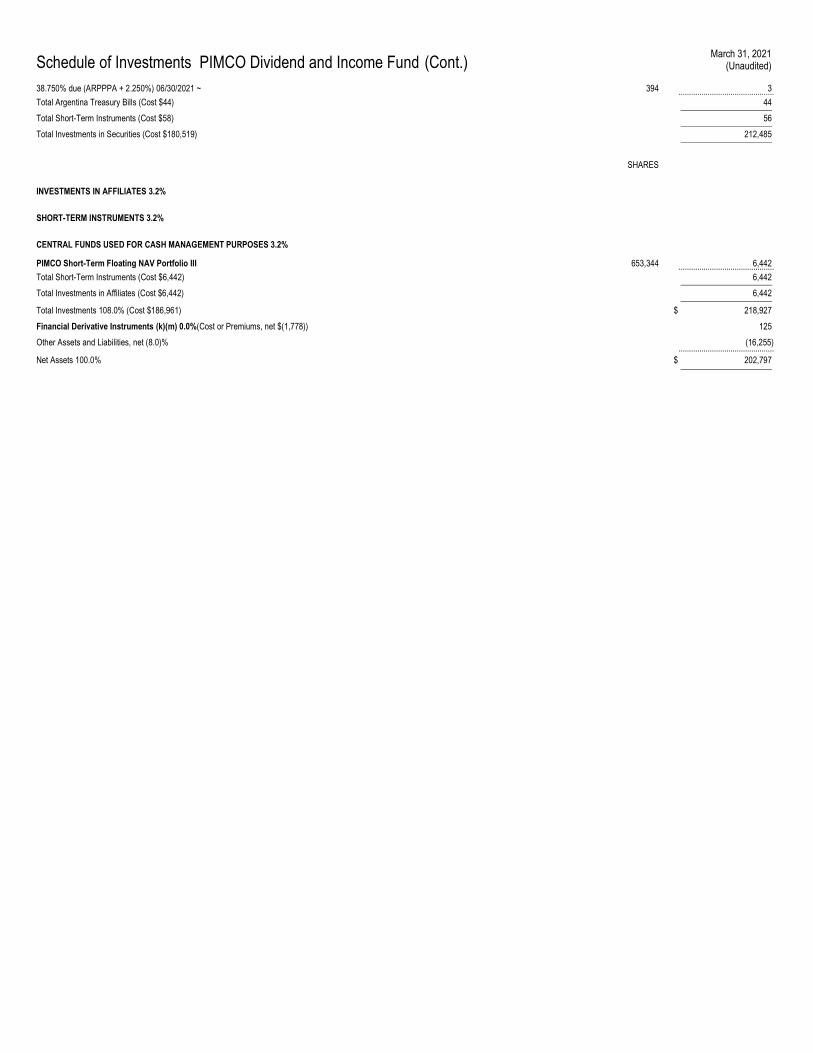
38.750% due (ARPPPA + 2.250%) 06/30/2021 ~ 394 3 .............................................. Total Argentina Treasury Bills (Cost $44) 44 ______________________
Total Short-Term Instruments (Cost $58) 56 ______________________
Total Investments in Securities (Cost $180,519) 212,485 ______________________
SHARES
INVESTMENTS IN AFFILIATES 3.2%
SHORT-TERM INSTRUMENTS 3.2%
CENTRAL FUNDS USED FOR CASH MANAGEMENT PURPOSES 3.2%
PIMCO Short-Term Floating NAV Portfolio III 653,344 6,442 .............................................. Total Short-Term Instruments (Cost $6,442) 6,442 ______________________
Total Investments in Affiliates (Cost $6,442) 6,442 ______________________
Total Investments 108.0% (Cost $186,961) $ 218,927
Financial Derivative Instruments (k)(m) 0.0%(Cost or Premiums, net $(1,778)) 125
Other Assets and Liabilities, net (8.0)% (16,255) ..............................................
Net Assets 100.0% $ 202,797 ______________________
Schedule of Investments PIMCO Dividend and Income Fund (Cont.) March 31, 2021
(Unaudited)
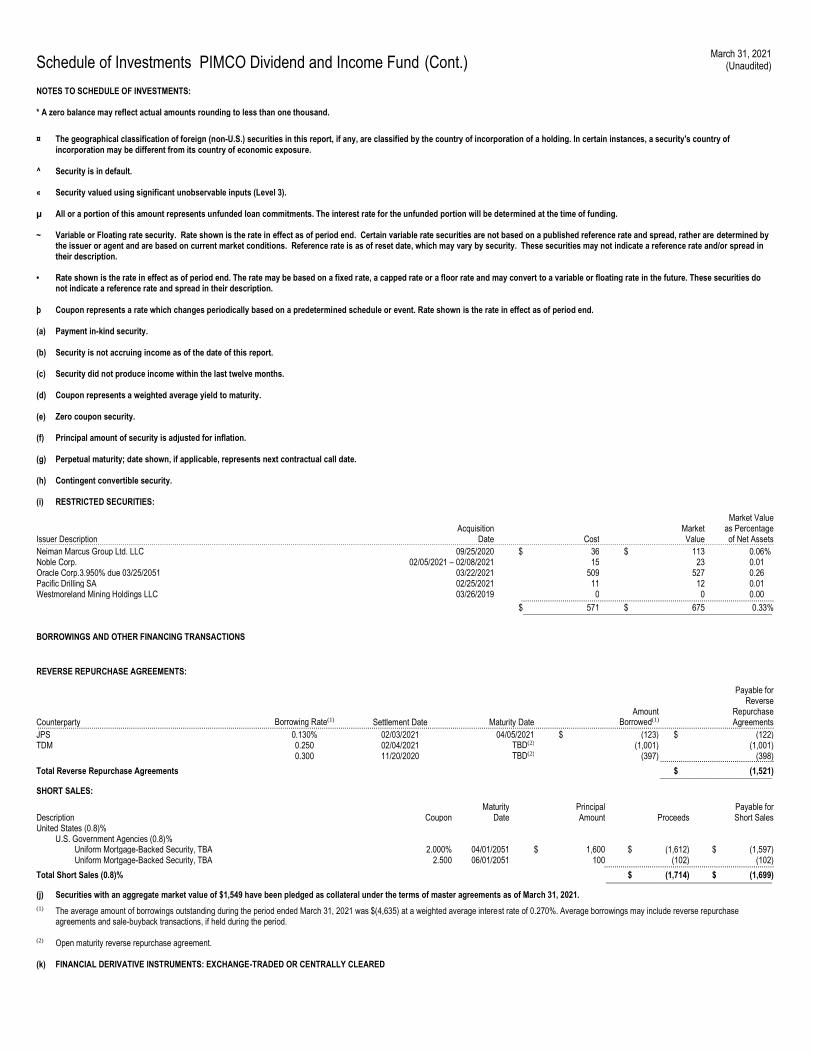
NOTES TO SCHEDULE OF INVESTMENTS: * A zero balance may reflect actual amounts rounding to less than one thousand.
¤ The geographical classification of foreign (non-U.S.) securities in this report, if any, are classified by the country of incorporation of a holding. In certain instances, a security's country of incorporation may be different from its country of economic exposure.
^ Security is in default.
« Security valued using significant unobservable inputs (Level 3).
µ All or a portion of this amount represents unfunded loan commitments. The interest rate for the unfunded portion will be determined at the time of funding.
~ Variable or Floating rate security. Rate shown is the rate in effect as of period end. Certain variable rate securities are not based on a published reference rate and spread, rather are determined by the issuer or agent and are based on current market conditions. Reference rate is as of reset date, which may vary by security. These securities may not indicate a reference rate and/or spread in their description.
• Rate shown is the rate in effect as of period end. The rate may be based on a fixed rate, a capped rate or a floor rate and may convert to a variable or floating rate in the future. These securities do not indicate a reference rate and spread in their description.
þ Coupon represents a rate which changes periodically based on a predetermined schedule or event. Rate shown is the rate in effect as of period end.
(a) Payment in-kind security.
(b) Security is not accruing income as of the date of this report.
(c) Security did not produce income within the last twelve months.
(d) Coupon represents a weighted average yield to maturity.
(e) Zero coupon security.
(f) Principal amount of security is adjusted for inflation.
(g) Perpetual maturity; date shown, if applicable, represents next contractual call date.
(h) Contingent convertible security.
(i) RESTRICTED SECURITIES:
Issuer Description Acquisition
Date Cost Market Value
Market Value as Percentage of Net Assets ...................................................................................................................................................................................................................................................................................................................................................................
Neiman Marcus Group Ltd. LLC 09/25/2020 $ 36 $ 113 0.06 % Noble Corp. 02/05/2021 – 02/08/2021 15 23 0.01 Oracle Corp.3.950% due 03/25/2051 03/22/2021 509 527 0.26 Pacific Drilling SA 02/25/2021 11 12 0.01 Westmoreland Mining Holdings LLC 03/26/2019 0 0 0.00 .......................................................................................................................... $ 571 $ 675 0.33% ____________________________________________________________
BORROWINGS AND OTHER FINANCING TRANSACTIONS
REVERSE REPURCHASE AGREEMENTS:
Counterparty Borrowing Rate(1) Settlement Date Maturity Date Amount
Borrowed(1)
Payable for Reverse
Repurchase Agreements ...................................................................................................................................................................................................................................................................................................................................................................
JPS 0.130% 02/03/2021 04/05/2021 $ (123) $ (122) TDM 0.250 02/04/2021 TBD(2) (1,001) (1,001) 0.300 11/20/2020 TBD(2) (397) (398) .......................................................
Total Reverse Repurchase Agreements $ (1,521) ___________________________
SHORT SALES:
Description Coupon Maturity
Date Principal Amount Proceeds
Payable for Short Sales
United States (0.8)% U.S. Government Agencies (0.8)%
Uniform Mortgage-Backed Security, TBA 2.000% 04/01/2051 $ 1,600 $ (1,612) $ (1,597) Uniform Mortgage-Backed Security, TBA 2.500 06/01/2051 100 (102) (102) ..................................................................................
Total Short Sales (0.8)% $ (1,714) $ (1,699) ________________________________________
(j) Securities with an aggregate market value of $1,549 have been pledged as collateral under the terms of master agreements as of March 31, 2021.
(1) The average amount of borrowings outstanding during the period ended March 31, 2021 was $(4,635) at a weighted average interest rate of 0.270%. Average borrowings may include reverse repurchase agreements and sale-buyback transactions, if held during the period.
(2) Open maturity reverse repurchase agreement.
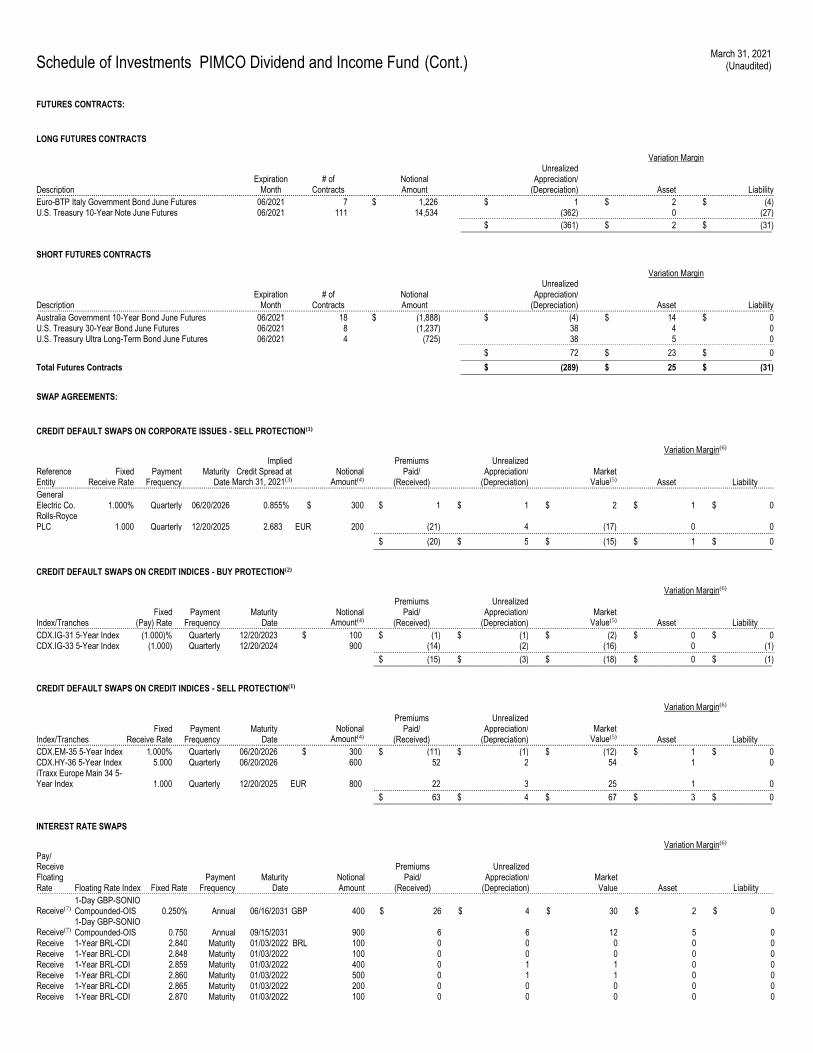
(k) FINANCIAL DERIVATIVE INSTRUMENTS: EXCHANGE-TRADED OR CENTRALLY CLEARED
Schedule of Investments PIMCO Dividend and Income Fund (Cont.) March 31, 2021
(Unaudited)
FUTURES CONTRACTS:
LONG FUTURES CONTRACTS
Variation Margin
Description Expiration
Month # of
Contracts Notional Amount
Unrealized Appreciation/
(Depreciation) Asset Liability ................................................................................................................................................................................................................................................................................................................................................................... Euro-BTP Italy Government Bond June Futures 06/2021 7 $ 1,226 $ 1 $ 2 $ (4) U.S. Treasury 10-Year Note June Futures 06/2021 111 14,534 (362) 0 (27) ........................................................................................................................................................ $ (361) $ 2 $ (31) ___________________________________________________________________________
SHORT FUTURES CONTRACTS
Variation Margin
Description Expiration
Month # of
Contracts Notional Amount
Unrealized Appreciation/
(Depreciation) Asset Liability ................................................................................................................................................................................................................................................................................................................................................................... Australia Government 10-Year Bond June Futures 06/2021 18 $ (1,888) $ (4) $ 14 $ 0 U.S. Treasury 30-Year Bond June Futures 06/2021 8 (1,237) 38 4 0 U.S. Treasury Ultra Long-Term Bond June Futures 06/2021 4 (725) 38 5 0 ........................................................................................................................................................ $ 72 $ 23 $ 0 ___________________________________________________________________________ Total Futures Contracts $ (289) $ 25 $ (31) ___________________________________________________________________________
SWAP AGREEMENTS:
CREDIT DEFAULT SWAPS ON CORPORATE ISSUES - SELL PROTECTION(1)
Variation Margin(6)
Reference Entity
Fixed Receive Rate
Payment Frequency
Maturity Date
Implied Credit Spread at
March 31, 2021(3) Notional
Amount(4)
Premiums Paid/
(Received)
Unrealized Appreciation/
(Depreciation) Market
Value(5) Asset Liability ................................................................................................................................................................................................................................................................................................................................................................... General Electric Co. 1.000% Quarterly 06/20/2026 0.855 % $ 300 $ 1 $ 1 $ 2 $ 1 $ 0 Rolls-Royce PLC 1.000 Quarterly 12/20/2025 2.683 EUR 200 (21) 4 (17) 0 0 ................................................................................................................................................................................................. $ (20) $ 5 $ (15) $ 1 $ 0 ________________________________________________________________________________________________
CREDIT DEFAULT SWAPS ON CREDIT INDICES - BUY PROTECTION(2)
Variation Margin(6)
Index/Tranches Fixed
(Pay) Rate Payment
Frequency Maturity
Date Notional
Amount(4)
Premiums Paid/
(Received)
Unrealized Appreciation/
(Depreciation) Market
Value(5) Asset Liability ................................................................................................................................................................................................................................................................................................................................................................... CDX.IG-31 5-Year Index (1.000)% Quarterly 12/20/2023 $ 100 $ (1) $ (1) $ (2) $ 0 $ 0 CDX.IG-33 5-Year Index (1.000) Quarterly 12/20/2024 900 (14) (2) (16) 0 (1) ................................................................................................................................................................................................. $ (15) $ (3) $ (18) $ 0 $ (1) ________________________________________________________________________________________________
CREDIT DEFAULT SWAPS ON CREDIT INDICES - SELL PROTECTION(1)
Variation Margin(6)
Index/Tranches Fixed
Receive Rate Payment
Frequency Maturity
Date Notional
Amount(4)
Premiums Paid/
(Received)
Unrealized Appreciation/
(Depreciation) Market
Value(5) Asset Liability ................................................................................................................................................................................................................................................................................................................................................................... CDX.EM-35 5-Year Index 1.000% Quarterly 06/20/2026 $ 300 $ (11) $ (1) $ (12) $ 1 $ 0 CDX.HY-36 5-Year Index 5.000 Quarterly 06/20/2026 600 52 2 54 1 0 iTraxx Europe Main 34 5-Year Index 1.000 Quarterly 12/20/2025 EUR 800 22 3 25 1 0 ................................................................................................................................................................................................. $ 63 $ 4 $ 67 $ 3 $ 0 ________________________________________________________________________________________________
INTEREST RATE SWAPS
Variation Margin(6)
Pay/ Receive Floating Rate Floating Rate Index Fixed Rate
Payment Frequency
Maturity Date
Notional Amount
Premiums Paid/
(Received)
Unrealized Appreciation/
(Depreciation) Market Value Asset Liability ...................................................................................................................................................................................................................................................................................................................................................................
Receive(7)
1-Day GBP-SONIO Compounded-OIS 0.250% Annual 06/16/2031 GBP 400 $ 26 $ 4 $ 30 $ 2 $ 0
Receive(7)
1-Day GBP-SONIO Compounded-OIS 0.750 Annual 09/15/2031 900 6 6 12 5 0
Receive 1-Year BRL-CDI 2.840 Maturity 01/03/2022 BRL 100 0 0 0 0 0 Receive 1-Year BRL-CDI 2.848 Maturity 01/03/2022 100 0 0 0 0 0 Receive 1-Year BRL-CDI 2.859 Maturity 01/03/2022 400 0 1 1 0 0 Receive 1-Year BRL-CDI 2.860 Maturity 01/03/2022 500 0 1 1 0 0 Receive 1-Year BRL-CDI 2.865 Maturity 01/03/2022 200 0 0 0 0 0 Receive 1-Year BRL-CDI 2.870 Maturity 01/03/2022 100 0 0 0 0 0
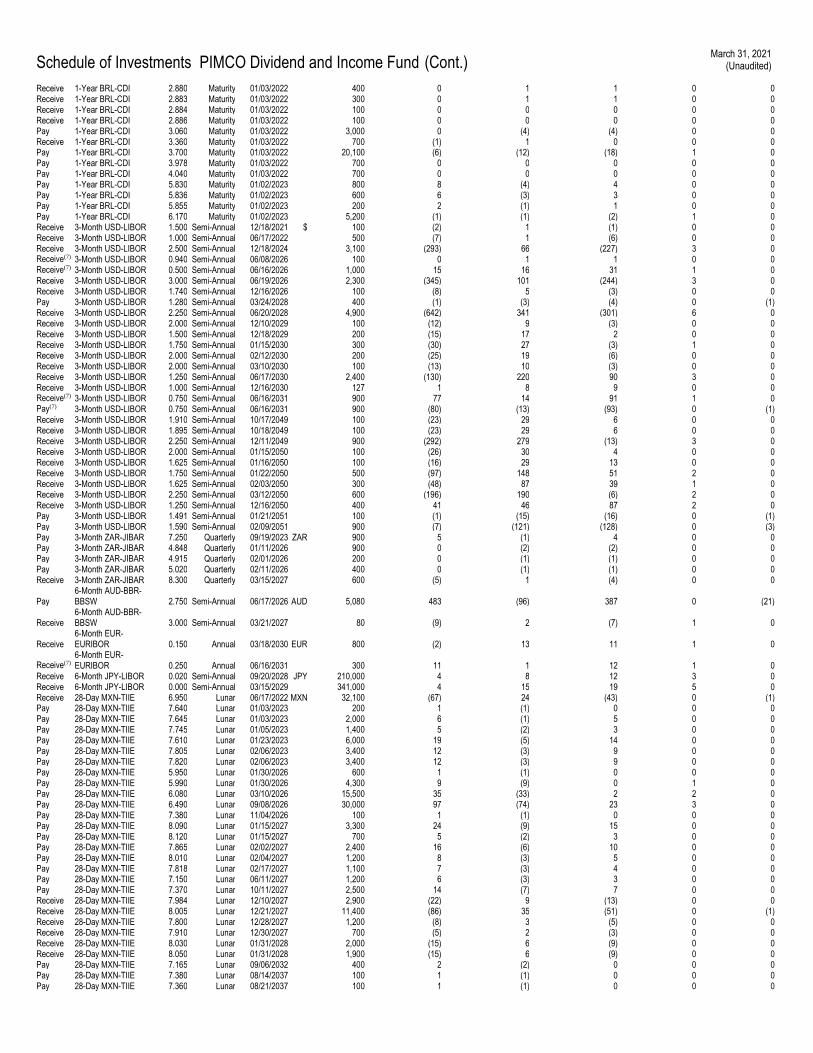
Schedule of Investments PIMCO Dividend and Income Fund (Cont.) March 31, 2021
(Unaudited)
Receive 1-Year BRL-CDI 2.880 Maturity 01/03/2022 400 0 1 1 0 0 Receive 1-Year BRL-CDI 2.883 Maturity 01/03/2022 300 0 1 1 0 0 Receive 1-Year BRL-CDI 2.884 Maturity 01/03/2022 100 0 0 0 0 0 Receive 1-Year BRL-CDI 2.886 Maturity 01/03/2022 100 0 0 0 0 0 Pay 1-Year BRL-CDI 3.060 Maturity 01/03/2022 3,000 0 (4) (4) 0 0 Receive 1-Year BRL-CDI 3.360 Maturity 01/03/2022 700 (1) 1 0 0 0 Pay 1-Year BRL-CDI 3.700 Maturity 01/03/2022 20,100 (6) (12) (18) 1 0 Pay 1-Year BRL-CDI 3.978 Maturity 01/03/2022 700 0 0 0 0 0 Pay 1-Year BRL-CDI 4.040 Maturity 01/03/2022 700 0 0 0 0 0 Pay 1-Year BRL-CDI 5.830 Maturity 01/02/2023 800 8 (4) 4 0 0 Pay 1-Year BRL-CDI 5.836 Maturity 01/02/2023 600 6 (3) 3 0 0 Pay 1-Year BRL-CDI 5.855 Maturity 01/02/2023 200 2 (1) 1 0 0 Pay 1-Year BRL-CDI 6.170 Maturity 01/02/2023 5,200 (1) (1) (2) 1 0 Receive 3-Month USD-LIBOR 1.500 Semi-Annual 12/18/2021 $ 100 (2) 1 (1) 0 0 Receive 3-Month USD-LIBOR 1.000 Semi-Annual 06/17/2022 500 (7) 1 (6) 0 0 Receive 3-Month USD-LIBOR 2.500 Semi-Annual 12/18/2024 3,100 (293) 66 (227) 3 0 Receive(7) 3-Month USD-LIBOR 0.940 Semi-Annual 06/08/2026 100 0 1 1 0 0 Receive(7) 3-Month USD-LIBOR 0.500 Semi-Annual 06/16/2026 1,000 15 16 31 1 0 Receive 3-Month USD-LIBOR 3.000 Semi-Annual 06/19/2026 2,300 (345) 101 (244) 3 0 Receive 3-Month USD-LIBOR 1.740 Semi-Annual 12/16/2026 100 (8) 5 (3) 0 0 Pay 3-Month USD-LIBOR 1.280 Semi-Annual 03/24/2028 400 (1) (3) (4) 0 (1) Receive 3-Month USD-LIBOR 2.250 Semi-Annual 06/20/2028 4,900 (642) 341 (301) 6 0 Receive 3-Month USD-LIBOR 2.000 Semi-Annual 12/10/2029 100 (12) 9 (3) 0 0 Receive 3-Month USD-LIBOR 1.500 Semi-Annual 12/18/2029 200 (15) 17 2 0 0 Receive 3-Month USD-LIBOR 1.750 Semi-Annual 01/15/2030 300 (30) 27 (3) 1 0 Receive 3-Month USD-LIBOR 2.000 Semi-Annual 02/12/2030 200 (25) 19 (6) 0 0 Receive 3-Month USD-LIBOR 2.000 Semi-Annual 03/10/2030 100 (13) 10 (3) 0 0 Receive 3-Month USD-LIBOR 1.250 Semi-Annual 06/17/2030 2,400 (130) 220 90 3 0 Receive 3-Month USD-LIBOR 1.000 Semi-Annual 12/16/2030 127 1 8 9 0 0 Receive(7) 3-Month USD-LIBOR 0.750 Semi-Annual 06/16/2031 900 77 14 91 1 0 Pay(7) 3-Month USD-LIBOR 0.750 Semi-Annual 06/16/2031 900 (80) (13) (93) 0 (1) Receive 3-Month USD-LIBOR 1.910 Semi-Annual 10/17/2049 100 (23) 29 6 0 0 Receive 3-Month USD-LIBOR 1.895 Semi-Annual 10/18/2049 100 (23) 29 6 0 0 Receive 3-Month USD-LIBOR 2.250 Semi-Annual 12/11/2049 900 (292) 279 (13) 3 0 Receive 3-Month USD-LIBOR 2.000 Semi-Annual 01/15/2050 100 (26) 30 4 0 0 Receive 3-Month USD-LIBOR 1.625 Semi-Annual 01/16/2050 100 (16) 29 13 0 0 Receive 3-Month USD-LIBOR 1.750 Semi-Annual 01/22/2050 500 (97) 148 51 2 0 Receive 3-Month USD-LIBOR 1.625 Semi-Annual 02/03/2050 300 (48) 87 39 1 0 Receive 3-Month USD-LIBOR 2.250 Semi-Annual 03/12/2050 600 (196) 190 (6) 2 0 Receive 3-Month USD-LIBOR 1.250 Semi-Annual 12/16/2050 400 41 46 87 2 0 Pay 3-Month USD-LIBOR 1.491 Semi-Annual 01/21/2051 100 (1) (15) (16) 0 (1) Pay 3-Month USD-LIBOR 1.590 Semi-Annual 02/09/2051 900 (7) (121) (128) 0 (3) Pay 3-Month ZAR-JIBAR 7.250 Quarterly 09/19/2023 ZAR 900 5 (1) 4 0 0 Pay 3-Month ZAR-JIBAR 4.848 Quarterly 01/11/2026 900 0 (2) (2) 0 0 Pay 3-Month ZAR-JIBAR 4.915 Quarterly 02/01/2026 200 0 (1) (1) 0 0 Pay 3-Month ZAR-JIBAR 5.020 Quarterly 02/11/2026 400 0 (1) (1) 0 0 Receive 3-Month ZAR-JIBAR 8.300 Quarterly 03/15/2027 600 (5) 1 (4) 0 0
Pay
6-Month AUD-BBR-BBSW 2.750 Semi-Annual 06/17/2026 AUD 5,080 483 (96) 387 0 (21)
Receive
6-Month AUD-BBR-BBSW 3.000 Semi-Annual 03/21/2027 80 (9) 2 (7) 1 0
Receive
6-Month EUR-EURIBOR 0.150 Annual 03/18/2030 EUR 800 (2) 13 11 1 0
Receive(7) 6-Month EUR-EURIBOR 0.250 Annual 06/16/2031 300 11 1 12 1 0
Receive 6-Month JPY-LIBOR 0.020 Semi-Annual 09/20/2028 JPY 210,000 4 8 12 3 0 Receive 6-Month JPY-LIBOR 0.000 Semi-Annual 03/15/2029 341,000 4 15 19 5 0 Receive 28-Day MXN-TIIE 6.950 Lunar 06/17/2022 MXN 32,100 (67) 24 (43) 0 (1) Pay 28-Day MXN-TIIE 7.640 Lunar 01/03/2023 200 1 (1) 0 0 0 Pay 28-Day MXN-TIIE 7.645 Lunar 01/03/2023 2,000 6 (1) 5 0 0 Pay 28-Day MXN-TIIE 7.745 Lunar 01/05/2023 1,400 5 (2) 3 0 0 Pay 28-Day MXN-TIIE 7.610 Lunar 01/23/2023 6,000 19 (5) 14 0 0 Pay 28-Day MXN-TIIE 7.805 Lunar 02/06/2023 3,400 12 (3) 9 0 0 Pay 28-Day MXN-TIIE 7.820 Lunar 02/06/2023 3,400 12 (3) 9 0 0 Pay 28-Day MXN-TIIE 5.950 Lunar 01/30/2026 600 1 (1) 0 0 0 Pay 28-Day MXN-TIIE 5.990 Lunar 01/30/2026 4,300 9 (9) 0 1 0 Pay 28-Day MXN-TIIE 6.080 Lunar 03/10/2026 15,500 35 (33) 2 2 0 Pay 28-Day MXN-TIIE 6.490 Lunar 09/08/2026 30,000 97 (74) 23 3 0 Pay 28-Day MXN-TIIE 7.380 Lunar 11/04/2026 100 1 (1) 0 0 0 Pay 28-Day MXN-TIIE 8.090 Lunar 01/15/2027 3,300 24 (9) 15 0 0 Pay 28-Day MXN-TIIE 8.120 Lunar 01/15/2027 700 5 (2) 3 0 0 Pay 28-Day MXN-TIIE 7.865 Lunar 02/02/2027 2,400 16 (6) 10 0 0 Pay 28-Day MXN-TIIE 8.010 Lunar 02/04/2027 1,200 8 (3) 5 0 0 Pay 28-Day MXN-TIIE 7.818 Lunar 02/17/2027 1,100 7 (3) 4 0 0 Pay 28-Day MXN-TIIE 7.150 Lunar 06/11/2027 1,200 6 (3) 3 0 0 Pay 28-Day MXN-TIIE 7.370 Lunar 10/11/2027 2,500 14 (7) 7 0 0 Receive 28-Day MXN-TIIE 7.984 Lunar 12/10/2027 2,900 (22) 9 (13) 0 0 Receive 28-Day MXN-TIIE 8.005 Lunar 12/21/2027 11,400 (86) 35 (51) 0 (1) Receive 28-Day MXN-TIIE 7.800 Lunar 12/28/2027 1,200 (8) 3 (5) 0 0 Receive 28-Day MXN-TIIE 7.910 Lunar 12/30/2027 700 (5) 2 (3) 0 0 Receive 28-Day MXN-TIIE 8.030 Lunar 01/31/2028 2,000 (15) 6 (9) 0 0 Receive 28-Day MXN-TIIE 8.050 Lunar 01/31/2028 1,900 (15) 6 (9) 0 0 Pay 28-Day MXN-TIIE 7.165 Lunar 09/06/2032 400 2 (2) 0 0 0 Pay 28-Day MXN-TIIE 7.380 Lunar 08/14/2037 100 1 (1) 0 0 0 Pay 28-Day MXN-TIIE 7.360 Lunar 08/21/2037 100 1 (1) 0 0 0
Schedule of Investments PIMCO Dividend and Income Fund (Cont.) March 31, 2021
(Unaudited)
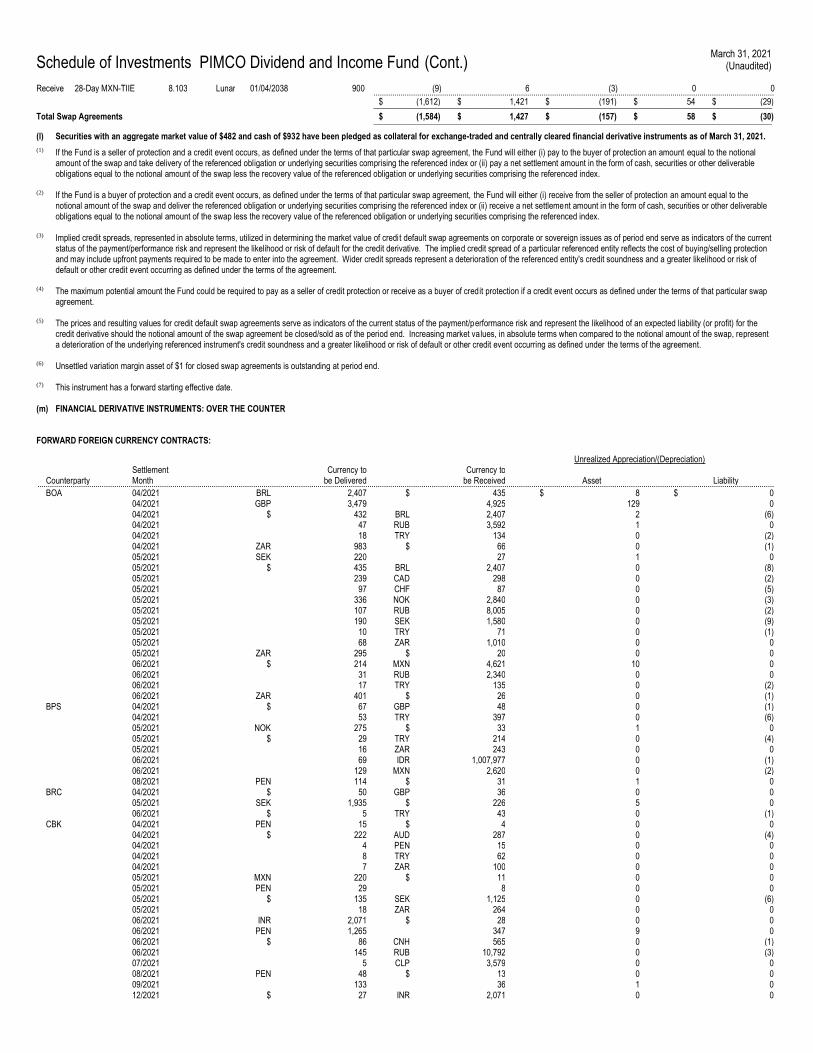
Receive 28-Day MXN-TIIE 8.103 Lunar 01/04/2038 900 (9) 6 (3) 0 0 ................................................................................................................................................................................................. $ (1,612) $ 1,421 $ (191) $ 54 $ (29) ________________________________________________________________________________________________
Total Swap Agreements $ (1,584) $ 1,427 $ (157) $ 58 $ (30) ________________________________________________________________________________________________
(l) Securities with an aggregate market value of $482 and cash of $932 have been pledged as collateral for exchange-traded and centrally cleared financial derivative instruments as of March 31, 2021.
(1) If the Fund is a seller of protection and a credit event occurs, as defined under the terms of that particular swap agreement, the Fund will either (i) pay to the buyer of protection an amount equal to the notional amount of the swap and take delivery of the referenced obligation or underlying securities comprising the referenced index or (ii) pay a net settlement amount in the form of cash, securities or other deliverable obligations equal to the notional amount of the swap less the recovery value of the referenced obligation or underlying securities comprising the referenced index.
(2) If the Fund is a buyer of protection and a credit event occurs, as defined under the terms of that particular swap agreement, the Fund will either (i) receive from the seller of protection an amount equal to the notional amount of the swap and deliver the referenced obligation or underlying securities comprising the referenced index or (ii) receive a net settlement amount in the form of cash, securities or other deliverable obligations equal to the notional amount of the swap less the recovery value of the referenced obligation or underlying securities comprising the referenced index.
(3) Implied credit spreads, represented in absolute terms, utilized in determining the market value of credit default swap agreements on corporate or sovereign issues as of period end serve as indicators of the current status of the payment/performance risk and represent the likelihood or risk of default for the credit derivative. The implied credit spread of a particular referenced entity reflects the cost of buying/selling protection and may include upfront payments required to be made to enter into the agreement. Wider credit spreads represent a deterioration of the referenced entity's credit soundness and a greater likelihood or risk of default or other credit event occurring as defined under the terms of the agreement.
(4) The maximum potential amount the Fund could be required to pay as a seller of credit protection or receive as a buyer of credit protection if a credit event occurs as defined under the terms of that particular swap agreement.
(5) The prices and resulting values for credit default swap agreements serve as indicators of the current status of the payment/performance risk and represent the likelihood of an expected liability (or profit) for the credit derivative should the notional amount of the swap agreement be closed/sold as of the period end. Increasing market values, in absolute terms when compared to the notional amount of the swap, represent a deterioration of the underlying referenced instrument's credit soundness and a greater likelihood or risk of default or other credit event occurring as defined under the terms of the agreement.
(6) Unsettled variation margin asset of $1 for closed swap agreements is outstanding at period end.
(7) This instrument has a forward starting effective date.
(m) FINANCIAL DERIVATIVE INSTRUMENTS: OVER THE COUNTER
FORWARD FOREIGN CURRENCY CONTRACTS:
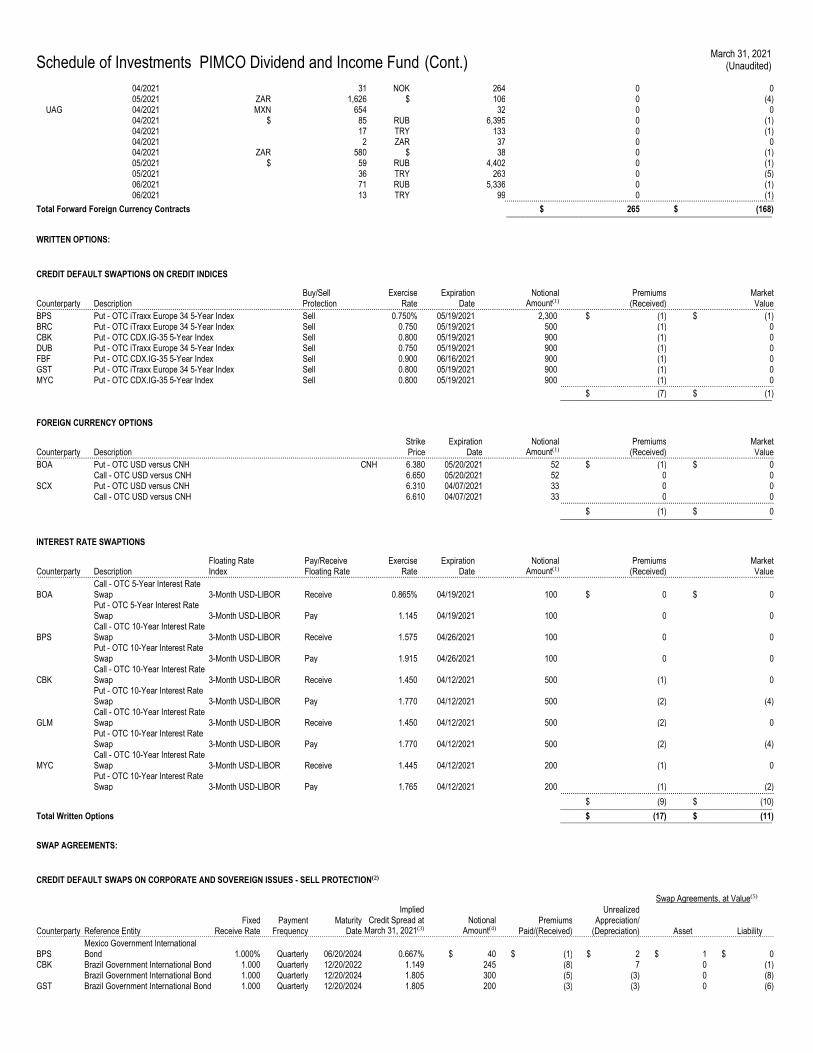
Unrealized Appreciation/(Depreciation)
Counterparty Settlement Month
Currency to be Delivered
Currency to be Received Asset Liability ...................................................................................................................................................................................................................................................................................................................................................................
BOA 04/2021 BRL 2,407 $ 435 $ 8 $ 0 04/2021 GBP 3,479 4,925 129 0 04/2021 $ 432 BRL 2,407 2 (6) 04/2021 47 RUB 3,592 1 0 04/2021 18 TRY 134 0 (2) 04/2021 ZAR 983 $ 66 0 (1) 05/2021 SEK 220 27 1 0 05/2021 $ 435 BRL 2,407 0 (8) 05/2021 239 CAD 298 0 (2) 05/2021 97 CHF 87 0 (5) 05/2021 336 NOK 2,840 0 (3) 05/2021 107 RUB 8,005 0 (2) 05/2021 190 SEK 1,580 0 (9) 05/2021 10 TRY 71 0 (1) 05/2021 68 ZAR 1,010 0 0 05/2021 ZAR 295 $ 20 0 0 06/2021 $ 214 MXN 4,621 10 0 06/2021 31 RUB 2,340 0 0 06/2021 17 TRY 135 0 (2) 06/2021 ZAR 401 $ 26 0 (1) BPS 04/2021 $ 67 GBP 48 0 (1) 04/2021 53 TRY 397 0 (6) 05/2021 NOK 275 $ 33 1 0 05/2021 $ 29 TRY 214 0 (4) 05/2021 16 ZAR 243 0 0 06/2021 69 IDR 1,007,977 0 (1) 06/2021 129 MXN 2,620 0 (2) 08/2021 PEN 114 $ 31 1 0 BRC 04/2021 $ 50 GBP 36 0 0 05/2021 SEK 1,935 $ 226 5 0 06/2021 $ 5 TRY 43 0 (1) CBK 04/2021 PEN 15 $ 4 0 0 04/2021 $ 222 AUD 287 0 (4) 04/2021 4 PEN 15 0 0 04/2021 8 TRY 62 0 0 04/2021 7 ZAR 100 0 0 05/2021 MXN 220 $ 11 0 0 05/2021 PEN 29 8 0 0 05/2021 $ 135 SEK 1,125 0 (6) 05/2021 18 ZAR 264 0 0 06/2021 INR 2,071 $ 28 0 0 06/2021 PEN 1,265 347 9 0 06/2021 $ 86 CNH 565 0 (1) 06/2021 145 RUB 10,792 0 (3) 07/2021 5 CLP 3,579 0 0 08/2021 PEN 48 $ 13 0 0 09/2021 133 36 1 0 12/2021 $ 27 INR 2,071 0 0
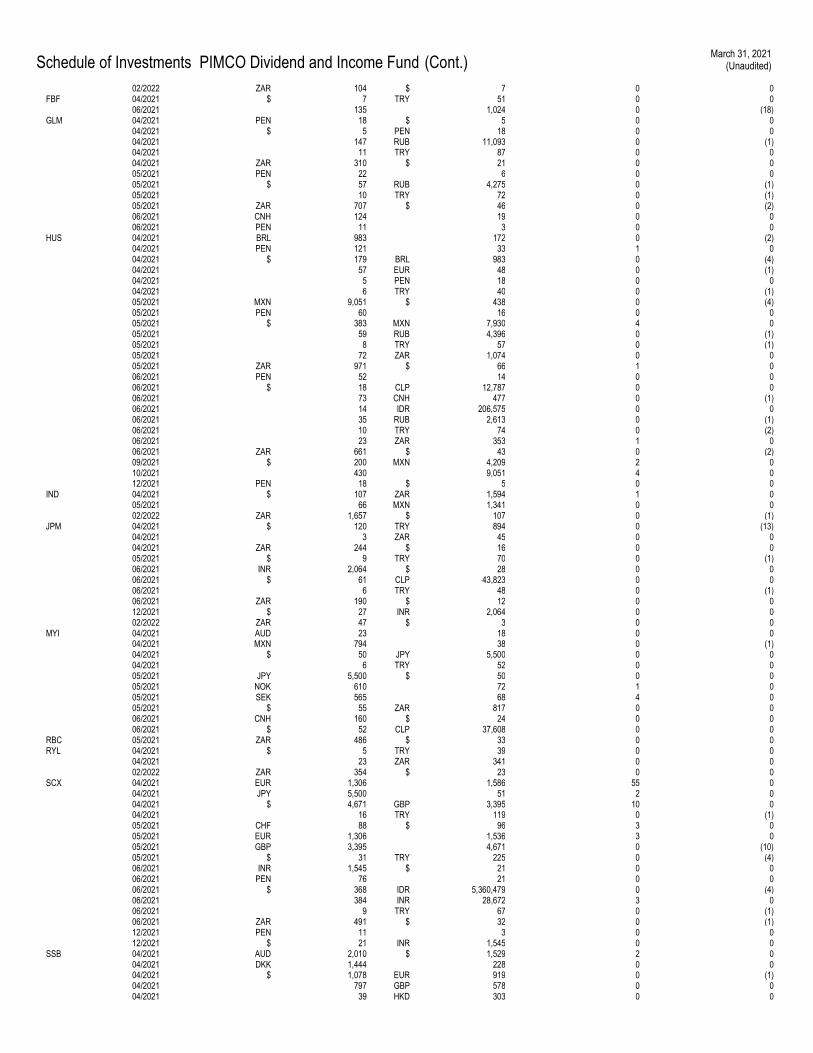
Schedule of Investments PIMCO Dividend and Income Fund (Cont.) March 31, 2021
(Unaudited)
02/2022 ZAR 104 $ 7 0 0 FBF 04/2021 $ 7 TRY 51 0 0 06/2021 135 1,024 0 (18) GLM 04/2021 PEN 18 $ 5 0 0 04/2021 $ 5 PEN 18 0 0 04/2021 147 RUB 11,093 0 (1) 04/2021 11 TRY 87 0 0 04/2021 ZAR 310 $ 21 0 0 05/2021 PEN 22 6 0 0 05/2021 $ 57 RUB 4,275 0 (1) 05/2021 10 TRY 72 0 (1) 05/2021 ZAR 707 $ 46 0 (2) 06/2021 CNH 124 19 0 0 06/2021 PEN 11 3 0 0 HUS 04/2021 BRL 983 172 0 (2) 04/2021 PEN 121 33 1 0 04/2021 $ 179 BRL 983 0 (4) 04/2021 57 EUR 48 0 (1) 04/2021 5 PEN 18 0 0 04/2021 6 TRY 40 0 (1) 05/2021 MXN 9,051 $ 438 0 (4) 05/2021 PEN 60 16 0 0 05/2021 $ 383 MXN 7,930 4 0 05/2021 59 RUB 4,396 0 (1) 05/2021 8 TRY 57 0 (1) 05/2021 72 ZAR 1,074 0 0 05/2021 ZAR 971 $ 66 1 0 06/2021 PEN 52 14 0 0 06/2021 $ 18 CLP 12,787 0 0 06/2021 73 CNH 477 0 (1) 06/2021 14 IDR 206,575 0 0 06/2021 35 RUB 2,613 0 (1) 06/2021 10 TRY 74 0 (2) 06/2021 23 ZAR 353 1 0 06/2021 ZAR 661 $ 43 0 (2) 09/2021 $ 200 MXN 4,209 2 0 10/2021 430 9,051 4 0 12/2021 PEN 18 $ 5 0 0 IND 04/2021 $ 107 ZAR 1,594 1 0 05/2021 66 MXN 1,341 0 0 02/2022 ZAR 1,657 $ 107 0 (1) JPM 04/2021 $ 120 TRY 894 0 (13) 04/2021 3 ZAR 45 0 0 04/2021 ZAR 244 $ 16 0 0 05/2021 $ 9 TRY 70 0 (1) 06/2021 INR 2,064 $ 28 0 0 06/2021 $ 61 CLP 43,823 0 0 06/2021 6 TRY 48 0 (1) 06/2021 ZAR 190 $ 12 0 0 12/2021 $ 27 INR 2,064 0 0 02/2022 ZAR 47 $ 3 0 0 MYI 04/2021 AUD 23 18 0 0 04/2021 MXN 794 38 0 (1) 04/2021 $ 50 JPY 5,500 0 0 04/2021 6 TRY 52 0 0 05/2021 JPY 5,500 $ 50 0 0 05/2021 NOK 610 72 1 0 05/2021 SEK 565 68 4 0 05/2021 $ 55 ZAR 817 0 0 06/2021 CNH 160 $ 24 0 0 06/2021 $ 52 CLP 37,608 0 0 RBC 05/2021 ZAR 486 $ 33 0 0 RYL 04/2021 $ 5 TRY 39 0 0 04/2021 23 ZAR 341 0 0 02/2022 ZAR 354 $ 23 0 0 SCX 04/2021 EUR 1,306 1,586 55 0 04/2021 JPY 5,500 51 2 0 04/2021 $ 4,671 GBP 3,395 10 0 04/2021 16 TRY 119 0 (1) 05/2021 CHF 88 $ 96 3 0 05/2021 EUR 1,306 1,536 3 0 05/2021 GBP 3,395 4,671 0 (10) 05/2021 $ 31 TRY 225 0 (4) 06/2021 INR 1,545 $ 21 0 0 06/2021 PEN 76 21 0 0 06/2021 $ 368 IDR 5,360,479 0 (4) 06/2021 384 INR 28,672 3 0 06/2021 9 TRY 67 0 (1) 06/2021 ZAR 491 $ 32 0 (1) 12/2021 PEN 11 3 0 0 12/2021 $ 21 INR 1,545 0 0 SSB 04/2021 AUD 2,010 $ 1,529 2 0 04/2021 DKK 1,444 228 0 0 04/2021 $ 1,078 EUR 919 0 (1) 04/2021 797 GBP 578 0 0 04/2021 39 HKD 303 0 0
Schedule of Investments PIMCO Dividend and Income Fund (Cont.) March 31, 2021
(Unaudited)
04/2021 31 NOK 264 0 0 05/2021 ZAR 1,626 $ 106 0 (4) UAG 04/2021 MXN 654 32 0 0 04/2021 $ 85 RUB 6,395 0 (1) 04/2021 17 TRY 133 0 (1) 04/2021 2 ZAR 37 0 0 04/2021 ZAR 580 $ 38 0 (1) 05/2021 $ 59 RUB 4,402 0 (1) 05/2021 36 TRY 263 0 (5) 06/2021 71 RUB 5,336 0 (1) 06/2021 13 TRY 99 0 (1) ..................................................................................................................................
Total Forward Foreign Currency Contracts $ 265 $ (168) ________________________________________________________________
WRITTEN OPTIONS:
CREDIT DEFAULT SWAPTIONS ON CREDIT INDICES
Counterparty Description Buy/Sell Protection
Exercise Rate
Expiration Date
Notional Amount(1)
Premiums (Received)
Market Value ...................................................................................................................................................................................................................................................................................................................................................................
BPS Put - OTC iTraxx Europe 34 5-Year Index Sell 0.750% 05/19/2021 2,300 $ (1) $ (1) BRC Put - OTC iTraxx Europe 34 5-Year Index Sell 0.750 05/19/2021 500 (1) 0 CBK Put - OTC CDX.IG-35 5-Year Index Sell 0.800 05/19/2021 900 (1) 0 DUB Put - OTC iTraxx Europe 34 5-Year Index Sell 0.750 05/19/2021 900 (1) 0 FBF Put - OTC CDX.IG-35 5-Year Index Sell 0.900 06/16/2021 900 (1) 0 GST Put - OTC iTraxx Europe 34 5-Year Index Sell 0.800 05/19/2021 900 (1) 0 MYC Put - OTC CDX.IG-35 5-Year Index Sell 0.800 05/19/2021 900 (1) 0 ....................................................................................................... $ (7) $ (1) ___________________________________________________
FOREIGN CURRENCY OPTIONS
Counterparty Description Strike Price
Expiration Date
Notional Amount(1)
Premiums (Received)
Market Value ...................................................................................................................................................................................................................................................................................................................................................................
BOA Put - OTC USD versus CNH CNH 6.380 05/20/2021 52 $ (1) $ 0 Call - OTC USD versus CNH 6.650 05/20/2021 52 0 0 SCX Put - OTC USD versus CNH 6.310 04/07/2021 33 0 0 Call - OTC USD versus CNH 6.610 04/07/2021 33 0 0 ....................................................................................................... $ (1) $ 0 ___________________________________________________
INTEREST RATE SWAPTIONS
Counterparty Description Floating Rate Index
Pay/Receive Floating Rate
Exercise Rate
Expiration Date
Notional Amount(1)
Premiums (Received)
Market Value ...................................................................................................................................................................................................................................................................................................................................................................
BOA Call - OTC 5-Year Interest Rate Swap 3-Month USD-LIBOR Receive 0.865% 04/19/2021 100 $ 0 $ 0
Put - OTC 5-Year Interest Rate Swap 3-Month USD-LIBOR Pay 1.145 04/19/2021 100 0 0
BPS Call - OTC 10-Year Interest Rate Swap 3-Month USD-LIBOR Receive 1.575 04/26/2021 100 0 0
Put - OTC 10-Year Interest Rate Swap 3-Month USD-LIBOR Pay 1.915 04/26/2021 100 0 0
CBK Call - OTC 10-Year Interest Rate Swap 3-Month USD-LIBOR Receive 1.450 04/12/2021 500 (1) 0
Put - OTC 10-Year Interest Rate Swap 3-Month USD-LIBOR Pay 1.770 04/12/2021 500 (2) (4)
GLM Call - OTC 10-Year Interest Rate Swap 3-Month USD-LIBOR Receive 1.450 04/12/2021 500 (2) 0
Put - OTC 10-Year Interest Rate Swap 3-Month USD-LIBOR Pay 1.770 04/12/2021 500 (2) (4)
MYC Call - OTC 10-Year Interest Rate Swap 3-Month USD-LIBOR Receive 1.445 04/12/2021 200 (1) 0
Put - OTC 10-Year Interest Rate Swap 3-Month USD-LIBOR Pay 1.765 04/12/2021 200 (1) (2) .......................................................................................................
$ (9) $ (10) ___________________________________________________ Total Written Options $ (17) $ (11) ___________________________________________________
SWAP AGREEMENTS:
CREDIT DEFAULT SWAPS ON CORPORATE AND SOVEREIGN ISSUES - SELL PROTECTION(2)
Swap Agreements, at Value(5)
Counterparty Reference Entity Fixed
Receive Rate Payment
Frequency Maturity
Date
Implied Credit Spread at
March 31, 2021(3) Notional
Amount(4) Premiums
Paid/(Received)
Unrealized Appreciation/
(Depreciation) Asset Liability ...................................................................................................................................................................................................................................................................................................................................................................
BPS Mexico Government International Bond 1.000% Quarterly 06/20/2024 0.667% $ 40 $ (1) $ 2 $ 1 $ 0
CBK Brazil Government International Bond 1.000 Quarterly 12/20/2022 1.149 245 (8) 7 0 (1) Brazil Government International Bond 1.000 Quarterly 12/20/2024 1.805 300 (5) (3) 0 (8) GST Brazil Government International Bond 1.000 Quarterly 12/20/2024 1.805 200 (3) (3) 0 (6)
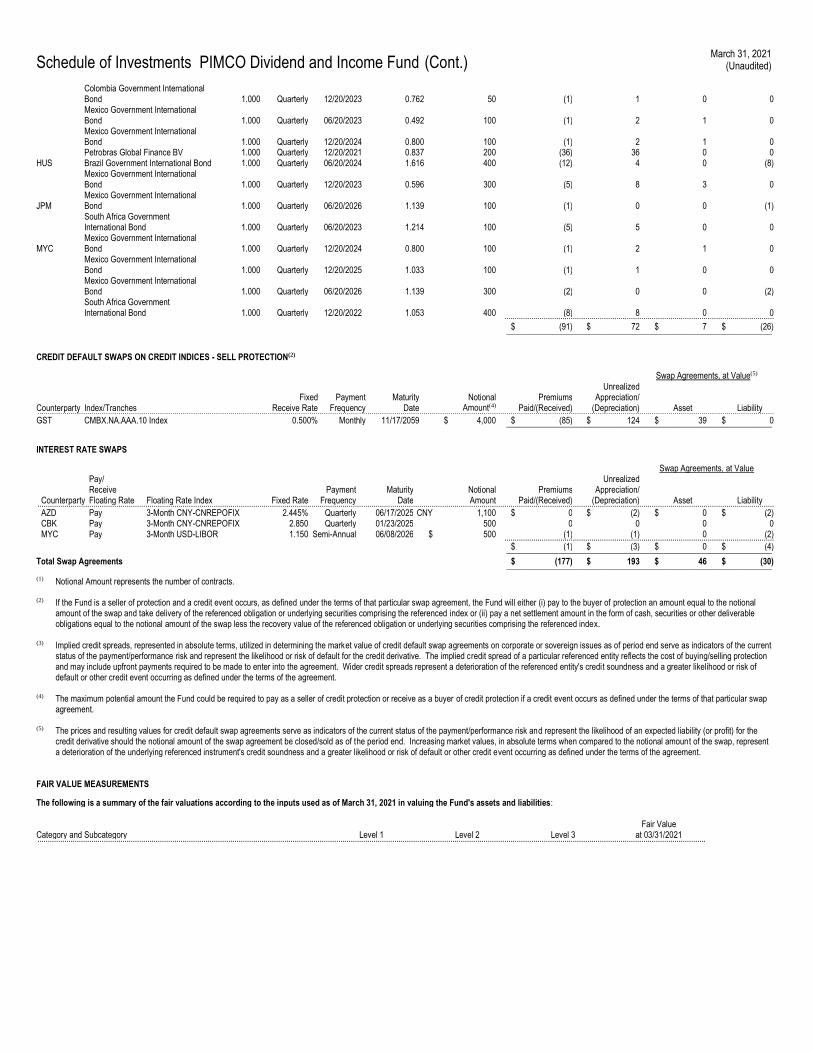
Schedule of Investments PIMCO Dividend and Income Fund (Cont.) March 31, 2021
(Unaudited)
Colombia Government International Bond 1.000 Quarterly 12/20/2023 0.762 50 (1) 1 0 0
Mexico Government International Bond 1.000 Quarterly 06/20/2023 0.492 100 (1) 2 1 0
Mexico Government International Bond 1.000 Quarterly 12/20/2024 0.800 100 (1) 2 1 0
Petrobras Global Finance BV 1.000 Quarterly 12/20/2021 0.837 200 (36) 36 0 0 HUS Brazil Government International Bond 1.000 Quarterly 06/20/2024 1.616 400 (12) 4 0 (8)
Mexico Government International Bond 1.000 Quarterly 12/20/2023 0.596 300 (5) 8 3 0
JPM Mexico Government International Bond 1.000 Quarterly 06/20/2026 1.139 100 (1) 0 0 (1)
South Africa Government International Bond 1.000 Quarterly 06/20/2023 1.214 100 (5) 5 0 0
MYC Mexico Government International Bond 1.000 Quarterly 12/20/2024 0.800 100 (1) 2 1 0
Mexico Government International Bond 1.000 Quarterly 12/20/2025 1.033 100 (1) 1 0 0
Mexico Government International Bond 1.000 Quarterly 06/20/2026 1.139 300 (2) 0 0 (2)
South Africa Government International Bond 1.000 Quarterly 12/20/2022 1.053 400 (8) 8 0 0 ..................................................................................................................................
$ (91) $ 72 $ 7 $ (26) ________________________________________________________________
CREDIT DEFAULT SWAPS ON CREDIT INDICES - SELL PROTECTION(2)
Swap Agreements, at Value(5)
Counterparty Index/Tranches Fixed
Receive Rate Payment
Frequency Maturity
Date Notional
Amount(4) Premiums
Paid/(Received)
Unrealized Appreciation/
(Depreciation) Asset Liability ................................................................................................................................................................................................................................................................................................................................................................... GST CMBX.NA.AAA.10 Index 0.500% Monthly 11/17/2059 $ 4,000 $ (85) $ 124 $ 39 $ 0 ________________________________________________________________
INTEREST RATE SWAPS
Swap Agreements, at Value
Counterparty
Pay/ Receive Floating Rate Floating Rate Index Fixed Rate
Payment Frequency
Maturity Date
Notional Amount
Premiums Paid/(Received)
Unrealized Appreciation/
(Depreciation) Asset Liability ................................................................................................................................................................................................................................................................................................................................................................... AZD Pay 3-Month CNY-CNREPOFIX 2.445% Quarterly 06/17/2025 CNY 1,100 $ 0 $ (2) $ 0 $ (2) CBK Pay 3-Month CNY-CNREPOFIX 2.850 Quarterly 01/23/2025 500 0 0 0 0 MYC Pay 3-Month USD-LIBOR 1.150 Semi-Annual 06/08/2026 $ 500 (1) (1) 0 (2) ..................................................................................................................................
$ (1) $ (3) $ 0 $ (4) ________________________________________________________________
Total Swap Agreements $ (177) $ 193 $ 46 $ (30) ________________________________________________________________
(1) Notional Amount represents the number of contracts.
(2) If the Fund is a seller of protection and a credit event occurs, as defined under the terms of that particular swap agreement, the Fund will either (i) pay to the buyer of protection an amount equal to the notional amount of the swap and take delivery of the referenced obligation or underlying securities comprising the referenced index or (ii) pay a net settlement amount in the form of cash, securities or other deliverable obligations equal to the notional amount of the swap less the recovery value of the referenced obligation or underlying securities comprising the referenced index.
(3) Implied credit spreads, represented in absolute terms, utilized in determining the market value of credit default swap agreements on corporate or sovereign issues as of period end serve as indicators of the current status of the payment/performance risk and represent the likelihood or risk of default for the credit derivative. The implied credit spread of a particular referenced entity reflects the cost of buying/selling protection and may include upfront payments required to be made to enter into the agreement. Wider credit spreads represent a deterioration of the referenced entity's credit soundness and a greater likelihood or risk of default or other credit event occurring as defined under the terms of the agreement.
(4) The maximum potential amount the Fund could be required to pay as a seller of credit protection or receive as a buyer of credit protection if a credit event occurs as defined under the terms of that particular swap agreement.
(5) The prices and resulting values for credit default swap agreements serve as indicators of the current status of the payment/performance risk and represent the likelihood of an expected liability (or profit) for the credit derivative should the notional amount of the swap agreement be closed/sold as of the period end. Increasing market values, in absolute terms when compared to the notional amount of the swap, represent a deterioration of the underlying referenced instrument's credit soundness and a greater likelihood or risk of default or other credit event occurring as defined under the terms of the agreement.
FAIR VALUE MEASUREMENTS
The following is a summary of the fair valuations according to the inputs used as of March 31, 2021 in valuing the Fund's assets and liabilities:
Category and Subcategory Level 1 Level 2 Level 3 Fair Value
at 03/31/2021 ..................................................................................................................................................................................................................................................................................................................................
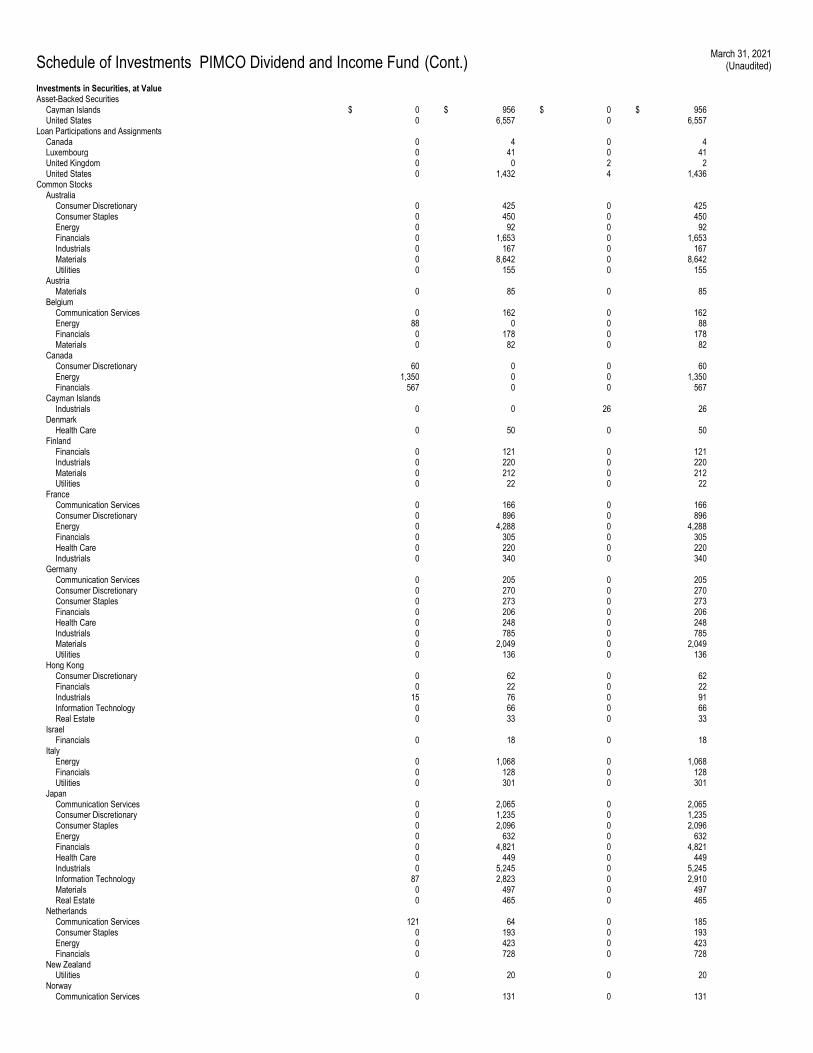
Schedule of Investments PIMCO Dividend and Income Fund (Cont.) March 31, 2021
(Unaudited)
Investments in Securities, at Value Asset-Backed Securities Cayman Islands $ 0 $ 956 $ 0 $ 956 United States 0 6,557 0 6,557 Loan Participations and Assignments Canada 0 4 0 4 Luxembourg 0 41 0 41 United Kingdom 0 0 2 2 United States 0 1,432 4 1,436 Common Stocks Australia Consumer Discretionary 0 425 0 425 Consumer Staples 0 450 0 450 Energy 0 92 0 92 Financials 0 1,653 0 1,653 Industrials 0 167 0 167 Materials 0 8,642 0 8,642 Utilities 0 155 0 155 Austria Materials 0 85 0 85 Belgium Communication Services 0 162 0 162 Energy 88 0 0 88 Financials 0 178 0 178 Materials 0 82 0 82 Canada Consumer Discretionary 60 0 0 60 Energy 1,350 0 0 1,350 Financials 567 0 0 567 Cayman Islands Industrials 0 0 26 26 Denmark Health Care 0 50 0 50 Finland Financials 0 121 0 121 Industrials 0 220 0 220 Materials 0 212 0 212 Utilities 0 22 0 22 France Communication Services 0 166 0 166 Consumer Discretionary 0 896 0 896 Energy 0 4,288 0 4,288 Financials 0 305 0 305 Health Care 0 220 0 220 Industrials 0 340 0 340 Germany Communication Services 0 205 0 205 Consumer Discretionary 0 270 0 270 Consumer Staples 0 273 0 273 Financials 0 206 0 206 Health Care 0 248 0 248 Industrials 0 785 0 785 Materials 0 2,049 0 2,049 Utilities 0 136 0 136 Hong Kong Consumer Discretionary 0 62 0 62 Financials 0 22 0 22 Industrials 15 76 0 91 Information Technology 0 66 0 66 Real Estate 0 33 0 33 Israel Financials 0 18 0 18 Italy Energy 0 1,068 0 1,068 Financials 0 128 0 128 Utilities 0 301 0 301 Japan Communication Services 0 2,065 0 2,065 Consumer Discretionary 0 1,235 0 1,235 Consumer Staples 0 2,096 0 2,096 Energy 0 632 0 632 Financials 0 4,821 0 4,821 Health Care 0 449 0 449 Industrials 0 5,245 0 5,245 Information Technology 87 2,823 0 2,910 Materials 0 497 0 497 Real Estate 0 465 0 465 Netherlands Communication Services 121 64 0 185 Consumer Staples 0 193 0 193 Energy 0 423 0 423 Financials 0 728 0 728 New Zealand Utilities 0 20 0 20 Norway Communication Services 0 131 0 131
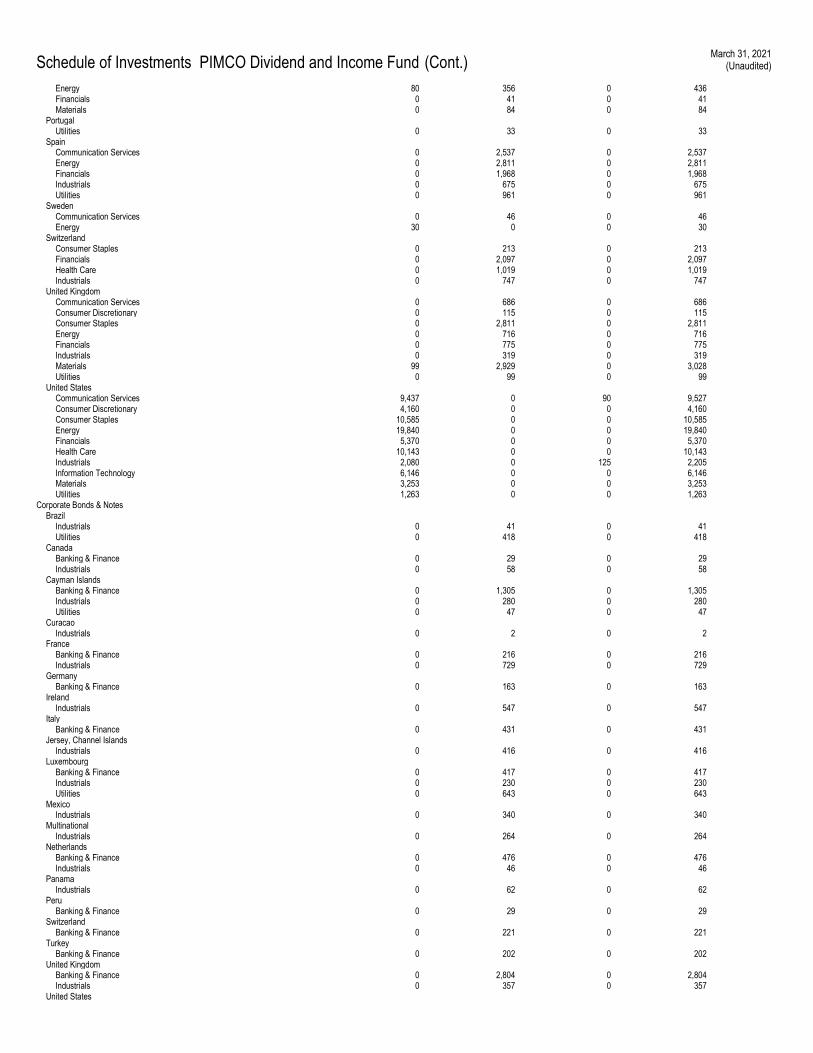
Schedule of Investments PIMCO Dividend and Income Fund (Cont.) March 31, 2021
(Unaudited)
Energy 80 356 0 436 Financials 0 41 0 41 Materials 0 84 0 84 Portugal Utilities 0 33 0 33 Spain Communication Services 0 2,537 0 2,537 Energy 0 2,811 0 2,811 Financials 0 1,968 0 1,968 Industrials 0 675 0 675 Utilities 0 961 0 961 Sweden Communication Services 0 46 0 46 Energy 30 0 0 30 Switzerland Consumer Staples 0 213 0 213 Financials 0 2,097 0 2,097 Health Care 0 1,019 0 1,019 Industrials 0 747 0 747 United Kingdom Communication Services 0 686 0 686 Consumer Discretionary 0 115 0 115 Consumer Staples 0 2,811 0 2,811 Energy 0 716 0 716 Financials 0 775 0 775 Industrials 0 319 0 319 Materials 99 2,929 0 3,028 Utilities 0 99 0 99 United States Communication Services 9,437 0 90 9,527 Consumer Discretionary 4,160 0 0 4,160 Consumer Staples 10,585 0 0 10,585 Energy 19,840 0 0 19,840 Financials 5,370 0 0 5,370 Health Care 10,143 0 0 10,143 Industrials 2,080 0 125 2,205 Information Technology 6,146 0 0 6,146 Materials 3,253 0 0 3,253 Utilities 1,263 0 0 1,263 Corporate Bonds & Notes Brazil Industrials 0 41 0 41 Utilities 0 418 0 418 Canada Banking & Finance 0 29 0 29 Industrials 0 58 0 58 Cayman Islands Banking & Finance 0 1,305 0 1,305 Industrials 0 280 0 280 Utilities 0 47 0 47 Curacao Industrials 0 2 0 2 France Banking & Finance 0 216 0 216 Industrials 0 729 0 729 Germany Banking & Finance 0 163 0 163 Ireland Industrials 0 547 0 547 Italy Banking & Finance 0 431 0 431 Jersey, Channel Islands Industrials 0 416 0 416 Luxembourg Banking & Finance 0 417 0 417 Industrials 0 230 0 230 Utilities 0 643 0 643 Mexico Industrials 0 340 0 340 Multinational Industrials 0 264 0 264 Netherlands Banking & Finance 0 476 0 476 Industrials 0 46 0 46 Panama Industrials 0 62 0 62 Peru Banking & Finance 0 29 0 29 Switzerland Banking & Finance 0 221 0 221 Turkey Banking & Finance 0 202 0 202 United Kingdom Banking & Finance 0 2,804 0 2,804 Industrials 0 357 0 357 United States
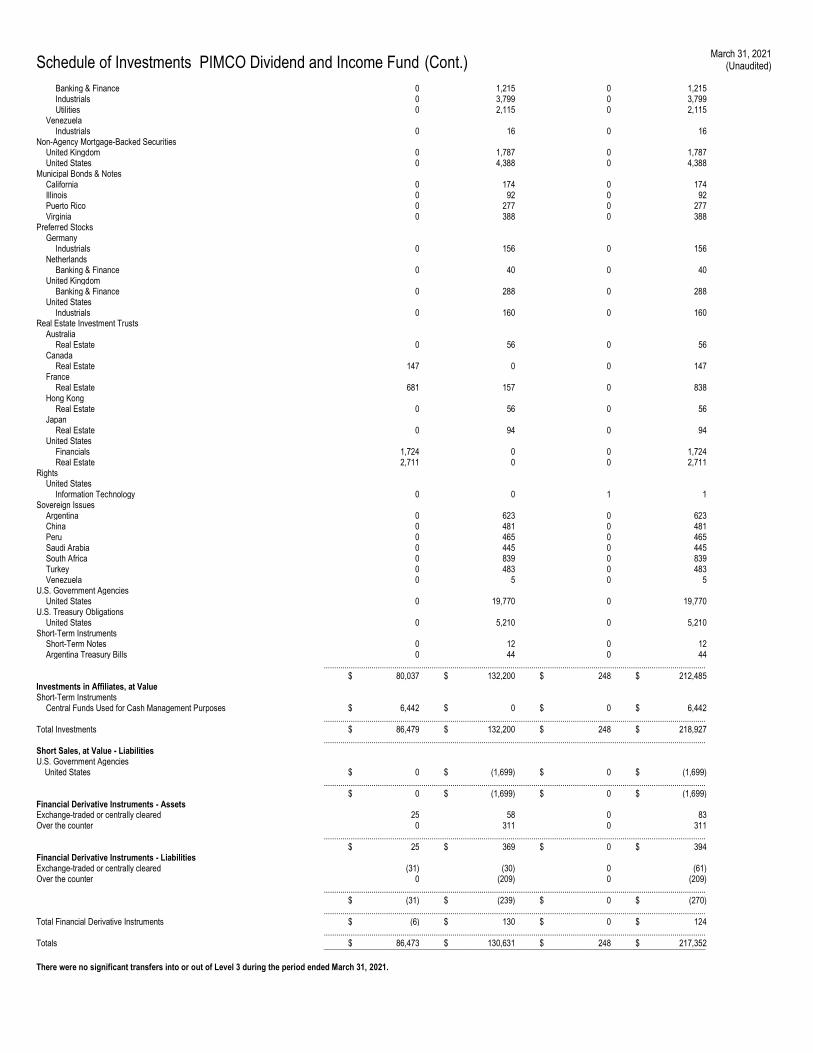
Schedule of Investments PIMCO Dividend and Income Fund (Cont.) March 31, 2021
(Unaudited)
Banking & Finance 0 1,215 0 1,215 Industrials 0 3,799 0 3,799 Utilities 0 2,115 0 2,115 Venezuela Industrials 0 16 0 16 Non-Agency Mortgage-Backed Securities United Kingdom 0 1,787 0 1,787 United States 0 4,388 0 4,388 Municipal Bonds & Notes California 0 174 0 174 Illinois 0 92 0 92 Puerto Rico 0 277 0 277 Virginia 0 388 0 388 Preferred Stocks Germany Industrials 0 156 0 156 Netherlands Banking & Finance 0 40 0 40 United Kingdom Banking & Finance 0 288 0 288 United States Industrials 0 160 0 160 Real Estate Investment Trusts Australia Real Estate 0 56 0 56 Canada Real Estate 147 0 0 147 France Real Estate 681 157 0 838 Hong Kong Real Estate 0 56 0 56 Japan Real Estate 0 94 0 94 United States Financials 1,724 0 0 1,724 Real Estate 2,711 0 0 2,711 Rights United States Information Technology 0 0 1 1 Sovereign Issues Argentina 0 623 0 623 China 0 481 0 481 Peru 0 465 0 465 Saudi Arabia 0 445 0 445 South Africa 0 839 0 839 Turkey 0 483 0 483 Venezuela 0 5 0 5 U.S. Government Agencies United States 0 19,770 0 19,770 U.S. Treasury Obligations United States 0 5,210 0 5,210 Short-Term Instruments Short-Term Notes 0 12 0 12 Argentina Treasury Bills 0 44 0 44 ........................................................................................................................................................................................ $ 80,037 $ 132,200 $ 248 $ 212,485 Investments in Affiliates, at Value Short-Term Instruments Central Funds Used for Cash Management Purposes $ 6,442 $ 0 $ 0 $ 6,442 ........................................................................................................................................................................................ Total Investments $ 86,479 $ 132,200 $ 248 $ 218,927 ........................................................................................................................................................................................ Short Sales, at Value - Liabilities U.S. Government Agencies United States $ 0 $ (1,699) $ 0 $ (1,699) ........................................................................................................................................................................................ $ 0 $ (1,699) $ 0 $ (1,699) Financial Derivative Instruments - Assets Exchange-traded or centrally cleared 25 58 0 83 Over the counter 0 311 0 311 ........................................................................................................................................................................................ $ 25 $ 369 $ 0 $ 394 Financial Derivative Instruments - Liabilities Exchange-traded or centrally cleared (31) (30) 0 (61) Over the counter 0 (209) 0 (209) ........................................................................................................................................................................................ $ (31) $ (239) $ 0 $ (270) ........................................................................................................................................................................................ Total Financial Derivative Instruments $ (6) $ 130 $ 0 $ 124 ........................................................................................................................................................................................ Totals $ 86,473 $ 130,631 $ 248 $ 217,352 ____________________________________________________________________________________________ There were no significant transfers into or out of Level 3 during the period ended March 31, 2021.
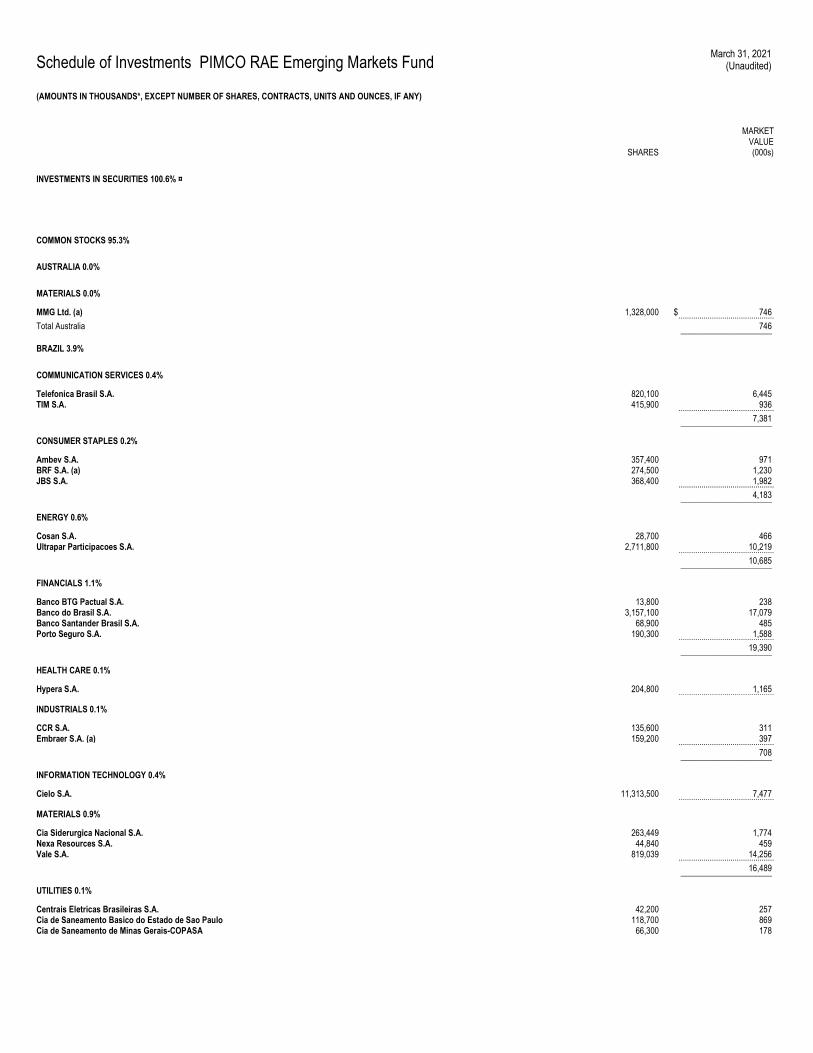
Schedule of Investments PIMCO RAE Emerging Markets Fund March 31, 2021
(Unaudited)
(AMOUNTS IN THOUSANDS*, EXCEPT NUMBER OF SHARES, CONTRACTS, UNITS AND OUNCES, IF ANY)
SHARES
MARKET VALUE (000s)
INVESTMENTS IN SECURITIES 100.6% ¤
COMMON STOCKS 95.3%
AUSTRALIA 0.0%
MATERIALS 0.0%
MMG Ltd. (a) 1,328,000 $ 746 .............................................. Total Australia 746 ______________________
BRAZIL 3.9%
COMMUNICATION SERVICES 0.4%
Telefonica Brasil S.A. 820,100 6,445 TIM S.A. 415,900 936 .............................................. 7,381 ______________________
CONSUMER STAPLES 0.2%
Ambev S.A. 357,400 971 BRF S.A. (a) 274,500 1,230 JBS S.A. 368,400 1,982 .............................................. 4,183 ______________________
ENERGY 0.6%
Cosan S.A. 28,700 466 Ultrapar Participacoes S.A. 2,711,800 10,219 .............................................. 10,685 ______________________
FINANCIALS 1.1%
Banco BTG Pactual S.A. 13,800 238 Banco do Brasil S.A. 3,157,100 17,079 Banco Santander Brasil S.A. 68,900 485 Porto Seguro S.A. 190,300 1,588 .............................................. 19,390 ______________________
HEALTH CARE 0.1%
Hypera S.A. 204,800 1,165 ..............................................
INDUSTRIALS 0.1%
CCR S.A. 135,600 311 Embraer S.A. (a) 159,200 397 .............................................. 708 ______________________
INFORMATION TECHNOLOGY 0.4%
Cielo S.A. 11,313,500 7,477 ..............................................
MATERIALS 0.9%
Cia Siderurgica Nacional S.A. 263,449 1,774 Nexa Resources S.A. 44,840 459 Vale S.A. 819,039 14,256 .............................................. 16,489 ______________________
UTILITIES 0.1%
Centrais Eletricas Brasileiras S.A. 42,200 257 Cia de Saneamento Basico do Estado de Sao Paulo 118,700 869 Cia de Saneamento de Minas Gerais-COPASA 66,300 178
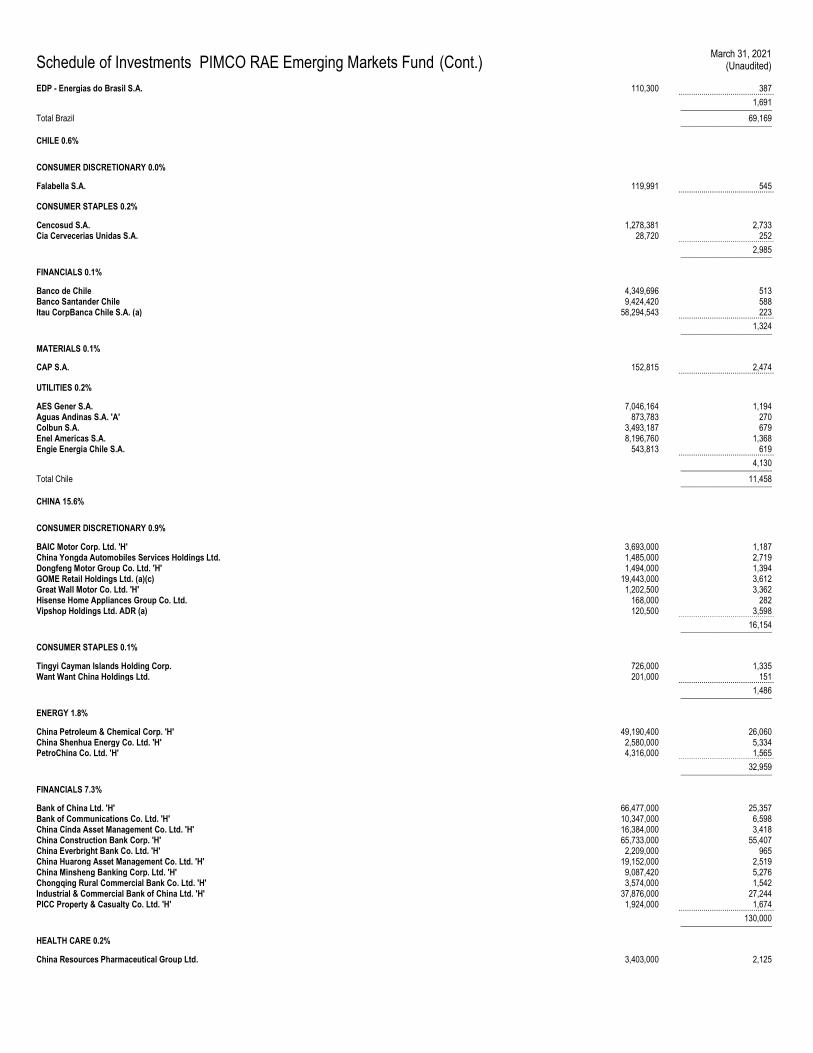
Schedule of Investments PIMCO RAE Emerging Markets Fund (Cont.) March 31, 2021
(Unaudited)
EDP - Energias do Brasil S.A. 110,300 387 .............................................. 1,691 ______________________
Total Brazil 69,169 ______________________
CHILE 0.6%
CONSUMER DISCRETIONARY 0.0%
Falabella S.A. 119,991 545 ..............................................
CONSUMER STAPLES 0.2%
Cencosud S.A. 1,278,381 2,733 Cia Cervecerias Unidas S.A. 28,720 252 .............................................. 2,985 ______________________
FINANCIALS 0.1%
Banco de Chile 4,349,696 513 Banco Santander Chile 9,424,420 588 Itau CorpBanca Chile S.A. (a) 58,294,543 223 .............................................. 1,324 ______________________
MATERIALS 0.1%
CAP S.A. 152,815 2,474 ..............................................
UTILITIES 0.2%
AES Gener S.A. 7,046,164 1,194 Aguas Andinas S.A. 'A' 873,783 270 Colbun S.A. 3,493,187 679 Enel Americas S.A. 8,196,760 1,368 Engie Energia Chile S.A. 543,813 619 .............................................. 4,130 ______________________
Total Chile 11,458 ______________________
CHINA 15.6%
CONSUMER DISCRETIONARY 0.9%
BAIC Motor Corp. Ltd. 'H' 3,693,000 1,187 China Yongda Automobiles Services Holdings Ltd. 1,485,000 2,719 Dongfeng Motor Group Co. Ltd. 'H' 1,494,000 1,394 GOME Retail Holdings Ltd. (a)(c) 19,443,000 3,612 Great Wall Motor Co. Ltd. 'H' 1,202,500 3,362 Hisense Home Appliances Group Co. Ltd. 168,000 282 Vipshop Holdings Ltd. ADR (a) 120,500 3,598 .............................................. 16,154 ______________________
CONSUMER STAPLES 0.1%
Tingyi Cayman Islands Holding Corp. 726,000 1,335 Want Want China Holdings Ltd. 201,000 151 .............................................. 1,486 ______________________
ENERGY 1.8%
China Petroleum & Chemical Corp. 'H' 49,190,400 26,060 China Shenhua Energy Co. Ltd. 'H' 2,580,000 5,334 PetroChina Co. Ltd. 'H' 4,316,000 1,565 .............................................. 32,959 ______________________
FINANCIALS 7.3%
Bank of China Ltd. 'H' 66,477,000 25,357 Bank of Communications Co. Ltd. 'H' 10,347,000 6,598 China Cinda Asset Management Co. Ltd. 'H' 16,384,000 3,418 China Construction Bank Corp. 'H' 65,733,000 55,407 China Everbright Bank Co. Ltd. 'H' 2,209,000 965 China Huarong Asset Management Co. Ltd. 'H' 19,152,000 2,519 China Minsheng Banking Corp. Ltd. 'H' 9,087,420 5,276 Chongqing Rural Commercial Bank Co. Ltd. 'H' 3,574,000 1,542 Industrial & Commercial Bank of China Ltd. 'H' 37,876,000 27,244 PICC Property & Casualty Co. Ltd. 'H' 1,924,000 1,674 .............................................. 130,000 ______________________
HEALTH CARE 0.2%
China Resources Pharmaceutical Group Ltd. 3,403,000 2,125
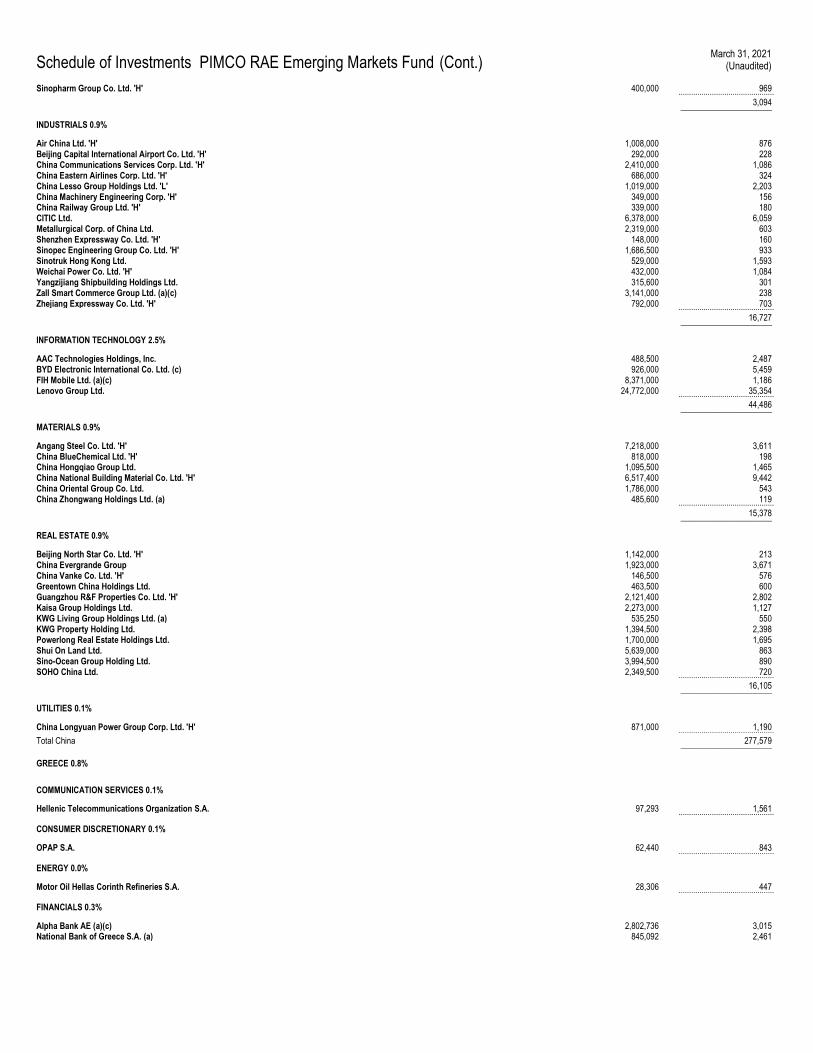
Schedule of Investments PIMCO RAE Emerging Markets Fund (Cont.) March 31, 2021
(Unaudited)
Sinopharm Group Co. Ltd. 'H' 400,000 969 .............................................. 3,094 ______________________
INDUSTRIALS 0.9%
Air China Ltd. 'H' 1,008,000 876 Beijing Capital International Airport Co. Ltd. 'H' 292,000 228 China Communications Services Corp. Ltd. 'H' 2,410,000 1,086 China Eastern Airlines Corp. Ltd. 'H' 686,000 324 China Lesso Group Holdings Ltd. 'L' 1,019,000 2,203 China Machinery Engineering Corp. 'H' 349,000 156 China Railway Group Ltd. 'H' 339,000 180 CITIC Ltd. 6,378,000 6,059 Metallurgical Corp. of China Ltd. 2,319,000 603 Shenzhen Expressway Co. Ltd. 'H' 148,000 160 Sinopec Engineering Group Co. Ltd. 'H' 1,686,500 933 Sinotruk Hong Kong Ltd. 529,000 1,593 Weichai Power Co. Ltd. 'H' 432,000 1,084 Yangzijiang Shipbuilding Holdings Ltd. 315,600 301 Zall Smart Commerce Group Ltd. (a)(c) 3,141,000 238 Zhejiang Expressway Co. Ltd. 'H' 792,000 703 .............................................. 16,727 ______________________
INFORMATION TECHNOLOGY 2.5%
AAC Technologies Holdings, Inc. 488,500 2,487 BYD Electronic International Co. Ltd. (c) 926,000 5,459 FIH Mobile Ltd. (a)(c) 8,371,000 1,186 Lenovo Group Ltd. 24,772,000 35,354 .............................................. 44,486 ______________________
MATERIALS 0.9%
Angang Steel Co. Ltd. 'H' 7,218,000 3,611 China BlueChemical Ltd. 'H' 818,000 198 China Hongqiao Group Ltd. 1,095,500 1,465 China National Building Material Co. Ltd. 'H' 6,517,400 9,442 China Oriental Group Co. Ltd. 1,786,000 543 China Zhongwang Holdings Ltd. (a) 485,600 119 .............................................. 15,378 ______________________
REAL ESTATE 0.9%
Beijing North Star Co. Ltd. 'H' 1,142,000 213 China Evergrande Group 1,923,000 3,671 China Vanke Co. Ltd. 'H' 146,500 576 Greentown China Holdings Ltd. 463,500 600 Guangzhou R&F Properties Co. Ltd. 'H' 2,121,400 2,802 Kaisa Group Holdings Ltd. 2,273,000 1,127 KWG Living Group Holdings Ltd. (a) 535,250 550 KWG Property Holding Ltd. 1,394,500 2,398 Powerlong Real Estate Holdings Ltd. 1,700,000 1,695 Shui On Land Ltd. 5,639,000 863 Sino-Ocean Group Holding Ltd. 3,994,500 890 SOHO China Ltd. 2,349,500 720 .............................................. 16,105 ______________________
UTILITIES 0.1%
China Longyuan Power Group Corp. Ltd. 'H' 871,000 1,190 .............................................. Total China 277,579 ______________________
GREECE 0.8%
COMMUNICATION SERVICES 0.1%
Hellenic Telecommunications Organization S.A. 97,293 1,561 ..............................................
CONSUMER DISCRETIONARY 0.1%
OPAP S.A. 62,440 843 ..............................................
ENERGY 0.0%
Motor Oil Hellas Corinth Refineries S.A. 28,306 447 ..............................................
FINANCIALS 0.3%
Alpha Bank AE (a)(c) 2,802,736 3,015 National Bank of Greece S.A. (a) 845,092 2,461
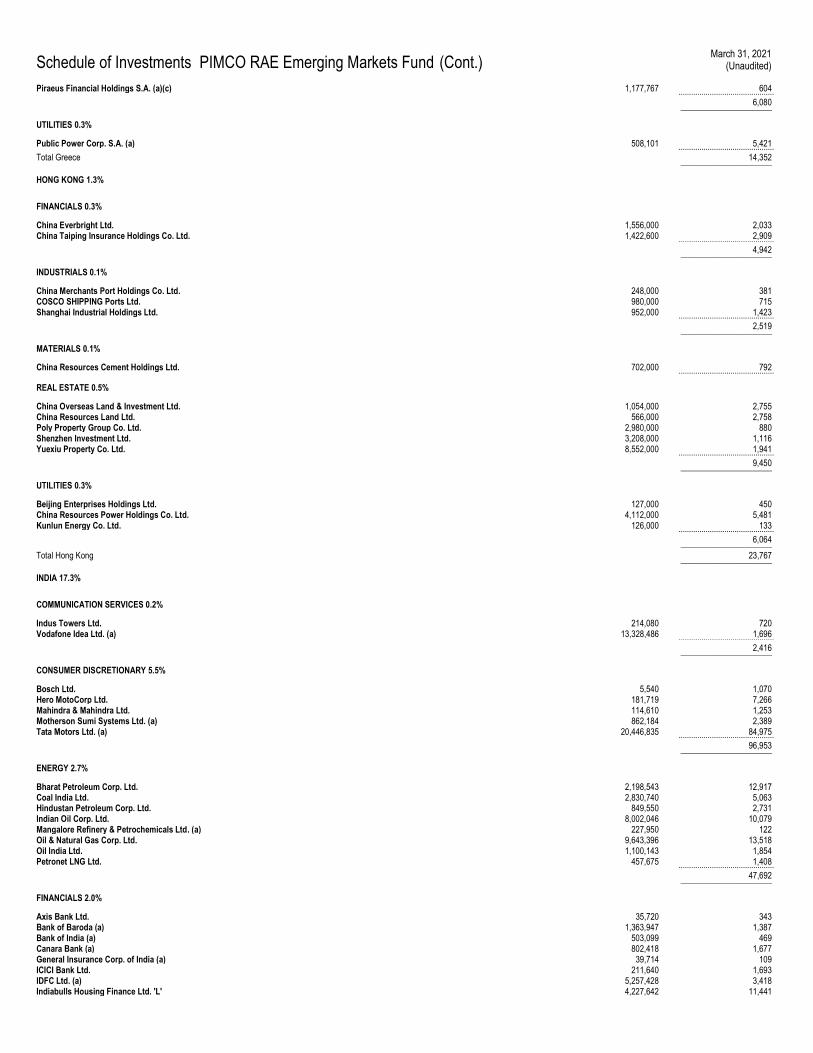
Schedule of Investments PIMCO RAE Emerging Markets Fund (Cont.) March 31, 2021
(Unaudited)
Piraeus Financial Holdings S.A. (a)(c) 1,177,767 604 .............................................. 6,080 ______________________
UTILITIES 0.3%
Public Power Corp. S.A. (a) 508,101 5,421 .............................................. Total Greece 14,352 ______________________
HONG KONG 1.3%
FINANCIALS 0.3%
China Everbright Ltd. 1,556,000 2,033 China Taiping Insurance Holdings Co. Ltd. 1,422,600 2,909 .............................................. 4,942 ______________________
INDUSTRIALS 0.1%
China Merchants Port Holdings Co. Ltd. 248,000 381 COSCO SHIPPING Ports Ltd. 980,000 715 Shanghai Industrial Holdings Ltd. 952,000 1,423 .............................................. 2,519 ______________________
MATERIALS 0.1%
China Resources Cement Holdings Ltd. 702,000 792 ..............................................
REAL ESTATE 0.5%
China Overseas Land & Investment Ltd. 1,054,000 2,755 China Resources Land Ltd. 566,000 2,758 Poly Property Group Co. Ltd. 2,980,000 880 Shenzhen Investment Ltd. 3,208,000 1,116 Yuexiu Property Co. Ltd. 8,552,000 1,941 .............................................. 9,450 ______________________
UTILITIES 0.3%
Beijing Enterprises Holdings Ltd. 127,000 450 China Resources Power Holdings Co. Ltd. 4,112,000 5,481 Kunlun Energy Co. Ltd. 126,000 133 .............................................. 6,064 ______________________
Total Hong Kong 23,767 ______________________
INDIA 17.3%
COMMUNICATION SERVICES 0.2%
Indus Towers Ltd. 214,080 720 Vodafone Idea Ltd. (a) 13,328,486 1,696 .............................................. 2,416 ______________________
CONSUMER DISCRETIONARY 5.5%
Bosch Ltd. 5,540 1,070 Hero MotoCorp Ltd. 181,719 7,266 Mahindra & Mahindra Ltd. 114,610 1,253 Motherson Sumi Systems Ltd. (a) 862,184 2,389 Tata Motors Ltd. (a) 20,446,835 84,975 .............................................. 96,953 ______________________
ENERGY 2.7%
Bharat Petroleum Corp. Ltd. 2,198,543 12,917 Coal India Ltd. 2,830,740 5,063 Hindustan Petroleum Corp. Ltd. 849,550 2,731 Indian Oil Corp. Ltd. 8,002,046 10,079 Mangalore Refinery & Petrochemicals Ltd. (a) 227,950 122 Oil & Natural Gas Corp. Ltd. 9,643,396 13,518 Oil India Ltd. 1,100,143 1,854 Petronet LNG Ltd. 457,675 1,408 .............................................. 47,692 ______________________
FINANCIALS 2.0%
Axis Bank Ltd. 35,720 343 Bank of Baroda (a) 1,363,947 1,387 Bank of India (a) 503,099 469 Canara Bank (a) 802,418 1,677 General Insurance Corp. of India (a) 39,714 109 ICICI Bank Ltd. 211,640 1,693 IDFC Ltd. (a) 5,257,428 3,418 Indiabulls Housing Finance Ltd. 'L' 4,227,642 11,441
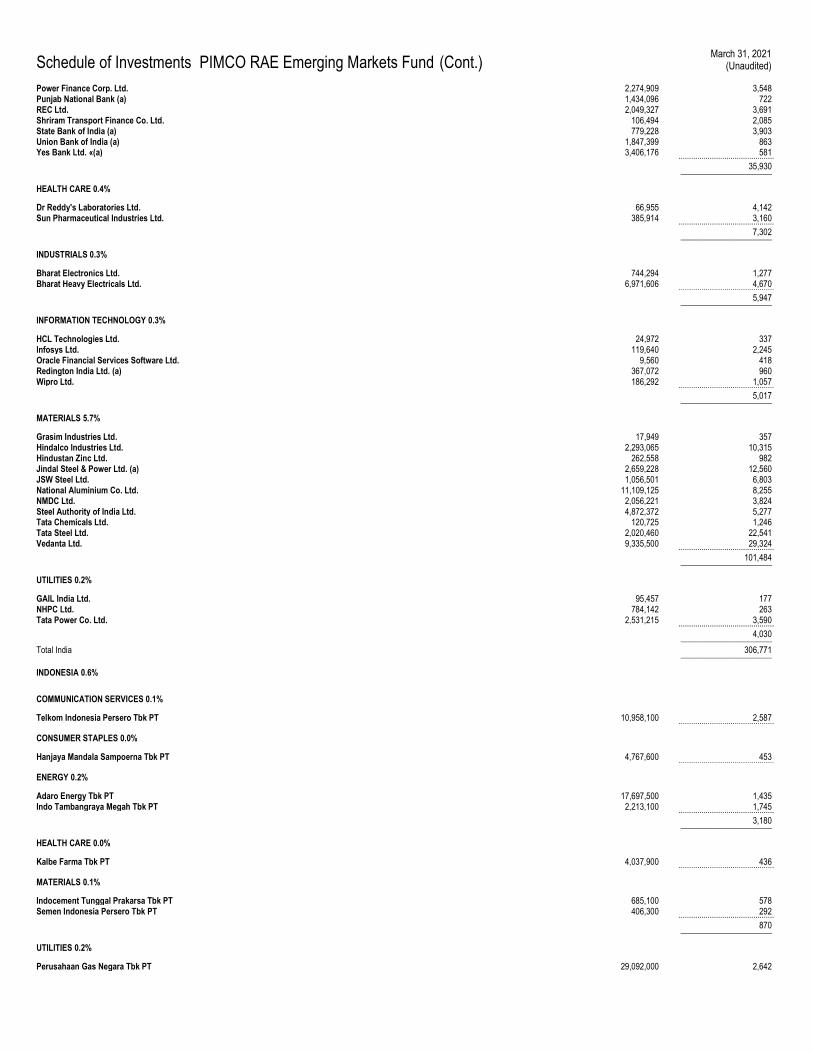
Schedule of Investments PIMCO RAE Emerging Markets Fund (Cont.) March 31, 2021
(Unaudited)
Power Finance Corp. Ltd. 2,274,909 3,548 Punjab National Bank (a) 1,434,096 722 REC Ltd. 2,049,327 3,691 Shriram Transport Finance Co. Ltd. 106,494 2,085 State Bank of India (a) 779,228 3,903 Union Bank of India (a) 1,847,399 863 Yes Bank Ltd. «(a) 3,406,176 581 .............................................. 35,930 ______________________
HEALTH CARE 0.4%
Dr Reddy's Laboratories Ltd. 66,955 4,142 Sun Pharmaceutical Industries Ltd. 385,914 3,160 .............................................. 7,302 ______________________
INDUSTRIALS 0.3%
Bharat Electronics Ltd. 744,294 1,277 Bharat Heavy Electricals Ltd. 6,971,606 4,670 .............................................. 5,947 ______________________
INFORMATION TECHNOLOGY 0.3%
HCL Technologies Ltd. 24,972 337 Infosys Ltd. 119,640 2,245 Oracle Financial Services Software Ltd. 9,560 418 Redington India Ltd. (a) 367,072 960 Wipro Ltd. 186,292 1,057 .............................................. 5,017 ______________________
MATERIALS 5.7%
Grasim Industries Ltd. 17,949 357 Hindalco Industries Ltd. 2,293,065 10,315 Hindustan Zinc Ltd. 262,558 982 Jindal Steel & Power Ltd. (a) 2,659,228 12,560 JSW Steel Ltd. 1,056,501 6,803 National Aluminium Co. Ltd. 11,109,125 8,255 NMDC Ltd. 2,056,221 3,824 Steel Authority of India Ltd. 4,872,372 5,277 Tata Chemicals Ltd. 120,725 1,246 Tata Steel Ltd. 2,020,460 22,541 Vedanta Ltd. 9,335,500 29,324 .............................................. 101,484 ______________________
UTILITIES 0.2%
GAIL India Ltd. 95,457 177 NHPC Ltd. 784,142 263 Tata Power Co. Ltd. 2,531,215 3,590 .............................................. 4,030 ______________________
Total India 306,771 ______________________
INDONESIA 0.6%
COMMUNICATION SERVICES 0.1%
Telkom Indonesia Persero Tbk PT 10,958,100 2,587 ..............................................
CONSUMER STAPLES 0.0%
Hanjaya Mandala Sampoerna Tbk PT 4,767,600 453 ..............................................
ENERGY 0.2%
Adaro Energy Tbk PT 17,697,500 1,435 Indo Tambangraya Megah Tbk PT 2,213,100 1,745 .............................................. 3,180 ______________________
HEALTH CARE 0.0%
Kalbe Farma Tbk PT 4,037,900 436 ..............................................
MATERIALS 0.1%
Indocement Tunggal Prakarsa Tbk PT 685,100 578 Semen Indonesia Persero Tbk PT 406,300 292 .............................................. 870 ______________________
UTILITIES 0.2%
Perusahaan Gas Negara Tbk PT 29,092,000 2,642
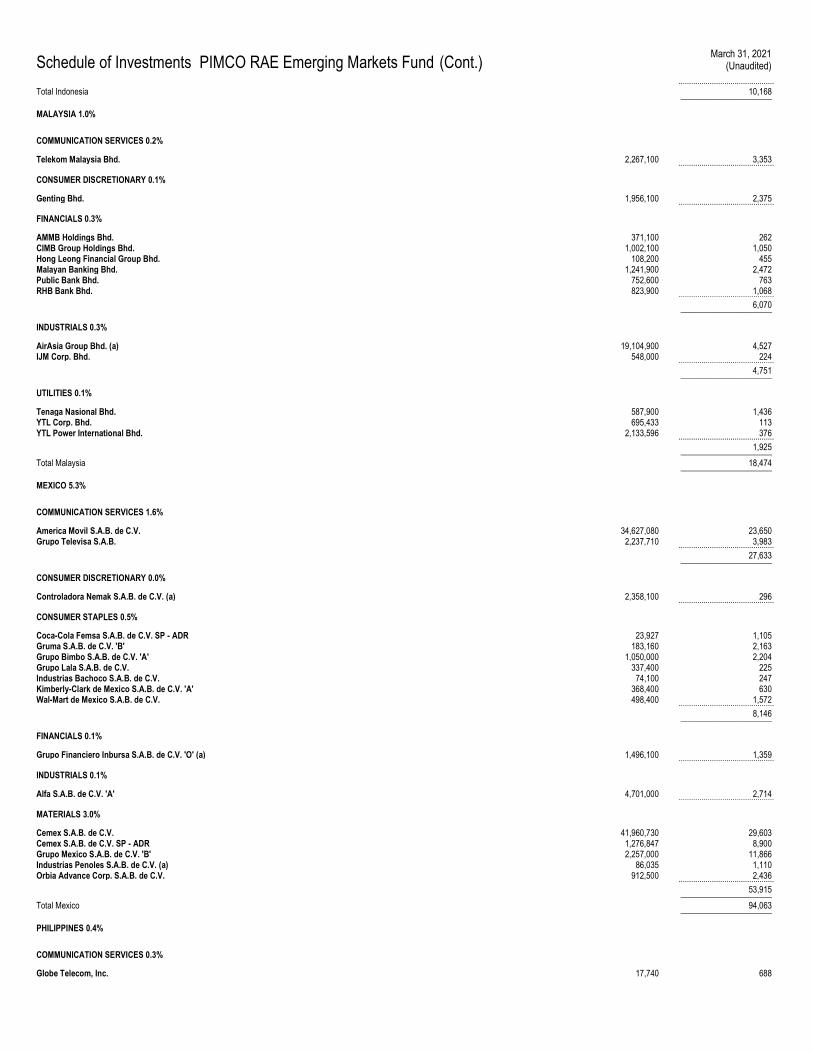
Schedule of Investments PIMCO RAE Emerging Markets Fund (Cont.) March 31, 2021
(Unaudited)
.............................................. Total Indonesia 10,168 ______________________
MALAYSIA 1.0%
COMMUNICATION SERVICES 0.2%
Telekom Malaysia Bhd. 2,267,100 3,353 ..............................................
CONSUMER DISCRETIONARY 0.1%
Genting Bhd. 1,956,100 2,375 ..............................................
FINANCIALS 0.3%
AMMB Holdings Bhd. 371,100 262 CIMB Group Holdings Bhd. 1,002,100 1,050 Hong Leong Financial Group Bhd. 108,200 455 Malayan Banking Bhd. 1,241,900 2,472 Public Bank Bhd. 752,600 763 RHB Bank Bhd. 823,900 1,068 .............................................. 6,070 ______________________
INDUSTRIALS 0.3%
AirAsia Group Bhd. (a) 19,104,900 4,527 IJM Corp. Bhd. 548,000 224 .............................................. 4,751 ______________________
UTILITIES 0.1%
Tenaga Nasional Bhd. 587,900 1,436 YTL Corp. Bhd. 695,433 113 YTL Power International Bhd. 2,133,596 376 .............................................. 1,925 ______________________
Total Malaysia 18,474 ______________________
MEXICO 5.3%
COMMUNICATION SERVICES 1.6%
America Movil S.A.B. de C.V. 34,627,080 23,650 Grupo Televisa S.A.B. 2,237,710 3,983 .............................................. 27,633 ______________________
CONSUMER DISCRETIONARY 0.0%
Controladora Nemak S.A.B. de C.V. (a) 2,358,100 296 ..............................................
CONSUMER STAPLES 0.5%
Coca-Cola Femsa S.A.B. de C.V. SP - ADR 23,927 1,105 Gruma S.A.B. de C.V. 'B' 183,160 2,163 Grupo Bimbo S.A.B. de C.V. 'A' 1,050,000 2,204 Grupo Lala S.A.B. de C.V. 337,400 225 Industrias Bachoco S.A.B. de C.V. 74,100 247 Kimberly-Clark de Mexico S.A.B. de C.V. 'A' 368,400 630 Wal-Mart de Mexico S.A.B. de C.V. 498,400 1,572 .............................................. 8,146 ______________________
FINANCIALS 0.1%
Grupo Financiero Inbursa S.A.B. de C.V. 'O' (a) 1,496,100 1,359 ..............................................
INDUSTRIALS 0.1%
Alfa S.A.B. de C.V. 'A' 4,701,000 2,714 ..............................................
MATERIALS 3.0%
Cemex S.A.B. de C.V. 41,960,730 29,603 Cemex S.A.B. de C.V. SP - ADR 1,276,847 8,900 Grupo Mexico S.A.B. de C.V. 'B' 2,257,000 11,866 Industrias Penoles S.A.B. de C.V. (a) 86,035 1,110 Orbia Advance Corp. S.A.B. de C.V. 912,500 2,436 .............................................. 53,915 ______________________
Total Mexico 94,063 ______________________
PHILIPPINES 0.4%
COMMUNICATION SERVICES 0.3%
Globe Telecom, Inc. 17,740 688
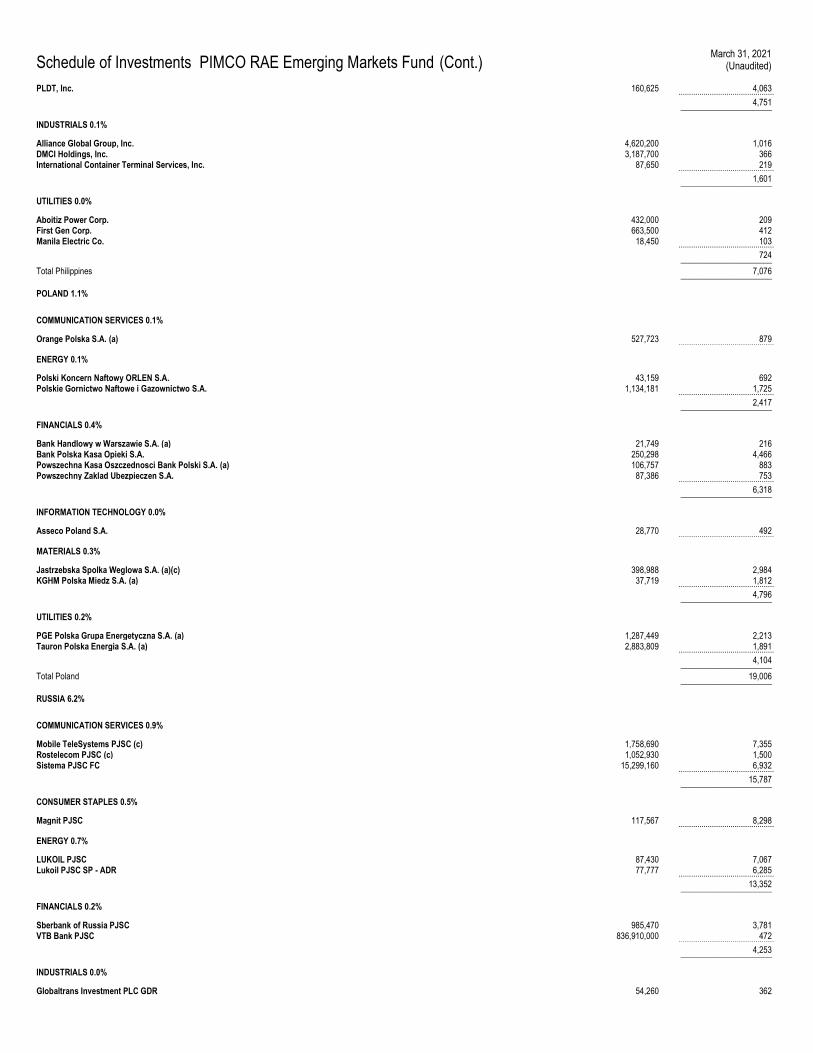
Schedule of Investments PIMCO RAE Emerging Markets Fund (Cont.) March 31, 2021
(Unaudited)
PLDT, Inc. 160,625 4,063 .............................................. 4,751 ______________________
INDUSTRIALS 0.1%
Alliance Global Group, Inc. 4,620,200 1,016 DMCI Holdings, Inc. 3,187,700 366 International Container Terminal Services, Inc. 87,650 219 .............................................. 1,601 ______________________
UTILITIES 0.0%
Aboitiz Power Corp. 432,000 209 First Gen Corp. 663,500 412 Manila Electric Co. 18,450 103 .............................................. 724 ______________________
Total Philippines 7,076 ______________________
POLAND 1.1%
COMMUNICATION SERVICES 0.1%
Orange Polska S.A. (a) 527,723 879 ..............................................
ENERGY 0.1%
Polski Koncern Naftowy ORLEN S.A. 43,159 692 Polskie Gornictwo Naftowe i Gazownictwo S.A. 1,134,181 1,725 .............................................. 2,417 ______________________
FINANCIALS 0.4%
Bank Handlowy w Warszawie S.A. (a) 21,749 216 Bank Polska Kasa Opieki S.A. 250,298 4,466 Powszechna Kasa Oszczednosci Bank Polski S.A. (a) 106,757 883 Powszechny Zaklad Ubezpieczen S.A. 87,386 753 .............................................. 6,318 ______________________
INFORMATION TECHNOLOGY 0.0%
Asseco Poland S.A. 28,770 492 ..............................................
MATERIALS 0.3%
Jastrzebska Spolka Weglowa S.A. (a)(c) 398,988 2,984 KGHM Polska Miedz S.A. (a) 37,719 1,812 .............................................. 4,796 ______________________
UTILITIES 0.2%
PGE Polska Grupa Energetyczna S.A. (a) 1,287,449 2,213 Tauron Polska Energia S.A. (a) 2,883,809 1,891 .............................................. 4,104 ______________________
Total Poland 19,006 ______________________
RUSSIA 6.2%
COMMUNICATION SERVICES 0.9%
Mobile TeleSystems PJSC (c) 1,758,690 7,355 Rostelecom PJSC (c) 1,052,930 1,500 Sistema PJSC FC 15,299,160 6,932 .............................................. 15,787 ______________________
CONSUMER STAPLES 0.5%
Magnit PJSC 117,567 8,298 ..............................................
ENERGY 0.7%
LUKOIL PJSC 87,430 7,067 Lukoil PJSC SP - ADR 77,777 6,285 .............................................. 13,352 ______________________
FINANCIALS 0.2%
Sberbank of Russia PJSC 985,470 3,781 VTB Bank PJSC 836,910,000 472 .............................................. 4,253 ______________________
INDUSTRIALS 0.0%
Globaltrans Investment PLC GDR 54,260 362
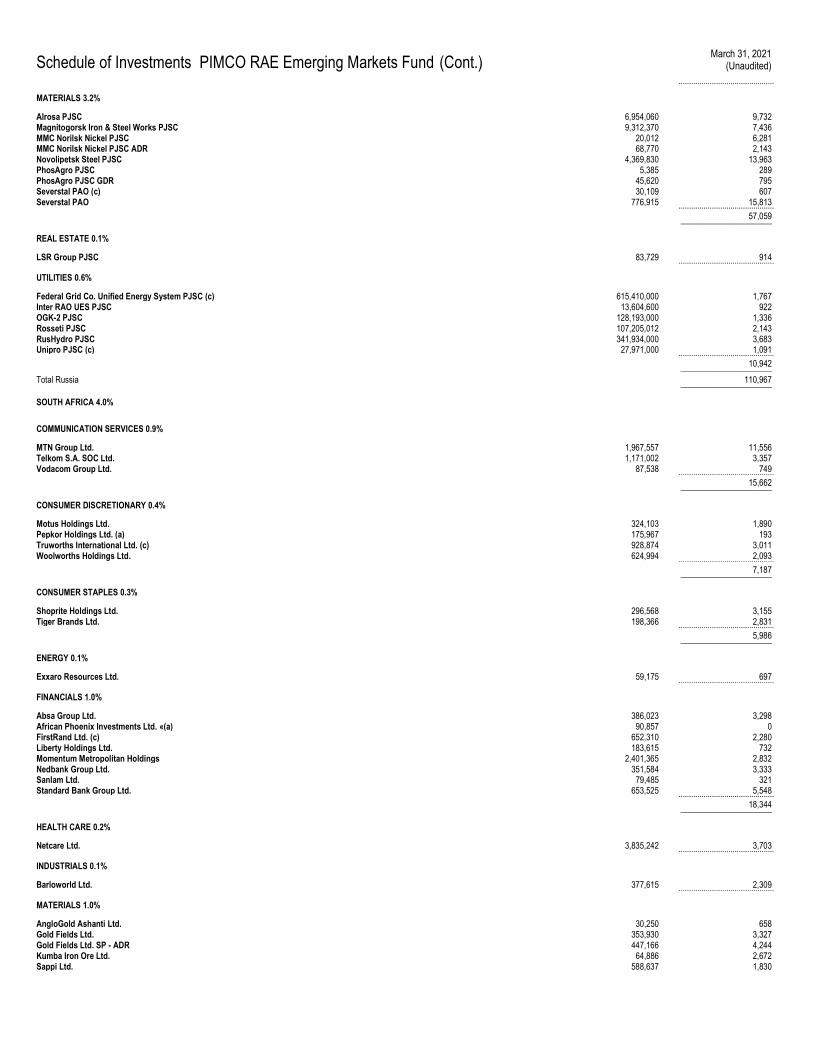
Schedule of Investments PIMCO RAE Emerging Markets Fund (Cont.) March 31, 2021
(Unaudited)
..............................................
MATERIALS 3.2%
Alrosa PJSC 6,954,060 9,732 Magnitogorsk Iron & Steel Works PJSC 9,312,370 7,436 MMC Norilsk Nickel PJSC 20,012 6,281 MMC Norilsk Nickel PJSC ADR 68,770 2,143 Novolipetsk Steel PJSC 4,369,830 13,963 PhosAgro PJSC 5,385 289 PhosAgro PJSC GDR 45,620 795 Severstal PAO (c) 30,109 607 Severstal PAO 776,915 15,813 .............................................. 57,059 ______________________
REAL ESTATE 0.1%
LSR Group PJSC 83,729 914 ..............................................
UTILITIES 0.6%
Federal Grid Co. Unified Energy System PJSC (c) 615,410,000 1,767 Inter RAO UES PJSC 13,604,600 922 OGK-2 PJSC 128,193,000 1,336 Rosseti PJSC 107,205,012 2,143 RusHydro PJSC 341,934,000 3,683 Unipro PJSC (c) 27,971,000 1,091 .............................................. 10,942 ______________________
Total Russia 110,967 ______________________
SOUTH AFRICA 4.0%
COMMUNICATION SERVICES 0.9%
MTN Group Ltd. 1,967,557 11,556 Telkom S.A. SOC Ltd. 1,171,002 3,357 Vodacom Group Ltd. 87,538 749 .............................................. 15,662 ______________________
CONSUMER DISCRETIONARY 0.4%
Motus Holdings Ltd. 324,103 1,890 Pepkor Holdings Ltd. (a) 175,967 193 Truworths International Ltd. (c) 928,874 3,011 Woolworths Holdings Ltd. 624,994 2,093 .............................................. 7,187 ______________________
CONSUMER STAPLES 0.3%
Shoprite Holdings Ltd. 296,568 3,155 Tiger Brands Ltd. 198,366 2,831 .............................................. 5,986 ______________________
ENERGY 0.1%
Exxaro Resources Ltd. 59,175 697 ..............................................
FINANCIALS 1.0%
Absa Group Ltd. 386,023 3,298 African Phoenix Investments Ltd. «(a) 90,857 0 FirstRand Ltd. (c) 652,310 2,280 Liberty Holdings Ltd. 183,615 732 Momentum Metropolitan Holdings 2,401,365 2,832 Nedbank Group Ltd. 351,584 3,333 Sanlam Ltd. 79,485 321 Standard Bank Group Ltd. 653,525 5,548 .............................................. 18,344 ______________________
HEALTH CARE 0.2%
Netcare Ltd. 3,835,242 3,703 ..............................................
INDUSTRIALS 0.1%
Barloworld Ltd. 377,615 2,309 ..............................................
MATERIALS 1.0%
AngloGold Ashanti Ltd. 30,250 658 Gold Fields Ltd. 353,930 3,327 Gold Fields Ltd. SP - ADR 447,166 4,244 Kumba Iron Ore Ltd. 64,886 2,672 Sappi Ltd. 588,637 1,830
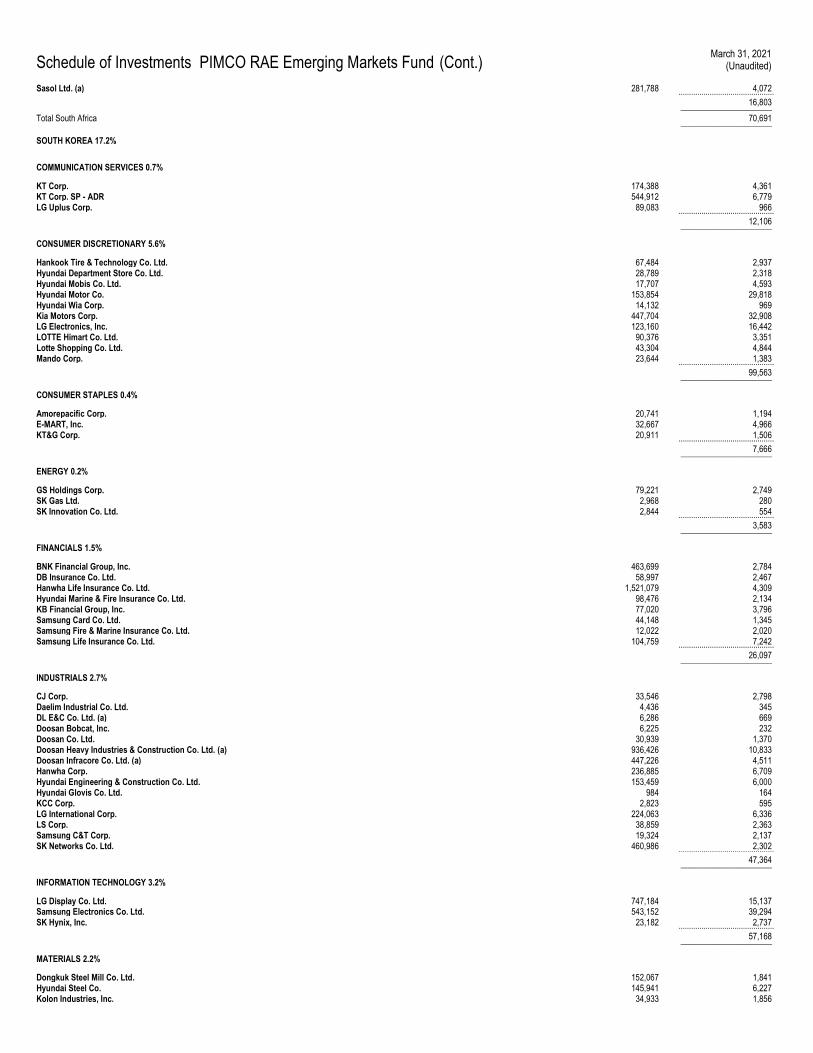
Schedule of Investments PIMCO RAE Emerging Markets Fund (Cont.) March 31, 2021
(Unaudited)
Sasol Ltd. (a) 281,788 4,072 .............................................. 16,803 ______________________
Total South Africa 70,691 ______________________
SOUTH KOREA 17.2%
COMMUNICATION SERVICES 0.7%
KT Corp. 174,388 4,361 KT Corp. SP - ADR 544,912 6,779 LG Uplus Corp. 89,083 966 .............................................. 12,106 ______________________
CONSUMER DISCRETIONARY 5.6%
Hankook Tire & Technology Co. Ltd. 67,484 2,937 Hyundai Department Store Co. Ltd. 28,789 2,318 Hyundai Mobis Co. Ltd. 17,707 4,593 Hyundai Motor Co. 153,854 29,818 Hyundai Wia Corp. 14,132 969 Kia Motors Corp. 447,704 32,908 LG Electronics, Inc. 123,160 16,442 LOTTE Himart Co. Ltd. 90,376 3,351 Lotte Shopping Co. Ltd. 43,304 4,844 Mando Corp. 23,644 1,383 .............................................. 99,563 ______________________
CONSUMER STAPLES 0.4%
Amorepacific Corp. 20,741 1,194 E-MART, Inc. 32,667 4,966 KT&G Corp. 20,911 1,506 .............................................. 7,666 ______________________
ENERGY 0.2%
GS Holdings Corp. 79,221 2,749 SK Gas Ltd. 2,968 280 SK Innovation Co. Ltd. 2,844 554 .............................................. 3,583 ______________________
FINANCIALS 1.5%
BNK Financial Group, Inc. 463,699 2,784 DB Insurance Co. Ltd. 58,997 2,467 Hanwha Life Insurance Co. Ltd. 1,521,079 4,309 Hyundai Marine & Fire Insurance Co. Ltd. 98,476 2,134 KB Financial Group, Inc. 77,020 3,796 Samsung Card Co. Ltd. 44,148 1,345 Samsung Fire & Marine Insurance Co. Ltd. 12,022 2,020 Samsung Life Insurance Co. Ltd. 104,759 7,242 .............................................. 26,097 ______________________
INDUSTRIALS 2.7%
CJ Corp. 33,546 2,798 Daelim Industrial Co. Ltd. 4,436 345 DL E&C Co. Ltd. (a) 6,286 669 Doosan Bobcat, Inc. 6,225 232 Doosan Co. Ltd. 30,939 1,370 Doosan Heavy Industries & Construction Co. Ltd. (a) 936,426 10,833 Doosan Infracore Co. Ltd. (a) 447,226 4,511 Hanwha Corp. 236,885 6,709 Hyundai Engineering & Construction Co. Ltd. 153,459 6,000 Hyundai Glovis Co. Ltd. 984 164 KCC Corp. 2,823 595 LG International Corp. 224,063 6,336 LS Corp. 38,859 2,363 Samsung C&T Corp. 19,324 2,137 SK Networks Co. Ltd. 460,986 2,302 .............................................. 47,364 ______________________
INFORMATION TECHNOLOGY 3.2%
LG Display Co. Ltd. 747,184 15,137 Samsung Electronics Co. Ltd. 543,152 39,294 SK Hynix, Inc. 23,182 2,737 .............................................. 57,168 ______________________
MATERIALS 2.2%
Dongkuk Steel Mill Co. Ltd. 152,067 1,841 Hyundai Steel Co. 145,941 6,227 Kolon Industries, Inc. 34,933 1,856
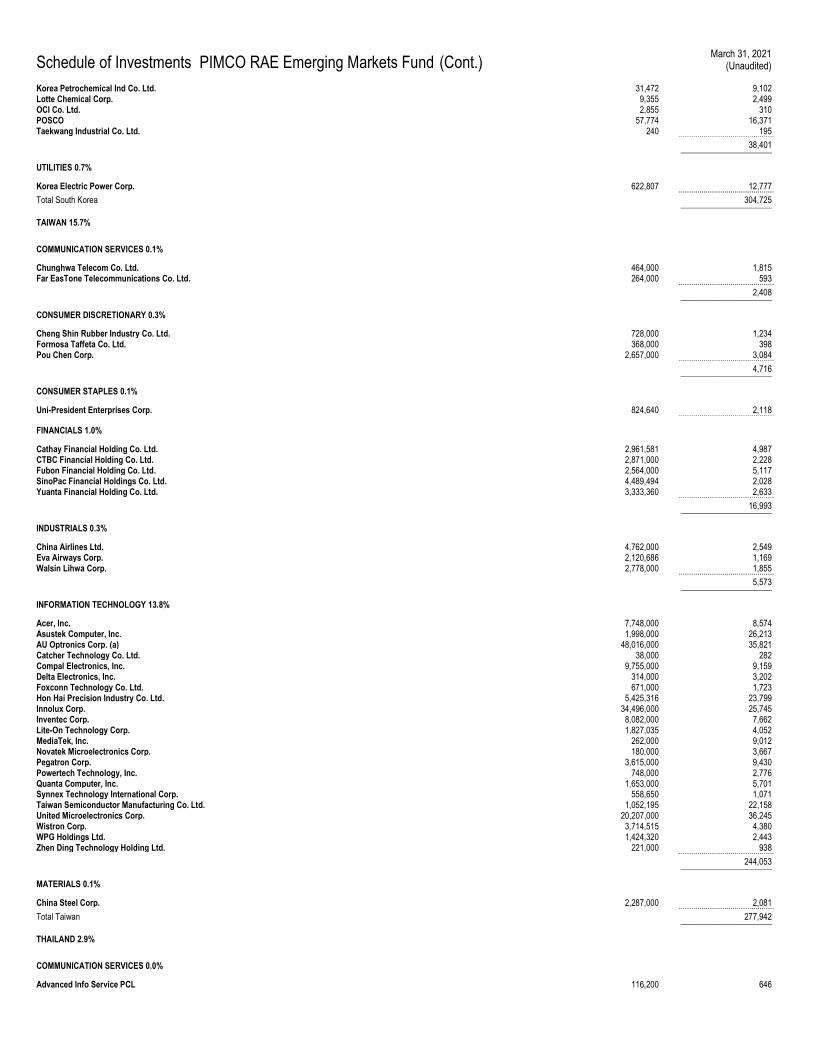
Schedule of Investments PIMCO RAE Emerging Markets Fund (Cont.) March 31, 2021
(Unaudited)
Korea Petrochemical Ind Co. Ltd. 31,472 9,102 Lotte Chemical Corp. 9,355 2,499 OCI Co. Ltd. 2,855 310 POSCO 57,774 16,371 Taekwang Industrial Co. Ltd. 240 195 .............................................. 38,401 ______________________
UTILITIES 0.7%
Korea Electric Power Corp. 622,807 12,777 .............................................. Total South Korea 304,725 ______________________
TAIWAN 15.7%
COMMUNICATION SERVICES 0.1%
Chunghwa Telecom Co. Ltd. 464,000 1,815 Far EasTone Telecommunications Co. Ltd. 264,000 593 .............................................. 2,408 ______________________
CONSUMER DISCRETIONARY 0.3%
Cheng Shin Rubber Industry Co. Ltd. 728,000 1,234 Formosa Taffeta Co. Ltd. 368,000 398 Pou Chen Corp. 2,657,000 3,084 .............................................. 4,716 ______________________
CONSUMER STAPLES 0.1%
Uni-President Enterprises Corp. 824,640 2,118 ..............................................
FINANCIALS 1.0%
Cathay Financial Holding Co. Ltd. 2,961,581 4,987 CTBC Financial Holding Co. Ltd. 2,871,000 2,228 Fubon Financial Holding Co. Ltd. 2,564,000 5,117 SinoPac Financial Holdings Co. Ltd. 4,489,494 2,028 Yuanta Financial Holding Co. Ltd. 3,333,360 2,633 .............................................. 16,993 ______________________
INDUSTRIALS 0.3%
China Airlines Ltd. 4,762,000 2,549 Eva Airways Corp. 2,120,686 1,169 Walsin Lihwa Corp. 2,778,000 1,855 .............................................. 5,573 ______________________
INFORMATION TECHNOLOGY 13.8%
Acer, Inc. 7,748,000 8,574 Asustek Computer, Inc. 1,998,000 26,213 AU Optronics Corp. (a) 48,016,000 35,821 Catcher Technology Co. Ltd. 38,000 282 Compal Electronics, Inc. 9,755,000 9,159 Delta Electronics, Inc. 314,000 3,202 Foxconn Technology Co. Ltd. 671,000 1,723 Hon Hai Precision Industry Co. Ltd. 5,425,316 23,799 Innolux Corp. 34,496,000 25,745 Inventec Corp. 8,082,000 7,662 Lite-On Technology Corp. 1,827,035 4,052 MediaTek, Inc. 262,000 9,012 Novatek Microelectronics Corp. 180,000 3,667 Pegatron Corp. 3,615,000 9,430 Powertech Technology, Inc. 748,000 2,776 Quanta Computer, Inc. 1,653,000 5,701 Synnex Technology International Corp. 558,650 1,071 Taiwan Semiconductor Manufacturing Co. Ltd. 1,052,195 22,158 United Microelectronics Corp. 20,207,000 36,245 Wistron Corp. 3,714,515 4,380 WPG Holdings Ltd. 1,424,320 2,443 Zhen Ding Technology Holding Ltd. 221,000 938 .............................................. 244,053 ______________________
MATERIALS 0.1%
China Steel Corp. 2,287,000 2,081 .............................................. Total Taiwan 277,942 ______________________
THAILAND 2.9%
COMMUNICATION SERVICES 0.0%
Advanced Info Service PCL 116,200 646
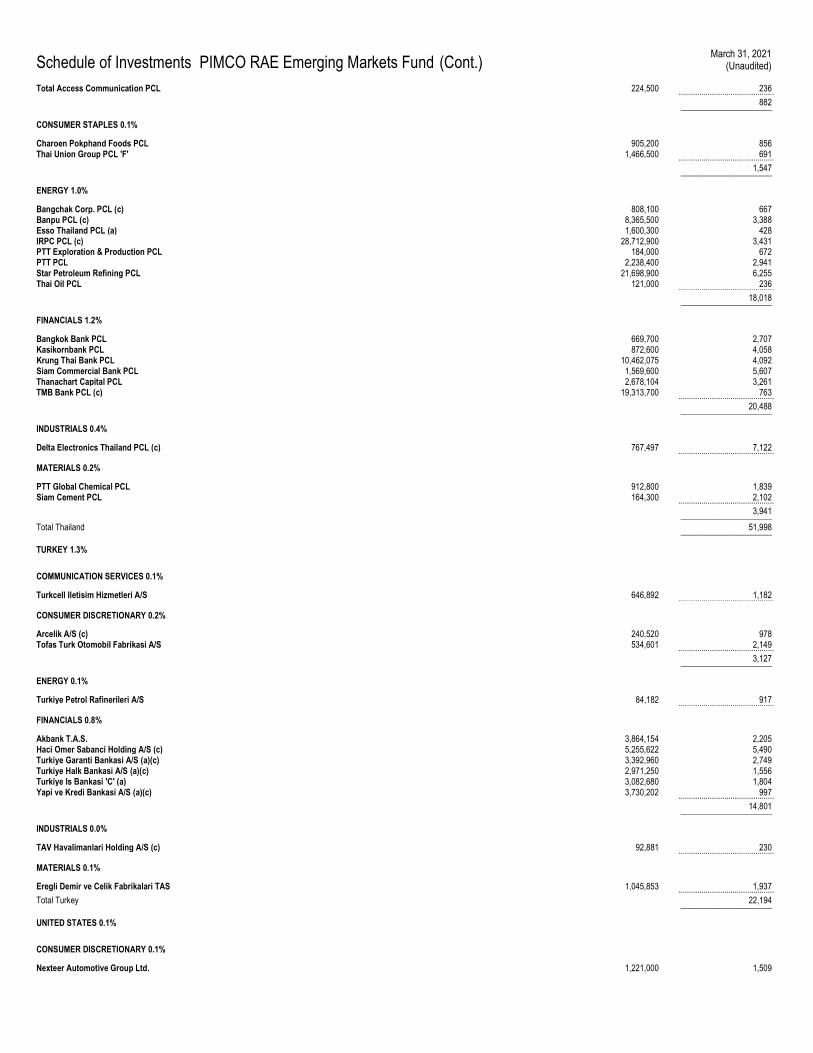
Schedule of Investments PIMCO RAE Emerging Markets Fund (Cont.) March 31, 2021
(Unaudited)
Total Access Communication PCL 224,500 236 .............................................. 882 ______________________
CONSUMER STAPLES 0.1%
Charoen Pokphand Foods PCL 905,200 856 Thai Union Group PCL 'F' 1,466,500 691 .............................................. 1,547 ______________________
ENERGY 1.0%
Bangchak Corp. PCL (c) 808,100 667 Banpu PCL (c) 8,365,500 3,388 Esso Thailand PCL (a) 1,600,300 428 IRPC PCL (c) 28,712,900 3,431 PTT Exploration & Production PCL 184,000 672 PTT PCL 2,238,400 2,941 Star Petroleum Refining PCL 21,698,900 6,255 Thai Oil PCL 121,000 236 .............................................. 18,018 ______________________
FINANCIALS 1.2%
Bangkok Bank PCL 669,700 2,707 Kasikornbank PCL 872,600 4,058 Krung Thai Bank PCL 10,462,075 4,092 Siam Commercial Bank PCL 1,569,600 5,607 Thanachart Capital PCL 2,678,104 3,261 TMB Bank PCL (c) 19,313,700 763 .............................................. 20,488 ______________________
INDUSTRIALS 0.4%
Delta Electronics Thailand PCL (c) 767,497 7,122 ..............................................
MATERIALS 0.2%
PTT Global Chemical PCL 912,800 1,839 Siam Cement PCL 164,300 2,102 .............................................. 3,941 ______________________
Total Thailand 51,998 ______________________
TURKEY 1.3%
COMMUNICATION SERVICES 0.1%
Turkcell Iletisim Hizmetleri A/S 646,892 1,182 ..............................................
CONSUMER DISCRETIONARY 0.2%
Arcelik A/S (c) 240,520 978 Tofas Turk Otomobil Fabrikasi A/S 534,601 2,149 .............................................. 3,127 ______________________
ENERGY 0.1%
Turkiye Petrol Rafinerileri A/S 84,182 917 ..............................................
FINANCIALS 0.8%
Akbank T.A.S. 3,864,154 2,205 Haci Omer Sabanci Holding A/S (c) 5,255,622 5,490 Turkiye Garanti Bankasi A/S (a)(c) 3,392,960 2,749 Turkiye Halk Bankasi A/S (a)(c) 2,971,250 1,556 Turkiye Is Bankasi 'C' (a) 3,082,680 1,804 Yapi ve Kredi Bankasi A/S (a)(c) 3,730,202 997 .............................................. 14,801 ______________________
INDUSTRIALS 0.0%
TAV Havalimanlari Holding A/S (c) 92,881 230 ..............................................
MATERIALS 0.1%
Eregli Demir ve Celik Fabrikalari TAS 1,045,853 1,937 .............................................. Total Turkey 22,194 ______________________
UNITED STATES 0.1%
CONSUMER DISCRETIONARY 0.1%
Nexteer Automotive Group Ltd. 1,221,000 1,509
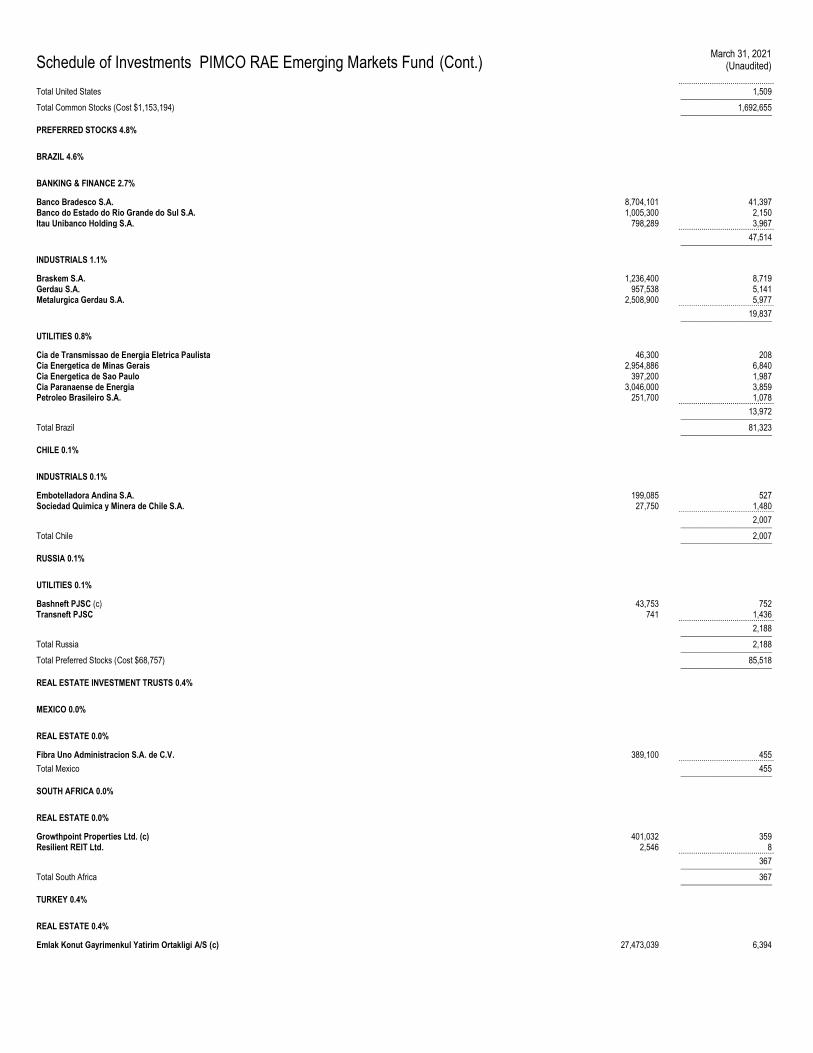
Schedule of Investments PIMCO RAE Emerging Markets Fund (Cont.) March 31, 2021
(Unaudited)
.............................................. Total United States 1,509 ______________________
Total Common Stocks (Cost $1,153,194) 1,692,655 ______________________
PREFERRED STOCKS 4.8%
BRAZIL 4.6%
BANKING & FINANCE 2.7%
Banco Bradesco S.A. 8,704,101 41,397 Banco do Estado do Rio Grande do Sul S.A. 1,005,300 2,150 Itau Unibanco Holding S.A. 798,289 3,967 .............................................. 47,514 ______________________
INDUSTRIALS 1.1%
Braskem S.A. 1,236,400 8,719 Gerdau S.A. 957,538 5,141 Metalurgica Gerdau S.A. 2,508,900 5,977 .............................................. 19,837 ______________________
UTILITIES 0.8%
Cia de Transmissao de Energia Eletrica Paulista 46,300 208 Cia Energetica de Minas Gerais 2,954,886 6,840 Cia Energetica de Sao Paulo 397,200 1,987 Cia Paranaense de Energia 3,046,000 3,859 Petroleo Brasileiro S.A. 251,700 1,078 .............................................. 13,972 ______________________
Total Brazil 81,323 ______________________
CHILE 0.1%
INDUSTRIALS 0.1%
Embotelladora Andina S.A. 199,085 527 Sociedad Quimica y Minera de Chile S.A. 27,750 1,480 .............................................. 2,007 ______________________
Total Chile 2,007 ______________________
RUSSIA 0.1%
UTILITIES 0.1%
Bashneft PJSC (c) 43,753 752 Transneft PJSC 741 1,436 .............................................. 2,188 ______________________
Total Russia 2,188 ______________________
Total Preferred Stocks (Cost $68,757) 85,518 ______________________
REAL ESTATE INVESTMENT TRUSTS 0.4%
MEXICO 0.0%
REAL ESTATE 0.0%
Fibra Uno Administracion S.A. de C.V. 389,100 455 .............................................. Total Mexico 455 ______________________
SOUTH AFRICA 0.0%
REAL ESTATE 0.0%
Growthpoint Properties Ltd. (c) 401,032 359 Resilient REIT Ltd. 2,546 8 .............................................. 367 ______________________
Total South Africa 367 ______________________
TURKEY 0.4%
REAL ESTATE 0.4%
Emlak Konut Gayrimenkul Yatirim Ortakligi A/S (c) 27,473,039 6,394
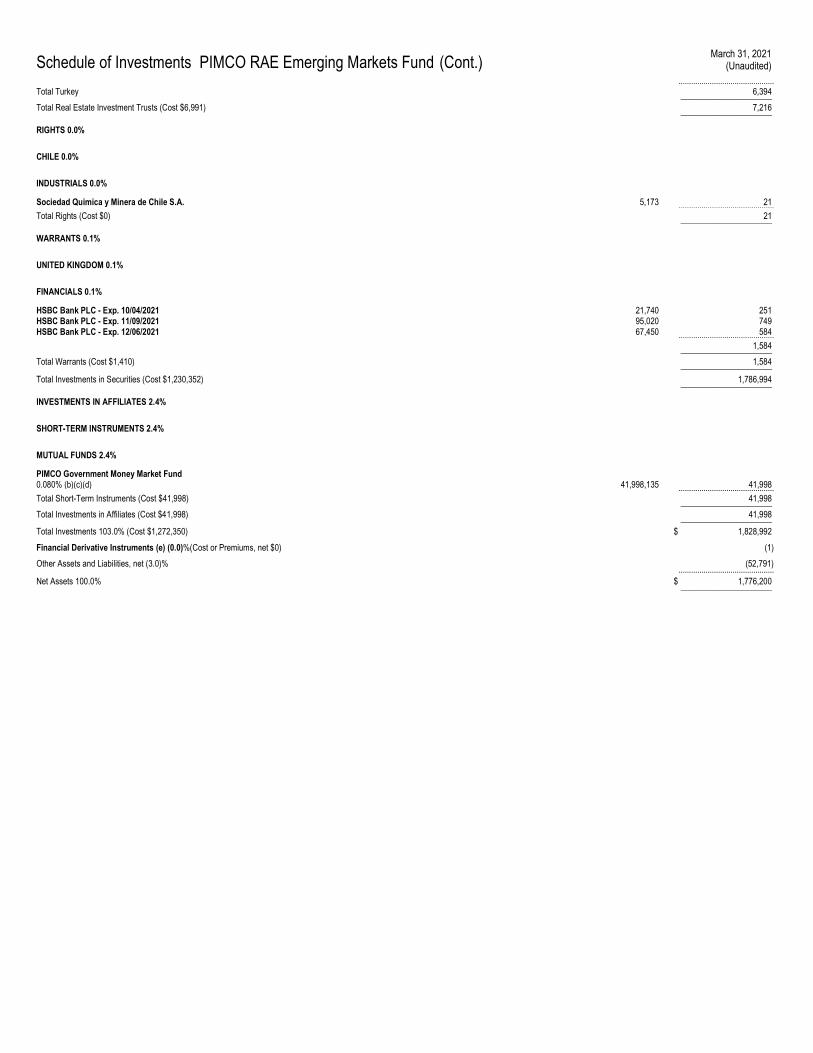
Schedule of Investments PIMCO RAE Emerging Markets Fund (Cont.) March 31, 2021
(Unaudited)
.............................................. Total Turkey 6,394 ______________________
Total Real Estate Investment Trusts (Cost $6,991) 7,216 ______________________
RIGHTS 0.0%
CHILE 0.0%
INDUSTRIALS 0.0%
Sociedad Quimica y Minera de Chile S.A. 5,173 21 .............................................. Total Rights (Cost $0) 21 ______________________
WARRANTS 0.1%
UNITED KINGDOM 0.1%
FINANCIALS 0.1%
HSBC Bank PLC - Exp. 10/04/2021 21,740 251 HSBC Bank PLC - Exp. 11/09/2021 95,020 749 HSBC Bank PLC - Exp. 12/06/2021 67,450 584 .............................................. 1,584 ______________________
Total Warrants (Cost $1,410) 1,584 ______________________ Total Investments in Securities (Cost $1,230,352) 1,786,994 ______________________
INVESTMENTS IN AFFILIATES 2.4%
SHORT-TERM INSTRUMENTS 2.4%
MUTUAL FUNDS 2.4%
PIMCO Government Money Market Fund 0.080% (b)(c)(d) 41,998,135 41,998 .............................................. Total Short-Term Instruments (Cost $41,998) 41,998 ______________________
Total Investments in Affiliates (Cost $41,998) 41,998 ______________________
Total Investments 103.0% (Cost $1,272,350) $ 1,828,992
Financial Derivative Instruments (e) (0.0)%(Cost or Premiums, net $0) (1)
Other Assets and Liabilities, net (3.0)% (52,791) ..............................................
Net Assets 100.0% $ 1,776,200 ______________________
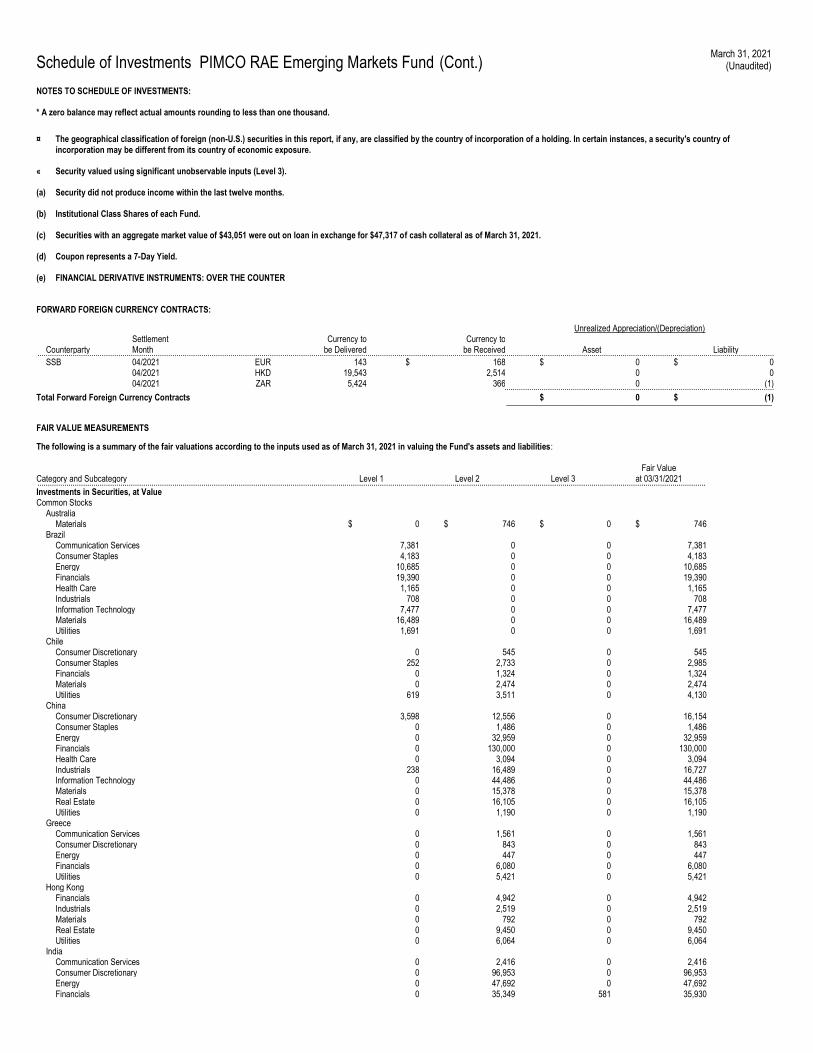
Schedule of Investments PIMCO RAE Emerging Markets Fund (Cont.) March 31, 2021
(Unaudited)
NOTES TO SCHEDULE OF INVESTMENTS: * A zero balance may reflect actual amounts rounding to less than one thousand.
¤ The geographical classification of foreign (non-U.S.) securities in this report, if any, are classified by the country of incorporation of a holding. In certain instances, a security's country of incorporation may be different from its country of economic exposure.
« Security valued using significant unobservable inputs (Level 3).
(a) Security did not produce income within the last twelve months.
(b) Institutional Class Shares of each Fund.
(c) Securities with an aggregate market value of $43,051 were out on loan in exchange for $47,317 of cash collateral as of March 31, 2021.
(d) Coupon represents a 7-Day Yield.
(e) FINANCIAL DERIVATIVE INSTRUMENTS: OVER THE COUNTER
FORWARD FOREIGN CURRENCY CONTRACTS:
Unrealized Appreciation/(Depreciation)
Counterparty Settlement Month
Currency to be Delivered
Currency to be Received Asset Liability ...................................................................................................................................................................................................................................................................................................................................................................
SSB 04/2021 EUR 143 $ 168 $ 0 $ 0 04/2021 HKD 19,543 2,514 0 0 04/2021 ZAR 5,424 366 0 (1) ..................................................................................................................................
Total Forward Foreign Currency Contracts $ 0 $ (1) ________________________________________________________________
FAIR VALUE MEASUREMENTS
The following is a summary of the fair valuations according to the inputs used as of March 31, 2021 in valuing the Fund's assets and liabilities:
Category and Subcategory Level 1 Level 2 Level 3 Fair Value
at 03/31/2021 .................................................................................................................................................................................................................................................................................................................................. Investments in Securities, at Value Common Stocks Australia Materials $ 0 $ 746 $ 0 $ 746 Brazil Communication Services 7,381 0 0 7,381 Consumer Staples 4,183 0 0 4,183 Energy 10,685 0 0 10,685 Financials 19,390 0 0 19,390 Health Care 1,165 0 0 1,165 Industrials 708 0 0 708 Information Technology 7,477 0 0 7,477 Materials 16,489 0 0 16,489 Utilities 1,691 0 0 1,691 Chile Consumer Discretionary 0 545 0 545 Consumer Staples 252 2,733 0 2,985 Financials 0 1,324 0 1,324 Materials 0 2,474 0 2,474 Utilities 619 3,511 0 4,130 China Consumer Discretionary 3,598 12,556 0 16,154 Consumer Staples 0 1,486 0 1,486 Energy 0 32,959 0 32,959 Financials 0 130,000 0 130,000 Health Care 0 3,094 0 3,094 Industrials 238 16,489 0 16,727 Information Technology 0 44,486 0 44,486 Materials 0 15,378 0 15,378 Real Estate 0 16,105 0 16,105 Utilities 0 1,190 0 1,190 Greece Communication Services 0 1,561 0 1,561 Consumer Discretionary 0 843 0 843 Energy 0 447 0 447 Financials 0 6,080 0 6,080 Utilities 0 5,421 0 5,421 Hong Kong Financials 0 4,942 0 4,942 Industrials 0 2,519 0 2,519 Materials 0 792 0 792 Real Estate 0 9,450 0 9,450 Utilities 0 6,064 0 6,064 India Communication Services 0 2,416 0 2,416 Consumer Discretionary 0 96,953 0 96,953 Energy 0 47,692 0 47,692 Financials 0 35,349 581 35,930
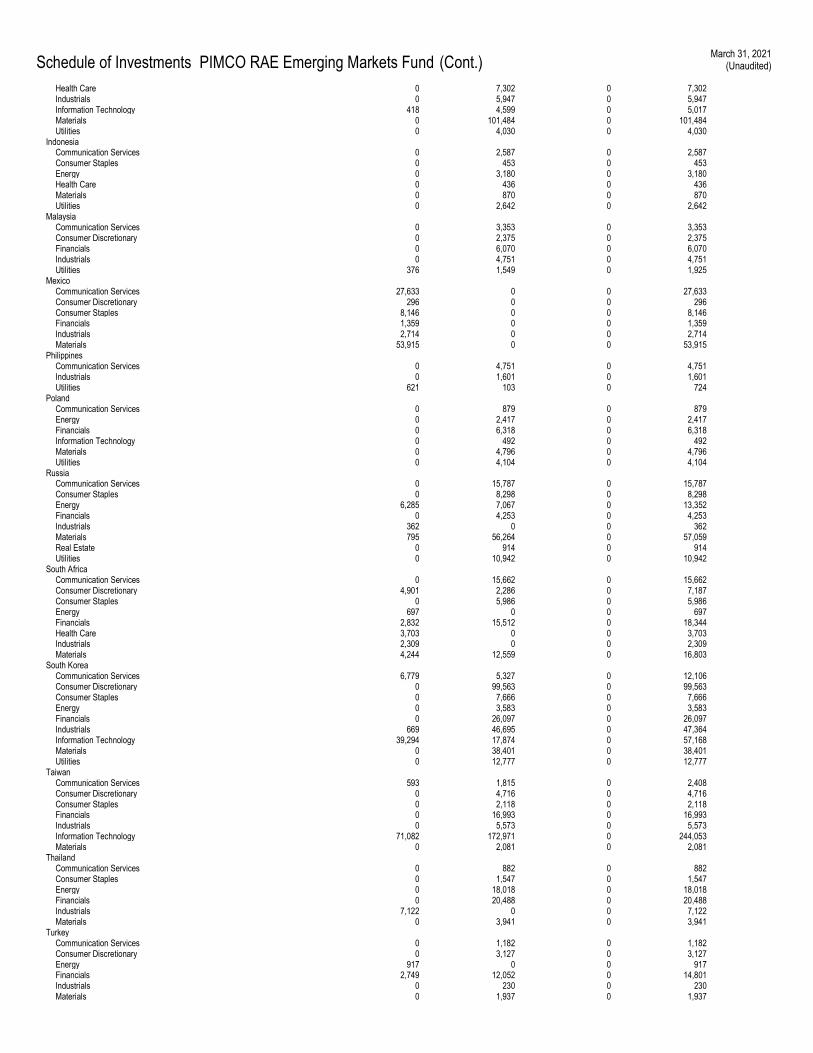
Schedule of Investments PIMCO RAE Emerging Markets Fund (Cont.) March 31, 2021
(Unaudited)
Health Care 0 7,302 0 7,302 Industrials 0 5,947 0 5,947 Information Technology 418 4,599 0 5,017 Materials 0 101,484 0 101,484 Utilities 0 4,030 0 4,030 Indonesia Communication Services 0 2,587 0 2,587 Consumer Staples 0 453 0 453 Energy 0 3,180 0 3,180 Health Care 0 436 0 436 Materials 0 870 0 870 Utilities 0 2,642 0 2,642 Malaysia Communication Services 0 3,353 0 3,353 Consumer Discretionary 0 2,375 0 2,375 Financials 0 6,070 0 6,070 Industrials 0 4,751 0 4,751 Utilities 376 1,549 0 1,925 Mexico Communication Services 27,633 0 0 27,633 Consumer Discretionary 296 0 0 296 Consumer Staples 8,146 0 0 8,146 Financials 1,359 0 0 1,359 Industrials 2,714 0 0 2,714 Materials 53,915 0 0 53,915 Philippines Communication Services 0 4,751 0 4,751 Industrials 0 1,601 0 1,601 Utilities 621 103 0 724 Poland Communication Services 0 879 0 879 Energy 0 2,417 0 2,417 Financials 0 6,318 0 6,318 Information Technology 0 492 0 492 Materials 0 4,796 0 4,796 Utilities 0 4,104 0 4,104 Russia Communication Services 0 15,787 0 15,787 Consumer Staples 0 8,298 0 8,298 Energy 6,285 7,067 0 13,352 Financials 0 4,253 0 4,253 Industrials 362 0 0 362 Materials 795 56,264 0 57,059 Real Estate 0 914 0 914 Utilities 0 10,942 0 10,942 South Africa Communication Services 0 15,662 0 15,662 Consumer Discretionary 4,901 2,286 0 7,187 Consumer Staples 0 5,986 0 5,986 Energy 697 0 0 697 Financials 2,832 15,512 0 18,344 Health Care 3,703 0 0 3,703 Industrials 2,309 0 0 2,309 Materials 4,244 12,559 0 16,803 South Korea Communication Services 6,779 5,327 0 12,106 Consumer Discretionary 0 99,563 0 99,563 Consumer Staples 0 7,666 0 7,666 Energy 0 3,583 0 3,583 Financials 0 26,097 0 26,097 Industrials 669 46,695 0 47,364 Information Technology 39,294 17,874 0 57,168 Materials 0 38,401 0 38,401 Utilities 0 12,777 0 12,777 Taiwan Communication Services 593 1,815 0 2,408 Consumer Discretionary 0 4,716 0 4,716 Consumer Staples 0 2,118 0 2,118 Financials 0 16,993 0 16,993 Industrials 0 5,573 0 5,573 Information Technology 71,082 172,971 0 244,053 Materials 0 2,081 0 2,081 Thailand Communication Services 0 882 0 882 Consumer Staples 0 1,547 0 1,547 Energy 0 18,018 0 18,018 Financials 0 20,488 0 20,488 Industrials 7,122 0 0 7,122 Materials 0 3,941 0 3,941 Turkey Communication Services 0 1,182 0 1,182 Consumer Discretionary 0 3,127 0 3,127 Energy 917 0 0 917 Financials 2,749 12,052 0 14,801 Industrials 0 230 0 230 Materials 0 1,937 0 1,937
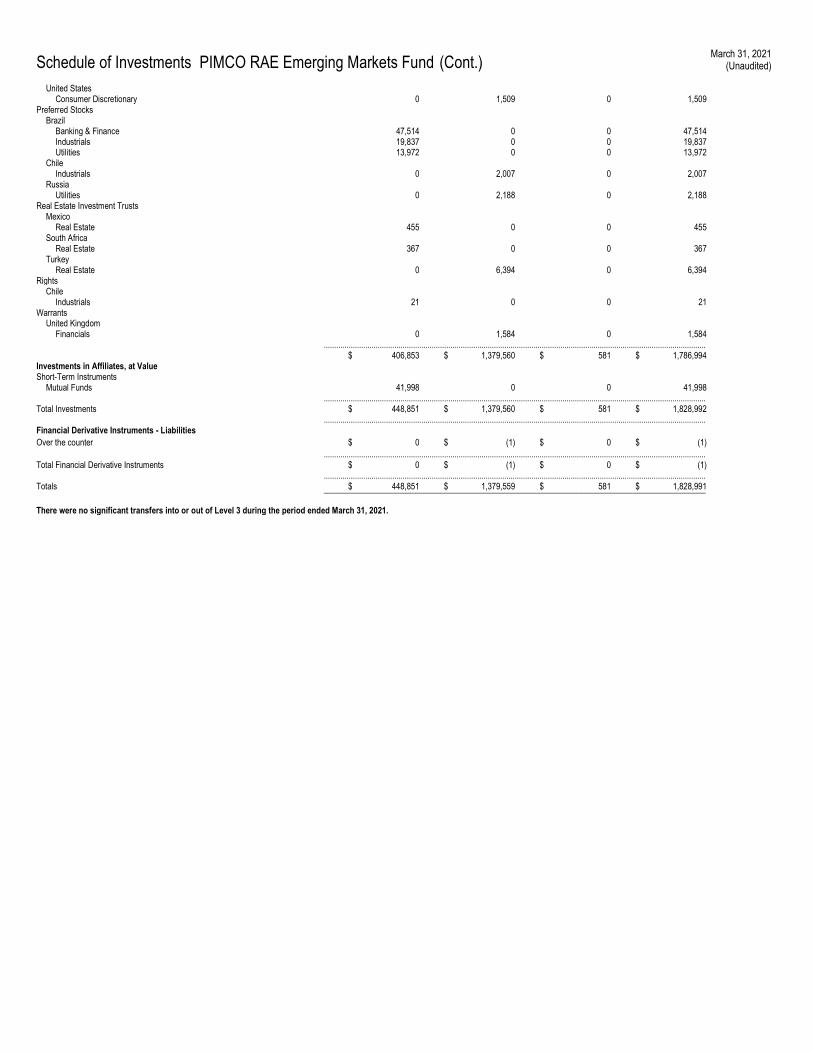
Schedule of Investments PIMCO RAE Emerging Markets Fund (Cont.) March 31, 2021
(Unaudited)
United States Consumer Discretionary 0 1,509 0 1,509 Preferred Stocks Brazil Banking & Finance 47,514 0 0 47,514 Industrials 19,837 0 0 19,837 Utilities 13,972 0 0 13,972 Chile Industrials 0 2,007 0 2,007 Russia Utilities 0 2,188 0 2,188 Real Estate Investment Trusts Mexico Real Estate 455 0 0 455 South Africa Real Estate 367 0 0 367 Turkey Real Estate 0 6,394 0 6,394 Rights Chile Industrials 21 0 0 21 Warrants United Kingdom Financials 0 1,584 0 1,584 ........................................................................................................................................................................................ $ 406,853 $ 1,379,560 $ 581 $ 1,786,994 Investments in Affiliates, at Value Short-Term Instruments Mutual Funds 41,998 0 0 41,998 ........................................................................................................................................................................................ Total Investments $ 448,851 $ 1,379,560 $ 581 $ 1,828,992 ........................................................................................................................................................................................ Financial Derivative Instruments - Liabilities
Over the counter $ 0 $ (1) $ 0 $ (1)
........................................................................................................................................................................................ Total Financial Derivative Instruments $ 0 $ (1) $ 0 $ (1) ........................................................................................................................................................................................ Totals $ 448,851 $ 1,379,559 $ 581 $ 1,828,991 ____________________________________________________________________________________________ There were no significant transfers into or out of Level 3 during the period ended March 31, 2021.
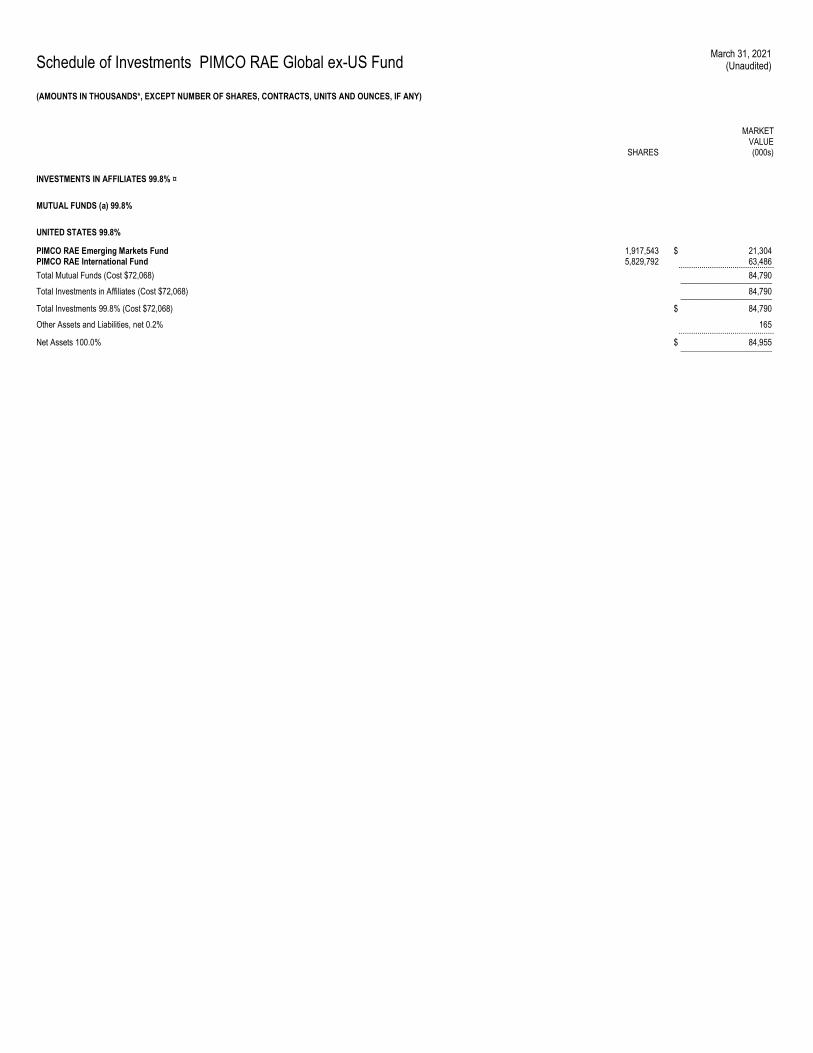
Schedule of Investments PIMCO RAE Global ex-US Fund March 31, 2021
(Unaudited)
(AMOUNTS IN THOUSANDS*, EXCEPT NUMBER OF SHARES, CONTRACTS, UNITS AND OUNCES, IF ANY)
SHARES
MARKET VALUE (000s)
INVESTMENTS IN AFFILIATES 99.8% ¤
MUTUAL FUNDS (a) 99.8%
UNITED STATES 99.8%
PIMCO RAE Emerging Markets Fund 1,917,543 $ 21,304 PIMCO RAE International Fund 5,829,792 63,486 .............................................. Total Mutual Funds (Cost $72,068) 84,790 ______________________
Total Investments in Affiliates (Cost $72,068) 84,790 ______________________
Total Investments 99.8% (Cost $72,068) $ 84,790
Other Assets and Liabilities, net 0.2% 165 ..............................................
Net Assets 100.0% $ 84,955 ______________________
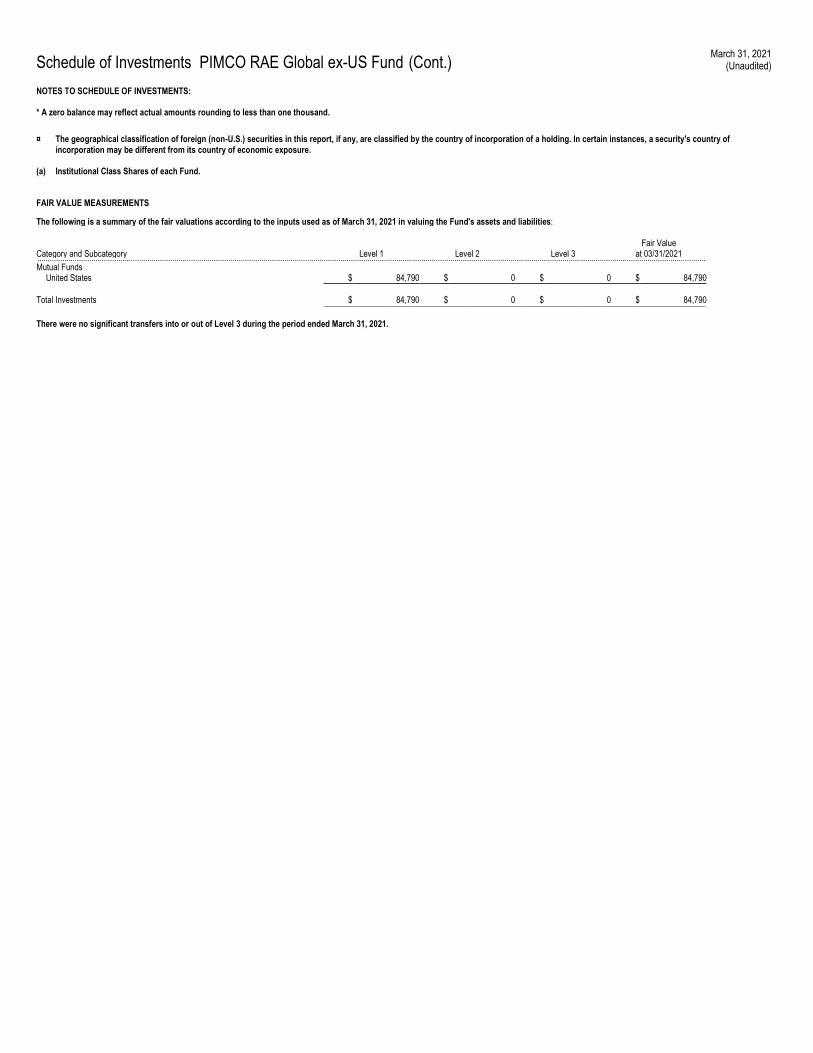
Schedule of Investments PIMCO RAE Global ex-US Fund (Cont.) March 31, 2021
(Unaudited)
NOTES TO SCHEDULE OF INVESTMENTS: * A zero balance may reflect actual amounts rounding to less than one thousand.
¤ The geographical classification of foreign (non-U.S.) securities in this report, if any, are classified by the country of incorporation of a holding. In certain instances, a security's country of incorporation may be different from its country of economic exposure.
(a) Institutional Class Shares of each Fund.
FAIR VALUE MEASUREMENTS
The following is a summary of the fair valuations according to the inputs used as of March 31, 2021 in valuing the Fund's assets and liabilities:
Category and Subcategory Level 1 Level 2 Level 3 Fair Value
at 03/31/2021 .................................................................................................................................................................................................................................................................................................................................. Mutual Funds United States $ 84,790 $ 0 $ 0 $ 84,790
Total Investments $ 84,790 $ 0 $ 0 $ 84,790 ____________________________________________________________________________________________ There were no significant transfers into or out of Level 3 during the period ended March 31, 2021.
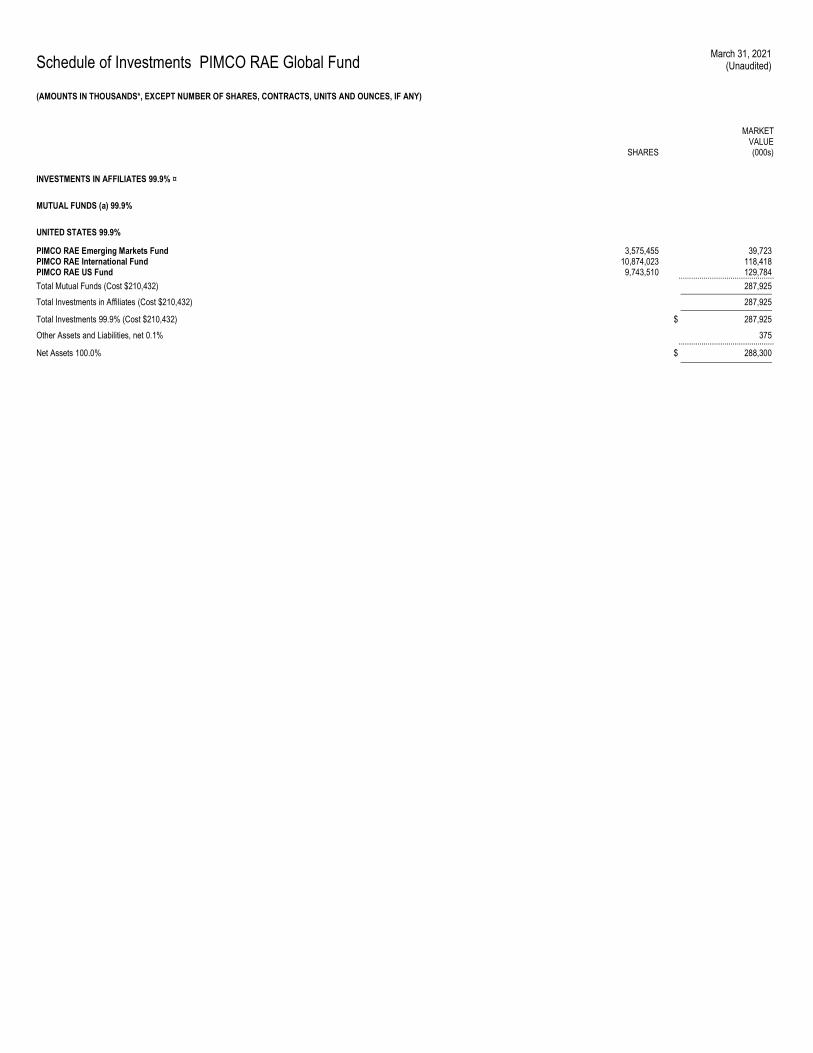
Schedule of Investments PIMCO RAE Global Fund March 31, 2021
(Unaudited)
(AMOUNTS IN THOUSANDS*, EXCEPT NUMBER OF SHARES, CONTRACTS, UNITS AND OUNCES, IF ANY)
SHARES
MARKET VALUE (000s)
INVESTMENTS IN AFFILIATES 99.9% ¤
MUTUAL FUNDS (a) 99.9%
UNITED STATES 99.9%
PIMCO RAE Emerging Markets Fund 3,575,455 39,723 PIMCO RAE International Fund 10,874,023 118,418 PIMCO RAE US Fund 9,743,510 129,784 .............................................. Total Mutual Funds (Cost $210,432) 287,925 ______________________
Total Investments in Affiliates (Cost $210,432) 287,925 ______________________
Total Investments 99.9% (Cost $210,432) $ 287,925
Other Assets and Liabilities, net 0.1% 375 ..............................................
Net Assets 100.0% $ 288,300 ______________________

Schedule of Investments PIMCO RAE Global Fund (Cont.) March 31, 2021
(Unaudited)
NOTES TO SCHEDULE OF INVESTMENTS: * A zero balance may reflect actual amounts rounding to less than one thousand.
¤ The geographical classification of foreign (non-U.S.) securities in this report, if any, are classified by the country of incorporation of a holding. In certain instances, a security's country of incorporation may be different from its country of economic exposure.
(a) Institutional Class Shares of each Fund.
FAIR VALUE MEASUREMENTS
The following is a summary of the fair valuations according to the inputs used as of March 31, 2021 in valuing the Fund's assets and liabilities:
Category and Subcategory Level 1 Level 2 Level 3 Fair Value
at 03/31/2021 .................................................................................................................................................................................................................................................................................................................................. Mutual Funds United States $ 287,925 $ 0 $ 0 $ 287,925
Total Investments $ 287,925 $ 0 $ 0 $ 287,925 ____________________________________________________________________________________________ There were no significant transfers into or out of Level 3 during the period ended March 31, 2021.
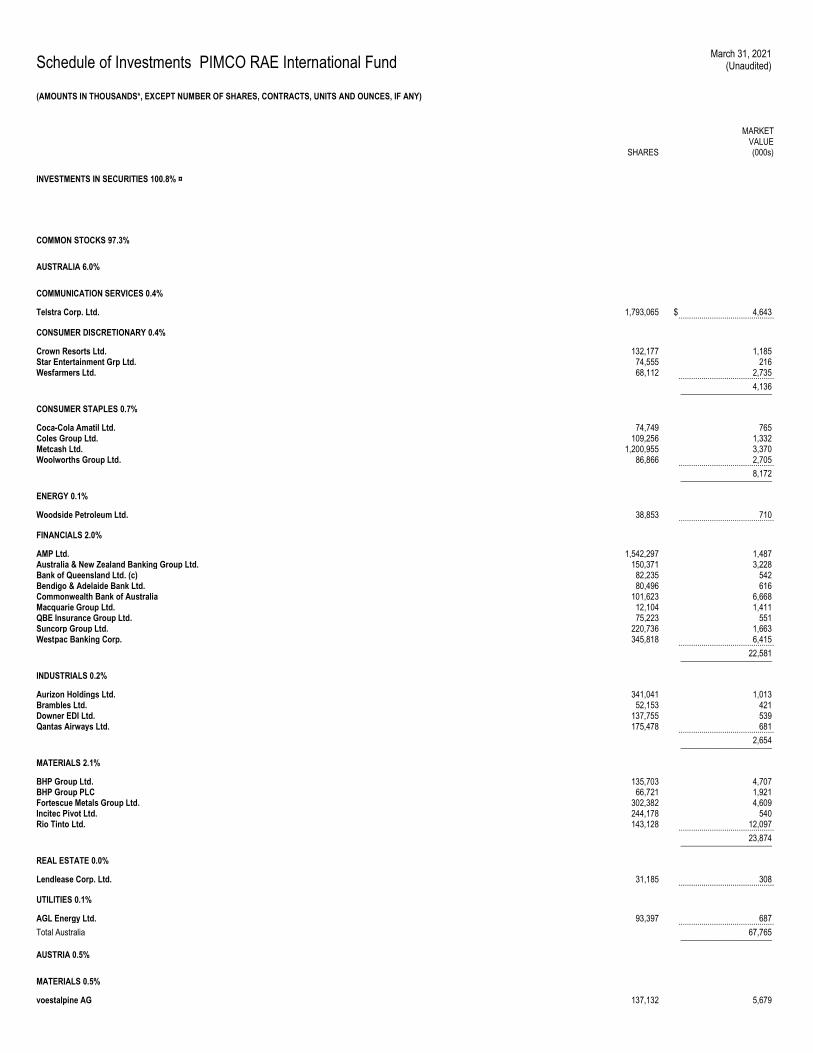
Schedule of Investments PIMCO RAE International Fund March 31, 2021
(Unaudited)
(AMOUNTS IN THOUSANDS*, EXCEPT NUMBER OF SHARES, CONTRACTS, UNITS AND OUNCES, IF ANY)
SHARES
MARKET VALUE (000s)
INVESTMENTS IN SECURITIES 100.8% ¤
COMMON STOCKS 97.3%
AUSTRALIA 6.0%
COMMUNICATION SERVICES 0.4%
Telstra Corp. Ltd. 1,793,065 $ 4,643 ..............................................
CONSUMER DISCRETIONARY 0.4%
Crown Resorts Ltd. 132,177 1,185 Star Entertainment Grp Ltd. 74,555 216 Wesfarmers Ltd. 68,112 2,735 .............................................. 4,136 ______________________
CONSUMER STAPLES 0.7%
Coca-Cola Amatil Ltd. 74,749 765 Coles Group Ltd. 109,256 1,332 Metcash Ltd. 1,200,955 3,370 Woolworths Group Ltd. 86,866 2,705 .............................................. 8,172 ______________________
ENERGY 0.1%
Woodside Petroleum Ltd. 38,853 710 ..............................................
FINANCIALS 2.0%
AMP Ltd. 1,542,297 1,487 Australia & New Zealand Banking Group Ltd. 150,371 3,228 Bank of Queensland Ltd. (c) 82,235 542 Bendigo & Adelaide Bank Ltd. 80,496 616 Commonwealth Bank of Australia 101,623 6,668 Macquarie Group Ltd. 12,104 1,411 QBE Insurance Group Ltd. 75,223 551 Suncorp Group Ltd. 220,736 1,663 Westpac Banking Corp. 345,818 6,415 .............................................. 22,581 ______________________
INDUSTRIALS 0.2%
Aurizon Holdings Ltd. 341,041 1,013 Brambles Ltd. 52,153 421 Downer EDI Ltd. 137,755 539 Qantas Airways Ltd. 175,478 681 .............................................. 2,654 ______________________
MATERIALS 2.1%
BHP Group Ltd. 135,703 4,707 BHP Group PLC 66,721 1,921 Fortescue Metals Group Ltd. 302,382 4,609 Incitec Pivot Ltd. 244,178 540 Rio Tinto Ltd. 143,128 12,097 .............................................. 23,874 ______________________
REAL ESTATE 0.0%
Lendlease Corp. Ltd. 31,185 308 ..............................................
UTILITIES 0.1%
AGL Energy Ltd. 93,397 687 .............................................. Total Australia 67,765 ______________________
AUSTRIA 0.5%
MATERIALS 0.5%
voestalpine AG 137,132 5,679
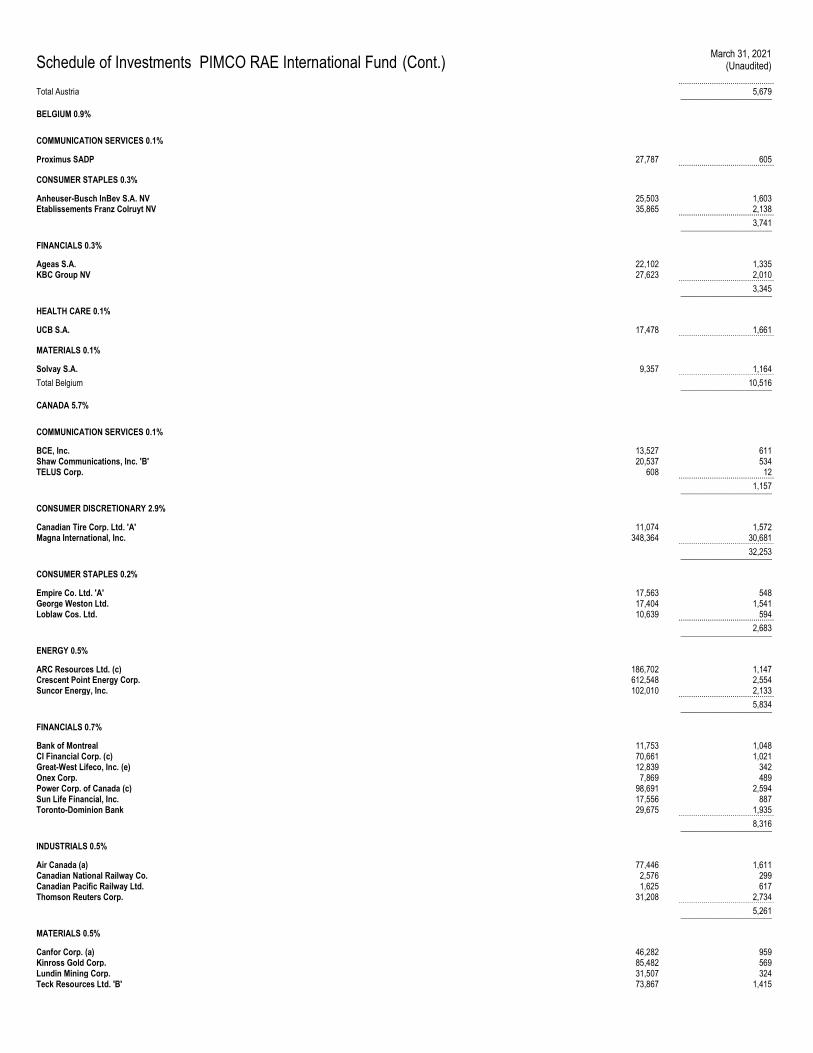
Schedule of Investments PIMCO RAE International Fund (Cont.) March 31, 2021
(Unaudited)
.............................................. Total Austria 5,679 ______________________
BELGIUM 0.9%
COMMUNICATION SERVICES 0.1%
Proximus SADP 27,787 605 ..............................................
CONSUMER STAPLES 0.3%
Anheuser-Busch InBev S.A. NV 25,503 1,603 Etablissements Franz Colruyt NV 35,865 2,138 .............................................. 3,741 ______________________
FINANCIALS 0.3%
Ageas S.A. 22,102 1,335 KBC Group NV 27,623 2,010 .............................................. 3,345 ______________________
HEALTH CARE 0.1%
UCB S.A. 17,478 1,661 ..............................................
MATERIALS 0.1%
Solvay S.A. 9,357 1,164 .............................................. Total Belgium 10,516 ______________________
CANADA 5.7%
COMMUNICATION SERVICES 0.1%
BCE, Inc. 13,527 611 Shaw Communications, Inc. 'B' 20,537 534 TELUS Corp. 608 12 .............................................. 1,157 ______________________
CONSUMER DISCRETIONARY 2.9%
Canadian Tire Corp. Ltd. 'A' 11,074 1,572 Magna International, Inc. 348,364 30,681 .............................................. 32,253 ______________________
CONSUMER STAPLES 0.2%
Empire Co. Ltd. 'A' 17,563 548 George Weston Ltd. 17,404 1,541 Loblaw Cos. Ltd. 10,639 594 .............................................. 2,683 ______________________
ENERGY 0.5%
ARC Resources Ltd. (c) 186,702 1,147 Crescent Point Energy Corp. 612,548 2,554 Suncor Energy, Inc. 102,010 2,133 .............................................. 5,834 ______________________
FINANCIALS 0.7%
Bank of Montreal 11,753 1,048 CI Financial Corp. (c) 70,661 1,021 Great-West Lifeco, Inc. (e) 12,839 342 Onex Corp. 7,869 489 Power Corp. of Canada (c) 98,691 2,594 Sun Life Financial, Inc. 17,556 887 Toronto-Dominion Bank 29,675 1,935 .............................................. 8,316 ______________________
INDUSTRIALS 0.5%
Air Canada (a) 77,446 1,611 Canadian National Railway Co. 2,576 299 Canadian Pacific Railway Ltd. 1,625 617 Thomson Reuters Corp. 31,208 2,734 .............................................. 5,261 ______________________
MATERIALS 0.5%
Canfor Corp. (a) 46,282 959 Kinross Gold Corp. 85,482 569 Lundin Mining Corp. 31,507 324 Teck Resources Ltd. 'B' 73,867 1,415
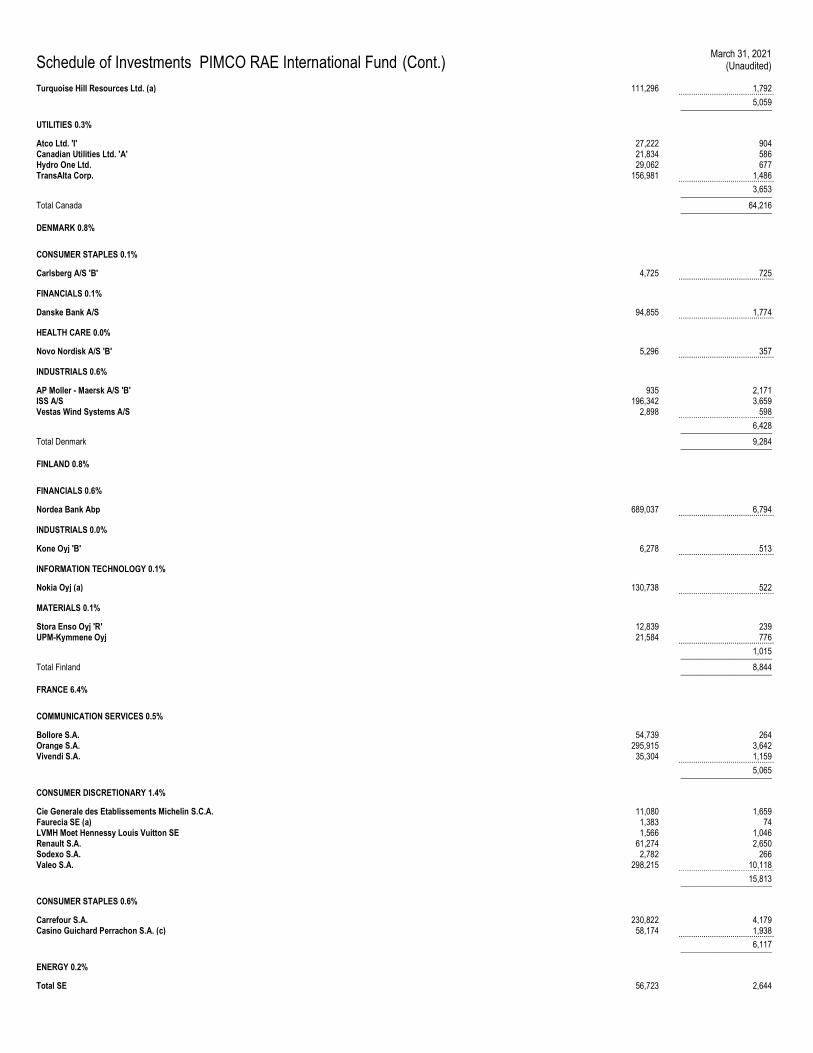
Schedule of Investments PIMCO RAE International Fund (Cont.) March 31, 2021
(Unaudited)
Turquoise Hill Resources Ltd. (a) 111,296 1,792 .............................................. 5,059 ______________________
UTILITIES 0.3%
Atco Ltd. 'I' 27,222 904 Canadian Utilities Ltd. 'A' 21,834 586 Hydro One Ltd. 29,062 677 TransAlta Corp. 156,981 1,486 .............................................. 3,653 ______________________
Total Canada 64,216 ______________________
DENMARK 0.8%
CONSUMER STAPLES 0.1%
Carlsberg A/S 'B' 4,725 725 ..............................................
FINANCIALS 0.1%
Danske Bank A/S 94,855 1,774 ..............................................
HEALTH CARE 0.0%
Novo Nordisk A/S 'B' 5,296 357 ..............................................
INDUSTRIALS 0.6%
AP Moller - Maersk A/S 'B' 935 2,171 ISS A/S 196,342 3,659 Vestas Wind Systems A/S 2,898 598 .............................................. 6,428 ______________________
Total Denmark 9,284 ______________________
FINLAND 0.8%
FINANCIALS 0.6%
Nordea Bank Abp 689,037 6,794 ..............................................
INDUSTRIALS 0.0%
Kone Oyj 'B' 6,278 513 ..............................................
INFORMATION TECHNOLOGY 0.1%
Nokia Oyj (a) 130,738 522 ..............................................
MATERIALS 0.1%
Stora Enso Oyj 'R' 12,839 239 UPM-Kymmene Oyj 21,584 776 .............................................. 1,015 ______________________
Total Finland 8,844 ______________________
FRANCE 6.4%
COMMUNICATION SERVICES 0.5%
Bollore S.A. 54,739 264 Orange S.A. 295,915 3,642 Vivendi S.A. 35,304 1,159 .............................................. 5,065 ______________________
CONSUMER DISCRETIONARY 1.4%
Cie Generale des Etablissements Michelin S.C.A. 11,080 1,659 Faurecia SE (a) 1,383 74 LVMH Moet Hennessy Louis Vuitton SE 1,566 1,046 Renault S.A. 61,274 2,650 Sodexo S.A. 2,782 266 Valeo S.A. 298,215 10,118 .............................................. 15,813 ______________________
CONSUMER STAPLES 0.6%
Carrefour S.A. 230,822 4,179 Casino Guichard Perrachon S.A. (c) 58,174 1,938 .............................................. 6,117 ______________________
ENERGY 0.2%
Total SE 56,723 2,644
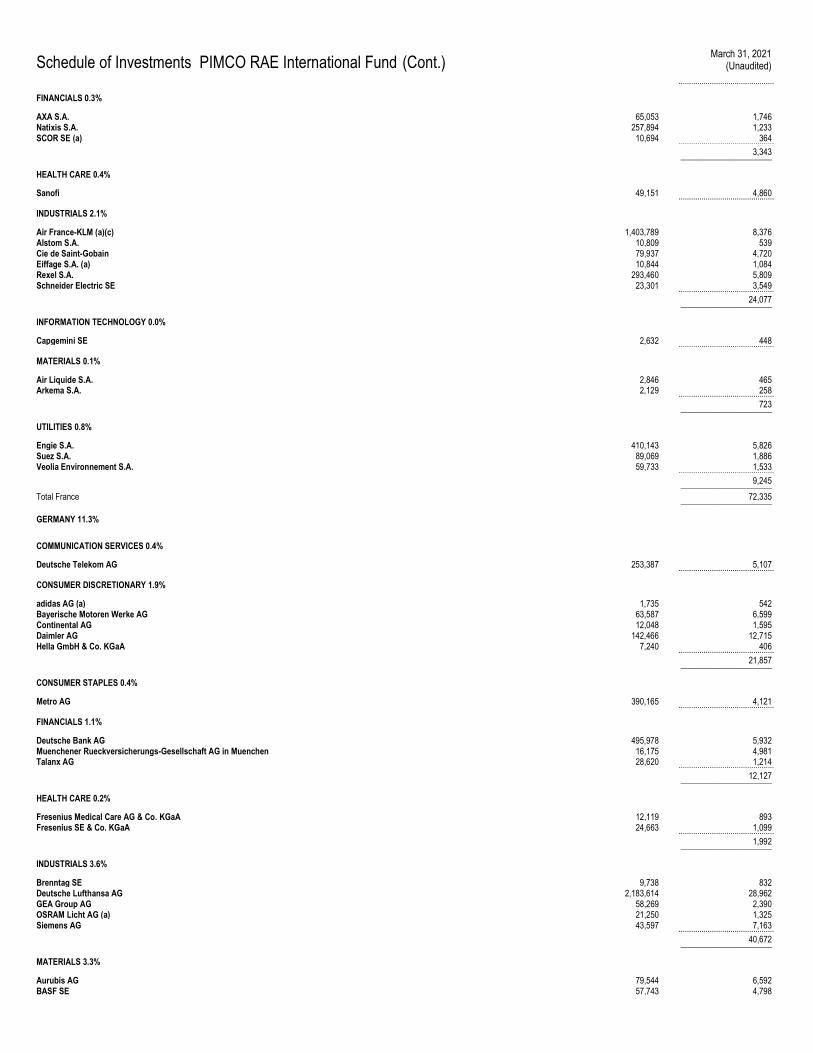
Schedule of Investments PIMCO RAE International Fund (Cont.) March 31, 2021
(Unaudited)
..............................................
FINANCIALS 0.3%
AXA S.A. 65,053 1,746 Natixis S.A. 257,894 1,233 SCOR SE (a) 10,694 364 .............................................. 3,343 ______________________
HEALTH CARE 0.4%
Sanofi 49,151 4,860 ..............................................
INDUSTRIALS 2.1%
Air France-KLM (a)(c) 1,403,789 8,376 Alstom S.A. 10,809 539 Cie de Saint-Gobain 79,937 4,720 Eiffage S.A. (a) 10,844 1,084 Rexel S.A. 293,460 5,809 Schneider Electric SE 23,301 3,549 .............................................. 24,077 ______________________
INFORMATION TECHNOLOGY 0.0%
Capgemini SE 2,632 448 ..............................................
MATERIALS 0.1%
Air Liquide S.A. 2,846 465 Arkema S.A. 2,129 258 .............................................. 723 ______________________
UTILITIES 0.8%
Engie S.A. 410,143 5,826 Suez S.A. 89,069 1,886 Veolia Environnement S.A. 59,733 1,533 .............................................. 9,245 ______________________
Total France 72,335 ______________________
GERMANY 11.3%
COMMUNICATION SERVICES 0.4%
Deutsche Telekom AG 253,387 5,107 ..............................................
CONSUMER DISCRETIONARY 1.9%
adidas AG (a) 1,735 542 Bayerische Motoren Werke AG 63,587 6,599 Continental AG 12,048 1,595 Daimler AG 142,466 12,715 Hella GmbH & Co. KGaA 7,240 406 .............................................. 21,857 ______________________
CONSUMER STAPLES 0.4%
Metro AG 390,165 4,121 ..............................................
FINANCIALS 1.1%
Deutsche Bank AG 495,978 5,932 Muenchener Rueckversicherungs-Gesellschaft AG in Muenchen 16,175 4,981 Talanx AG 28,620 1,214 .............................................. 12,127 ______________________
HEALTH CARE 0.2%
Fresenius Medical Care AG & Co. KGaA 12,119 893 Fresenius SE & Co. KGaA 24,663 1,099 .............................................. 1,992 ______________________
INDUSTRIALS 3.6%
Brenntag SE 9,738 832 Deutsche Lufthansa AG 2,183,614 28,962 GEA Group AG 58,269 2,390 OSRAM Licht AG (a) 21,250 1,325 Siemens AG 43,597 7,163 .............................................. 40,672 ______________________
MATERIALS 3.3%
Aurubis AG 79,544 6,592 BASF SE 57,743 4,798
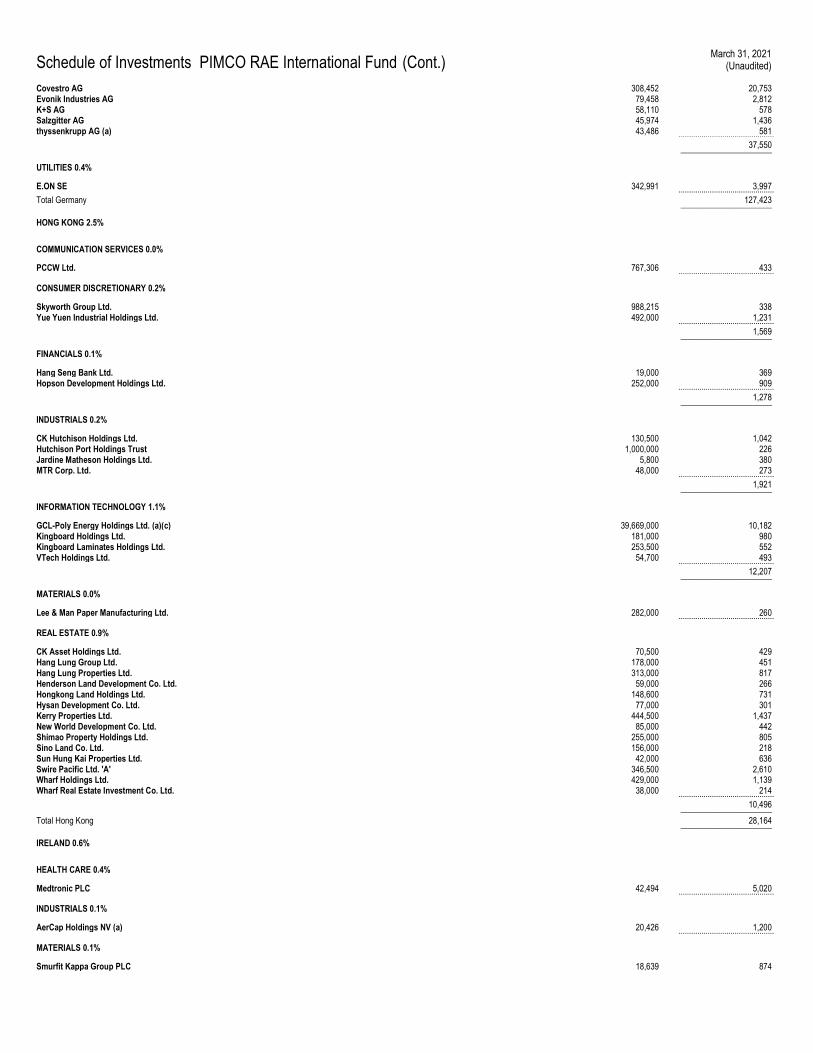
Schedule of Investments PIMCO RAE International Fund (Cont.) March 31, 2021
(Unaudited)
Covestro AG 308,452 20,753 Evonik Industries AG 79,458 2,812 K+S AG 58,110 578 Salzgitter AG 45,974 1,436 thyssenkrupp AG (a) 43,486 581 .............................................. 37,550 ______________________
UTILITIES 0.4%
E.ON SE 342,991 3,997 .............................................. Total Germany 127,423 ______________________
HONG KONG 2.5%
COMMUNICATION SERVICES 0.0%
PCCW Ltd. 767,306 433 ..............................................
CONSUMER DISCRETIONARY 0.2%
Skyworth Group Ltd. 988,215 338 Yue Yuen Industrial Holdings Ltd. 492,000 1,231 .............................................. 1,569 ______________________
FINANCIALS 0.1%
Hang Seng Bank Ltd. 19,000 369 Hopson Development Holdings Ltd. 252,000 909 .............................................. 1,278 ______________________
INDUSTRIALS 0.2%
CK Hutchison Holdings Ltd. 130,500 1,042 Hutchison Port Holdings Trust 1,000,000 226 Jardine Matheson Holdings Ltd. 5,800 380 MTR Corp. Ltd. 48,000 273 .............................................. 1,921 ______________________
INFORMATION TECHNOLOGY 1.1%
GCL-Poly Energy Holdings Ltd. (a)(c) 39,669,000 10,182 Kingboard Holdings Ltd. 181,000 980 Kingboard Laminates Holdings Ltd. 253,500 552 VTech Holdings Ltd. 54,700 493 .............................................. 12,207 ______________________
MATERIALS 0.0%
Lee & Man Paper Manufacturing Ltd. 282,000 260 ..............................................
REAL ESTATE 0.9%
CK Asset Holdings Ltd. 70,500 429 Hang Lung Group Ltd. 178,000 451 Hang Lung Properties Ltd. 313,000 817 Henderson Land Development Co. Ltd. 59,000 266 Hongkong Land Holdings Ltd. 148,600 731 Hysan Development Co. Ltd. 77,000 301 Kerry Properties Ltd. 444,500 1,437 New World Development Co. Ltd. 85,000 442 Shimao Property Holdings Ltd. 255,000 805 Sino Land Co. Ltd. 156,000 218 Sun Hung Kai Properties Ltd. 42,000 636 Swire Pacific Ltd. 'A' 346,500 2,610 Wharf Holdings Ltd. 429,000 1,139 Wharf Real Estate Investment Co. Ltd. 38,000 214 .............................................. 10,496 ______________________
Total Hong Kong 28,164 ______________________
IRELAND 0.6%
HEALTH CARE 0.4%
Medtronic PLC 42,494 5,020 ..............................................
INDUSTRIALS 0.1%
AerCap Holdings NV (a) 20,426 1,200 ..............................................
MATERIALS 0.1%
Smurfit Kappa Group PLC 18,639 874
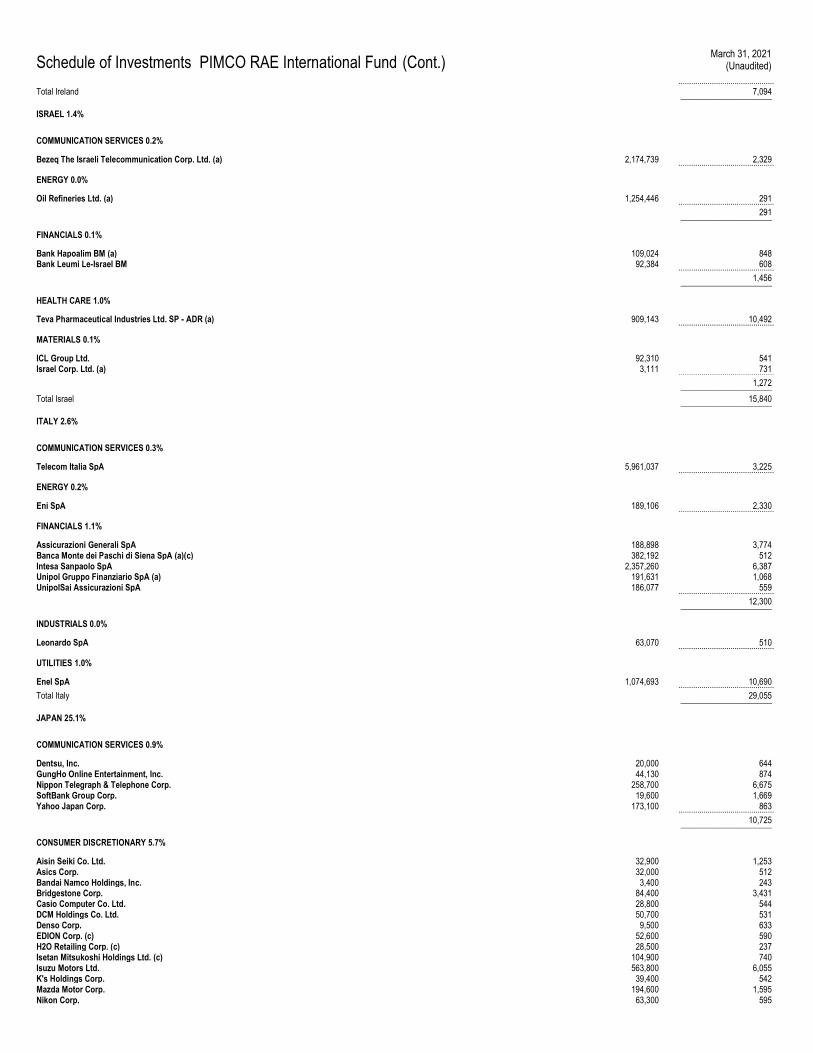
Schedule of Investments PIMCO RAE International Fund (Cont.) March 31, 2021
(Unaudited)
.............................................. Total Ireland 7,094 ______________________
ISRAEL 1.4%
COMMUNICATION SERVICES 0.2%
Bezeq The Israeli Telecommunication Corp. Ltd. (a) 2,174,739 2,329 ..............................................
ENERGY 0.0%
Oil Refineries Ltd. (a) 1,254,446 291 .............................................. 291 ______________________
FINANCIALS 0.1%
Bank Hapoalim BM (a) 109,024 848 Bank Leumi Le-Israel BM 92,384 608 .............................................. 1,456 ______________________
HEALTH CARE 1.0%
Teva Pharmaceutical Industries Ltd. SP - ADR (a) 909,143 10,492 ..............................................
MATERIALS 0.1%
ICL Group Ltd. 92,310 541 Israel Corp. Ltd. (a) 3,111 731 .............................................. 1,272 ______________________
Total Israel 15,840 ______________________
ITALY 2.6%
COMMUNICATION SERVICES 0.3%
Telecom Italia SpA 5,961,037 3,225 ..............................................
ENERGY 0.2%
Eni SpA 189,106 2,330 ..............................................
FINANCIALS 1.1%
Assicurazioni Generali SpA 188,898 3,774 Banca Monte dei Paschi di Siena SpA (a)(c) 382,192 512 Intesa Sanpaolo SpA 2,357,260 6,387 Unipol Gruppo Finanziario SpA (a) 191,631 1,068 UnipolSai Assicurazioni SpA 186,077 559 .............................................. 12,300 ______________________
INDUSTRIALS 0.0%
Leonardo SpA 63,070 510 ..............................................
UTILITIES 1.0%
Enel SpA 1,074,693 10,690 .............................................. Total Italy 29,055 ______________________
JAPAN 25.1%
COMMUNICATION SERVICES 0.9%
Dentsu, Inc. 20,000 644 GungHo Online Entertainment, Inc. 44,130 874 Nippon Telegraph & Telephone Corp. 258,700 6,675 SoftBank Group Corp. 19,600 1,669 Yahoo Japan Corp. 173,100 863 .............................................. 10,725 ______________________
CONSUMER DISCRETIONARY 5.7%
Aisin Seiki Co. Ltd. 32,900 1,253 Asics Corp. 32,000 512 Bandai Namco Holdings, Inc. 3,400 243 Bridgestone Corp. 84,400 3,431 Casio Computer Co. Ltd. 28,800 544 DCM Holdings Co. Ltd. 50,700 531 Denso Corp. 9,500 633 EDION Corp. (c) 52,600 590 H2O Retailing Corp. (c) 28,500 237 Isetan Mitsukoshi Holdings Ltd. (c) 104,900 740 Isuzu Motors Ltd. 563,800 6,055 K's Holdings Corp. 39,400 542 Mazda Motor Corp. 194,600 1,595 Nikon Corp. 63,300 595
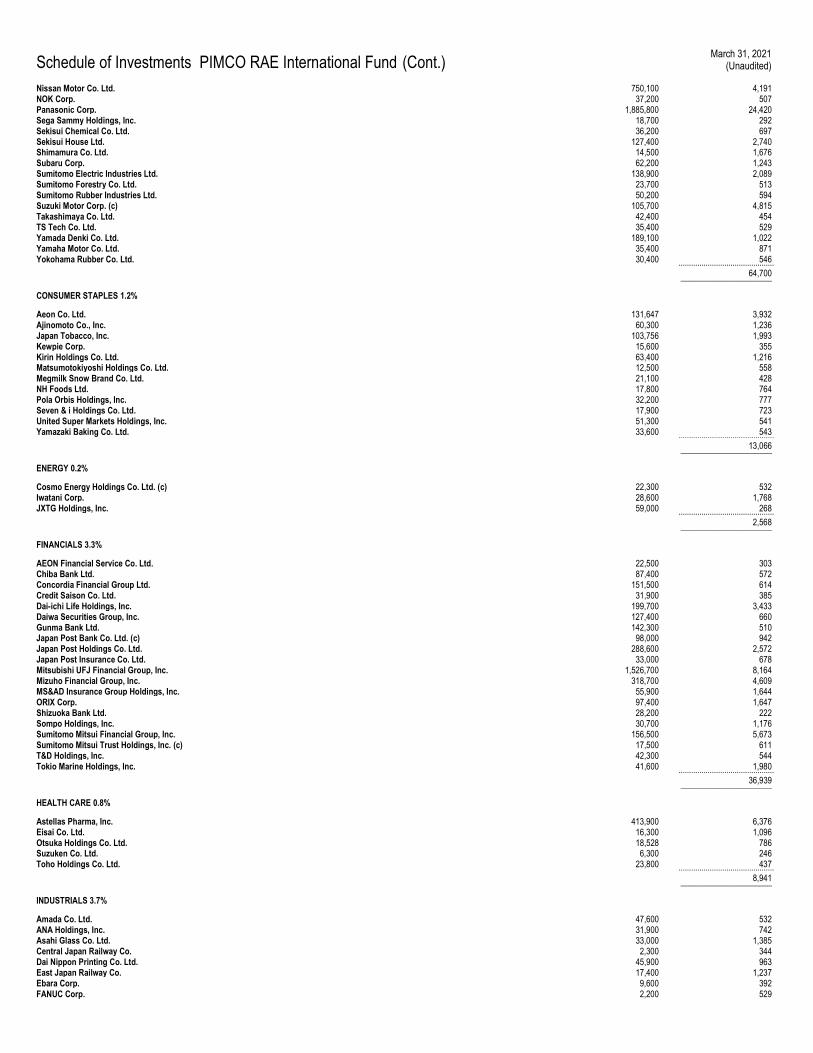
Schedule of Investments PIMCO RAE International Fund (Cont.) March 31, 2021
(Unaudited)
Nissan Motor Co. Ltd. 750,100 4,191 NOK Corp. 37,200 507 Panasonic Corp. 1,885,800 24,420 Sega Sammy Holdings, Inc. 18,700 292 Sekisui Chemical Co. Ltd. 36,200 697 Sekisui House Ltd. 127,400 2,740 Shimamura Co. Ltd. 14,500 1,676 Subaru Corp. 62,200 1,243 Sumitomo Electric Industries Ltd. 138,900 2,089 Sumitomo Forestry Co. Ltd. 23,700 513 Sumitomo Rubber Industries Ltd. 50,200 594 Suzuki Motor Corp. (c) 105,700 4,815 Takashimaya Co. Ltd. 42,400 454 TS Tech Co. Ltd. 35,400 529 Yamada Denki Co. Ltd. 189,100 1,022 Yamaha Motor Co. Ltd. 35,400 871 Yokohama Rubber Co. Ltd. 30,400 546 .............................................. 64,700 ______________________
CONSUMER STAPLES 1.2%
Aeon Co. Ltd. 131,647 3,932 Ajinomoto Co., Inc. 60,300 1,236 Japan Tobacco, Inc. 103,756 1,993 Kewpie Corp. 15,600 355 Kirin Holdings Co. Ltd. 63,400 1,216 Matsumotokiyoshi Holdings Co. Ltd. 12,500 558 Megmilk Snow Brand Co. Ltd. 21,100 428 NH Foods Ltd. 17,800 764 Pola Orbis Holdings, Inc. 32,200 777 Seven & i Holdings Co. Ltd. 17,900 723 United Super Markets Holdings, Inc. 51,300 541 Yamazaki Baking Co. Ltd. 33,600 543 .............................................. 13,066 ______________________
ENERGY 0.2%
Cosmo Energy Holdings Co. Ltd. (c) 22,300 532 Iwatani Corp. 28,600 1,768 JXTG Holdings, Inc. 59,000 268 .............................................. 2,568 ______________________
FINANCIALS 3.3%
AEON Financial Service Co. Ltd. 22,500 303 Chiba Bank Ltd. 87,400 572 Concordia Financial Group Ltd. 151,500 614 Credit Saison Co. Ltd. 31,900 385 Dai-ichi Life Holdings, Inc. 199,700 3,433 Daiwa Securities Group, Inc. 127,400 660 Gunma Bank Ltd. 142,300 510 Japan Post Bank Co. Ltd. (c) 98,000 942 Japan Post Holdings Co. Ltd. 288,600 2,572 Japan Post Insurance Co. Ltd. 33,000 678 Mitsubishi UFJ Financial Group, Inc. 1,526,700 8,164 Mizuho Financial Group, Inc. 318,700 4,609 MS&AD Insurance Group Holdings, Inc. 55,900 1,644 ORIX Corp. 97,400 1,647 Shizuoka Bank Ltd. 28,200 222 Sompo Holdings, Inc. 30,700 1,176 Sumitomo Mitsui Financial Group, Inc. 156,500 5,673 Sumitomo Mitsui Trust Holdings, Inc. (c) 17,500 611 T&D Holdings, Inc. 42,300 544 Tokio Marine Holdings, Inc. 41,600 1,980 .............................................. 36,939 ______________________
HEALTH CARE 0.8%
Astellas Pharma, Inc. 413,900 6,376 Eisai Co. Ltd. 16,300 1,096 Otsuka Holdings Co. Ltd. 18,528 786 Suzuken Co. Ltd. 6,300 246 Toho Holdings Co. Ltd. 23,800 437 .............................................. 8,941 ______________________
INDUSTRIALS 3.7%
Amada Co. Ltd. 47,600 532 ANA Holdings, Inc. 31,900 742 Asahi Glass Co. Ltd. 33,000 1,385 Central Japan Railway Co. 2,300 344 Dai Nippon Printing Co. Ltd. 45,900 963 East Japan Railway Co. 17,400 1,237 Ebara Corp. 9,600 392 FANUC Corp. 2,200 529
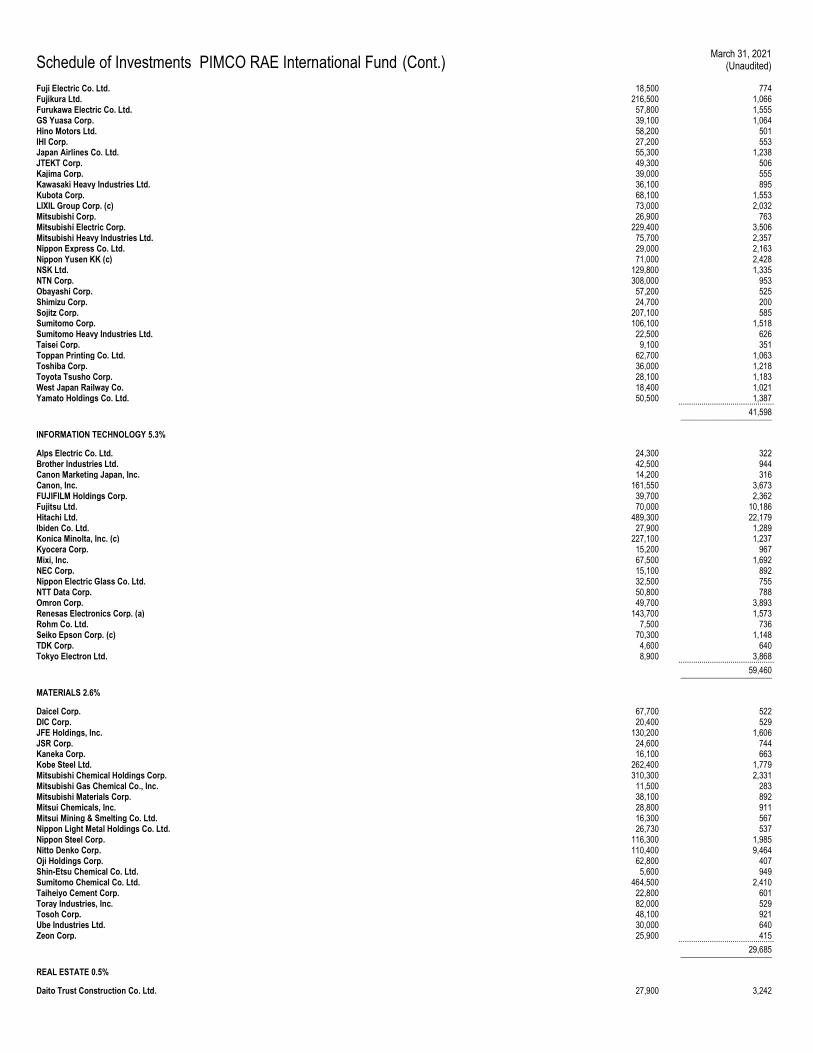
Schedule of Investments PIMCO RAE International Fund (Cont.) March 31, 2021
(Unaudited)
Fuji Electric Co. Ltd. 18,500 774 Fujikura Ltd. 216,500 1,066 Furukawa Electric Co. Ltd. 57,800 1,555 GS Yuasa Corp. 39,100 1,064 Hino Motors Ltd. 58,200 501 IHI Corp. 27,200 553 Japan Airlines Co. Ltd. 55,300 1,238 JTEKT Corp. 49,300 506 Kajima Corp. 39,000 555 Kawasaki Heavy Industries Ltd. 36,100 895 Kubota Corp. 68,100 1,553 LIXIL Group Corp. (c) 73,000 2,032 Mitsubishi Corp. 26,900 763 Mitsubishi Electric Corp. 229,400 3,506 Mitsubishi Heavy Industries Ltd. 75,700 2,357 Nippon Express Co. Ltd. 29,000 2,163 Nippon Yusen KK (c) 71,000 2,428 NSK Ltd. 129,800 1,335 NTN Corp. 308,000 953 Obayashi Corp. 57,200 525 Shimizu Corp. 24,700 200 Sojitz Corp. 207,100 585 Sumitomo Corp. 106,100 1,518 Sumitomo Heavy Industries Ltd. 22,500 626 Taisei Corp. 9,100 351 Toppan Printing Co. Ltd. 62,700 1,063 Toshiba Corp. 36,000 1,218 Toyota Tsusho Corp. 28,100 1,183 West Japan Railway Co. 18,400 1,021 Yamato Holdings Co. Ltd. 50,500 1,387 .............................................. 41,598 ______________________
INFORMATION TECHNOLOGY 5.3%
Alps Electric Co. Ltd. 24,300 322 Brother Industries Ltd. 42,500 944 Canon Marketing Japan, Inc. 14,200 316 Canon, Inc. 161,550 3,673 FUJIFILM Holdings Corp. 39,700 2,362 Fujitsu Ltd. 70,000 10,186 Hitachi Ltd. 489,300 22,179 Ibiden Co. Ltd. 27,900 1,289 Konica Minolta, Inc. (c) 227,100 1,237 Kyocera Corp. 15,200 967 Mixi, Inc. 67,500 1,692 NEC Corp. 15,100 892 Nippon Electric Glass Co. Ltd. 32,500 755 NTT Data Corp. 50,800 788 Omron Corp. 49,700 3,893 Renesas Electronics Corp. (a) 143,700 1,573 Rohm Co. Ltd. 7,500 736 Seiko Epson Corp. (c) 70,300 1,148 TDK Corp. 4,600 640 Tokyo Electron Ltd. 8,900 3,868 .............................................. 59,460 ______________________
MATERIALS 2.6%
Daicel Corp. 67,700 522 DIC Corp. 20,400 529 JFE Holdings, Inc. 130,200 1,606 JSR Corp. 24,600 744 Kaneka Corp. 16,100 663 Kobe Steel Ltd. 262,400 1,779 Mitsubishi Chemical Holdings Corp. 310,300 2,331 Mitsubishi Gas Chemical Co., Inc. 11,500 283 Mitsubishi Materials Corp. 38,100 892 Mitsui Chemicals, Inc. 28,800 911 Mitsui Mining & Smelting Co. Ltd. 16,300 567 Nippon Light Metal Holdings Co. Ltd. 26,730 537 Nippon Steel Corp. 116,300 1,985 Nitto Denko Corp. 110,400 9,464 Oji Holdings Corp. 62,800 407 Shin-Etsu Chemical Co. Ltd. 5,600 949 Sumitomo Chemical Co. Ltd. 464,500 2,410 Taiheiyo Cement Corp. 22,800 601 Toray Industries, Inc. 82,000 529 Tosoh Corp. 48,100 921 Ube Industries Ltd. 30,000 640 Zeon Corp. 25,900 415 .............................................. 29,685 ______________________
REAL ESTATE 0.5%
Daito Trust Construction Co. Ltd. 27,900 3,242
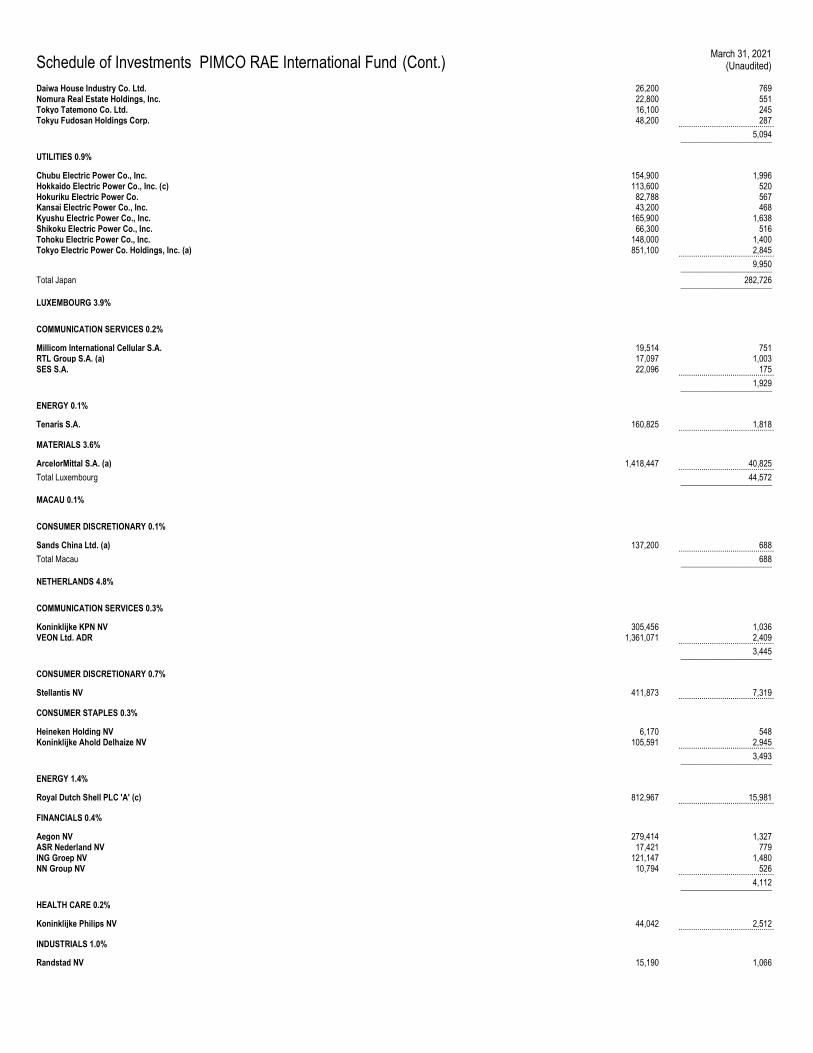
Schedule of Investments PIMCO RAE International Fund (Cont.) March 31, 2021
(Unaudited)
Daiwa House Industry Co. Ltd. 26,200 769 Nomura Real Estate Holdings, Inc. 22,800 551 Tokyo Tatemono Co. Ltd. 16,100 245 Tokyu Fudosan Holdings Corp. 48,200 287 .............................................. 5,094 ______________________
UTILITIES 0.9%
Chubu Electric Power Co., Inc. 154,900 1,996 Hokkaido Electric Power Co., Inc. (c) 113,600 520 Hokuriku Electric Power Co. 82,788 567 Kansai Electric Power Co., Inc. 43,200 468 Kyushu Electric Power Co., Inc. 165,900 1,638 Shikoku Electric Power Co., Inc. 66,300 516 Tohoku Electric Power Co., Inc. 148,000 1,400 Tokyo Electric Power Co. Holdings, Inc. (a) 851,100 2,845 .............................................. 9,950 ______________________
Total Japan 282,726 ______________________
LUXEMBOURG 3.9%
COMMUNICATION SERVICES 0.2%
Millicom International Cellular S.A. 19,514 751 RTL Group S.A. (a) 17,097 1,003 SES S.A. 22,096 175 .............................................. 1,929 ______________________
ENERGY 0.1%
Tenaris S.A. 160,825 1,818 ..............................................
MATERIALS 3.6%
ArcelorMittal S.A. (a) 1,418,447 40,825 .............................................. Total Luxembourg 44,572 ______________________
MACAU 0.1%
CONSUMER DISCRETIONARY 0.1%
Sands China Ltd. (a) 137,200 688 .............................................. Total Macau 688 ______________________
NETHERLANDS 4.8%
COMMUNICATION SERVICES 0.3%
Koninklijke KPN NV 305,456 1,036 VEON Ltd. ADR 1,361,071 2,409 .............................................. 3,445 ______________________
CONSUMER DISCRETIONARY 0.7%
Stellantis NV 411,873 7,319 ..............................................
CONSUMER STAPLES 0.3%
Heineken Holding NV 6,170 548 Koninklijke Ahold Delhaize NV 105,591 2,945 .............................................. 3,493 ______________________
ENERGY 1.4%
Royal Dutch Shell PLC 'A' (c) 812,967 15,981 ..............................................
FINANCIALS 0.4%
Aegon NV 279,414 1,327 ASR Nederland NV 17,421 779 ING Groep NV 121,147 1,480 NN Group NV 10,794 526 .............................................. 4,112 ______________________
HEALTH CARE 0.2%
Koninklijke Philips NV 44,042 2,512 ..............................................
INDUSTRIALS 1.0%
Randstad NV 15,190 1,066
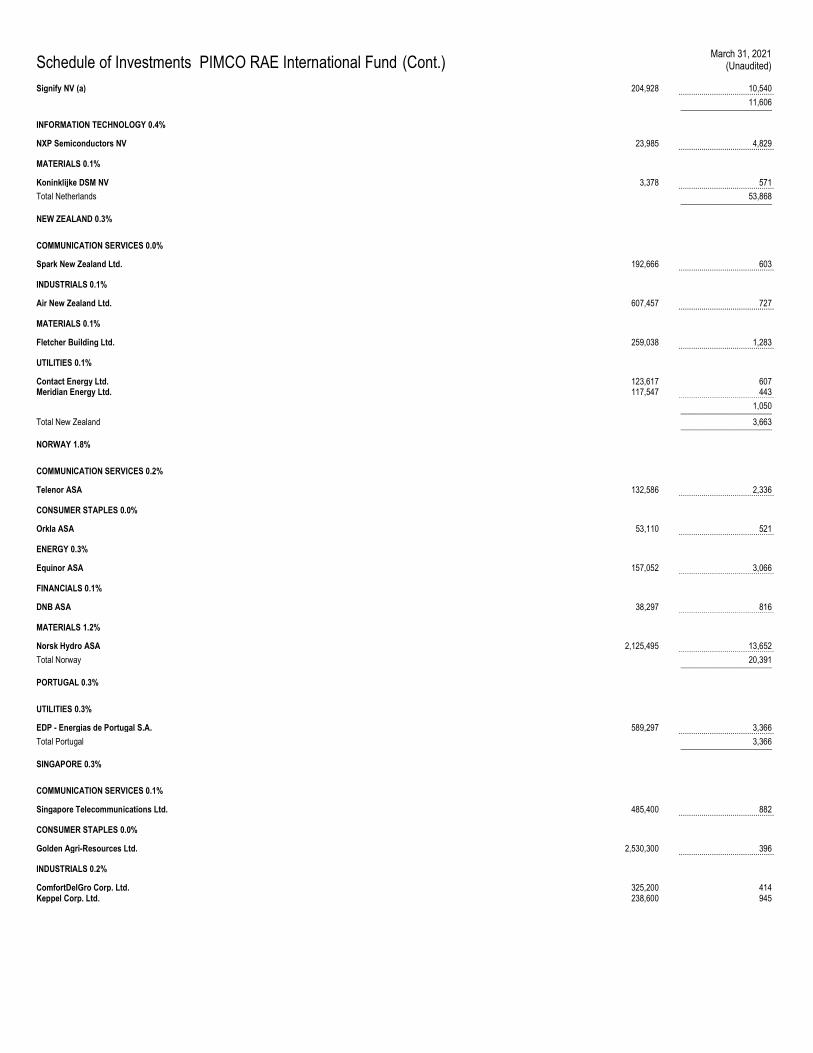
Schedule of Investments PIMCO RAE International Fund (Cont.) March 31, 2021
(Unaudited)
Signify NV (a) 204,928 10,540 .............................................. 11,606 ______________________
INFORMATION TECHNOLOGY 0.4%
NXP Semiconductors NV 23,985 4,829 ..............................................
MATERIALS 0.1%
Koninklijke DSM NV 3,378 571 .............................................. Total Netherlands 53,868 ______________________
NEW ZEALAND 0.3%
COMMUNICATION SERVICES 0.0%
Spark New Zealand Ltd. 192,666 603 ..............................................
INDUSTRIALS 0.1%
Air New Zealand Ltd. 607,457 727 ..............................................
MATERIALS 0.1%
Fletcher Building Ltd. 259,038 1,283 ..............................................
UTILITIES 0.1%
Contact Energy Ltd. 123,617 607 Meridian Energy Ltd. 117,547 443 .............................................. 1,050 ______________________
Total New Zealand 3,663 ______________________
NORWAY 1.8%
COMMUNICATION SERVICES 0.2%
Telenor ASA 132,586 2,336 ..............................................
CONSUMER STAPLES 0.0%
Orkla ASA 53,110 521 ..............................................
ENERGY 0.3%
Equinor ASA 157,052 3,066 ..............................................
FINANCIALS 0.1%
DNB ASA 38,297 816 ..............................................
MATERIALS 1.2%
Norsk Hydro ASA 2,125,495 13,652 .............................................. Total Norway 20,391 ______________________
PORTUGAL 0.3%
UTILITIES 0.3%
EDP - Energias de Portugal S.A. 589,297 3,366 .............................................. Total Portugal 3,366 ______________________
SINGAPORE 0.3%
COMMUNICATION SERVICES 0.1%
Singapore Telecommunications Ltd. 485,400 882 ..............................................
CONSUMER STAPLES 0.0%
Golden Agri-Resources Ltd. 2,530,300 396 ..............................................
INDUSTRIALS 0.2%
ComfortDelGro Corp. Ltd. 325,200 414 Keppel Corp. Ltd. 238,600 945
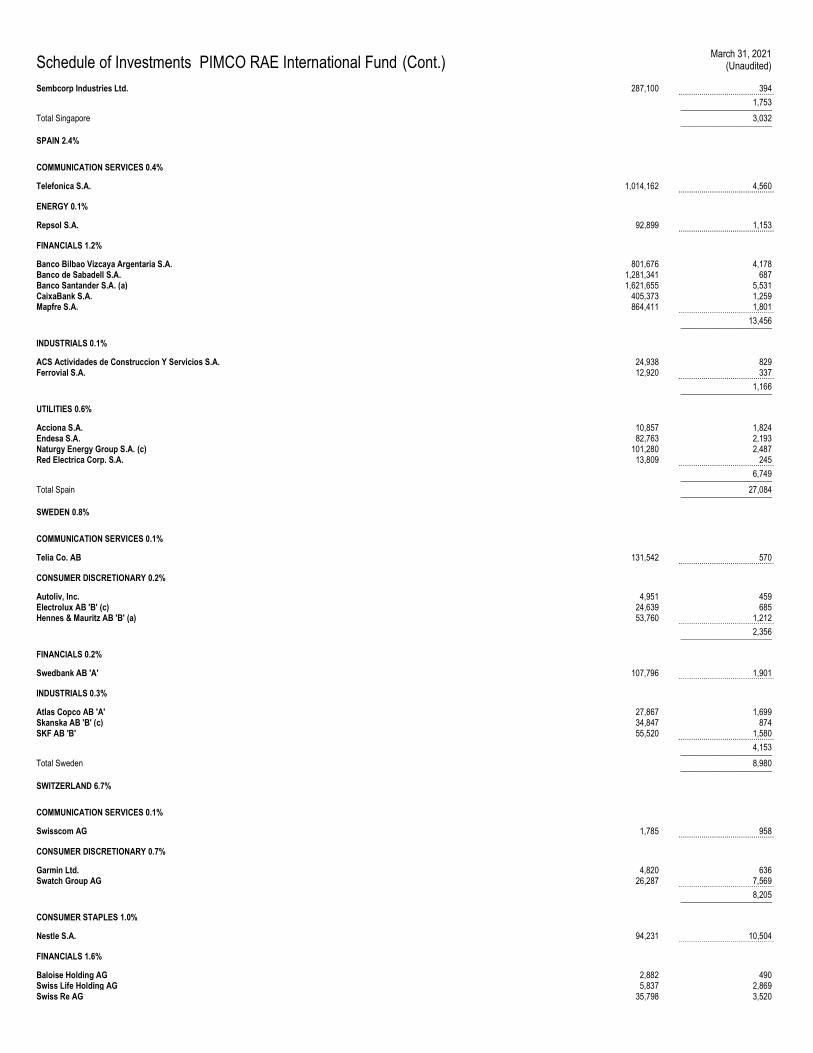
Schedule of Investments PIMCO RAE International Fund (Cont.) March 31, 2021
(Unaudited)
Sembcorp Industries Ltd. 287,100 394 .............................................. 1,753 ______________________
Total Singapore 3,032 ______________________
SPAIN 2.4%
COMMUNICATION SERVICES 0.4%
Telefonica S.A. 1,014,162 4,560 ..............................................
ENERGY 0.1%
Repsol S.A. 92,899 1,153 ..............................................
FINANCIALS 1.2%
Banco Bilbao Vizcaya Argentaria S.A. 801,676 4,178 Banco de Sabadell S.A. 1,281,341 687 Banco Santander S.A. (a) 1,621,655 5,531 CaixaBank S.A. 405,373 1,259 Mapfre S.A. 864,411 1,801 .............................................. 13,456 ______________________
INDUSTRIALS 0.1%
ACS Actividades de Construccion Y Servicios S.A. 24,938 829 Ferrovial S.A. 12,920 337 .............................................. 1,166 ______________________
UTILITIES 0.6%
Acciona S.A. 10,857 1,824 Endesa S.A. 82,763 2,193 Naturgy Energy Group S.A. (c) 101,280 2,487 Red Electrica Corp. S.A. 13,809 245 .............................................. 6,749 ______________________
Total Spain 27,084 ______________________
SWEDEN 0.8%
COMMUNICATION SERVICES 0.1%
Telia Co. AB 131,542 570 ..............................................
CONSUMER DISCRETIONARY 0.2%
Autoliv, Inc. 4,951 459 Electrolux AB 'B' (c) 24,639 685 Hennes & Mauritz AB 'B' (a) 53,760 1,212 .............................................. 2,356 ______________________
FINANCIALS 0.2%
Swedbank AB 'A' 107,796 1,901 ..............................................
INDUSTRIALS 0.3%
Atlas Copco AB 'A' 27,867 1,699 Skanska AB 'B' (c) 34,847 874 SKF AB 'B' 55,520 1,580 .............................................. 4,153 ______________________
Total Sweden 8,980 ______________________
SWITZERLAND 6.7%
COMMUNICATION SERVICES 0.1%
Swisscom AG 1,785 958 ..............................................
CONSUMER DISCRETIONARY 0.7%
Garmin Ltd. 4,820 636 Swatch Group AG 26,287 7,569 .............................................. 8,205 ______________________
CONSUMER STAPLES 1.0%
Nestle S.A. 94,231 10,504 ..............................................
FINANCIALS 1.6%
Baloise Holding AG 2,882 490 Swiss Life Holding AG 5,837 2,869 Swiss Re AG 35,798 3,520
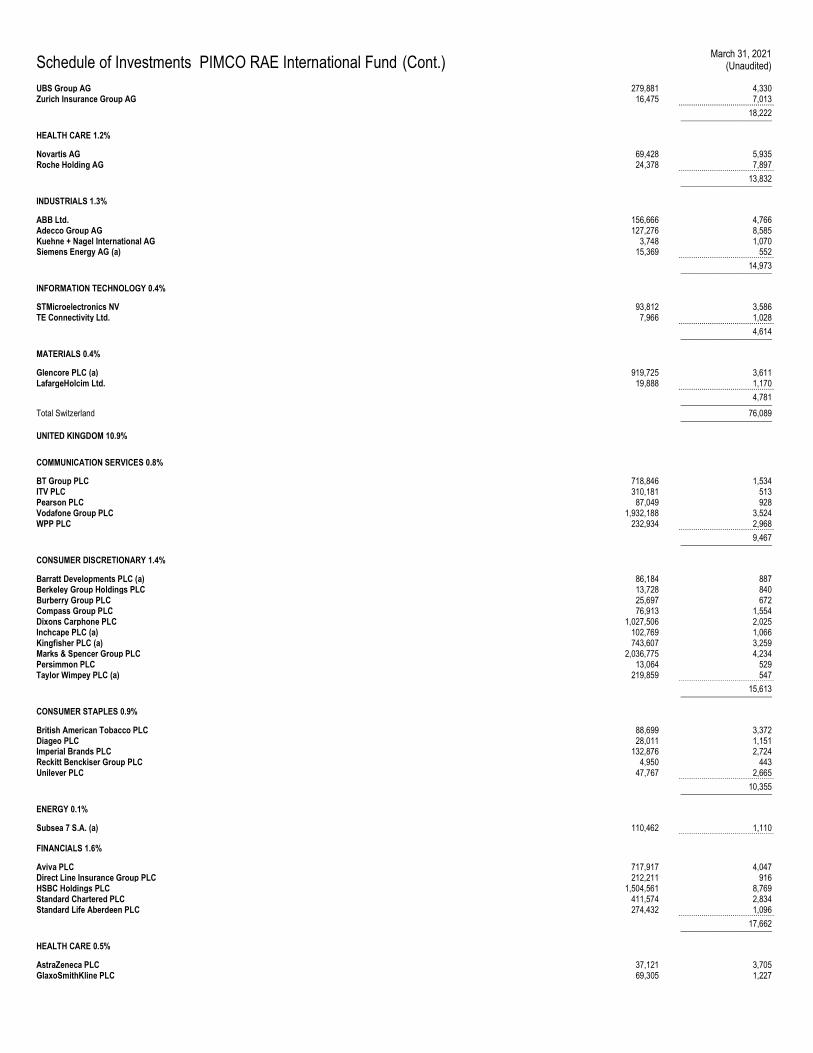
Schedule of Investments PIMCO RAE International Fund (Cont.) March 31, 2021
(Unaudited)
UBS Group AG 279,881 4,330 Zurich Insurance Group AG 16,475 7,013 .............................................. 18,222 ______________________
HEALTH CARE 1.2%
Novartis AG 69,428 5,935 Roche Holding AG 24,378 7,897 .............................................. 13,832 ______________________
INDUSTRIALS 1.3%
ABB Ltd. 156,666 4,766 Adecco Group AG 127,276 8,585 Kuehne + Nagel International AG 3,748 1,070 Siemens Energy AG (a) 15,369 552 .............................................. 14,973 ______________________
INFORMATION TECHNOLOGY 0.4%
STMicroelectronics NV 93,812 3,586 TE Connectivity Ltd. 7,966 1,028 .............................................. 4,614 ______________________
MATERIALS 0.4%
Glencore PLC (a) 919,725 3,611 LafargeHolcim Ltd. 19,888 1,170 .............................................. 4,781 ______________________
Total Switzerland 76,089 ______________________
UNITED KINGDOM 10.9%
COMMUNICATION SERVICES 0.8%
BT Group PLC 718,846 1,534 ITV PLC 310,181 513 Pearson PLC 87,049 928 Vodafone Group PLC 1,932,188 3,524 WPP PLC 232,934 2,968 .............................................. 9,467 ______________________
CONSUMER DISCRETIONARY 1.4%
Barratt Developments PLC (a) 86,184 887 Berkeley Group Holdings PLC 13,728 840 Burberry Group PLC 25,697 672 Compass Group PLC 76,913 1,554 Dixons Carphone PLC 1,027,506 2,025 Inchcape PLC (a) 102,769 1,066 Kingfisher PLC (a) 743,607 3,259 Marks & Spencer Group PLC 2,036,775 4,234 Persimmon PLC 13,064 529 Taylor Wimpey PLC (a) 219,859 547 .............................................. 15,613 ______________________
CONSUMER STAPLES 0.9%
British American Tobacco PLC 88,699 3,372 Diageo PLC 28,011 1,151 Imperial Brands PLC 132,876 2,724 Reckitt Benckiser Group PLC 4,950 443 Unilever PLC 47,767 2,665 .............................................. 10,355 ______________________
ENERGY 0.1%
Subsea 7 S.A. (a) 110,462 1,110 ..............................................
FINANCIALS 1.6%
Aviva PLC 717,917 4,047 Direct Line Insurance Group PLC 212,211 916 HSBC Holdings PLC 1,504,561 8,769 Standard Chartered PLC 411,574 2,834 Standard Life Aberdeen PLC 274,432 1,096 .............................................. 17,662 ______________________
HEALTH CARE 0.5%
AstraZeneca PLC 37,121 3,705 GlaxoSmithKline PLC 69,305 1,227
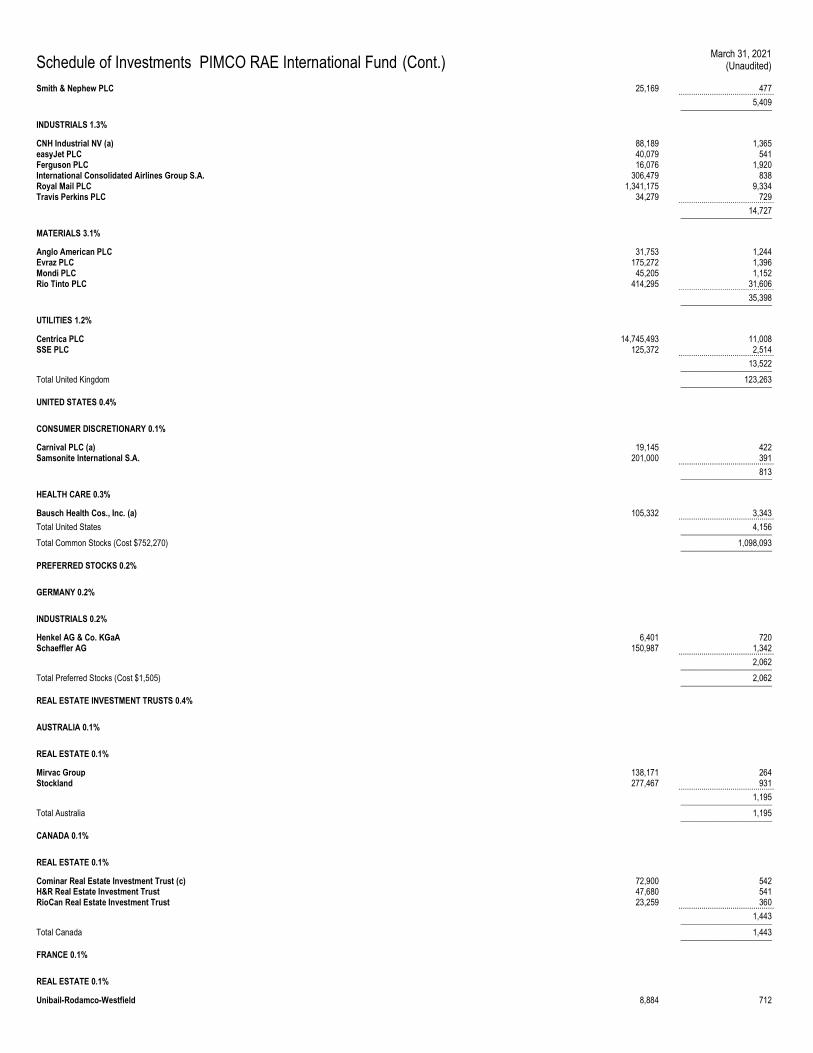
Schedule of Investments PIMCO RAE International Fund (Cont.) March 31, 2021
(Unaudited)
Smith & Nephew PLC 25,169 477 .............................................. 5,409 ______________________
INDUSTRIALS 1.3%
CNH Industrial NV (a) 88,189 1,365 easyJet PLC 40,079 541 Ferguson PLC 16,076 1,920 International Consolidated Airlines Group S.A. 306,479 838 Royal Mail PLC 1,341,175 9,334 Travis Perkins PLC 34,279 729 .............................................. 14,727 ______________________
MATERIALS 3.1%
Anglo American PLC 31,753 1,244 Evraz PLC 175,272 1,396 Mondi PLC 45,205 1,152 Rio Tinto PLC 414,295 31,606 .............................................. 35,398 ______________________
UTILITIES 1.2%
Centrica PLC 14,745,493 11,008 SSE PLC 125,372 2,514 .............................................. 13,522 ______________________
Total United Kingdom 123,263 ______________________
UNITED STATES 0.4%
CONSUMER DISCRETIONARY 0.1%
Carnival PLC (a) 19,145 422 Samsonite International S.A. 201,000 391 .............................................. 813 ______________________
HEALTH CARE 0.3%
Bausch Health Cos., Inc. (a) 105,332 3,343 .............................................. Total United States 4,156 ______________________
Total Common Stocks (Cost $752,270) 1,098,093 ______________________
PREFERRED STOCKS 0.2%
GERMANY 0.2%
INDUSTRIALS 0.2%
Henkel AG & Co. KGaA 6,401 720 Schaeffler AG 150,987 1,342 .............................................. 2,062 ______________________
Total Preferred Stocks (Cost $1,505) 2,062 ______________________
REAL ESTATE INVESTMENT TRUSTS 0.4%
AUSTRALIA 0.1%
REAL ESTATE 0.1%
Mirvac Group 138,171 264 Stockland 277,467 931 .............................................. 1,195 ______________________
Total Australia 1,195 ______________________
CANADA 0.1%
REAL ESTATE 0.1%
Cominar Real Estate Investment Trust (c) 72,900 542 H&R Real Estate Investment Trust 47,680 541 RioCan Real Estate Investment Trust 23,259 360 .............................................. 1,443 ______________________
Total Canada 1,443 ______________________
FRANCE 0.1%
REAL ESTATE 0.1%
Unibail-Rodamco-Westfield 8,884 712
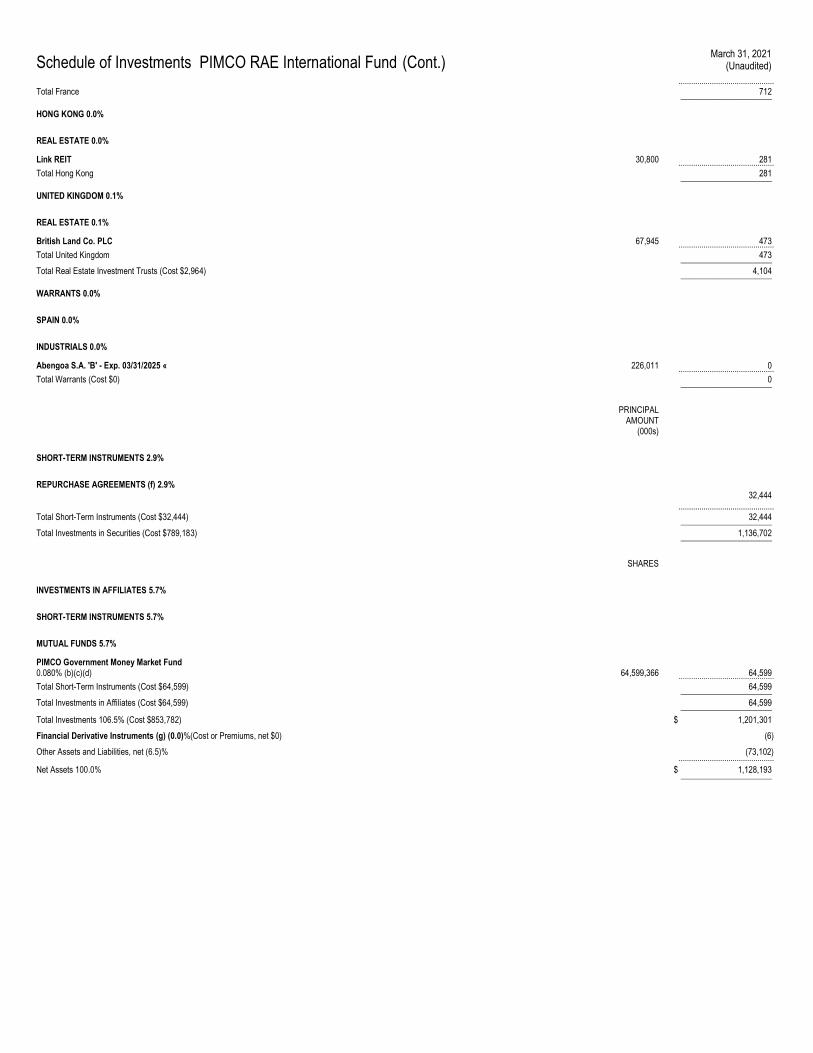
Schedule of Investments PIMCO RAE International Fund (Cont.) March 31, 2021
(Unaudited)
.............................................. Total France 712 ______________________
HONG KONG 0.0%
REAL ESTATE 0.0%
Link REIT 30,800 281 .............................................. Total Hong Kong 281 ______________________
UNITED KINGDOM 0.1%
REAL ESTATE 0.1%
British Land Co. PLC 67,945 473 .............................................. Total United Kingdom 473 ______________________
Total Real Estate Investment Trusts (Cost $2,964) 4,104 ______________________
WARRANTS 0.0%
SPAIN 0.0%
INDUSTRIALS 0.0%
Abengoa S.A. 'B' - Exp. 03/31/2025 « 226,011 0 .............................................. Total Warrants (Cost $0) 0 ______________________
PRINCIPAL AMOUNT
(000s)
SHORT-TERM INSTRUMENTS 2.9%
REPURCHASE AGREEMENTS (f) 2.9% 32,444
.............................................. Total Short-Term Instruments (Cost $32,444) 32,444 ______________________
Total Investments in Securities (Cost $789,183) 1,136,702 ______________________
SHARES
INVESTMENTS IN AFFILIATES 5.7%
SHORT-TERM INSTRUMENTS 5.7%
MUTUAL FUNDS 5.7%
PIMCO Government Money Market Fund 0.080% (b)(c)(d) 64,599,366 64,599 .............................................. Total Short-Term Instruments (Cost $64,599) 64,599 ______________________
Total Investments in Affiliates (Cost $64,599) 64,599 ______________________
Total Investments 106.5% (Cost $853,782) $ 1,201,301
Financial Derivative Instruments (g) (0.0)%(Cost or Premiums, net $0) (6)
Other Assets and Liabilities, net (6.5)% (73,102) ..............................................
Net Assets 100.0% $ 1,128,193 ______________________
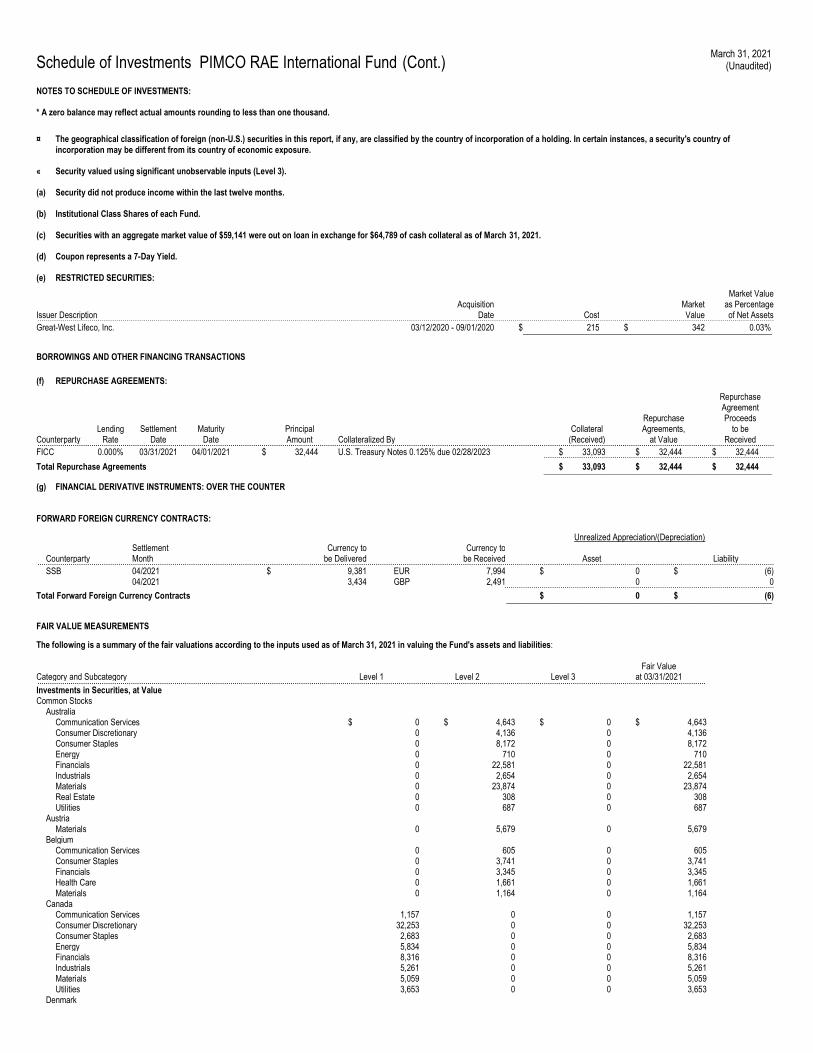
Schedule of Investments PIMCO RAE International Fund (Cont.) March 31, 2021
(Unaudited)
NOTES TO SCHEDULE OF INVESTMENTS: * A zero balance may reflect actual amounts rounding to less than one thousand.
¤ The geographical classification of foreign (non-U.S.) securities in this report, if any, are classified by the country of incorporation of a holding. In certain instances, a security's country of incorporation may be different from its country of economic exposure.
« Security valued using significant unobservable inputs (Level 3).
(a) Security did not produce income within the last twelve months.
(b) Institutional Class Shares of each Fund.
(c) Securities with an aggregate market value of $59,141 were out on loan in exchange for $64,789 of cash collateral as of March 31, 2021.
(d) Coupon represents a 7-Day Yield.
(e) RESTRICTED SECURITIES:
Issuer Description Acquisition
Date Cost Market Value
Market Value as Percentage of Net Assets ...................................................................................................................................................................................................................................................................................................................................................................
Great-West Lifeco, Inc. 03/12/2020 - 09/01/2020 $ 215 $ 342 0.03 % ____________________________________________________________
BORROWINGS AND OTHER FINANCING TRANSACTIONS
(f) REPURCHASE AGREEMENTS:
Counterparty Lending
Rate Settlement
Date Maturity
Date Principal Amount Collateralized By
Collateral (Received)
Repurchase Agreements,
at Value
Repurchase Agreement Proceeds
to be Received
................................................................................................................................................................................................................................................................................................................................................................... FICC 0.000% 03/31/2021 04/01/2021 $ 32,444 U.S. Treasury Notes 0.125% due 02/28/2023 $ 33,093 $ 32,444 $ 32,444 ...............................................................................................................
Total Repurchase Agreements $ 33,093 $ 32,444 $ 32,444 _______________________________________________________
(g) FINANCIAL DERIVATIVE INSTRUMENTS: OVER THE COUNTER
FORWARD FOREIGN CURRENCY CONTRACTS:
Unrealized Appreciation/(Depreciation)
Counterparty Settlement Month
Currency to be Delivered
Currency to be Received Asset Liability ...................................................................................................................................................................................................................................................................................................................................................................
SSB 04/2021 $ 9,381 EUR 7,994 $ 0 $ (6) 04/2021 3,434 GBP 2,491 0 0 ..................................................................................................................................
Total Forward Foreign Currency Contracts $ 0 $ (6) ________________________________________________________________
FAIR VALUE MEASUREMENTS
The following is a summary of the fair valuations according to the inputs used as of March 31, 2021 in valuing the Fund's assets and liabilities:
Category and Subcategory Level 1 Level 2 Level 3 Fair Value
at 03/31/2021 .................................................................................................................................................................................................................................................................................................................................. Investments in Securities, at Value Common Stocks Australia Communication Services $ 0 $ 4,643 $ 0 $ 4,643 Consumer Discretionary 0 4,136 0 4,136 Consumer Staples 0 8,172 0 8,172 Energy 0 710 0 710 Financials 0 22,581 0 22,581 Industrials 0 2,654 0 2,654 Materials 0 23,874 0 23,874 Real Estate 0 308 0 308 Utilities 0 687 0 687 Austria Materials 0 5,679 0 5,679 Belgium Communication Services 0 605 0 605 Consumer Staples 0 3,741 0 3,741 Financials 0 3,345 0 3,345 Health Care 0 1,661 0 1,661 Materials 0 1,164 0 1,164 Canada Communication Services 1,157 0 0 1,157 Consumer Discretionary 32,253 0 0 32,253 Consumer Staples 2,683 0 0 2,683 Energy 5,834 0 0 5,834 Financials 8,316 0 0 8,316 Industrials 5,261 0 0 5,261 Materials 5,059 0 0 5,059 Utilities 3,653 0 0 3,653 Denmark
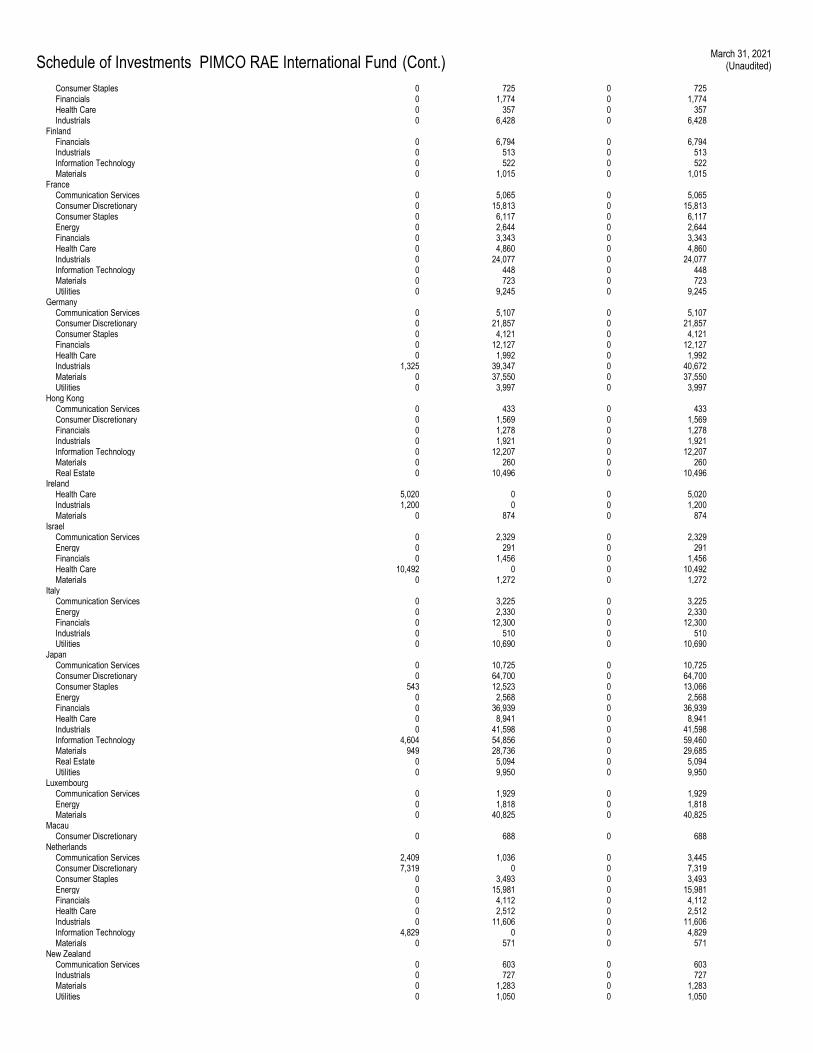
Schedule of Investments PIMCO RAE International Fund (Cont.) March 31, 2021
(Unaudited)
Consumer Staples 0 725 0 725 Financials 0 1,774 0 1,774 Health Care 0 357 0 357 Industrials 0 6,428 0 6,428 Finland Financials 0 6,794 0 6,794 Industrials 0 513 0 513 Information Technology 0 522 0 522 Materials 0 1,015 0 1,015 France Communication Services 0 5,065 0 5,065 Consumer Discretionary 0 15,813 0 15,813 Consumer Staples 0 6,117 0 6,117 Energy 0 2,644 0 2,644 Financials 0 3,343 0 3,343 Health Care 0 4,860 0 4,860 Industrials 0 24,077 0 24,077 Information Technology 0 448 0 448 Materials 0 723 0 723 Utilities 0 9,245 0 9,245 Germany Communication Services 0 5,107 0 5,107 Consumer Discretionary 0 21,857 0 21,857 Consumer Staples 0 4,121 0 4,121 Financials 0 12,127 0 12,127 Health Care 0 1,992 0 1,992 Industrials 1,325 39,347 0 40,672 Materials 0 37,550 0 37,550 Utilities 0 3,997 0 3,997 Hong Kong Communication Services 0 433 0 433 Consumer Discretionary 0 1,569 0 1,569 Financials 0 1,278 0 1,278 Industrials 0 1,921 0 1,921 Information Technology 0 12,207 0 12,207 Materials 0 260 0 260 Real Estate 0 10,496 0 10,496 Ireland Health Care 5,020 0 0 5,020 Industrials 1,200 0 0 1,200 Materials 0 874 0 874 Israel Communication Services 0 2,329 0 2,329 Energy 0 291 0 291 Financials 0 1,456 0 1,456 Health Care 10,492 0 0 10,492 Materials 0 1,272 0 1,272 Italy Communication Services 0 3,225 0 3,225 Energy 0 2,330 0 2,330 Financials 0 12,300 0 12,300 Industrials 0 510 0 510 Utilities 0 10,690 0 10,690 Japan Communication Services 0 10,725 0 10,725 Consumer Discretionary 0 64,700 0 64,700 Consumer Staples 543 12,523 0 13,066 Energy 0 2,568 0 2,568 Financials 0 36,939 0 36,939 Health Care 0 8,941 0 8,941 Industrials 0 41,598 0 41,598 Information Technology 4,604 54,856 0 59,460 Materials 949 28,736 0 29,685 Real Estate 0 5,094 0 5,094 Utilities 0 9,950 0 9,950 Luxembourg Communication Services 0 1,929 0 1,929 Energy 0 1,818 0 1,818 Materials 0 40,825 0 40,825 Macau Consumer Discretionary 0 688 0 688 Netherlands Communication Services 2,409 1,036 0 3,445 Consumer Discretionary 7,319 0 0 7,319 Consumer Staples 0 3,493 0 3,493 Energy 0 15,981 0 15,981 Financials 0 4,112 0 4,112 Health Care 0 2,512 0 2,512 Industrials 0 11,606 0 11,606 Information Technology 4,829 0 0 4,829 Materials 0 571 0 571 New Zealand Communication Services 0 603 0 603 Industrials 0 727 0 727 Materials 0 1,283 0 1,283 Utilities 0 1,050 0 1,050
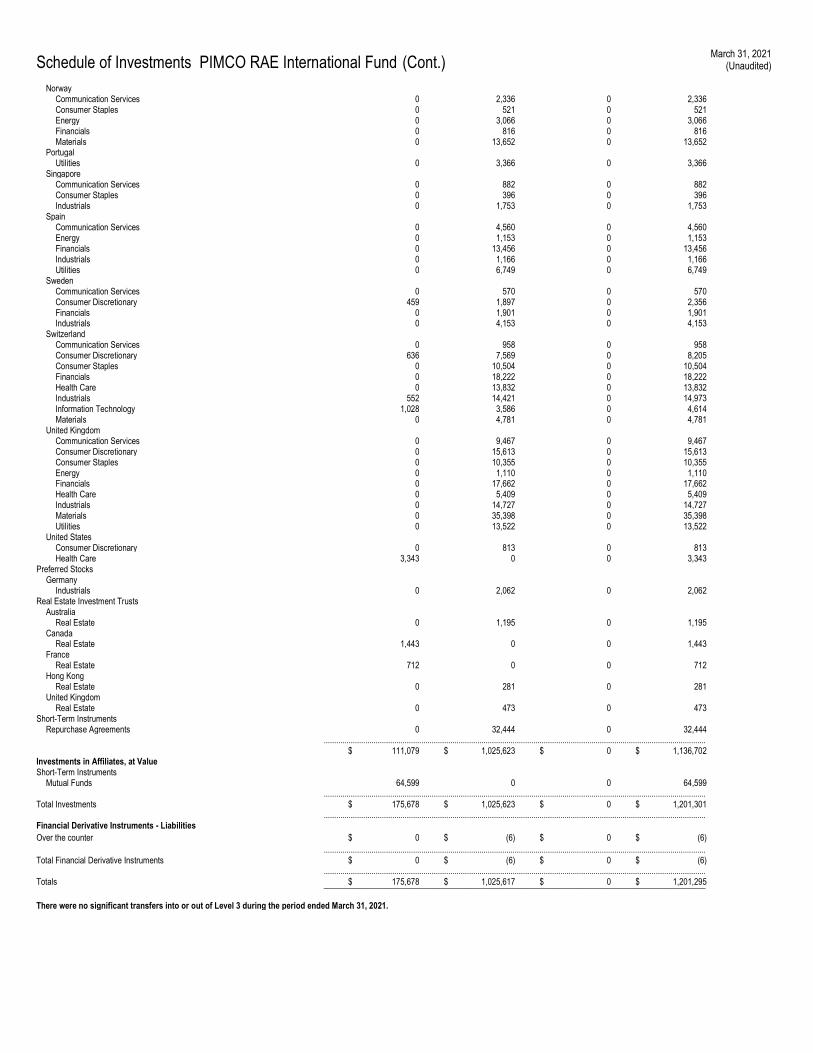
Schedule of Investments PIMCO RAE International Fund (Cont.) March 31, 2021
(Unaudited)
Norway Communication Services 0 2,336 0 2,336 Consumer Staples 0 521 0 521 Energy 0 3,066 0 3,066 Financials 0 816 0 816 Materials 0 13,652 0 13,652 Portugal Utilities 0 3,366 0 3,366 Singapore Communication Services 0 882 0 882 Consumer Staples 0 396 0 396 Industrials 0 1,753 0 1,753 Spain Communication Services 0 4,560 0 4,560 Energy 0 1,153 0 1,153 Financials 0 13,456 0 13,456 Industrials 0 1,166 0 1,166 Utilities 0 6,749 0 6,749 Sweden Communication Services 0 570 0 570 Consumer Discretionary 459 1,897 0 2,356 Financials 0 1,901 0 1,901 Industrials 0 4,153 0 4,153 Switzerland Communication Services 0 958 0 958 Consumer Discretionary 636 7,569 0 8,205 Consumer Staples 0 10,504 0 10,504 Financials 0 18,222 0 18,222 Health Care 0 13,832 0 13,832 Industrials 552 14,421 0 14,973 Information Technology 1,028 3,586 0 4,614 Materials 0 4,781 0 4,781 United Kingdom Communication Services 0 9,467 0 9,467 Consumer Discretionary 0 15,613 0 15,613 Consumer Staples 0 10,355 0 10,355 Energy 0 1,110 0 1,110 Financials 0 17,662 0 17,662 Health Care 0 5,409 0 5,409 Industrials 0 14,727 0 14,727 Materials 0 35,398 0 35,398 Utilities 0 13,522 0 13,522 United States Consumer Discretionary 0 813 0 813 Health Care 3,343 0 0 3,343 Preferred Stocks Germany Industrials 0 2,062 0 2,062 Real Estate Investment Trusts Australia Real Estate 0 1,195 0 1,195 Canada Real Estate 1,443 0 0 1,443 France Real Estate 712 0 0 712 Hong Kong Real Estate 0 281 0 281 United Kingdom Real Estate 0 473 0 473 Short-Term Instruments Repurchase Agreements 0 32,444 0 32,444 ........................................................................................................................................................................................ $ 111,079 $ 1,025,623 $ 0 $ 1,136,702 Investments in Affiliates, at Value Short-Term Instruments Mutual Funds 64,599 0 0 64,599 ........................................................................................................................................................................................ Total Investments $ 175,678 $ 1,025,623 $ 0 $ 1,201,301 ........................................................................................................................................................................................ Financial Derivative Instruments - Liabilities
Over the counter $ 0 $ (6) $ 0 $ (6)
........................................................................................................................................................................................ Total Financial Derivative Instruments $ 0 $ (6) $ 0 $ (6) ........................................................................................................................................................................................ Totals $ 175,678 $ 1,025,617 $ 0 $ 1,201,295 ____________________________________________________________________________________________ There were no significant transfers into or out of Level 3 during the period ended March 31, 2021.
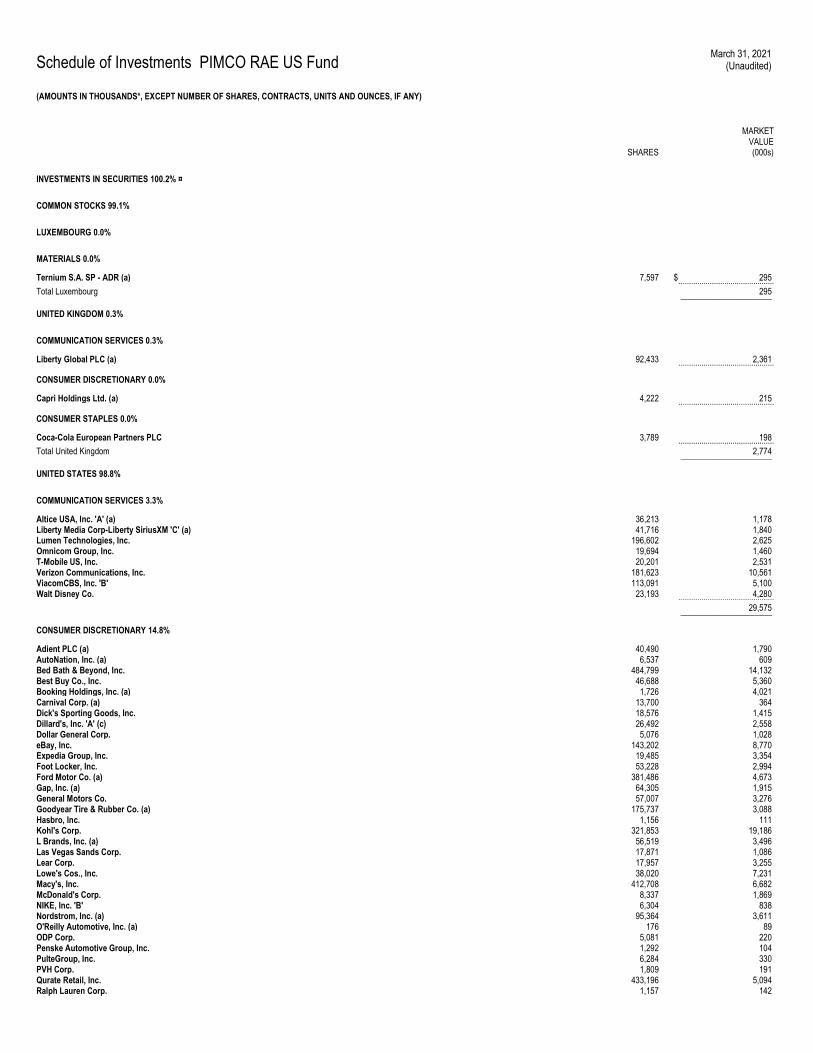
Schedule of Investments PIMCO RAE US Fund March 31, 2021
(Unaudited)
(AMOUNTS IN THOUSANDS*, EXCEPT NUMBER OF SHARES, CONTRACTS, UNITS AND OUNCES, IF ANY)
SHARES
MARKET VALUE (000s)
INVESTMENTS IN SECURITIES 100.2% ¤
COMMON STOCKS 99.1%
LUXEMBOURG 0.0%
MATERIALS 0.0%
Ternium S.A. SP - ADR (a) 7,597 $ 295 .............................................. Total Luxembourg 295 ______________________
UNITED KINGDOM 0.3%
COMMUNICATION SERVICES 0.3%
Liberty Global PLC (a) 92,433 2,361 ..............................................
CONSUMER DISCRETIONARY 0.0%
Capri Holdings Ltd. (a) 4,222 215 ..............................................
CONSUMER STAPLES 0.0%
Coca-Cola European Partners PLC 3,789 198 .............................................. Total United Kingdom 2,774 ______________________
UNITED STATES 98.8%
COMMUNICATION SERVICES 3.3%
Altice USA, Inc. 'A' (a) 36,213 1,178 Liberty Media Corp-Liberty SiriusXM 'C' (a) 41,716 1,840 Lumen Technologies, Inc. 196,602 2,625 Omnicom Group, Inc. 19,694 1,460 T-Mobile US, Inc. 20,201 2,531 Verizon Communications, Inc. 181,623 10,561 ViacomCBS, Inc. 'B' 113,091 5,100 Walt Disney Co. 23,193 4,280 .............................................. 29,575 ______________________
CONSUMER DISCRETIONARY 14.8%
Adient PLC (a) 40,490 1,790 AutoNation, Inc. (a) 6,537 609 Bed Bath & Beyond, Inc. 484,799 14,132 Best Buy Co., Inc. 46,688 5,360 Booking Holdings, Inc. (a) 1,726 4,021 Carnival Corp. (a) 13,700 364 Dick's Sporting Goods, Inc. 18,576 1,415 Dillard's, Inc. 'A' (c) 26,492 2,558 Dollar General Corp. 5,076 1,028 eBay, Inc. 143,202 8,770 Expedia Group, Inc. 19,485 3,354 Foot Locker, Inc. 53,228 2,994 Ford Motor Co. (a) 381,486 4,673 Gap, Inc. (a) 64,305 1,915 General Motors Co. 57,007 3,276 Goodyear Tire & Rubber Co. (a) 175,737 3,088 Hasbro, Inc. 1,156 111 Kohl's Corp. 321,853 19,186 L Brands, Inc. (a) 56,519 3,496 Las Vegas Sands Corp. 17,871 1,086 Lear Corp. 17,957 3,255 Lowe's Cos., Inc. 38,020 7,231 Macy's, Inc. 412,708 6,682 McDonald's Corp. 8,337 1,869 NIKE, Inc. 'B' 6,304 838 Nordstrom, Inc. (a) 95,364 3,611 O'Reilly Automotive, Inc. (a) 176 89 ODP Corp. 5,081 220 Penske Automotive Group, Inc. 1,292 104 PulteGroup, Inc. 6,284 330 PVH Corp. 1,809 191 Qurate Retail, Inc. 433,196 5,094 Ralph Lauren Corp. 1,157 142
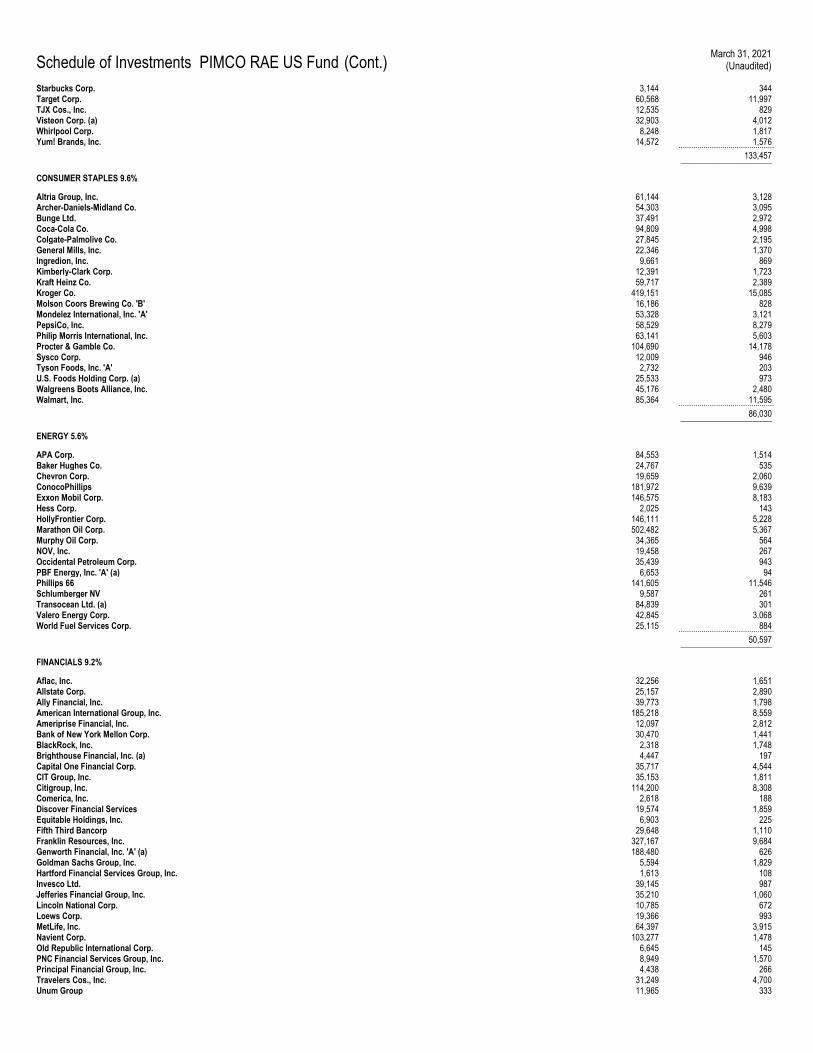
Schedule of Investments PIMCO RAE US Fund (Cont.) March 31, 2021
(Unaudited)
Starbucks Corp. 3,144 344 Target Corp. 60,568 11,997 TJX Cos., Inc. 12,535 829 Visteon Corp. (a) 32,903 4,012 Whirlpool Corp. 8,248 1,817 Yum! Brands, Inc. 14,572 1,576 .............................................. 133,457 ______________________
CONSUMER STAPLES 9.6%
Altria Group, Inc. 61,144 3,128 Archer-Daniels-Midland Co. 54,303 3,095 Bunge Ltd. 37,491 2,972 Coca-Cola Co. 94,809 4,998 Colgate-Palmolive Co. 27,845 2,195 General Mills, Inc. 22,346 1,370 Ingredion, Inc. 9,661 869 Kimberly-Clark Corp. 12,391 1,723 Kraft Heinz Co. 59,717 2,389 Kroger Co. 419,151 15,085 Molson Coors Brewing Co. 'B' 16,186 828 Mondelez International, Inc. 'A' 53,328 3,121 PepsiCo, Inc. 58,529 8,279 Philip Morris International, Inc. 63,141 5,603 Procter & Gamble Co. 104,690 14,178 Sysco Corp. 12,009 946 Tyson Foods, Inc. 'A' 2,732 203 U.S. Foods Holding Corp. (a) 25,533 973 Walgreens Boots Alliance, Inc. 45,176 2,480 Walmart, Inc. 85,364 11,595 .............................................. 86,030 ______________________
ENERGY 5.6%
APA Corp. 84,553 1,514 Baker Hughes Co. 24,767 535 Chevron Corp. 19,659 2,060 ConocoPhillips 181,972 9,639 Exxon Mobil Corp. 146,575 8,183 Hess Corp. 2,025 143 HollyFrontier Corp. 146,111 5,228 Marathon Oil Corp. 502,482 5,367 Murphy Oil Corp. 34,365 564 NOV, Inc. 19,458 267 Occidental Petroleum Corp. 35,439 943 PBF Energy, Inc. 'A' (a) 6,653 94 Phillips 66 141,605 11,546 Schlumberger NV 9,587 261 Transocean Ltd. (a) 84,839 301 Valero Energy Corp. 42,845 3,068 World Fuel Services Corp. 25,115 884 .............................................. 50,597 ______________________
FINANCIALS 9.2%
Aflac, Inc. 32,256 1,651 Allstate Corp. 25,157 2,890 Ally Financial, Inc. 39,773 1,798 American International Group, Inc. 185,218 8,559 Ameriprise Financial, Inc. 12,097 2,812 Bank of New York Mellon Corp. 30,470 1,441 BlackRock, Inc. 2,318 1,748 Brighthouse Financial, Inc. (a) 4,447 197 Capital One Financial Corp. 35,717 4,544 CIT Group, Inc. 35,153 1,811 Citigroup, Inc. 114,200 8,308 Comerica, Inc. 2,618 188 Discover Financial Services 19,574 1,859 Equitable Holdings, Inc. 6,903 225 Fifth Third Bancorp 29,648 1,110 Franklin Resources, Inc. 327,167 9,684 Genworth Financial, Inc. 'A' (a) 188,480 626 Goldman Sachs Group, Inc. 5,594 1,829 Hartford Financial Services Group, Inc. 1,613 108 Invesco Ltd. 39,145 987 Jefferies Financial Group, Inc. 35,210 1,060 Lincoln National Corp. 10,785 672 Loews Corp. 19,366 993 MetLife, Inc. 64,397 3,915 Navient Corp. 103,277 1,478 Old Republic International Corp. 6,645 145 PNC Financial Services Group, Inc. 8,949 1,570 Principal Financial Group, Inc. 4,438 266 Travelers Cos., Inc. 31,249 4,700 Unum Group 11,965 333
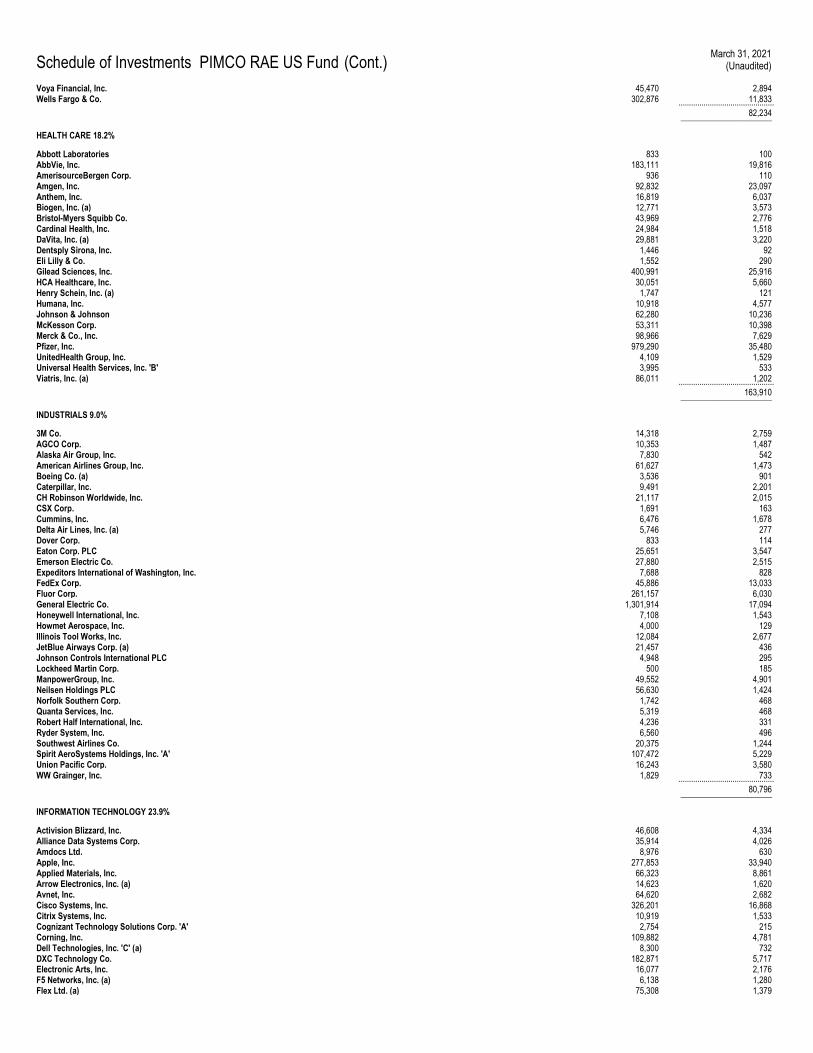
Schedule of Investments PIMCO RAE US Fund (Cont.) March 31, 2021
(Unaudited)
Voya Financial, Inc. 45,470 2,894 Wells Fargo & Co. 302,876 11,833 .............................................. 82,234 ______________________
HEALTH CARE 18.2%
Abbott Laboratories 833 100 AbbVie, Inc. 183,111 19,816 AmerisourceBergen Corp. 936 110 Amgen, Inc. 92,832 23,097 Anthem, Inc. 16,819 6,037 Biogen, Inc. (a) 12,771 3,573 Bristol-Myers Squibb Co. 43,969 2,776 Cardinal Health, Inc. 24,984 1,518 DaVita, Inc. (a) 29,881 3,220 Dentsply Sirona, Inc. 1,446 92 Eli Lilly & Co. 1,552 290 Gilead Sciences, Inc. 400,991 25,916 HCA Healthcare, Inc. 30,051 5,660 Henry Schein, Inc. (a) 1,747 121 Humana, Inc. 10,918 4,577 Johnson & Johnson 62,280 10,236 McKesson Corp. 53,311 10,398 Merck & Co., Inc. 98,966 7,629 Pfizer, Inc. 979,290 35,480 UnitedHealth Group, Inc. 4,109 1,529 Universal Health Services, Inc. 'B' 3,995 533 Viatris, Inc. (a) 86,011 1,202 .............................................. 163,910 ______________________
INDUSTRIALS 9.0%
3M Co. 14,318 2,759 AGCO Corp. 10,353 1,487 Alaska Air Group, Inc. 7,830 542 American Airlines Group, Inc. 61,627 1,473 Boeing Co. (a) 3,536 901 Caterpillar, Inc. 9,491 2,201 CH Robinson Worldwide, Inc. 21,117 2,015 CSX Corp. 1,691 163 Cummins, Inc. 6,476 1,678 Delta Air Lines, Inc. (a) 5,746 277 Dover Corp. 833 114 Eaton Corp. PLC 25,651 3,547 Emerson Electric Co. 27,880 2,515 Expeditors International of Washington, Inc. 7,688 828 FedEx Corp. 45,886 13,033 Fluor Corp. 261,157 6,030 General Electric Co. 1,301,914 17,094 Honeywell International, Inc. 7,108 1,543 Howmet Aerospace, Inc. 4,000 129 Illinois Tool Works, Inc. 12,084 2,677 JetBlue Airways Corp. (a) 21,457 436 Johnson Controls International PLC 4,948 295 Lockheed Martin Corp. 500 185 ManpowerGroup, Inc. 49,552 4,901 Neilsen Holdings PLC 56,630 1,424 Norfolk Southern Corp. 1,742 468 Quanta Services, Inc. 5,319 468 Robert Half International, Inc. 4,236 331 Ryder System, Inc. 6,560 496 Southwest Airlines Co. 20,375 1,244 Spirit AeroSystems Holdings, Inc. 'A' 107,472 5,229 Union Pacific Corp. 16,243 3,580 WW Grainger, Inc. 1,829 733 .............................................. 80,796 ______________________
INFORMATION TECHNOLOGY 23.9%
Activision Blizzard, Inc. 46,608 4,334 Alliance Data Systems Corp. 35,914 4,026 Amdocs Ltd. 8,976 630 Apple, Inc. 277,853 33,940 Applied Materials, Inc. 66,323 8,861 Arrow Electronics, Inc. (a) 14,623 1,620 Avnet, Inc. 64,620 2,682 Cisco Systems, Inc. 326,201 16,868 Citrix Systems, Inc. 10,919 1,533 Cognizant Technology Solutions Corp. 'A' 2,754 215 Corning, Inc. 109,882 4,781 Dell Technologies, Inc. 'C' (a) 8,300 732 DXC Technology Co. 182,871 5,717 Electronic Arts, Inc. 16,077 2,176 F5 Networks, Inc. (a) 6,138 1,280 Flex Ltd. (a) 75,308 1,379
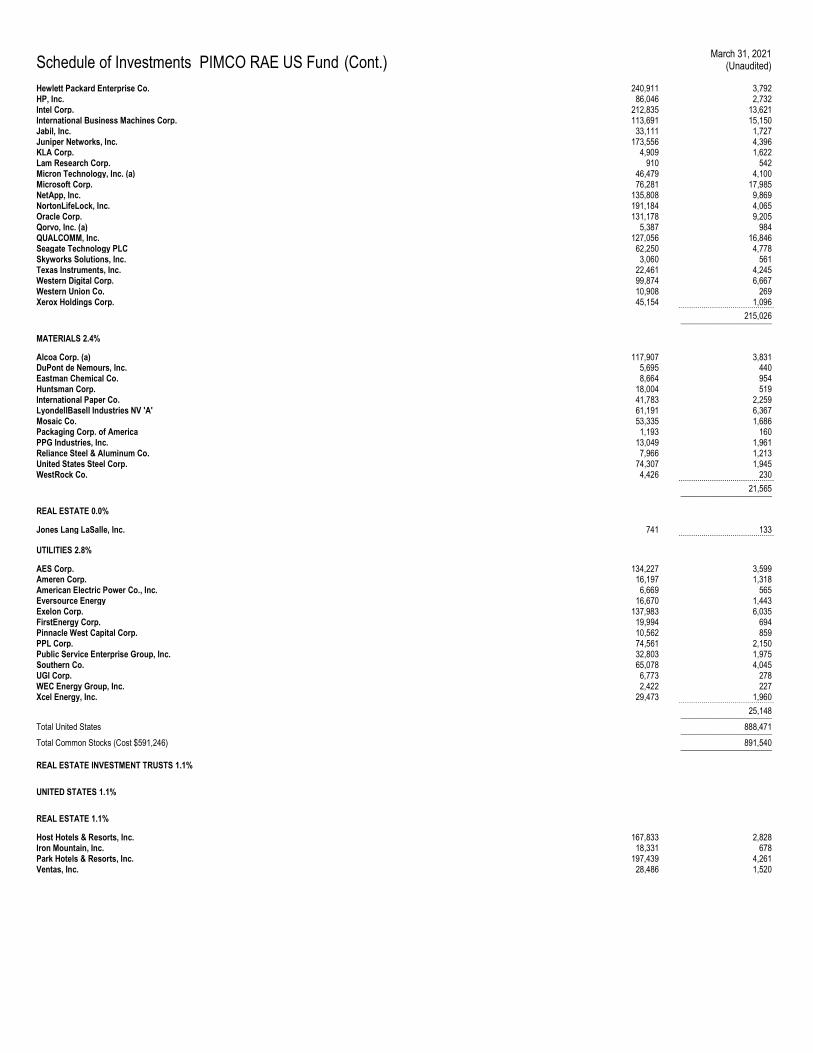
Schedule of Investments PIMCO RAE US Fund (Cont.) March 31, 2021
(Unaudited)
Hewlett Packard Enterprise Co. 240,911 3,792 HP, Inc. 86,046 2,732 Intel Corp. 212,835 13,621 International Business Machines Corp. 113,691 15,150 Jabil, Inc. 33,111 1,727 Juniper Networks, Inc. 173,556 4,396 KLA Corp. 4,909 1,622 Lam Research Corp. 910 542 Micron Technology, Inc. (a) 46,479 4,100 Microsoft Corp. 76,281 17,985 NetApp, Inc. 135,808 9,869 NortonLifeLock, Inc. 191,184 4,065 Oracle Corp. 131,178 9,205 Qorvo, Inc. (a) 5,387 984 QUALCOMM, Inc. 127,056 16,846 Seagate Technology PLC 62,250 4,778 Skyworks Solutions, Inc. 3,060 561 Texas Instruments, Inc. 22,461 4,245 Western Digital Corp. 99,874 6,667 Western Union Co. 10,908 269 Xerox Holdings Corp. 45,154 1,096 .............................................. 215,026 ______________________
MATERIALS 2.4%
Alcoa Corp. (a) 117,907 3,831 DuPont de Nemours, Inc. 5,695 440 Eastman Chemical Co. 8,664 954 Huntsman Corp. 18,004 519 International Paper Co. 41,783 2,259 LyondellBasell Industries NV 'A' 61,191 6,367 Mosaic Co. 53,335 1,686 Packaging Corp. of America 1,193 160 PPG Industries, Inc. 13,049 1,961 Reliance Steel & Aluminum Co. 7,966 1,213 United States Steel Corp. 74,307 1,945 WestRock Co. 4,426 230 .............................................. 21,565 ______________________
REAL ESTATE 0.0%
Jones Lang LaSalle, Inc. 741 133 ..............................................
UTILITIES 2.8%
AES Corp. 134,227 3,599 Ameren Corp. 16,197 1,318 American Electric Power Co., Inc. 6,669 565 Eversource Energy 16,670 1,443 Exelon Corp. 137,983 6,035 FirstEnergy Corp. 19,994 694 Pinnacle West Capital Corp. 10,562 859 PPL Corp. 74,561 2,150 Public Service Enterprise Group, Inc. 32,803 1,975 Southern Co. 65,078 4,045 UGI Corp. 6,773 278 WEC Energy Group, Inc. 2,422 227 Xcel Energy, Inc. 29,473 1,960 .............................................. 25,148 ______________________
Total United States 888,471 ______________________
Total Common Stocks (Cost $591,246) 891,540 ______________________
REAL ESTATE INVESTMENT TRUSTS 1.1%
UNITED STATES 1.1%
REAL ESTATE 1.1%
Host Hotels & Resorts, Inc. 167,833 2,828 Iron Mountain, Inc. 18,331 678 Park Hotels & Resorts, Inc. 197,439 4,261 Ventas, Inc. 28,486 1,520
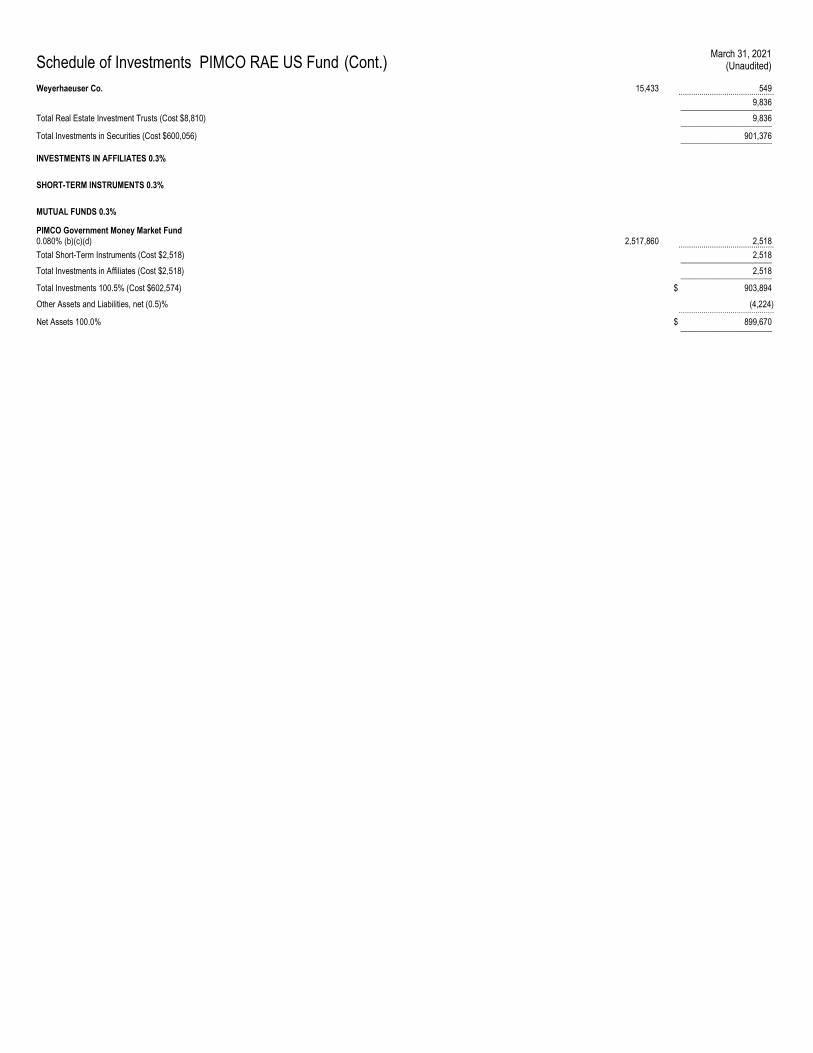
Schedule of Investments PIMCO RAE US Fund (Cont.) March 31, 2021
(Unaudited)
Weyerhaeuser Co. 15,433 549 .............................................. 9,836 ______________________
Total Real Estate Investment Trusts (Cost $8,810) 9,836 ______________________ Total Investments in Securities (Cost $600,056) 901,376 ______________________
INVESTMENTS IN AFFILIATES 0.3%
SHORT-TERM INSTRUMENTS 0.3%
MUTUAL FUNDS 0.3%
PIMCO Government Money Market Fund 0.080% (b)(c)(d) 2,517,860 2,518 .............................................. Total Short-Term Instruments (Cost $2,518) 2,518 ______________________
Total Investments in Affiliates (Cost $2,518) 2,518 ______________________
Total Investments 100.5% (Cost $602,574) $ 903,894
Other Assets and Liabilities, net (0.5)% (4,224) ..............................................
Net Assets 100.0% $ 899,670 ______________________
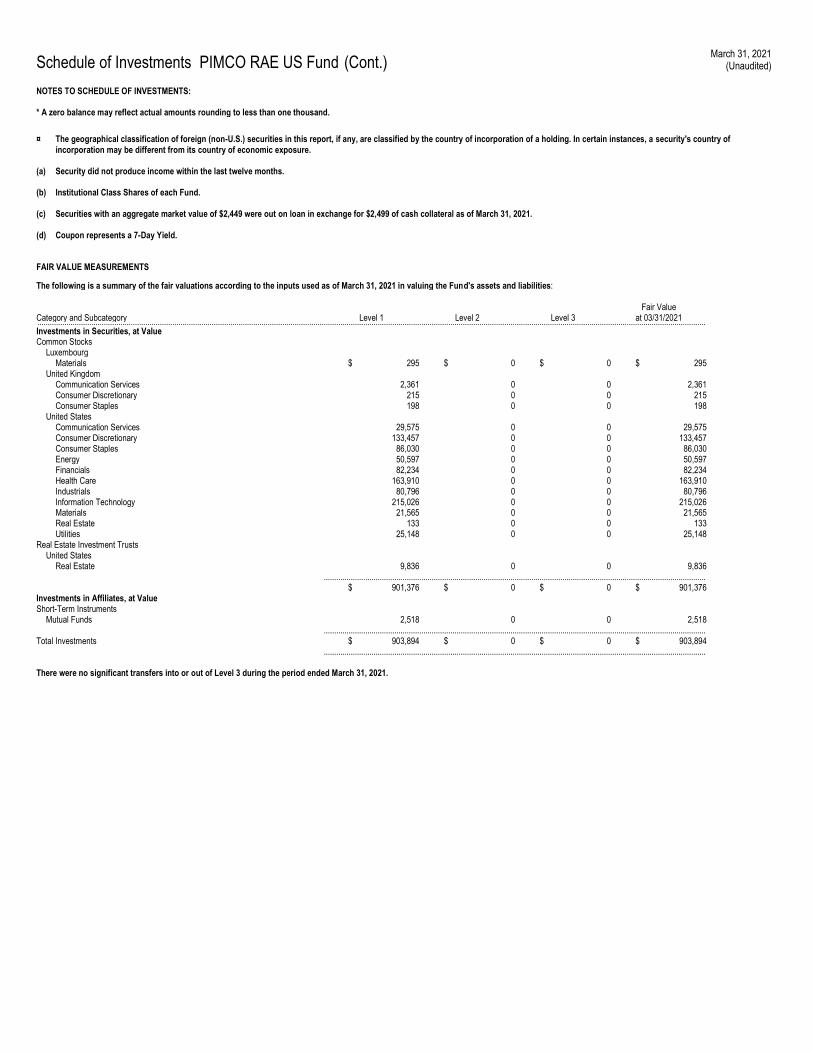
Schedule of Investments PIMCO RAE US Fund (Cont.) March 31, 2021
(Unaudited)
NOTES TO SCHEDULE OF INVESTMENTS: * A zero balance may reflect actual amounts rounding to less than one thousand.
¤ The geographical classification of foreign (non-U.S.) securities in this report, if any, are classified by the country of incorporation of a holding. In certain instances, a security's country of incorporation may be different from its country of economic exposure.
(a) Security did not produce income within the last twelve months.
(b) Institutional Class Shares of each Fund.
(c) Securities with an aggregate market value of $2,449 were out on loan in exchange for $2,499 of cash collateral as of March 31, 2021.
(d) Coupon represents a 7-Day Yield.
FAIR VALUE MEASUREMENTS
The following is a summary of the fair valuations according to the inputs used as of March 31, 2021 in valuing the Fund's assets and liabilities:
Category and Subcategory Level 1 Level 2 Level 3 Fair Value
at 03/31/2021 .................................................................................................................................................................................................................................................................................................................................. Investments in Securities, at Value Common Stocks Luxembourg Materials $ 295 $ 0 $ 0 $ 295 United Kingdom Communication Services 2,361 0 0 2,361 Consumer Discretionary 215 0 0 215 Consumer Staples 198 0 0 198 United States Communication Services 29,575 0 0 29,575 Consumer Discretionary 133,457 0 0 133,457 Consumer Staples 86,030 0 0 86,030 Energy 50,597 0 0 50,597 Financials 82,234 0 0 82,234 Health Care 163,910 0 0 163,910 Industrials 80,796 0 0 80,796 Information Technology 215,026 0 0 215,026 Materials 21,565 0 0 21,565 Real Estate 133 0 0 133 Utilities 25,148 0 0 25,148 Real Estate Investment Trusts United States Real Estate 9,836 0 0 9,836 ........................................................................................................................................................................................ $ 901,376 $ 0 $ 0 $ 901,376 Investments in Affiliates, at Value Short-Term Instruments Mutual Funds 2,518 0 0 2,518 ........................................................................................................................................................................................ Total Investments $ 903,894 $ 0 $ 0 $ 903,894 ........................................................................................................................................................................................ There were no significant transfers into or out of Level 3 during the period ended March 31, 2021.
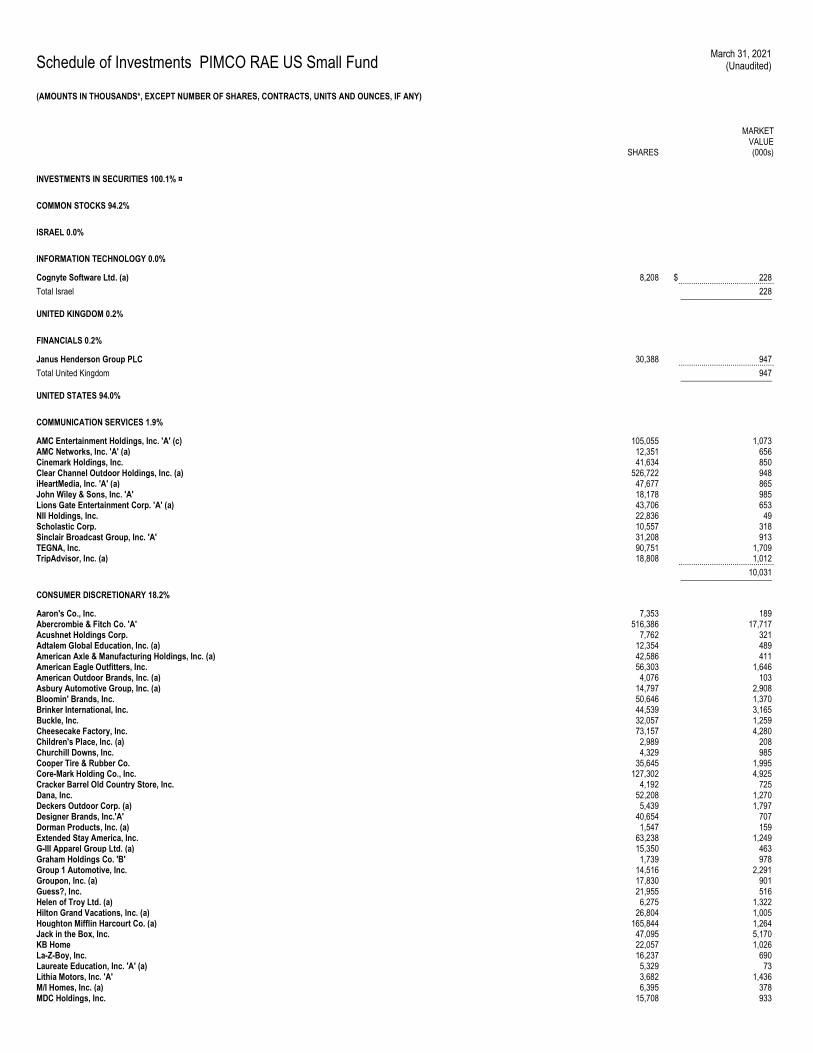
Schedule of Investments PIMCO RAE US Small Fund March 31, 2021
(Unaudited)
(AMOUNTS IN THOUSANDS*, EXCEPT NUMBER OF SHARES, CONTRACTS, UNITS AND OUNCES, IF ANY)
SHARES
MARKET VALUE (000s)
INVESTMENTS IN SECURITIES 100.1% ¤
COMMON STOCKS 94.2%
ISRAEL 0.0%
INFORMATION TECHNOLOGY 0.0%
Cognyte Software Ltd. (a) 8,208 $ 228 .............................................. Total Israel 228 ______________________
UNITED KINGDOM 0.2%
FINANCIALS 0.2%
Janus Henderson Group PLC 30,388 947 .............................................. Total United Kingdom 947 ______________________
UNITED STATES 94.0%
COMMUNICATION SERVICES 1.9%
AMC Entertainment Holdings, Inc. 'A' (c) 105,055 1,073 AMC Networks, Inc. 'A' (a) 12,351 656 Cinemark Holdings, Inc. 41,634 850 Clear Channel Outdoor Holdings, Inc. (a) 526,722 948 iHeartMedia, Inc. 'A' (a) 47,677 865 John Wiley & Sons, Inc. 'A' 18,178 985 Lions Gate Entertainment Corp. 'A' (a) 43,706 653 NII Holdings, Inc. 22,836 49 Scholastic Corp. 10,557 318 Sinclair Broadcast Group, Inc. 'A' 31,208 913 TEGNA, Inc. 90,751 1,709 TripAdvisor, Inc. (a) 18,808 1,012 .............................................. 10,031 ______________________
CONSUMER DISCRETIONARY 18.2%
Aaron's Co., Inc. 7,353 189 Abercrombie & Fitch Co. 'A' 516,386 17,717 Acushnet Holdings Corp. 7,762 321 Adtalem Global Education, Inc. (a) 12,354 489 American Axle & Manufacturing Holdings, Inc. (a) 42,586 411 American Eagle Outfitters, Inc. 56,303 1,646 American Outdoor Brands, Inc. (a) 4,076 103 Asbury Automotive Group, Inc. (a) 14,797 2,908 Bloomin' Brands, Inc. 50,646 1,370 Brinker International, Inc. 44,539 3,165 Buckle, Inc. 32,057 1,259 Cheesecake Factory, Inc. 73,157 4,280 Children's Place, Inc. (a) 2,989 208 Churchill Downs, Inc. 4,329 985 Cooper Tire & Rubber Co. 35,645 1,995 Core-Mark Holding Co., Inc. 127,302 4,925 Cracker Barrel Old Country Store, Inc. 4,192 725 Dana, Inc. 52,208 1,270 Deckers Outdoor Corp. (a) 5,439 1,797 Designer Brands, Inc.'A' 40,654 707 Dorman Products, Inc. (a) 1,547 159 Extended Stay America, Inc. 63,238 1,249 G-III Apparel Group Ltd. (a) 15,350 463 Graham Holdings Co. 'B' 1,739 978 Group 1 Automotive, Inc. 14,516 2,291 Groupon, Inc. (a) 17,830 901 Guess?, Inc. 21,955 516 Helen of Troy Ltd. (a) 6,275 1,322 Hilton Grand Vacations, Inc. (a) 26,804 1,005 Houghton Mifflin Harcourt Co. (a) 165,844 1,264 Jack in the Box, Inc. 47,095 5,170 KB Home 22,057 1,026 La-Z-Boy, Inc. 16,237 690 Laureate Education, Inc. 'A' (a) 5,329 73 Lithia Motors, Inc. 'A' 3,682 1,436 M/I Homes, Inc. (a) 6,395 378 MDC Holdings, Inc. 15,708 933
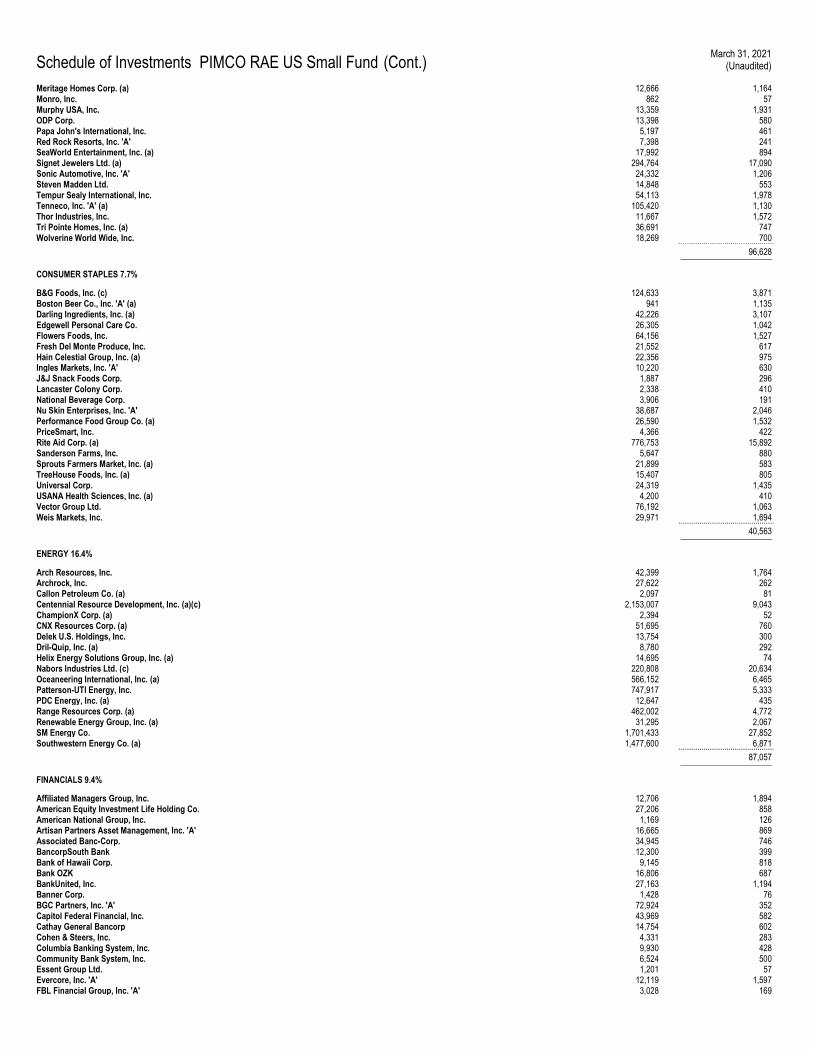
Schedule of Investments PIMCO RAE US Small Fund (Cont.) March 31, 2021
(Unaudited)
Meritage Homes Corp. (a) 12,666 1,164 Monro, Inc. 862 57 Murphy USA, Inc. 13,359 1,931 ODP Corp. 13,398 580 Papa John's International, Inc. 5,197 461 Red Rock Resorts, Inc. 'A' 7,398 241 SeaWorld Entertainment, Inc. (a) 17,992 894 Signet Jewelers Ltd. (a) 294,764 17,090 Sonic Automotive, Inc. 'A' 24,332 1,206 Steven Madden Ltd. 14,848 553 Tempur Sealy International, Inc. 54,113 1,978 Tenneco, Inc. 'A' (a) 105,420 1,130 Thor Industries, Inc. 11,667 1,572 Tri Pointe Homes, Inc. (a) 36,691 747 Wolverine World Wide, Inc. 18,269 700 .............................................. 96,628 ______________________
CONSUMER STAPLES 7.7%
B&G Foods, Inc. (c) 124,633 3,871 Boston Beer Co., Inc. 'A' (a) 941 1,135 Darling Ingredients, Inc. (a) 42,226 3,107 Edgewell Personal Care Co. 26,305 1,042 Flowers Foods, Inc. 64,156 1,527 Fresh Del Monte Produce, Inc. 21,552 617 Hain Celestial Group, Inc. (a) 22,356 975 Ingles Markets, Inc. 'A' 10,220 630 J&J Snack Foods Corp. 1,887 296 Lancaster Colony Corp. 2,338 410 National Beverage Corp. 3,906 191 Nu Skin Enterprises, Inc. 'A' 38,687 2,046 Performance Food Group Co. (a) 26,590 1,532 PriceSmart, Inc. 4,366 422 Rite Aid Corp. (a) 776,753 15,892 Sanderson Farms, Inc. 5,647 880 Sprouts Farmers Market, Inc. (a) 21,899 583 TreeHouse Foods, Inc. (a) 15,407 805 Universal Corp. 24,319 1,435 USANA Health Sciences, Inc. (a) 4,200 410 Vector Group Ltd. 76,192 1,063 Weis Markets, Inc. 29,971 1,694 .............................................. 40,563 ______________________
ENERGY 16.4%
Arch Resources, Inc. 42,399 1,764 Archrock, Inc. 27,622 262 Callon Petroleum Co. (a) 2,097 81 Centennial Resource Development, Inc. (a)(c) 2,153,007 9,043 ChampionX Corp. (a) 2,394 52 CNX Resources Corp. (a) 51,695 760 Delek U.S. Holdings, Inc. 13,754 300 Dril-Quip, Inc. (a) 8,780 292 Helix Energy Solutions Group, Inc. (a) 14,695 74 Nabors Industries Ltd. (c) 220,808 20,634 Oceaneering International, Inc. (a) 566,152 6,465 Patterson-UTI Energy, Inc. 747,917 5,333 PDC Energy, Inc. (a) 12,647 435 Range Resources Corp. (a) 462,002 4,772 Renewable Energy Group, Inc. (a) 31,295 2,067 SM Energy Co. 1,701,433 27,852 Southwestern Energy Co. (a) 1,477,600 6,871 .............................................. 87,057 ______________________
FINANCIALS 9.4%
Affiliated Managers Group, Inc. 12,706 1,894 American Equity Investment Life Holding Co. 27,206 858 American National Group, Inc. 1,169 126 Artisan Partners Asset Management, Inc. 'A' 16,665 869 Associated Banc-Corp. 34,945 746 BancorpSouth Bank 12,300 399 Bank of Hawaii Corp. 9,145 818 Bank OZK 16,806 687 BankUnited, Inc. 27,163 1,194 Banner Corp. 1,428 76 BGC Partners, Inc. 'A' 72,924 352 Capitol Federal Financial, Inc. 43,969 582 Cathay General Bancorp 14,754 602 Cohen & Steers, Inc. 4,331 283 Columbia Banking System, Inc. 9,930 428 Community Bank System, Inc. 6,524 500 Essent Group Ltd. 1,201 57 Evercore, Inc. 'A' 12,119 1,597 FBL Financial Group, Inc. 'A' 3,028 169
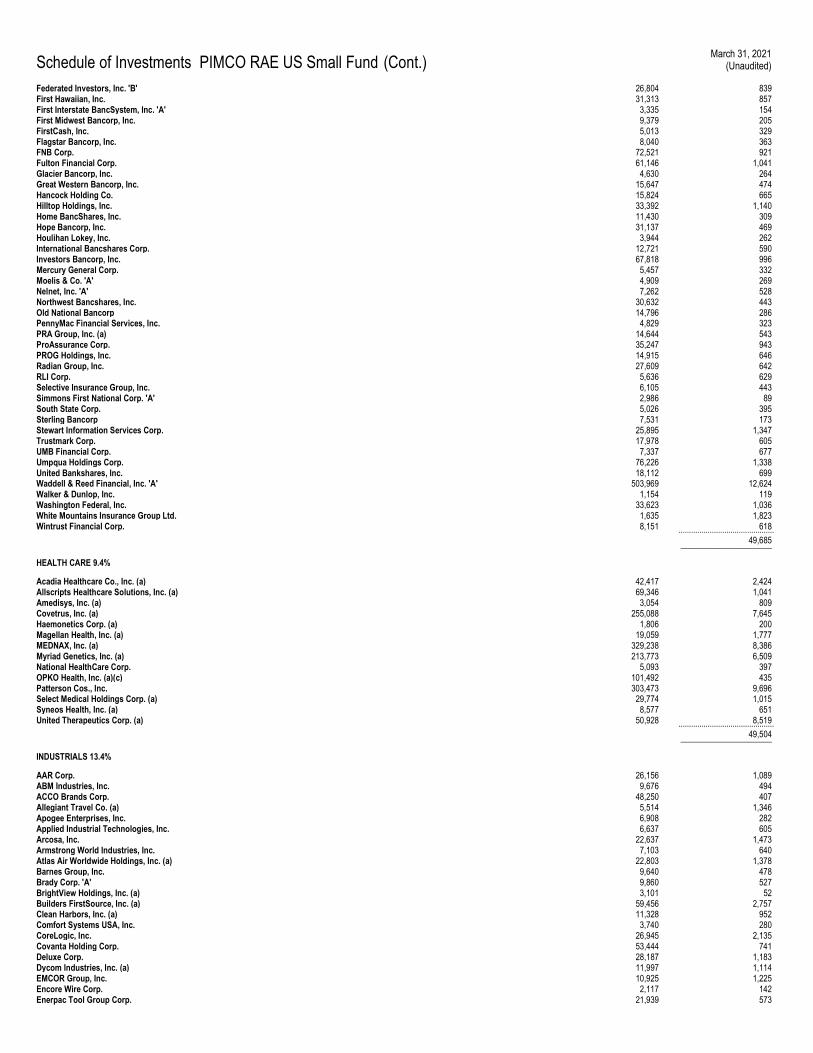
Schedule of Investments PIMCO RAE US Small Fund (Cont.) March 31, 2021
(Unaudited)
Federated Investors, Inc. 'B' 26,804 839 First Hawaiian, Inc. 31,313 857 First Interstate BancSystem, Inc. 'A' 3,335 154 First Midwest Bancorp, Inc. 9,379 205 FirstCash, Inc. 5,013 329 Flagstar Bancorp, Inc. 8,040 363 FNB Corp. 72,521 921 Fulton Financial Corp. 61,146 1,041 Glacier Bancorp, Inc. 4,630 264 Great Western Bancorp, Inc. 15,647 474 Hancock Holding Co. 15,824 665 Hilltop Holdings, Inc. 33,392 1,140 Home BancShares, Inc. 11,430 309 Hope Bancorp, Inc. 31,137 469 Houlihan Lokey, Inc. 3,944 262 International Bancshares Corp. 12,721 590 Investors Bancorp, Inc. 67,818 996 Mercury General Corp. 5,457 332 Moelis & Co. 'A' 4,909 269 Nelnet, Inc. 'A' 7,262 528 Northwest Bancshares, Inc. 30,632 443 Old National Bancorp 14,796 286 PennyMac Financial Services, Inc. 4,829 323 PRA Group, Inc. (a) 14,644 543 ProAssurance Corp. 35,247 943 PROG Holdings, Inc. 14,915 646 Radian Group, Inc. 27,609 642 RLI Corp. 5,636 629 Selective Insurance Group, Inc. 6,105 443 Simmons First National Corp. 'A' 2,986 89 South State Corp. 5,026 395 Sterling Bancorp 7,531 173 Stewart Information Services Corp. 25,895 1,347 Trustmark Corp. 17,978 605 UMB Financial Corp. 7,337 677 Umpqua Holdings Corp. 76,226 1,338 United Bankshares, Inc. 18,112 699 Waddell & Reed Financial, Inc. 'A' 503,969 12,624 Walker & Dunlop, Inc. 1,154 119 Washington Federal, Inc. 33,623 1,036 White Mountains Insurance Group Ltd. 1,635 1,823 Wintrust Financial Corp. 8,151 618 .............................................. 49,685 ______________________
HEALTH CARE 9.4%
Acadia Healthcare Co., Inc. (a) 42,417 2,424 Allscripts Healthcare Solutions, Inc. (a) 69,346 1,041 Amedisys, Inc. (a) 3,054 809 Covetrus, Inc. (a) 255,088 7,645 Haemonetics Corp. (a) 1,806 200 Magellan Health, Inc. (a) 19,059 1,777 MEDNAX, Inc. (a) 329,238 8,386 Myriad Genetics, Inc. (a) 213,773 6,509 National HealthCare Corp. 5,093 397 OPKO Health, Inc. (a)(c) 101,492 435 Patterson Cos., Inc. 303,473 9,696 Select Medical Holdings Corp. (a) 29,774 1,015 Syneos Health, Inc. (a) 8,577 651 United Therapeutics Corp. (a) 50,928 8,519 .............................................. 49,504 ______________________
INDUSTRIALS 13.4%
AAR Corp. 26,156 1,089 ABM Industries, Inc. 9,676 494 ACCO Brands Corp. 48,250 407 Allegiant Travel Co. (a) 5,514 1,346 Apogee Enterprises, Inc. 6,908 282 Applied Industrial Technologies, Inc. 6,637 605 Arcosa, Inc. 22,637 1,473 Armstrong World Industries, Inc. 7,103 640 Atlas Air Worldwide Holdings, Inc. (a) 22,803 1,378 Barnes Group, Inc. 9,640 478 Brady Corp. 'A' 9,860 527 BrightView Holdings, Inc. (a) 3,101 52 Builders FirstSource, Inc. (a) 59,456 2,757 Clean Harbors, Inc. (a) 11,328 952 Comfort Systems USA, Inc. 3,740 280 CoreLogic, Inc. 26,945 2,135 Covanta Holding Corp. 53,444 741 Deluxe Corp. 28,187 1,183 Dycom Industries, Inc. (a) 11,997 1,114 EMCOR Group, Inc. 10,925 1,225 Encore Wire Corp. 2,117 142 Enerpac Tool Group Corp. 21,939 573
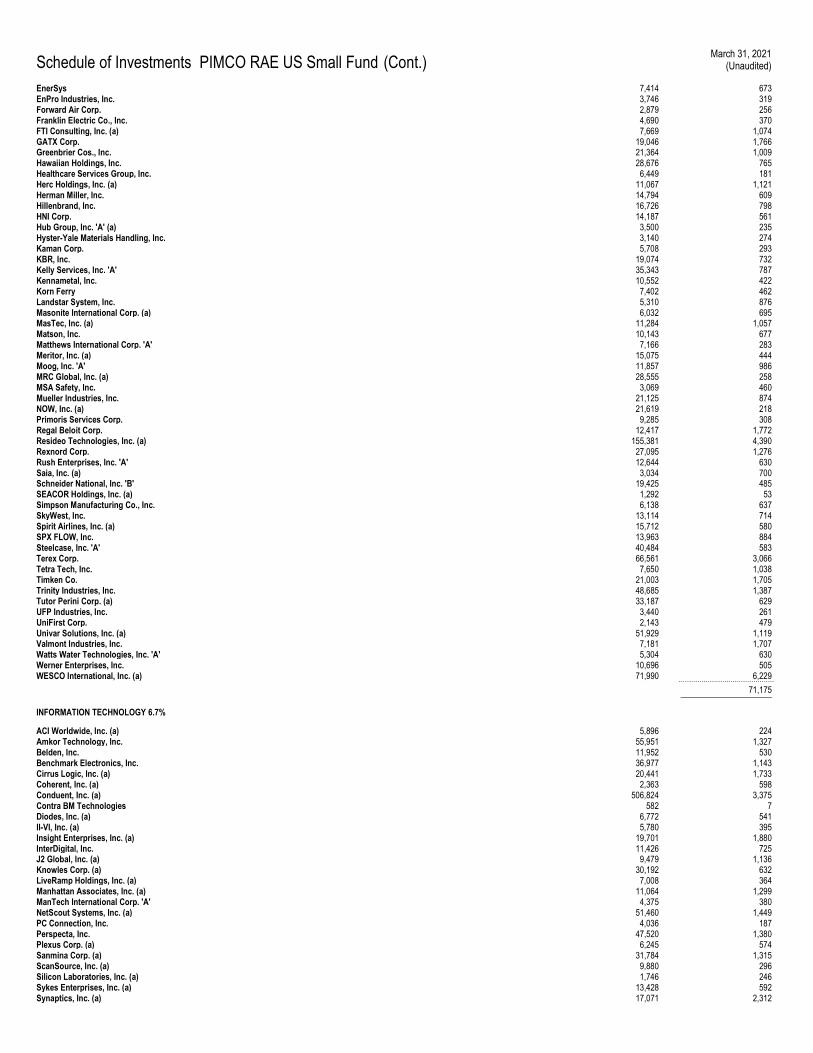
Schedule of Investments PIMCO RAE US Small Fund (Cont.) March 31, 2021
(Unaudited)
EnerSys 7,414 673 EnPro Industries, Inc. 3,746 319 Forward Air Corp. 2,879 256 Franklin Electric Co., Inc. 4,690 370 FTI Consulting, Inc. (a) 7,669 1,074 GATX Corp. 19,046 1,766 Greenbrier Cos., Inc. 21,364 1,009 Hawaiian Holdings, Inc. 28,676 765 Healthcare Services Group, Inc. 6,449 181 Herc Holdings, Inc. (a) 11,067 1,121 Herman Miller, Inc. 14,794 609 Hillenbrand, Inc. 16,726 798 HNI Corp. 14,187 561 Hub Group, Inc. 'A' (a) 3,500 235 Hyster-Yale Materials Handling, Inc. 3,140 274 Kaman Corp. 5,708 293 KBR, Inc. 19,074 732 Kelly Services, Inc. 'A' 35,343 787 Kennametal, Inc. 10,552 422 Korn Ferry 7,402 462 Landstar System, Inc. 5,310 876 Masonite International Corp. (a) 6,032 695 MasTec, Inc. (a) 11,284 1,057 Matson, Inc. 10,143 677 Matthews International Corp. 'A' 7,166 283 Meritor, Inc. (a) 15,075 444 Moog, Inc. 'A' 11,857 986 MRC Global, Inc. (a) 28,555 258 MSA Safety, Inc. 3,069 460 Mueller Industries, Inc. 21,125 874 NOW, Inc. (a) 21,619 218 Primoris Services Corp. 9,285 308 Regal Beloit Corp. 12,417 1,772 Resideo Technologies, Inc. (a) 155,381 4,390 Rexnord Corp. 27,095 1,276 Rush Enterprises, Inc. 'A' 12,644 630 Saia, Inc. (a) 3,034 700 Schneider National, Inc. 'B' 19,425 485 SEACOR Holdings, Inc. (a) 1,292 53 Simpson Manufacturing Co., Inc. 6,138 637 SkyWest, Inc. 13,114 714 Spirit Airlines, Inc. (a) 15,712 580 SPX FLOW, Inc. 13,963 884 Steelcase, Inc. 'A' 40,484 583 Terex Corp. 66,561 3,066 Tetra Tech, Inc. 7,650 1,038 Timken Co. 21,003 1,705 Trinity Industries, Inc. 48,685 1,387 Tutor Perini Corp. (a) 33,187 629 UFP Industries, Inc. 3,440 261 UniFirst Corp. 2,143 479 Univar Solutions, Inc. (a) 51,929 1,119 Valmont Industries, Inc. 7,181 1,707 Watts Water Technologies, Inc. 'A' 5,304 630 Werner Enterprises, Inc. 10,696 505 WESCO International, Inc. (a) 71,990 6,229 .............................................. 71,175 ______________________
INFORMATION TECHNOLOGY 6.7%
ACI Worldwide, Inc. (a) 5,896 224 Amkor Technology, Inc. 55,951 1,327 Belden, Inc. 11,952 530 Benchmark Electronics, Inc. 36,977 1,143 Cirrus Logic, Inc. (a) 20,441 1,733 Coherent, Inc. (a) 2,363 598 Conduent, Inc. (a) 506,824 3,375 Contra BM Technologies 582 7 Diodes, Inc. (a) 6,772 541 II-VI, Inc. (a) 5,780 395 Insight Enterprises, Inc. (a) 19,701 1,880 InterDigital, Inc. 11,426 725 J2 Global, Inc. (a) 9,479 1,136 Knowles Corp. (a) 30,192 632 LiveRamp Holdings, Inc. (a) 7,008 364 Manhattan Associates, Inc. (a) 11,064 1,299 ManTech International Corp. 'A' 4,375 380 NetScout Systems, Inc. (a) 51,460 1,449 PC Connection, Inc. 4,036 187 Perspecta, Inc. 47,520 1,380 Plexus Corp. (a) 6,245 574 Sanmina Corp. (a) 31,784 1,315 ScanSource, Inc. (a) 9,880 296 Silicon Laboratories, Inc. (a) 1,746 246 Sykes Enterprises, Inc. (a) 13,428 592 Synaptics, Inc. (a) 17,071 2,312
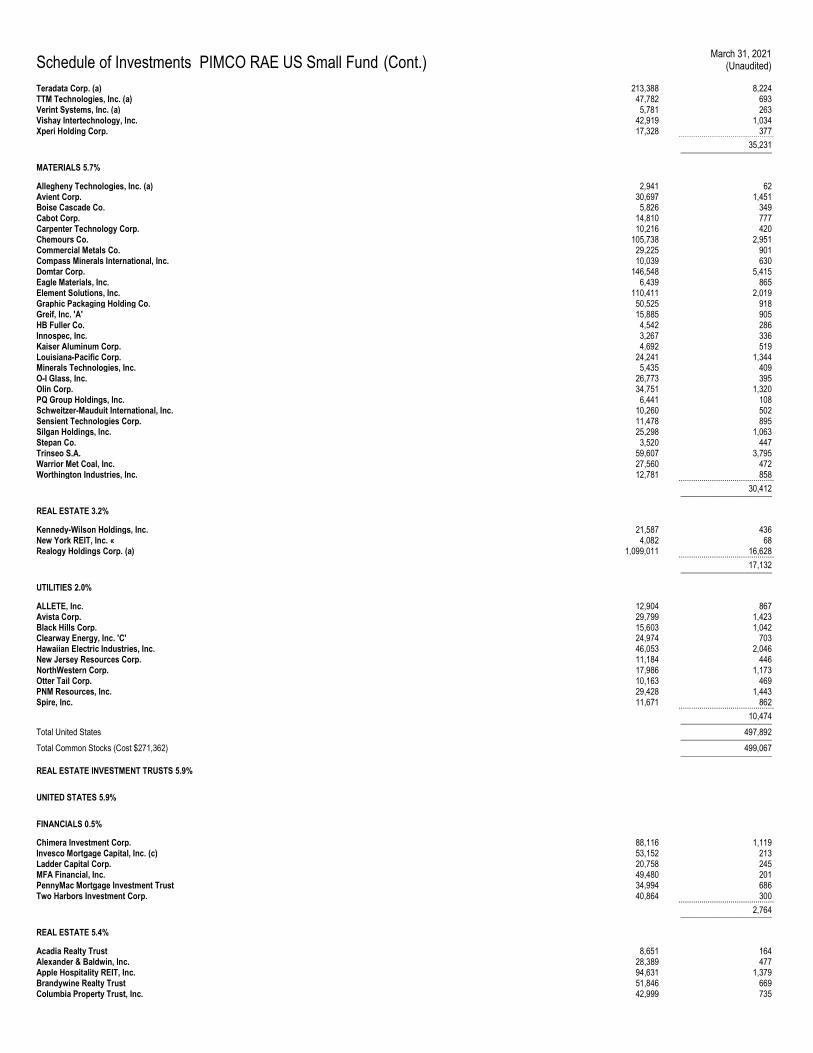
Schedule of Investments PIMCO RAE US Small Fund (Cont.) March 31, 2021
(Unaudited)
Teradata Corp. (a) 213,388 8,224 TTM Technologies, Inc. (a) 47,782 693 Verint Systems, Inc. (a) 5,781 263 Vishay Intertechnology, Inc. 42,919 1,034 Xperi Holding Corp. 17,328 377 .............................................. 35,231 ______________________
MATERIALS 5.7%
Allegheny Technologies, Inc. (a) 2,941 62 Avient Corp. 30,697 1,451 Boise Cascade Co. 5,826 349 Cabot Corp. 14,810 777 Carpenter Technology Corp. 10,216 420 Chemours Co. 105,738 2,951 Commercial Metals Co. 29,225 901 Compass Minerals International, Inc. 10,039 630 Domtar Corp. 146,548 5,415 Eagle Materials, Inc. 6,439 865 Element Solutions, Inc. 110,411 2,019 Graphic Packaging Holding Co. 50,525 918 Greif, Inc. 'A' 15,885 905 HB Fuller Co. 4,542 286 Innospec, Inc. 3,267 336 Kaiser Aluminum Corp. 4,692 519 Louisiana-Pacific Corp. 24,241 1,344 Minerals Technologies, Inc. 5,435 409 O-I Glass, Inc. 26,773 395 Olin Corp. 34,751 1,320 PQ Group Holdings, Inc. 6,441 108 Schweitzer-Mauduit International, Inc. 10,260 502 Sensient Technologies Corp. 11,478 895 Silgan Holdings, Inc. 25,298 1,063 Stepan Co. 3,520 447 Trinseo S.A. 59,607 3,795 Warrior Met Coal, Inc. 27,560 472 Worthington Industries, Inc. 12,781 858 .............................................. 30,412 ______________________
REAL ESTATE 3.2%
Kennedy-Wilson Holdings, Inc. 21,587 436 New York REIT, Inc. « 4,082 68 Realogy Holdings Corp. (a) 1,099,011 16,628 .............................................. 17,132 ______________________
UTILITIES 2.0%
ALLETE, Inc. 12,904 867 Avista Corp. 29,799 1,423 Black Hills Corp. 15,603 1,042 Clearway Energy, Inc. 'C' 24,974 703 Hawaiian Electric Industries, Inc. 46,053 2,046 New Jersey Resources Corp. 11,184 446 NorthWestern Corp. 17,986 1,173 Otter Tail Corp. 10,163 469 PNM Resources, Inc. 29,428 1,443 Spire, Inc. 11,671 862 .............................................. 10,474 ______________________
Total United States 497,892 ______________________
Total Common Stocks (Cost $271,362) 499,067 ______________________
REAL ESTATE INVESTMENT TRUSTS 5.9%
UNITED STATES 5.9%
FINANCIALS 0.5%
Chimera Investment Corp. 88,116 1,119 Invesco Mortgage Capital, Inc. (c) 53,152 213 Ladder Capital Corp. 20,758 245 MFA Financial, Inc. 49,480 201 PennyMac Mortgage Investment Trust 34,994 686 Two Harbors Investment Corp. 40,864 300 .............................................. 2,764 ______________________
REAL ESTATE 5.4%
Acadia Realty Trust 8,651 164 Alexander & Baldwin, Inc. 28,389 477 Apple Hospitality REIT, Inc. 94,631 1,379 Brandywine Realty Trust 51,846 669 Columbia Property Trust, Inc. 42,999 735
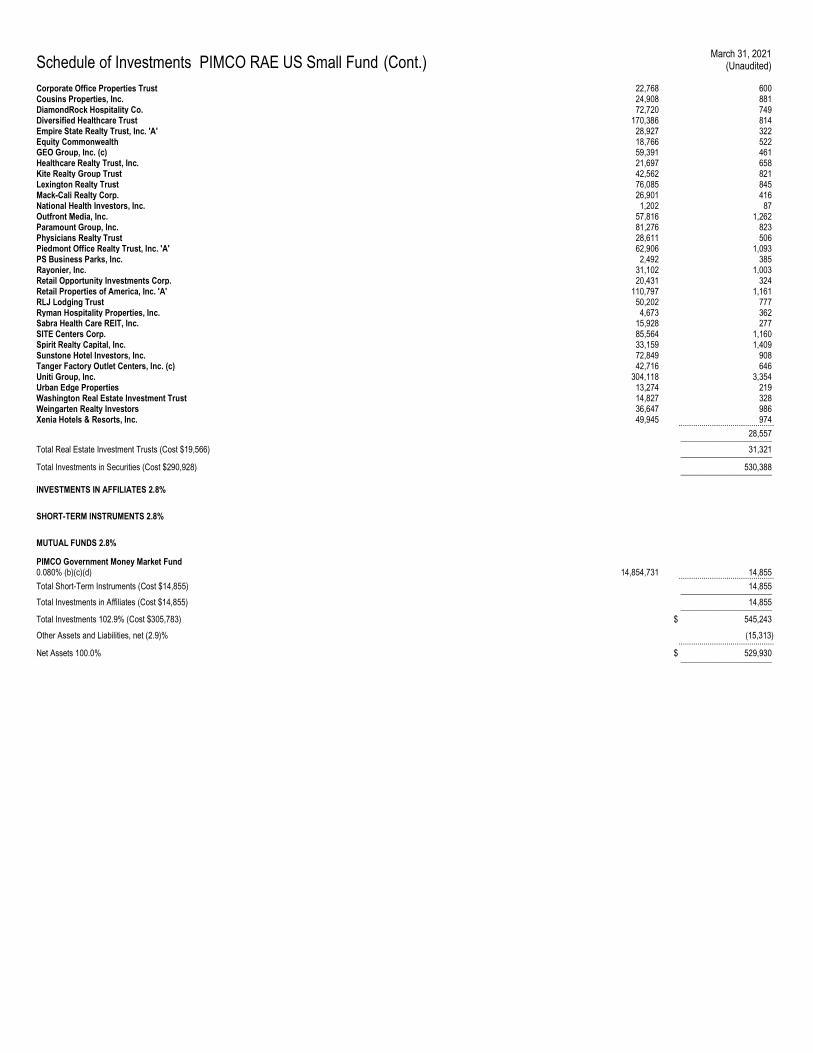
Schedule of Investments PIMCO RAE US Small Fund (Cont.) March 31, 2021
(Unaudited)
Corporate Office Properties Trust 22,768 600 Cousins Properties, Inc. 24,908 881 DiamondRock Hospitality Co. 72,720 749 Diversified Healthcare Trust 170,386 814 Empire State Realty Trust, Inc. 'A' 28,927 322 Equity Commonwealth 18,766 522 GEO Group, Inc. (c) 59,391 461 Healthcare Realty Trust, Inc. 21,697 658 Kite Realty Group Trust 42,562 821 Lexington Realty Trust 76,085 845 Mack-Cali Realty Corp. 26,901 416 National Health Investors, Inc. 1,202 87 Outfront Media, Inc. 57,816 1,262 Paramount Group, Inc. 81,276 823 Physicians Realty Trust 28,611 506 Piedmont Office Realty Trust, Inc. 'A' 62,906 1,093 PS Business Parks, Inc. 2,492 385 Rayonier, Inc. 31,102 1,003 Retail Opportunity Investments Corp. 20,431 324 Retail Properties of America, Inc. 'A' 110,797 1,161 RLJ Lodging Trust 50,202 777 Ryman Hospitality Properties, Inc. 4,673 362 Sabra Health Care REIT, Inc. 15,928 277 SITE Centers Corp. 85,564 1,160 Spirit Realty Capital, Inc. 33,159 1,409 Sunstone Hotel Investors, Inc. 72,849 908 Tanger Factory Outlet Centers, Inc. (c) 42,716 646 Uniti Group, Inc. 304,118 3,354 Urban Edge Properties 13,274 219 Washington Real Estate Investment Trust 14,827 328 Weingarten Realty Investors 36,647 986 Xenia Hotels & Resorts, Inc. 49,945 974 .............................................. 28,557 ______________________
Total Real Estate Investment Trusts (Cost $19,566) 31,321 ______________________ Total Investments in Securities (Cost $290,928) 530,388 ______________________
INVESTMENTS IN AFFILIATES 2.8%
SHORT-TERM INSTRUMENTS 2.8%
MUTUAL FUNDS 2.8%
PIMCO Government Money Market Fund 0.080% (b)(c)(d) 14,854,731 14,855 .............................................. Total Short-Term Instruments (Cost $14,855) 14,855 ______________________
Total Investments in Affiliates (Cost $14,855) 14,855 ______________________
Total Investments 102.9% (Cost $305,783) $ 545,243
Other Assets and Liabilities, net (2.9)% (15,313) ..............................................
Net Assets 100.0% $ 529,930 ______________________
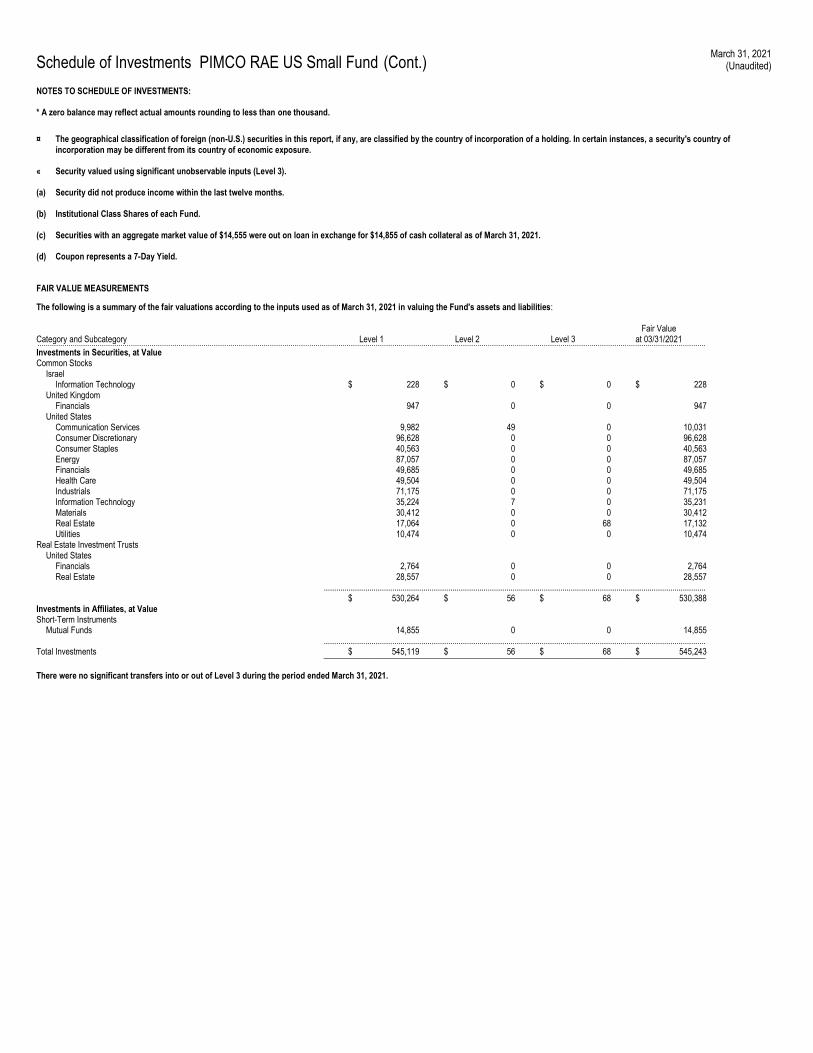
Schedule of Investments PIMCO RAE US Small Fund (Cont.) March 31, 2021
(Unaudited)
NOTES TO SCHEDULE OF INVESTMENTS: * A zero balance may reflect actual amounts rounding to less than one thousand.
¤ The geographical classification of foreign (non-U.S.) securities in this report, if any, are classified by the country of incorporation of a holding. In certain instances, a security's country of incorporation may be different from its country of economic exposure.
« Security valued using significant unobservable inputs (Level 3).
(a) Security did not produce income within the last twelve months.
(b) Institutional Class Shares of each Fund.
(c) Securities with an aggregate market value of $14,555 were out on loan in exchange for $14,855 of cash collateral as of March 31, 2021.
(d) Coupon represents a 7-Day Yield.
FAIR VALUE MEASUREMENTS
The following is a summary of the fair valuations according to the inputs used as of March 31, 2021 in valuing the Fund's assets and liabilities:
Category and Subcategory Level 1 Level 2 Level 3 Fair Value
at 03/31/2021 .................................................................................................................................................................................................................................................................................................................................. Investments in Securities, at Value Common Stocks Israel Information Technology $ 228 $ 0 $ 0 $ 228 United Kingdom Financials 947 0 0 947 United States Communication Services 9,982 49 0 10,031 Consumer Discretionary 96,628 0 0 96,628 Consumer Staples 40,563 0 0 40,563 Energy 87,057 0 0 87,057 Financials 49,685 0 0 49,685 Health Care 49,504 0 0 49,504 Industrials 71,175 0 0 71,175 Information Technology 35,224 7 0 35,231 Materials 30,412 0 0 30,412 Real Estate 17,064 0 68 17,132 Utilities 10,474 0 0 10,474 Real Estate Investment Trusts United States Financials 2,764 0 0 2,764 Real Estate 28,557 0 0 28,557 ........................................................................................................................................................................................ $ 530,264 $ 56 $ 68 $ 530,388 Investments in Affiliates, at Value Short-Term Instruments Mutual Funds 14,855 0 0 14,855 ........................................................................................................................................................................................ Total Investments $ 545,119 $ 56 $ 68 $ 545,243 ____________________________________________________________________________________________ There were no significant transfers into or out of Level 3 during the period ended March 31, 2021.
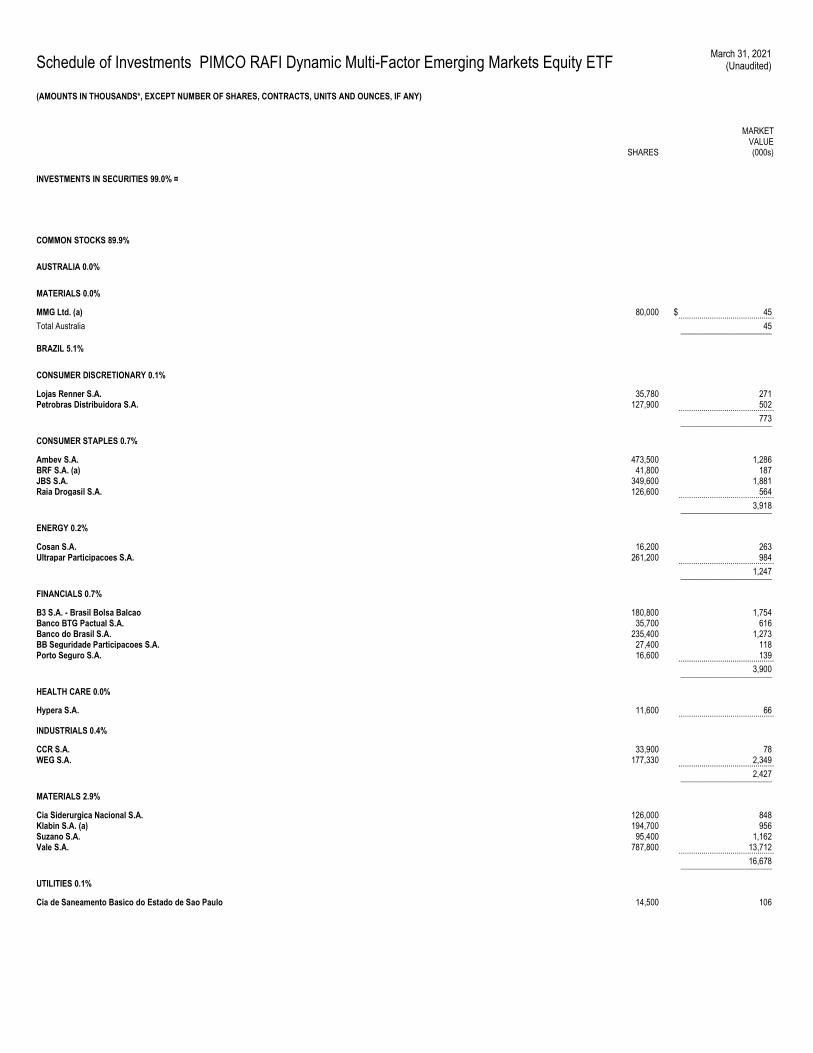
Schedule of Investments PIMCO RAFI Dynamic Multi-Factor Emerging Markets Equity ETF March 31, 2021
(Unaudited)
(AMOUNTS IN THOUSANDS*, EXCEPT NUMBER OF SHARES, CONTRACTS, UNITS AND OUNCES, IF ANY)
SHARES
MARKET VALUE (000s)
INVESTMENTS IN SECURITIES 99.0% ¤
COMMON STOCKS 89.9%
AUSTRALIA 0.0%
MATERIALS 0.0%
MMG Ltd. (a) 80,000 $ 45 .............................................. Total Australia 45 ______________________
BRAZIL 5.1%
CONSUMER DISCRETIONARY 0.1%
Lojas Renner S.A. 35,780 271 Petrobras Distribuidora S.A. 127,900 502 .............................................. 773 ______________________
CONSUMER STAPLES 0.7%
Ambev S.A. 473,500 1,286 BRF S.A. (a) 41,800 187 JBS S.A. 349,600 1,881 Raia Drogasil S.A. 126,600 564 .............................................. 3,918 ______________________
ENERGY 0.2%
Cosan S.A. 16,200 263 Ultrapar Participacoes S.A. 261,200 984 .............................................. 1,247 ______________________
FINANCIALS 0.7%
B3 S.A. - Brasil Bolsa Balcao 180,800 1,754 Banco BTG Pactual S.A. 35,700 616 Banco do Brasil S.A. 235,400 1,273 BB Seguridade Participacoes S.A. 27,400 118 Porto Seguro S.A. 16,600 139 .............................................. 3,900 ______________________
HEALTH CARE 0.0%
Hypera S.A. 11,600 66 ..............................................
INDUSTRIALS 0.4%
CCR S.A. 33,900 78 WEG S.A. 177,330 2,349 .............................................. 2,427 ______________________
MATERIALS 2.9%
Cia Siderurgica Nacional S.A. 126,000 848 Klabin S.A. (a) 194,700 956 Suzano S.A. 95,400 1,162 Vale S.A. 787,800 13,712 .............................................. 16,678 ______________________
UTILITIES 0.1%
Cia de Saneamento Basico do Estado de Sao Paulo 14,500 106
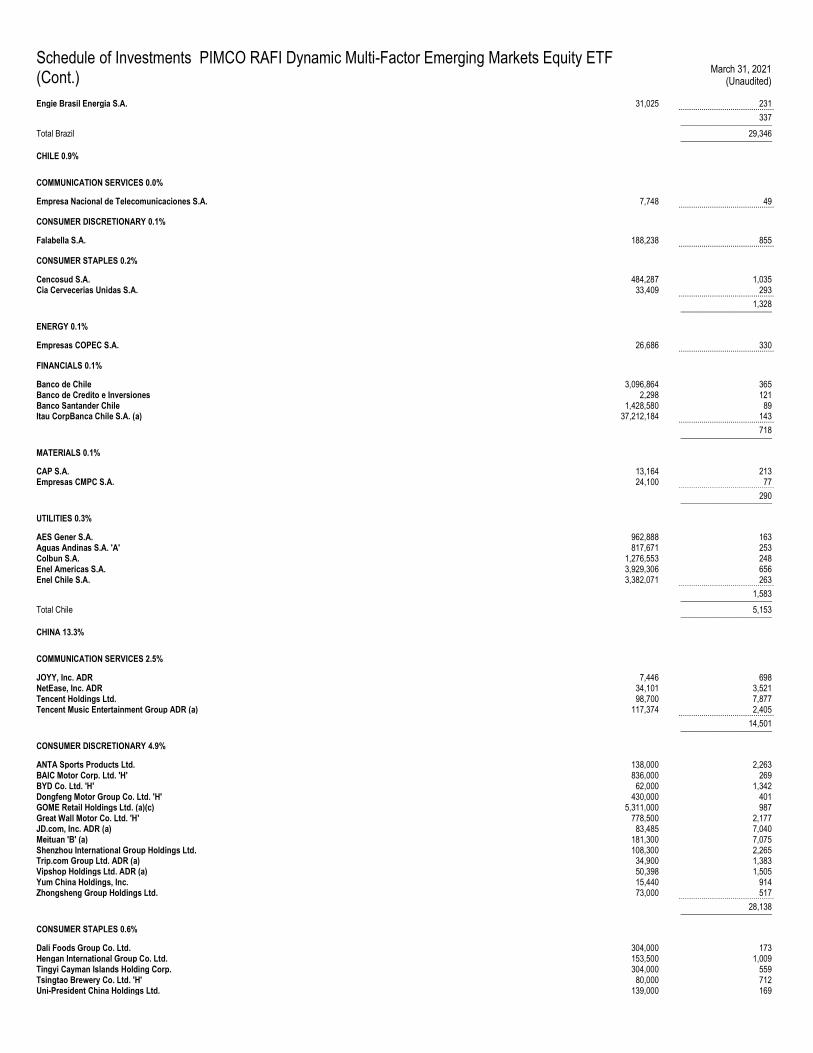
Schedule of Investments PIMCO RAFI Dynamic Multi-Factor Emerging Markets Equity ETF
(Cont.) March 31, 2021
(Unaudited)
Engie Brasil Energia S.A. 31,025 231 .............................................. 337 ______________________
Total Brazil 29,346 ______________________
CHILE 0.9%
COMMUNICATION SERVICES 0.0%
Empresa Nacional de Telecomunicaciones S.A. 7,748 49 ..............................................
CONSUMER DISCRETIONARY 0.1%
Falabella S.A. 188,238 855 ..............................................
CONSUMER STAPLES 0.2%
Cencosud S.A. 484,287 1,035 Cia Cervecerias Unidas S.A. 33,409 293 .............................................. 1,328 ______________________
ENERGY 0.1%
Empresas COPEC S.A. 26,686 330 ..............................................
FINANCIALS 0.1%
Banco de Chile 3,096,864 365 Banco de Credito e Inversiones 2,298 121 Banco Santander Chile 1,428,580 89 Itau CorpBanca Chile S.A. (a) 37,212,184 143 .............................................. 718 ______________________
MATERIALS 0.1%
CAP S.A. 13,164 213 Empresas CMPC S.A. 24,100 77 .............................................. 290 ______________________
UTILITIES 0.3%
AES Gener S.A. 962,888 163 Aguas Andinas S.A. 'A' 817,671 253 Colbun S.A. 1,276,553 248 Enel Americas S.A. 3,929,306 656 Enel Chile S.A. 3,382,071 263 .............................................. 1,583 ______________________
Total Chile 5,153 ______________________
CHINA 13.3%
COMMUNICATION SERVICES 2.5%
JOYY, Inc. ADR 7,446 698 NetEase, Inc. ADR 34,101 3,521 Tencent Holdings Ltd. 98,700 7,877 Tencent Music Entertainment Group ADR (a) 117,374 2,405 .............................................. 14,501 ______________________
CONSUMER DISCRETIONARY 4.9%
ANTA Sports Products Ltd. 138,000 2,263 BAIC Motor Corp. Ltd. 'H' 836,000 269 BYD Co. Ltd. 'H' 62,000 1,342 Dongfeng Motor Group Co. Ltd. 'H' 430,000 401 GOME Retail Holdings Ltd. (a)(c) 5,311,000 987 Great Wall Motor Co. Ltd. 'H' 778,500 2,177 JD.com, Inc. ADR (a) 83,485 7,040 Meituan 'B' (a) 181,300 7,075 Shenzhou International Group Holdings Ltd. 108,300 2,265 Trip.com Group Ltd. ADR (a) 34,900 1,383 Vipshop Holdings Ltd. ADR (a) 50,398 1,505 Yum China Holdings, Inc. 15,440 914 Zhongsheng Group Holdings Ltd. 73,000 517 .............................................. 28,138 ______________________
CONSUMER STAPLES 0.6%
Dali Foods Group Co. Ltd. 304,000 173 Hengan International Group Co. Ltd. 153,500 1,009 Tingyi Cayman Islands Holding Corp. 304,000 559 Tsingtao Brewery Co. Ltd. 'H' 80,000 712 Uni-President China Holdings Ltd. 139,000 169
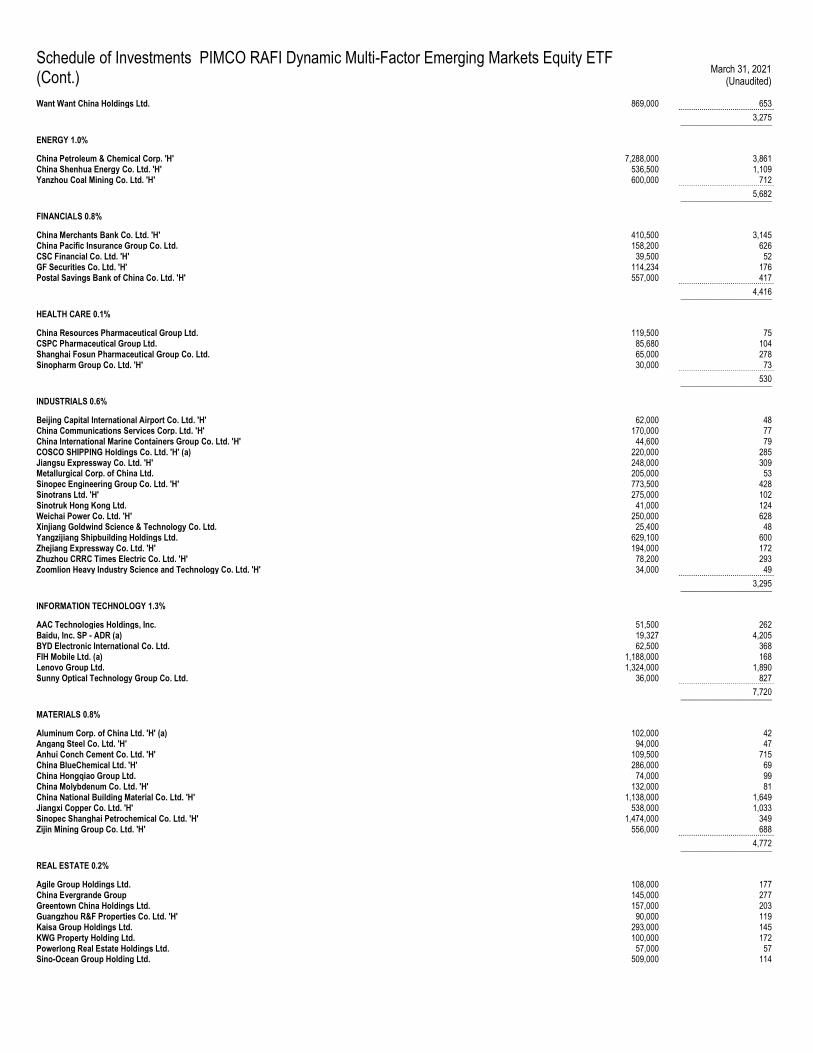
Schedule of Investments PIMCO RAFI Dynamic Multi-Factor Emerging Markets Equity ETF
(Cont.) March 31, 2021
(Unaudited)
Want Want China Holdings Ltd. 869,000 653 .............................................. 3,275 ______________________
ENERGY 1.0%
China Petroleum & Chemical Corp. 'H' 7,288,000 3,861 China Shenhua Energy Co. Ltd. 'H' 536,500 1,109 Yanzhou Coal Mining Co. Ltd. 'H' 600,000 712 .............................................. 5,682 ______________________
FINANCIALS 0.8%
China Merchants Bank Co. Ltd. 'H' 410,500 3,145 China Pacific Insurance Group Co. Ltd. 158,200 626 CSC Financial Co. Ltd. 'H' 39,500 52 GF Securities Co. Ltd. 'H' 114,234 176 Postal Savings Bank of China Co. Ltd. 'H' 557,000 417 .............................................. 4,416 ______________________
HEALTH CARE 0.1%
China Resources Pharmaceutical Group Ltd. 119,500 75 CSPC Pharmaceutical Group Ltd. 85,680 104 Shanghai Fosun Pharmaceutical Group Co. Ltd. 65,000 278 Sinopharm Group Co. Ltd. 'H' 30,000 73 .............................................. 530 ______________________
INDUSTRIALS 0.6%
Beijing Capital International Airport Co. Ltd. 'H' 62,000 48 China Communications Services Corp. Ltd. 'H' 170,000 77 China International Marine Containers Group Co. Ltd. 'H' 44,600 79 COSCO SHIPPING Holdings Co. Ltd. 'H' (a) 220,000 285 Jiangsu Expressway Co. Ltd. 'H' 248,000 309 Metallurgical Corp. of China Ltd. 205,000 53 Sinopec Engineering Group Co. Ltd. 'H' 773,500 428 Sinotrans Ltd. 'H' 275,000 102 Sinotruk Hong Kong Ltd. 41,000 124 Weichai Power Co. Ltd. 'H' 250,000 628 Xinjiang Goldwind Science & Technology Co. Ltd. 25,400 48 Yangzijiang Shipbuilding Holdings Ltd. 629,100 600 Zhejiang Expressway Co. Ltd. 'H' 194,000 172 Zhuzhou CRRC Times Electric Co. Ltd. 'H' 78,200 293 Zoomlion Heavy Industry Science and Technology Co. Ltd. 'H' 34,000 49 .............................................. 3,295 ______________________
INFORMATION TECHNOLOGY 1.3%
AAC Technologies Holdings, Inc. 51,500 262 Baidu, Inc. SP - ADR (a) 19,327 4,205 BYD Electronic International Co. Ltd. 62,500 368 FIH Mobile Ltd. (a) 1,188,000 168 Lenovo Group Ltd. 1,324,000 1,890 Sunny Optical Technology Group Co. Ltd. 36,000 827 .............................................. 7,720 ______________________
MATERIALS 0.8%
Aluminum Corp. of China Ltd. 'H' (a) 102,000 42 Angang Steel Co. Ltd. 'H' 94,000 47 Anhui Conch Cement Co. Ltd. 'H' 109,500 715 China BlueChemical Ltd. 'H' 286,000 69 China Hongqiao Group Ltd. 74,000 99 China Molybdenum Co. Ltd. 'H' 132,000 81 China National Building Material Co. Ltd. 'H' 1,138,000 1,649 Jiangxi Copper Co. Ltd. 'H' 538,000 1,033 Sinopec Shanghai Petrochemical Co. Ltd. 'H' 1,474,000 349 Zijin Mining Group Co. Ltd. 'H' 556,000 688 .............................................. 4,772 ______________________
REAL ESTATE 0.2%
Agile Group Holdings Ltd. 108,000 177 China Evergrande Group 145,000 277 Greentown China Holdings Ltd. 157,000 203 Guangzhou R&F Properties Co. Ltd. 'H' 90,000 119 Kaisa Group Holdings Ltd. 293,000 145 KWG Property Holding Ltd. 100,000 172 Powerlong Real Estate Holdings Ltd. 57,000 57 Sino-Ocean Group Holding Ltd. 509,000 114
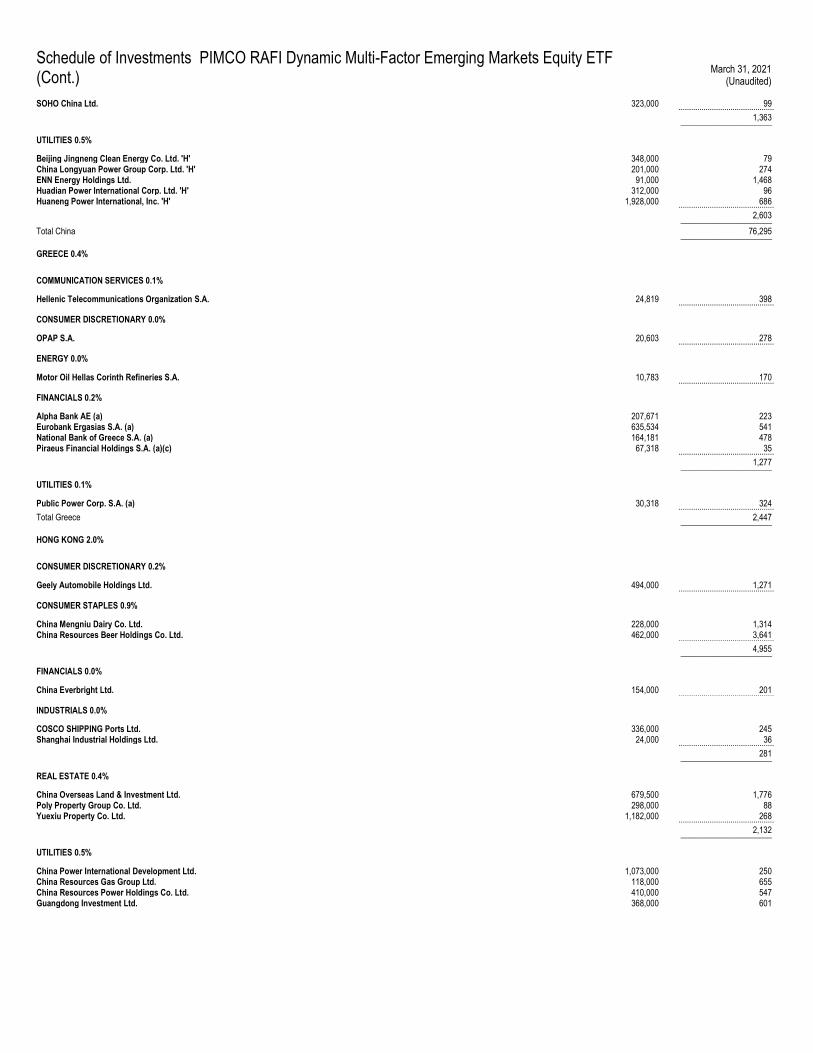
Schedule of Investments PIMCO RAFI Dynamic Multi-Factor Emerging Markets Equity ETF
(Cont.) March 31, 2021
(Unaudited)
SOHO China Ltd. 323,000 99 .............................................. 1,363 ______________________
UTILITIES 0.5%
Beijing Jingneng Clean Energy Co. Ltd. 'H' 348,000 79 China Longyuan Power Group Corp. Ltd. 'H' 201,000 274 ENN Energy Holdings Ltd. 91,000 1,468 Huadian Power International Corp. Ltd. 'H' 312,000 96 Huaneng Power International, Inc. 'H' 1,928,000 686 .............................................. 2,603 ______________________
Total China 76,295 ______________________
GREECE 0.4%
COMMUNICATION SERVICES 0.1%
Hellenic Telecommunications Organization S.A. 24,819 398 ..............................................
CONSUMER DISCRETIONARY 0.0%
OPAP S.A. 20,603 278 ..............................................
ENERGY 0.0%
Motor Oil Hellas Corinth Refineries S.A. 10,783 170 ..............................................
FINANCIALS 0.2%
Alpha Bank AE (a) 207,671 223 Eurobank Ergasias S.A. (a) 635,534 541 National Bank of Greece S.A. (a) 164,181 478 Piraeus Financial Holdings S.A. (a)(c) 67,318 35 .............................................. 1,277 ______________________
UTILITIES 0.1%
Public Power Corp. S.A. (a) 30,318 324 .............................................. Total Greece 2,447 ______________________
HONG KONG 2.0%
CONSUMER DISCRETIONARY 0.2%
Geely Automobile Holdings Ltd. 494,000 1,271 ..............................................
CONSUMER STAPLES 0.9%
China Mengniu Dairy Co. Ltd. 228,000 1,314 China Resources Beer Holdings Co. Ltd. 462,000 3,641 .............................................. 4,955 ______________________
FINANCIALS 0.0%
China Everbright Ltd. 154,000 201 ..............................................
INDUSTRIALS 0.0%
COSCO SHIPPING Ports Ltd. 336,000 245 Shanghai Industrial Holdings Ltd. 24,000 36 .............................................. 281 ______________________
REAL ESTATE 0.4%
China Overseas Land & Investment Ltd. 679,500 1,776 Poly Property Group Co. Ltd. 298,000 88 Yuexiu Property Co. Ltd. 1,182,000 268 .............................................. 2,132 ______________________
UTILITIES 0.5%
China Power International Development Ltd. 1,073,000 250 China Resources Gas Group Ltd. 118,000 655 China Resources Power Holdings Co. Ltd. 410,000 547 Guangdong Investment Ltd. 368,000 601
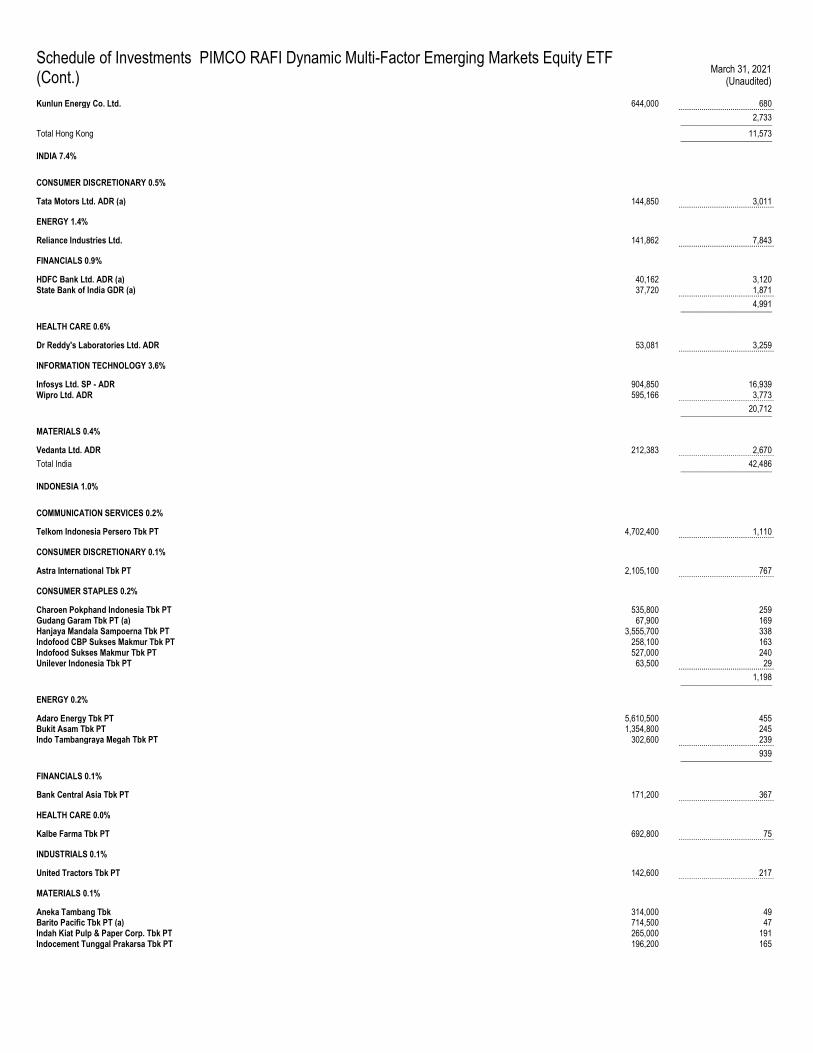
Schedule of Investments PIMCO RAFI Dynamic Multi-Factor Emerging Markets Equity ETF
(Cont.) March 31, 2021
(Unaudited)
Kunlun Energy Co. Ltd. 644,000 680 .............................................. 2,733 ______________________
Total Hong Kong 11,573 ______________________
INDIA 7.4%
CONSUMER DISCRETIONARY 0.5%
Tata Motors Ltd. ADR (a) 144,850 3,011 ..............................................
ENERGY 1.4%
Reliance Industries Ltd. 141,862 7,843 ..............................................
FINANCIALS 0.9%
HDFC Bank Ltd. ADR (a) 40,162 3,120 State Bank of India GDR (a) 37,720 1,871 .............................................. 4,991 ______________________
HEALTH CARE 0.6%
Dr Reddy's Laboratories Ltd. ADR 53,081 3,259 ..............................................
INFORMATION TECHNOLOGY 3.6%
Infosys Ltd. SP - ADR 904,850 16,939 Wipro Ltd. ADR 595,166 3,773 .............................................. 20,712 ______________________
MATERIALS 0.4%
Vedanta Ltd. ADR 212,383 2,670 .............................................. Total India 42,486 ______________________
INDONESIA 1.0%
COMMUNICATION SERVICES 0.2%
Telkom Indonesia Persero Tbk PT 4,702,400 1,110 ..............................................
CONSUMER DISCRETIONARY 0.1%
Astra International Tbk PT 2,105,100 767 ..............................................
CONSUMER STAPLES 0.2%
Charoen Pokphand Indonesia Tbk PT 535,800 259 Gudang Garam Tbk PT (a) 67,900 169 Hanjaya Mandala Sampoerna Tbk PT 3,555,700 338 Indofood CBP Sukses Makmur Tbk PT 258,100 163 Indofood Sukses Makmur Tbk PT 527,000 240 Unilever Indonesia Tbk PT 63,500 29 .............................................. 1,198 ______________________
ENERGY 0.2%
Adaro Energy Tbk PT 5,610,500 455 Bukit Asam Tbk PT 1,354,800 245 Indo Tambangraya Megah Tbk PT 302,600 239 .............................................. 939 ______________________
FINANCIALS 0.1%
Bank Central Asia Tbk PT 171,200 367 ..............................................
HEALTH CARE 0.0%
Kalbe Farma Tbk PT 692,800 75 ..............................................
INDUSTRIALS 0.1%
United Tractors Tbk PT 142,600 217 ..............................................
MATERIALS 0.1%
Aneka Tambang Tbk 314,000 49 Barito Pacific Tbk PT (a) 714,500 47 Indah Kiat Pulp & Paper Corp. Tbk PT 265,000 191 Indocement Tunggal Prakarsa Tbk PT 196,200 165
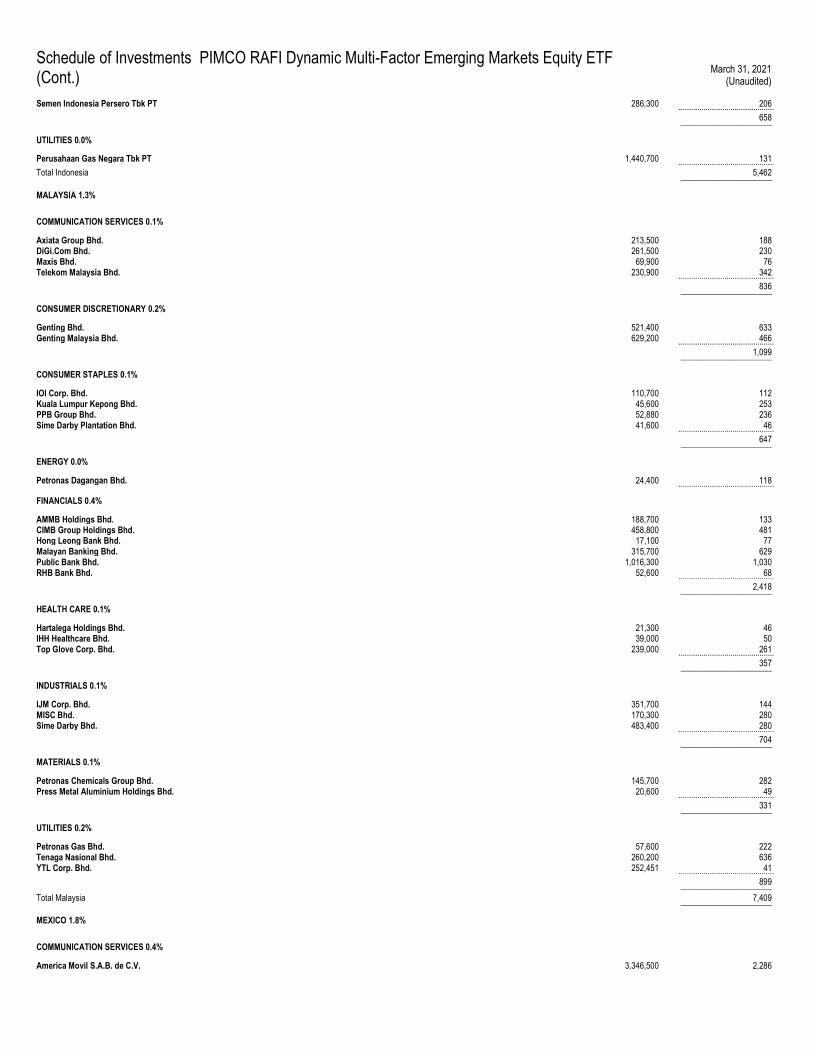
Schedule of Investments PIMCO RAFI Dynamic Multi-Factor Emerging Markets Equity ETF
(Cont.) March 31, 2021
(Unaudited)
Semen Indonesia Persero Tbk PT 286,300 206 .............................................. 658 ______________________
UTILITIES 0.0%
Perusahaan Gas Negara Tbk PT 1,440,700 131 .............................................. Total Indonesia 5,462 ______________________
MALAYSIA 1.3%
COMMUNICATION SERVICES 0.1%
Axiata Group Bhd. 213,500 188 DiGi.Com Bhd. 261,500 230 Maxis Bhd. 69,900 76 Telekom Malaysia Bhd. 230,900 342 .............................................. 836 ______________________
CONSUMER DISCRETIONARY 0.2%
Genting Bhd. 521,400 633 Genting Malaysia Bhd. 629,200 466 .............................................. 1,099 ______________________
CONSUMER STAPLES 0.1%
IOI Corp. Bhd. 110,700 112 Kuala Lumpur Kepong Bhd. 45,600 253 PPB Group Bhd. 52,880 236 Sime Darby Plantation Bhd. 41,600 46 .............................................. 647 ______________________
ENERGY 0.0%
Petronas Dagangan Bhd. 24,400 118 ..............................................
FINANCIALS 0.4%
AMMB Holdings Bhd. 188,700 133 CIMB Group Holdings Bhd. 458,800 481 Hong Leong Bank Bhd. 17,100 77 Malayan Banking Bhd. 315,700 629 Public Bank Bhd. 1,016,300 1,030 RHB Bank Bhd. 52,600 68 .............................................. 2,418 ______________________
HEALTH CARE 0.1%
Hartalega Holdings Bhd. 21,300 46 IHH Healthcare Bhd. 39,000 50 Top Glove Corp. Bhd. 239,000 261 .............................................. 357 ______________________
INDUSTRIALS 0.1%
IJM Corp. Bhd. 351,700 144 MISC Bhd. 170,300 280 Sime Darby Bhd. 483,400 280 .............................................. 704 ______________________
MATERIALS 0.1%
Petronas Chemicals Group Bhd. 145,700 282 Press Metal Aluminium Holdings Bhd. 20,600 49 .............................................. 331 ______________________
UTILITIES 0.2%
Petronas Gas Bhd. 57,600 222 Tenaga Nasional Bhd. 260,200 636 YTL Corp. Bhd. 252,451 41 .............................................. 899 ______________________
Total Malaysia 7,409 ______________________
MEXICO 1.8%
COMMUNICATION SERVICES 0.4%
America Movil S.A.B. de C.V. 3,346,500 2,286
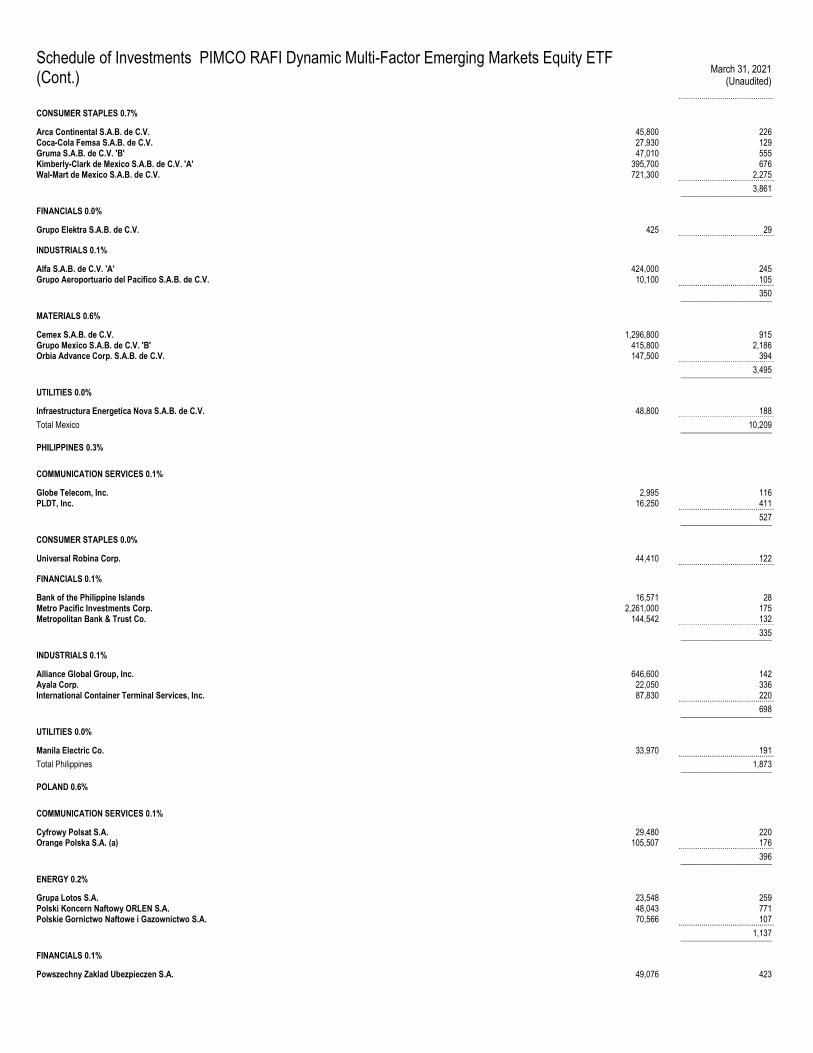
Schedule of Investments PIMCO RAFI Dynamic Multi-Factor Emerging Markets Equity ETF
(Cont.) March 31, 2021
(Unaudited)
..............................................
CONSUMER STAPLES 0.7%
Arca Continental S.A.B. de C.V. 45,800 226 Coca-Cola Femsa S.A.B. de C.V. 27,930 129 Gruma S.A.B. de C.V. 'B' 47,010 555 Kimberly-Clark de Mexico S.A.B. de C.V. 'A' 395,700 676 Wal-Mart de Mexico S.A.B. de C.V. 721,300 2,275 .............................................. 3,861 ______________________
FINANCIALS 0.0%
Grupo Elektra S.A.B. de C.V. 425 29 ..............................................
INDUSTRIALS 0.1%
Alfa S.A.B. de C.V. 'A' 424,000 245 Grupo Aeroportuario del Pacifico S.A.B. de C.V. 10,100 105 .............................................. 350 ______________________
MATERIALS 0.6%
Cemex S.A.B. de C.V. 1,296,800 915 Grupo Mexico S.A.B. de C.V. 'B' 415,800 2,186 Orbia Advance Corp. S.A.B. de C.V. 147,500 394 .............................................. 3,495 ______________________
UTILITIES 0.0%
Infraestructura Energetica Nova S.A.B. de C.V. 48,800 188 .............................................. Total Mexico 10,209 ______________________
PHILIPPINES 0.3%
COMMUNICATION SERVICES 0.1%
Globe Telecom, Inc. 2,995 116 PLDT, Inc. 16,250 411 .............................................. 527 ______________________
CONSUMER STAPLES 0.0%
Universal Robina Corp. 44,410 122 ..............................................
FINANCIALS 0.1%
Bank of the Philippine Islands 16,571 28 Metro Pacific Investments Corp. 2,261,000 175 Metropolitan Bank & Trust Co. 144,542 132 .............................................. 335 ______________________
INDUSTRIALS 0.1%
Alliance Global Group, Inc. 646,600 142 Ayala Corp. 22,050 336 International Container Terminal Services, Inc. 87,830 220 .............................................. 698 ______________________
UTILITIES 0.0%
Manila Electric Co. 33,970 191 .............................................. Total Philippines 1,873 ______________________
POLAND 0.6%
COMMUNICATION SERVICES 0.1%
Cyfrowy Polsat S.A. 29,480 220 Orange Polska S.A. (a) 105,507 176 .............................................. 396 ______________________
ENERGY 0.2%
Grupa Lotos S.A. 23,548 259 Polski Koncern Naftowy ORLEN S.A. 48,043 771 Polskie Gornictwo Naftowe i Gazownictwo S.A. 70,566 107 .............................................. 1,137 ______________________
FINANCIALS 0.1%
Powszechny Zaklad Ubezpieczen S.A. 49,076 423
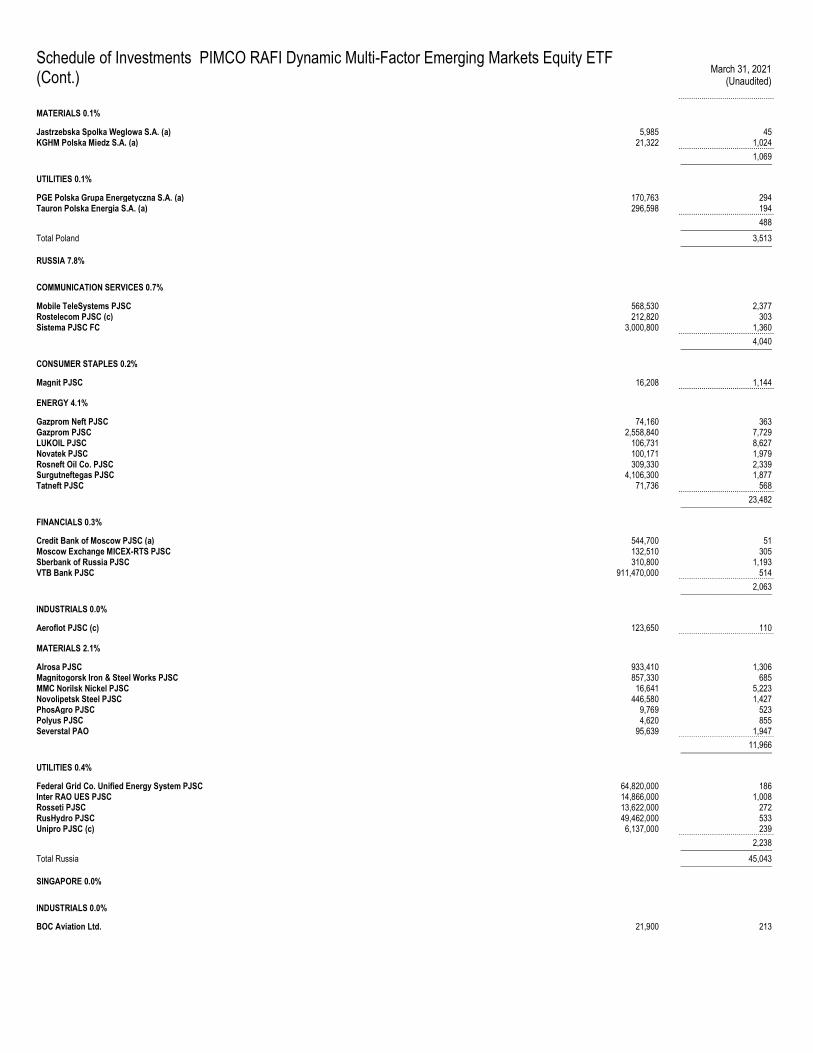
Schedule of Investments PIMCO RAFI Dynamic Multi-Factor Emerging Markets Equity ETF
(Cont.) March 31, 2021
(Unaudited)
..............................................
MATERIALS 0.1%
Jastrzebska Spolka Weglowa S.A. (a) 5,985 45 KGHM Polska Miedz S.A. (a) 21,322 1,024 .............................................. 1,069 ______________________
UTILITIES 0.1%
PGE Polska Grupa Energetyczna S.A. (a) 170,763 294 Tauron Polska Energia S.A. (a) 296,598 194 .............................................. 488 ______________________
Total Poland 3,513 ______________________
RUSSIA 7.8%
COMMUNICATION SERVICES 0.7%
Mobile TeleSystems PJSC 568,530 2,377 Rostelecom PJSC (c) 212,820 303 Sistema PJSC FC 3,000,800 1,360 .............................................. 4,040 ______________________
CONSUMER STAPLES 0.2%
Magnit PJSC 16,208 1,144 ..............................................
ENERGY 4.1%
Gazprom Neft PJSC 74,160 363 Gazprom PJSC 2,558,840 7,729 LUKOIL PJSC 106,731 8,627 Novatek PJSC 100,171 1,979 Rosneft Oil Co. PJSC 309,330 2,339 Surgutneftegas PJSC 4,106,300 1,877 Tatneft PJSC 71,736 568 .............................................. 23,482 ______________________
FINANCIALS 0.3%
Credit Bank of Moscow PJSC (a) 544,700 51 Moscow Exchange MICEX-RTS PJSC 132,510 305 Sberbank of Russia PJSC 310,800 1,193 VTB Bank PJSC 911,470,000 514 .............................................. 2,063 ______________________
INDUSTRIALS 0.0%
Aeroflot PJSC (c) 123,650 110 ..............................................
MATERIALS 2.1%
Alrosa PJSC 933,410 1,306 Magnitogorsk Iron & Steel Works PJSC 857,330 685 MMC Norilsk Nickel PJSC 16,641 5,223 Novolipetsk Steel PJSC 446,580 1,427 PhosAgro PJSC 9,769 523 Polyus PJSC 4,620 855 Severstal PAO 95,639 1,947 .............................................. 11,966 ______________________
UTILITIES 0.4%
Federal Grid Co. Unified Energy System PJSC 64,820,000 186 Inter RAO UES PJSC 14,866,000 1,008 Rosseti PJSC 13,622,000 272 RusHydro PJSC 49,462,000 533 Unipro PJSC (c) 6,137,000 239 .............................................. 2,238 ______________________
Total Russia 45,043 ______________________
SINGAPORE 0.0%
INDUSTRIALS 0.0%
BOC Aviation Ltd. 21,900 213
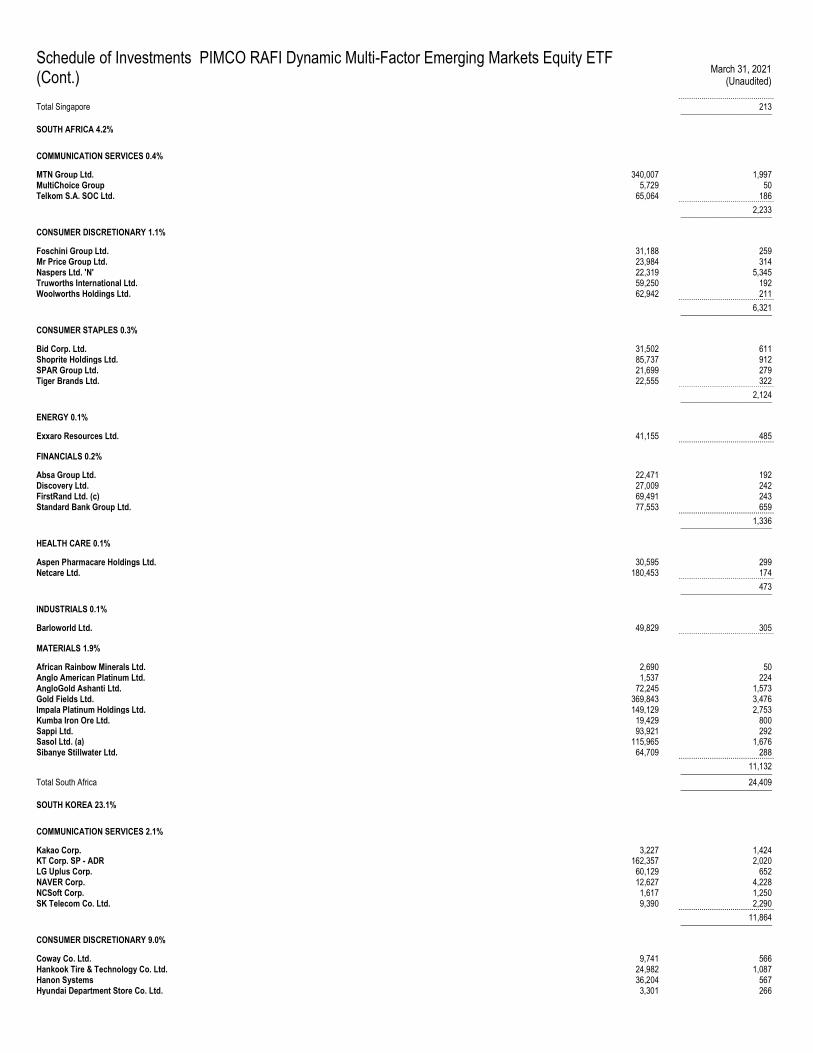
Schedule of Investments PIMCO RAFI Dynamic Multi-Factor Emerging Markets Equity ETF
(Cont.) March 31, 2021
(Unaudited)
.............................................. Total Singapore 213 ______________________
SOUTH AFRICA 4.2%
COMMUNICATION SERVICES 0.4%
MTN Group Ltd. 340,007 1,997 MultiChoice Group 5,729 50 Telkom S.A. SOC Ltd. 65,064 186 .............................................. 2,233 ______________________
CONSUMER DISCRETIONARY 1.1%
Foschini Group Ltd. 31,188 259 Mr Price Group Ltd. 23,984 314 Naspers Ltd. 'N' 22,319 5,345 Truworths International Ltd. 59,250 192 Woolworths Holdings Ltd. 62,942 211 .............................................. 6,321 ______________________
CONSUMER STAPLES 0.3%
Bid Corp. Ltd. 31,502 611 Shoprite Holdings Ltd. 85,737 912 SPAR Group Ltd. 21,699 279 Tiger Brands Ltd. 22,555 322 .............................................. 2,124 ______________________
ENERGY 0.1%
Exxaro Resources Ltd. 41,155 485 ..............................................
FINANCIALS 0.2%
Absa Group Ltd. 22,471 192 Discovery Ltd. 27,009 242 FirstRand Ltd. (c) 69,491 243 Standard Bank Group Ltd. 77,553 659 .............................................. 1,336 ______________________
HEALTH CARE 0.1%
Aspen Pharmacare Holdings Ltd. 30,595 299 Netcare Ltd. 180,453 174 .............................................. 473 ______________________
INDUSTRIALS 0.1%
Barloworld Ltd. 49,829 305 ..............................................
MATERIALS 1.9%
African Rainbow Minerals Ltd. 2,690 50 Anglo American Platinum Ltd. 1,537 224 AngloGold Ashanti Ltd. 72,245 1,573 Gold Fields Ltd. 369,843 3,476 Impala Platinum Holdings Ltd. 149,129 2,753 Kumba Iron Ore Ltd. 19,429 800 Sappi Ltd. 93,921 292 Sasol Ltd. (a) 115,965 1,676 Sibanye Stillwater Ltd. 64,709 288 .............................................. 11,132 ______________________
Total South Africa 24,409 ______________________
SOUTH KOREA 23.1%
COMMUNICATION SERVICES 2.1%
Kakao Corp. 3,227 1,424 KT Corp. SP - ADR 162,357 2,020 LG Uplus Corp. 60,129 652 NAVER Corp. 12,627 4,228 NCSoft Corp. 1,617 1,250 SK Telecom Co. Ltd. 9,390 2,290 .............................................. 11,864 ______________________
CONSUMER DISCRETIONARY 9.0%
Coway Co. Ltd. 9,741 566 Hankook Tire & Technology Co. Ltd. 24,982 1,087 Hanon Systems 36,204 567 Hyundai Department Store Co. Ltd. 3,301 266
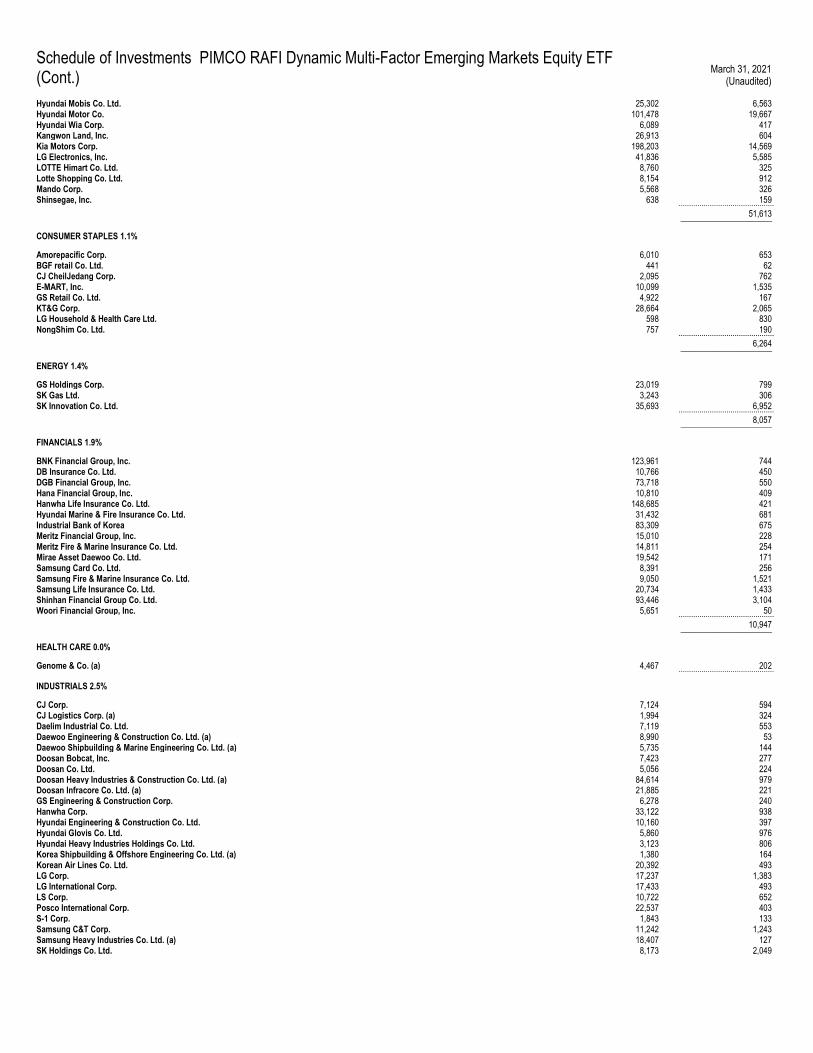
Schedule of Investments PIMCO RAFI Dynamic Multi-Factor Emerging Markets Equity ETF
(Cont.) March 31, 2021
(Unaudited)
Hyundai Mobis Co. Ltd. 25,302 6,563 Hyundai Motor Co. 101,478 19,667 Hyundai Wia Corp. 6,089 417 Kangwon Land, Inc. 26,913 604 Kia Motors Corp. 198,203 14,569 LG Electronics, Inc. 41,836 5,585 LOTTE Himart Co. Ltd. 8,760 325 Lotte Shopping Co. Ltd. 8,154 912 Mando Corp. 5,568 326 Shinsegae, Inc. 638 159 .............................................. 51,613 ______________________
CONSUMER STAPLES 1.1%
Amorepacific Corp. 6,010 653 BGF retail Co. Ltd. 441 62 CJ CheilJedang Corp. 2,095 762 E-MART, Inc. 10,099 1,535 GS Retail Co. Ltd. 4,922 167 KT&G Corp. 28,664 2,065 LG Household & Health Care Ltd. 598 830 NongShim Co. Ltd. 757 190 .............................................. 6,264 ______________________
ENERGY 1.4%
GS Holdings Corp. 23,019 799 SK Gas Ltd. 3,243 306 SK Innovation Co. Ltd. 35,693 6,952 .............................................. 8,057 ______________________
FINANCIALS 1.9%
BNK Financial Group, Inc. 123,961 744 DB Insurance Co. Ltd. 10,766 450 DGB Financial Group, Inc. 73,718 550 Hana Financial Group, Inc. 10,810 409 Hanwha Life Insurance Co. Ltd. 148,685 421 Hyundai Marine & Fire Insurance Co. Ltd. 31,432 681 Industrial Bank of Korea 83,309 675 Meritz Financial Group, Inc. 15,010 228 Meritz Fire & Marine Insurance Co. Ltd. 14,811 254 Mirae Asset Daewoo Co. Ltd. 19,542 171 Samsung Card Co. Ltd. 8,391 256 Samsung Fire & Marine Insurance Co. Ltd. 9,050 1,521 Samsung Life Insurance Co. Ltd. 20,734 1,433 Shinhan Financial Group Co. Ltd. 93,446 3,104 Woori Financial Group, Inc. 5,651 50 .............................................. 10,947 ______________________
HEALTH CARE 0.0%
Genome & Co. (a) 4,467 202 ..............................................
INDUSTRIALS 2.5%
CJ Corp. 7,124 594 CJ Logistics Corp. (a) 1,994 324 Daelim Industrial Co. Ltd. 7,119 553 Daewoo Engineering & Construction Co. Ltd. (a) 8,990 53 Daewoo Shipbuilding & Marine Engineering Co. Ltd. (a) 5,735 144 Doosan Bobcat, Inc. 7,423 277 Doosan Co. Ltd. 5,056 224 Doosan Heavy Industries & Construction Co. Ltd. (a) 84,614 979 Doosan Infracore Co. Ltd. (a) 21,885 221 GS Engineering & Construction Corp. 6,278 240 Hanwha Corp. 33,122 938 Hyundai Engineering & Construction Co. Ltd. 10,160 397 Hyundai Glovis Co. Ltd. 5,860 976 Hyundai Heavy Industries Holdings Co. Ltd. 3,123 806 Korea Shipbuilding & Offshore Engineering Co. Ltd. (a) 1,380 164 Korean Air Lines Co. Ltd. 20,392 493 LG Corp. 17,237 1,383 LG International Corp. 17,433 493 LS Corp. 10,722 652 Posco International Corp. 22,537 403 S-1 Corp. 1,843 133 Samsung C&T Corp. 11,242 1,243 Samsung Heavy Industries Co. Ltd. (a) 18,407 127 SK Holdings Co. Ltd. 8,173 2,049
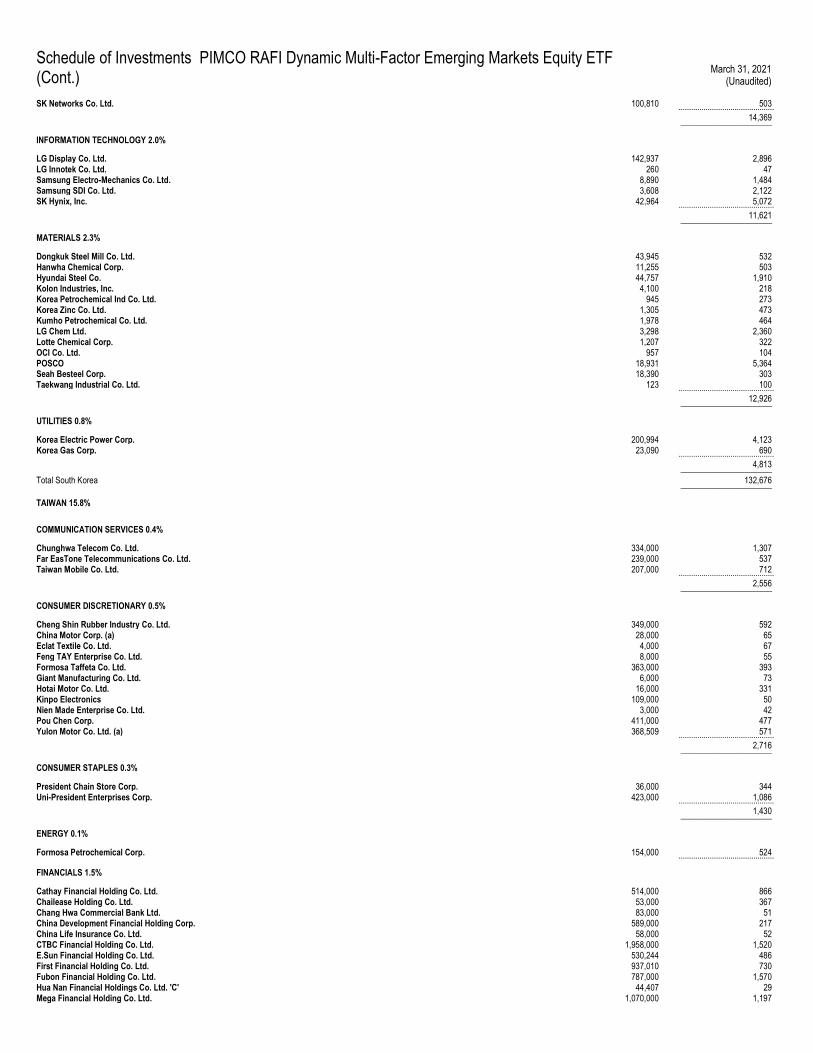
Schedule of Investments PIMCO RAFI Dynamic Multi-Factor Emerging Markets Equity ETF
(Cont.) March 31, 2021
(Unaudited)
SK Networks Co. Ltd. 100,810 503 .............................................. 14,369 ______________________
INFORMATION TECHNOLOGY 2.0%
LG Display Co. Ltd. 142,937 2,896 LG Innotek Co. Ltd. 260 47 Samsung Electro-Mechanics Co. Ltd. 8,890 1,484 Samsung SDI Co. Ltd. 3,608 2,122 SK Hynix, Inc. 42,964 5,072 .............................................. 11,621 ______________________
MATERIALS 2.3%
Dongkuk Steel Mill Co. Ltd. 43,945 532 Hanwha Chemical Corp. 11,255 503 Hyundai Steel Co. 44,757 1,910 Kolon Industries, Inc. 4,100 218 Korea Petrochemical Ind Co. Ltd. 945 273 Korea Zinc Co. Ltd. 1,305 473 Kumho Petrochemical Co. Ltd. 1,978 464 LG Chem Ltd. 3,298 2,360 Lotte Chemical Corp. 1,207 322 OCI Co. Ltd. 957 104 POSCO 18,931 5,364 Seah Besteel Corp. 18,390 303 Taekwang Industrial Co. Ltd. 123 100 .............................................. 12,926 ______________________
UTILITIES 0.8%
Korea Electric Power Corp. 200,994 4,123 Korea Gas Corp. 23,090 690 .............................................. 4,813 ______________________
Total South Korea 132,676 ______________________
TAIWAN 15.8%
COMMUNICATION SERVICES 0.4%
Chunghwa Telecom Co. Ltd. 334,000 1,307 Far EasTone Telecommunications Co. Ltd. 239,000 537 Taiwan Mobile Co. Ltd. 207,000 712 .............................................. 2,556 ______________________
CONSUMER DISCRETIONARY 0.5%
Cheng Shin Rubber Industry Co. Ltd. 349,000 592 China Motor Corp. (a) 28,000 65 Eclat Textile Co. Ltd. 4,000 67 Feng TAY Enterprise Co. Ltd. 8,000 55 Formosa Taffeta Co. Ltd. 363,000 393 Giant Manufacturing Co. Ltd. 6,000 73 Hotai Motor Co. Ltd. 16,000 331 Kinpo Electronics 109,000 50 Nien Made Enterprise Co. Ltd. 3,000 42 Pou Chen Corp. 411,000 477 Yulon Motor Co. Ltd. (a) 368,509 571 .............................................. 2,716 ______________________
CONSUMER STAPLES 0.3%
President Chain Store Corp. 36,000 344 Uni-President Enterprises Corp. 423,000 1,086 .............................................. 1,430 ______________________
ENERGY 0.1%
Formosa Petrochemical Corp. 154,000 524 ..............................................
FINANCIALS 1.5%
Cathay Financial Holding Co. Ltd. 514,000 866 Chailease Holding Co. Ltd. 53,000 367 Chang Hwa Commercial Bank Ltd. 83,000 51 China Development Financial Holding Corp. 589,000 217 China Life Insurance Co. Ltd. 58,000 52 CTBC Financial Holding Co. Ltd. 1,958,000 1,520 E.Sun Financial Holding Co. Ltd. 530,244 486 First Financial Holding Co. Ltd. 937,010 730 Fubon Financial Holding Co. Ltd. 787,000 1,570 Hua Nan Financial Holdings Co. Ltd. 'C' 44,407 29 Mega Financial Holding Co. Ltd. 1,070,000 1,197
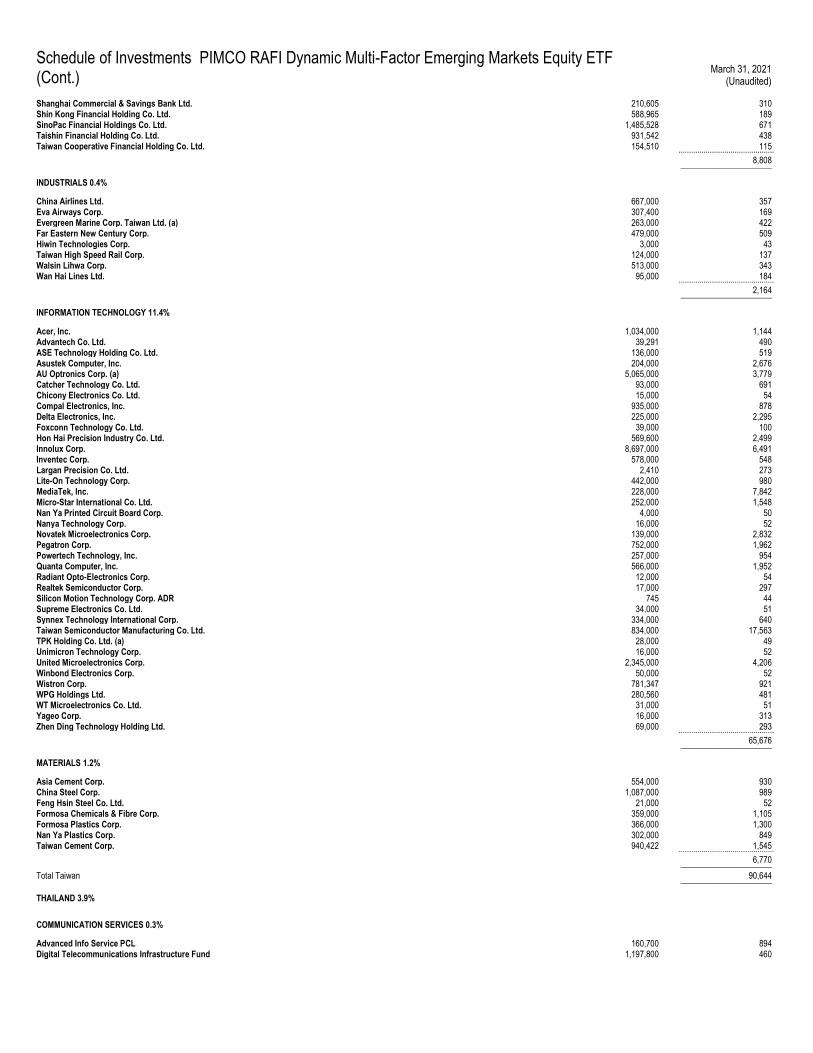
Schedule of Investments PIMCO RAFI Dynamic Multi-Factor Emerging Markets Equity ETF
(Cont.) March 31, 2021
(Unaudited)
Shanghai Commercial & Savings Bank Ltd. 210,605 310 Shin Kong Financial Holding Co. Ltd. 588,965 189 SinoPac Financial Holdings Co. Ltd. 1,485,528 671 Taishin Financial Holding Co. Ltd. 931,542 438 Taiwan Cooperative Financial Holding Co. Ltd. 154,510 115 .............................................. 8,808 ______________________
INDUSTRIALS 0.4%
China Airlines Ltd. 667,000 357 Eva Airways Corp. 307,400 169 Evergreen Marine Corp. Taiwan Ltd. (a) 263,000 422 Far Eastern New Century Corp. 479,000 509 Hiwin Technologies Corp. 3,000 43 Taiwan High Speed Rail Corp. 124,000 137 Walsin Lihwa Corp. 513,000 343 Wan Hai Lines Ltd. 95,000 184 .............................................. 2,164 ______________________
INFORMATION TECHNOLOGY 11.4%
Acer, Inc. 1,034,000 1,144 Advantech Co. Ltd. 39,291 490 ASE Technology Holding Co. Ltd. 136,000 519 Asustek Computer, Inc. 204,000 2,676 AU Optronics Corp. (a) 5,065,000 3,779 Catcher Technology Co. Ltd. 93,000 691 Chicony Electronics Co. Ltd. 15,000 54 Compal Electronics, Inc. 935,000 878 Delta Electronics, Inc. 225,000 2,295 Foxconn Technology Co. Ltd. 39,000 100 Hon Hai Precision Industry Co. Ltd. 569,600 2,499 Innolux Corp. 8,697,000 6,491 Inventec Corp. 578,000 548 Largan Precision Co. Ltd. 2,410 273 Lite-On Technology Corp. 442,000 980 MediaTek, Inc. 228,000 7,842 Micro-Star International Co. Ltd. 252,000 1,548 Nan Ya Printed Circuit Board Corp. 4,000 50 Nanya Technology Corp. 16,000 52 Novatek Microelectronics Corp. 139,000 2,832 Pegatron Corp. 752,000 1,962 Powertech Technology, Inc. 257,000 954 Quanta Computer, Inc. 566,000 1,952 Radiant Opto-Electronics Corp. 12,000 54 Realtek Semiconductor Corp. 17,000 297 Silicon Motion Technology Corp. ADR 745 44 Supreme Electronics Co. Ltd. 34,000 51 Synnex Technology International Corp. 334,000 640 Taiwan Semiconductor Manufacturing Co. Ltd. 834,000 17,563 TPK Holding Co. Ltd. (a) 28,000 49 Unimicron Technology Corp. 16,000 52 United Microelectronics Corp. 2,345,000 4,206 Winbond Electronics Corp. 50,000 52 Wistron Corp. 781,347 921 WPG Holdings Ltd. 280,560 481 WT Microelectronics Co. Ltd. 31,000 51 Yageo Corp. 16,000 313 Zhen Ding Technology Holding Ltd. 69,000 293 .............................................. 65,676 ______________________
MATERIALS 1.2%
Asia Cement Corp. 554,000 930 China Steel Corp. 1,087,000 989 Feng Hsin Steel Co. Ltd. 21,000 52 Formosa Chemicals & Fibre Corp. 359,000 1,105 Formosa Plastics Corp. 366,000 1,300 Nan Ya Plastics Corp. 302,000 849 Taiwan Cement Corp. 940,422 1,545 .............................................. 6,770 ______________________
Total Taiwan 90,644 ______________________
THAILAND 3.9%
COMMUNICATION SERVICES 0.3%
Advanced Info Service PCL 160,700 894 Digital Telecommunications Infrastructure Fund 1,197,800 460
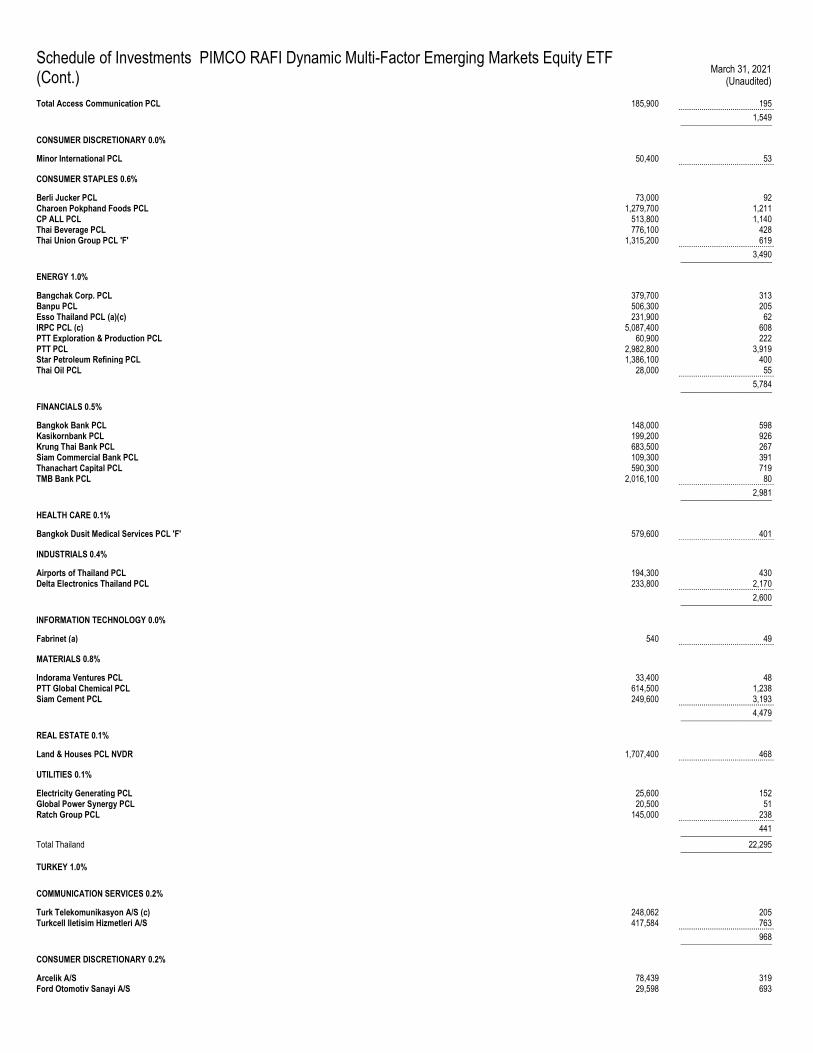
Schedule of Investments PIMCO RAFI Dynamic Multi-Factor Emerging Markets Equity ETF
(Cont.) March 31, 2021
(Unaudited)
Total Access Communication PCL 185,900 195 .............................................. 1,549 ______________________
CONSUMER DISCRETIONARY 0.0%
Minor International PCL 50,400 53 ..............................................
CONSUMER STAPLES 0.6%
Berli Jucker PCL 73,000 92 Charoen Pokphand Foods PCL 1,279,700 1,211 CP ALL PCL 513,800 1,140 Thai Beverage PCL 776,100 428 Thai Union Group PCL 'F' 1,315,200 619 .............................................. 3,490 ______________________
ENERGY 1.0%
Bangchak Corp. PCL 379,700 313 Banpu PCL 506,300 205 Esso Thailand PCL (a)(c) 231,900 62 IRPC PCL (c) 5,087,400 608 PTT Exploration & Production PCL 60,900 222 PTT PCL 2,982,800 3,919 Star Petroleum Refining PCL 1,386,100 400 Thai Oil PCL 28,000 55 .............................................. 5,784 ______________________
FINANCIALS 0.5%
Bangkok Bank PCL 148,000 598 Kasikornbank PCL 199,200 926 Krung Thai Bank PCL 683,500 267 Siam Commercial Bank PCL 109,300 391 Thanachart Capital PCL 590,300 719 TMB Bank PCL 2,016,100 80 .............................................. 2,981 ______________________
HEALTH CARE 0.1%
Bangkok Dusit Medical Services PCL 'F' 579,600 401 ..............................................
INDUSTRIALS 0.4%
Airports of Thailand PCL 194,300 430 Delta Electronics Thailand PCL 233,800 2,170 .............................................. 2,600 ______________________
INFORMATION TECHNOLOGY 0.0%
Fabrinet (a) 540 49 ..............................................
MATERIALS 0.8%
Indorama Ventures PCL 33,400 48 PTT Global Chemical PCL 614,500 1,238 Siam Cement PCL 249,600 3,193 .............................................. 4,479 ______________________
REAL ESTATE 0.1%
Land & Houses PCL NVDR 1,707,400 468 ..............................................
UTILITIES 0.1%
Electricity Generating PCL 25,600 152 Global Power Synergy PCL 20,500 51 Ratch Group PCL 145,000 238 .............................................. 441 ______________________
Total Thailand 22,295 ______________________
TURKEY 1.0%
COMMUNICATION SERVICES 0.2%
Turk Telekomunikasyon A/S (c) 248,062 205 Turkcell Iletisim Hizmetleri A/S 417,584 763 .............................................. 968 ______________________
CONSUMER DISCRETIONARY 0.2%
Arcelik A/S 78,439 319 Ford Otomotiv Sanayi A/S 29,598 693
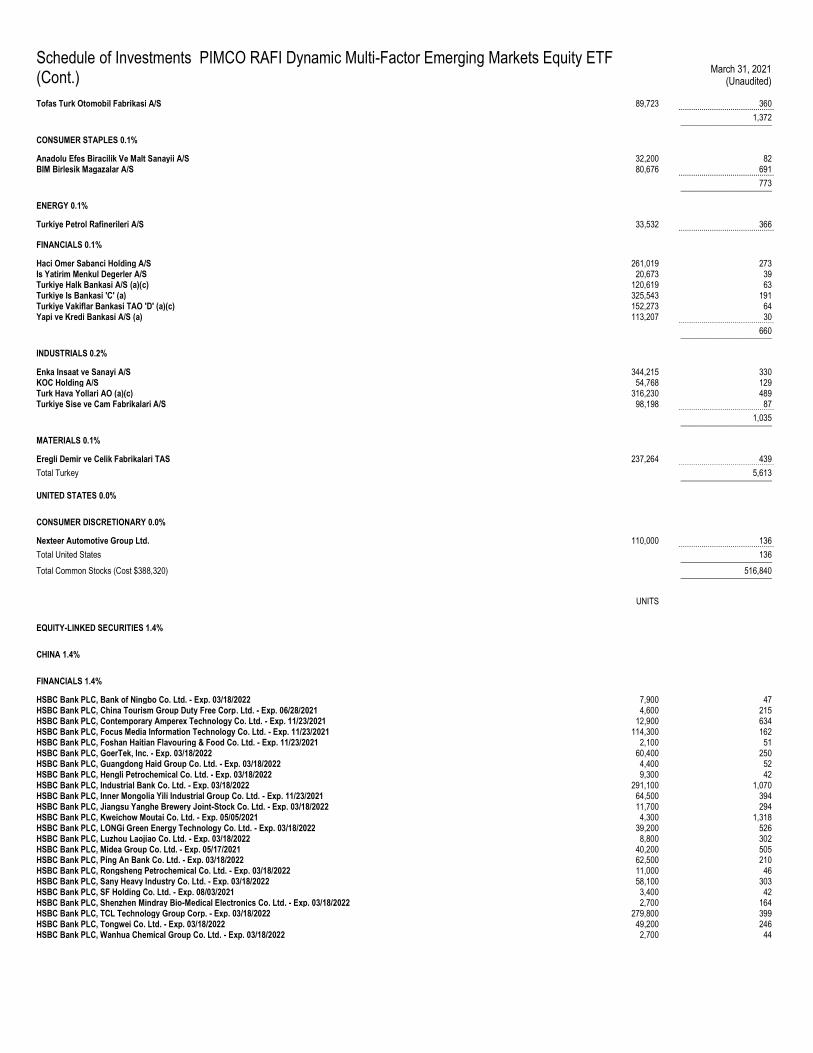
Schedule of Investments PIMCO RAFI Dynamic Multi-Factor Emerging Markets Equity ETF
(Cont.) March 31, 2021
(Unaudited)
Tofas Turk Otomobil Fabrikasi A/S 89,723 360 .............................................. 1,372 ______________________
CONSUMER STAPLES 0.1%
Anadolu Efes Biracilik Ve Malt Sanayii A/S 32,200 82 BIM Birlesik Magazalar A/S 80,676 691 .............................................. 773 ______________________
ENERGY 0.1%
Turkiye Petrol Rafinerileri A/S 33,532 366 ..............................................
FINANCIALS 0.1%
Haci Omer Sabanci Holding A/S 261,019 273 Is Yatirim Menkul Degerler A/S 20,673 39 Turkiye Halk Bankasi A/S (a)(c) 120,619 63 Turkiye Is Bankasi 'C' (a) 325,543 191 Turkiye Vakiflar Bankasi TAO 'D' (a)(c) 152,273 64 Yapi ve Kredi Bankasi A/S (a) 113,207 30 .............................................. 660 ______________________
INDUSTRIALS 0.2%
Enka Insaat ve Sanayi A/S 344,215 330 KOC Holding A/S 54,768 129 Turk Hava Yollari AO (a)(c) 316,230 489 Turkiye Sise ve Cam Fabrikalari A/S 98,198 87 .............................................. 1,035 ______________________
MATERIALS 0.1%
Eregli Demir ve Celik Fabrikalari TAS 237,264 439 .............................................. Total Turkey 5,613 ______________________
UNITED STATES 0.0%
CONSUMER DISCRETIONARY 0.0%
Nexteer Automotive Group Ltd. 110,000 136 .............................................. Total United States 136 ______________________
Total Common Stocks (Cost $388,320) 516,840 ______________________
UNITS
EQUITY-LINKED SECURITIES 1.4%
CHINA 1.4%
FINANCIALS 1.4%
HSBC Bank PLC, Bank of Ningbo Co. Ltd. - Exp. 03/18/2022 7,900 47 HSBC Bank PLC, China Tourism Group Duty Free Corp. Ltd. - Exp. 06/28/2021 4,600 215 HSBC Bank PLC, Contemporary Amperex Technology Co. Ltd. - Exp. 11/23/2021 12,900 634 HSBC Bank PLC, Focus Media Information Technology Co. Ltd. - Exp. 11/23/2021 114,300 162 HSBC Bank PLC, Foshan Haitian Flavouring & Food Co. Ltd. - Exp. 11/23/2021 2,100 51 HSBC Bank PLC, GoerTek, Inc. - Exp. 03/18/2022 60,400 250 HSBC Bank PLC, Guangdong Haid Group Co. Ltd. - Exp. 03/18/2022 4,400 52 HSBC Bank PLC, Hengli Petrochemical Co. Ltd. - Exp. 03/18/2022 9,300 42 HSBC Bank PLC, Industrial Bank Co. Ltd. - Exp. 03/18/2022 291,100 1,070 HSBC Bank PLC, Inner Mongolia Yili Industrial Group Co. Ltd. - Exp. 11/23/2021 64,500 394 HSBC Bank PLC, Jiangsu Yanghe Brewery Joint-Stock Co. Ltd. - Exp. 03/18/2022 11,700 294 HSBC Bank PLC, Kweichow Moutai Co. Ltd. - Exp. 05/05/2021 4,300 1,318 HSBC Bank PLC, LONGi Green Energy Technology Co. Ltd. - Exp. 03/18/2022 39,200 526 HSBC Bank PLC, Luzhou Laojiao Co. Ltd. - Exp. 03/18/2022 8,800 302 HSBC Bank PLC, Midea Group Co. Ltd. - Exp. 05/17/2021 40,200 505 HSBC Bank PLC, Ping An Bank Co. Ltd. - Exp. 03/18/2022 62,500 210 HSBC Bank PLC, Rongsheng Petrochemical Co. Ltd. - Exp. 03/18/2022 11,000 46 HSBC Bank PLC, Sany Heavy Industry Co. Ltd. - Exp. 03/18/2022 58,100 303 HSBC Bank PLC, SF Holding Co. Ltd. - Exp. 08/03/2021 3,400 42 HSBC Bank PLC, Shenzhen Mindray Bio-Medical Electronics Co. Ltd. - Exp. 03/18/2022 2,700 164 HSBC Bank PLC, TCL Technology Group Corp. - Exp. 03/18/2022 279,800 399 HSBC Bank PLC, Tongwei Co. Ltd. - Exp. 03/18/2022 49,200 246 HSBC Bank PLC, Wanhua Chemical Group Co. Ltd. - Exp. 03/18/2022 2,700 44
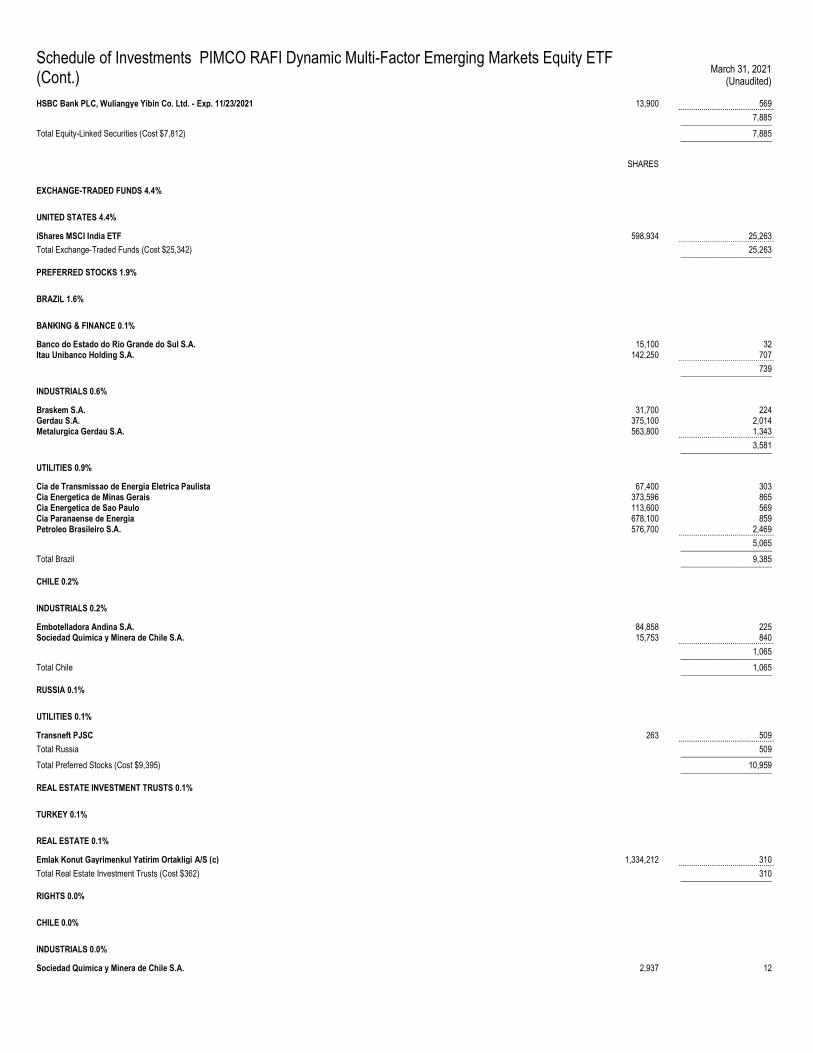
Schedule of Investments PIMCO RAFI Dynamic Multi-Factor Emerging Markets Equity ETF
(Cont.) March 31, 2021
(Unaudited)
HSBC Bank PLC, Wuliangye Yibin Co. Ltd. - Exp. 11/23/2021 13,900 569 .............................................. 7,885 ______________________
Total Equity-Linked Securities (Cost $7,812) 7,885 ______________________
SHARES
EXCHANGE-TRADED FUNDS 4.4%
UNITED STATES 4.4%
iShares MSCI India ETF 598,934 25,263 .............................................. Total Exchange-Traded Funds (Cost $25,342) 25,263 ______________________
PREFERRED STOCKS 1.9%
BRAZIL 1.6%
BANKING & FINANCE 0.1%
Banco do Estado do Rio Grande do Sul S.A. 15,100 32 Itau Unibanco Holding S.A. 142,250 707 .............................................. 739 ______________________
INDUSTRIALS 0.6%
Braskem S.A. 31,700 224 Gerdau S.A. 375,100 2,014 Metalurgica Gerdau S.A. 563,800 1,343 .............................................. 3,581 ______________________
UTILITIES 0.9%
Cia de Transmissao de Energia Eletrica Paulista 67,400 303 Cia Energetica de Minas Gerais 373,596 865 Cia Energetica de Sao Paulo 113,600 569 Cia Paranaense de Energia 678,100 859 Petroleo Brasileiro S.A. 576,700 2,469 .............................................. 5,065 ______________________
Total Brazil 9,385 ______________________
CHILE 0.2%
INDUSTRIALS 0.2%
Embotelladora Andina S.A. 84,858 225 Sociedad Quimica y Minera de Chile S.A. 15,753 840 .............................................. 1,065 ______________________
Total Chile 1,065 ______________________
RUSSIA 0.1%
UTILITIES 0.1%
Transneft PJSC 263 509 .............................................. Total Russia 509 ______________________
Total Preferred Stocks (Cost $9,395) 10,959 ______________________
REAL ESTATE INVESTMENT TRUSTS 0.1%
TURKEY 0.1%
REAL ESTATE 0.1%
Emlak Konut Gayrimenkul Yatirim Ortakligi A/S (c) 1,334,212 310 .............................................. Total Real Estate Investment Trusts (Cost $362) 310 ______________________
RIGHTS 0.0%
CHILE 0.0%
INDUSTRIALS 0.0%
Sociedad Quimica y Minera de Chile S.A. 2,937 12
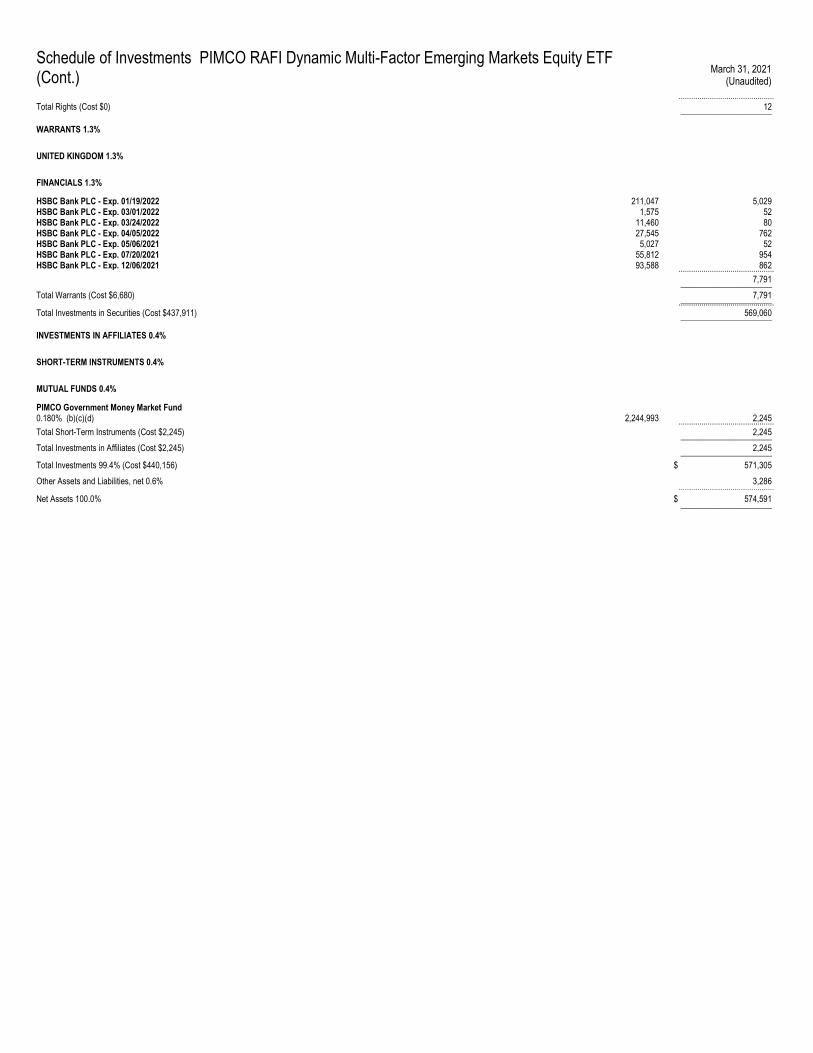
Schedule of Investments PIMCO RAFI Dynamic Multi-Factor Emerging Markets Equity ETF
(Cont.) March 31, 2021
(Unaudited)
.............................................. Total Rights (Cost $0) 12 ______________________
WARRANTS 1.3%
UNITED KINGDOM 1.3%
FINANCIALS 1.3%
HSBC Bank PLC - Exp. 01/19/2022 211,047 5,029 HSBC Bank PLC - Exp. 03/01/2022 1,575 52 HSBC Bank PLC - Exp. 03/24/2022 11,460 80 HSBC Bank PLC - Exp. 04/05/2022 27,545 762 HSBC Bank PLC - Exp. 05/06/2021 5,027 52 HSBC Bank PLC - Exp. 07/20/2021 55,812 954 HSBC Bank PLC - Exp. 12/06/2021 93,588 862 .............................................. 7,791 ______________________
Total Warrants (Cost $6,680) 7,791 ______________________ .............................................. Total Investments in Securities (Cost $437,911) 569,060 ______________________
INVESTMENTS IN AFFILIATES 0.4%
SHORT-TERM INSTRUMENTS 0.4%
MUTUAL FUNDS 0.4%
PIMCO Government Money Market Fund 0.180% (b)(c)(d) 2,244,993 2,245 .............................................. Total Short-Term Instruments (Cost $2,245) 2,245 ______________________
Total Investments in Affiliates (Cost $2,245) 2,245 ______________________
Total Investments 99.4% (Cost $440,156) $ 571,305
Other Assets and Liabilities, net 0.6% 3,286 ..............................................
Net Assets 100.0% $ 574,591 ______________________
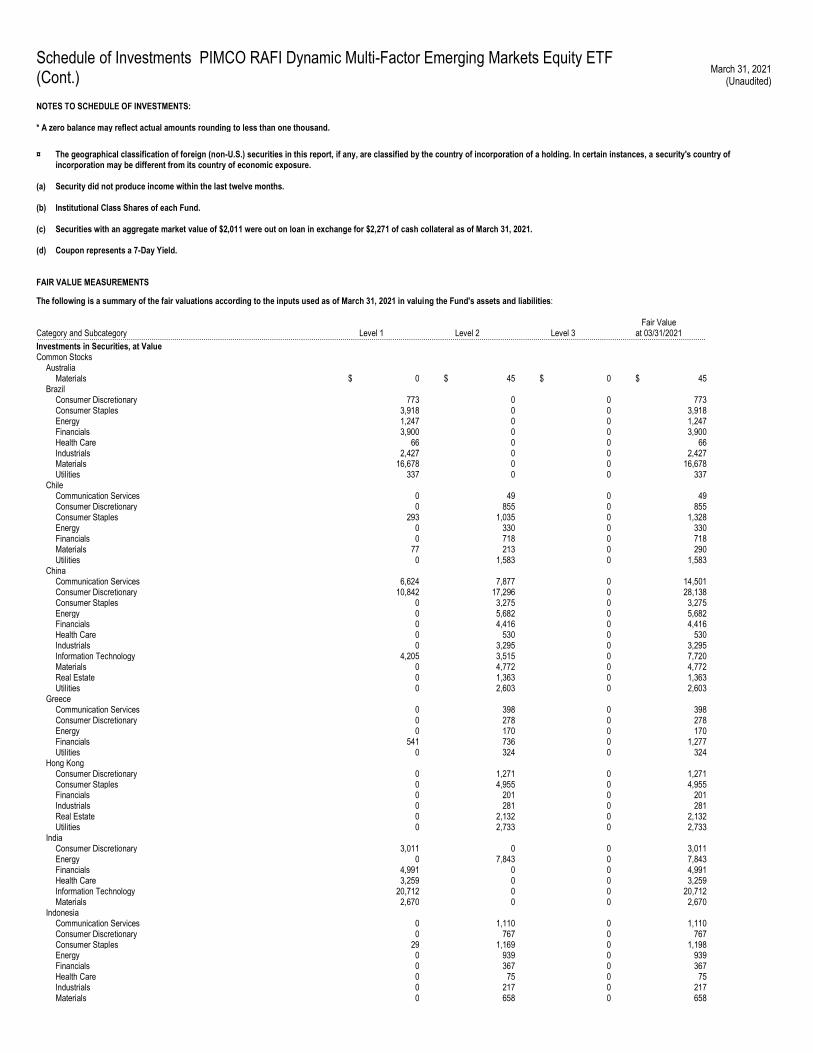
Schedule of Investments PIMCO RAFI Dynamic Multi-Factor Emerging Markets Equity ETF
(Cont.) March 31, 2021
(Unaudited)
NOTES TO SCHEDULE OF INVESTMENTS: * A zero balance may reflect actual amounts rounding to less than one thousand.
¤ The geographical classification of foreign (non-U.S.) securities in this report, if any, are classified by the country of incorporation of a holding. In certain instances, a security's country of incorporation may be different from its country of economic exposure.
(a) Security did not produce income within the last twelve months.
(b) Institutional Class Shares of each Fund.
(c) Securities with an aggregate market value of $2,011 were out on loan in exchange for $2,271 of cash collateral as of March 31, 2021.
(d) Coupon represents a 7-Day Yield.
FAIR VALUE MEASUREMENTS
The following is a summary of the fair valuations according to the inputs used as of March 31, 2021 in valuing the Fund's assets and liabilities:
Category and Subcategory Level 1 Level 2 Level 3 Fair Value
at 03/31/2021 .................................................................................................................................................................................................................................................................................................................................. Investments in Securities, at Value Common Stocks Australia Materials $ 0 $ 45 $ 0 $ 45 Brazil Consumer Discretionary 773 0 0 773 Consumer Staples 3,918 0 0 3,918 Energy 1,247 0 0 1,247 Financials 3,900 0 0 3,900 Health Care 66 0 0 66 Industrials 2,427 0 0 2,427 Materials 16,678 0 0 16,678 Utilities 337 0 0 337 Chile Communication Services 0 49 0 49 Consumer Discretionary 0 855 0 855 Consumer Staples 293 1,035 0 1,328 Energy 0 330 0 330 Financials 0 718 0 718 Materials 77 213 0 290 Utilities 0 1,583 0 1,583 China Communication Services 6,624 7,877 0 14,501 Consumer Discretionary 10,842 17,296 0 28,138 Consumer Staples 0 3,275 0 3,275 Energy 0 5,682 0 5,682 Financials 0 4,416 0 4,416 Health Care 0 530 0 530 Industrials 0 3,295 0 3,295 Information Technology 4,205 3,515 0 7,720 Materials 0 4,772 0 4,772 Real Estate 0 1,363 0 1,363 Utilities 0 2,603 0 2,603 Greece Communication Services 0 398 0 398 Consumer Discretionary 0 278 0 278 Energy 0 170 0 170 Financials 541 736 0 1,277 Utilities 0 324 0 324 Hong Kong Consumer Discretionary 0 1,271 0 1,271 Consumer Staples 0 4,955 0 4,955 Financials 0 201 0 201 Industrials 0 281 0 281 Real Estate 0 2,132 0 2,132 Utilities 0 2,733 0 2,733 India Consumer Discretionary 3,011 0 0 3,011 Energy 0 7,843 0 7,843 Financials 4,991 0 0 4,991 Health Care 3,259 0 0 3,259 Information Technology 20,712 0 0 20,712 Materials 2,670 0 0 2,670 Indonesia Communication Services 0 1,110 0 1,110 Consumer Discretionary 0 767 0 767 Consumer Staples 29 1,169 0 1,198 Energy 0 939 0 939 Financials 0 367 0 367 Health Care 0 75 0 75 Industrials 0 217 0 217 Materials 0 658 0 658
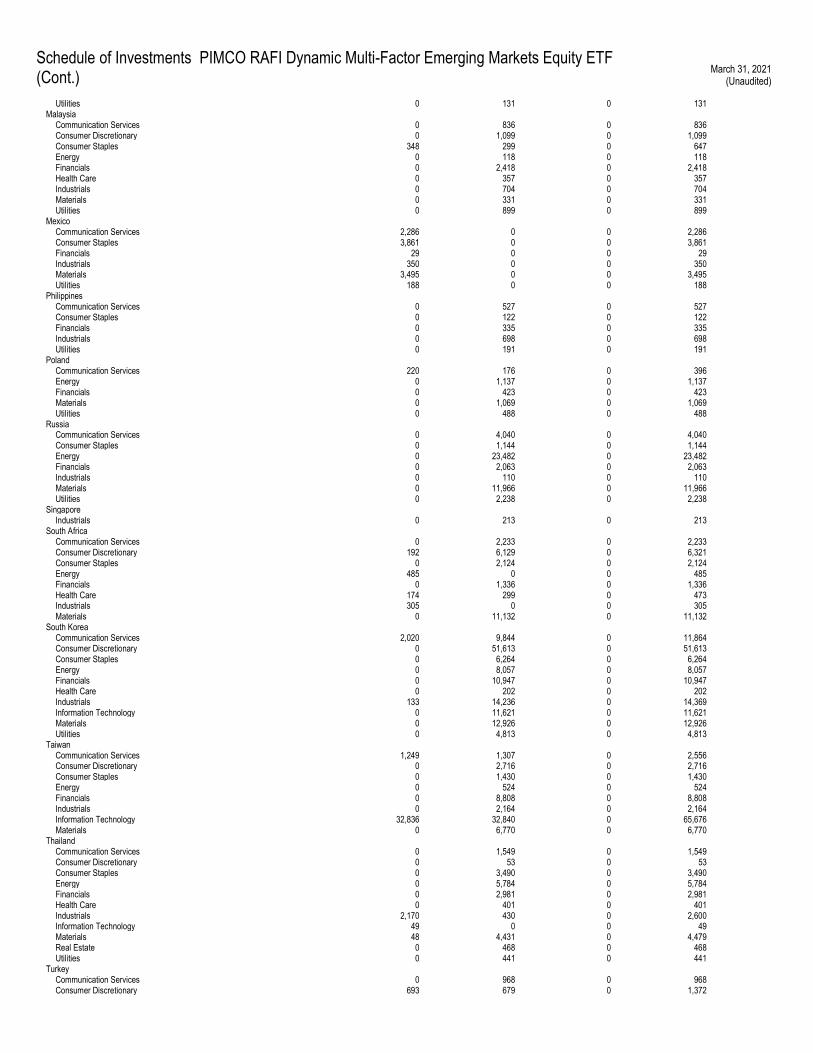
Schedule of Investments PIMCO RAFI Dynamic Multi-Factor Emerging Markets Equity ETF
(Cont.) March 31, 2021
(Unaudited)
Utilities 0 131 0 131 Malaysia Communication Services 0 836 0 836 Consumer Discretionary 0 1,099 0 1,099 Consumer Staples 348 299 0 647 Energy 0 118 0 118 Financials 0 2,418 0 2,418 Health Care 0 357 0 357 Industrials 0 704 0 704 Materials 0 331 0 331 Utilities 0 899 0 899 Mexico Communication Services 2,286 0 0 2,286 Consumer Staples 3,861 0 0 3,861 Financials 29 0 0 29 Industrials 350 0 0 350 Materials 3,495 0 0 3,495 Utilities 188 0 0 188 Philippines Communication Services 0 527 0 527 Consumer Staples 0 122 0 122 Financials 0 335 0 335 Industrials 0 698 0 698 Utilities 0 191 0 191 Poland Communication Services 220 176 0 396 Energy 0 1,137 0 1,137 Financials 0 423 0 423 Materials 0 1,069 0 1,069 Utilities 0 488 0 488 Russia Communication Services 0 4,040 0 4,040 Consumer Staples 0 1,144 0 1,144 Energy 0 23,482 0 23,482 Financials 0 2,063 0 2,063 Industrials 0 110 0 110 Materials 0 11,966 0 11,966 Utilities 0 2,238 0 2,238 Singapore Industrials 0 213 0 213 South Africa Communication Services 0 2,233 0 2,233 Consumer Discretionary 192 6,129 0 6,321 Consumer Staples 0 2,124 0 2,124 Energy 485 0 0 485 Financials 0 1,336 0 1,336 Health Care 174 299 0 473 Industrials 305 0 0 305 Materials 0 11,132 0 11,132 South Korea Communication Services 2,020 9,844 0 11,864 Consumer Discretionary 0 51,613 0 51,613 Consumer Staples 0 6,264 0 6,264 Energy 0 8,057 0 8,057 Financials 0 10,947 0 10,947 Health Care 0 202 0 202 Industrials 133 14,236 0 14,369 Information Technology 0 11,621 0 11,621 Materials 0 12,926 0 12,926 Utilities 0 4,813 0 4,813 Taiwan Communication Services 1,249 1,307 0 2,556 Consumer Discretionary 0 2,716 0 2,716 Consumer Staples 0 1,430 0 1,430 Energy 0 524 0 524 Financials 0 8,808 0 8,808 Industrials 0 2,164 0 2,164 Information Technology 32,836 32,840 0 65,676 Materials 0 6,770 0 6,770 Thailand Communication Services 0 1,549 0 1,549 Consumer Discretionary 0 53 0 53 Consumer Staples 0 3,490 0 3,490 Energy 0 5,784 0 5,784 Financials 0 2,981 0 2,981 Health Care 0 401 0 401 Industrials 2,170 430 0 2,600 Information Technology 49 0 0 49 Materials 48 4,431 0 4,479 Real Estate 0 468 0 468 Utilities 0 441 0 441 Turkey Communication Services 0 968 0 968 Consumer Discretionary 693 679 0 1,372
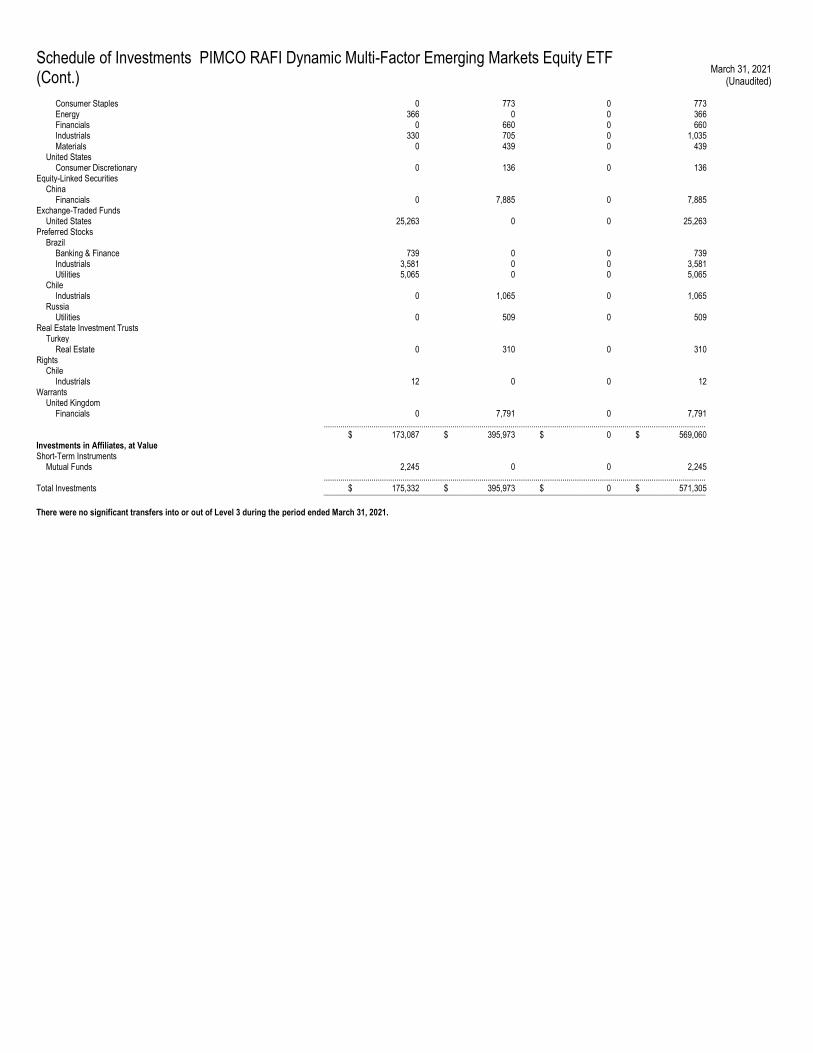
Schedule of Investments PIMCO RAFI Dynamic Multi-Factor Emerging Markets Equity ETF
(Cont.) March 31, 2021
(Unaudited)
Consumer Staples 0 773 0 773 Energy 366 0 0 366 Financials 0 660 0 660 Industrials 330 705 0 1,035 Materials 0 439 0 439 United States Consumer Discretionary 0 136 0 136 Equity-Linked Securities China Financials 0 7,885 0 7,885 Exchange-Traded Funds United States 25,263 0 0 25,263 Preferred Stocks Brazil Banking & Finance 739 0 0 739 Industrials 3,581 0 0 3,581 Utilities 5,065 0 0 5,065 Chile Industrials 0 1,065 0 1,065 Russia Utilities 0 509 0 509 Real Estate Investment Trusts Turkey Real Estate 0 310 0 310 Rights Chile Industrials 12 0 0 12 Warrants United Kingdom Financials 0 7,791 0 7,791 ........................................................................................................................................................................................ $ 173,087 $ 395,973 $ 0 $ 569,060 Investments in Affiliates, at Value Short-Term Instruments Mutual Funds 2,245 0 0 2,245 ........................................................................................................................................................................................ Total Investments $ 175,332 $ 395,973 $ 0 $ 571,305 ____________________________________________________________________________________________ There were no significant transfers into or out of Level 3 during the period ended March 31, 2021.
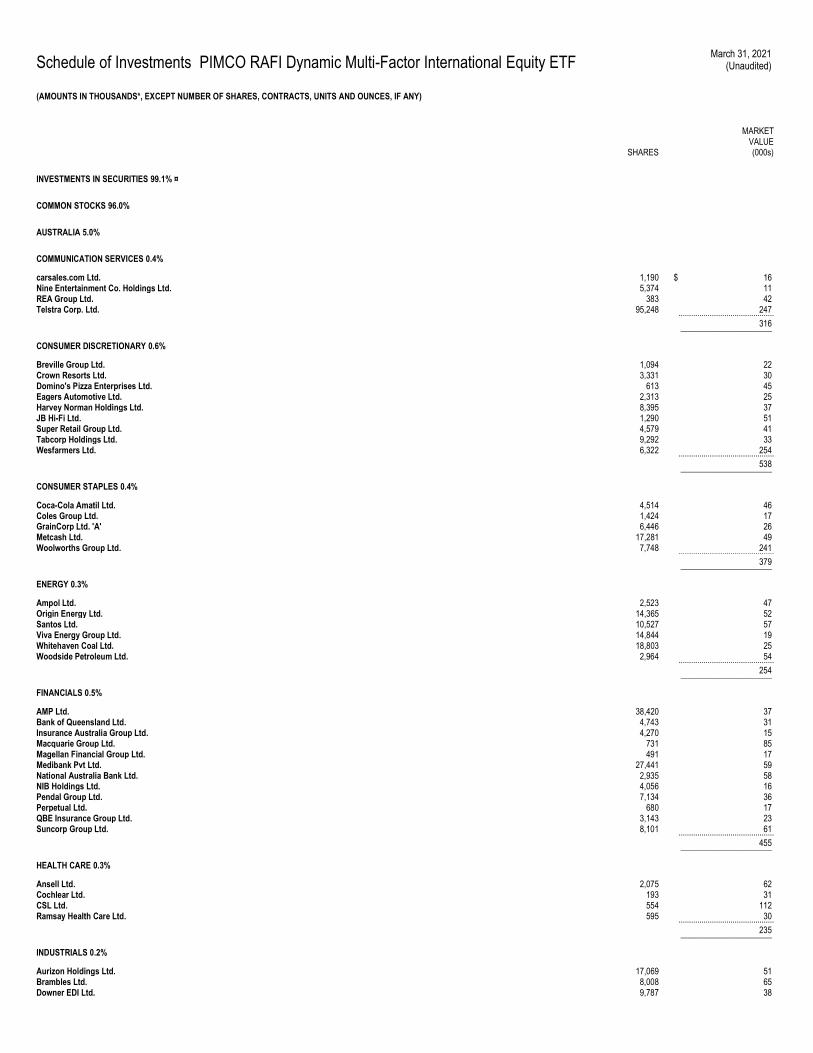
Schedule of Investments PIMCO RAFI Dynamic Multi-Factor International Equity ETF March 31, 2021
(Unaudited)
(AMOUNTS IN THOUSANDS*, EXCEPT NUMBER OF SHARES, CONTRACTS, UNITS AND OUNCES, IF ANY)
SHARES
MARKET VALUE (000s)
INVESTMENTS IN SECURITIES 99.1% ¤
COMMON STOCKS 96.0%
AUSTRALIA 5.0%
COMMUNICATION SERVICES 0.4%
carsales.com Ltd. 1,190 $ 16 Nine Entertainment Co. Holdings Ltd. 5,374 11 REA Group Ltd. 383 42 Telstra Corp. Ltd. 95,248 247 .............................................. 316 ______________________
CONSUMER DISCRETIONARY 0.6%
Breville Group Ltd. 1,094 22 Crown Resorts Ltd. 3,331 30 Domino's Pizza Enterprises Ltd. 613 45 Eagers Automotive Ltd. 2,313 25 Harvey Norman Holdings Ltd. 8,395 37 JB Hi-Fi Ltd. 1,290 51 Super Retail Group Ltd. 4,579 41 Tabcorp Holdings Ltd. 9,292 33 Wesfarmers Ltd. 6,322 254 .............................................. 538 ______________________
CONSUMER STAPLES 0.4%
Coca-Cola Amatil Ltd. 4,514 46 Coles Group Ltd. 1,424 17 GrainCorp Ltd. 'A' 6,446 26 Metcash Ltd. 17,281 49 Woolworths Group Ltd. 7,748 241 .............................................. 379 ______________________
ENERGY 0.3%
Ampol Ltd. 2,523 47 Origin Energy Ltd. 14,365 52 Santos Ltd. 10,527 57 Viva Energy Group Ltd. 14,844 19 Whitehaven Coal Ltd. 18,803 25 Woodside Petroleum Ltd. 2,964 54 .............................................. 254 ______________________
FINANCIALS 0.5%
AMP Ltd. 38,420 37 Bank of Queensland Ltd. 4,743 31 Insurance Australia Group Ltd. 4,270 15 Macquarie Group Ltd. 731 85 Magellan Financial Group Ltd. 491 17 Medibank Pvt Ltd. 27,441 59 National Australia Bank Ltd. 2,935 58 NIB Holdings Ltd. 4,056 16 Pendal Group Ltd. 7,134 36 Perpetual Ltd. 680 17 QBE Insurance Group Ltd. 3,143 23 Suncorp Group Ltd. 8,101 61 .............................................. 455 ______________________
HEALTH CARE 0.3%
Ansell Ltd. 2,075 62 Cochlear Ltd. 193 31 CSL Ltd. 554 112 Ramsay Health Care Ltd. 595 30 .............................................. 235 ______________________
INDUSTRIALS 0.2%
Aurizon Holdings Ltd. 17,069 51 Brambles Ltd. 8,008 65 Downer EDI Ltd. 9,787 38
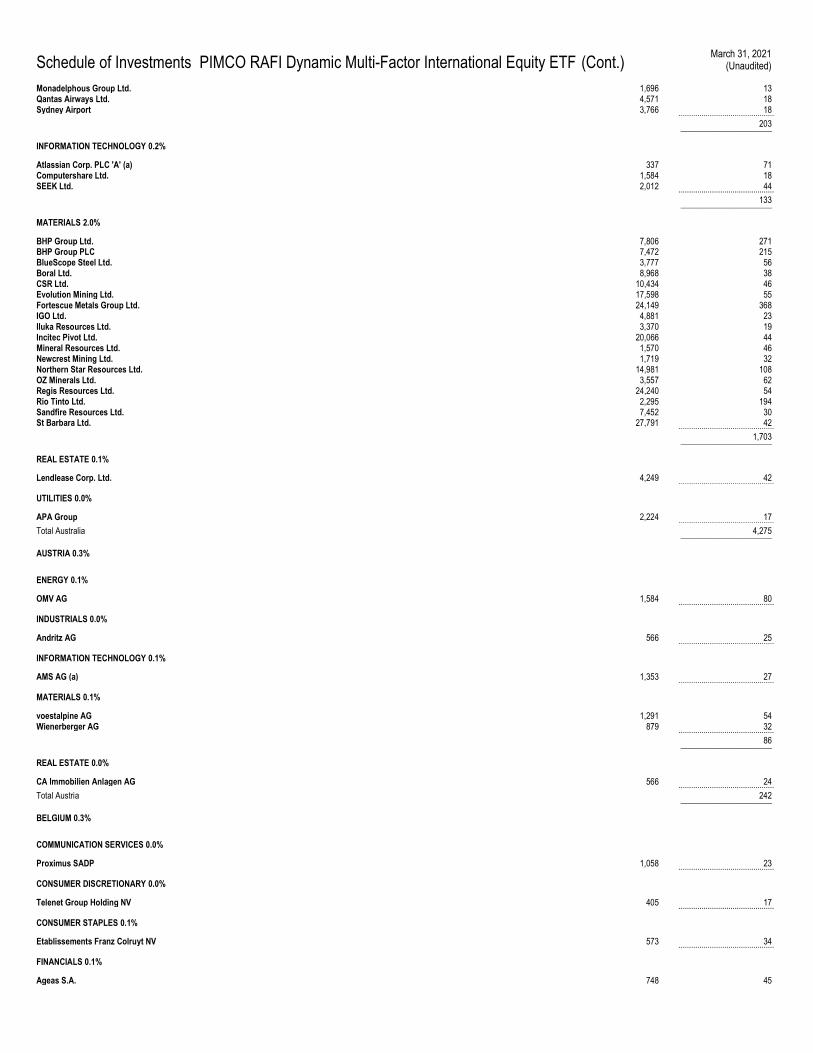
Schedule of Investments PIMCO RAFI Dynamic Multi-Factor International Equity ETF (Cont.) March 31, 2021
(Unaudited)
Monadelphous Group Ltd. 1,696 13 Qantas Airways Ltd. 4,571 18 Sydney Airport 3,766 18 .............................................. 203 ______________________
INFORMATION TECHNOLOGY 0.2%
Atlassian Corp. PLC 'A' (a) 337 71 Computershare Ltd. 1,584 18 SEEK Ltd. 2,012 44 .............................................. 133 ______________________
MATERIALS 2.0%
BHP Group Ltd. 7,806 271 BHP Group PLC 7,472 215 BlueScope Steel Ltd. 3,777 56 Boral Ltd. 8,968 38 CSR Ltd. 10,434 46 Evolution Mining Ltd. 17,598 55 Fortescue Metals Group Ltd. 24,149 368 IGO Ltd. 4,881 23 Iluka Resources Ltd. 3,370 19 Incitec Pivot Ltd. 20,066 44 Mineral Resources Ltd. 1,570 46 Newcrest Mining Ltd. 1,719 32 Northern Star Resources Ltd. 14,981 108 OZ Minerals Ltd. 3,557 62 Regis Resources Ltd. 24,240 54 Rio Tinto Ltd. 2,295 194 Sandfire Resources Ltd. 7,452 30 St Barbara Ltd. 27,791 42 .............................................. 1,703 ______________________
REAL ESTATE 0.1%
Lendlease Corp. Ltd. 4,249 42 ..............................................
UTILITIES 0.0%
APA Group 2,224 17 .............................................. Total Australia 4,275 ______________________
AUSTRIA 0.3%
ENERGY 0.1%
OMV AG 1,584 80 ..............................................
INDUSTRIALS 0.0%
Andritz AG 566 25 ..............................................
INFORMATION TECHNOLOGY 0.1%
AMS AG (a) 1,353 27 ..............................................
MATERIALS 0.1%
voestalpine AG 1,291 54 Wienerberger AG 879 32 .............................................. 86 ______________________
REAL ESTATE 0.0%
CA Immobilien Anlagen AG 566 24 .............................................. Total Austria 242 ______________________
BELGIUM 0.3%
COMMUNICATION SERVICES 0.0%
Proximus SADP 1,058 23 ..............................................
CONSUMER DISCRETIONARY 0.0%
Telenet Group Holding NV 405 17 ..............................................
CONSUMER STAPLES 0.1%
Etablissements Franz Colruyt NV 573 34 ..............................................
FINANCIALS 0.1%
Ageas S.A. 748 45
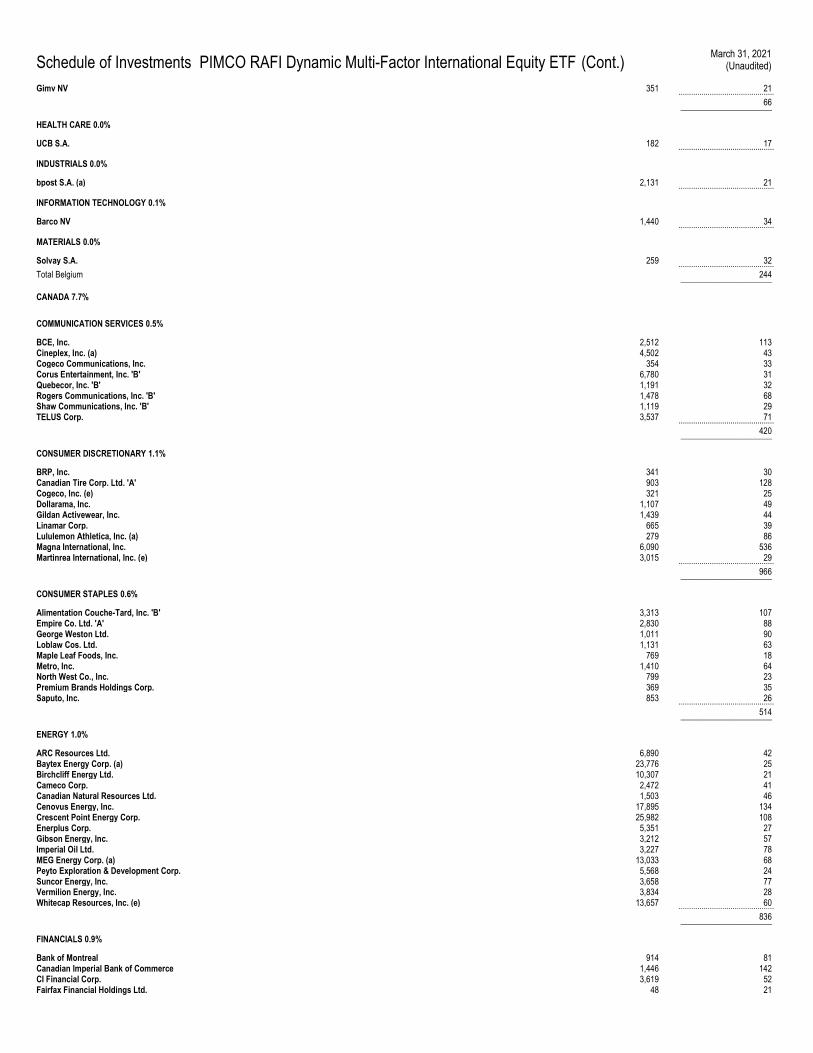
Schedule of Investments PIMCO RAFI Dynamic Multi-Factor International Equity ETF (Cont.) March 31, 2021
(Unaudited)
Gimv NV 351 21 .............................................. 66 ______________________
HEALTH CARE 0.0%
UCB S.A. 182 17 ..............................................
INDUSTRIALS 0.0%
bpost S.A. (a) 2,131 21 ..............................................
INFORMATION TECHNOLOGY 0.1%
Barco NV 1,440 34 ..............................................
MATERIALS 0.0%
Solvay S.A. 259 32 .............................................. Total Belgium 244 ______________________
CANADA 7.7%
COMMUNICATION SERVICES 0.5%
BCE, Inc. 2,512 113 Cineplex, Inc. (a) 4,502 43 Cogeco Communications, Inc. 354 33 Corus Entertainment, Inc. 'B' 6,780 31 Quebecor, Inc. 'B' 1,191 32 Rogers Communications, Inc. 'B' 1,478 68 Shaw Communications, Inc. 'B' 1,119 29 TELUS Corp. 3,537 71 .............................................. 420 ______________________
CONSUMER DISCRETIONARY 1.1%
BRP, Inc. 341 30 Canadian Tire Corp. Ltd. 'A' 903 128 Cogeco, Inc. (e) 321 25 Dollarama, Inc. 1,107 49 Gildan Activewear, Inc. 1,439 44 Linamar Corp. 665 39 Lululemon Athletica, Inc. (a) 279 86 Magna International, Inc. 6,090 536 Martinrea International, Inc. (e) 3,015 29 .............................................. 966 ______________________
CONSUMER STAPLES 0.6%
Alimentation Couche-Tard, Inc. 'B' 3,313 107 Empire Co. Ltd. 'A' 2,830 88 George Weston Ltd. 1,011 90 Loblaw Cos. Ltd. 1,131 63 Maple Leaf Foods, Inc. 769 18 Metro, Inc. 1,410 64 North West Co., Inc. 799 23 Premium Brands Holdings Corp. 369 35 Saputo, Inc. 853 26 .............................................. 514 ______________________
ENERGY 1.0%
ARC Resources Ltd. 6,890 42 Baytex Energy Corp. (a) 23,776 25 Birchcliff Energy Ltd. 10,307 21 Cameco Corp. 2,472 41 Canadian Natural Resources Ltd. 1,503 46 Cenovus Energy, Inc. 17,895 134 Crescent Point Energy Corp. 25,982 108 Enerplus Corp. 5,351 27 Gibson Energy, Inc. 3,212 57 Imperial Oil Ltd. 3,227 78 MEG Energy Corp. (a) 13,033 68 Peyto Exploration & Development Corp. 5,568 24 Suncor Energy, Inc. 3,658 77 Vermilion Energy, Inc. 3,834 28 Whitecap Resources, Inc. (e) 13,657 60 .............................................. 836 ______________________
FINANCIALS 0.9%
Bank of Montreal 914 81 Canadian Imperial Bank of Commerce 1,446 142 CI Financial Corp. 3,619 52 Fairfax Financial Holdings Ltd. 48 21
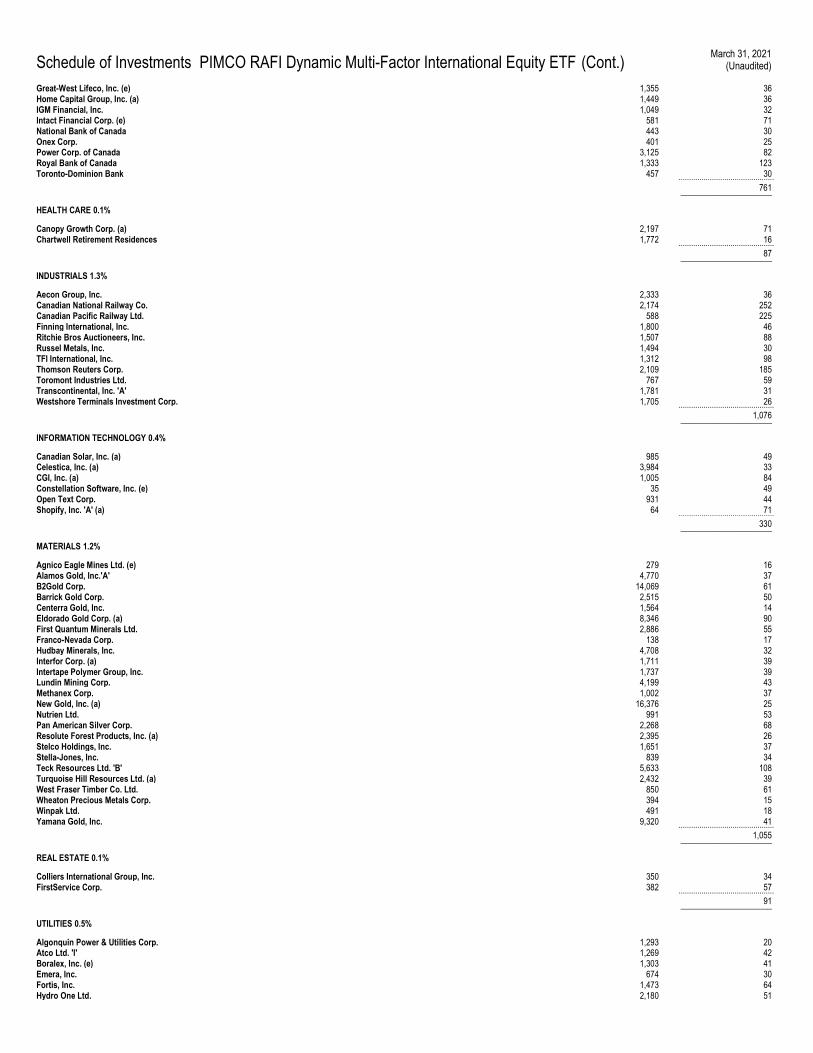
Schedule of Investments PIMCO RAFI Dynamic Multi-Factor International Equity ETF (Cont.) March 31, 2021
(Unaudited)
Great-West Lifeco, Inc. (e) 1,355 36 Home Capital Group, Inc. (a) 1,449 36 IGM Financial, Inc. 1,049 32 Intact Financial Corp. (e) 581 71 National Bank of Canada 443 30 Onex Corp. 401 25 Power Corp. of Canada 3,125 82 Royal Bank of Canada 1,333 123 Toronto-Dominion Bank 457 30 .............................................. 761 ______________________
HEALTH CARE 0.1%
Canopy Growth Corp. (a) 2,197 71 Chartwell Retirement Residences 1,772 16 .............................................. 87 ______________________
INDUSTRIALS 1.3%
Aecon Group, Inc. 2,333 36 Canadian National Railway Co. 2,174 252 Canadian Pacific Railway Ltd. 588 225 Finning International, Inc. 1,800 46 Ritchie Bros Auctioneers, Inc. 1,507 88 Russel Metals, Inc. 1,494 30 TFI International, Inc. 1,312 98 Thomson Reuters Corp. 2,109 185 Toromont Industries Ltd. 767 59 Transcontinental, Inc. 'A' 1,781 31 Westshore Terminals Investment Corp. 1,705 26 .............................................. 1,076 ______________________
INFORMATION TECHNOLOGY 0.4%
Canadian Solar, Inc. (a) 985 49 Celestica, Inc. (a) 3,984 33 CGI, Inc. (a) 1,005 84 Constellation Software, Inc. (e) 35 49 Open Text Corp. 931 44 Shopify, Inc. 'A' (a) 64 71 .............................................. 330 ______________________
MATERIALS 1.2%
Agnico Eagle Mines Ltd. (e) 279 16 Alamos Gold, Inc.'A' 4,770 37 B2Gold Corp. 14,069 61 Barrick Gold Corp. 2,515 50 Centerra Gold, Inc. 1,564 14 Eldorado Gold Corp. (a) 8,346 90 First Quantum Minerals Ltd. 2,886 55 Franco-Nevada Corp. 138 17 Hudbay Minerals, Inc. 4,708 32 Interfor Corp. (a) 1,711 39 Intertape Polymer Group, Inc. 1,737 39 Lundin Mining Corp. 4,199 43 Methanex Corp. 1,002 37 New Gold, Inc. (a) 16,376 25 Nutrien Ltd. 991 53 Pan American Silver Corp. 2,268 68 Resolute Forest Products, Inc. (a) 2,395 26 Stelco Holdings, Inc. 1,651 37 Stella-Jones, Inc. 839 34 Teck Resources Ltd. 'B' 5,633 108 Turquoise Hill Resources Ltd. (a) 2,432 39 West Fraser Timber Co. Ltd. 850 61 Wheaton Precious Metals Corp. 394 15 Winpak Ltd. 491 18 Yamana Gold, Inc. 9,320 41 .............................................. 1,055 ______________________
REAL ESTATE 0.1%
Colliers International Group, Inc. 350 34 FirstService Corp. 382 57 .............................................. 91 ______________________
UTILITIES 0.5%
Algonquin Power & Utilities Corp. 1,293 20 Atco Ltd. 'I' 1,269 42 Boralex, Inc. (e) 1,303 41 Emera, Inc. 674 30 Fortis, Inc. 1,473 64 Hydro One Ltd. 2,180 51
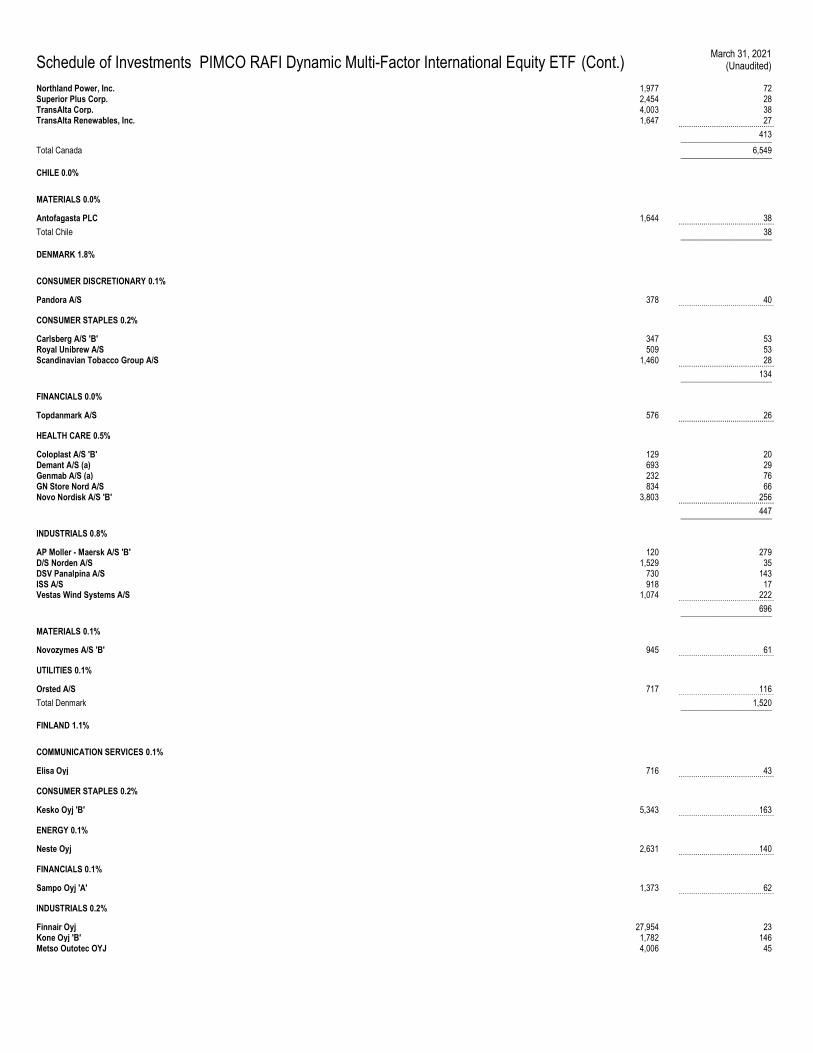
Schedule of Investments PIMCO RAFI Dynamic Multi-Factor International Equity ETF (Cont.) March 31, 2021
(Unaudited)
Northland Power, Inc. 1,977 72 Superior Plus Corp. 2,454 28 TransAlta Corp. 4,003 38 TransAlta Renewables, Inc. 1,647 27 .............................................. 413 ______________________
Total Canada 6,549 ______________________
CHILE 0.0%
MATERIALS 0.0%
Antofagasta PLC 1,644 38 .............................................. Total Chile 38 ______________________
DENMARK 1.8%
CONSUMER DISCRETIONARY 0.1%
Pandora A/S 378 40 ..............................................
CONSUMER STAPLES 0.2%
Carlsberg A/S 'B' 347 53 Royal Unibrew A/S 509 53 Scandinavian Tobacco Group A/S 1,460 28 .............................................. 134 ______________________
FINANCIALS 0.0%
Topdanmark A/S 576 26 ..............................................
HEALTH CARE 0.5%
Coloplast A/S 'B' 129 20 Demant A/S (a) 693 29 Genmab A/S (a) 232 76 GN Store Nord A/S 834 66 Novo Nordisk A/S 'B' 3,803 256 .............................................. 447 ______________________
INDUSTRIALS 0.8%
AP Moller - Maersk A/S 'B' 120 279 D/S Norden A/S 1,529 35 DSV Panalpina A/S 730 143 ISS A/S 918 17 Vestas Wind Systems A/S 1,074 222 .............................................. 696 ______________________
MATERIALS 0.1%
Novozymes A/S 'B' 945 61 ..............................................
UTILITIES 0.1%
Orsted A/S 717 116 .............................................. Total Denmark 1,520 ______________________
FINLAND 1.1%
COMMUNICATION SERVICES 0.1%
Elisa Oyj 716 43 ..............................................
CONSUMER STAPLES 0.2%
Kesko Oyj 'B' 5,343 163 ..............................................
ENERGY 0.1%
Neste Oyj 2,631 140 ..............................................
FINANCIALS 0.1%
Sampo Oyj 'A' 1,373 62 ..............................................
INDUSTRIALS 0.2%
Finnair Oyj 27,954 23 Kone Oyj 'B' 1,782 146 Metso Outotec OYJ 4,006 45
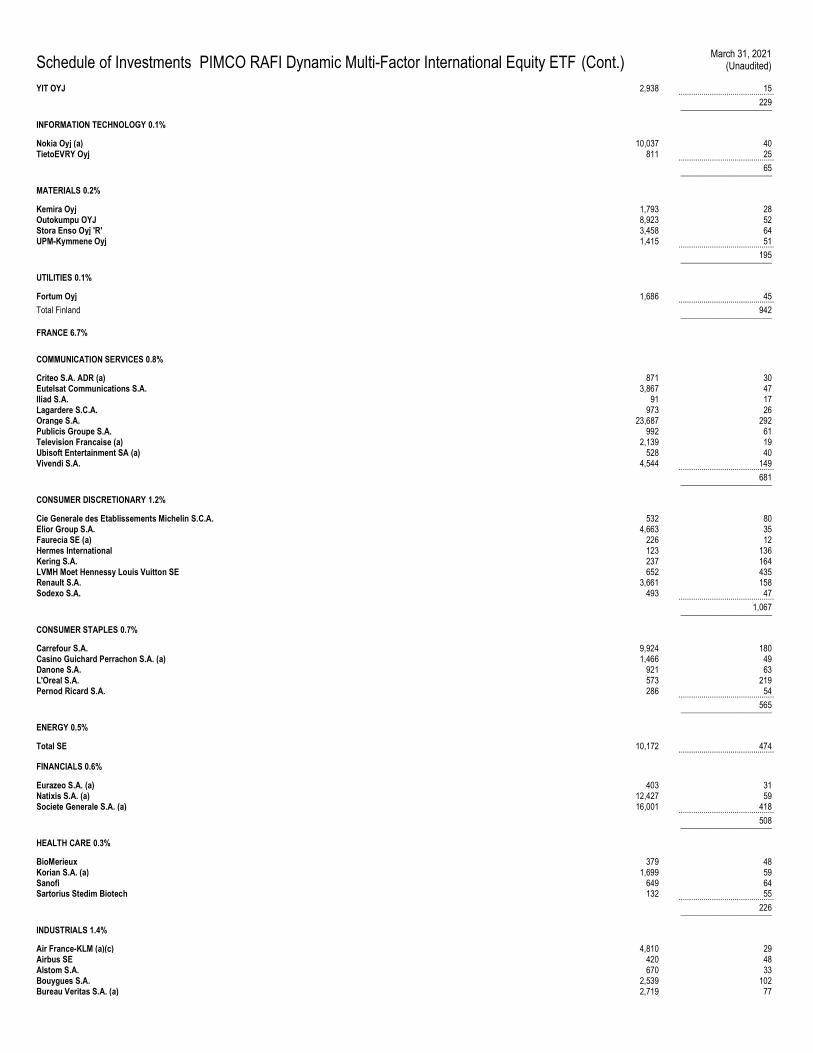
Schedule of Investments PIMCO RAFI Dynamic Multi-Factor International Equity ETF (Cont.) March 31, 2021
(Unaudited)
YIT OYJ 2,938 15 .............................................. 229 ______________________
INFORMATION TECHNOLOGY 0.1%
Nokia Oyj (a) 10,037 40 TietoEVRY Oyj 811 25 .............................................. 65 ______________________
MATERIALS 0.2%
Kemira Oyj 1,793 28 Outokumpu OYJ 8,923 52 Stora Enso Oyj 'R' 3,458 64 UPM-Kymmene Oyj 1,415 51 .............................................. 195 ______________________
UTILITIES 0.1%
Fortum Oyj 1,686 45 .............................................. Total Finland 942 ______________________
FRANCE 6.7%
COMMUNICATION SERVICES 0.8%
Criteo S.A. ADR (a) 871 30 Eutelsat Communications S.A. 3,867 47 Iliad S.A. 91 17 Lagardere S.C.A. 973 26 Orange S.A. 23,687 292 Publicis Groupe S.A. 992 61 Television Francaise (a) 2,139 19 Ubisoft Entertainment SA (a) 528 40 Vivendi S.A. 4,544 149 .............................................. 681 ______________________
CONSUMER DISCRETIONARY 1.2%
Cie Generale des Etablissements Michelin S.C.A. 532 80 Elior Group S.A. 4,663 35 Faurecia SE (a) 226 12 Hermes International 123 136 Kering S.A. 237 164 LVMH Moet Hennessy Louis Vuitton SE 652 435 Renault S.A. 3,661 158 Sodexo S.A. 493 47 .............................................. 1,067 ______________________
CONSUMER STAPLES 0.7%
Carrefour S.A. 9,924 180 Casino Guichard Perrachon S.A. (a) 1,466 49 Danone S.A. 921 63 L'Oreal S.A. 573 219 Pernod Ricard S.A. 286 54 .............................................. 565 ______________________
ENERGY 0.5%
Total SE 10,172 474 ..............................................
FINANCIALS 0.6%
Eurazeo S.A. (a) 403 31 Natixis S.A. (a) 12,427 59 Societe Generale S.A. (a) 16,001 418 .............................................. 508 ______________________
HEALTH CARE 0.3%
BioMerieux 379 48 Korian S.A. (a) 1,699 59 Sanofi 649 64 Sartorius Stedim Biotech 132 55 .............................................. 226 ______________________
INDUSTRIALS 1.4%
Air France-KLM (a)(c) 4,810 29 Airbus SE 420 48 Alstom S.A. 670 33 Bouygues S.A. 2,539 102 Bureau Veritas S.A. (a) 2,719 77
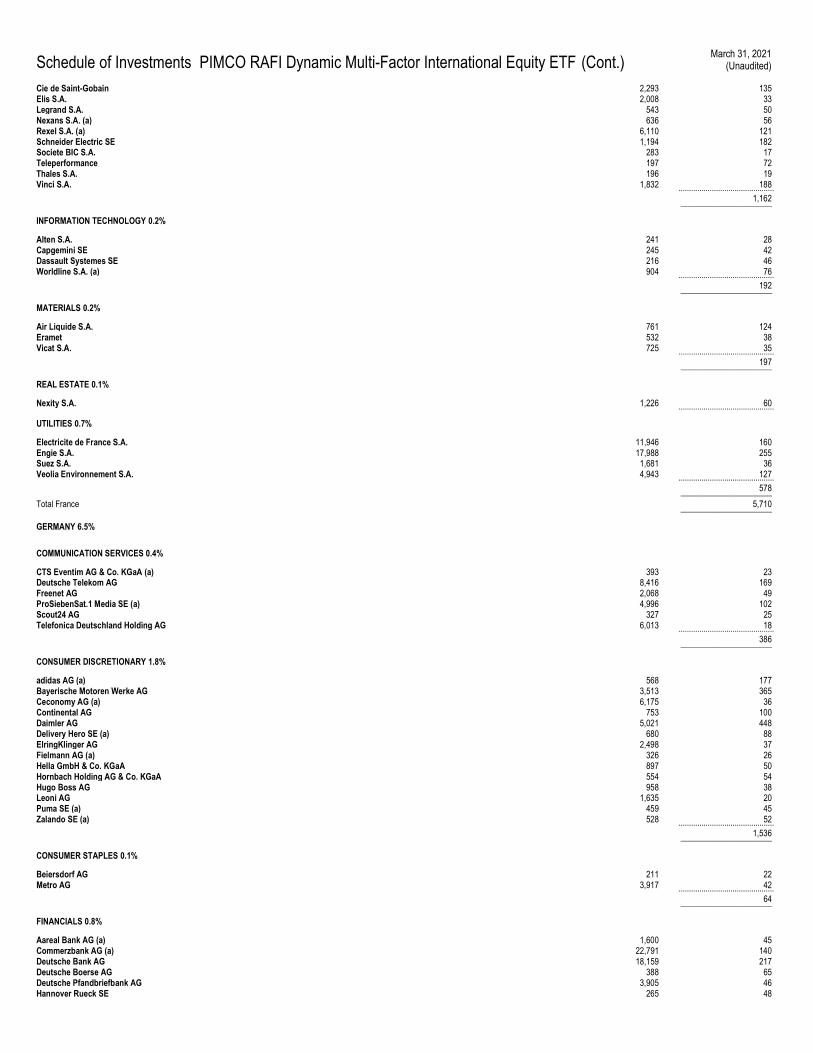
Schedule of Investments PIMCO RAFI Dynamic Multi-Factor International Equity ETF (Cont.) March 31, 2021
(Unaudited)
Cie de Saint-Gobain 2,293 135 Elis S.A. 2,008 33 Legrand S.A. 543 50 Nexans S.A. (a) 636 56 Rexel S.A. (a) 6,110 121 Schneider Electric SE 1,194 182 Societe BIC S.A. 283 17 Teleperformance 197 72 Thales S.A. 196 19 Vinci S.A. 1,832 188 .............................................. 1,162 ______________________
INFORMATION TECHNOLOGY 0.2%
Alten S.A. 241 28 Capgemini SE 245 42 Dassault Systemes SE 216 46 Worldline S.A. (a) 904 76 .............................................. 192 ______________________
MATERIALS 0.2%
Air Liquide S.A. 761 124 Eramet 532 38 Vicat S.A. 725 35 .............................................. 197 ______________________
REAL ESTATE 0.1%
Nexity S.A. 1,226 60 ..............................................
UTILITIES 0.7%
Electricite de France S.A. 11,946 160 Engie S.A. 17,988 255 Suez S.A. 1,681 36 Veolia Environnement S.A. 4,943 127 .............................................. 578 ______________________
Total France 5,710 ______________________
GERMANY 6.5%
COMMUNICATION SERVICES 0.4%
CTS Eventim AG & Co. KGaA (a) 393 23 Deutsche Telekom AG 8,416 169 Freenet AG 2,068 49 ProSiebenSat.1 Media SE (a) 4,996 102 Scout24 AG 327 25 Telefonica Deutschland Holding AG 6,013 18 .............................................. 386 ______________________
CONSUMER DISCRETIONARY 1.8%
adidas AG (a) 568 177 Bayerische Motoren Werke AG 3,513 365 Ceconomy AG (a) 6,175 36 Continental AG 753 100 Daimler AG 5,021 448 Delivery Hero SE (a) 680 88 ElringKlinger AG 2,498 37 Fielmann AG (a) 326 26 Hella GmbH & Co. KGaA 897 50 Hornbach Holding AG & Co. KGaA 554 54 Hugo Boss AG 958 38 Leoni AG 1,635 20 Puma SE (a) 459 45 Zalando SE (a) 528 52 .............................................. 1,536 ______________________
CONSUMER STAPLES 0.1%
Beiersdorf AG 211 22 Metro AG 3,917 42 .............................................. 64 ______________________
FINANCIALS 0.8%
Aareal Bank AG (a) 1,600 45 Commerzbank AG (a) 22,791 140 Deutsche Bank AG 18,159 217 Deutsche Boerse AG 388 65 Deutsche Pfandbriefbank AG 3,905 46 Hannover Rueck SE 265 48
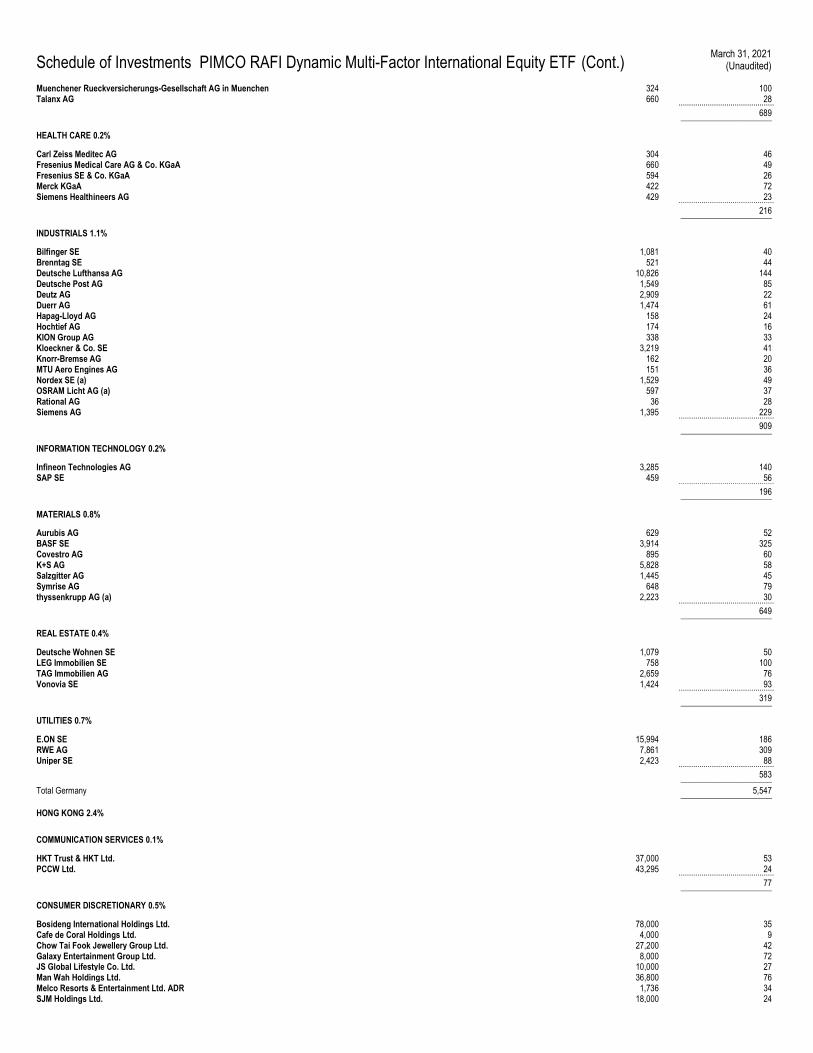
Schedule of Investments PIMCO RAFI Dynamic Multi-Factor International Equity ETF (Cont.) March 31, 2021
(Unaudited)
Muenchener Rueckversicherungs-Gesellschaft AG in Muenchen 324 100 Talanx AG 660 28 .............................................. 689 ______________________
HEALTH CARE 0.2%
Carl Zeiss Meditec AG 304 46 Fresenius Medical Care AG & Co. KGaA 660 49 Fresenius SE & Co. KGaA 594 26 Merck KGaA 422 72 Siemens Healthineers AG 429 23 .............................................. 216 ______________________
INDUSTRIALS 1.1%
Bilfinger SE 1,081 40 Brenntag SE 521 44 Deutsche Lufthansa AG 10,826 144 Deutsche Post AG 1,549 85 Deutz AG 2,909 22 Duerr AG 1,474 61 Hapag-Lloyd AG 158 24 Hochtief AG 174 16 KION Group AG 338 33 Kloeckner & Co. SE 3,219 41 Knorr-Bremse AG 162 20 MTU Aero Engines AG 151 36 Nordex SE (a) 1,529 49 OSRAM Licht AG (a) 597 37 Rational AG 36 28 Siemens AG 1,395 229 .............................................. 909 ______________________
INFORMATION TECHNOLOGY 0.2%
Infineon Technologies AG 3,285 140 SAP SE 459 56 .............................................. 196 ______________________
MATERIALS 0.8%
Aurubis AG 629 52 BASF SE 3,914 325 Covestro AG 895 60 K+S AG 5,828 58 Salzgitter AG 1,445 45 Symrise AG 648 79 thyssenkrupp AG (a) 2,223 30 .............................................. 649 ______________________
REAL ESTATE 0.4%
Deutsche Wohnen SE 1,079 50 LEG Immobilien SE 758 100 TAG Immobilien AG 2,659 76 Vonovia SE 1,424 93 .............................................. 319 ______________________
UTILITIES 0.7%
E.ON SE 15,994 186 RWE AG 7,861 309 Uniper SE 2,423 88 .............................................. 583 ______________________
Total Germany 5,547 ______________________
HONG KONG 2.4%
COMMUNICATION SERVICES 0.1%
HKT Trust & HKT Ltd. 37,000 53 PCCW Ltd. 43,295 24 .............................................. 77 ______________________
CONSUMER DISCRETIONARY 0.5%
Bosideng International Holdings Ltd. 78,000 35 Cafe de Coral Holdings Ltd. 4,000 9 Chow Tai Fook Jewellery Group Ltd. 27,200 42 Galaxy Entertainment Group Ltd. 8,000 72 JS Global Lifestyle Co. Ltd. 10,000 27 Man Wah Holdings Ltd. 36,800 76 Melco Resorts & Entertainment Ltd. ADR 1,736 34 SJM Holdings Ltd. 18,000 24
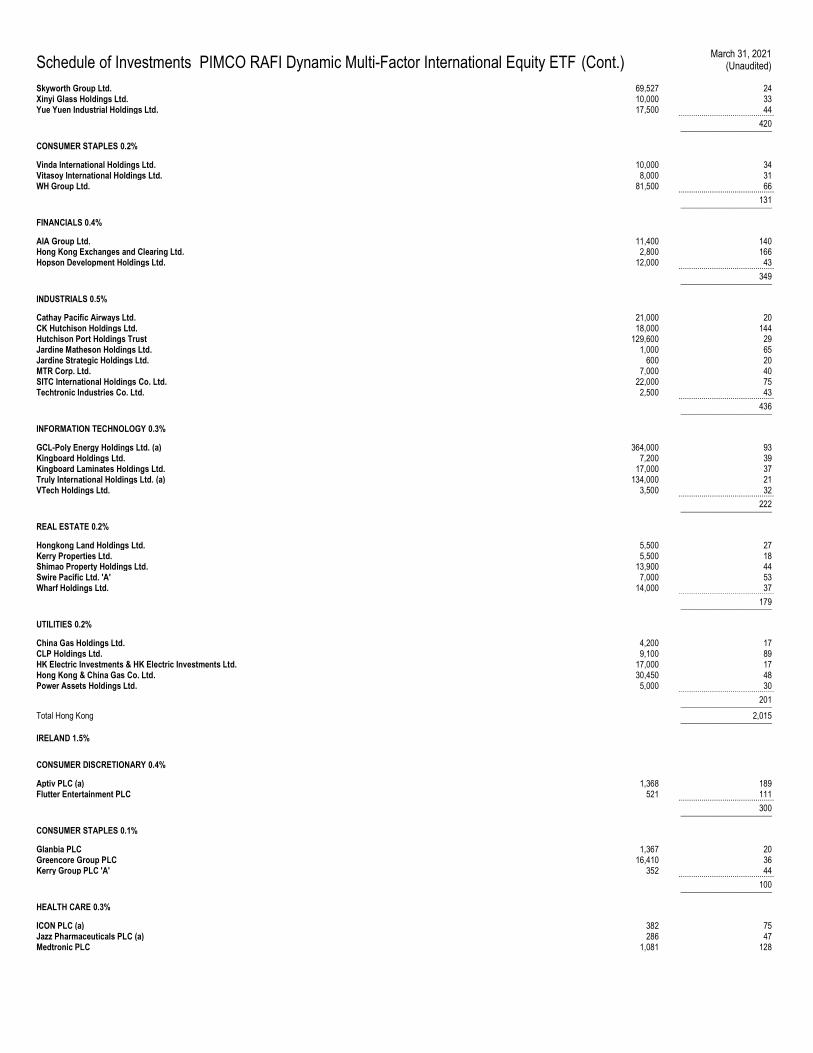
Schedule of Investments PIMCO RAFI Dynamic Multi-Factor International Equity ETF (Cont.) March 31, 2021
(Unaudited)
Skyworth Group Ltd. 69,527 24 Xinyi Glass Holdings Ltd. 10,000 33 Yue Yuen Industrial Holdings Ltd. 17,500 44 .............................................. 420 ______________________
CONSUMER STAPLES 0.2%
Vinda International Holdings Ltd. 10,000 34 Vitasoy International Holdings Ltd. 8,000 31 WH Group Ltd. 81,500 66 .............................................. 131 ______________________
FINANCIALS 0.4%
AIA Group Ltd. 11,400 140 Hong Kong Exchanges and Clearing Ltd. 2,800 166 Hopson Development Holdings Ltd. 12,000 43 .............................................. 349 ______________________
INDUSTRIALS 0.5%
Cathay Pacific Airways Ltd. 21,000 20 CK Hutchison Holdings Ltd. 18,000 144 Hutchison Port Holdings Trust 129,600 29 Jardine Matheson Holdings Ltd. 1,000 65 Jardine Strategic Holdings Ltd. 600 20 MTR Corp. Ltd. 7,000 40 SITC International Holdings Co. Ltd. 22,000 75 Techtronic Industries Co. Ltd. 2,500 43 .............................................. 436 ______________________
INFORMATION TECHNOLOGY 0.3%
GCL-Poly Energy Holdings Ltd. (a) 364,000 93 Kingboard Holdings Ltd. 7,200 39 Kingboard Laminates Holdings Ltd. 17,000 37 Truly International Holdings Ltd. (a) 134,000 21 VTech Holdings Ltd. 3,500 32 .............................................. 222 ______________________
REAL ESTATE 0.2%
Hongkong Land Holdings Ltd. 5,500 27 Kerry Properties Ltd. 5,500 18 Shimao Property Holdings Ltd. 13,900 44 Swire Pacific Ltd. 'A' 7,000 53 Wharf Holdings Ltd. 14,000 37 .............................................. 179 ______________________
UTILITIES 0.2%
China Gas Holdings Ltd. 4,200 17 CLP Holdings Ltd. 9,100 89 HK Electric Investments & HK Electric Investments Ltd. 17,000 17 Hong Kong & China Gas Co. Ltd. 30,450 48 Power Assets Holdings Ltd. 5,000 30 .............................................. 201 ______________________
Total Hong Kong 2,015 ______________________
IRELAND 1.5%
CONSUMER DISCRETIONARY 0.4%
Aptiv PLC (a) 1,368 189 Flutter Entertainment PLC 521 111 .............................................. 300 ______________________
CONSUMER STAPLES 0.1%
Glanbia PLC 1,367 20 Greencore Group PLC 16,410 36 Kerry Group PLC 'A' 352 44 .............................................. 100 ______________________
HEALTH CARE 0.3%
ICON PLC (a) 382 75 Jazz Pharmaceuticals PLC (a) 286 47 Medtronic PLC 1,081 128
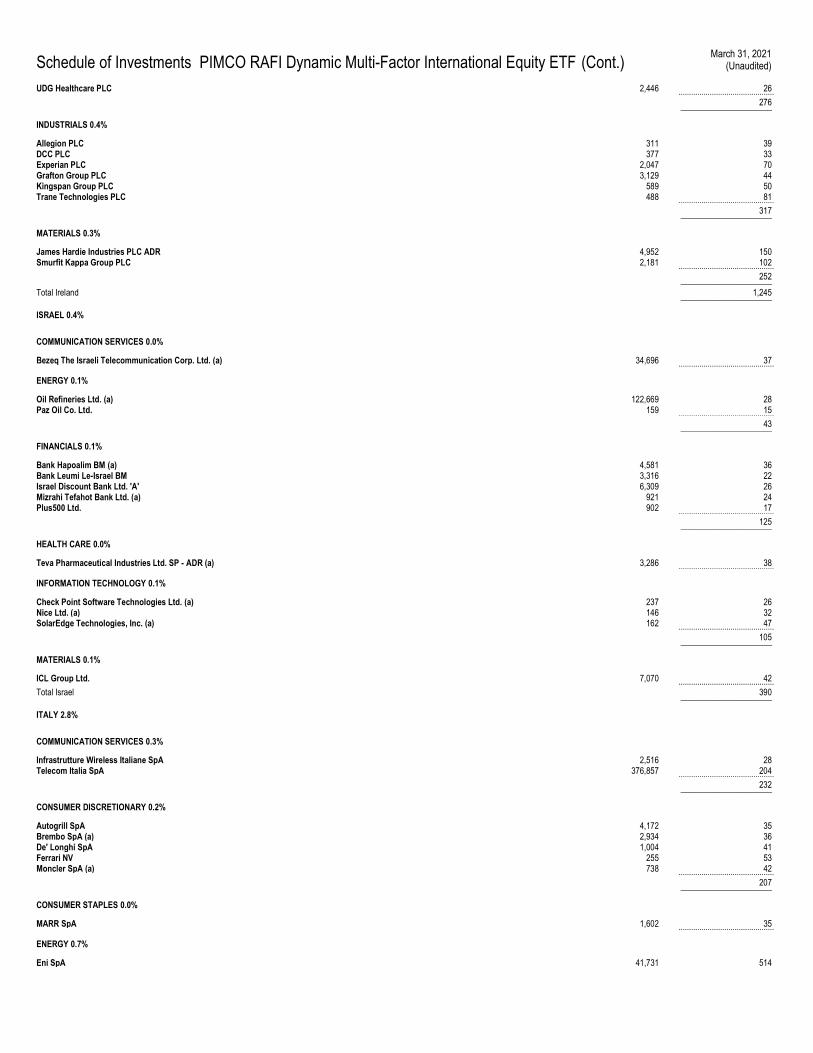
Schedule of Investments PIMCO RAFI Dynamic Multi-Factor International Equity ETF (Cont.) March 31, 2021
(Unaudited)
UDG Healthcare PLC 2,446 26 .............................................. 276 ______________________
INDUSTRIALS 0.4%
Allegion PLC 311 39 DCC PLC 377 33 Experian PLC 2,047 70 Grafton Group PLC 3,129 44 Kingspan Group PLC 589 50 Trane Technologies PLC 488 81 .............................................. 317 ______________________
MATERIALS 0.3%
James Hardie Industries PLC ADR 4,952 150 Smurfit Kappa Group PLC 2,181 102 .............................................. 252 ______________________
Total Ireland 1,245 ______________________
ISRAEL 0.4%
COMMUNICATION SERVICES 0.0%
Bezeq The Israeli Telecommunication Corp. Ltd. (a) 34,696 37 ..............................................
ENERGY 0.1%
Oil Refineries Ltd. (a) 122,669 28 Paz Oil Co. Ltd. 159 15 .............................................. 43 ______________________
FINANCIALS 0.1%
Bank Hapoalim BM (a) 4,581 36 Bank Leumi Le-Israel BM 3,316 22 Israel Discount Bank Ltd. 'A' 6,309 26 Mizrahi Tefahot Bank Ltd. (a) 921 24 Plus500 Ltd. 902 17 .............................................. 125 ______________________
HEALTH CARE 0.0%
Teva Pharmaceutical Industries Ltd. SP - ADR (a) 3,286 38 ..............................................
INFORMATION TECHNOLOGY 0.1%
Check Point Software Technologies Ltd. (a) 237 26 Nice Ltd. (a) 146 32 SolarEdge Technologies, Inc. (a) 162 47 .............................................. 105 ______________________
MATERIALS 0.1%
ICL Group Ltd. 7,070 42 .............................................. Total Israel 390 ______________________
ITALY 2.8%
COMMUNICATION SERVICES 0.3%
Infrastrutture Wireless Italiane SpA 2,516 28 Telecom Italia SpA 376,857 204 .............................................. 232 ______________________
CONSUMER DISCRETIONARY 0.2%
Autogrill SpA 4,172 35 Brembo SpA (a) 2,934 36 De' Longhi SpA 1,004 41 Ferrari NV 255 53 Moncler SpA (a) 738 42 .............................................. 207 ______________________
CONSUMER STAPLES 0.0%
MARR SpA 1,602 35 ..............................................
ENERGY 0.7%
Eni SpA 41,731 514
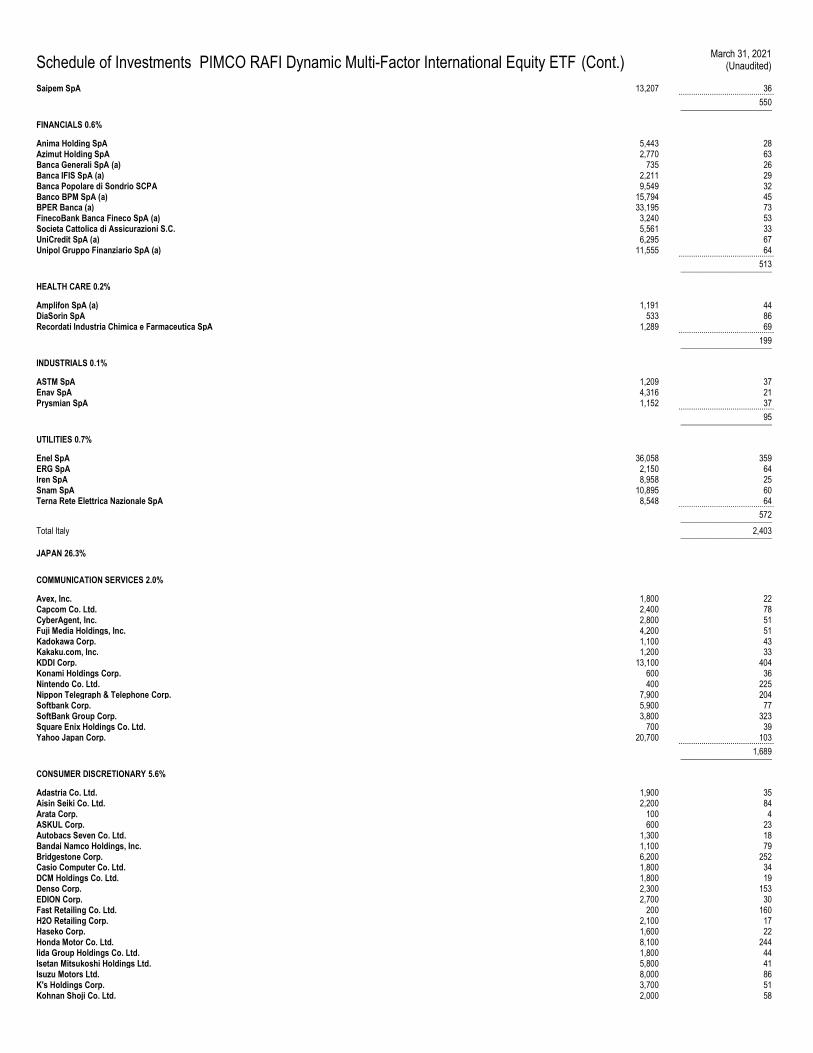
Schedule of Investments PIMCO RAFI Dynamic Multi-Factor International Equity ETF (Cont.) March 31, 2021
(Unaudited)
Saipem SpA 13,207 36 .............................................. 550 ______________________
FINANCIALS 0.6%
Anima Holding SpA 5,443 28 Azimut Holding SpA 2,770 63 Banca Generali SpA (a) 735 26 Banca IFIS SpA (a) 2,211 29 Banca Popolare di Sondrio SCPA 9,549 32 Banco BPM SpA (a) 15,794 45 BPER Banca (a) 33,195 73 FinecoBank Banca Fineco SpA (a) 3,240 53 Societa Cattolica di Assicurazioni S.C. 5,561 33 UniCredit SpA (a) 6,295 67 Unipol Gruppo Finanziario SpA (a) 11,555 64 .............................................. 513 ______________________
HEALTH CARE 0.2%
Amplifon SpA (a) 1,191 44 DiaSorin SpA 533 86 Recordati Industria Chimica e Farmaceutica SpA 1,289 69 .............................................. 199 ______________________
INDUSTRIALS 0.1%
ASTM SpA 1,209 37 Enav SpA 4,316 21 Prysmian SpA 1,152 37 .............................................. 95 ______________________
UTILITIES 0.7%
Enel SpA 36,058 359 ERG SpA 2,150 64 Iren SpA 8,958 25 Snam SpA 10,895 60 Terna Rete Elettrica Nazionale SpA 8,548 64 .............................................. 572 ______________________
Total Italy 2,403 ______________________
JAPAN 26.3%
COMMUNICATION SERVICES 2.0%
Avex, Inc. 1,800 22 Capcom Co. Ltd. 2,400 78 CyberAgent, Inc. 2,800 51 Fuji Media Holdings, Inc. 4,200 51 Kadokawa Corp. 1,100 43 Kakaku.com, Inc. 1,200 33 KDDI Corp. 13,100 404 Konami Holdings Corp. 600 36 Nintendo Co. Ltd. 400 225 Nippon Telegraph & Telephone Corp. 7,900 204 Softbank Corp. 5,900 77 SoftBank Group Corp. 3,800 323 Square Enix Holdings Co. Ltd. 700 39 Yahoo Japan Corp. 20,700 103 .............................................. 1,689 ______________________
CONSUMER DISCRETIONARY 5.6%
Adastria Co. Ltd. 1,900 35 Aisin Seiki Co. Ltd. 2,200 84 Arata Corp. 100 4 ASKUL Corp. 600 23 Autobacs Seven Co. Ltd. 1,300 18 Bandai Namco Holdings, Inc. 1,100 79 Bridgestone Corp. 6,200 252 Casio Computer Co. Ltd. 1,800 34 DCM Holdings Co. Ltd. 1,800 19 Denso Corp. 2,300 153 EDION Corp. 2,700 30 Fast Retailing Co. Ltd. 200 160 H2O Retailing Corp. 2,100 17 Haseko Corp. 1,600 22 Honda Motor Co. Ltd. 8,100 244 Iida Group Holdings Co. Ltd. 1,800 44 Isetan Mitsukoshi Holdings Ltd. 5,800 41 Isuzu Motors Ltd. 8,000 86 K's Holdings Corp. 3,700 51 Kohnan Shoji Co. Ltd. 2,000 58
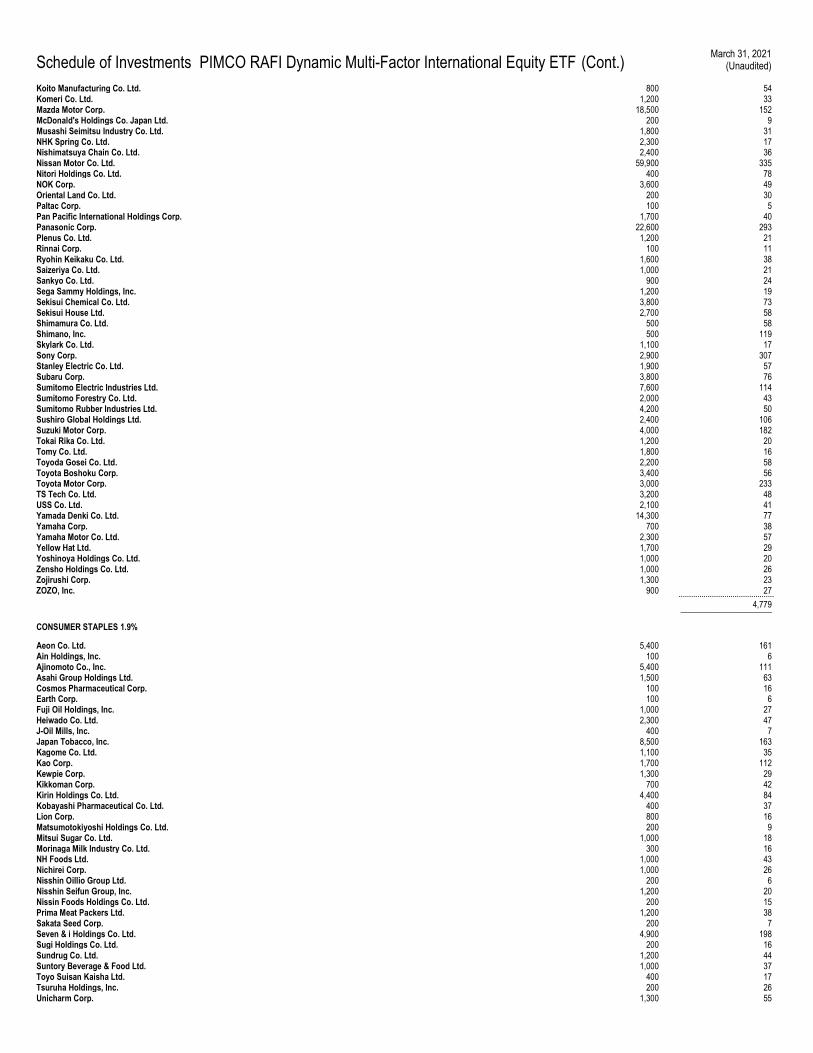
Schedule of Investments PIMCO RAFI Dynamic Multi-Factor International Equity ETF (Cont.) March 31, 2021
(Unaudited)
Koito Manufacturing Co. Ltd. 800 54 Komeri Co. Ltd. 1,200 33 Mazda Motor Corp. 18,500 152 McDonald's Holdings Co. Japan Ltd. 200 9 Musashi Seimitsu Industry Co. Ltd. 1,800 31 NHK Spring Co. Ltd. 2,300 17 Nishimatsuya Chain Co. Ltd. 2,400 36 Nissan Motor Co. Ltd. 59,900 335 Nitori Holdings Co. Ltd. 400 78 NOK Corp. 3,600 49 Oriental Land Co. Ltd. 200 30 Paltac Corp. 100 5 Pan Pacific International Holdings Corp. 1,700 40 Panasonic Corp. 22,600 293 Plenus Co. Ltd. 1,200 21 Rinnai Corp. 100 11 Ryohin Keikaku Co. Ltd. 1,600 38 Saizeriya Co. Ltd. 1,000 21 Sankyo Co. Ltd. 900 24 Sega Sammy Holdings, Inc. 1,200 19 Sekisui Chemical Co. Ltd. 3,800 73 Sekisui House Ltd. 2,700 58 Shimamura Co. Ltd. 500 58 Shimano, Inc. 500 119 Skylark Co. Ltd. 1,100 17 Sony Corp. 2,900 307 Stanley Electric Co. Ltd. 1,900 57 Subaru Corp. 3,800 76 Sumitomo Electric Industries Ltd. 7,600 114 Sumitomo Forestry Co. Ltd. 2,000 43 Sumitomo Rubber Industries Ltd. 4,200 50 Sushiro Global Holdings Ltd. 2,400 106 Suzuki Motor Corp. 4,000 182 Tokai Rika Co. Ltd. 1,200 20 Tomy Co. Ltd. 1,800 16 Toyoda Gosei Co. Ltd. 2,200 58 Toyota Boshoku Corp. 3,400 56 Toyota Motor Corp. 3,000 233 TS Tech Co. Ltd. 3,200 48 USS Co. Ltd. 2,100 41 Yamada Denki Co. Ltd. 14,300 77 Yamaha Corp. 700 38 Yamaha Motor Co. Ltd. 2,300 57 Yellow Hat Ltd. 1,700 29 Yoshinoya Holdings Co. Ltd. 1,000 20 Zensho Holdings Co. Ltd. 1,000 26 Zojirushi Corp. 1,300 23 ZOZO, Inc. 900 27 .............................................. 4,779 ______________________
CONSUMER STAPLES 1.9%
Aeon Co. Ltd. 5,400 161 Ain Holdings, Inc. 100 6 Ajinomoto Co., Inc. 5,400 111 Asahi Group Holdings Ltd. 1,500 63 Cosmos Pharmaceutical Corp. 100 16 Earth Corp. 100 6 Fuji Oil Holdings, Inc. 1,000 27 Heiwado Co. Ltd. 2,300 47 J-Oil Mills, Inc. 400 7 Japan Tobacco, Inc. 8,500 163 Kagome Co. Ltd. 1,100 35 Kao Corp. 1,700 112 Kewpie Corp. 1,300 29 Kikkoman Corp. 700 42 Kirin Holdings Co. Ltd. 4,400 84 Kobayashi Pharmaceutical Co. Ltd. 400 37 Lion Corp. 800 16 Matsumotokiyoshi Holdings Co. Ltd. 200 9 Mitsui Sugar Co. Ltd. 1,000 18 Morinaga Milk Industry Co. Ltd. 300 16 NH Foods Ltd. 1,000 43 Nichirei Corp. 1,000 26 Nisshin Oillio Group Ltd. 200 6 Nisshin Seifun Group, Inc. 1,200 20 Nissin Foods Holdings Co. Ltd. 200 15 Prima Meat Packers Ltd. 1,200 38 Sakata Seed Corp. 200 7 Seven & i Holdings Co. Ltd. 4,900 198 Sugi Holdings Co. Ltd. 200 16 Sundrug Co. Ltd. 1,200 44 Suntory Beverage & Food Ltd. 1,000 37 Toyo Suisan Kaisha Ltd. 400 17 Tsuruha Holdings, Inc. 200 26 Unicharm Corp. 1,300 55
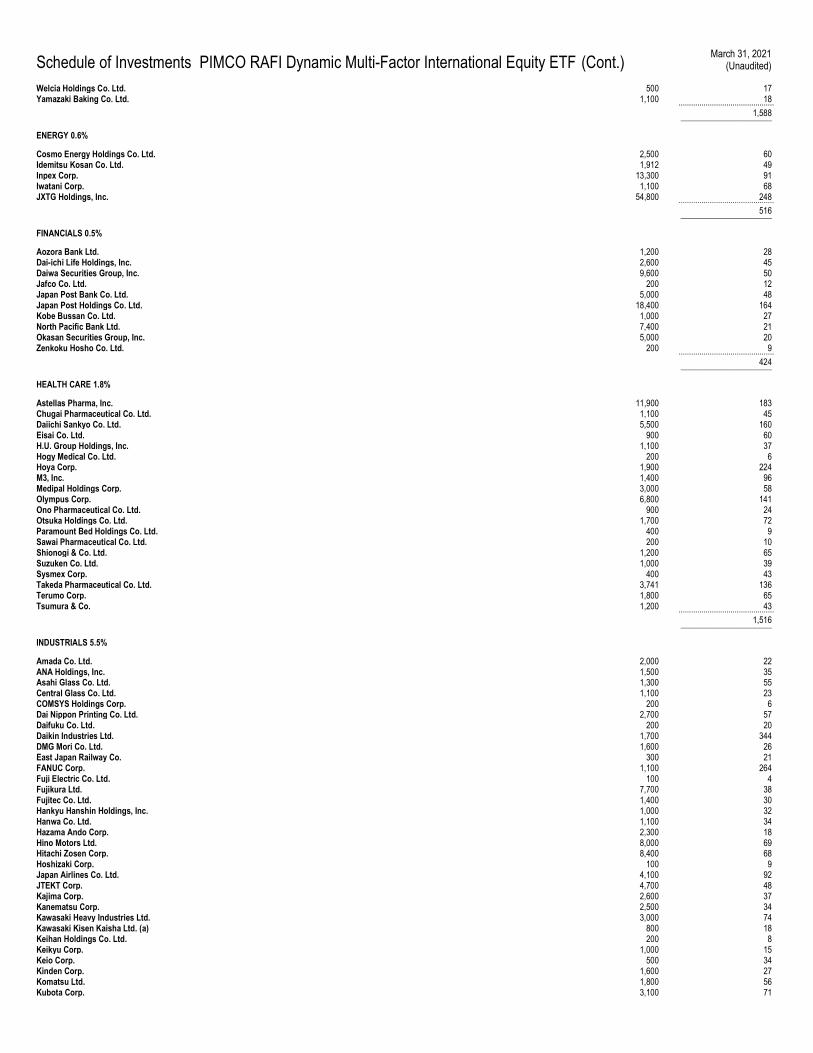
Schedule of Investments PIMCO RAFI Dynamic Multi-Factor International Equity ETF (Cont.) March 31, 2021
(Unaudited)
Welcia Holdings Co. Ltd. 500 17 Yamazaki Baking Co. Ltd. 1,100 18 .............................................. 1,588 ______________________
ENERGY 0.6%
Cosmo Energy Holdings Co. Ltd. 2,500 60 Idemitsu Kosan Co. Ltd. 1,912 49 Inpex Corp. 13,300 91 Iwatani Corp. 1,100 68 JXTG Holdings, Inc. 54,800 248 .............................................. 516 ______________________
FINANCIALS 0.5%
Aozora Bank Ltd. 1,200 28 Dai-ichi Life Holdings, Inc. 2,600 45 Daiwa Securities Group, Inc. 9,600 50 Jafco Co. Ltd. 200 12 Japan Post Bank Co. Ltd. 5,000 48 Japan Post Holdings Co. Ltd. 18,400 164 Kobe Bussan Co. Ltd. 1,000 27 North Pacific Bank Ltd. 7,400 21 Okasan Securities Group, Inc. 5,000 20 Zenkoku Hosho Co. Ltd. 200 9 .............................................. 424 ______________________
HEALTH CARE 1.8%
Astellas Pharma, Inc. 11,900 183 Chugai Pharmaceutical Co. Ltd. 1,100 45 Daiichi Sankyo Co. Ltd. 5,500 160 Eisai Co. Ltd. 900 60 H.U. Group Holdings, Inc. 1,100 37 Hogy Medical Co. Ltd. 200 6 Hoya Corp. 1,900 224 M3, Inc. 1,400 96 Medipal Holdings Corp. 3,000 58 Olympus Corp. 6,800 141 Ono Pharmaceutical Co. Ltd. 900 24 Otsuka Holdings Co. Ltd. 1,700 72 Paramount Bed Holdings Co. Ltd. 400 9 Sawai Pharmaceutical Co. Ltd. 200 10 Shionogi & Co. Ltd. 1,200 65 Suzuken Co. Ltd. 1,000 39 Sysmex Corp. 400 43 Takeda Pharmaceutical Co. Ltd. 3,741 136 Terumo Corp. 1,800 65 Tsumura & Co. 1,200 43 .............................................. 1,516 ______________________
INDUSTRIALS 5.5%
Amada Co. Ltd. 2,000 22 ANA Holdings, Inc. 1,500 35 Asahi Glass Co. Ltd. 1,300 55 Central Glass Co. Ltd. 1,100 23 COMSYS Holdings Corp. 200 6 Dai Nippon Printing Co. Ltd. 2,700 57 Daifuku Co. Ltd. 200 20 Daikin Industries Ltd. 1,700 344 DMG Mori Co. Ltd. 1,600 26 East Japan Railway Co. 300 21 FANUC Corp. 1,100 264 Fuji Electric Co. Ltd. 100 4 Fujikura Ltd. 7,700 38 Fujitec Co. Ltd. 1,400 30 Hankyu Hanshin Holdings, Inc. 1,000 32 Hanwa Co. Ltd. 1,100 34 Hazama Ando Corp. 2,300 18 Hino Motors Ltd. 8,000 69 Hitachi Zosen Corp. 8,400 68 Hoshizaki Corp. 100 9 Japan Airlines Co. Ltd. 4,100 92 JTEKT Corp. 4,700 48 Kajima Corp. 2,600 37 Kanematsu Corp. 2,500 34 Kawasaki Heavy Industries Ltd. 3,000 74 Kawasaki Kisen Kaisha Ltd. (a) 800 18 Keihan Holdings Co. Ltd. 200 8 Keikyu Corp. 1,000 15 Keio Corp. 500 34 Kinden Corp. 1,600 27 Komatsu Ltd. 1,800 56 Kubota Corp. 3,100 71
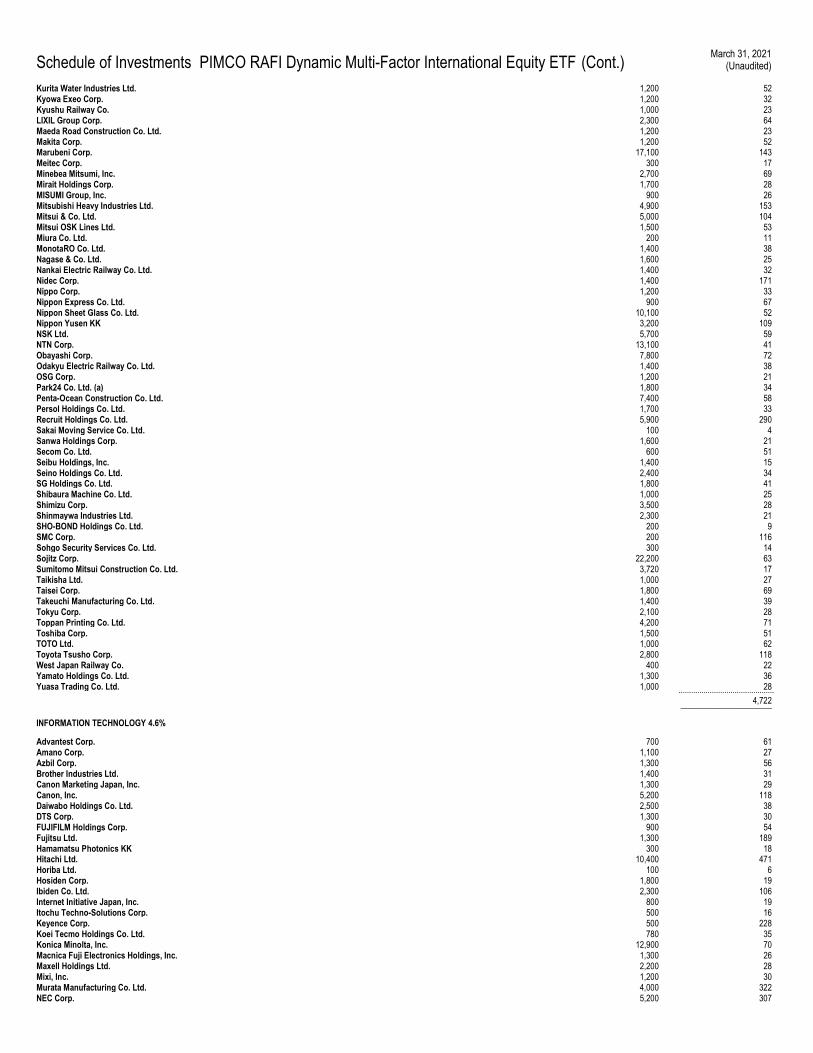
Schedule of Investments PIMCO RAFI Dynamic Multi-Factor International Equity ETF (Cont.) March 31, 2021
(Unaudited)
Kurita Water Industries Ltd. 1,200 52 Kyowa Exeo Corp. 1,200 32 Kyushu Railway Co. 1,000 23 LIXIL Group Corp. 2,300 64 Maeda Road Construction Co. Ltd. 1,200 23 Makita Corp. 1,200 52 Marubeni Corp. 17,100 143 Meitec Corp. 300 17 Minebea Mitsumi, Inc. 2,700 69 Mirait Holdings Corp. 1,700 28 MISUMI Group, Inc. 900 26 Mitsubishi Heavy Industries Ltd. 4,900 153 Mitsui & Co. Ltd. 5,000 104 Mitsui OSK Lines Ltd. 1,500 53 Miura Co. Ltd. 200 11 MonotaRO Co. Ltd. 1,400 38 Nagase & Co. Ltd. 1,600 25 Nankai Electric Railway Co. Ltd. 1,400 32 Nidec Corp. 1,400 171 Nippo Corp. 1,200 33 Nippon Express Co. Ltd. 900 67 Nippon Sheet Glass Co. Ltd. 10,100 52 Nippon Yusen KK 3,200 109 NSK Ltd. 5,700 59 NTN Corp. 13,100 41 Obayashi Corp. 7,800 72 Odakyu Electric Railway Co. Ltd. 1,400 38 OSG Corp. 1,200 21 Park24 Co. Ltd. (a) 1,800 34 Penta-Ocean Construction Co. Ltd. 7,400 58 Persol Holdings Co. Ltd. 1,700 33 Recruit Holdings Co. Ltd. 5,900 290 Sakai Moving Service Co. Ltd. 100 4 Sanwa Holdings Corp. 1,600 21 Secom Co. Ltd. 600 51 Seibu Holdings, Inc. 1,400 15 Seino Holdings Co. Ltd. 2,400 34 SG Holdings Co. Ltd. 1,800 41 Shibaura Machine Co. Ltd. 1,000 25 Shimizu Corp. 3,500 28 Shinmaywa Industries Ltd. 2,300 21 SHO-BOND Holdings Co. Ltd. 200 9 SMC Corp. 200 116 Sohgo Security Services Co. Ltd. 300 14 Sojitz Corp. 22,200 63 Sumitomo Mitsui Construction Co. Ltd. 3,720 17 Taikisha Ltd. 1,000 27 Taisei Corp. 1,800 69 Takeuchi Manufacturing Co. Ltd. 1,400 39 Tokyu Corp. 2,100 28 Toppan Printing Co. Ltd. 4,200 71 Toshiba Corp. 1,500 51 TOTO Ltd. 1,000 62 Toyota Tsusho Corp. 2,800 118 West Japan Railway Co. 400 22 Yamato Holdings Co. Ltd. 1,300 36 Yuasa Trading Co. Ltd. 1,000 28 .............................................. 4,722 ______________________
INFORMATION TECHNOLOGY 4.6%
Advantest Corp. 700 61 Amano Corp. 1,100 27 Azbil Corp. 1,300 56 Brother Industries Ltd. 1,400 31 Canon Marketing Japan, Inc. 1,300 29 Canon, Inc. 5,200 118 Daiwabo Holdings Co. Ltd. 2,500 38 DTS Corp. 1,300 30 FUJIFILM Holdings Corp. 900 54 Fujitsu Ltd. 1,300 189 Hamamatsu Photonics KK 300 18 Hitachi Ltd. 10,400 471 Horiba Ltd. 100 6 Hosiden Corp. 1,800 19 Ibiden Co. Ltd. 2,300 106 Internet Initiative Japan, Inc. 800 19 Itochu Techno-Solutions Corp. 500 16 Keyence Corp. 500 228 Koei Tecmo Holdings Co. Ltd. 780 35 Konica Minolta, Inc. 12,900 70 Macnica Fuji Electronics Holdings, Inc. 1,300 26 Maxell Holdings Ltd. 2,200 28 Mixi, Inc. 1,200 30 Murata Manufacturing Co. Ltd. 4,000 322 NEC Corp. 5,200 307
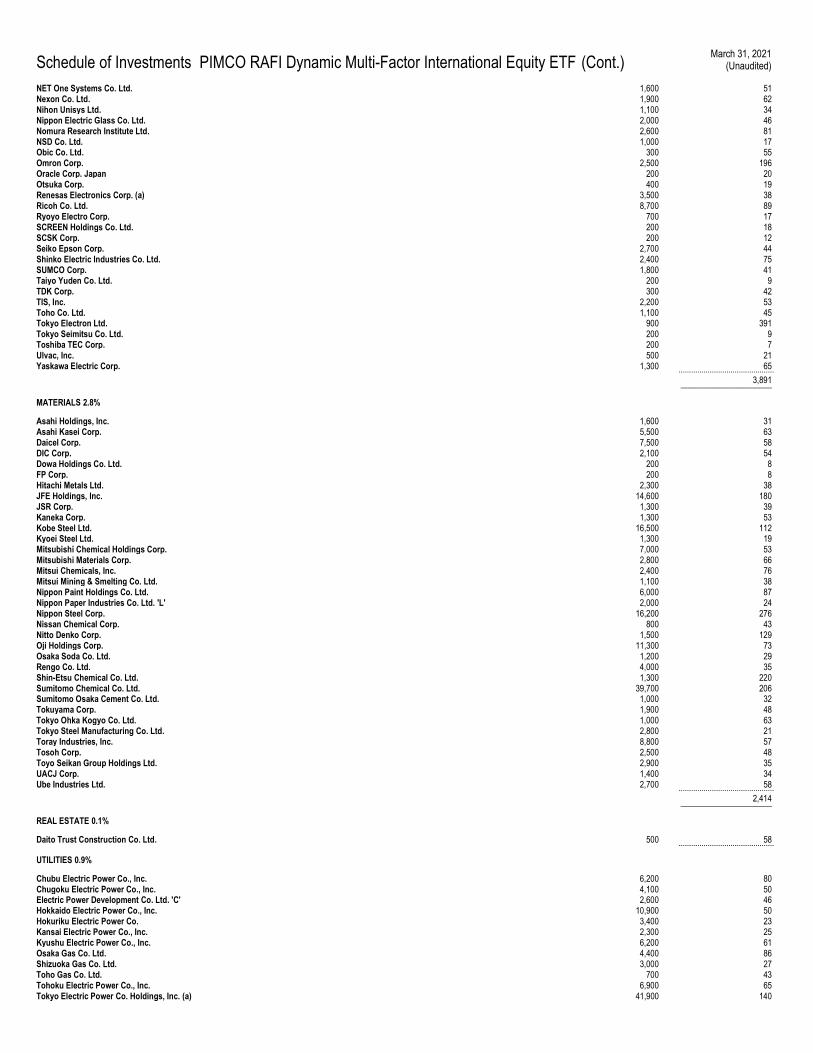
Schedule of Investments PIMCO RAFI Dynamic Multi-Factor International Equity ETF (Cont.) March 31, 2021
(Unaudited)
NET One Systems Co. Ltd. 1,600 51 Nexon Co. Ltd. 1,900 62 Nihon Unisys Ltd. 1,100 34 Nippon Electric Glass Co. Ltd. 2,000 46 Nomura Research Institute Ltd. 2,600 81 NSD Co. Ltd. 1,000 17 Obic Co. Ltd. 300 55 Omron Corp. 2,500 196 Oracle Corp. Japan 200 20 Otsuka Corp. 400 19 Renesas Electronics Corp. (a) 3,500 38 Ricoh Co. Ltd. 8,700 89 Ryoyo Electro Corp. 700 17 SCREEN Holdings Co. Ltd. 200 18 SCSK Corp. 200 12 Seiko Epson Corp. 2,700 44 Shinko Electric Industries Co. Ltd. 2,400 75 SUMCO Corp. 1,800 41 Taiyo Yuden Co. Ltd. 200 9 TDK Corp. 300 42 TIS, Inc. 2,200 53 Toho Co. Ltd. 1,100 45 Tokyo Electron Ltd. 900 391 Tokyo Seimitsu Co. Ltd. 200 9 Toshiba TEC Corp. 200 7 Ulvac, Inc. 500 21 Yaskawa Electric Corp. 1,300 65 .............................................. 3,891 ______________________
MATERIALS 2.8%
Asahi Holdings, Inc. 1,600 31 Asahi Kasei Corp. 5,500 63 Daicel Corp. 7,500 58 DIC Corp. 2,100 54 Dowa Holdings Co. Ltd. 200 8 FP Corp. 200 8 Hitachi Metals Ltd. 2,300 38 JFE Holdings, Inc. 14,600 180 JSR Corp. 1,300 39 Kaneka Corp. 1,300 53 Kobe Steel Ltd. 16,500 112 Kyoei Steel Ltd. 1,300 19 Mitsubishi Chemical Holdings Corp. 7,000 53 Mitsubishi Materials Corp. 2,800 66 Mitsui Chemicals, Inc. 2,400 76 Mitsui Mining & Smelting Co. Ltd. 1,100 38 Nippon Paint Holdings Co. Ltd. 6,000 87 Nippon Paper Industries Co. Ltd. 'L' 2,000 24 Nippon Steel Corp. 16,200 276 Nissan Chemical Corp. 800 43 Nitto Denko Corp. 1,500 129 Oji Holdings Corp. 11,300 73 Osaka Soda Co. Ltd. 1,200 29 Rengo Co. Ltd. 4,000 35 Shin-Etsu Chemical Co. Ltd. 1,300 220 Sumitomo Chemical Co. Ltd. 39,700 206 Sumitomo Osaka Cement Co. Ltd. 1,000 32 Tokuyama Corp. 1,900 48 Tokyo Ohka Kogyo Co. Ltd. 1,000 63 Tokyo Steel Manufacturing Co. Ltd. 2,800 21 Toray Industries, Inc. 8,800 57 Tosoh Corp. 2,500 48 Toyo Seikan Group Holdings Ltd. 2,900 35 UACJ Corp. 1,400 34 Ube Industries Ltd. 2,700 58 .............................................. 2,414 ______________________
REAL ESTATE 0.1%
Daito Trust Construction Co. Ltd. 500 58 ..............................................
UTILITIES 0.9%
Chubu Electric Power Co., Inc. 6,200 80 Chugoku Electric Power Co., Inc. 4,100 50 Electric Power Development Co. Ltd. 'C' 2,600 46 Hokkaido Electric Power Co., Inc. 10,900 50 Hokuriku Electric Power Co. 3,400 23 Kansai Electric Power Co., Inc. 2,300 25 Kyushu Electric Power Co., Inc. 6,200 61 Osaka Gas Co. Ltd. 4,400 86 Shizuoka Gas Co. Ltd. 3,000 27 Toho Gas Co. Ltd. 700 43 Tohoku Electric Power Co., Inc. 6,900 65 Tokyo Electric Power Co. Holdings, Inc. (a) 41,900 140
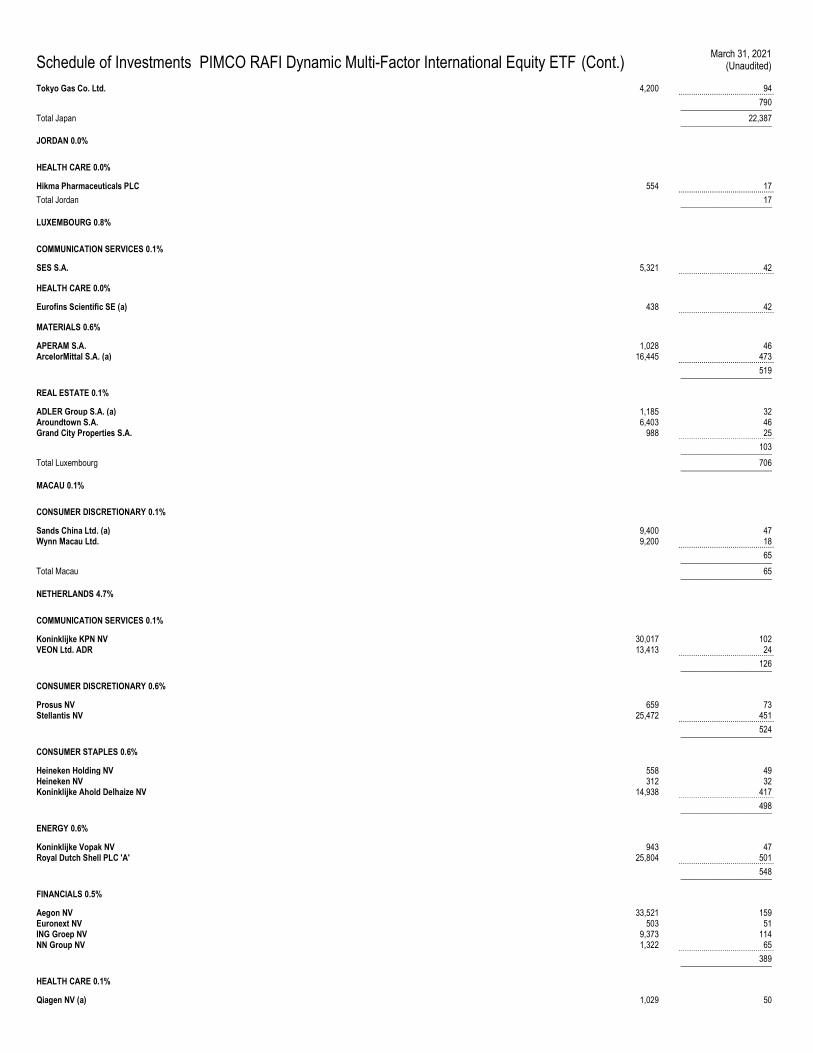
Schedule of Investments PIMCO RAFI Dynamic Multi-Factor International Equity ETF (Cont.) March 31, 2021
(Unaudited)
Tokyo Gas Co. Ltd. 4,200 94 .............................................. 790 ______________________
Total Japan 22,387 ______________________
JORDAN 0.0%
HEALTH CARE 0.0%
Hikma Pharmaceuticals PLC 554 17 .............................................. Total Jordan 17 ______________________
LUXEMBOURG 0.8%
COMMUNICATION SERVICES 0.1%
SES S.A. 5,321 42 ..............................................
HEALTH CARE 0.0%
Eurofins Scientific SE (a) 438 42 ..............................................
MATERIALS 0.6%
APERAM S.A. 1,028 46 ArcelorMittal S.A. (a) 16,445 473 .............................................. 519 ______________________
REAL ESTATE 0.1%
ADLER Group S.A. (a) 1,185 32 Aroundtown S.A. 6,403 46 Grand City Properties S.A. 988 25 .............................................. 103 ______________________
Total Luxembourg 706 ______________________
MACAU 0.1%
CONSUMER DISCRETIONARY 0.1%
Sands China Ltd. (a) 9,400 47 Wynn Macau Ltd. 9,200 18 .............................................. 65 ______________________
Total Macau 65 ______________________
NETHERLANDS 4.7%
COMMUNICATION SERVICES 0.1%
Koninklijke KPN NV 30,017 102 VEON Ltd. ADR 13,413 24 .............................................. 126 ______________________
CONSUMER DISCRETIONARY 0.6%
Prosus NV 659 73 Stellantis NV 25,472 451 .............................................. 524 ______________________
CONSUMER STAPLES 0.6%
Heineken Holding NV 558 49 Heineken NV 312 32 Koninklijke Ahold Delhaize NV 14,938 417 .............................................. 498 ______________________
ENERGY 0.6%
Koninklijke Vopak NV 943 47 Royal Dutch Shell PLC 'A' 25,804 501 .............................................. 548 ______________________
FINANCIALS 0.5%
Aegon NV 33,521 159 Euronext NV 503 51 ING Groep NV 9,373 114 NN Group NV 1,322 65 .............................................. 389 ______________________
HEALTH CARE 0.1%
Qiagen NV (a) 1,029 50
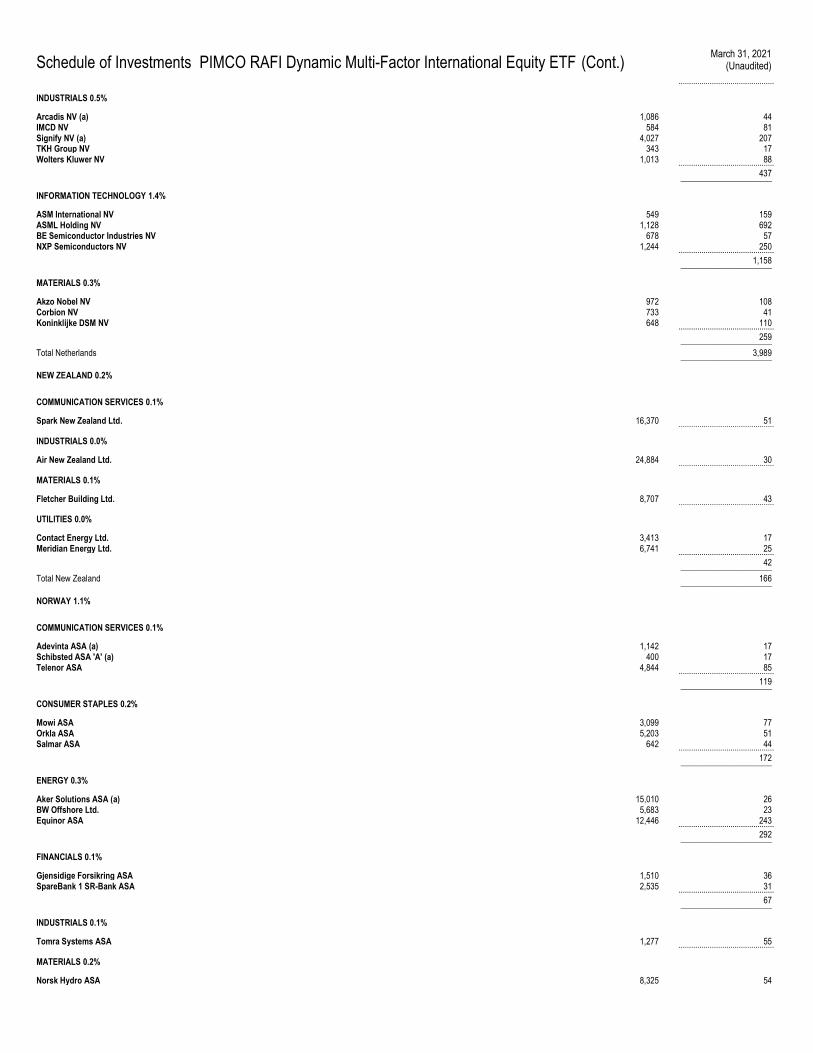
Schedule of Investments PIMCO RAFI Dynamic Multi-Factor International Equity ETF (Cont.) March 31, 2021
(Unaudited)
..............................................
INDUSTRIALS 0.5%
Arcadis NV (a) 1,086 44 IMCD NV 584 81 Signify NV (a) 4,027 207 TKH Group NV 343 17 Wolters Kluwer NV 1,013 88 .............................................. 437 ______________________
INFORMATION TECHNOLOGY 1.4%
ASM International NV 549 159 ASML Holding NV 1,128 692 BE Semiconductor Industries NV 678 57 NXP Semiconductors NV 1,244 250 .............................................. 1,158 ______________________
MATERIALS 0.3%
Akzo Nobel NV 972 108 Corbion NV 733 41 Koninklijke DSM NV 648 110 .............................................. 259 ______________________
Total Netherlands 3,989 ______________________
NEW ZEALAND 0.2%
COMMUNICATION SERVICES 0.1%
Spark New Zealand Ltd. 16,370 51 ..............................................
INDUSTRIALS 0.0%
Air New Zealand Ltd. 24,884 30 ..............................................
MATERIALS 0.1%
Fletcher Building Ltd. 8,707 43 ..............................................
UTILITIES 0.0%
Contact Energy Ltd. 3,413 17 Meridian Energy Ltd. 6,741 25 .............................................. 42 ______________________
Total New Zealand 166 ______________________
NORWAY 1.1%
COMMUNICATION SERVICES 0.1%
Adevinta ASA (a) 1,142 17 Schibsted ASA 'A' (a) 400 17 Telenor ASA 4,844 85 .............................................. 119 ______________________
CONSUMER STAPLES 0.2%
Mowi ASA 3,099 77 Orkla ASA 5,203 51 Salmar ASA 642 44 .............................................. 172 ______________________
ENERGY 0.3%
Aker Solutions ASA (a) 15,010 26 BW Offshore Ltd. 5,683 23 Equinor ASA 12,446 243 .............................................. 292 ______________________
FINANCIALS 0.1%
Gjensidige Forsikring ASA 1,510 36 SpareBank 1 SR-Bank ASA 2,535 31 .............................................. 67 ______________________
INDUSTRIALS 0.1%
Tomra Systems ASA 1,277 55 ..............................................
MATERIALS 0.2%
Norsk Hydro ASA 8,325 54
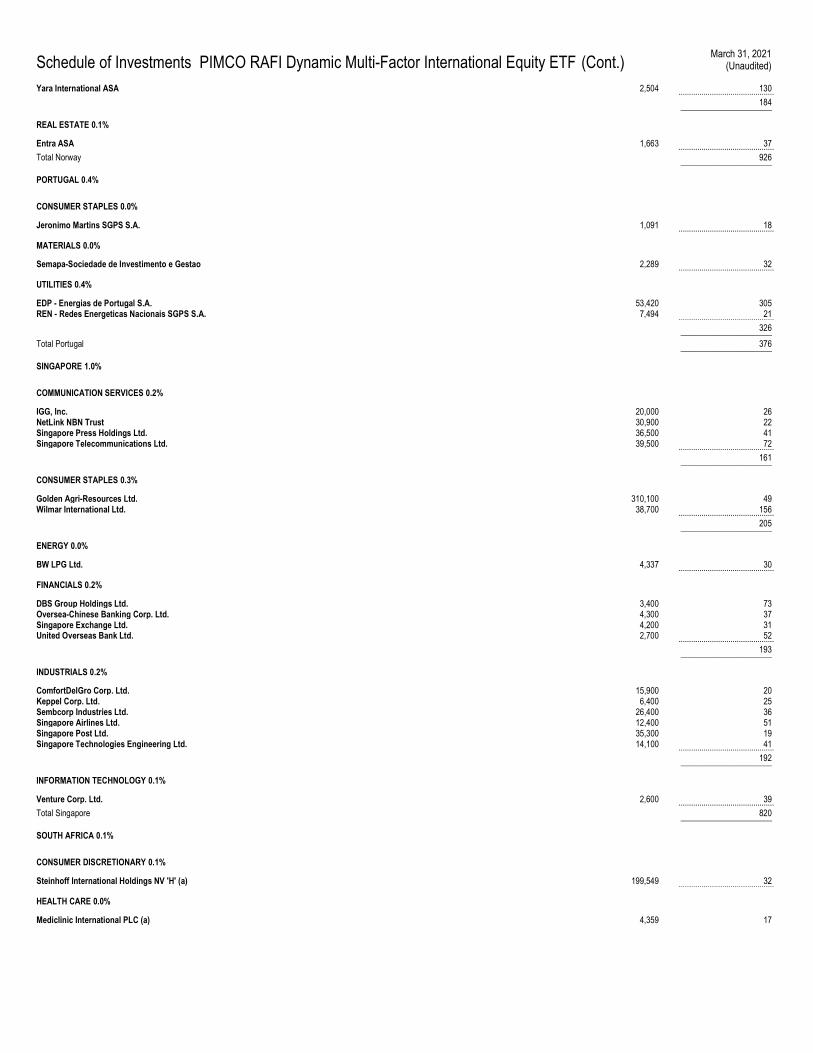
Schedule of Investments PIMCO RAFI Dynamic Multi-Factor International Equity ETF (Cont.) March 31, 2021
(Unaudited)
Yara International ASA 2,504 130 .............................................. 184 ______________________
REAL ESTATE 0.1%
Entra ASA 1,663 37 .............................................. Total Norway 926 ______________________
PORTUGAL 0.4%
CONSUMER STAPLES 0.0%
Jeronimo Martins SGPS S.A. 1,091 18 ..............................................
MATERIALS 0.0%
Semapa-Sociedade de Investimento e Gestao 2,289 32 ..............................................
UTILITIES 0.4%
EDP - Energias de Portugal S.A. 53,420 305 REN - Redes Energeticas Nacionais SGPS S.A. 7,494 21 .............................................. 326 ______________________
Total Portugal 376 ______________________
SINGAPORE 1.0%
COMMUNICATION SERVICES 0.2%
IGG, Inc. 20,000 26 NetLink NBN Trust 30,900 22 Singapore Press Holdings Ltd. 36,500 41 Singapore Telecommunications Ltd. 39,500 72 .............................................. 161 ______________________
CONSUMER STAPLES 0.3%
Golden Agri-Resources Ltd. 310,100 49 Wilmar International Ltd. 38,700 156 .............................................. 205 ______________________
ENERGY 0.0%
BW LPG Ltd. 4,337 30 ..............................................
FINANCIALS 0.2%
DBS Group Holdings Ltd. 3,400 73 Oversea-Chinese Banking Corp. Ltd. 4,300 37 Singapore Exchange Ltd. 4,200 31 United Overseas Bank Ltd. 2,700 52 .............................................. 193 ______________________
INDUSTRIALS 0.2%
ComfortDelGro Corp. Ltd. 15,900 20 Keppel Corp. Ltd. 6,400 25 Sembcorp Industries Ltd. 26,400 36 Singapore Airlines Ltd. 12,400 51 Singapore Post Ltd. 35,300 19 Singapore Technologies Engineering Ltd. 14,100 41 .............................................. 192 ______________________
INFORMATION TECHNOLOGY 0.1%
Venture Corp. Ltd. 2,600 39 .............................................. Total Singapore 820 ______________________
SOUTH AFRICA 0.1%
CONSUMER DISCRETIONARY 0.1%
Steinhoff International Holdings NV 'H' (a) 199,549 32 ..............................................
HEALTH CARE 0.0%
Mediclinic International PLC (a) 4,359 17
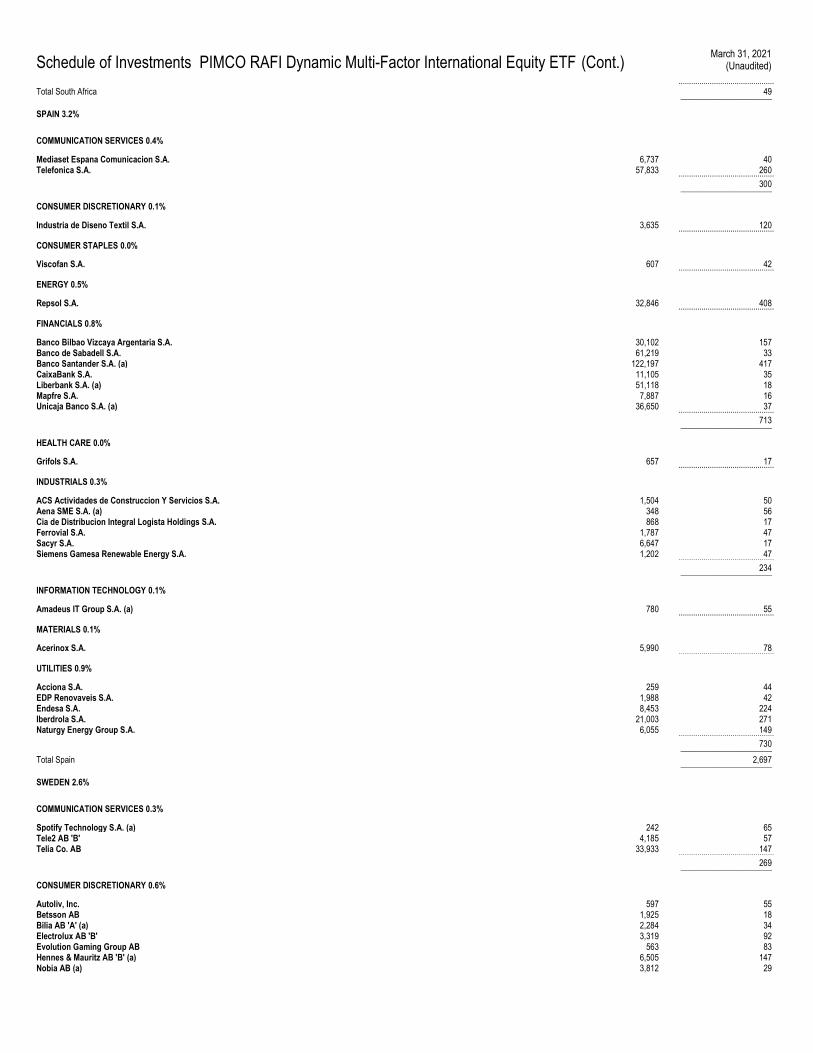
Schedule of Investments PIMCO RAFI Dynamic Multi-Factor International Equity ETF (Cont.) March 31, 2021
(Unaudited)
.............................................. Total South Africa 49 ______________________
SPAIN 3.2%
COMMUNICATION SERVICES 0.4%
Mediaset Espana Comunicacion S.A. 6,737 40 Telefonica S.A. 57,833 260 .............................................. 300 ______________________
CONSUMER DISCRETIONARY 0.1%
Industria de Diseno Textil S.A. 3,635 120 ..............................................
CONSUMER STAPLES 0.0%
Viscofan S.A. 607 42 ..............................................
ENERGY 0.5%
Repsol S.A. 32,846 408 ..............................................
FINANCIALS 0.8%
Banco Bilbao Vizcaya Argentaria S.A. 30,102 157 Banco de Sabadell S.A. 61,219 33 Banco Santander S.A. (a) 122,197 417 CaixaBank S.A. 11,105 35 Liberbank S.A. (a) 51,118 18 Mapfre S.A. 7,887 16 Unicaja Banco S.A. (a) 36,650 37 .............................................. 713 ______________________
HEALTH CARE 0.0%
Grifols S.A. 657 17 ..............................................
INDUSTRIALS 0.3%
ACS Actividades de Construccion Y Servicios S.A. 1,504 50 Aena SME S.A. (a) 348 56 Cia de Distribucion Integral Logista Holdings S.A. 868 17 Ferrovial S.A. 1,787 47 Sacyr S.A. 6,647 17 Siemens Gamesa Renewable Energy S.A. 1,202 47 .............................................. 234 ______________________
INFORMATION TECHNOLOGY 0.1%
Amadeus IT Group S.A. (a) 780 55 ..............................................
MATERIALS 0.1%
Acerinox S.A. 5,990 78 ..............................................
UTILITIES 0.9%
Acciona S.A. 259 44 EDP Renovaveis S.A. 1,988 42 Endesa S.A. 8,453 224 Iberdrola S.A. 21,003 271 Naturgy Energy Group S.A. 6,055 149 .............................................. 730 ______________________
Total Spain 2,697 ______________________
SWEDEN 2.6%
COMMUNICATION SERVICES 0.3%
Spotify Technology S.A. (a) 242 65 Tele2 AB 'B' 4,185 57 Telia Co. AB 33,933 147 .............................................. 269 ______________________
CONSUMER DISCRETIONARY 0.6%
Autoliv, Inc. 597 55 Betsson AB 1,925 18 Bilia AB 'A' (a) 2,284 34 Electrolux AB 'B' 3,319 92 Evolution Gaming Group AB 563 83 Hennes & Mauritz AB 'B' (a) 6,505 147 Nobia AB (a) 3,812 29
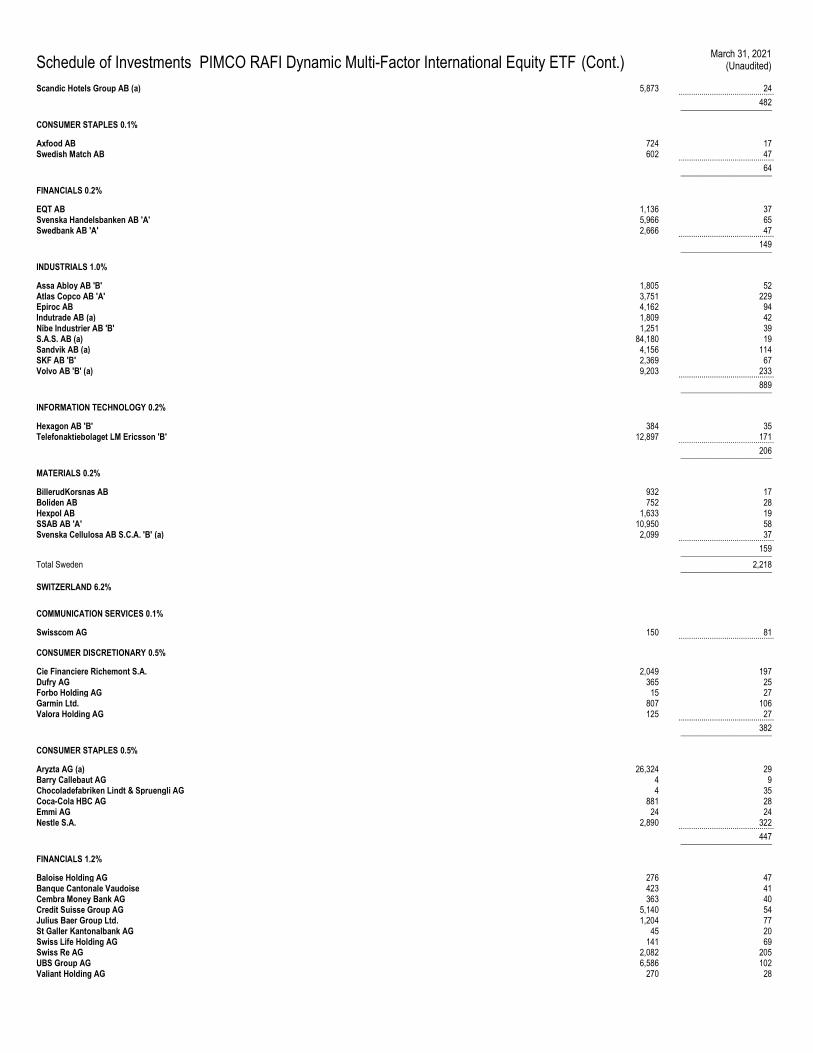
Schedule of Investments PIMCO RAFI Dynamic Multi-Factor International Equity ETF (Cont.) March 31, 2021
(Unaudited)
Scandic Hotels Group AB (a) 5,873 24 .............................................. 482 ______________________
CONSUMER STAPLES 0.1%
Axfood AB 724 17 Swedish Match AB 602 47 .............................................. 64 ______________________
FINANCIALS 0.2%
EQT AB 1,136 37 Svenska Handelsbanken AB 'A' 5,966 65 Swedbank AB 'A' 2,666 47 .............................................. 149 ______________________
INDUSTRIALS 1.0%
Assa Abloy AB 'B' 1,805 52 Atlas Copco AB 'A' 3,751 229 Epiroc AB 4,162 94 Indutrade AB (a) 1,809 42 Nibe Industrier AB 'B' 1,251 39 S.A.S. AB (a) 84,180 19 Sandvik AB (a) 4,156 114 SKF AB 'B' 2,369 67 Volvo AB 'B' (a) 9,203 233 .............................................. 889 ______________________
INFORMATION TECHNOLOGY 0.2%
Hexagon AB 'B' 384 35 Telefonaktiebolaget LM Ericsson 'B' 12,897 171 .............................................. 206 ______________________
MATERIALS 0.2%
BillerudKorsnas AB 932 17 Boliden AB 752 28 Hexpol AB 1,633 19 SSAB AB 'A' 10,950 58 Svenska Cellulosa AB S.C.A. 'B' (a) 2,099 37 .............................................. 159 ______________________
Total Sweden 2,218 ______________________
SWITZERLAND 6.2%
COMMUNICATION SERVICES 0.1%
Swisscom AG 150 81 ..............................................
CONSUMER DISCRETIONARY 0.5%
Cie Financiere Richemont S.A. 2,049 197 Dufry AG 365 25 Forbo Holding AG 15 27 Garmin Ltd. 807 106 Valora Holding AG 125 27 .............................................. 382 ______________________
CONSUMER STAPLES 0.5%
Aryzta AG (a) 26,324 29 Barry Callebaut AG 4 9 Chocoladefabriken Lindt & Spruengli AG 4 35 Coca-Cola HBC AG 881 28 Emmi AG 24 24 Nestle S.A. 2,890 322 .............................................. 447 ______________________
FINANCIALS 1.2%
Baloise Holding AG 276 47 Banque Cantonale Vaudoise 423 41 Cembra Money Bank AG 363 40 Credit Suisse Group AG 5,140 54 Julius Baer Group Ltd. 1,204 77 St Galler Kantonalbank AG 45 20 Swiss Life Holding AG 141 69 Swiss Re AG 2,082 205 UBS Group AG 6,586 102 Valiant Holding AG 270 28
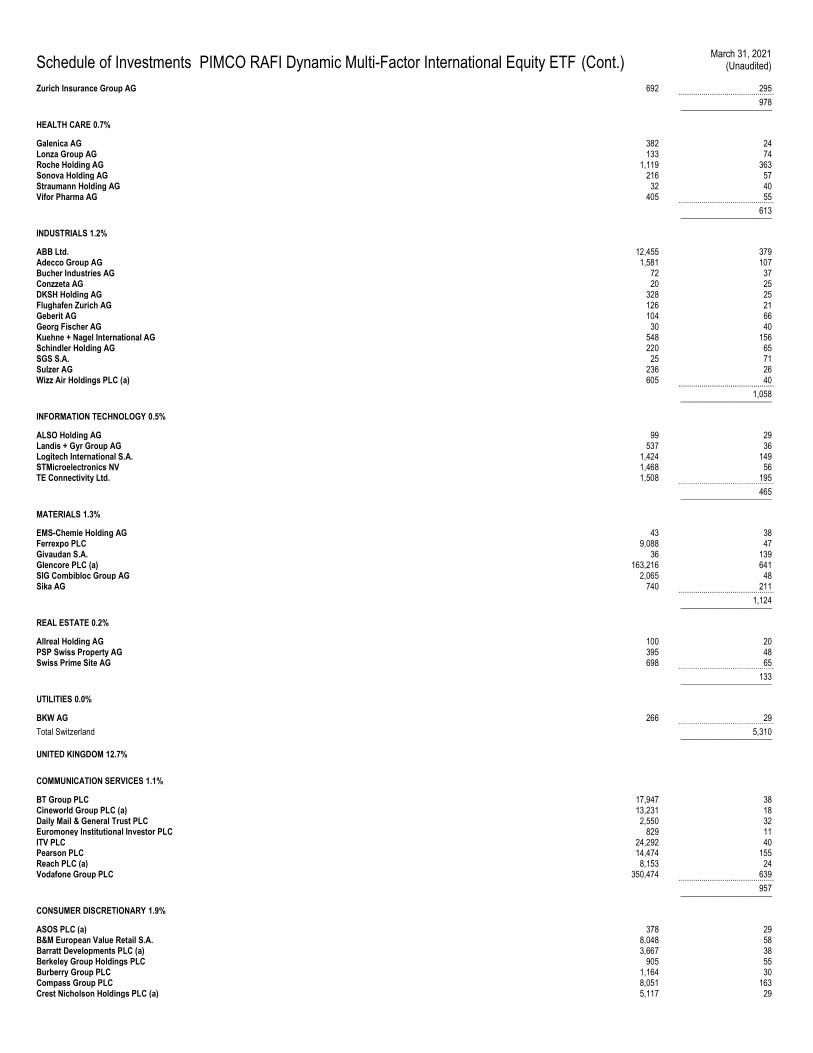
Schedule of Investments PIMCO RAFI Dynamic Multi-Factor International Equity ETF (Cont.) March 31, 2021
(Unaudited)
Zurich Insurance Group AG 692 295 .............................................. 978 ______________________
HEALTH CARE 0.7%
Galenica AG 382 24 Lonza Group AG 133 74 Roche Holding AG 1,119 363 Sonova Holding AG 216 57 Straumann Holding AG 32 40 Vifor Pharma AG 405 55 .............................................. 613 ______________________
INDUSTRIALS 1.2%
ABB Ltd. 12,455 379 Adecco Group AG 1,581 107 Bucher Industries AG 72 37 Conzzeta AG 20 25 DKSH Holding AG 328 25 Flughafen Zurich AG 126 21 Geberit AG 104 66 Georg Fischer AG 30 40 Kuehne + Nagel International AG 548 156 Schindler Holding AG 220 65 SGS S.A. 25 71 Sulzer AG 236 26 Wizz Air Holdings PLC (a) 605 40 .............................................. 1,058 ______________________
INFORMATION TECHNOLOGY 0.5%
ALSO Holding AG 99 29 Landis + Gyr Group AG 537 36 Logitech International S.A. 1,424 149 STMicroelectronics NV 1,468 56 TE Connectivity Ltd. 1,508 195 .............................................. 465 ______________________
MATERIALS 1.3%
EMS-Chemie Holding AG 43 38 Ferrexpo PLC 9,088 47 Givaudan S.A. 36 139 Glencore PLC (a) 163,216 641 SIG Combibloc Group AG 2,065 48 Sika AG 740 211 .............................................. 1,124 ______________________
REAL ESTATE 0.2%
Allreal Holding AG 100 20 PSP Swiss Property AG 395 48 Swiss Prime Site AG 698 65 .............................................. 133 ______________________
UTILITIES 0.0%
BKW AG 266 29 .............................................. Total Switzerland 5,310 ______________________
UNITED KINGDOM 12.7%
COMMUNICATION SERVICES 1.1%
BT Group PLC 17,947 38 Cineworld Group PLC (a) 13,231 18 Daily Mail & General Trust PLC 2,550 32 Euromoney Institutional Investor PLC 829 11 ITV PLC 24,292 40 Pearson PLC 14,474 155 Reach PLC (a) 8,153 24 Vodafone Group PLC 350,474 639 .............................................. 957 ______________________
CONSUMER DISCRETIONARY 1.9%
ASOS PLC (a) 378 29 B&M European Value Retail S.A. 8,048 58 Barratt Developments PLC (a) 3,667 38 Berkeley Group Holdings PLC 905 55 Burberry Group PLC 1,164 30 Compass Group PLC 8,051 163 Crest Nicholson Holdings PLC (a) 5,117 29
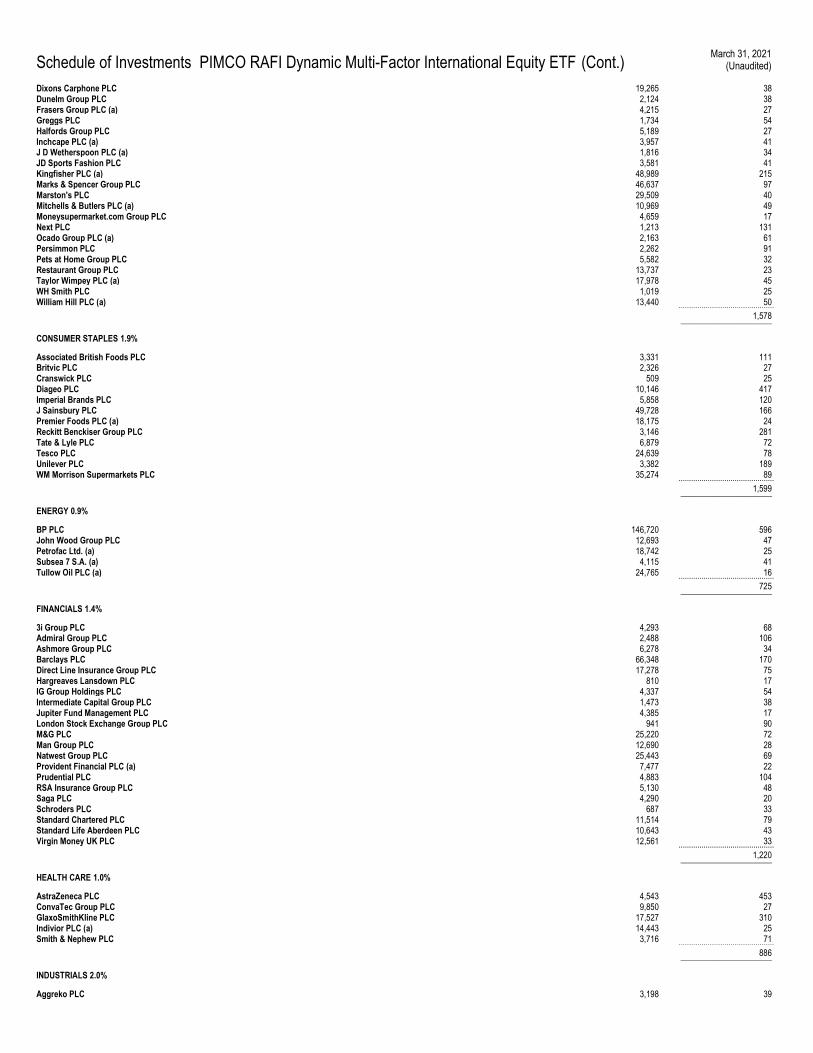
Schedule of Investments PIMCO RAFI Dynamic Multi-Factor International Equity ETF (Cont.) March 31, 2021
(Unaudited)
Dixons Carphone PLC 19,265 38 Dunelm Group PLC 2,124 38 Frasers Group PLC (a) 4,215 27 Greggs PLC 1,734 54 Halfords Group PLC 5,189 27 Inchcape PLC (a) 3,957 41 J D Wetherspoon PLC (a) 1,816 34 JD Sports Fashion PLC 3,581 41 Kingfisher PLC (a) 48,989 215 Marks & Spencer Group PLC 46,637 97 Marston's PLC 29,509 40 Mitchells & Butlers PLC (a) 10,969 49 Moneysupermarket.com Group PLC 4,659 17 Next PLC 1,213 131 Ocado Group PLC (a) 2,163 61 Persimmon PLC 2,262 91 Pets at Home Group PLC 5,582 32 Restaurant Group PLC 13,737 23 Taylor Wimpey PLC (a) 17,978 45 WH Smith PLC 1,019 25 William Hill PLC (a) 13,440 50 .............................................. 1,578 ______________________
CONSUMER STAPLES 1.9%
Associated British Foods PLC 3,331 111 Britvic PLC 2,326 27 Cranswick PLC 509 25 Diageo PLC 10,146 417 Imperial Brands PLC 5,858 120 J Sainsbury PLC 49,728 166 Premier Foods PLC (a) 18,175 24 Reckitt Benckiser Group PLC 3,146 281 Tate & Lyle PLC 6,879 72 Tesco PLC 24,639 78 Unilever PLC 3,382 189 WM Morrison Supermarkets PLC 35,274 89 .............................................. 1,599 ______________________
ENERGY 0.9%
BP PLC 146,720 596 John Wood Group PLC 12,693 47 Petrofac Ltd. (a) 18,742 25 Subsea 7 S.A. (a) 4,115 41 Tullow Oil PLC (a) 24,765 16 .............................................. 725 ______________________
FINANCIALS 1.4%
3i Group PLC 4,293 68 Admiral Group PLC 2,488 106 Ashmore Group PLC 6,278 34 Barclays PLC 66,348 170 Direct Line Insurance Group PLC 17,278 75 Hargreaves Lansdown PLC 810 17 IG Group Holdings PLC 4,337 54 Intermediate Capital Group PLC 1,473 38 Jupiter Fund Management PLC 4,385 17 London Stock Exchange Group PLC 941 90 M&G PLC 25,220 72 Man Group PLC 12,690 28 Natwest Group PLC 25,443 69 Provident Financial PLC (a) 7,477 22 Prudential PLC 4,883 104 RSA Insurance Group PLC 5,130 48 Saga PLC 4,290 20 Schroders PLC 687 33 Standard Chartered PLC 11,514 79 Standard Life Aberdeen PLC 10,643 43 Virgin Money UK PLC 12,561 33 .............................................. 1,220 ______________________
HEALTH CARE 1.0%
AstraZeneca PLC 4,543 453 ConvaTec Group PLC 9,850 27 GlaxoSmithKline PLC 17,527 310 Indivior PLC (a) 14,443 25 Smith & Nephew PLC 3,716 71 .............................................. 886 ______________________
INDUSTRIALS 2.0%
Aggreko PLC 3,198 39
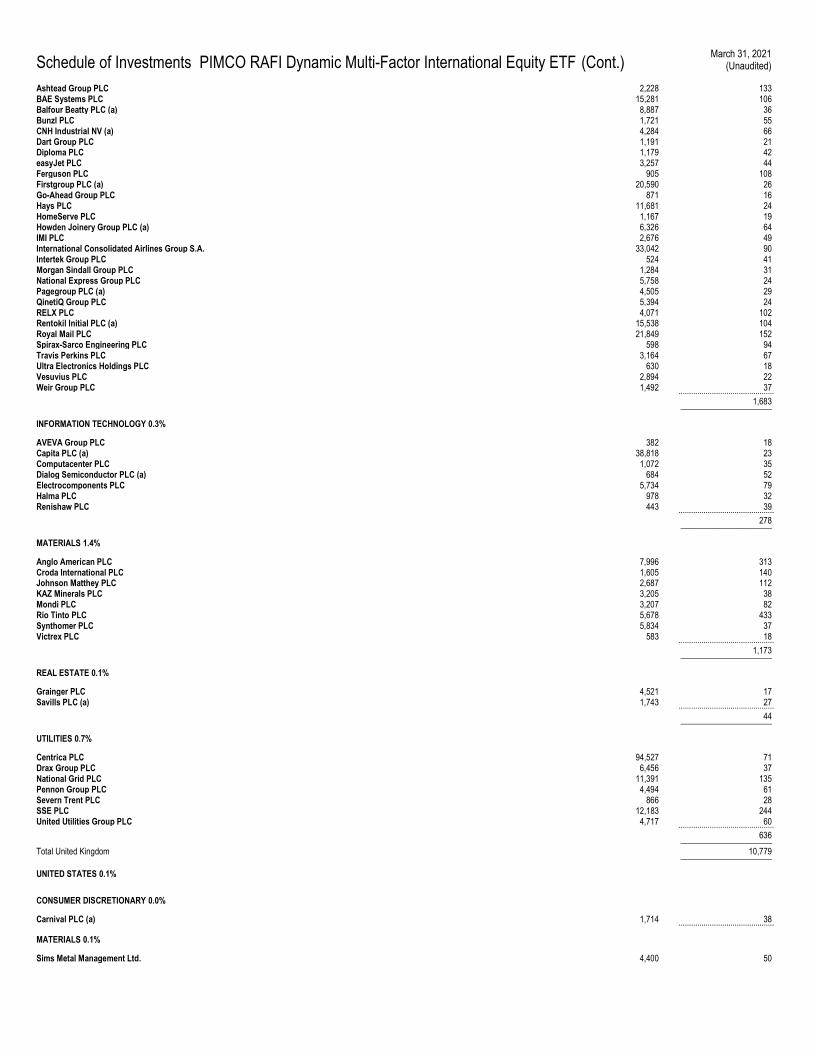
Schedule of Investments PIMCO RAFI Dynamic Multi-Factor International Equity ETF (Cont.) March 31, 2021
(Unaudited)
Ashtead Group PLC 2,228 133 BAE Systems PLC 15,281 106 Balfour Beatty PLC (a) 8,887 36 Bunzl PLC 1,721 55 CNH Industrial NV (a) 4,284 66 Dart Group PLC 1,191 21 Diploma PLC 1,179 42 easyJet PLC 3,257 44 Ferguson PLC 905 108 Firstgroup PLC (a) 20,590 26 Go-Ahead Group PLC 871 16 Hays PLC 11,681 24 HomeServe PLC 1,167 19 Howden Joinery Group PLC (a) 6,326 64 IMI PLC 2,676 49 International Consolidated Airlines Group S.A. 33,042 90 Intertek Group PLC 524 41 Morgan Sindall Group PLC 1,284 31 National Express Group PLC 5,758 24 Pagegroup PLC (a) 4,505 29 QinetiQ Group PLC 5,394 24 RELX PLC 4,071 102 Rentokil Initial PLC (a) 15,538 104 Royal Mail PLC 21,849 152 Spirax-Sarco Engineering PLC 598 94 Travis Perkins PLC 3,164 67 Ultra Electronics Holdings PLC 630 18 Vesuvius PLC 2,894 22 Weir Group PLC 1,492 37 .............................................. 1,683 ______________________
INFORMATION TECHNOLOGY 0.3%
AVEVA Group PLC 382 18 Capita PLC (a) 38,818 23 Computacenter PLC 1,072 35 Dialog Semiconductor PLC (a) 684 52 Electrocomponents PLC 5,734 79 Halma PLC 978 32 Renishaw PLC 443 39 .............................................. 278 ______________________
MATERIALS 1.4%
Anglo American PLC 7,996 313 Croda International PLC 1,605 140 Johnson Matthey PLC 2,687 112 KAZ Minerals PLC 3,205 38 Mondi PLC 3,207 82 Rio Tinto PLC 5,678 433 Synthomer PLC 5,834 37 Victrex PLC 583 18 .............................................. 1,173 ______________________
REAL ESTATE 0.1%
Grainger PLC 4,521 17 Savills PLC (a) 1,743 27 .............................................. 44 ______________________
UTILITIES 0.7%
Centrica PLC 94,527 71 Drax Group PLC 6,456 37 National Grid PLC 11,391 135 Pennon Group PLC 4,494 61 Severn Trent PLC 866 28 SSE PLC 12,183 244 United Utilities Group PLC 4,717 60 .............................................. 636 ______________________
Total United Kingdom 10,779 ______________________
UNITED STATES 0.1%
CONSUMER DISCRETIONARY 0.0%
Carnival PLC (a) 1,714 38 ..............................................
MATERIALS 0.1%
Sims Metal Management Ltd. 4,400 50
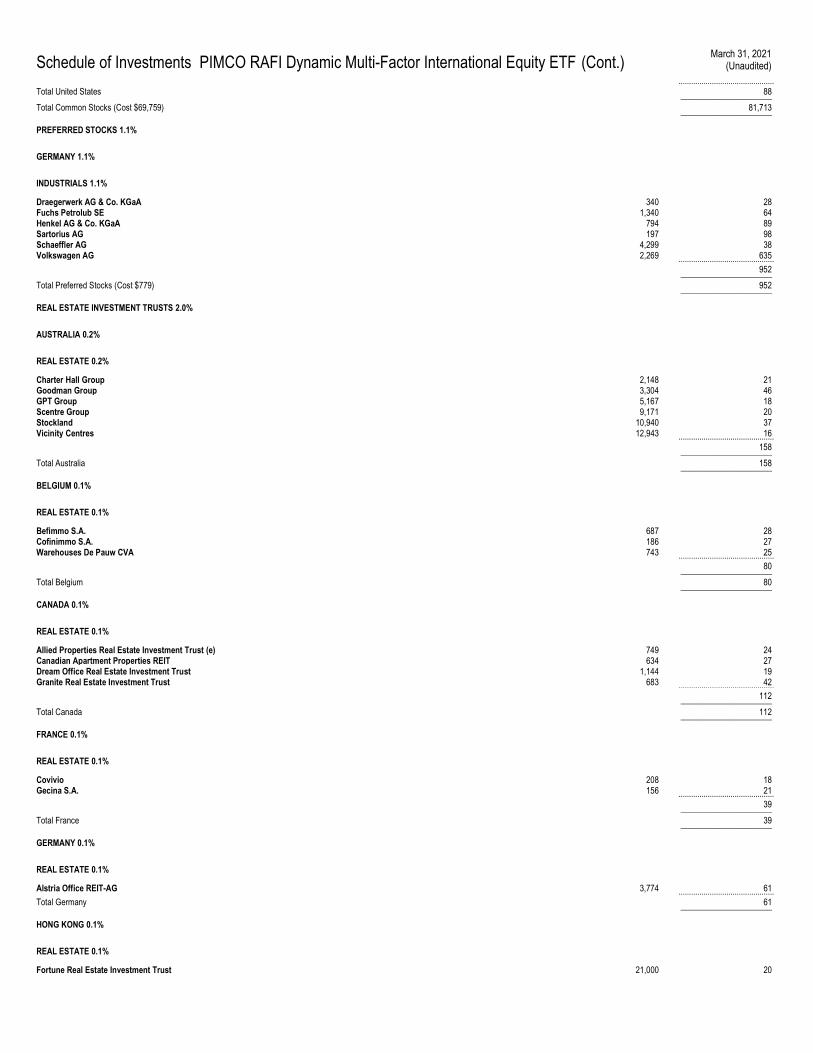
Schedule of Investments PIMCO RAFI Dynamic Multi-Factor International Equity ETF (Cont.) March 31, 2021
(Unaudited)
.............................................. Total United States 88 ______________________
Total Common Stocks (Cost $69,759) 81,713 ______________________
PREFERRED STOCKS 1.1%
GERMANY 1.1%
INDUSTRIALS 1.1%
Draegerwerk AG & Co. KGaA 340 28 Fuchs Petrolub SE 1,340 64 Henkel AG & Co. KGaA 794 89 Sartorius AG 197 98 Schaeffler AG 4,299 38 Volkswagen AG 2,269 635 .............................................. 952 ______________________
Total Preferred Stocks (Cost $779) 952 ______________________
REAL ESTATE INVESTMENT TRUSTS 2.0%
AUSTRALIA 0.2%
REAL ESTATE 0.2%
Charter Hall Group 2,148 21 Goodman Group 3,304 46 GPT Group 5,167 18 Scentre Group 9,171 20 Stockland 10,940 37 Vicinity Centres 12,943 16 .............................................. 158 ______________________
Total Australia 158 ______________________
BELGIUM 0.1%
REAL ESTATE 0.1%
Befimmo S.A. 687 28 Cofinimmo S.A. 186 27 Warehouses De Pauw CVA 743 25 .............................................. 80 ______________________
Total Belgium 80 ______________________
CANADA 0.1%
REAL ESTATE 0.1%
Allied Properties Real Estate Investment Trust (e) 749 24 Canadian Apartment Properties REIT 634 27 Dream Office Real Estate Investment Trust 1,144 19 Granite Real Estate Investment Trust 683 42 .............................................. 112 ______________________
Total Canada 112 ______________________
FRANCE 0.1%
REAL ESTATE 0.1%
Covivio 208 18 Gecina S.A. 156 21 .............................................. 39 ______________________
Total France 39 ______________________
GERMANY 0.1%
REAL ESTATE 0.1%
Alstria Office REIT-AG 3,774 61 .............................................. Total Germany 61 ______________________
HONG KONG 0.1%
REAL ESTATE 0.1%
Fortune Real Estate Investment Trust 21,000 20
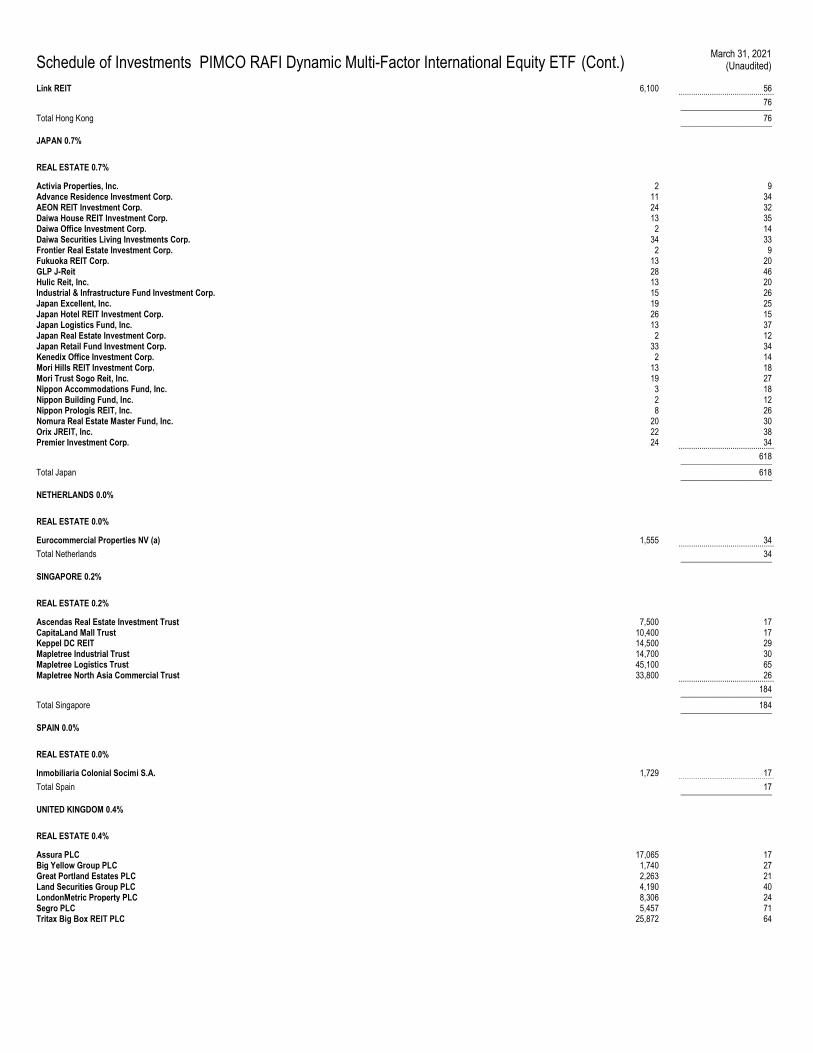
Schedule of Investments PIMCO RAFI Dynamic Multi-Factor International Equity ETF (Cont.) March 31, 2021
(Unaudited)
Link REIT 6,100 56 .............................................. 76 ______________________
Total Hong Kong 76 ______________________
JAPAN 0.7%
REAL ESTATE 0.7%
Activia Properties, Inc. 2 9 Advance Residence Investment Corp. 11 34 AEON REIT Investment Corp. 24 32 Daiwa House REIT Investment Corp. 13 35 Daiwa Office Investment Corp. 2 14 Daiwa Securities Living Investments Corp. 34 33 Frontier Real Estate Investment Corp. 2 9 Fukuoka REIT Corp. 13 20 GLP J-Reit 28 46 Hulic Reit, Inc. 13 20 Industrial & Infrastructure Fund Investment Corp. 15 26 Japan Excellent, Inc. 19 25 Japan Hotel REIT Investment Corp. 26 15 Japan Logistics Fund, Inc. 13 37 Japan Real Estate Investment Corp. 2 12 Japan Retail Fund Investment Corp. 33 34 Kenedix Office Investment Corp. 2 14 Mori Hills REIT Investment Corp. 13 18 Mori Trust Sogo Reit, Inc. 19 27 Nippon Accommodations Fund, Inc. 3 18 Nippon Building Fund, Inc. 2 12 Nippon Prologis REIT, Inc. 8 26 Nomura Real Estate Master Fund, Inc. 20 30 Orix JREIT, Inc. 22 38 Premier Investment Corp. 24 34 .............................................. 618 ______________________
Total Japan 618 ______________________
NETHERLANDS 0.0%
REAL ESTATE 0.0%
Eurocommercial Properties NV (a) 1,555 34 .............................................. Total Netherlands 34 ______________________
SINGAPORE 0.2%
REAL ESTATE 0.2%
Ascendas Real Estate Investment Trust 7,500 17 CapitaLand Mall Trust 10,400 17 Keppel DC REIT 14,500 29 Mapletree Industrial Trust 14,700 30 Mapletree Logistics Trust 45,100 65 Mapletree North Asia Commercial Trust 33,800 26 .............................................. 184 ______________________
Total Singapore 184 ______________________
SPAIN 0.0%
REAL ESTATE 0.0%
Inmobiliaria Colonial Socimi S.A. 1,729 17 .............................................. Total Spain 17 ______________________
UNITED KINGDOM 0.4%
REAL ESTATE 0.4%
Assura PLC 17,065 17 Big Yellow Group PLC 1,740 27 Great Portland Estates PLC 2,263 21 Land Securities Group PLC 4,190 40 LondonMetric Property PLC 8,306 24 Segro PLC 5,457 71 Tritax Big Box REIT PLC 25,872 64
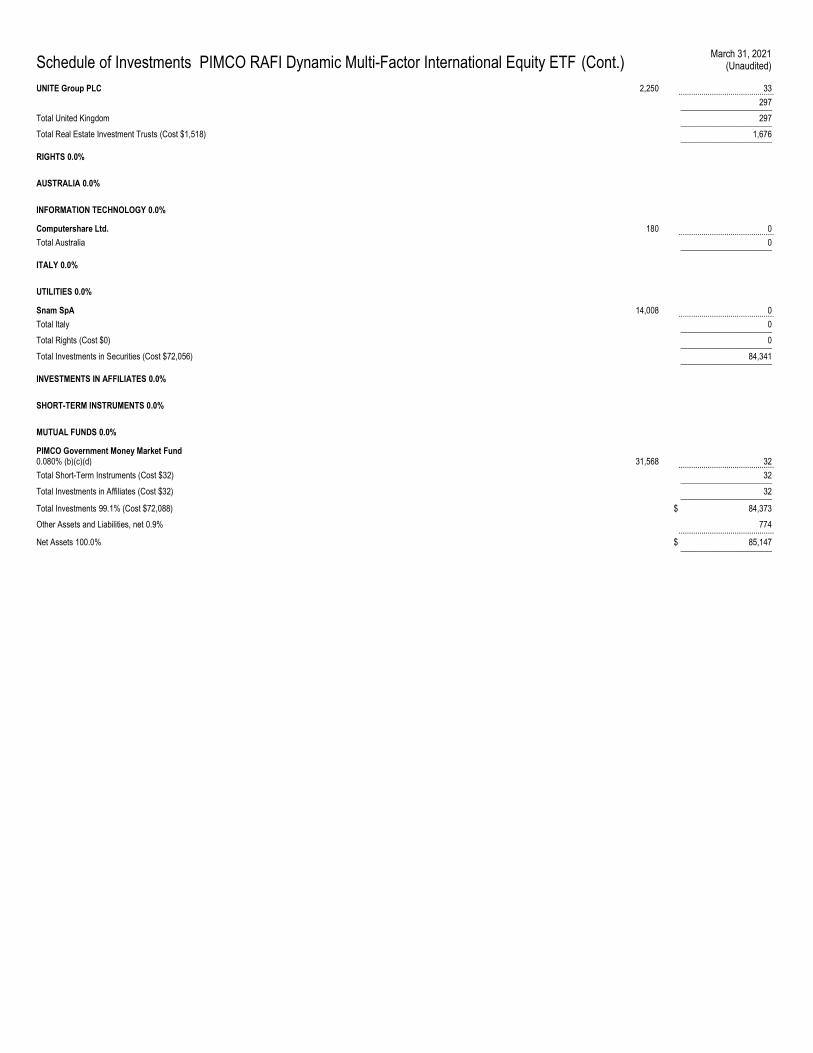
Schedule of Investments PIMCO RAFI Dynamic Multi-Factor International Equity ETF (Cont.) March 31, 2021
(Unaudited)
UNITE Group PLC 2,250 33 .............................................. 297 ______________________
Total United Kingdom 297 ______________________
Total Real Estate Investment Trusts (Cost $1,518) 1,676 ______________________
RIGHTS 0.0%
AUSTRALIA 0.0%
INFORMATION TECHNOLOGY 0.0%
Computershare Ltd. 180 0 .............................................. Total Australia 0 ______________________
ITALY 0.0%
UTILITIES 0.0%
Snam SpA 14,008 0 .............................................. Total Italy 0 ______________________
Total Rights (Cost $0) 0 ______________________
Total Investments in Securities (Cost $72,056) 84,341 ______________________
INVESTMENTS IN AFFILIATES 0.0%
SHORT-TERM INSTRUMENTS 0.0%
MUTUAL FUNDS 0.0%
PIMCO Government Money Market Fund 0.080% (b)(c)(d) 31,568 32 .............................................. Total Short-Term Instruments (Cost $32) 32 ______________________
Total Investments in Affiliates (Cost $32) 32 ______________________
Total Investments 99.1% (Cost $72,088) $ 84,373
Other Assets and Liabilities, net 0.9% 774 ..............................................
Net Assets 100.0% $ 85,147 ______________________
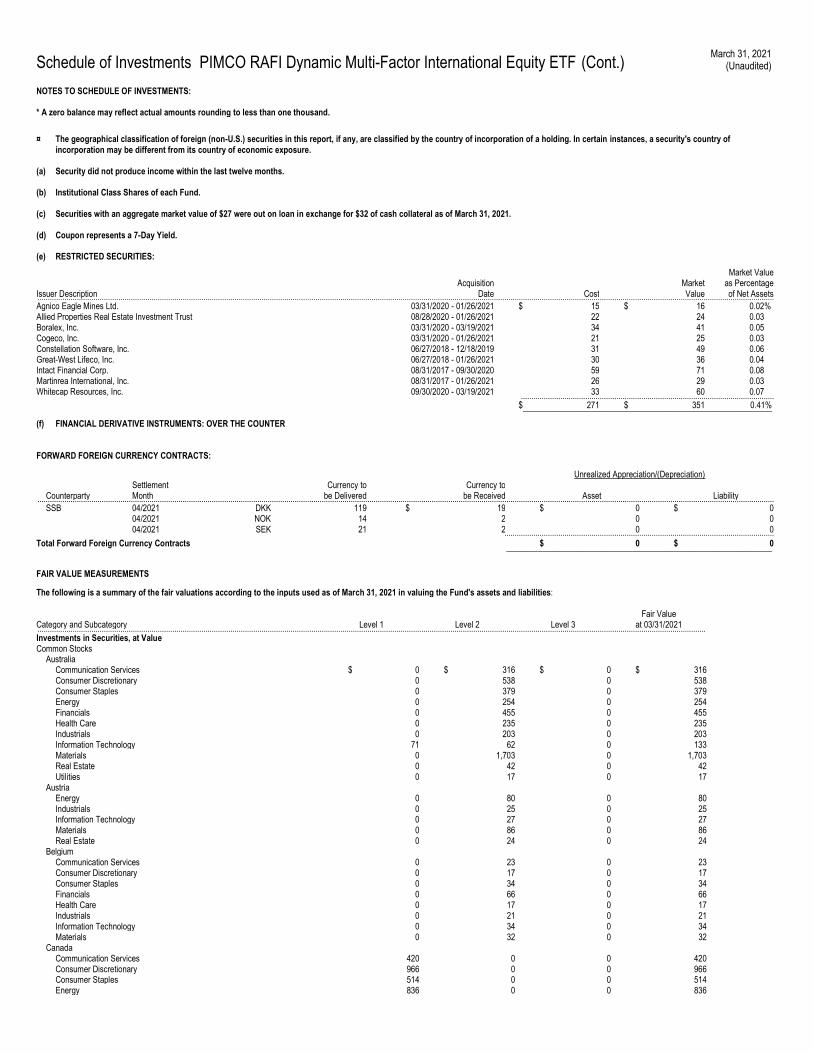
Schedule of Investments PIMCO RAFI Dynamic Multi-Factor International Equity ETF (Cont.) March 31, 2021
(Unaudited)
NOTES TO SCHEDULE OF INVESTMENTS: * A zero balance may reflect actual amounts rounding to less than one thousand.
¤ The geographical classification of foreign (non-U.S.) securities in this report, if any, are classified by the country of incorporation of a holding. In certain instances, a security's country of incorporation may be different from its country of economic exposure.
(a) Security did not produce income within the last twelve months.
(b) Institutional Class Shares of each Fund.
(c) Securities with an aggregate market value of $27 were out on loan in exchange for $32 of cash collateral as of March 31, 2021.
(d) Coupon represents a 7-Day Yield.
(e) RESTRICTED SECURITIES:
Issuer Description Acquisition
Date Cost Market Value
Market Value as Percentage of Net Assets ...................................................................................................................................................................................................................................................................................................................................................................
Agnico Eagle Mines Ltd. 03/31/2020 - 01/26/2021 $ 15 $ 16 0.02 % Allied Properties Real Estate Investment Trust 08/28/2020 - 01/26/2021 22 24 0.03 Boralex, Inc. 03/31/2020 - 03/19/2021 34 41 0.05 Cogeco, Inc. 03/31/2020 - 01/26/2021 21 25 0.03 Constellation Software, Inc. 06/27/2018 - 12/18/2019 31 49 0.06 Great-West Lifeco, Inc. 06/27/2018 - 01/26/2021 30 36 0.04 Intact Financial Corp. 08/31/2017 - 09/30/2020 59 71 0.08 Martinrea International, Inc. 08/31/2017 - 01/26/2021 26 29 0.03 Whitecap Resources, Inc. 09/30/2020 - 03/19/2021 33 60 0.07 .......................................................................................................................... $ 271 $ 351 0.41% ____________________________________________________________
(f) FINANCIAL DERIVATIVE INSTRUMENTS: OVER THE COUNTER
FORWARD FOREIGN CURRENCY CONTRACTS:
Unrealized Appreciation/(Depreciation)
Counterparty Settlement Month
Currency to be Delivered
Currency to be Received Asset Liability ...................................................................................................................................................................................................................................................................................................................................................................
SSB 04/2021 DKK 119 $ 19 $ 0 $ 0 04/2021 NOK 14 2 0 0 04/2021 SEK 21 2 0 0 ..................................................................................................................................
Total Forward Foreign Currency Contracts $ 0 $ 0 ________________________________________________________________
FAIR VALUE MEASUREMENTS
The following is a summary of the fair valuations according to the inputs used as of March 31, 2021 in valuing the Fund's assets and liabilities:
Category and Subcategory Level 1 Level 2 Level 3 Fair Value
at 03/31/2021 .................................................................................................................................................................................................................................................................................................................................. Investments in Securities, at Value Common Stocks Australia Communication Services $ 0 $ 316 $ 0 $ 316 Consumer Discretionary 0 538 0 538 Consumer Staples 0 379 0 379 Energy 0 254 0 254 Financials 0 455 0 455 Health Care 0 235 0 235 Industrials 0 203 0 203 Information Technology 71 62 0 133 Materials 0 1,703 0 1,703 Real Estate 0 42 0 42 Utilities 0 17 0 17 Austria Energy 0 80 0 80 Industrials 0 25 0 25 Information Technology 0 27 0 27 Materials 0 86 0 86 Real Estate 0 24 0 24 Belgium Communication Services 0 23 0 23 Consumer Discretionary 0 17 0 17 Consumer Staples 0 34 0 34 Financials 0 66 0 66 Health Care 0 17 0 17 Industrials 0 21 0 21 Information Technology 0 34 0 34 Materials 0 32 0 32 Canada Communication Services 420 0 0 420 Consumer Discretionary 966 0 0 966 Consumer Staples 514 0 0 514 Energy 836 0 0 836
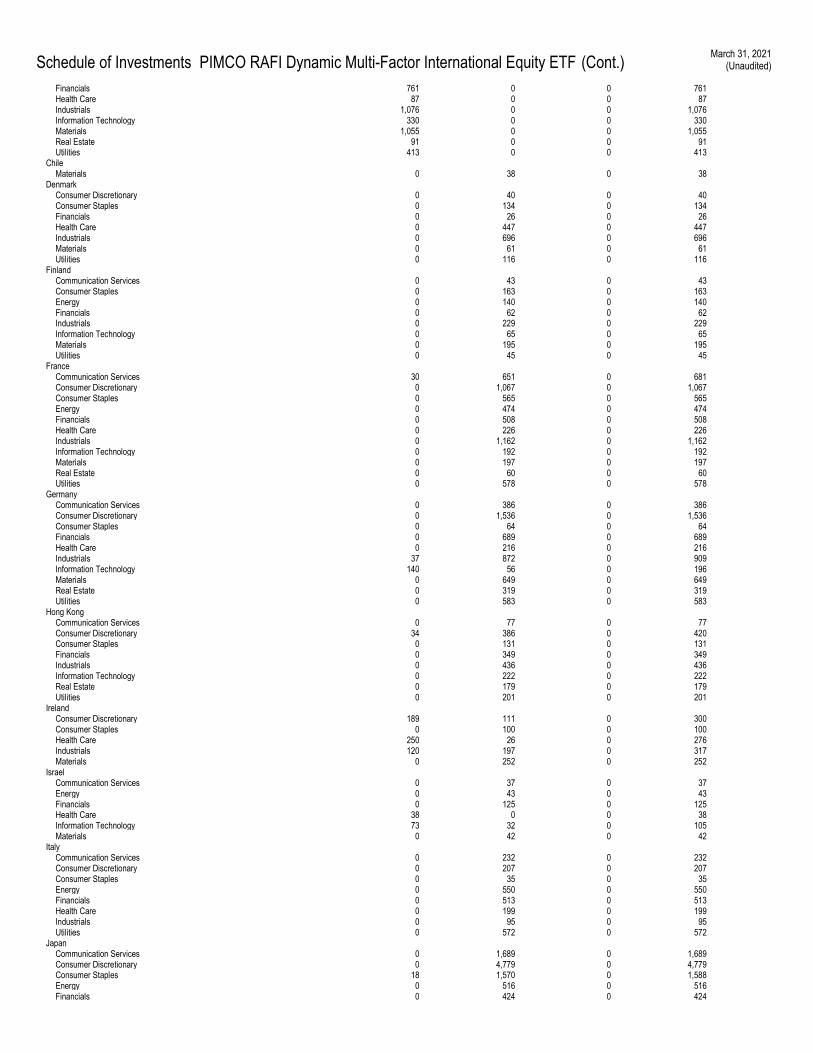
Schedule of Investments PIMCO RAFI Dynamic Multi-Factor International Equity ETF (Cont.) March 31, 2021
(Unaudited)
Financials 761 0 0 761 Health Care 87 0 0 87 Industrials 1,076 0 0 1,076 Information Technology 330 0 0 330 Materials 1,055 0 0 1,055 Real Estate 91 0 0 91 Utilities 413 0 0 413 Chile Materials 0 38 0 38 Denmark Consumer Discretionary 0 40 0 40 Consumer Staples 0 134 0 134 Financials 0 26 0 26 Health Care 0 447 0 447 Industrials 0 696 0 696 Materials 0 61 0 61 Utilities 0 116 0 116 Finland Communication Services 0 43 0 43 Consumer Staples 0 163 0 163 Energy 0 140 0 140 Financials 0 62 0 62 Industrials 0 229 0 229 Information Technology 0 65 0 65 Materials 0 195 0 195 Utilities 0 45 0 45 France Communication Services 30 651 0 681 Consumer Discretionary 0 1,067 0 1,067 Consumer Staples 0 565 0 565 Energy 0 474 0 474 Financials 0 508 0 508 Health Care 0 226 0 226 Industrials 0 1,162 0 1,162 Information Technology 0 192 0 192 Materials 0 197 0 197 Real Estate 0 60 0 60 Utilities 0 578 0 578 Germany Communication Services 0 386 0 386 Consumer Discretionary 0 1,536 0 1,536 Consumer Staples 0 64 0 64 Financials 0 689 0 689 Health Care 0 216 0 216 Industrials 37 872 0 909 Information Technology 140 56 0 196 Materials 0 649 0 649 Real Estate 0 319 0 319 Utilities 0 583 0 583 Hong Kong Communication Services 0 77 0 77 Consumer Discretionary 34 386 0 420 Consumer Staples 0 131 0 131 Financials 0 349 0 349 Industrials 0 436 0 436 Information Technology 0 222 0 222 Real Estate 0 179 0 179 Utilities 0 201 0 201 Ireland Consumer Discretionary 189 111 0 300 Consumer Staples 0 100 0 100 Health Care 250 26 0 276 Industrials 120 197 0 317 Materials 0 252 0 252 Israel Communication Services 0 37 0 37 Energy 0 43 0 43 Financials 0 125 0 125 Health Care 38 0 0 38 Information Technology 73 32 0 105 Materials 0 42 0 42 Italy Communication Services 0 232 0 232 Consumer Discretionary 0 207 0 207 Consumer Staples 0 35 0 35 Energy 0 550 0 550 Financials 0 513 0 513 Health Care 0 199 0 199 Industrials 0 95 0 95 Utilities 0 572 0 572 Japan Communication Services 0 1,689 0 1,689 Consumer Discretionary 0 4,779 0 4,779 Consumer Staples 18 1,570 0 1,588 Energy 0 516 0 516 Financials 0 424 0 424
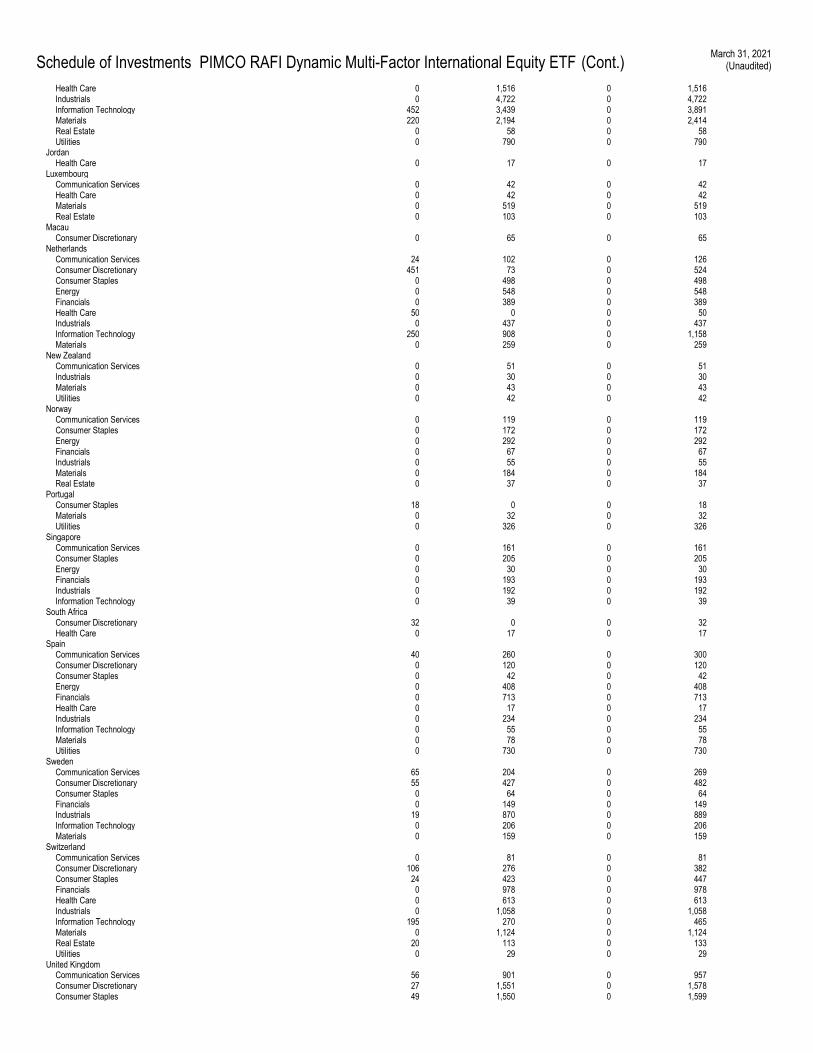
Schedule of Investments PIMCO RAFI Dynamic Multi-Factor International Equity ETF (Cont.) March 31, 2021
(Unaudited)
Health Care 0 1,516 0 1,516 Industrials 0 4,722 0 4,722 Information Technology 452 3,439 0 3,891 Materials 220 2,194 0 2,414 Real Estate 0 58 0 58 Utilities 0 790 0 790 Jordan Health Care 0 17 0 17 Luxembourg Communication Services 0 42 0 42 Health Care 0 42 0 42 Materials 0 519 0 519 Real Estate 0 103 0 103 Macau Consumer Discretionary 0 65 0 65 Netherlands Communication Services 24 102 0 126 Consumer Discretionary 451 73 0 524 Consumer Staples 0 498 0 498 Energy 0 548 0 548 Financials 0 389 0 389 Health Care 50 0 0 50 Industrials 0 437 0 437 Information Technology 250 908 0 1,158 Materials 0 259 0 259 New Zealand Communication Services 0 51 0 51 Industrials 0 30 0 30 Materials 0 43 0 43 Utilities 0 42 0 42 Norway Communication Services 0 119 0 119 Consumer Staples 0 172 0 172 Energy 0 292 0 292 Financials 0 67 0 67 Industrials 0 55 0 55 Materials 0 184 0 184 Real Estate 0 37 0 37 Portugal Consumer Staples 18 0 0 18 Materials 0 32 0 32 Utilities 0 326 0 326 Singapore Communication Services 0 161 0 161 Consumer Staples 0 205 0 205 Energy 0 30 0 30 Financials 0 193 0 193 Industrials 0 192 0 192 Information Technology 0 39 0 39 South Africa Consumer Discretionary 32 0 0 32 Health Care 0 17 0 17 Spain Communication Services 40 260 0 300 Consumer Discretionary 0 120 0 120 Consumer Staples 0 42 0 42 Energy 0 408 0 408 Financials 0 713 0 713 Health Care 0 17 0 17 Industrials 0 234 0 234 Information Technology 0 55 0 55 Materials 0 78 0 78 Utilities 0 730 0 730 Sweden Communication Services 65 204 0 269 Consumer Discretionary 55 427 0 482 Consumer Staples 0 64 0 64 Financials 0 149 0 149 Industrials 19 870 0 889 Information Technology 0 206 0 206 Materials 0 159 0 159 Switzerland Communication Services 0 81 0 81 Consumer Discretionary 106 276 0 382 Consumer Staples 24 423 0 447 Financials 0 978 0 978 Health Care 0 613 0 613 Industrials 0 1,058 0 1,058 Information Technology 195 270 0 465 Materials 0 1,124 0 1,124 Real Estate 20 113 0 133 Utilities 0 29 0 29 United Kingdom Communication Services 56 901 0 957 Consumer Discretionary 27 1,551 0 1,578 Consumer Staples 49 1,550 0 1,599
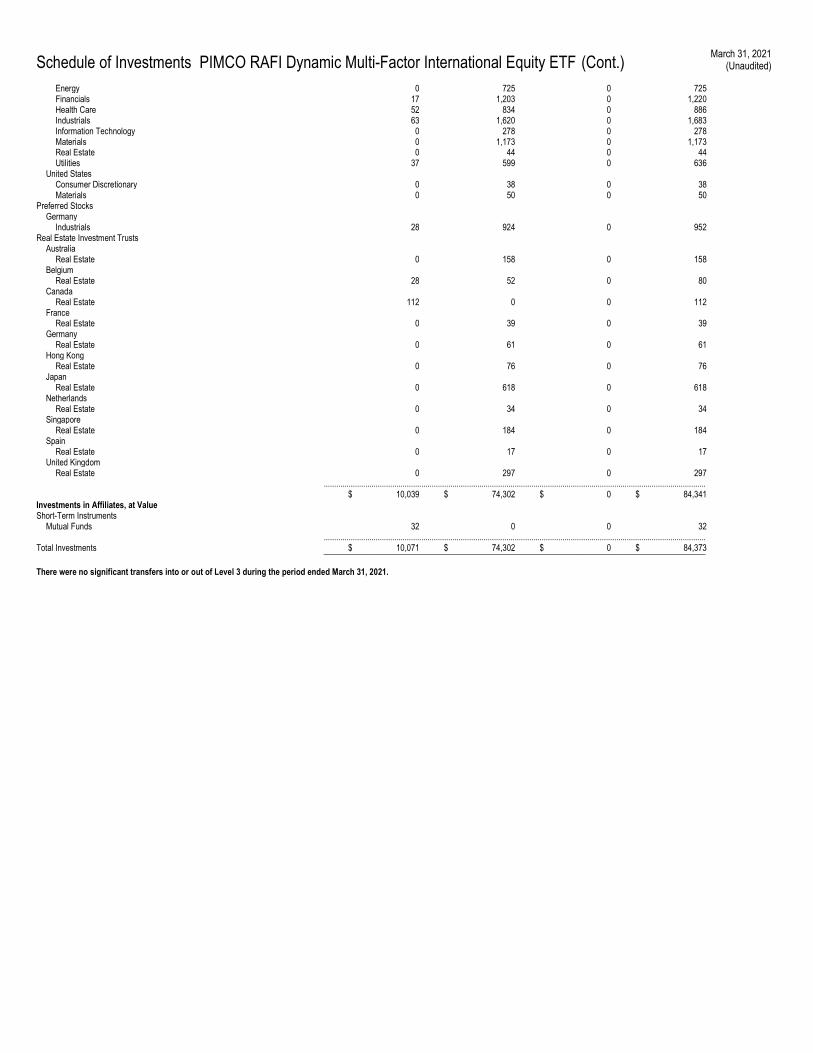
Schedule of Investments PIMCO RAFI Dynamic Multi-Factor International Equity ETF (Cont.) March 31, 2021
(Unaudited)
Energy 0 725 0 725 Financials 17 1,203 0 1,220 Health Care 52 834 0 886 Industrials 63 1,620 0 1,683 Information Technology 0 278 0 278 Materials 0 1,173 0 1,173 Real Estate 0 44 0 44 Utilities 37 599 0 636 United States Consumer Discretionary 0 38 0 38 Materials 0 50 0 50 Preferred Stocks Germany Industrials 28 924 0 952 Real Estate Investment Trusts Australia Real Estate 0 158 0 158 Belgium Real Estate 28 52 0 80 Canada Real Estate 112 0 0 112 France Real Estate 0 39 0 39 Germany Real Estate 0 61 0 61 Hong Kong Real Estate 0 76 0 76 Japan Real Estate 0 618 0 618 Netherlands Real Estate 0 34 0 34 Singapore Real Estate 0 184 0 184 Spain Real Estate 0 17 0 17 United Kingdom Real Estate 0 297 0 297 ........................................................................................................................................................................................ $ 10,039 $ 74,302 $ 0 $ 84,341 Investments in Affiliates, at Value Short-Term Instruments Mutual Funds 32 0 0 32 ........................................................................................................................................................................................ Total Investments $ 10,071 $ 74,302 $ 0 $ 84,373 ____________________________________________________________________________________________ There were no significant transfers into or out of Level 3 during the period ended March 31, 2021.
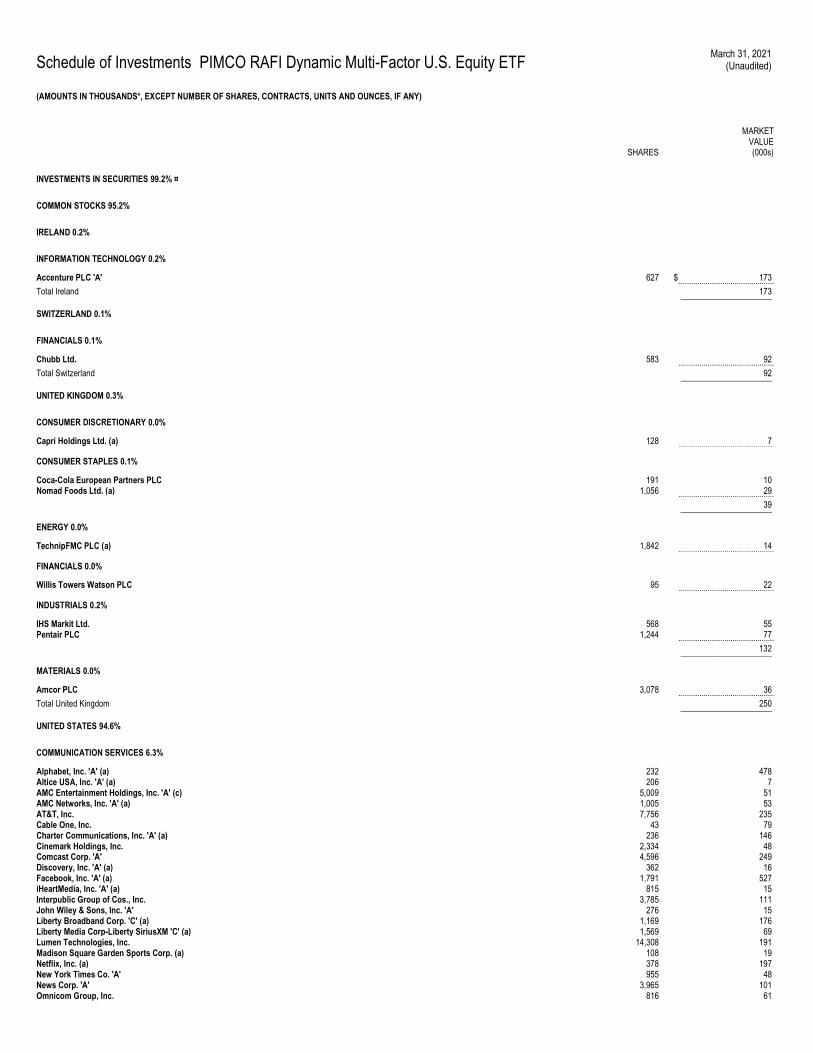
Schedule of Investments PIMCO RAFI Dynamic Multi-Factor U.S. Equity ETF March 31, 2021
(Unaudited)
(AMOUNTS IN THOUSANDS*, EXCEPT NUMBER OF SHARES, CONTRACTS, UNITS AND OUNCES, IF ANY)
SHARES
MARKET VALUE (000s)
INVESTMENTS IN SECURITIES 99.2% ¤
COMMON STOCKS 95.2%
IRELAND 0.2%
INFORMATION TECHNOLOGY 0.2%
Accenture PLC 'A' 627 $ 173 .............................................. Total Ireland 173 ______________________
SWITZERLAND 0.1%
FINANCIALS 0.1%
Chubb Ltd. 583 92 .............................................. Total Switzerland 92 ______________________
UNITED KINGDOM 0.3%
CONSUMER DISCRETIONARY 0.0%
Capri Holdings Ltd. (a) 128 7 ..............................................
CONSUMER STAPLES 0.1%
Coca-Cola European Partners PLC 191 10 Nomad Foods Ltd. (a) 1,056 29 .............................................. 39 ______________________
ENERGY 0.0%
TechnipFMC PLC (a) 1,842 14 ..............................................
FINANCIALS 0.0%
Willis Towers Watson PLC 95 22 ..............................................
INDUSTRIALS 0.2%
IHS Markit Ltd. 568 55 Pentair PLC 1,244 77 .............................................. 132 ______________________
MATERIALS 0.0%
Amcor PLC 3,078 36 .............................................. Total United Kingdom 250 ______________________
UNITED STATES 94.6%
COMMUNICATION SERVICES 6.3%
Alphabet, Inc. 'A' (a) 232 478 Altice USA, Inc. 'A' (a) 206 7 AMC Entertainment Holdings, Inc. 'A' (c) 5,009 51 AMC Networks, Inc. 'A' (a) 1,005 53 AT&T, Inc. 7,756 235 Cable One, Inc. 43 79 Charter Communications, Inc. 'A' (a) 236 146 Cinemark Holdings, Inc. 2,334 48 Comcast Corp. 'A' 4,596 249 Discovery, Inc. 'A' (a) 362 16 Facebook, Inc. 'A' (a) 1,791 527 iHeartMedia, Inc. 'A' (a) 815 15 Interpublic Group of Cos., Inc. 3,785 111 John Wiley & Sons, Inc. 'A' 276 15 Liberty Broadband Corp. 'C' (a) 1,169 176 Liberty Media Corp-Liberty SiriusXM 'C' (a) 1,569 69 Lumen Technologies, Inc. 14,308 191 Madison Square Garden Sports Corp. (a) 108 19 Netflix, Inc. (a) 378 197 New York Times Co. 'A' 955 48 News Corp. 'A' 3,965 101 Omnicom Group, Inc. 816 61
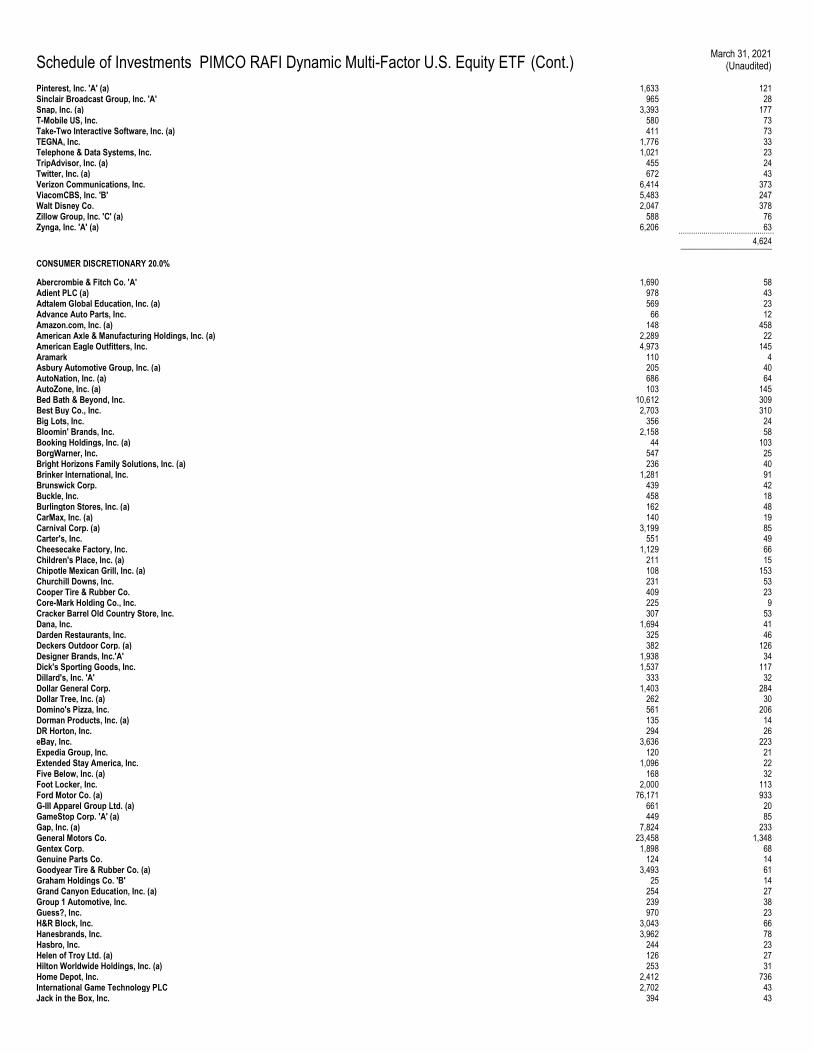
Schedule of Investments PIMCO RAFI Dynamic Multi-Factor U.S. Equity ETF (Cont.) March 31, 2021
(Unaudited)
Pinterest, Inc. 'A' (a) 1,633 121 Sinclair Broadcast Group, Inc. 'A' 965 28 Snap, Inc. (a) 3,393 177 T-Mobile US, Inc. 580 73 Take-Two Interactive Software, Inc. (a) 411 73 TEGNA, Inc. 1,776 33 Telephone & Data Systems, Inc. 1,021 23 TripAdvisor, Inc. (a) 455 24 Twitter, Inc. (a) 672 43 Verizon Communications, Inc. 6,414 373 ViacomCBS, Inc. 'B' 5,483 247 Walt Disney Co. 2,047 378 Zillow Group, Inc. 'C' (a) 588 76 Zynga, Inc. 'A' (a) 6,206 63 .............................................. 4,624 ______________________
CONSUMER DISCRETIONARY 20.0%
Abercrombie & Fitch Co. 'A' 1,690 58 Adient PLC (a) 978 43 Adtalem Global Education, Inc. (a) 569 23 Advance Auto Parts, Inc. 66 12 Amazon.com, Inc. (a) 148 458 American Axle & Manufacturing Holdings, Inc. (a) 2,289 22 American Eagle Outfitters, Inc. 4,973 145 Aramark 110 4 Asbury Automotive Group, Inc. (a) 205 40 AutoNation, Inc. (a) 686 64 AutoZone, Inc. (a) 103 145 Bed Bath & Beyond, Inc. 10,612 309 Best Buy Co., Inc. 2,703 310 Big Lots, Inc. 356 24 Bloomin' Brands, Inc. 2,158 58 Booking Holdings, Inc. (a) 44 103 BorgWarner, Inc. 547 25 Bright Horizons Family Solutions, Inc. (a) 236 40 Brinker International, Inc. 1,281 91 Brunswick Corp. 439 42 Buckle, Inc. 458 18 Burlington Stores, Inc. (a) 162 48 CarMax, Inc. (a) 140 19 Carnival Corp. (a) 3,199 85 Carter's, Inc. 551 49 Cheesecake Factory, Inc. 1,129 66 Children's Place, Inc. (a) 211 15 Chipotle Mexican Grill, Inc. (a) 108 153 Churchill Downs, Inc. 231 53 Cooper Tire & Rubber Co. 409 23 Core-Mark Holding Co., Inc. 225 9 Cracker Barrel Old Country Store, Inc. 307 53 Dana, Inc. 1,694 41 Darden Restaurants, Inc. 325 46 Deckers Outdoor Corp. (a) 382 126 Designer Brands, Inc.'A' 1,938 34 Dick's Sporting Goods, Inc. 1,537 117 Dillard's, Inc. 'A' 333 32 Dollar General Corp. 1,403 284 Dollar Tree, Inc. (a) 262 30 Domino's Pizza, Inc. 561 206 Dorman Products, Inc. (a) 135 14 DR Horton, Inc. 294 26 eBay, Inc. 3,636 223 Expedia Group, Inc. 120 21 Extended Stay America, Inc. 1,096 22 Five Below, Inc. (a) 168 32 Foot Locker, Inc. 2,000 113 Ford Motor Co. (a) 76,171 933 G-III Apparel Group Ltd. (a) 661 20 GameStop Corp. 'A' (a) 449 85 Gap, Inc. (a) 7,824 233 General Motors Co. 23,458 1,348 Gentex Corp. 1,898 68 Genuine Parts Co. 124 14 Goodyear Tire & Rubber Co. (a) 3,493 61 Graham Holdings Co. 'B' 25 14 Grand Canyon Education, Inc. (a) 254 27 Group 1 Automotive, Inc. 239 38 Guess?, Inc. 970 23 H&R Block, Inc. 3,043 66 Hanesbrands, Inc. 3,962 78 Hasbro, Inc. 244 23 Helen of Troy Ltd. (a) 126 27 Hilton Worldwide Holdings, Inc. (a) 253 31 Home Depot, Inc. 2,412 736 International Game Technology PLC 2,702 43 Jack in the Box, Inc. 394 43
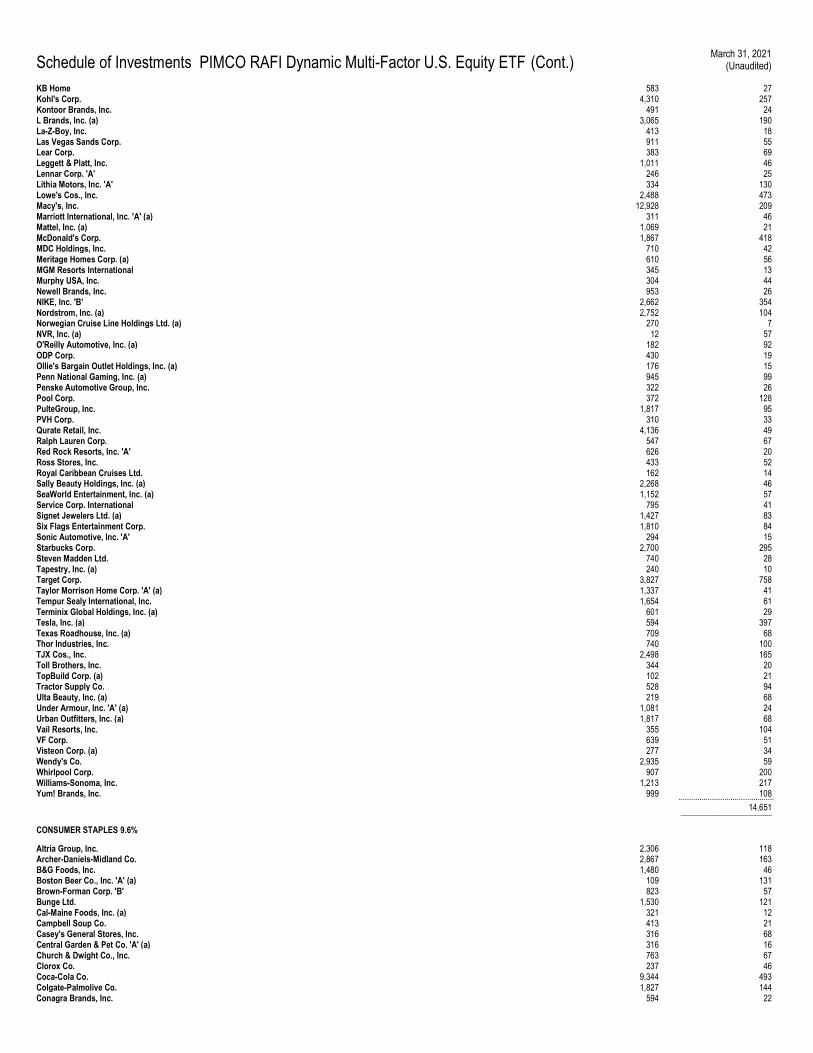
Schedule of Investments PIMCO RAFI Dynamic Multi-Factor U.S. Equity ETF (Cont.) March 31, 2021
(Unaudited)
KB Home 583 27 Kohl's Corp. 4,310 257 Kontoor Brands, Inc. 491 24 L Brands, Inc. (a) 3,065 190 La-Z-Boy, Inc. 413 18 Las Vegas Sands Corp. 911 55 Lear Corp. 383 69 Leggett & Platt, Inc. 1,011 46 Lennar Corp. 'A' 246 25 Lithia Motors, Inc. 'A' 334 130 Lowe's Cos., Inc. 2,488 473 Macy's, Inc. 12,928 209 Marriott International, Inc. 'A' (a) 311 46 Mattel, Inc. (a) 1,069 21 McDonald's Corp. 1,867 418 MDC Holdings, Inc. 710 42 Meritage Homes Corp. (a) 610 56 MGM Resorts International 345 13 Murphy USA, Inc. 304 44 Newell Brands, Inc. 953 26 NIKE, Inc. 'B' 2,662 354 Nordstrom, Inc. (a) 2,752 104 Norwegian Cruise Line Holdings Ltd. (a) 270 7 NVR, Inc. (a) 12 57 O'Reilly Automotive, Inc. (a) 182 92 ODP Corp. 430 19 Ollie's Bargain Outlet Holdings, Inc. (a) 176 15 Penn National Gaming, Inc. (a) 945 99 Penske Automotive Group, Inc. 322 26 Pool Corp. 372 128 PulteGroup, Inc. 1,817 95 PVH Corp. 310 33 Qurate Retail, Inc. 4,136 49 Ralph Lauren Corp. 547 67 Red Rock Resorts, Inc. 'A' 626 20 Ross Stores, Inc. 433 52 Royal Caribbean Cruises Ltd. 162 14 Sally Beauty Holdings, Inc. (a) 2,268 46 SeaWorld Entertainment, Inc. (a) 1,152 57 Service Corp. International 795 41 Signet Jewelers Ltd. (a) 1,427 83 Six Flags Entertainment Corp. 1,810 84 Sonic Automotive, Inc. 'A' 294 15 Starbucks Corp. 2,700 295 Steven Madden Ltd. 740 28 Tapestry, Inc. (a) 240 10 Target Corp. 3,827 758 Taylor Morrison Home Corp. 'A' (a) 1,337 41 Tempur Sealy International, Inc. 1,654 61 Terminix Global Holdings, Inc. (a) 601 29 Tesla, Inc. (a) 594 397 Texas Roadhouse, Inc. (a) 709 68 Thor Industries, Inc. 740 100 TJX Cos., Inc. 2,498 165 Toll Brothers, Inc. 344 20 TopBuild Corp. (a) 102 21 Tractor Supply Co. 528 94 Ulta Beauty, Inc. (a) 219 68 Under Armour, Inc. 'A' (a) 1,081 24 Urban Outfitters, Inc. (a) 1,817 68 Vail Resorts, Inc. 355 104 VF Corp. 639 51 Visteon Corp. (a) 277 34 Wendy's Co. 2,935 59 Whirlpool Corp. 907 200 Williams-Sonoma, Inc. 1,213 217 Yum! Brands, Inc. 999 108 .............................................. 14,651 ______________________
CONSUMER STAPLES 9.6%
Altria Group, Inc. 2,306 118 Archer-Daniels-Midland Co. 2,867 163 B&G Foods, Inc. 1,480 46 Boston Beer Co., Inc. 'A' (a) 109 131 Brown-Forman Corp. 'B' 823 57 Bunge Ltd. 1,530 121 Cal-Maine Foods, Inc. (a) 321 12 Campbell Soup Co. 413 21 Casey's General Stores, Inc. 316 68 Central Garden & Pet Co. 'A' (a) 316 16 Church & Dwight Co., Inc. 763 67 Clorox Co. 237 46 Coca-Cola Co. 9,344 493 Colgate-Palmolive Co. 1,827 144 Conagra Brands, Inc. 594 22
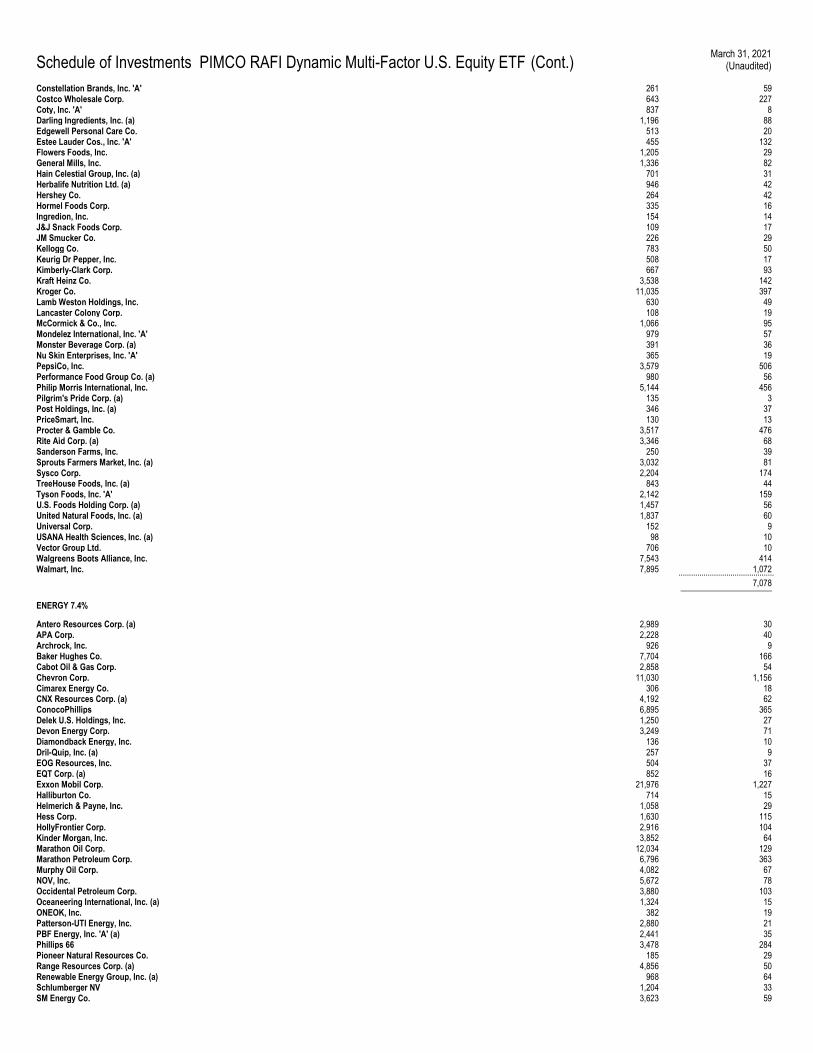
Schedule of Investments PIMCO RAFI Dynamic Multi-Factor U.S. Equity ETF (Cont.) March 31, 2021
(Unaudited)
Constellation Brands, Inc. 'A' 261 59 Costco Wholesale Corp. 643 227 Coty, Inc. 'A' 837 8 Darling Ingredients, Inc. (a) 1,196 88 Edgewell Personal Care Co. 513 20 Estee Lauder Cos., Inc. 'A' 455 132 Flowers Foods, Inc. 1,205 29 General Mills, Inc. 1,336 82 Hain Celestial Group, Inc. (a) 701 31 Herbalife Nutrition Ltd. (a) 946 42 Hershey Co. 264 42 Hormel Foods Corp. 335 16 Ingredion, Inc. 154 14 J&J Snack Foods Corp. 109 17 JM Smucker Co. 226 29 Kellogg Co. 783 50 Keurig Dr Pepper, Inc. 508 17 Kimberly-Clark Corp. 667 93 Kraft Heinz Co. 3,538 142 Kroger Co. 11,035 397 Lamb Weston Holdings, Inc. 630 49 Lancaster Colony Corp. 108 19 McCormick & Co., Inc. 1,066 95 Mondelez International, Inc. 'A' 979 57 Monster Beverage Corp. (a) 391 36 Nu Skin Enterprises, Inc. 'A' 365 19 PepsiCo, Inc. 3,579 506 Performance Food Group Co. (a) 980 56 Philip Morris International, Inc. 5,144 456 Pilgrim's Pride Corp. (a) 135 3 Post Holdings, Inc. (a) 346 37 PriceSmart, Inc. 130 13 Procter & Gamble Co. 3,517 476 Rite Aid Corp. (a) 3,346 68 Sanderson Farms, Inc. 250 39 Sprouts Farmers Market, Inc. (a) 3,032 81 Sysco Corp. 2,204 174 TreeHouse Foods, Inc. (a) 843 44 Tyson Foods, Inc. 'A' 2,142 159 U.S. Foods Holding Corp. (a) 1,457 56 United Natural Foods, Inc. (a) 1,837 60 Universal Corp. 152 9 USANA Health Sciences, Inc. (a) 98 10 Vector Group Ltd. 706 10 Walgreens Boots Alliance, Inc. 7,543 414 Walmart, Inc. 7,895 1,072 .............................................. 7,078 ______________________
ENERGY 7.4%
Antero Resources Corp. (a) 2,989 30 APA Corp. 2,228 40 Archrock, Inc. 926 9 Baker Hughes Co. 7,704 166 Cabot Oil & Gas Corp. 2,858 54 Chevron Corp. 11,030 1,156 Cimarex Energy Co. 306 18 CNX Resources Corp. (a) 4,192 62 ConocoPhillips 6,895 365 Delek U.S. Holdings, Inc. 1,250 27 Devon Energy Corp. 3,249 71 Diamondback Energy, Inc. 136 10 Dril-Quip, Inc. (a) 257 9 EOG Resources, Inc. 504 37 EQT Corp. (a) 852 16 Exxon Mobil Corp. 21,976 1,227 Halliburton Co. 714 15 Helmerich & Payne, Inc. 1,058 29 Hess Corp. 1,630 115 HollyFrontier Corp. 2,916 104 Kinder Morgan, Inc. 3,852 64 Marathon Oil Corp. 12,034 129 Marathon Petroleum Corp. 6,796 363 Murphy Oil Corp. 4,082 67 NOV, Inc. 5,672 78 Occidental Petroleum Corp. 3,880 103 Oceaneering International, Inc. (a) 1,324 15 ONEOK, Inc. 382 19 Patterson-UTI Energy, Inc. 2,880 21 PBF Energy, Inc. 'A' (a) 2,441 35 Phillips 66 3,478 284 Pioneer Natural Resources Co. 185 29 Range Resources Corp. (a) 4,856 50 Renewable Energy Group, Inc. (a) 968 64 Schlumberger NV 1,204 33 SM Energy Co. 3,623 59
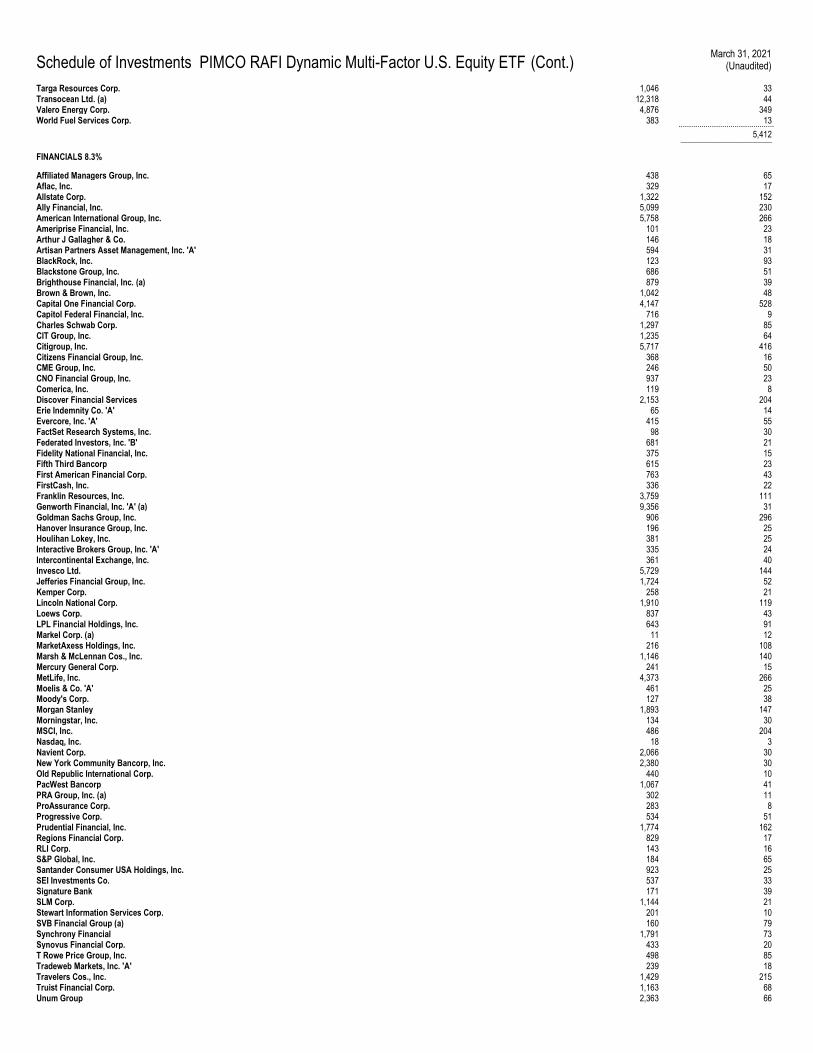
Schedule of Investments PIMCO RAFI Dynamic Multi-Factor U.S. Equity ETF (Cont.) March 31, 2021
(Unaudited)
Targa Resources Corp. 1,046 33 Transocean Ltd. (a) 12,318 44 Valero Energy Corp. 4,876 349 World Fuel Services Corp. 383 13 .............................................. 5,412 ______________________
FINANCIALS 8.3%
Affiliated Managers Group, Inc. 438 65 Aflac, Inc. 329 17 Allstate Corp. 1,322 152 Ally Financial, Inc. 5,099 230 American International Group, Inc. 5,758 266 Ameriprise Financial, Inc. 101 23 Arthur J Gallagher & Co. 146 18 Artisan Partners Asset Management, Inc. 'A' 594 31 BlackRock, Inc. 123 93 Blackstone Group, Inc. 686 51 Brighthouse Financial, Inc. (a) 879 39 Brown & Brown, Inc. 1,042 48 Capital One Financial Corp. 4,147 528 Capitol Federal Financial, Inc. 716 9 Charles Schwab Corp. 1,297 85 CIT Group, Inc. 1,235 64 Citigroup, Inc. 5,717 416 Citizens Financial Group, Inc. 368 16 CME Group, Inc. 246 50 CNO Financial Group, Inc. 937 23 Comerica, Inc. 119 8 Discover Financial Services 2,153 204 Erie Indemnity Co. 'A' 65 14 Evercore, Inc. 'A' 415 55 FactSet Research Systems, Inc. 98 30 Federated Investors, Inc. 'B' 681 21 Fidelity National Financial, Inc. 375 15 Fifth Third Bancorp 615 23 First American Financial Corp. 763 43 FirstCash, Inc. 336 22 Franklin Resources, Inc. 3,759 111 Genworth Financial, Inc. 'A' (a) 9,356 31 Goldman Sachs Group, Inc. 906 296 Hanover Insurance Group, Inc. 196 25 Houlihan Lokey, Inc. 381 25 Interactive Brokers Group, Inc. 'A' 335 24 Intercontinental Exchange, Inc. 361 40 Invesco Ltd. 5,729 144 Jefferies Financial Group, Inc. 1,724 52 Kemper Corp. 258 21 Lincoln National Corp. 1,910 119 Loews Corp. 837 43 LPL Financial Holdings, Inc. 643 91 Markel Corp. (a) 11 12 MarketAxess Holdings, Inc. 216 108 Marsh & McLennan Cos., Inc. 1,146 140 Mercury General Corp. 241 15 MetLife, Inc. 4,373 266 Moelis & Co. 'A' 461 25 Moody's Corp. 127 38 Morgan Stanley 1,893 147 Morningstar, Inc. 134 30 MSCI, Inc. 486 204 Nasdaq, Inc. 18 3 Navient Corp. 2,066 30 New York Community Bancorp, Inc. 2,380 30 Old Republic International Corp. 440 10 PacWest Bancorp 1,067 41 PRA Group, Inc. (a) 302 11 ProAssurance Corp. 283 8 Progressive Corp. 534 51 Prudential Financial, Inc. 1,774 162 Regions Financial Corp. 829 17 RLI Corp. 143 16 S&P Global, Inc. 184 65 Santander Consumer USA Holdings, Inc. 923 25 SEI Investments Co. 537 33 Signature Bank 171 39 SLM Corp. 1,144 21 Stewart Information Services Corp. 201 10 SVB Financial Group (a) 160 79 Synchrony Financial 1,791 73 Synovus Financial Corp. 433 20 T Rowe Price Group, Inc. 498 85 Tradeweb Markets, Inc. 'A' 239 18 Travelers Cos., Inc. 1,429 215 Truist Financial Corp. 1,163 68 Unum Group 2,363 66
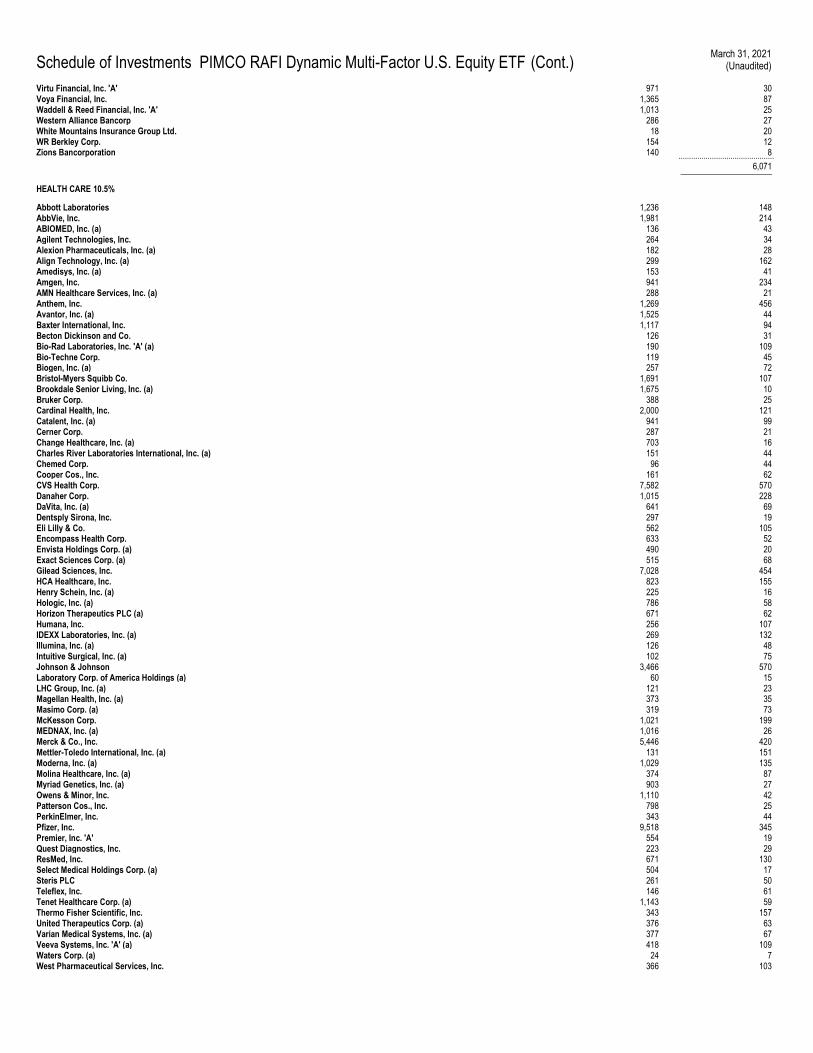
Schedule of Investments PIMCO RAFI Dynamic Multi-Factor U.S. Equity ETF (Cont.) March 31, 2021
(Unaudited)
Virtu Financial, Inc. 'A' 971 30 Voya Financial, Inc. 1,365 87 Waddell & Reed Financial, Inc. 'A' 1,013 25 Western Alliance Bancorp 286 27 White Mountains Insurance Group Ltd. 18 20 WR Berkley Corp. 154 12 Zions Bancorporation 140 8 .............................................. 6,071 ______________________
HEALTH CARE 10.5%
Abbott Laboratories 1,236 148 AbbVie, Inc. 1,981 214 ABIOMED, Inc. (a) 136 43 Agilent Technologies, Inc. 264 34 Alexion Pharmaceuticals, Inc. (a) 182 28 Align Technology, Inc. (a) 299 162 Amedisys, Inc. (a) 153 41 Amgen, Inc. 941 234 AMN Healthcare Services, Inc. (a) 288 21 Anthem, Inc. 1,269 456 Avantor, Inc. (a) 1,525 44 Baxter International, Inc. 1,117 94 Becton Dickinson and Co. 126 31 Bio-Rad Laboratories, Inc. 'A' (a) 190 109 Bio-Techne Corp. 119 45 Biogen, Inc. (a) 257 72 Bristol-Myers Squibb Co. 1,691 107 Brookdale Senior Living, Inc. (a) 1,675 10 Bruker Corp. 388 25 Cardinal Health, Inc. 2,000 121 Catalent, Inc. (a) 941 99 Cerner Corp. 287 21 Change Healthcare, Inc. (a) 703 16 Charles River Laboratories International, Inc. (a) 151 44 Chemed Corp. 96 44 Cooper Cos., Inc. 161 62 CVS Health Corp. 7,582 570 Danaher Corp. 1,015 228 DaVita, Inc. (a) 641 69 Dentsply Sirona, Inc. 297 19 Eli Lilly & Co. 562 105 Encompass Health Corp. 633 52 Envista Holdings Corp. (a) 490 20 Exact Sciences Corp. (a) 515 68 Gilead Sciences, Inc. 7,028 454 HCA Healthcare, Inc. 823 155 Henry Schein, Inc. (a) 225 16 Hologic, Inc. (a) 786 58 Horizon Therapeutics PLC (a) 671 62 Humana, Inc. 256 107 IDEXX Laboratories, Inc. (a) 269 132 Illumina, Inc. (a) 126 48 Intuitive Surgical, Inc. (a) 102 75 Johnson & Johnson 3,466 570 Laboratory Corp. of America Holdings (a) 60 15 LHC Group, Inc. (a) 121 23 Magellan Health, Inc. (a) 373 35 Masimo Corp. (a) 319 73 McKesson Corp. 1,021 199 MEDNAX, Inc. (a) 1,016 26 Merck & Co., Inc. 5,446 420 Mettler-Toledo International, Inc. (a) 131 151 Moderna, Inc. (a) 1,029 135 Molina Healthcare, Inc. (a) 374 87 Myriad Genetics, Inc. (a) 903 27 Owens & Minor, Inc. 1,110 42 Patterson Cos., Inc. 798 25 PerkinElmer, Inc. 343 44 Pfizer, Inc. 9,518 345 Premier, Inc. 'A' 554 19 Quest Diagnostics, Inc. 223 29 ResMed, Inc. 671 130 Select Medical Holdings Corp. (a) 504 17 Steris PLC 261 50 Teleflex, Inc. 146 61 Tenet Healthcare Corp. (a) 1,143 59 Thermo Fisher Scientific, Inc. 343 157 United Therapeutics Corp. (a) 376 63 Varian Medical Systems, Inc. (a) 377 67 Veeva Systems, Inc. 'A' (a) 418 109 Waters Corp. (a) 24 7 West Pharmaceutical Services, Inc. 366 103
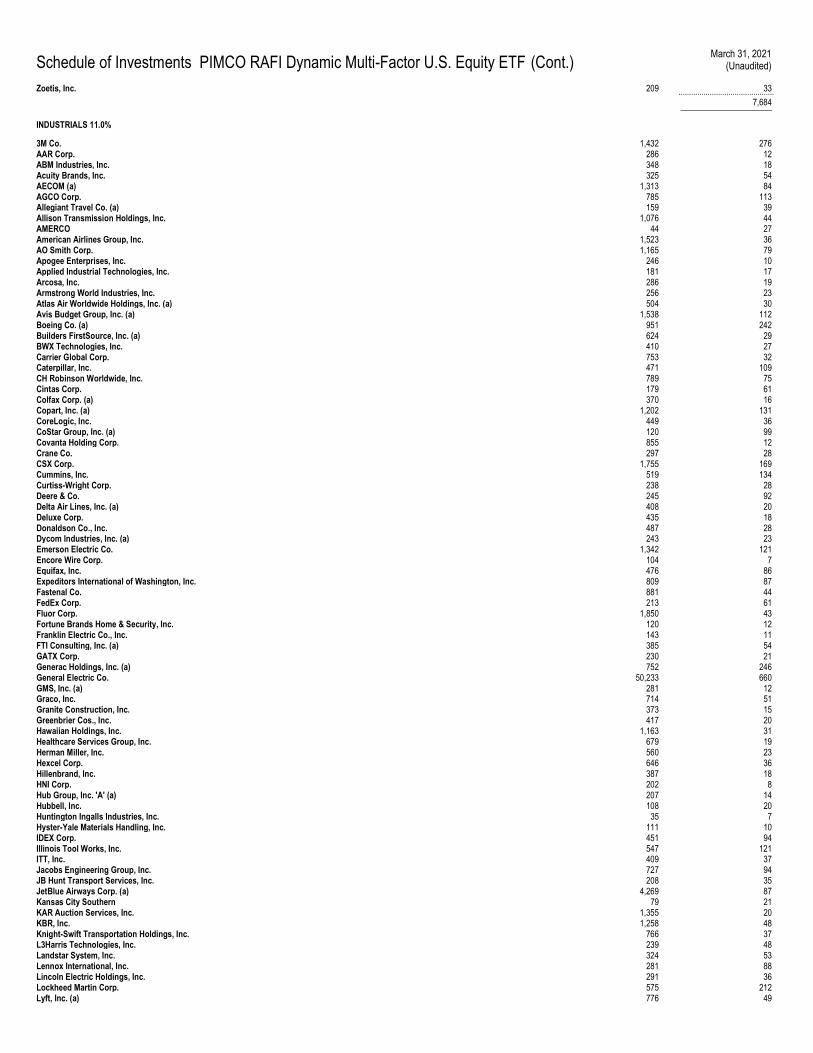
Schedule of Investments PIMCO RAFI Dynamic Multi-Factor U.S. Equity ETF (Cont.) March 31, 2021
(Unaudited)
Zoetis, Inc. 209 33 .............................................. 7,684 ______________________
INDUSTRIALS 11.0%
3M Co. 1,432 276 AAR Corp. 286 12 ABM Industries, Inc. 348 18 Acuity Brands, Inc. 325 54 AECOM (a) 1,313 84 AGCO Corp. 785 113 Allegiant Travel Co. (a) 159 39 Allison Transmission Holdings, Inc. 1,076 44 AMERCO 44 27 American Airlines Group, Inc. 1,523 36 AO Smith Corp. 1,165 79 Apogee Enterprises, Inc. 246 10 Applied Industrial Technologies, Inc. 181 17 Arcosa, Inc. 286 19 Armstrong World Industries, Inc. 256 23 Atlas Air Worldwide Holdings, Inc. (a) 504 30 Avis Budget Group, Inc. (a) 1,538 112 Boeing Co. (a) 951 242 Builders FirstSource, Inc. (a) 624 29 BWX Technologies, Inc. 410 27 Carrier Global Corp. 753 32 Caterpillar, Inc. 471 109 CH Robinson Worldwide, Inc. 789 75 Cintas Corp. 179 61 Colfax Corp. (a) 370 16 Copart, Inc. (a) 1,202 131 CoreLogic, Inc. 449 36 CoStar Group, Inc. (a) 120 99 Covanta Holding Corp. 855 12 Crane Co. 297 28 CSX Corp. 1,755 169 Cummins, Inc. 519 134 Curtiss-Wright Corp. 238 28 Deere & Co. 245 92 Delta Air Lines, Inc. (a) 408 20 Deluxe Corp. 435 18 Donaldson Co., Inc. 487 28 Dycom Industries, Inc. (a) 243 23 Emerson Electric Co. 1,342 121 Encore Wire Corp. 104 7 Equifax, Inc. 476 86 Expeditors International of Washington, Inc. 809 87 Fastenal Co. 881 44 FedEx Corp. 213 61 Fluor Corp. 1,850 43 Fortune Brands Home & Security, Inc. 120 12 Franklin Electric Co., Inc. 143 11 FTI Consulting, Inc. (a) 385 54 GATX Corp. 230 21 Generac Holdings, Inc. (a) 752 246 General Electric Co. 50,233 660 GMS, Inc. (a) 281 12 Graco, Inc. 714 51 Granite Construction, Inc. 373 15 Greenbrier Cos., Inc. 417 20 Hawaiian Holdings, Inc. 1,163 31 Healthcare Services Group, Inc. 679 19 Herman Miller, Inc. 560 23 Hexcel Corp. 646 36 Hillenbrand, Inc. 387 18 HNI Corp. 202 8 Hub Group, Inc. 'A' (a) 207 14 Hubbell, Inc. 108 20 Huntington Ingalls Industries, Inc. 35 7 Hyster-Yale Materials Handling, Inc. 111 10 IDEX Corp. 451 94 Illinois Tool Works, Inc. 547 121 ITT, Inc. 409 37 Jacobs Engineering Group, Inc. 727 94 JB Hunt Transport Services, Inc. 208 35 JetBlue Airways Corp. (a) 4,269 87 Kansas City Southern 79 21 KAR Auction Services, Inc. 1,355 20 KBR, Inc. 1,258 48 Knight-Swift Transportation Holdings, Inc. 766 37 L3Harris Technologies, Inc. 239 48 Landstar System, Inc. 324 53 Lennox International, Inc. 281 88 Lincoln Electric Holdings, Inc. 291 36 Lockheed Martin Corp. 575 212 Lyft, Inc. (a) 776 49
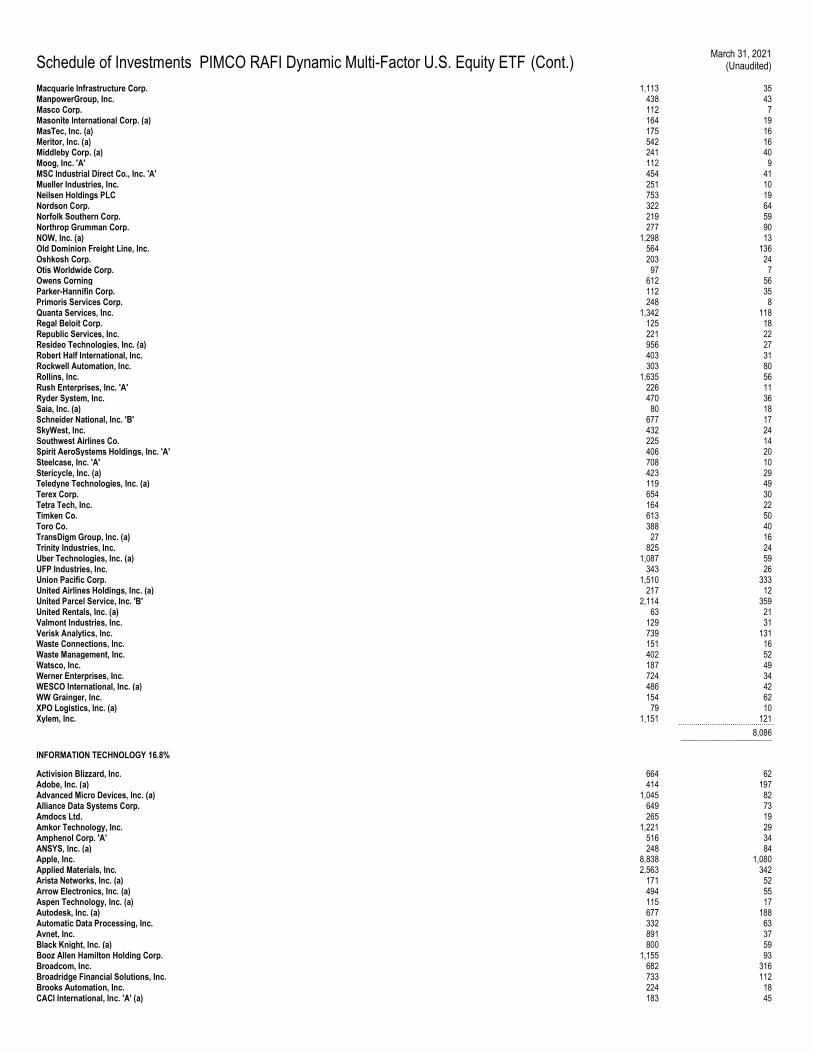
Schedule of Investments PIMCO RAFI Dynamic Multi-Factor U.S. Equity ETF (Cont.) March 31, 2021
(Unaudited)
Macquarie Infrastructure Corp. 1,113 35 ManpowerGroup, Inc. 438 43 Masco Corp. 112 7 Masonite International Corp. (a) 164 19 MasTec, Inc. (a) 175 16 Meritor, Inc. (a) 542 16 Middleby Corp. (a) 241 40 Moog, Inc. 'A' 112 9 MSC Industrial Direct Co., Inc. 'A' 454 41 Mueller Industries, Inc. 251 10 Neilsen Holdings PLC 753 19 Nordson Corp. 322 64 Norfolk Southern Corp. 219 59 Northrop Grumman Corp. 277 90 NOW, Inc. (a) 1,298 13 Old Dominion Freight Line, Inc. 564 136 Oshkosh Corp. 203 24 Otis Worldwide Corp. 97 7 Owens Corning 612 56 Parker-Hannifin Corp. 112 35 Primoris Services Corp. 248 8 Quanta Services, Inc. 1,342 118 Regal Beloit Corp. 125 18 Republic Services, Inc. 221 22 Resideo Technologies, Inc. (a) 956 27 Robert Half International, Inc. 403 31 Rockwell Automation, Inc. 303 80 Rollins, Inc. 1,635 56 Rush Enterprises, Inc. 'A' 226 11 Ryder System, Inc. 470 36 Saia, Inc. (a) 80 18 Schneider National, Inc. 'B' 677 17 SkyWest, Inc. 432 24 Southwest Airlines Co. 225 14 Spirit AeroSystems Holdings, Inc. 'A' 406 20 Steelcase, Inc. 'A' 708 10 Stericycle, Inc. (a) 423 29 Teledyne Technologies, Inc. (a) 119 49 Terex Corp. 654 30 Tetra Tech, Inc. 164 22 Timken Co. 613 50 Toro Co. 388 40 TransDigm Group, Inc. (a) 27 16 Trinity Industries, Inc. 825 24 Uber Technologies, Inc. (a) 1,087 59 UFP Industries, Inc. 343 26 Union Pacific Corp. 1,510 333 United Airlines Holdings, Inc. (a) 217 12 United Parcel Service, Inc. 'B' 2,114 359 United Rentals, Inc. (a) 63 21 Valmont Industries, Inc. 129 31 Verisk Analytics, Inc. 739 131 Waste Connections, Inc. 151 16 Waste Management, Inc. 402 52 Watsco, Inc. 187 49 Werner Enterprises, Inc. 724 34 WESCO International, Inc. (a) 486 42 WW Grainger, Inc. 154 62 XPO Logistics, Inc. (a) 79 10 Xylem, Inc. 1,151 121 .............................................. 8,086 ______________________
INFORMATION TECHNOLOGY 16.8%
Activision Blizzard, Inc. 664 62 Adobe, Inc. (a) 414 197 Advanced Micro Devices, Inc. (a) 1,045 82 Alliance Data Systems Corp. 649 73 Amdocs Ltd. 265 19 Amkor Technology, Inc. 1,221 29 Amphenol Corp. 'A' 516 34 ANSYS, Inc. (a) 248 84 Apple, Inc. 8,838 1,080 Applied Materials, Inc. 2,563 342 Arista Networks, Inc. (a) 171 52 Arrow Electronics, Inc. (a) 494 55 Aspen Technology, Inc. (a) 115 17 Autodesk, Inc. (a) 677 188 Automatic Data Processing, Inc. 332 63 Avnet, Inc. 891 37 Black Knight, Inc. (a) 800 59 Booz Allen Hamilton Holding Corp. 1,155 93 Broadcom, Inc. 682 316 Broadridge Financial Solutions, Inc. 733 112 Brooks Automation, Inc. 224 18 CACI International, Inc. 'A' (a) 183 45
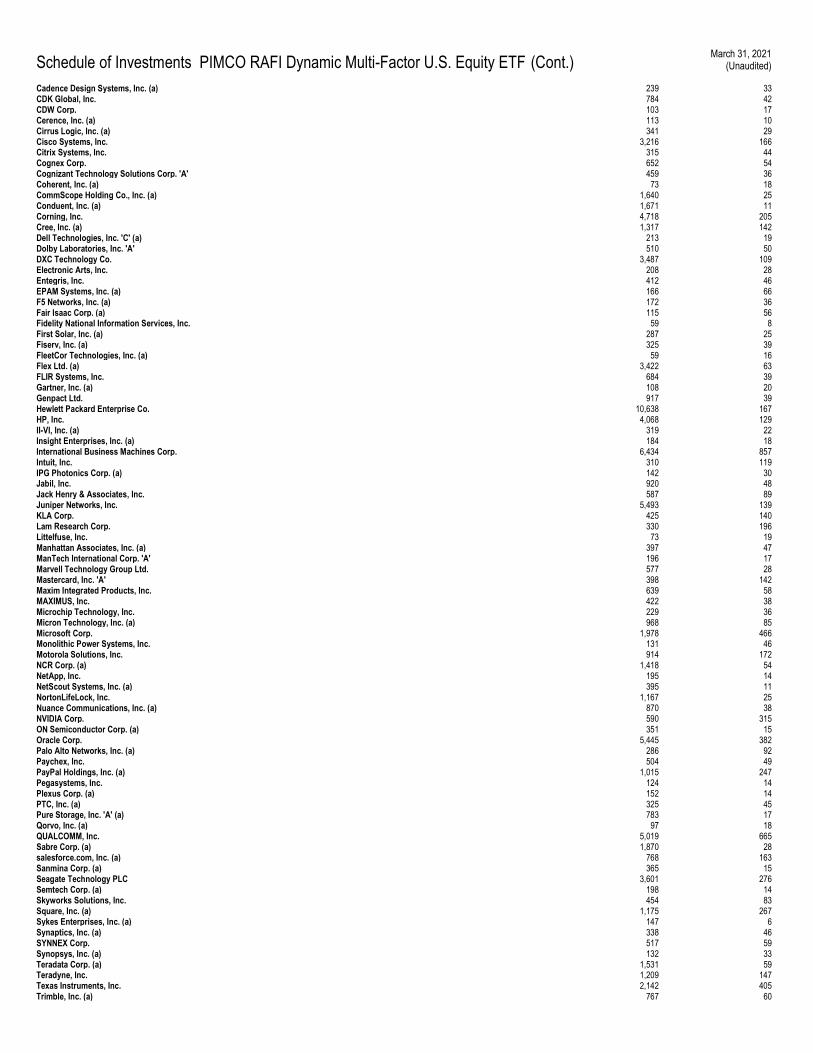
Schedule of Investments PIMCO RAFI Dynamic Multi-Factor U.S. Equity ETF (Cont.) March 31, 2021
(Unaudited)
Cadence Design Systems, Inc. (a) 239 33 CDK Global, Inc. 784 42 CDW Corp. 103 17 Cerence, Inc. (a) 113 10 Cirrus Logic, Inc. (a) 341 29 Cisco Systems, Inc. 3,216 166 Citrix Systems, Inc. 315 44 Cognex Corp. 652 54 Cognizant Technology Solutions Corp. 'A' 459 36 Coherent, Inc. (a) 73 18 CommScope Holding Co., Inc. (a) 1,640 25 Conduent, Inc. (a) 1,671 11 Corning, Inc. 4,718 205 Cree, Inc. (a) 1,317 142 Dell Technologies, Inc. 'C' (a) 213 19 Dolby Laboratories, Inc. 'A' 510 50 DXC Technology Co. 3,487 109 Electronic Arts, Inc. 208 28 Entegris, Inc. 412 46 EPAM Systems, Inc. (a) 166 66 F5 Networks, Inc. (a) 172 36 Fair Isaac Corp. (a) 115 56 Fidelity National Information Services, Inc. 59 8 First Solar, Inc. (a) 287 25 Fiserv, Inc. (a) 325 39 FleetCor Technologies, Inc. (a) 59 16 Flex Ltd. (a) 3,422 63 FLIR Systems, Inc. 684 39 Gartner, Inc. (a) 108 20 Genpact Ltd. 917 39 Hewlett Packard Enterprise Co. 10,638 167 HP, Inc. 4,068 129 II-VI, Inc. (a) 319 22 Insight Enterprises, Inc. (a) 184 18 International Business Machines Corp. 6,434 857 Intuit, Inc. 310 119 IPG Photonics Corp. (a) 142 30 Jabil, Inc. 920 48 Jack Henry & Associates, Inc. 587 89 Juniper Networks, Inc. 5,493 139 KLA Corp. 425 140 Lam Research Corp. 330 196 Littelfuse, Inc. 73 19 Manhattan Associates, Inc. (a) 397 47 ManTech International Corp. 'A' 196 17 Marvell Technology Group Ltd. 577 28 Mastercard, Inc. 'A' 398 142 Maxim Integrated Products, Inc. 639 58 MAXIMUS, Inc. 422 38 Microchip Technology, Inc. 229 36 Micron Technology, Inc. (a) 968 85 Microsoft Corp. 1,978 466 Monolithic Power Systems, Inc. 131 46 Motorola Solutions, Inc. 914 172 NCR Corp. (a) 1,418 54 NetApp, Inc. 195 14 NetScout Systems, Inc. (a) 395 11 NortonLifeLock, Inc. 1,167 25 Nuance Communications, Inc. (a) 870 38 NVIDIA Corp. 590 315 ON Semiconductor Corp. (a) 351 15 Oracle Corp. 5,445 382 Palo Alto Networks, Inc. (a) 286 92 Paychex, Inc. 504 49 PayPal Holdings, Inc. (a) 1,015 247 Pegasystems, Inc. 124 14 Plexus Corp. (a) 152 14 PTC, Inc. (a) 325 45 Pure Storage, Inc. 'A' (a) 783 17 Qorvo, Inc. (a) 97 18 QUALCOMM, Inc. 5,019 665 Sabre Corp. (a) 1,870 28 salesforce.com, Inc. (a) 768 163 Sanmina Corp. (a) 365 15 Seagate Technology PLC 3,601 276 Semtech Corp. (a) 198 14 Skyworks Solutions, Inc. 454 83 Square, Inc. (a) 1,175 267 Sykes Enterprises, Inc. (a) 147 6 Synaptics, Inc. (a) 338 46 SYNNEX Corp. 517 59 Synopsys, Inc. (a) 132 33 Teradata Corp. (a) 1,531 59 Teradyne, Inc. 1,209 147 Texas Instruments, Inc. 2,142 405 Trimble, Inc. (a) 767 60
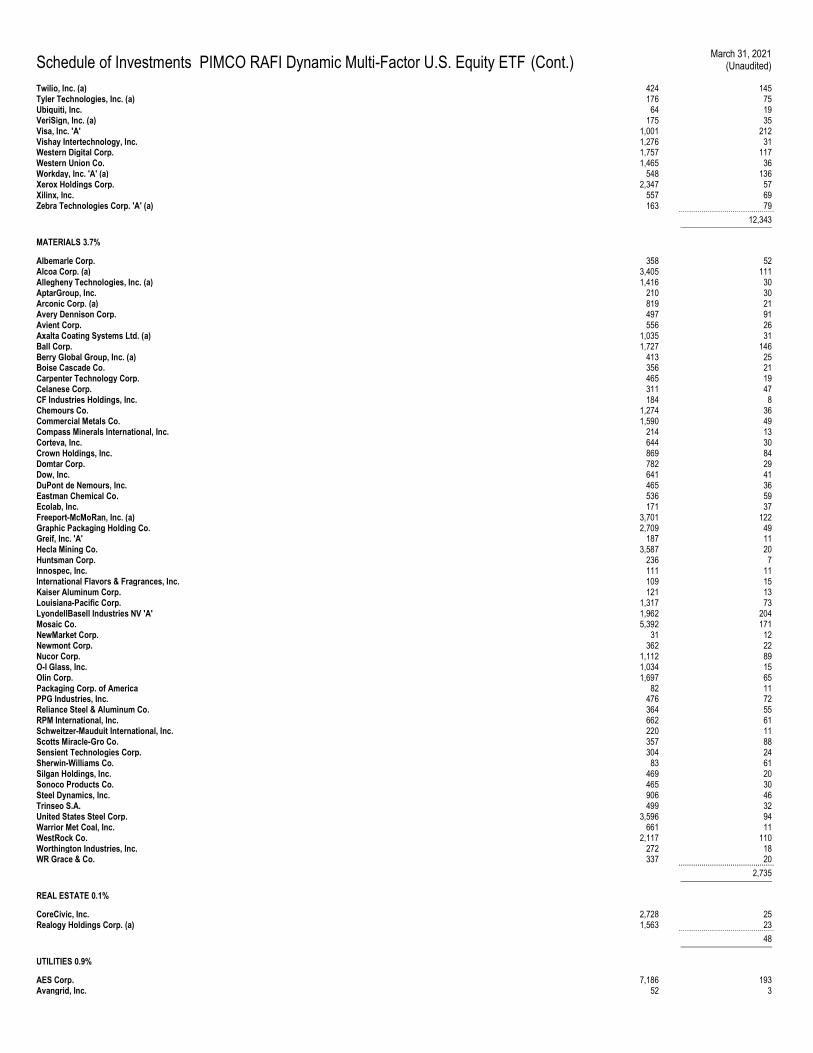
Schedule of Investments PIMCO RAFI Dynamic Multi-Factor U.S. Equity ETF (Cont.) March 31, 2021
(Unaudited)
Twilio, Inc. (a) 424 145 Tyler Technologies, Inc. (a) 176 75 Ubiquiti, Inc. 64 19 VeriSign, Inc. (a) 175 35 Visa, Inc. 'A' 1,001 212 Vishay Intertechnology, Inc. 1,276 31 Western Digital Corp. 1,757 117 Western Union Co. 1,465 36 Workday, Inc. 'A' (a) 548 136 Xerox Holdings Corp. 2,347 57 Xilinx, Inc. 557 69 Zebra Technologies Corp. 'A' (a) 163 79 .............................................. 12,343 ______________________
MATERIALS 3.7%
Albemarle Corp. 358 52 Alcoa Corp. (a) 3,405 111 Allegheny Technologies, Inc. (a) 1,416 30 AptarGroup, Inc. 210 30 Arconic Corp. (a) 819 21 Avery Dennison Corp. 497 91 Avient Corp. 556 26 Axalta Coating Systems Ltd. (a) 1,035 31 Ball Corp. 1,727 146 Berry Global Group, Inc. (a) 413 25 Boise Cascade Co. 356 21 Carpenter Technology Corp. 465 19 Celanese Corp. 311 47 CF Industries Holdings, Inc. 184 8 Chemours Co. 1,274 36 Commercial Metals Co. 1,590 49 Compass Minerals International, Inc. 214 13 Corteva, Inc. 644 30 Crown Holdings, Inc. 869 84 Domtar Corp. 782 29 Dow, Inc. 641 41 DuPont de Nemours, Inc. 465 36 Eastman Chemical Co. 536 59 Ecolab, Inc. 171 37 Freeport-McMoRan, Inc. (a) 3,701 122 Graphic Packaging Holding Co. 2,709 49 Greif, Inc. 'A' 187 11 Hecla Mining Co. 3,587 20 Huntsman Corp. 236 7 Innospec, Inc. 111 11 International Flavors & Fragrances, Inc. 109 15 Kaiser Aluminum Corp. 121 13 Louisiana-Pacific Corp. 1,317 73 LyondellBasell Industries NV 'A' 1,962 204 Mosaic Co. 5,392 171 NewMarket Corp. 31 12 Newmont Corp. 362 22 Nucor Corp. 1,112 89 O-I Glass, Inc. 1,034 15 Olin Corp. 1,697 65 Packaging Corp. of America 82 11 PPG Industries, Inc. 476 72 Reliance Steel & Aluminum Co. 364 55 RPM International, Inc. 662 61 Schweitzer-Mauduit International, Inc. 220 11 Scotts Miracle-Gro Co. 357 88 Sensient Technologies Corp. 304 24 Sherwin-Williams Co. 83 61 Silgan Holdings, Inc. 469 20 Sonoco Products Co. 465 30 Steel Dynamics, Inc. 906 46 Trinseo S.A. 499 32 United States Steel Corp. 3,596 94 Warrior Met Coal, Inc. 661 11 WestRock Co. 2,117 110 Worthington Industries, Inc. 272 18 WR Grace & Co. 337 20 .............................................. 2,735 ______________________
REAL ESTATE 0.1%
CoreCivic, Inc. 2,728 25 Realogy Holdings Corp. (a) 1,563 23 .............................................. 48 ______________________
UTILITIES 0.9%
AES Corp. 7,186 193 Avangrid, Inc. 52 3
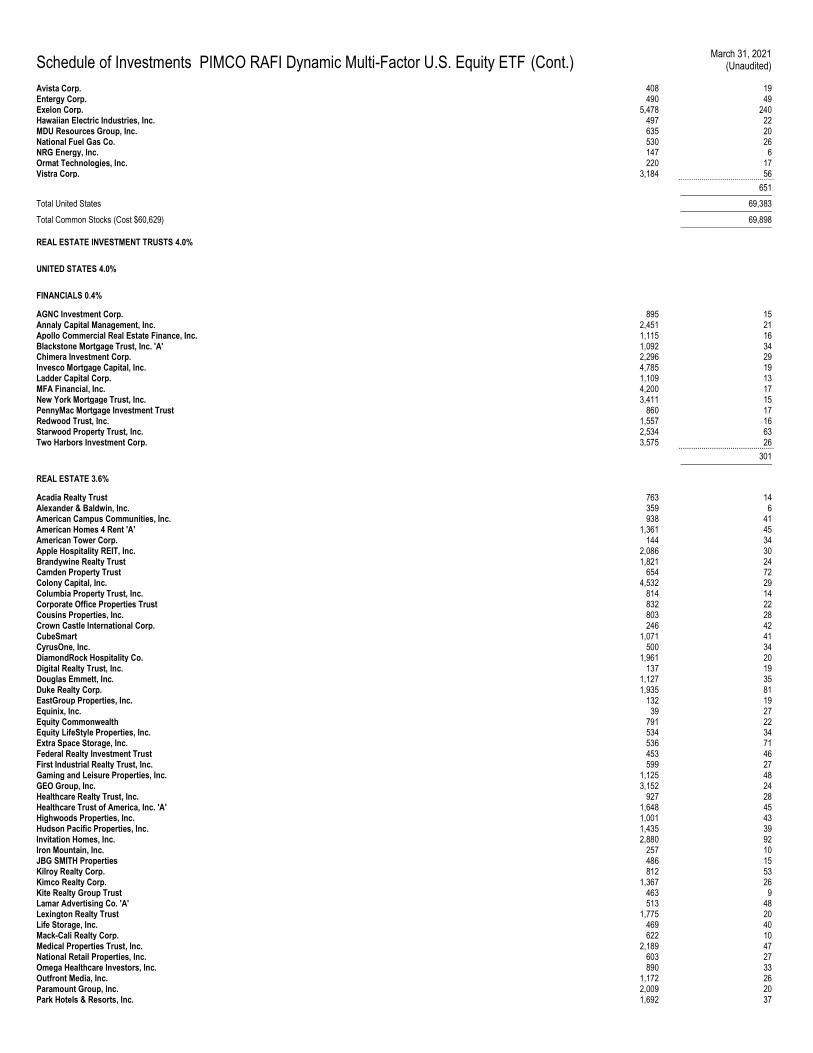
Schedule of Investments PIMCO RAFI Dynamic Multi-Factor U.S. Equity ETF (Cont.) March 31, 2021
(Unaudited)
Avista Corp. 408 19 Entergy Corp. 490 49 Exelon Corp. 5,478 240 Hawaiian Electric Industries, Inc. 497 22 MDU Resources Group, Inc. 635 20 National Fuel Gas Co. 530 26 NRG Energy, Inc. 147 6 Ormat Technologies, Inc. 220 17 Vistra Corp. 3,184 56 .............................................. 651 ______________________
Total United States 69,383 ______________________
Total Common Stocks (Cost $60,629) 69,898 ______________________
REAL ESTATE INVESTMENT TRUSTS 4.0%
UNITED STATES 4.0%
FINANCIALS 0.4%
AGNC Investment Corp. 895 15 Annaly Capital Management, Inc. 2,451 21 Apollo Commercial Real Estate Finance, Inc. 1,115 16 Blackstone Mortgage Trust, Inc. 'A' 1,092 34 Chimera Investment Corp. 2,296 29 Invesco Mortgage Capital, Inc. 4,785 19 Ladder Capital Corp. 1,109 13 MFA Financial, Inc. 4,200 17 New York Mortgage Trust, Inc. 3,411 15 PennyMac Mortgage Investment Trust 860 17 Redwood Trust, Inc. 1,557 16 Starwood Property Trust, Inc. 2,534 63 Two Harbors Investment Corp. 3,575 26 .............................................. 301 ______________________
REAL ESTATE 3.6%
Acadia Realty Trust 763 14 Alexander & Baldwin, Inc. 359 6 American Campus Communities, Inc. 938 41 American Homes 4 Rent 'A' 1,361 45 American Tower Corp. 144 34 Apple Hospitality REIT, Inc. 2,086 30 Brandywine Realty Trust 1,821 24 Camden Property Trust 654 72 Colony Capital, Inc. 4,532 29 Columbia Property Trust, Inc. 814 14 Corporate Office Properties Trust 832 22 Cousins Properties, Inc. 803 28 Crown Castle International Corp. 246 42 CubeSmart 1,071 41 CyrusOne, Inc. 500 34 DiamondRock Hospitality Co. 1,961 20 Digital Realty Trust, Inc. 137 19 Douglas Emmett, Inc. 1,127 35 Duke Realty Corp. 1,935 81 EastGroup Properties, Inc. 132 19 Equinix, Inc. 39 27 Equity Commonwealth 791 22 Equity LifeStyle Properties, Inc. 534 34 Extra Space Storage, Inc. 536 71 Federal Realty Investment Trust 453 46 First Industrial Realty Trust, Inc. 599 27 Gaming and Leisure Properties, Inc. 1,125 48 GEO Group, Inc. 3,152 24 Healthcare Realty Trust, Inc. 927 28 Healthcare Trust of America, Inc. 'A' 1,648 45 Highwoods Properties, Inc. 1,001 43 Hudson Pacific Properties, Inc. 1,435 39 Invitation Homes, Inc. 2,880 92 Iron Mountain, Inc. 257 10 JBG SMITH Properties 486 15 Kilroy Realty Corp. 812 53 Kimco Realty Corp. 1,367 26 Kite Realty Group Trust 463 9 Lamar Advertising Co. 'A' 513 48 Lexington Realty Trust 1,775 20 Life Storage, Inc. 469 40 Mack-Cali Realty Corp. 622 10 Medical Properties Trust, Inc. 2,189 47 National Retail Properties, Inc. 603 27 Omega Healthcare Investors, Inc. 890 33 Outfront Media, Inc. 1,172 26 Paramount Group, Inc. 2,009 20 Park Hotels & Resorts, Inc. 1,692 37
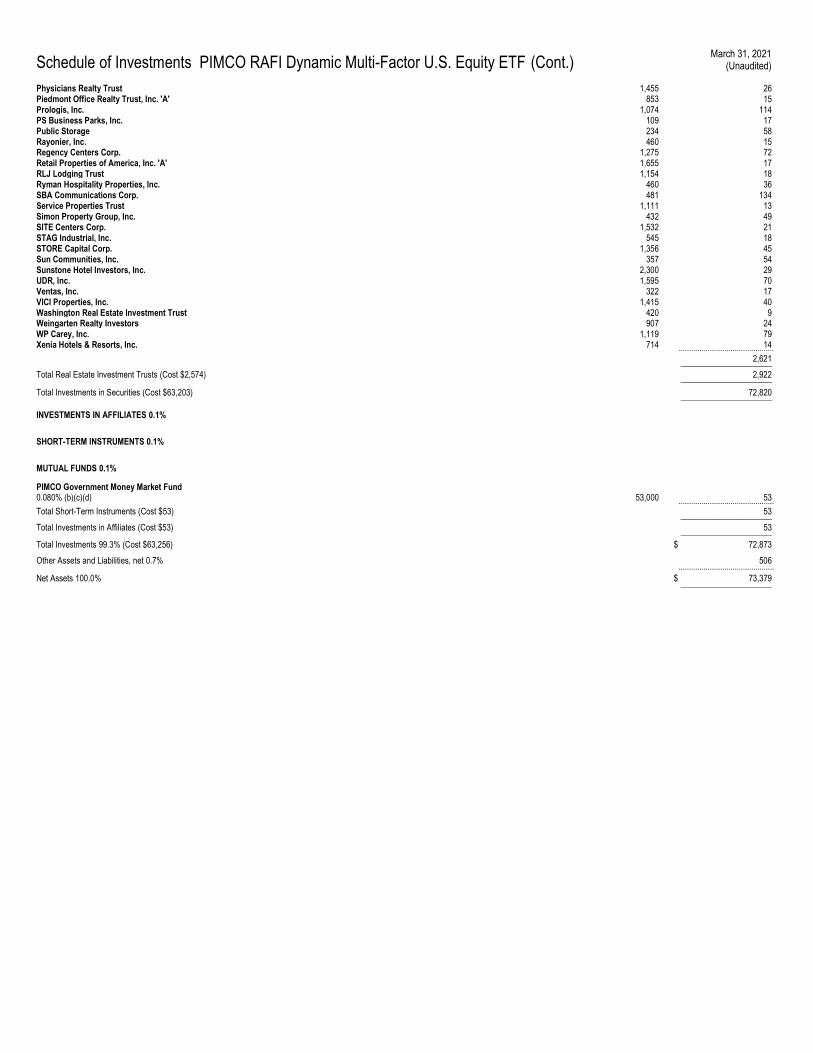
Schedule of Investments PIMCO RAFI Dynamic Multi-Factor U.S. Equity ETF (Cont.) March 31, 2021
(Unaudited)
Physicians Realty Trust 1,455 26 Piedmont Office Realty Trust, Inc. 'A' 853 15 Prologis, Inc. 1,074 114 PS Business Parks, Inc. 109 17 Public Storage 234 58 Rayonier, Inc. 460 15 Regency Centers Corp. 1,275 72 Retail Properties of America, Inc. 'A' 1,655 17 RLJ Lodging Trust 1,154 18 Ryman Hospitality Properties, Inc. 460 36 SBA Communications Corp. 481 134 Service Properties Trust 1,111 13 Simon Property Group, Inc. 432 49 SITE Centers Corp. 1,532 21 STAG Industrial, Inc. 545 18 STORE Capital Corp. 1,356 45 Sun Communities, Inc. 357 54 Sunstone Hotel Investors, Inc. 2,300 29 UDR, Inc. 1,595 70 Ventas, Inc. 322 17 VICI Properties, Inc. 1,415 40 Washington Real Estate Investment Trust 420 9 Weingarten Realty Investors 907 24 WP Carey, Inc. 1,119 79 Xenia Hotels & Resorts, Inc. 714 14 .............................................. 2,621 ______________________
Total Real Estate Investment Trusts (Cost $2,574) 2,922 ______________________ Total Investments in Securities (Cost $63,203) 72,820 ______________________
INVESTMENTS IN AFFILIATES 0.1%
SHORT-TERM INSTRUMENTS 0.1%
MUTUAL FUNDS 0.1%
PIMCO Government Money Market Fund 0.080% (b)(c)(d) 53,000 53 .............................................. Total Short-Term Instruments (Cost $53) 53 ______________________
Total Investments in Affiliates (Cost $53) 53 ______________________
Total Investments 99.3% (Cost $63,256) $ 72,873
Other Assets and Liabilities, net 0.7% 506 ..............................................
Net Assets 100.0% $ 73,379 ______________________
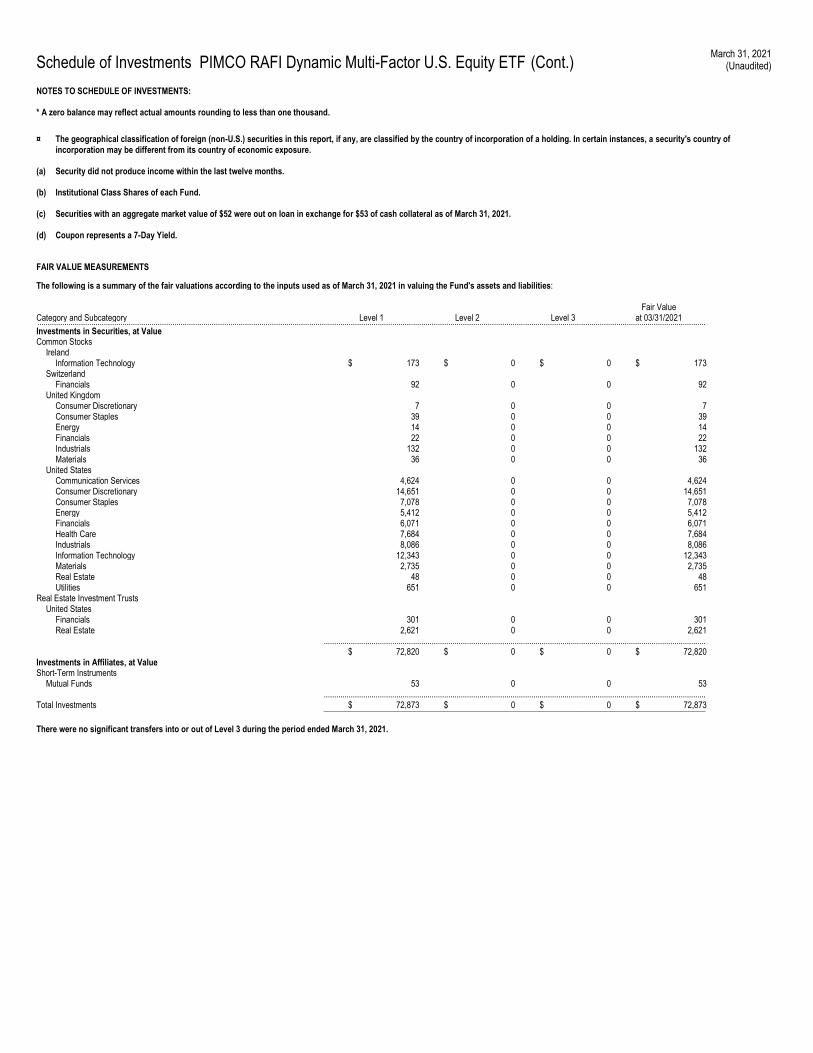
Schedule of Investments PIMCO RAFI Dynamic Multi-Factor U.S. Equity ETF (Cont.) March 31, 2021
(Unaudited)
NOTES TO SCHEDULE OF INVESTMENTS: * A zero balance may reflect actual amounts rounding to less than one thousand.
¤ The geographical classification of foreign (non-U.S.) securities in this report, if any, are classified by the country of incorporation of a holding. In certain instances, a security's country of incorporation may be different from its country of economic exposure.
(a) Security did not produce income within the last twelve months.
(b) Institutional Class Shares of each Fund.
(c) Securities with an aggregate market value of $52 were out on loan in exchange for $53 of cash collateral as of March 31, 2021.
(d) Coupon represents a 7-Day Yield.
FAIR VALUE MEASUREMENTS
The following is a summary of the fair valuations according to the inputs used as of March 31, 2021 in valuing the Fund's assets and liabilities:
Category and Subcategory Level 1 Level 2 Level 3 Fair Value
at 03/31/2021 .................................................................................................................................................................................................................................................................................................................................. Investments in Securities, at Value Common Stocks Ireland Information Technology $ 173 $ 0 $ 0 $ 173 Switzerland Financials 92 0 0 92 United Kingdom Consumer Discretionary 7 0 0 7 Consumer Staples 39 0 0 39 Energy 14 0 0 14 Financials 22 0 0 22 Industrials 132 0 0 132 Materials 36 0 0 36 United States Communication Services 4,624 0 0 4,624 Consumer Discretionary 14,651 0 0 14,651 Consumer Staples 7,078 0 0 7,078 Energy 5,412 0 0 5,412 Financials 6,071 0 0 6,071 Health Care 7,684 0 0 7,684 Industrials 8,086 0 0 8,086 Information Technology 12,343 0 0 12,343 Materials 2,735 0 0 2,735 Real Estate 48 0 0 48 Utilities 651 0 0 651 Real Estate Investment Trusts United States Financials 301 0 0 301 Real Estate 2,621 0 0 2,621 ........................................................................................................................................................................................ $ 72,820 $ 0 $ 0 $ 72,820 Investments in Affiliates, at Value Short-Term Instruments Mutual Funds 53 0 0 53 ........................................................................................................................................................................................ Total Investments $ 72,873 $ 0 $ 0 $ 72,873 ____________________________________________________________________________________________ There were no significant transfers into or out of Level 3 during the period ended March 31, 2021.
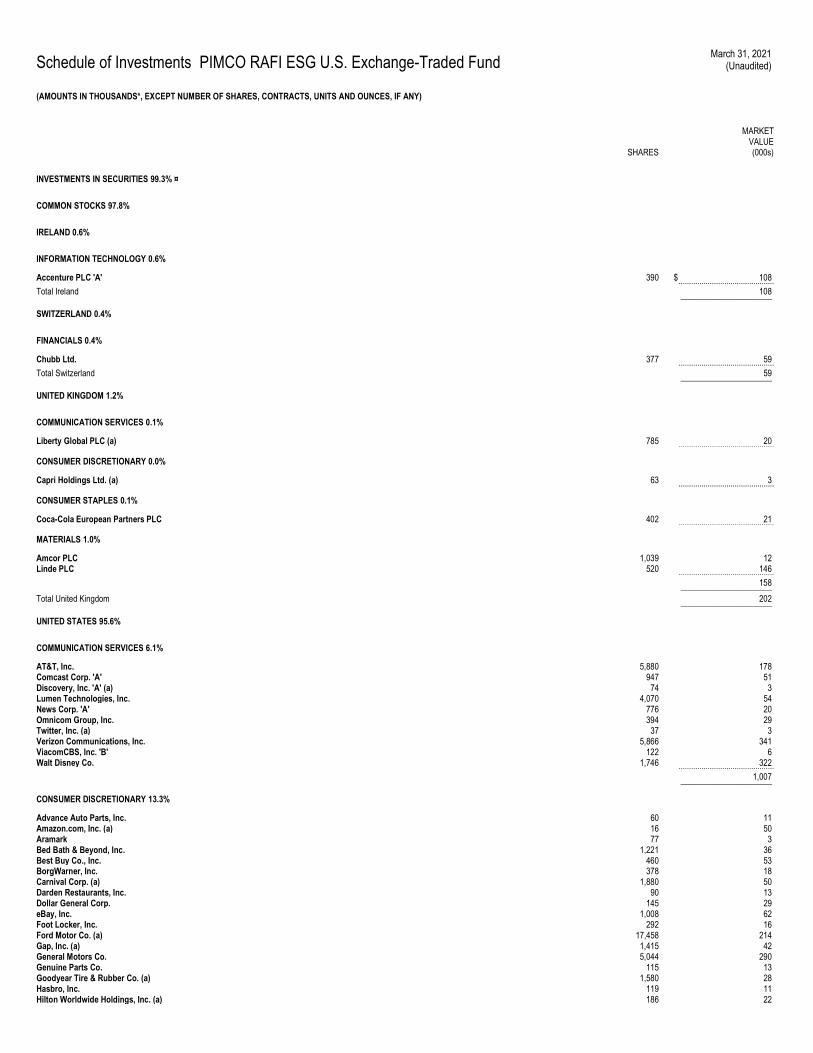
Schedule of Investments PIMCO RAFI ESG U.S. Exchange-Traded Fund March 31, 2021
(Unaudited)
(AMOUNTS IN THOUSANDS*, EXCEPT NUMBER OF SHARES, CONTRACTS, UNITS AND OUNCES, IF ANY)
SHARES
MARKET VALUE (000s)
INVESTMENTS IN SECURITIES 99.3% ¤
COMMON STOCKS 97.8%
IRELAND 0.6%
INFORMATION TECHNOLOGY 0.6%
Accenture PLC 'A' 390 $ 108 .............................................. Total Ireland 108 ______________________
SWITZERLAND 0.4%
FINANCIALS 0.4%
Chubb Ltd. 377 59 .............................................. Total Switzerland 59 ______________________
UNITED KINGDOM 1.2%
COMMUNICATION SERVICES 0.1%
Liberty Global PLC (a) 785 20 ..............................................
CONSUMER DISCRETIONARY 0.0%
Capri Holdings Ltd. (a) 63 3 ..............................................
CONSUMER STAPLES 0.1%
Coca-Cola European Partners PLC 402 21 ..............................................
MATERIALS 1.0%
Amcor PLC 1,039 12 Linde PLC 520 146 .............................................. 158 ______________________
Total United Kingdom 202 ______________________
UNITED STATES 95.6%
COMMUNICATION SERVICES 6.1%
AT&T, Inc. 5,880 178 Comcast Corp. 'A' 947 51 Discovery, Inc. 'A' (a) 74 3 Lumen Technologies, Inc. 4,070 54 News Corp. 'A' 776 20 Omnicom Group, Inc. 394 29 Twitter, Inc. (a) 37 3 Verizon Communications, Inc. 5,866 341 ViacomCBS, Inc. 'B' 122 6 Walt Disney Co. 1,746 322 .............................................. 1,007 ______________________
CONSUMER DISCRETIONARY 13.3%
Advance Auto Parts, Inc. 60 11 Amazon.com, Inc. (a) 16 50 Aramark 77 3 Bed Bath & Beyond, Inc. 1,221 36 Best Buy Co., Inc. 460 53 BorgWarner, Inc. 378 18 Carnival Corp. (a) 1,880 50 Darden Restaurants, Inc. 90 13 Dollar General Corp. 145 29 eBay, Inc. 1,008 62 Foot Locker, Inc. 292 16 Ford Motor Co. (a) 17,458 214 Gap, Inc. (a) 1,415 42 General Motors Co. 5,044 290 Genuine Parts Co. 115 13 Goodyear Tire & Rubber Co. (a) 1,580 28 Hasbro, Inc. 119 11 Hilton Worldwide Holdings, Inc. (a) 186 22
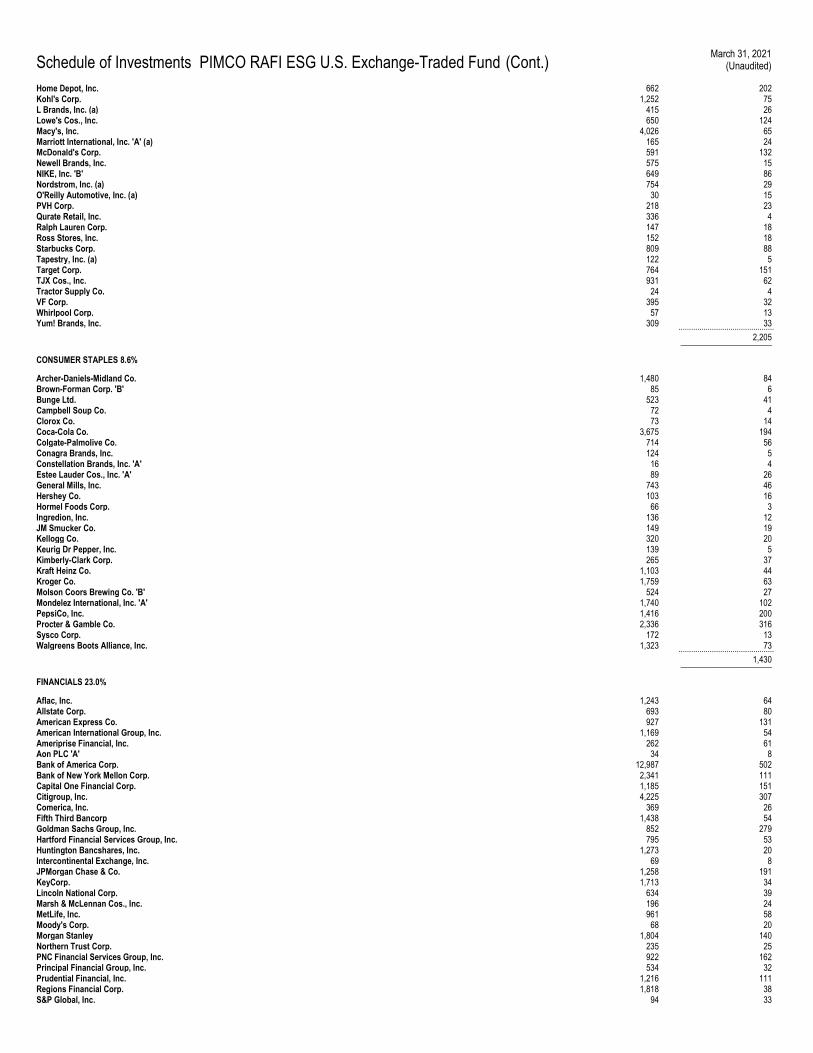
Schedule of Investments PIMCO RAFI ESG U.S. Exchange-Traded Fund (Cont.) March 31, 2021
(Unaudited)
Home Depot, Inc. 662 202 Kohl's Corp. 1,252 75 L Brands, Inc. (a) 415 26 Lowe's Cos., Inc. 650 124 Macy's, Inc. 4,026 65 Marriott International, Inc. 'A' (a) 165 24 McDonald's Corp. 591 132 Newell Brands, Inc. 575 15 NIKE, Inc. 'B' 649 86 Nordstrom, Inc. (a) 754 29 O'Reilly Automotive, Inc. (a) 30 15 PVH Corp. 218 23 Qurate Retail, Inc. 336 4 Ralph Lauren Corp. 147 18 Ross Stores, Inc. 152 18 Starbucks Corp. 809 88 Tapestry, Inc. (a) 122 5 Target Corp. 764 151 TJX Cos., Inc. 931 62 Tractor Supply Co. 24 4 VF Corp. 395 32 Whirlpool Corp. 57 13 Yum! Brands, Inc. 309 33 .............................................. 2,205 ______________________
CONSUMER STAPLES 8.6%
Archer-Daniels-Midland Co. 1,480 84 Brown-Forman Corp. 'B' 85 6 Bunge Ltd. 523 41 Campbell Soup Co. 72 4 Clorox Co. 73 14 Coca-Cola Co. 3,675 194 Colgate-Palmolive Co. 714 56 Conagra Brands, Inc. 124 5 Constellation Brands, Inc. 'A' 16 4 Estee Lauder Cos., Inc. 'A' 89 26 General Mills, Inc. 743 46 Hershey Co. 103 16 Hormel Foods Corp. 66 3 Ingredion, Inc. 136 12 JM Smucker Co. 149 19 Kellogg Co. 320 20 Keurig Dr Pepper, Inc. 139 5 Kimberly-Clark Corp. 265 37 Kraft Heinz Co. 1,103 44 Kroger Co. 1,759 63 Molson Coors Brewing Co. 'B' 524 27 Mondelez International, Inc. 'A' 1,740 102 PepsiCo, Inc. 1,416 200 Procter & Gamble Co. 2,336 316 Sysco Corp. 172 13 Walgreens Boots Alliance, Inc. 1,323 73 .............................................. 1,430 ______________________
FINANCIALS 23.0%
Aflac, Inc. 1,243 64 Allstate Corp. 693 80 American Express Co. 927 131 American International Group, Inc. 1,169 54 Ameriprise Financial, Inc. 262 61 Aon PLC 'A' 34 8 Bank of America Corp. 12,987 502 Bank of New York Mellon Corp. 2,341 111 Capital One Financial Corp. 1,185 151 Citigroup, Inc. 4,225 307 Comerica, Inc. 369 26 Fifth Third Bancorp 1,438 54 Goldman Sachs Group, Inc. 852 279 Hartford Financial Services Group, Inc. 795 53 Huntington Bancshares, Inc. 1,273 20 Intercontinental Exchange, Inc. 69 8 JPMorgan Chase & Co. 1,258 191 KeyCorp. 1,713 34 Lincoln National Corp. 634 39 Marsh & McLennan Cos., Inc. 196 24 MetLife, Inc. 961 58 Moody's Corp. 68 20 Morgan Stanley 1,804 140 Northern Trust Corp. 235 25 PNC Financial Services Group, Inc. 922 162 Principal Financial Group, Inc. 534 32 Prudential Financial, Inc. 1,216 111 Regions Financial Corp. 1,818 38 S&P Global, Inc. 94 33
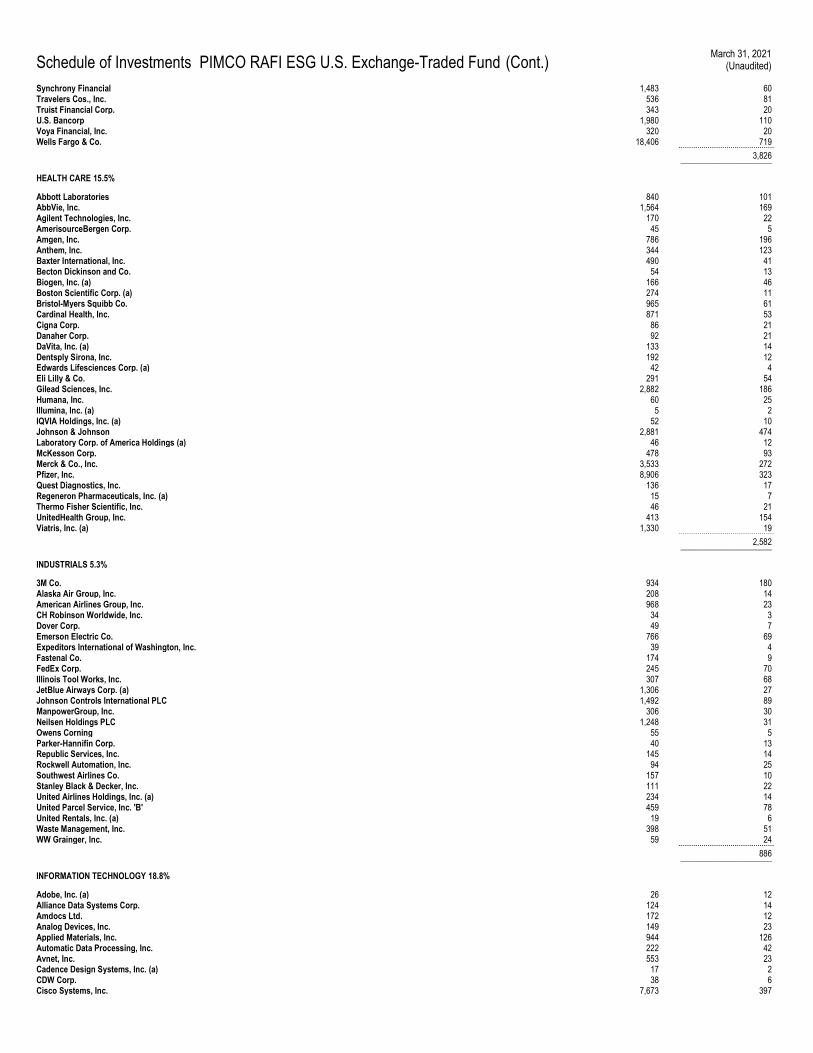
Schedule of Investments PIMCO RAFI ESG U.S. Exchange-Traded Fund (Cont.) March 31, 2021
(Unaudited)
Synchrony Financial 1,483 60 Travelers Cos., Inc. 536 81 Truist Financial Corp. 343 20 U.S. Bancorp 1,980 110 Voya Financial, Inc. 320 20 Wells Fargo & Co. 18,406 719 .............................................. 3,826 ______________________
HEALTH CARE 15.5%
Abbott Laboratories 840 101 AbbVie, Inc. 1,564 169 Agilent Technologies, Inc. 170 22 AmerisourceBergen Corp. 45 5 Amgen, Inc. 786 196 Anthem, Inc. 344 123 Baxter International, Inc. 490 41 Becton Dickinson and Co. 54 13 Biogen, Inc. (a) 166 46 Boston Scientific Corp. (a) 274 11 Bristol-Myers Squibb Co. 965 61 Cardinal Health, Inc. 871 53 Cigna Corp. 86 21 Danaher Corp. 92 21 DaVita, Inc. (a) 133 14 Dentsply Sirona, Inc. 192 12 Edwards Lifesciences Corp. (a) 42 4 Eli Lilly & Co. 291 54 Gilead Sciences, Inc. 2,882 186 Humana, Inc. 60 25 Illumina, Inc. (a) 5 2 IQVIA Holdings, Inc. (a) 52 10 Johnson & Johnson 2,881 474 Laboratory Corp. of America Holdings (a) 46 12 McKesson Corp. 478 93 Merck & Co., Inc. 3,533 272 Pfizer, Inc. 8,906 323 Quest Diagnostics, Inc. 136 17 Regeneron Pharmaceuticals, Inc. (a) 15 7 Thermo Fisher Scientific, Inc. 46 21 UnitedHealth Group, Inc. 413 154 Viatris, Inc. (a) 1,330 19 .............................................. 2,582 ______________________
INDUSTRIALS 5.3%
3M Co. 934 180 Alaska Air Group, Inc. 208 14 American Airlines Group, Inc. 968 23 CH Robinson Worldwide, Inc. 34 3 Dover Corp. 49 7 Emerson Electric Co. 766 69 Expeditors International of Washington, Inc. 39 4 Fastenal Co. 174 9 FedEx Corp. 245 70 Illinois Tool Works, Inc. 307 68 JetBlue Airways Corp. (a) 1,306 27 Johnson Controls International PLC 1,492 89 ManpowerGroup, Inc. 306 30 Neilsen Holdings PLC 1,248 31 Owens Corning 55 5 Parker-Hannifin Corp. 40 13 Republic Services, Inc. 145 14 Rockwell Automation, Inc. 94 25 Southwest Airlines Co. 157 10 Stanley Black & Decker, Inc. 111 22 United Airlines Holdings, Inc. (a) 234 14 United Parcel Service, Inc. 'B' 459 78 United Rentals, Inc. (a) 19 6 Waste Management, Inc. 398 51 WW Grainger, Inc. 59 24 .............................................. 886 ______________________
INFORMATION TECHNOLOGY 18.8%
Adobe, Inc. (a) 26 12 Alliance Data Systems Corp. 124 14 Amdocs Ltd. 172 12 Analog Devices, Inc. 149 23 Applied Materials, Inc. 944 126 Automatic Data Processing, Inc. 222 42 Avnet, Inc. 553 23 Cadence Design Systems, Inc. (a) 17 2 CDW Corp. 38 6 Cisco Systems, Inc. 7,673 397
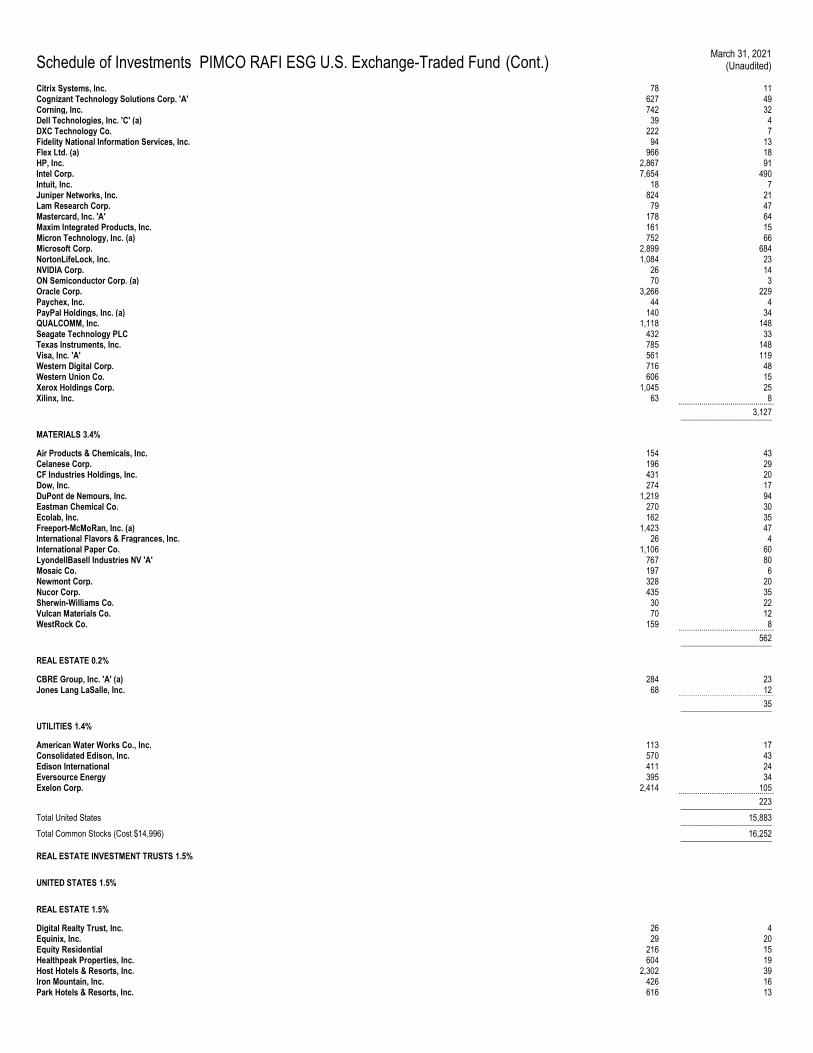
Schedule of Investments PIMCO RAFI ESG U.S. Exchange-Traded Fund (Cont.) March 31, 2021
(Unaudited)
Citrix Systems, Inc. 78 11 Cognizant Technology Solutions Corp. 'A' 627 49 Corning, Inc. 742 32 Dell Technologies, Inc. 'C' (a) 39 4 DXC Technology Co. 222 7 Fidelity National Information Services, Inc. 94 13 Flex Ltd. (a) 966 18 HP, Inc. 2,867 91 Intel Corp. 7,654 490 Intuit, Inc. 18 7 Juniper Networks, Inc. 824 21 Lam Research Corp. 79 47 Mastercard, Inc. 'A' 178 64 Maxim Integrated Products, Inc. 161 15 Micron Technology, Inc. (a) 752 66 Microsoft Corp. 2,899 684 NortonLifeLock, Inc. 1,084 23 NVIDIA Corp. 26 14 ON Semiconductor Corp. (a) 70 3 Oracle Corp. 3,266 229 Paychex, Inc. 44 4 PayPal Holdings, Inc. (a) 140 34 QUALCOMM, Inc. 1,118 148 Seagate Technology PLC 432 33 Texas Instruments, Inc. 785 148 Visa, Inc. 'A' 561 119 Western Digital Corp. 716 48 Western Union Co. 606 15 Xerox Holdings Corp. 1,045 25 Xilinx, Inc. 63 8 .............................................. 3,127 ______________________
MATERIALS 3.4%
Air Products & Chemicals, Inc. 154 43 Celanese Corp. 196 29 CF Industries Holdings, Inc. 431 20 Dow, Inc. 274 17 DuPont de Nemours, Inc. 1,219 94 Eastman Chemical Co. 270 30 Ecolab, Inc. 162 35 Freeport-McMoRan, Inc. (a) 1,423 47 International Flavors & Fragrances, Inc. 26 4 International Paper Co. 1,106 60 LyondellBasell Industries NV 'A' 767 80 Mosaic Co. 197 6 Newmont Corp. 328 20 Nucor Corp. 435 35 Sherwin-Williams Co. 30 22 Vulcan Materials Co. 70 12 WestRock Co. 159 8 .............................................. 562 ______________________
REAL ESTATE 0.2%
CBRE Group, Inc. 'A' (a) 284 23 Jones Lang LaSalle, Inc. 68 12 .............................................. 35 ______________________
UTILITIES 1.4%
American Water Works Co., Inc. 113 17 Consolidated Edison, Inc. 570 43 Edison International 411 24 Eversource Energy 395 34 Exelon Corp. 2,414 105 .............................................. 223 ______________________
Total United States 15,883 ______________________
Total Common Stocks (Cost $14,996) 16,252 ______________________
REAL ESTATE INVESTMENT TRUSTS 1.5%
UNITED STATES 1.5%
REAL ESTATE 1.5%
Digital Realty Trust, Inc. 26 4 Equinix, Inc. 29 20 Equity Residential 216 15 Healthpeak Properties, Inc. 604 19 Host Hotels & Resorts, Inc. 2,302 39 Iron Mountain, Inc. 426 16 Park Hotels & Resorts, Inc. 616 13
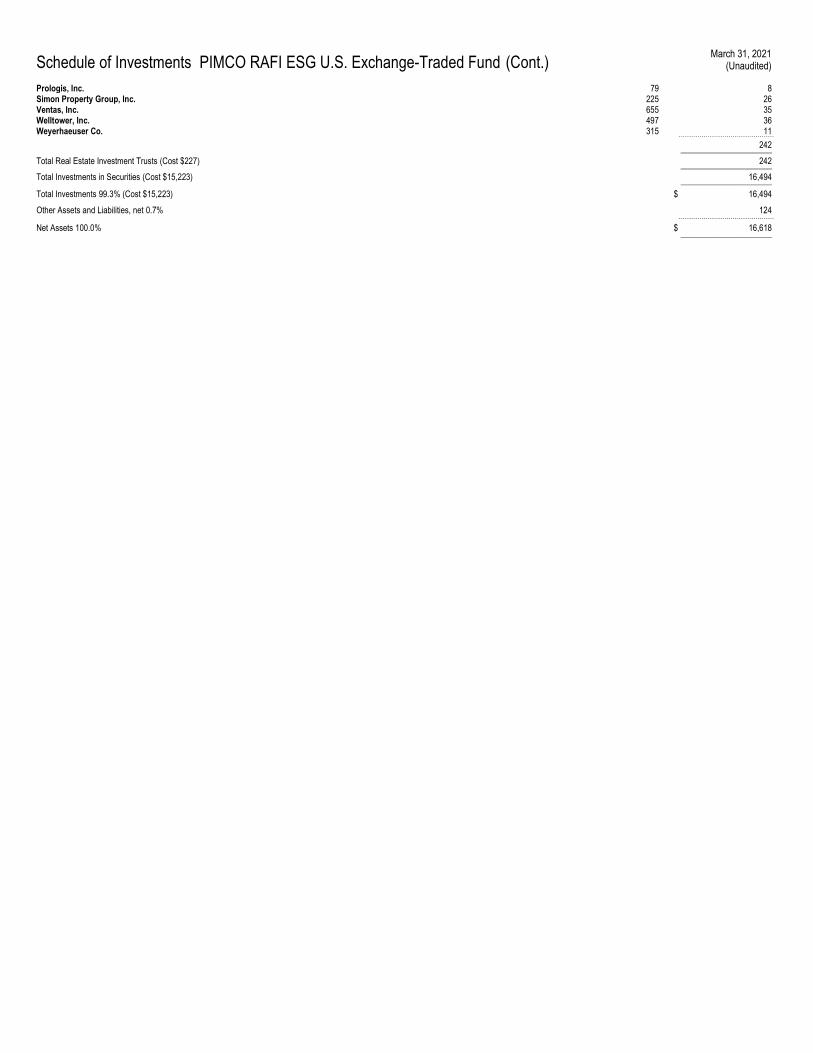
Schedule of Investments PIMCO RAFI ESG U.S. Exchange-Traded Fund (Cont.) March 31, 2021
(Unaudited)
Prologis, Inc. 79 8 Simon Property Group, Inc. 225 26 Ventas, Inc. 655 35 Welltower, Inc. 497 36 Weyerhaeuser Co. 315 11 .............................................. 242 ______________________
Total Real Estate Investment Trusts (Cost $227) 242 ______________________
Total Investments in Securities (Cost $15,223) 16,494 ______________________
Total Investments 99.3% (Cost $15,223) $ 16,494
Other Assets and Liabilities, net 0.7% 124 ..............................................
Net Assets 100.0% $ 16,618 ______________________
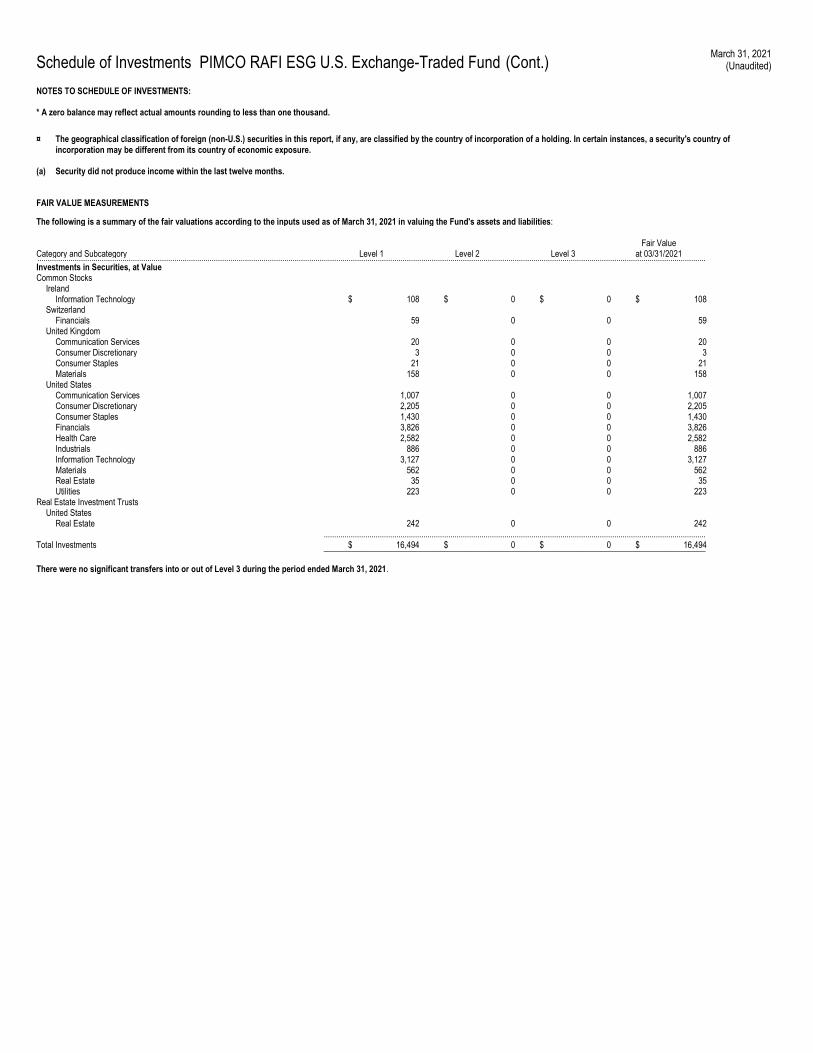
Schedule of Investments PIMCO RAFI ESG U.S. Exchange-Traded Fund (Cont.) March 31, 2021
(Unaudited)
NOTES TO SCHEDULE OF INVESTMENTS: * A zero balance may reflect actual amounts rounding to less than one thousand.
¤ The geographical classification of foreign (non-U.S.) securities in this report, if any, are classified by the country of incorporation of a holding. In certain instances, a security's country of incorporation may be different from its country of economic exposure.
(a) Security did not produce income within the last twelve months.
FAIR VALUE MEASUREMENTS
The following is a summary of the fair valuations according to the inputs used as of March 31, 2021 in valuing the Fund's assets and liabilities:
Category and Subcategory Level 1 Level 2 Level 3 Fair Value
at 03/31/2021 .................................................................................................................................................................................................................................................................................................................................. Investments in Securities, at Value Common Stocks Ireland Information Technology $ 108 $ 0 $ 0 $ 108 Switzerland Financials 59 0 0 59 United Kingdom Communication Services 20 0 0 20 Consumer Discretionary 3 0 0 3 Consumer Staples 21 0 0 21 Materials 158 0 0 158 United States Communication Services 1,007 0 0 1,007 Consumer Discretionary 2,205 0 0 2,205 Consumer Staples 1,430 0 0 1,430 Financials 3,826 0 0 3,826 Health Care 2,582 0 0 2,582 Industrials 886 0 0 886 Information Technology 3,127 0 0 3,127 Materials 562 0 0 562 Real Estate 35 0 0 35 Utilities 223 0 0 223 Real Estate Investment Trusts United States Real Estate 242 0 0 242 ........................................................................................................................................................................................ Total Investments $ 16,494 $ 0 $ 0 $ 16,494 ____________________________________________________________________________________________ There were no significant transfers into or out of Level 3 during the period ended March 31, 2021.

Schedule of Investments PIMCO REALPATH® Blend 2025 Fund March 31, 2021
(Unaudited)
(AMOUNTS IN THOUSANDS*, EXCEPT NUMBER OF SHARES, CONTRACTS, UNITS AND OUNCES, IF ANY)
SHARES
MARKET VALUE (000s)
INVESTMENTS IN SECURITIES 50.6% ¤
MUTUAL FUNDS 50.6%
Vanguard Developed Markets Index Fund 'Institutional' 2,137,651 $ 33,753 Vanguard Emerging Markets Stock Index Fund 'Institutional' 452,440 14,831 Vanguard Institutional Index Fund 'Institutional' 160,959 55,853 Vanguard Small-Cap Index Fund 'Admiral' 7 1 Vanguard Small-Cap Index Fund 'Institutional' 91,794 9,406 .............................................. Total Mutual Funds (Cost $94,337) 113,844 ______________________
Total Investments in Securities (Cost $94,337) 113,844 ______________________
INVESTMENTS IN AFFILIATES 49.6%
MUTUAL FUNDS (a) 45.2%
PIMCO Emerging Markets Local Currency and Bond Fund 1,462,477 9,404 PIMCO High Yield Fund 394,030 3,542 PIMCO Income Fund 2,135,240 25,559 PIMCO International Bond Fund (U.S. Dollar-Hedged) 207,650 2,263 PIMCO Long-Term Real Return Fund 2,135,486 15,546 PIMCO Long-Term U.S. Government Fund 3,289,863 17,206 PIMCO Real Return Fund 685,972 8,273 PIMCO Total Return Fund 1,949,786 19,927 .............................................. Total Mutual Funds (Cost $105,784) 101,720 ______________________
SHORT-TERM INSTRUMENTS 4.4%
CENTRAL FUNDS USED FOR CASH MANAGEMENT PURPOSES 4.4%
PIMCO Short-Term Floating NAV Portfolio III 995,729 9,818 .............................................. Total Short-Term Instruments (Cost $9,810) 9,818 ______________________
Total Investments in Affiliates (Cost $115,594) 111,538 ______________________
Total Investments 100.2% (Cost $209,931) $ 225,382
Financial Derivative Instruments (b)(c) 0.1%(Cost or Premiums, net $913) 356
Other Assets and Liabilities, net (0.3)% (719) ..............................................
Net Assets 100.0% $ 225,019 ______________________
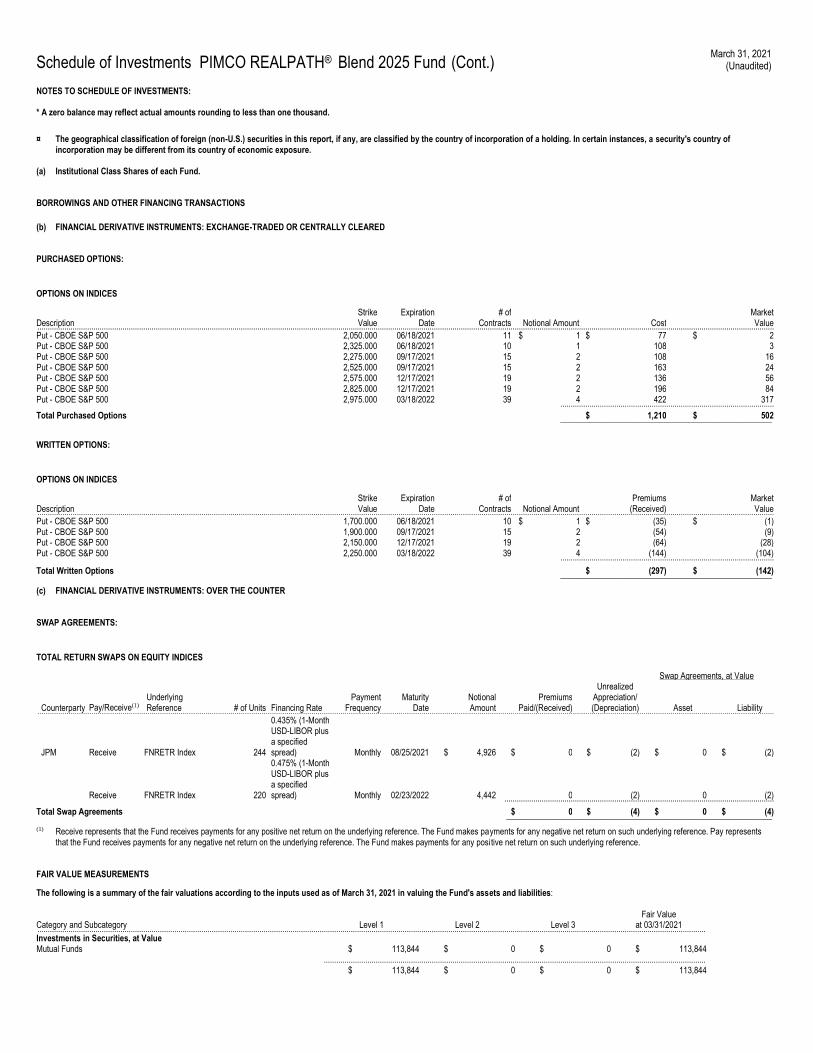
Schedule of Investments PIMCO REALPATH® Blend 2025 Fund (Cont.) March 31, 2021
(Unaudited)
NOTES TO SCHEDULE OF INVESTMENTS: * A zero balance may reflect actual amounts rounding to less than one thousand.
¤ The geographical classification of foreign (non-U.S.) securities in this report, if any, are classified by the country of incorporation of a holding. In certain instances, a security's country of incorporation may be different from its country of economic exposure.
(a) Institutional Class Shares of each Fund.
BORROWINGS AND OTHER FINANCING TRANSACTIONS
(b) FINANCIAL DERIVATIVE INSTRUMENTS: EXCHANGE-TRADED OR CENTRALLY CLEARED
PURCHASED OPTIONS:
OPTIONS ON INDICES
Description Strike Value
Expiration Date
# of Contracts Notional Amount Cost
Market Value ...................................................................................................................................................................................................................................................................................................................................................................
Put - CBOE S&P 500 2,050.000 06/18/2021 11 $ 1 $ 77 $ 2 Put - CBOE S&P 500 2,325.000 06/18/2021 10 1 108 3 Put - CBOE S&P 500 2,275.000 09/17/2021 15 2 108 16 Put - CBOE S&P 500 2,525.000 09/17/2021 15 2 163 24 Put - CBOE S&P 500 2,575.000 12/17/2021 19 2 136 56 Put - CBOE S&P 500 2,825.000 12/17/2021 19 2 196 84 Put - CBOE S&P 500 2,975.000 03/18/2022 39 4 422 317 ....................................................................................................... Total Purchased Options $ 1,210 $ 502 ___________________________________________________
WRITTEN OPTIONS:
OPTIONS ON INDICES
Description Strike Value
Expiration Date
# of Contracts Notional Amount
Premiums (Received)
Market Value ...................................................................................................................................................................................................................................................................................................................................................................
Put - CBOE S&P 500 1,700.000 06/18/2021 10 $ 1 $ (35) $ (1) Put - CBOE S&P 500 1,900.000 09/17/2021 15 2 (54) (9) Put - CBOE S&P 500 2,150.000 12/17/2021 19 2 (64) (28) Put - CBOE S&P 500 2,250.000 03/18/2022 39 4 (144) (104) .......................................................................................................
Total Written Options $ (297) $ (142) ___________________________________________________
(c) FINANCIAL DERIVATIVE INSTRUMENTS: OVER THE COUNTER
SWAP AGREEMENTS:
TOTAL RETURN SWAPS ON EQUITY INDICES
Swap Agreements, at Value
Counterparty Pay/Receive(1)
Underlying Reference # of Units Financing Rate
Payment Frequency
Maturity Date
Notional Amount
Premiums Paid/(Received)
Unrealized Appreciation/ (Depreciation) Asset Liability ...................................................................................................................................................................................................................................................................................................................................................................
JPM Receive FNRETR Index 244
0.435% (1-Month USD-LIBOR plus a specified spread) Monthly 08/25/2021 $ 4,926 $ 0 $ (2) $ 0 $ (2)
Receive FNRETR Index 220
0.475% (1-Month USD-LIBOR plus a specified spread) Monthly 02/23/2022 4,442 0 (2) 0 (2) ..................................................................................................................................
Total Swap Agreements $ 0 $ (4) $ 0 $ (4) ________________________________________________________________
(1) Receive represents that the Fund receives payments for any positive net return on the underlying reference. The Fund makes payments for any negative net return on such underlying reference. Pay represents that the Fund receives payments for any negative net return on the underlying reference. The Fund makes payments for any posi tive net return on such underlying reference.
FAIR VALUE MEASUREMENTS
The following is a summary of the fair valuations according to the inputs used as of March 31, 2021 in valuing the Fund's assets and liabilities:
Category and Subcategory Level 1 Level 2 Level 3 Fair Value
at 03/31/2021 .................................................................................................................................................................................................................................................................................................................................. Investments in Securities, at Value Mutual Funds $ 113,844 $ 0 $ 0 $ 113,844 ........................................................................................................................................................................................ $ 113,844 $ 0 $ 0 $ 113,844
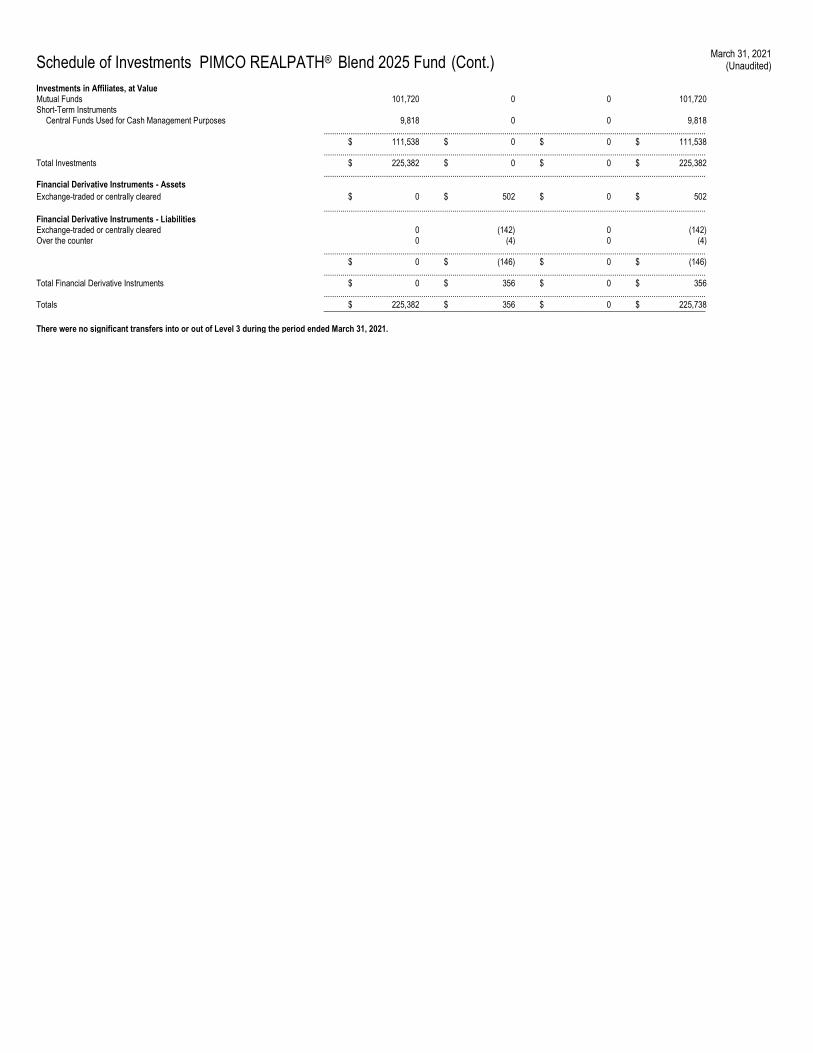
Schedule of Investments PIMCO REALPATH® Blend 2025 Fund (Cont.) March 31, 2021
(Unaudited)
Investments in Affiliates, at Value Mutual Funds 101,720 0 0 101,720 Short-Term Instruments Central Funds Used for Cash Management Purposes 9,818 0 0 9,818 ........................................................................................................................................................................................ $ 111,538 $ 0 $ 0 $ 111,538 ........................................................................................................................................................................................ Total Investments $ 225,382 $ 0 $ 0 $ 225,382 ........................................................................................................................................................................................ Financial Derivative Instruments - Assets
Exchange-traded or centrally cleared $ 0 $ 502 $ 0 $ 502
........................................................................................................................................................................................ Financial Derivative Instruments - Liabilities Exchange-traded or centrally cleared 0 (142) 0 (142) Over the counter 0 (4) 0 (4) ........................................................................................................................................................................................ $ 0 $ (146) $ 0 $ (146) ........................................................................................................................................................................................ Total Financial Derivative Instruments $ 0 $ 356 $ 0 $ 356 ........................................................................................................................................................................................ Totals $ 225,382 $ 356 $ 0 $ 225,738 ____________________________________________________________________________________________ There were no significant transfers into or out of Level 3 during the period ended March 31, 2021.
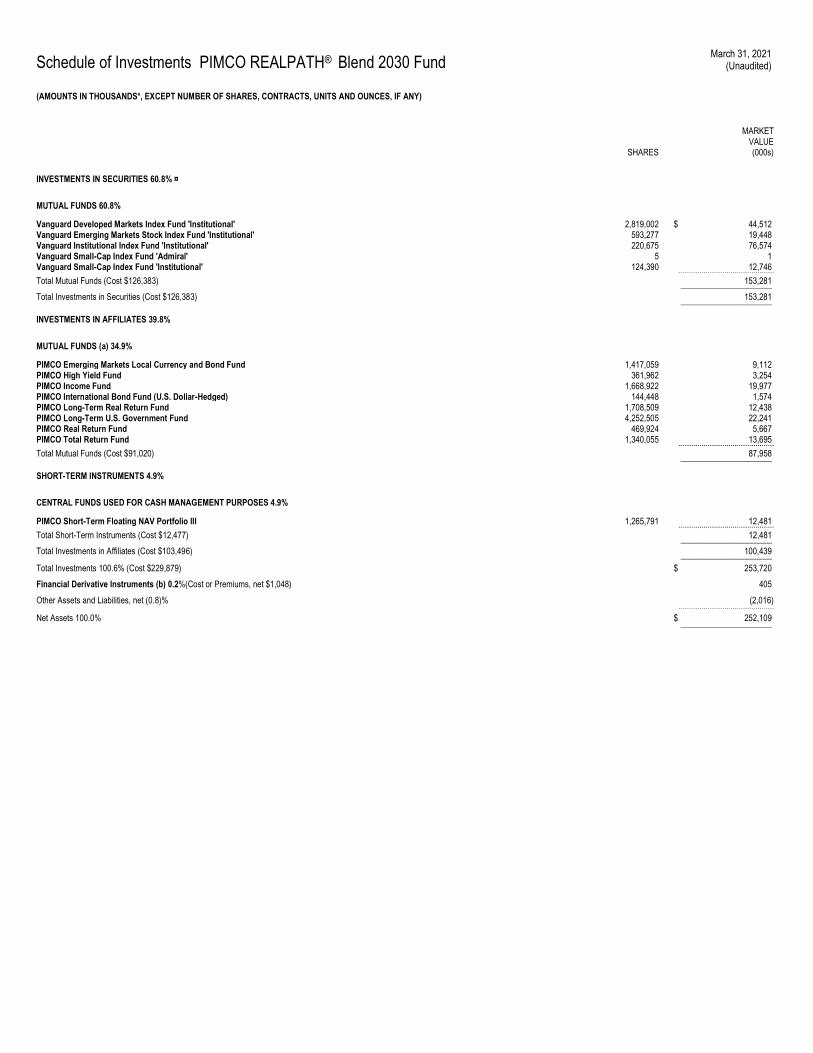
Schedule of Investments PIMCO REALPATH® Blend 2030 Fund March 31, 2021
(Unaudited)
(AMOUNTS IN THOUSANDS*, EXCEPT NUMBER OF SHARES, CONTRACTS, UNITS AND OUNCES, IF ANY)
SHARES
MARKET VALUE (000s)
INVESTMENTS IN SECURITIES 60.8% ¤
MUTUAL FUNDS 60.8%
Vanguard Developed Markets Index Fund 'Institutional' 2,819,002 $ 44,512 Vanguard Emerging Markets Stock Index Fund 'Institutional' 593,277 19,448 Vanguard Institutional Index Fund 'Institutional' 220,675 76,574 Vanguard Small-Cap Index Fund 'Admiral' 5 1 Vanguard Small-Cap Index Fund 'Institutional' 124,390 12,746 .............................................. Total Mutual Funds (Cost $126,383) 153,281 ______________________
Total Investments in Securities (Cost $126,383) 153,281 ______________________
INVESTMENTS IN AFFILIATES 39.8%
MUTUAL FUNDS (a) 34.9%
PIMCO Emerging Markets Local Currency and Bond Fund 1,417,059 9,112 PIMCO High Yield Fund 361,962 3,254 PIMCO Income Fund 1,668,922 19,977 PIMCO International Bond Fund (U.S. Dollar-Hedged) 144,448 1,574 PIMCO Long-Term Real Return Fund 1,708,509 12,438 PIMCO Long-Term U.S. Government Fund 4,252,505 22,241 PIMCO Real Return Fund 469,924 5,667 PIMCO Total Return Fund 1,340,055 13,695 .............................................. Total Mutual Funds (Cost $91,020) 87,958 ______________________
SHORT-TERM INSTRUMENTS 4.9%
CENTRAL FUNDS USED FOR CASH MANAGEMENT PURPOSES 4.9%
PIMCO Short-Term Floating NAV Portfolio III 1,265,791 12,481 .............................................. Total Short-Term Instruments (Cost $12,477) 12,481 ______________________
Total Investments in Affiliates (Cost $103,496) 100,439 ______________________
Total Investments 100.6% (Cost $229,879) $ 253,720
Financial Derivative Instruments (b) 0.2%(Cost or Premiums, net $1,048) 405
Other Assets and Liabilities, net (0.8)% (2,016) ..............................................
Net Assets 100.0% $ 252,109 ______________________
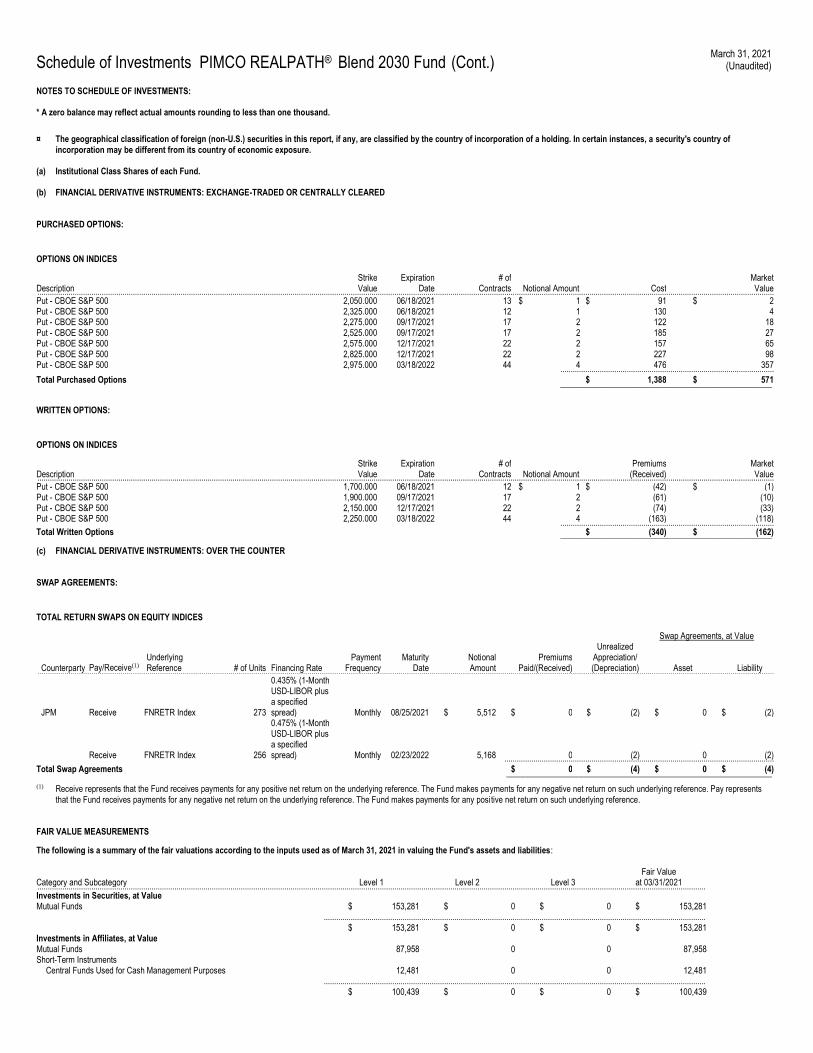
Schedule of Investments PIMCO REALPATH® Blend 2030 Fund (Cont.) March 31, 2021
(Unaudited)
NOTES TO SCHEDULE OF INVESTMENTS: * A zero balance may reflect actual amounts rounding to less than one thousand.
¤ The geographical classification of foreign (non-U.S.) securities in this report, if any, are classified by the country of incorporation of a holding. In certain instances, a security's country of incorporation may be different from its country of economic exposure.
(a) Institutional Class Shares of each Fund.
(b) FINANCIAL DERIVATIVE INSTRUMENTS: EXCHANGE-TRADED OR CENTRALLY CLEARED
PURCHASED OPTIONS:
OPTIONS ON INDICES
Description Strike Value
Expiration Date
# of Contracts Notional Amount Cost
Market Value ...................................................................................................................................................................................................................................................................................................................................................................
Put - CBOE S&P 500 2,050.000 06/18/2021 13 $ 1 $ 91 $ 2 Put - CBOE S&P 500 2,325.000 06/18/2021 12 1 130 4 Put - CBOE S&P 500 2,275.000 09/17/2021 17 2 122 18 Put - CBOE S&P 500 2,525.000 09/17/2021 17 2 185 27 Put - CBOE S&P 500 2,575.000 12/17/2021 22 2 157 65 Put - CBOE S&P 500 2,825.000 12/17/2021 22 2 227 98 Put - CBOE S&P 500 2,975.000 03/18/2022 44 4 476 357 ....................................................................................................... Total Purchased Options $ 1,388 $ 571 ___________________________________________________
WRITTEN OPTIONS:
OPTIONS ON INDICES
Description Strike Value
Expiration Date
# of Contracts Notional Amount
Premiums (Received)
Market Value ...................................................................................................................................................................................................................................................................................................................................................................
Put - CBOE S&P 500 1,700.000 06/18/2021 12 $ 1 $ (42) $ (1) Put - CBOE S&P 500 1,900.000 09/17/2021 17 2 (61) (10) Put - CBOE S&P 500 2,150.000 12/17/2021 22 2 (74) (33) Put - CBOE S&P 500 2,250.000 03/18/2022 44 4 (163) (118) ....................................................................................................... Total Written Options $ (340) $ (162) ___________________________________________________
(c) FINANCIAL DERIVATIVE INSTRUMENTS: OVER THE COUNTER
SWAP AGREEMENTS:
TOTAL RETURN SWAPS ON EQUITY INDICES
Swap Agreements, at Value
Counterparty Pay/Receive(1)
Underlying Reference # of Units Financing Rate
Payment Frequency
Maturity Date
Notional Amount
Premiums Paid/(Received)
Unrealized Appreciation/ (Depreciation) Asset Liability ...................................................................................................................................................................................................................................................................................................................................................................
JPM Receive FNRETR Index 273
0.435% (1-Month USD-LIBOR plus a specified spread) Monthly 08/25/2021 $ 5,512 $ 0 $ (2) $ 0 $ (2)
Receive FNRETR Index 256
0.475% (1-Month USD-LIBOR plus a specified spread) Monthly 02/23/2022 5,168 0 (2) 0 (2) ..................................................................................................................................
Total Swap Agreements $ 0 $ (4) $ 0 $ (4) ________________________________________________________________
(1) Receive represents that the Fund receives payments for any positive net return on the underlying reference. The Fund makes payments for any negative net return on such underlying reference. Pay represents that the Fund receives payments for any negative net return on the underlying reference. The Fund makes payments for any posi tive net return on such underlying reference.
FAIR VALUE MEASUREMENTS
The following is a summary of the fair valuations according to the inputs used as of March 31, 2021 in valuing the Fund's assets and liabilities:
Category and Subcategory Level 1 Level 2 Level 3 Fair Value
at 03/31/2021 .................................................................................................................................................................................................................................................................................................................................. Investments in Securities, at Value Mutual Funds $ 153,281 $ 0 $ 0 $ 153,281 ........................................................................................................................................................................................ $ 153,281 $ 0 $ 0 $ 153,281 Investments in Affiliates, at Value Mutual Funds 87,958 0 0 87,958 Short-Term Instruments Central Funds Used for Cash Management Purposes 12,481 0 0 12,481 ........................................................................................................................................................................................ $ 100,439 $ 0 $ 0 $ 100,439
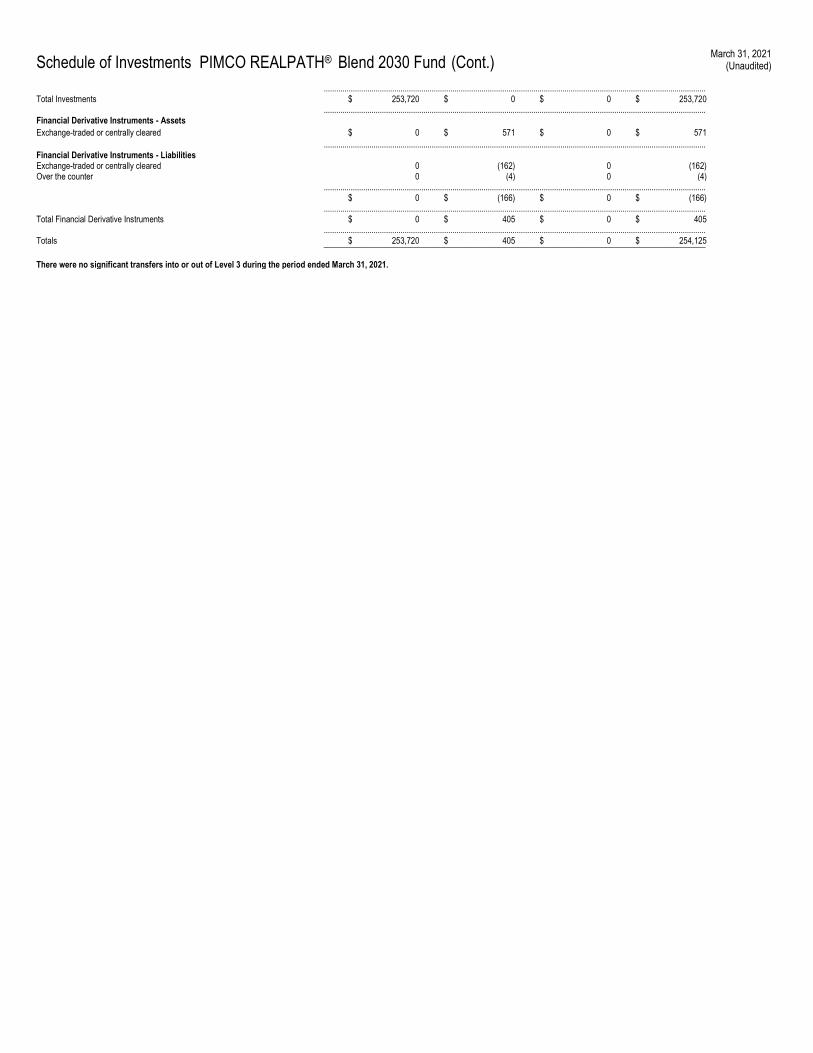
Schedule of Investments PIMCO REALPATH® Blend 2030 Fund (Cont.) March 31, 2021
(Unaudited)
........................................................................................................................................................................................ Total Investments $ 253,720 $ 0 $ 0 $ 253,720 ........................................................................................................................................................................................ Financial Derivative Instruments - Assets
Exchange-traded or centrally cleared $ 0 $ 571 $ 0 $ 571
........................................................................................................................................................................................ Financial Derivative Instruments - Liabilities Exchange-traded or centrally cleared 0 (162) 0 (162) Over the counter 0 (4) 0 (4) ........................................................................................................................................................................................ $ 0 $ (166) $ 0 $ (166) ........................................................................................................................................................................................ Total Financial Derivative Instruments $ 0 $ 405 $ 0 $ 405 ........................................................................................................................................................................................ Totals $ 253,720 $ 405 $ 0 $ 254,125 ____________________________________________________________________________________________ There were no significant transfers into or out of Level 3 during the period ended March 31, 2021.
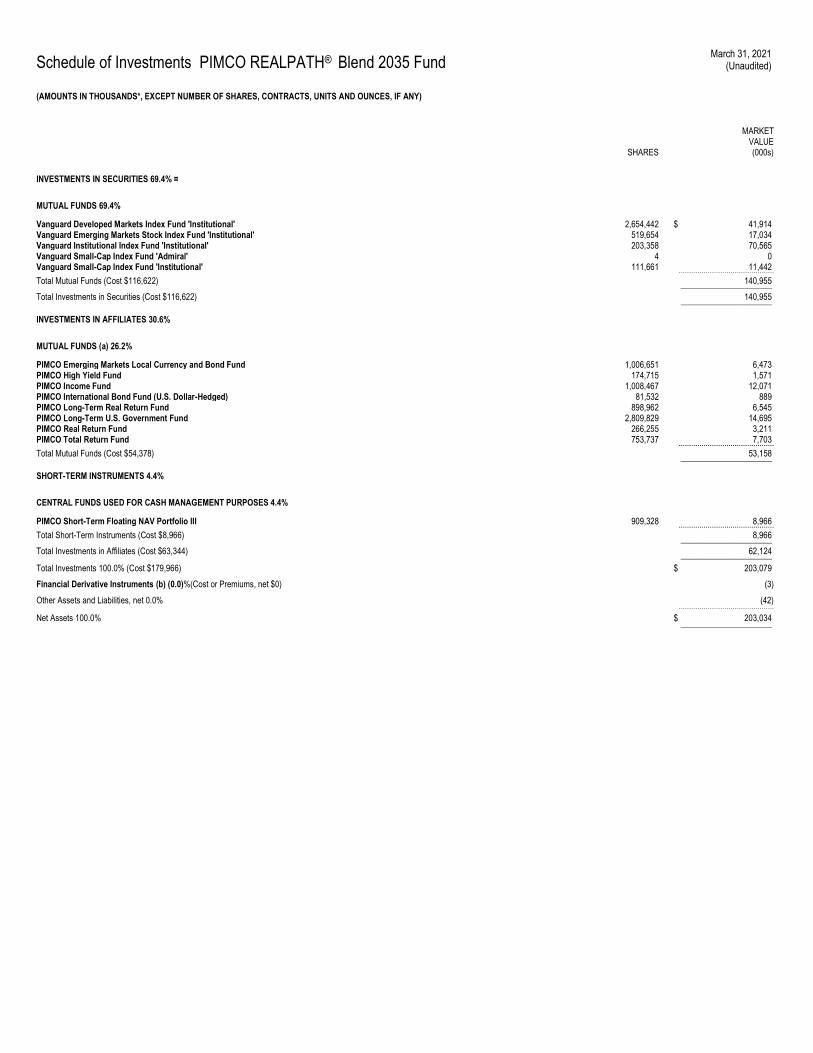
Schedule of Investments PIMCO REALPATH® Blend 2035 Fund March 31, 2021
(Unaudited)
(AMOUNTS IN THOUSANDS*, EXCEPT NUMBER OF SHARES, CONTRACTS, UNITS AND OUNCES, IF ANY)
SHARES
MARKET VALUE (000s)
INVESTMENTS IN SECURITIES 69.4% ¤
MUTUAL FUNDS 69.4%
Vanguard Developed Markets Index Fund 'Institutional' 2,654,442 $ 41,914 Vanguard Emerging Markets Stock Index Fund 'Institutional' 519,654 17,034 Vanguard Institutional Index Fund 'Institutional' 203,358 70,565 Vanguard Small-Cap Index Fund 'Admiral' 4 0 Vanguard Small-Cap Index Fund 'Institutional' 111,661 11,442 .............................................. Total Mutual Funds (Cost $116,622) 140,955 ______________________
Total Investments in Securities (Cost $116,622) 140,955 ______________________
INVESTMENTS IN AFFILIATES 30.6%
MUTUAL FUNDS (a) 26.2%
PIMCO Emerging Markets Local Currency and Bond Fund 1,006,651 6,473 PIMCO High Yield Fund 174,715 1,571 PIMCO Income Fund 1,008,467 12,071 PIMCO International Bond Fund (U.S. Dollar-Hedged) 81,532 889 PIMCO Long-Term Real Return Fund 898,962 6,545 PIMCO Long-Term U.S. Government Fund 2,809,829 14,695 PIMCO Real Return Fund 266,255 3,211 PIMCO Total Return Fund 753,737 7,703 .............................................. Total Mutual Funds (Cost $54,378) 53,158 ______________________
SHORT-TERM INSTRUMENTS 4.4%
CENTRAL FUNDS USED FOR CASH MANAGEMENT PURPOSES 4.4%
PIMCO Short-Term Floating NAV Portfolio III 909,328 8,966 .............................................. Total Short-Term Instruments (Cost $8,966) 8,966 ______________________
Total Investments in Affiliates (Cost $63,344) 62,124 ______________________
Total Investments 100.0% (Cost $179,966) $ 203,079
Financial Derivative Instruments (b) (0.0)%(Cost or Premiums, net $0) (3)
Other Assets and Liabilities, net 0.0% (42) ..............................................
Net Assets 100.0% $ 203,034 ______________________
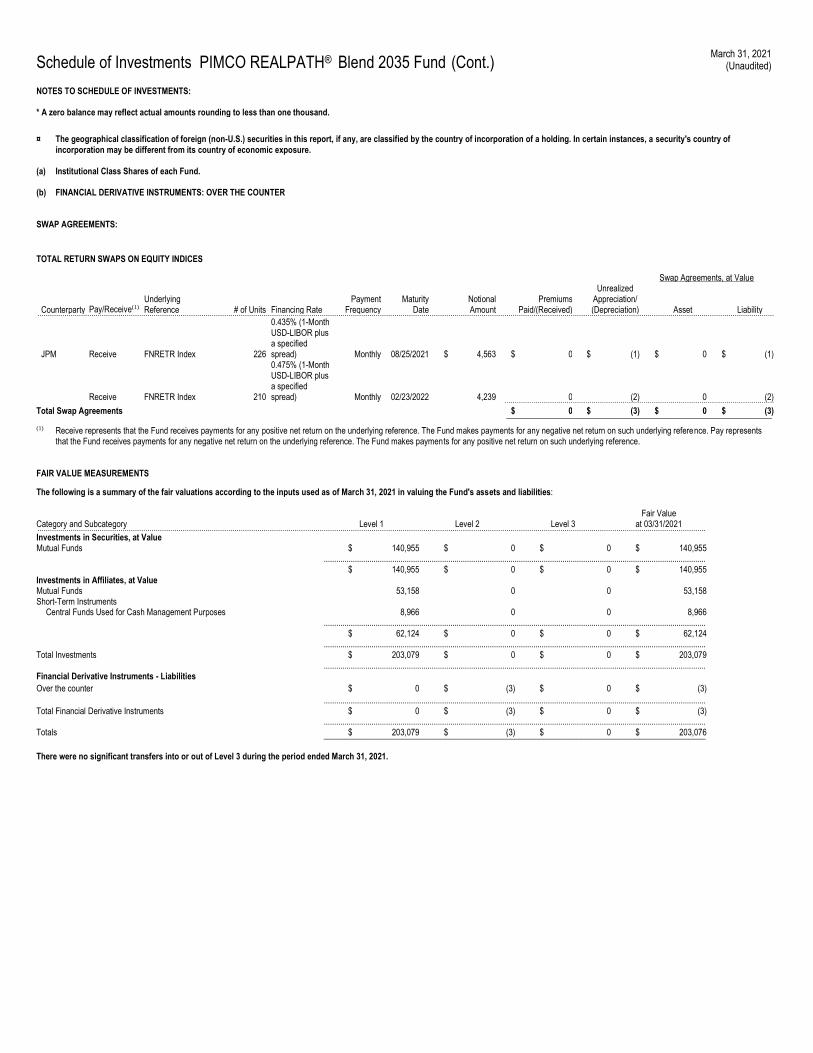
Schedule of Investments PIMCO REALPATH® Blend 2035 Fund (Cont.) March 31, 2021
(Unaudited)
NOTES TO SCHEDULE OF INVESTMENTS: * A zero balance may reflect actual amounts rounding to less than one thousand.
¤ The geographical classification of foreign (non-U.S.) securities in this report, if any, are classified by the country of incorporation of a holding. In certain instances, a security's country of incorporation may be different from its country of economic exposure.
(a) Institutional Class Shares of each Fund.
(b) FINANCIAL DERIVATIVE INSTRUMENTS: OVER THE COUNTER
SWAP AGREEMENTS:
TOTAL RETURN SWAPS ON EQUITY INDICES
Swap Agreements, at Value
Counterparty Pay/Receive(1) Underlying Reference # of Units Financing Rate
Payment Frequency
Maturity Date
Notional Amount
Premiums Paid/(Received)
Unrealized Appreciation/ (Depreciation) Asset Liability ...................................................................................................................................................................................................................................................................................................................................................................
JPM Receive FNRETR Index 226
0.435% (1-Month USD-LIBOR plus a specified spread) Monthly 08/25/2021 $ 4,563 $ 0 $ (1) $ 0 $ (1)
Receive FNRETR Index 210
0.475% (1-Month USD-LIBOR plus a specified spread) Monthly 02/23/2022 4,239 0 (2) 0 (2) ..................................................................................................................................
Total Swap Agreements $ 0 $ (3) $ 0 $ (3) ________________________________________________________________
(1) Receive represents that the Fund receives payments for any positive net return on the underlying reference. The Fund makes payments for any negative net return on such underlying reference. Pay represents that the Fund receives payments for any negative net return on the underlying reference. The Fund makes payments for any positive net return on such underlying reference.
FAIR VALUE MEASUREMENTS
The following is a summary of the fair valuations according to the inputs used as of March 31, 2021 in valuing the Fund's assets and liabilities:
Category and Subcategory Level 1 Level 2 Level 3 Fair Value
at 03/31/2021 .................................................................................................................................................................................................................................................................................................................................. Investments in Securities, at Value Mutual Funds $ 140,955 $ 0 $ 0 $ 140,955 ........................................................................................................................................................................................ $ 140,955 $ 0 $ 0 $ 140,955 Investments in Affiliates, at Value Mutual Funds 53,158 0 0 53,158 Short-Term Instruments Central Funds Used for Cash Management Purposes 8,966 0 0 8,966 ........................................................................................................................................................................................ $ 62,124 $ 0 $ 0 $ 62,124 ........................................................................................................................................................................................ Total Investments $ 203,079 $ 0 $ 0 $ 203,079 ........................................................................................................................................................................................ Financial Derivative Instruments - Liabilities
Over the counter $ 0 $ (3) $ 0 $ (3)
........................................................................................................................................................................................ Total Financial Derivative Instruments $ 0 $ (3) $ 0 $ (3) ........................................................................................................................................................................................ Totals $ 203,079 $ (3) $ 0 $ 203,076 ____________________________________________________________________________________________ There were no significant transfers into or out of Level 3 during the period ended March 31, 2021.

Schedule of Investments PIMCO REALPATH® Blend 2040 Fund March 31, 2021
(Unaudited)
(AMOUNTS IN THOUSANDS*, EXCEPT NUMBER OF SHARES, CONTRACTS, UNITS AND OUNCES, IF ANY)
SHARES
MARKET VALUE (000s)
INVESTMENTS IN SECURITIES 77.0% ¤
MUTUAL FUNDS 77.0%
Vanguard Developed Markets Index Fund 'Institutional' 3,389,953 $ 53,528 Vanguard Emerging Markets Stock Index Fund 'Institutional' 548,448 17,978 Vanguard Institutional Index Fund 'Institutional' 236,671 82,125 Vanguard Small-Cap Index Fund 'Admiral' 2 0 Vanguard Small-Cap Index Fund 'Institutional' 130,661 13,389 .............................................. Total Mutual Funds (Cost $137,774) 167,020 ______________________
Total Investments in Securities (Cost $137,774) 167,020 ______________________
INVESTMENTS IN AFFILIATES 23.2%
MUTUAL FUNDS (a) 18.4%
PIMCO Emerging Markets Local Currency and Bond Fund 739,245 4,753 PIMCO Income Fund 741,866 8,880 PIMCO International Bond Fund (U.S. Dollar-Hedged) 64,995 708 PIMCO Long-Term Real Return Fund 702,261 5,113 PIMCO Long-Term U.S. Government Fund 2,271,283 11,879 PIMCO Real Return Fund 212,240 2,560 PIMCO Total Return Fund 592,076 6,051 .............................................. Total Mutual Funds (Cost $40,500) 39,944 ______________________
SHORT-TERM INSTRUMENTS 4.8%
CENTRAL FUNDS USED FOR CASH MANAGEMENT PURPOSES 4.8%
PIMCO Short-Term Floating NAV Portfolio III 1,044,457 10,298 .............................................. Total Short-Term Instruments (Cost $10,299) 10,298 ______________________
Total Investments in Affiliates (Cost $50,799) 50,242 ______________________
Total Investments 100.2% (Cost $188,573) $ 217,262
Financial Derivative Instruments (b) (0.0)%(Cost or Premiums, net $0) (4)
Other Assets and Liabilities, net (0.2)% (479) ..............................................
Net Assets 100.0% $ 216,779 ______________________

Schedule of Investments PIMCO REALPATH® Blend 2040 Fund (Cont.) March 31, 2021
(Unaudited)
NOTES TO SCHEDULE OF INVESTMENTS: * A zero balance may reflect actual amounts rounding to less than one thousand.
¤ The geographical classification of foreign (non-U.S.) securities in this report, if any, are classified by the country of incorporation of a holding. In certain instances, a security's country of incorporation may be different from its country of economic exposure.
(a) Institutional Class Shares of each Fund.
(b) FINANCIAL DERIVATIVE INSTRUMENTS: OVER THE COUNTER
SWAP AGREEMENTS:
TOTAL RETURN SWAPS ON EQUITY INDICES
Swap Agreements, at Value
Counterparty Pay/Receive(1) Underlying Reference # of Units Financing Rate
Payment Frequency
Maturity Date
Notional Amount
Premiums Paid/(Received)
Unrealized Appreciation/ (Depreciation) Asset Liability ...................................................................................................................................................................................................................................................................................................................................................................
JPM Receive FNRETR Index 247
0.435% (1-Month USD-LIBOR plus a specified spread) Monthly 08/25/2021 $ 4,987 $ 0 $ (2) $ 0 $ (2)
Receive FNRETR Index 230
0.475% (1-Month USD-LIBOR plus a specified spread) Monthly 02/23/2022 4,643 0 (2) 0 (2) ..................................................................................................................................
Total Swap Agreements $ 0 $ (4) $ 0 $ (4) ________________________________________________________________
(1) Receive represents that the Fund receives payments for any positive net return on the underlying reference. The Fund makes payments for any negative net return on such underlying reference. Pay represents that the Fund receives payments for any negative net return on the underlying reference. The Fund makes payments for any posi tive net return on such underlying reference.
FAIR VALUE MEASUREMENTS
The following is a summary of the fair valuations according to the inputs used as of March 31, 2021 in valuing the Fund's assets and liabilities:
Category and Subcategory Level 1 Level 2 Level 3 Fair Value
at 03/31/2021 .................................................................................................................................................................................................................................................................................................................................. Investments in Securities, at Value Mutual Funds $ 167,020 $ 0 $ 0 $ 167,020 ........................................................................................................................................................................................ $ 167,020 $ 0 $ 0 $ 167,020 Investments in Affiliates, at Value Mutual Funds 39,944 0 0 39,944 Short-Term Instruments Central Funds Used for Cash Management Purposes 10,298 0 0 10,298 ........................................................................................................................................................................................ $ 50,242 $ 0 $ 0 $ 50,242 ........................................................................................................................................................................................ Total Investments $ 217,262 $ 0 $ 0 $ 217,262 ........................................................................................................................................................................................ Financial Derivative Instruments - Liabilities
Over the counter $ 0 $ (4) $ 0 $ (4)
........................................................................................................................................................................................ Total Financial Derivative Instruments $ 0 $ (4) $ 0 $ (4) ........................................................................................................................................................................................ Totals $ 217,262 $ (4) $ 0 $ 217,258 ____________________________________________________________________________________________ There were no significant transfers into or out of Level 3 during the period ended March 31, 2021.
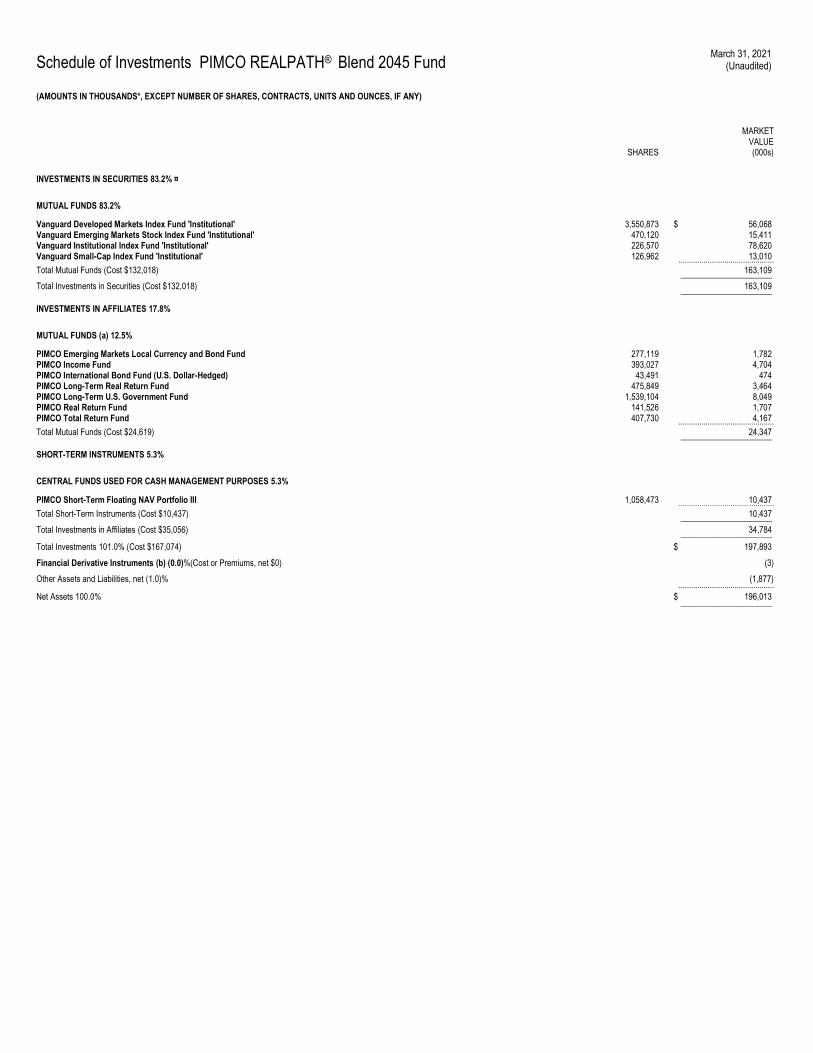
Schedule of Investments PIMCO REALPATH® Blend 2045 Fund March 31, 2021
(Unaudited)
(AMOUNTS IN THOUSANDS*, EXCEPT NUMBER OF SHARES, CONTRACTS, UNITS AND OUNCES, IF ANY)
SHARES
MARKET VALUE (000s)
INVESTMENTS IN SECURITIES 83.2% ¤
MUTUAL FUNDS 83.2%
Vanguard Developed Markets Index Fund 'Institutional' 3,550,873 $ 56,068 Vanguard Emerging Markets Stock Index Fund 'Institutional' 470,120 15,411 Vanguard Institutional Index Fund 'Institutional' 226,570 78,620 Vanguard Small-Cap Index Fund 'Institutional' 126,962 13,010 .............................................. Total Mutual Funds (Cost $132,018) 163,109 ______________________
Total Investments in Securities (Cost $132,018) 163,109 ______________________
INVESTMENTS IN AFFILIATES 17.8%
MUTUAL FUNDS (a) 12.5%
PIMCO Emerging Markets Local Currency and Bond Fund 277,119 1,782 PIMCO Income Fund 393,027 4,704 PIMCO International Bond Fund (U.S. Dollar-Hedged) 43,491 474 PIMCO Long-Term Real Return Fund 475,849 3,464 PIMCO Long-Term U.S. Government Fund 1,539,104 8,049 PIMCO Real Return Fund 141,526 1,707 PIMCO Total Return Fund 407,730 4,167 .............................................. Total Mutual Funds (Cost $24,619) 24,347 ______________________
SHORT-TERM INSTRUMENTS 5.3%
CENTRAL FUNDS USED FOR CASH MANAGEMENT PURPOSES 5.3%
PIMCO Short-Term Floating NAV Portfolio III 1,058,473 10,437 .............................................. Total Short-Term Instruments (Cost $10,437) 10,437 ______________________
Total Investments in Affiliates (Cost $35,056) 34,784 ______________________
Total Investments 101.0% (Cost $167,074) $ 197,893
Financial Derivative Instruments (b) (0.0)%(Cost or Premiums, net $0) (3)
Other Assets and Liabilities, net (1.0)% (1,877) ..............................................
Net Assets 100.0% $ 196,013 ______________________
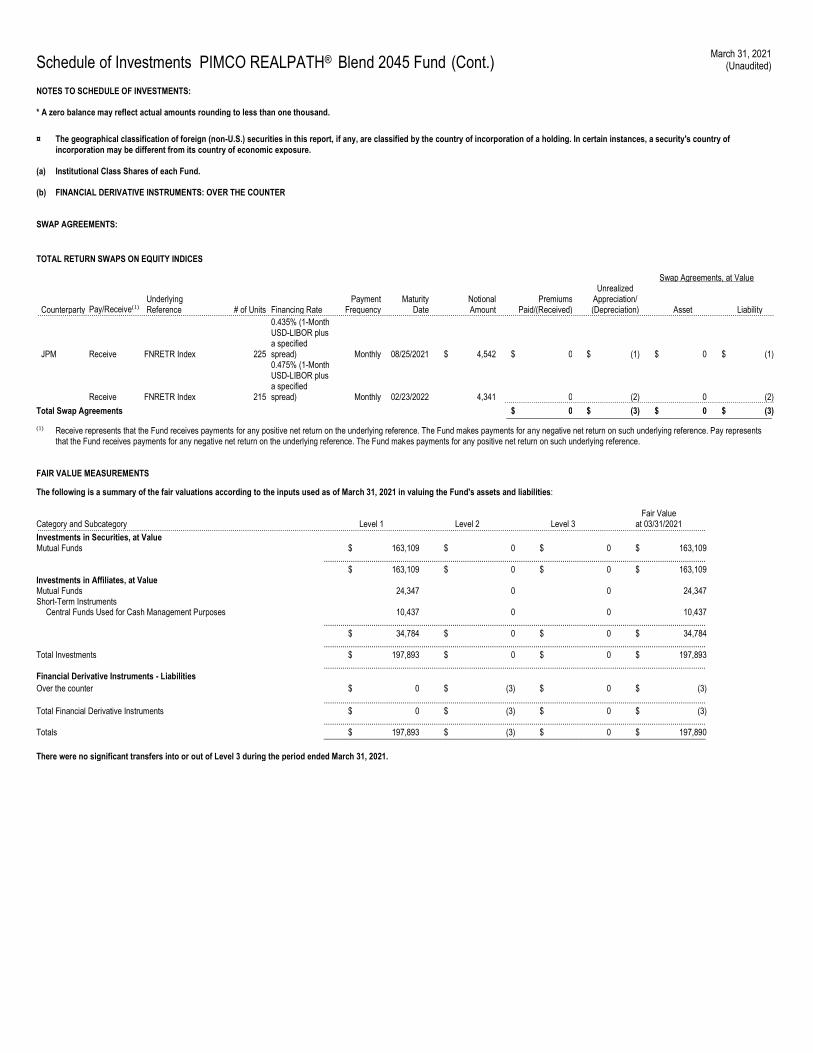
Schedule of Investments PIMCO REALPATH® Blend 2045 Fund (Cont.) March 31, 2021
(Unaudited)
NOTES TO SCHEDULE OF INVESTMENTS: * A zero balance may reflect actual amounts rounding to less than one thousand.
¤ The geographical classification of foreign (non-U.S.) securities in this report, if any, are classified by the country of incorporation of a holding. In certain instances, a security's country of incorporation may be different from its country of economic exposure.
(a) Institutional Class Shares of each Fund.
(b) FINANCIAL DERIVATIVE INSTRUMENTS: OVER THE COUNTER
SWAP AGREEMENTS:
TOTAL RETURN SWAPS ON EQUITY INDICES
Swap Agreements, at Value
Counterparty Pay/Receive(1) Underlying Reference # of Units Financing Rate
Payment Frequency
Maturity Date
Notional Amount
Premiums Paid/(Received)
Unrealized Appreciation/ (Depreciation) Asset Liability ...................................................................................................................................................................................................................................................................................................................................................................
JPM Receive FNRETR Index 225
0.435% (1-Month USD-LIBOR plus a specified spread) Monthly 08/25/2021 $ 4,542 $ 0 $ (1) $ 0 $ (1)
Receive FNRETR Index 215
0.475% (1-Month USD-LIBOR plus a specified spread) Monthly 02/23/2022 4,341 0 (2) 0 (2) ..................................................................................................................................
Total Swap Agreements $ 0 $ (3) $ 0 $ (3) ________________________________________________________________
(1) Receive represents that the Fund receives payments for any positive net return on the underlying reference. The Fund makes payments for any negative net return on such underlying reference. Pay represents that the Fund receives payments for any negative net return on the underlying reference. The Fund makes payments for any positive net return on such underlying reference.
FAIR VALUE MEASUREMENTS
The following is a summary of the fair valuations according to the inputs used as of March 31, 2021 in valuing the Fund's assets and liabilities:
Category and Subcategory Level 1 Level 2 Level 3 Fair Value
at 03/31/2021 .................................................................................................................................................................................................................................................................................................................................. Investments in Securities, at Value Mutual Funds $ 163,109 $ 0 $ 0 $ 163,109 ........................................................................................................................................................................................ $ 163,109 $ 0 $ 0 $ 163,109 Investments in Affiliates, at Value Mutual Funds 24,347 0 0 24,347 Short-Term Instruments Central Funds Used for Cash Management Purposes 10,437 0 0 10,437 ........................................................................................................................................................................................ $ 34,784 $ 0 $ 0 $ 34,784 ........................................................................................................................................................................................ Total Investments $ 197,893 $ 0 $ 0 $ 197,893 ........................................................................................................................................................................................ Financial Derivative Instruments - Liabilities
Over the counter $ 0 $ (3) $ 0 $ (3)
........................................................................................................................................................................................ Total Financial Derivative Instruments $ 0 $ (3) $ 0 $ (3) ........................................................................................................................................................................................ Totals $ 197,893 $ (3) $ 0 $ 197,890 ____________________________________________________________________________________________ There were no significant transfers into or out of Level 3 during the period ended March 31, 2021.
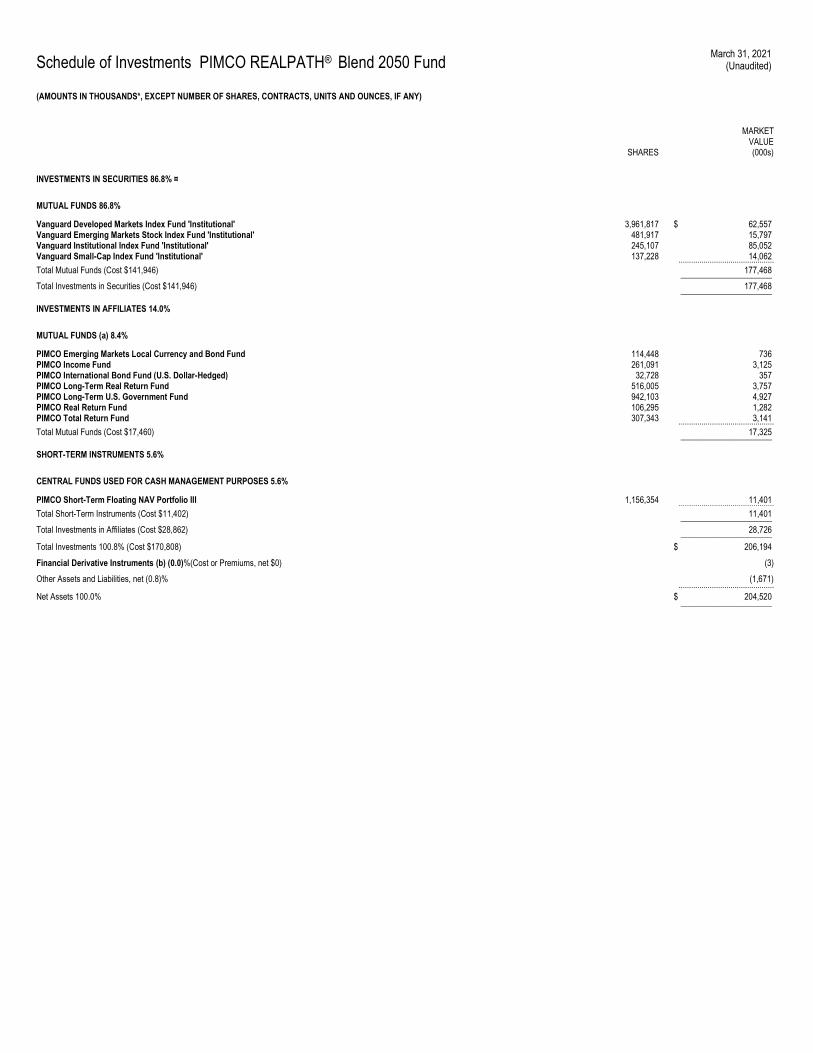
Schedule of Investments PIMCO REALPATH® Blend 2050 Fund March 31, 2021
(Unaudited)
(AMOUNTS IN THOUSANDS*, EXCEPT NUMBER OF SHARES, CONTRACTS, UNITS AND OUNCES, IF ANY)
SHARES
MARKET VALUE (000s)
INVESTMENTS IN SECURITIES 86.8% ¤
MUTUAL FUNDS 86.8%
Vanguard Developed Markets Index Fund 'Institutional' 3,961,817 $ 62,557 Vanguard Emerging Markets Stock Index Fund 'Institutional' 481,917 15,797 Vanguard Institutional Index Fund 'Institutional' 245,107 85,052 Vanguard Small-Cap Index Fund 'Institutional' 137,228 14,062 .............................................. Total Mutual Funds (Cost $141,946) 177,468 ______________________
Total Investments in Securities (Cost $141,946) 177,468 ______________________
INVESTMENTS IN AFFILIATES 14.0%
MUTUAL FUNDS (a) 8.4%
PIMCO Emerging Markets Local Currency and Bond Fund 114,448 736 PIMCO Income Fund 261,091 3,125 PIMCO International Bond Fund (U.S. Dollar-Hedged) 32,728 357 PIMCO Long-Term Real Return Fund 516,005 3,757 PIMCO Long-Term U.S. Government Fund 942,103 4,927 PIMCO Real Return Fund 106,295 1,282 PIMCO Total Return Fund 307,343 3,141 .............................................. Total Mutual Funds (Cost $17,460) 17,325 ______________________
SHORT-TERM INSTRUMENTS 5.6%
CENTRAL FUNDS USED FOR CASH MANAGEMENT PURPOSES 5.6%
PIMCO Short-Term Floating NAV Portfolio III 1,156,354 11,401 .............................................. Total Short-Term Instruments (Cost $11,402) 11,401 ______________________
Total Investments in Affiliates (Cost $28,862) 28,726 ______________________
Total Investments 100.8% (Cost $170,808) $ 206,194
Financial Derivative Instruments (b) (0.0)%(Cost or Premiums, net $0) (3)
Other Assets and Liabilities, net (0.8)% (1,671) ..............................................
Net Assets 100.0% $ 204,520 ______________________

Schedule of Investments PIMCO REALPATH® Blend 2050 Fund (Cont.) March 31, 2021
(Unaudited)
NOTES TO SCHEDULE OF INVESTMENTS: * A zero balance may reflect actual amounts rounding to less than one thousand.
¤ The geographical classification of foreign (non-U.S.) securities in this report, if any, are classified by the country of incorporation of a holding. In certain instances, a security's country of incorporation may be different from its country of economic exposure.
(a) Institutional Class Shares of each Fund.
(b) FINANCIAL DERIVATIVE INSTRUMENTS: OVER THE COUNTER
SWAP AGREEMENTS:
TOTAL RETURN SWAPS ON EQUITY INDICES
Swap Agreements, at Value
Counterparty Pay/Receive(1) Underlying Reference # of Units Financing Rate
Payment Frequency
Maturity Date
Notional Amount
Premiums Paid/(Received)
Unrealized Appreciation/ (Depreciation) Asset Liability ...................................................................................................................................................................................................................................................................................................................................................................
JPM Receive FNRETR Index 235
0.435% (1-Month USD-LIBOR plus a specified spread) Monthly 08/25/2021 $ 4,744 $ 0 $ (1) $ 0 $ (1)
Receive FNRETR Index 226
0.475% (1-Month USD-LIBOR plus a specified spread) Monthly 02/23/2022 4,563 0 (2) 0 (2) ..................................................................................................................................
Total Swap Agreements $ 0 $ (3) $ 0 $ (3) ________________________________________________________________
(1) Receive represents that the Fund receives payments for any positive net return on the underlying reference. The Fund makes payments for any negative net return on such underlying reference. Pay represents that the Fund receives payments for any negative net return on the underlying reference. The Fund makes payments for any posi tive net return on such underlying reference.
FAIR VALUE MEASUREMENTS
The following is a summary of the fair valuations according to the inputs used as of March 31, 2021 in valuing the Fund's assets and liabilities:
Category and Subcategory Level 1 Level 2 Level 3 Fair Value
at 03/31/2021 .................................................................................................................................................................................................................................................................................................................................. Investments in Securities, at Value Mutual Funds $ 177,468 $ 0 $ 0 $ 177,468 ........................................................................................................................................................................................ $ 177,468 $ 0 $ 0 $ 177,468 Investments in Affiliates, at Value Mutual Funds 17,325 0 0 17,325 Short-Term Instruments Central Funds Used for Cash Management Purposes 11,401 0 0 11,401 ........................................................................................................................................................................................ $ 28,726 $ 0 $ 0 $ 28,726 ........................................................................................................................................................................................ Total Investments $ 206,194 $ 0 $ 0 $ 206,194 ........................................................................................................................................................................................ Financial Derivative Instruments - Liabilities
Over the counter $ 0 $ (3) $ 0 $ (3)
........................................................................................................................................................................................ Total Financial Derivative Instruments $ 0 $ (3) $ 0 $ (3) ........................................................................................................................................................................................ Totals $ 206,194 $ (3) $ 0 $ 206,191 ____________________________________________________________________________________________ There were no significant transfers into or out of Level 3 during the period ended March 31, 2021.
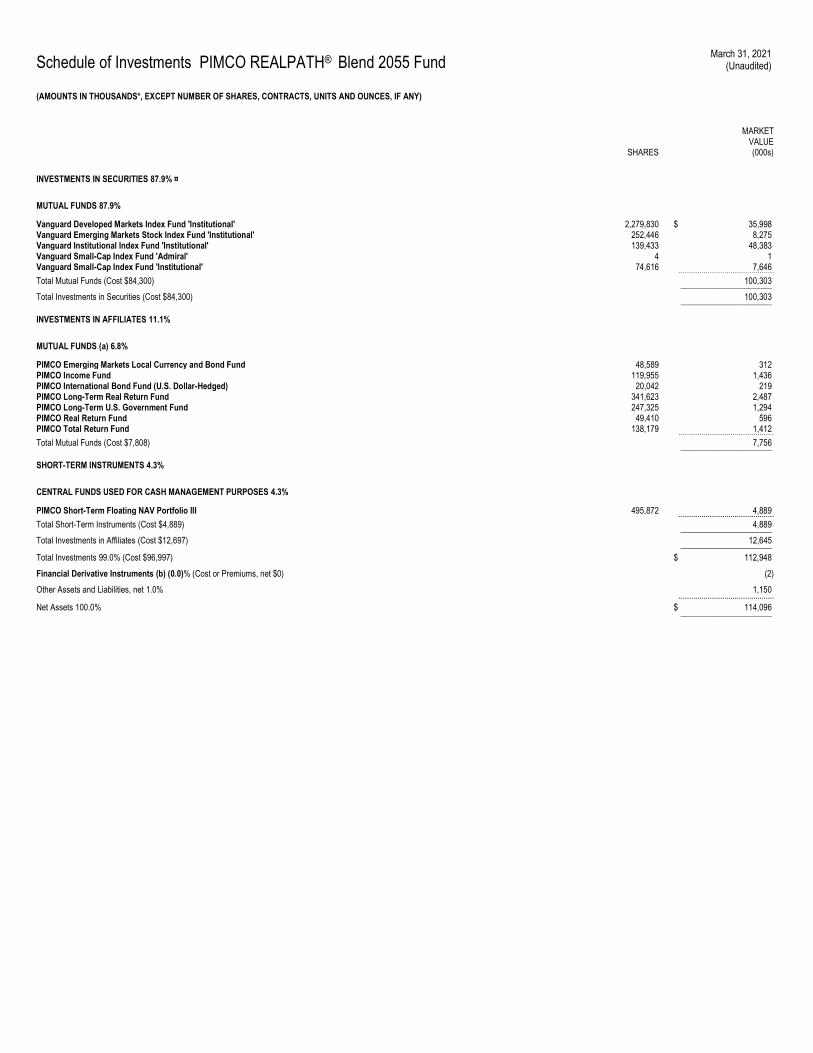
Schedule of Investments PIMCO REALPATH® Blend 2055 Fund March 31, 2021
(Unaudited)
(AMOUNTS IN THOUSANDS*, EXCEPT NUMBER OF SHARES, CONTRACTS, UNITS AND OUNCES, IF ANY)
SHARES
MARKET VALUE (000s)
INVESTMENTS IN SECURITIES 87.9% ¤
MUTUAL FUNDS 87.9%
Vanguard Developed Markets Index Fund 'Institutional' 2,279,830 $ 35,998 Vanguard Emerging Markets Stock Index Fund 'Institutional' 252,446 8,275 Vanguard Institutional Index Fund 'Institutional' 139,433 48,383 Vanguard Small-Cap Index Fund 'Admiral' 4 1 Vanguard Small-Cap Index Fund 'Institutional' 74,616 7,646 .............................................. Total Mutual Funds (Cost $84,300) 100,303 ______________________
Total Investments in Securities (Cost $84,300) 100,303 ______________________
INVESTMENTS IN AFFILIATES 11.1%
MUTUAL FUNDS (a) 6.8%
PIMCO Emerging Markets Local Currency and Bond Fund 48,589 312 PIMCO Income Fund 119,955 1,436 PIMCO International Bond Fund (U.S. Dollar-Hedged) 20,042 219 PIMCO Long-Term Real Return Fund 341,623 2,487 PIMCO Long-Term U.S. Government Fund 247,325 1,294 PIMCO Real Return Fund 49,410 596 PIMCO Total Return Fund 138,179 1,412 .............................................. Total Mutual Funds (Cost $7,808) 7,756 ______________________
SHORT-TERM INSTRUMENTS 4.3%
CENTRAL FUNDS USED FOR CASH MANAGEMENT PURPOSES 4.3%
PIMCO Short-Term Floating NAV Portfolio III 495,872 4,889 .............................................. Total Short-Term Instruments (Cost $4,889) 4,889 ______________________
Total Investments in Affiliates (Cost $12,697) 12,645 ______________________
Total Investments 99.0% (Cost $96,997) $ 112,948
Financial Derivative Instruments (b) (0.0)% (Cost or Premiums, net $0) (2)
Other Assets and Liabilities, net 1.0% 1,150 ..............................................
Net Assets 100.0% $ 114,096 ______________________

Schedule of Investments PIMCO REALPATH® Blend 2055 Fund (Cont.) March 31, 2021
(Unaudited)
NOTES TO SCHEDULE OF INVESTMENTS: * A zero balance may reflect actual amounts rounding to less than one thousand.
¤ The geographical classification of foreign (non-U.S.) securities in this report, if any, are classified by the country of incorporation of a holding. In certain instances, a security's country of incorporation may be different from its country of economic exposure.
(a) Institutional Class Shares of each Fund.
(b) FINANCIAL DERIVATIVE INSTRUMENTS: OVER THE COUNTER
SWAP AGREEMENTS:
TOTAL RETURN SWAPS ON EQUITY INDICES
Swap Agreements, at Value
Counterparty Pay/Receive(1) Underlying Reference # of Units Financing Rate
Payment Frequency
Maturity Date
Notional Amount
Premiums Paid/(Received)
Unrealized Appreciation/ (Depreciation) Asset Liability ...................................................................................................................................................................................................................................................................................................................................................................
JPM Receive FNRETR Index 136
0.435% (1-Month USD-LIBOR plus a specified spread) Monthly 08/25/2021 $ 2,746 $ 0 $ (1) $ 0 $ (1)
Receive FNRETR Index 130
0.475% (1-Month USD-LIBOR plus a specified spread) Monthly 02/23/2022 2,624 0 (1) 0 (1) ..................................................................................................................................
Total Swap Agreements $ 0 $ (2) $ 0 $ (2) ________________________________________________________________
(1) Receive represents that the Fund receives payments for any positive net return on the underlying reference. The Fund makes payments for any negative net return on such underlying reference. Pay represents that the Fund receives payments for any negative net return on the underlying reference. The Fund makes payments for any positive net return on such underlying reference.
FAIR VALUE MEASUREMENTS
The following is a summary of the fair valuations according to the inputs used as of March 31, 2021 in valuing the Fund's assets and liabilities:
Category and Subcategory Level 1 Level 2 Level 3 Fair Value
at 03/31/2021 .................................................................................................................................................................................................................................................................................................................................. Investments in Securities, at Value Mutual Funds $ 100,303 $ 0 $ 0 $ 100,303 ........................................................................................................................................................................................ $ 100,303 $ 0 $ 0 $ 100,303 Investments in Affiliates, at Value Mutual Funds 7,756 0 0 7,756 Short-Term Instruments Central Funds Used for Cash Management Purposes 4,889 0 0 4,889 ........................................................................................................................................................................................ $ 12,645 $ 0 $ 0 $ 12,645 ........................................................................................................................................................................................ Total Investments $ 112,948 $ 0 $ 0 $ 112,948 ........................................................................................................................................................................................ Financial Derivative Instruments - Liabilities
Over the counter $ 0 $ (2) $ 0 $ (2)
........................................................................................................................................................................................ Total Financial Derivative Instruments $ 0 $ (2) $ 0 $ (2) ........................................................................................................................................................................................ Totals $ 112,948 $ (2) $ 0 $ 112,946 ____________________________________________________________________________________________ There were no significant transfers into or out of Level 3 during the period ended March 31, 2021.
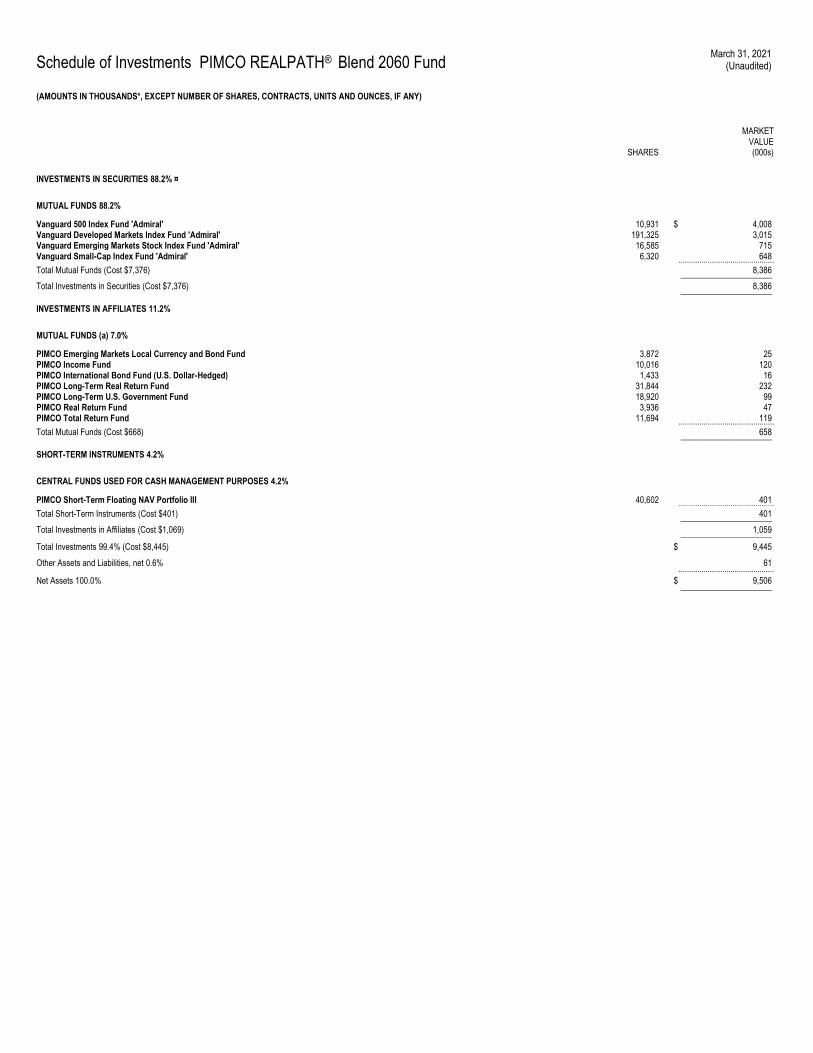
Schedule of Investments PIMCO REALPATH® Blend 2060 Fund March 31, 2021
(Unaudited)
(AMOUNTS IN THOUSANDS*, EXCEPT NUMBER OF SHARES, CONTRACTS, UNITS AND OUNCES, IF ANY)
SHARES
MARKET VALUE (000s)
INVESTMENTS IN SECURITIES 88.2% ¤
MUTUAL FUNDS 88.2%
Vanguard 500 Index Fund 'Admiral' 10,931 $ 4,008 Vanguard Developed Markets Index Fund 'Admiral' 191,325 3,015 Vanguard Emerging Markets Stock Index Fund 'Admiral' 16,585 715 Vanguard Small-Cap Index Fund 'Admiral' 6,320 648 .............................................. Total Mutual Funds (Cost $7,376) 8,386 ______________________
Total Investments in Securities (Cost $7,376) 8,386 ______________________
INVESTMENTS IN AFFILIATES 11.2%
MUTUAL FUNDS (a) 7.0%
PIMCO Emerging Markets Local Currency and Bond Fund 3,872 25 PIMCO Income Fund 10,016 120 PIMCO International Bond Fund (U.S. Dollar-Hedged) 1,433 16 PIMCO Long-Term Real Return Fund 31,844 232 PIMCO Long-Term U.S. Government Fund 18,920 99 PIMCO Real Return Fund 3,936 47 PIMCO Total Return Fund 11,694 119 .............................................. Total Mutual Funds (Cost $668) 658 ______________________
SHORT-TERM INSTRUMENTS 4.2%
CENTRAL FUNDS USED FOR CASH MANAGEMENT PURPOSES 4.2%
PIMCO Short-Term Floating NAV Portfolio III 40,602 401 .............................................. Total Short-Term Instruments (Cost $401) 401 ______________________
Total Investments in Affiliates (Cost $1,069) 1,059 ______________________
Total Investments 99.4% (Cost $8,445) $ 9,445
Other Assets and Liabilities, net 0.6% 61 ..............................................
Net Assets 100.0% $ 9,506 ______________________
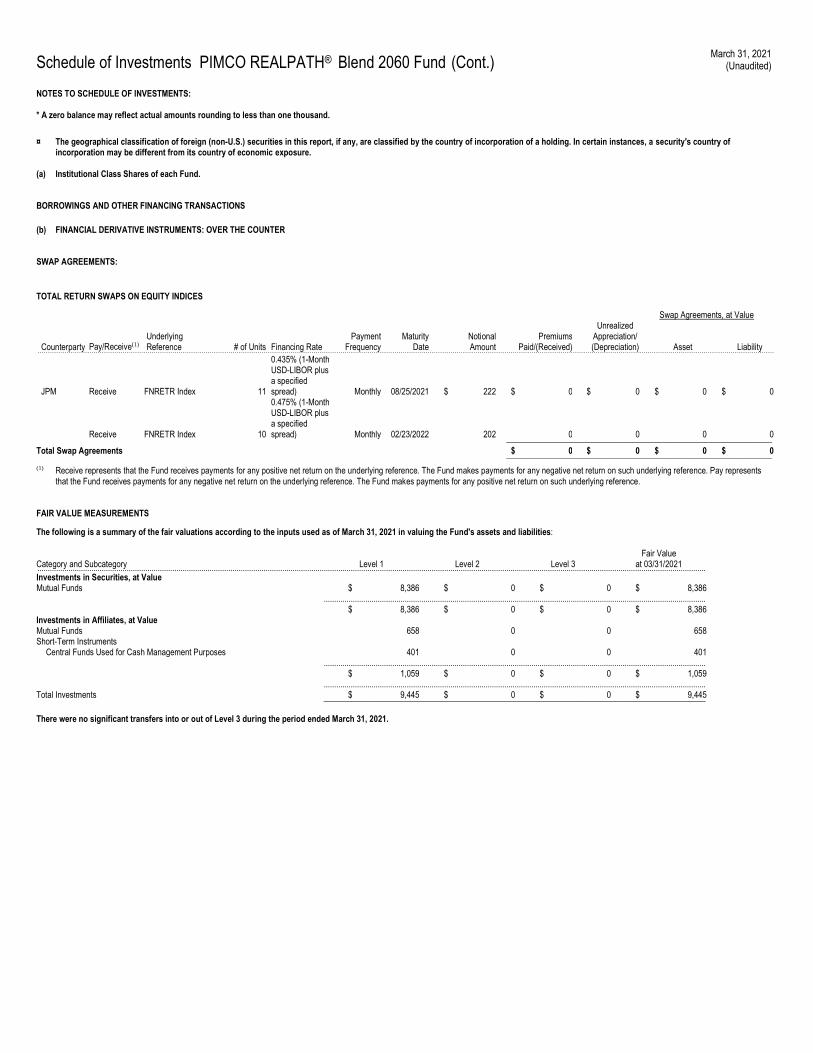
Schedule of Investments PIMCO REALPATH® Blend 2060 Fund (Cont.) March 31, 2021
(Unaudited)
NOTES TO SCHEDULE OF INVESTMENTS: * A zero balance may reflect actual amounts rounding to less than one thousand.
¤ The geographical classification of foreign (non-U.S.) securities in this report, if any, are classified by the country of incorporation of a holding. In certain instances, a security's country of incorporation may be different from its country of economic exposure.
(a) Institutional Class Shares of each Fund.
BORROWINGS AND OTHER FINANCING TRANSACTIONS
(b) FINANCIAL DERIVATIVE INSTRUMENTS: OVER THE COUNTER
SWAP AGREEMENTS:
TOTAL RETURN SWAPS ON EQUITY INDICES
Swap Agreements, at Value
Counterparty Pay/Receive(1)
Underlying Reference # of Units Financing Rate
Payment Frequency
Maturity Date
Notional Amount
Premiums Paid/(Received)
Unrealized Appreciation/ (Depreciation) Asset Liability ...................................................................................................................................................................................................................................................................................................................................................................
JPM Receive FNRETR Index 11
0.435% (1-Month USD-LIBOR plus a specified spread) Monthly 08/25/2021 $ 222 $ 0 $ 0 $ 0 $ 0
Receive FNRETR Index 10
0.475% (1-Month USD-LIBOR plus a specified spread) Monthly 02/23/2022 202 0 0 0 0 ________________________________________________________________
Total Swap Agreements $ 0 $ 0 $ 0 $ 0 ________________________________________________________________
(1) Receive represents that the Fund receives payments for any positive net return on the underlying reference. The Fund makes payments for any negative net return on such underlying reference. Pay represents that the Fund receives payments for any negative net return on the underlying reference. The Fund makes payments for any positive net return on such underlying reference.
FAIR VALUE MEASUREMENTS
The following is a summary of the fair valuations according to the inputs used as of March 31, 2021 in valuing the Fund's assets and liabilities:
Category and Subcategory Level 1 Level 2 Level 3 Fair Value
at 03/31/2021 .................................................................................................................................................................................................................................................................................................................................. Investments in Securities, at Value Mutual Funds $ 8,386 $ 0 $ 0 $ 8,386 ........................................................................................................................................................................................ $ 8,386 $ 0 $ 0 $ 8,386 Investments in Affiliates, at Value Mutual Funds 658 0 0 658 Short-Term Instruments Central Funds Used for Cash Management Purposes 401 0 0 401 ........................................................................................................................................................................................ $ 1,059 $ 0 $ 0 $ 1,059 ........................................................................................................................................................................................ Total Investments $ 9,445 $ 0 $ 0 $ 9,445 ____________________________________________________________________________________________ There were no significant transfers into or out of Level 3 during the period ended March 31, 2021.
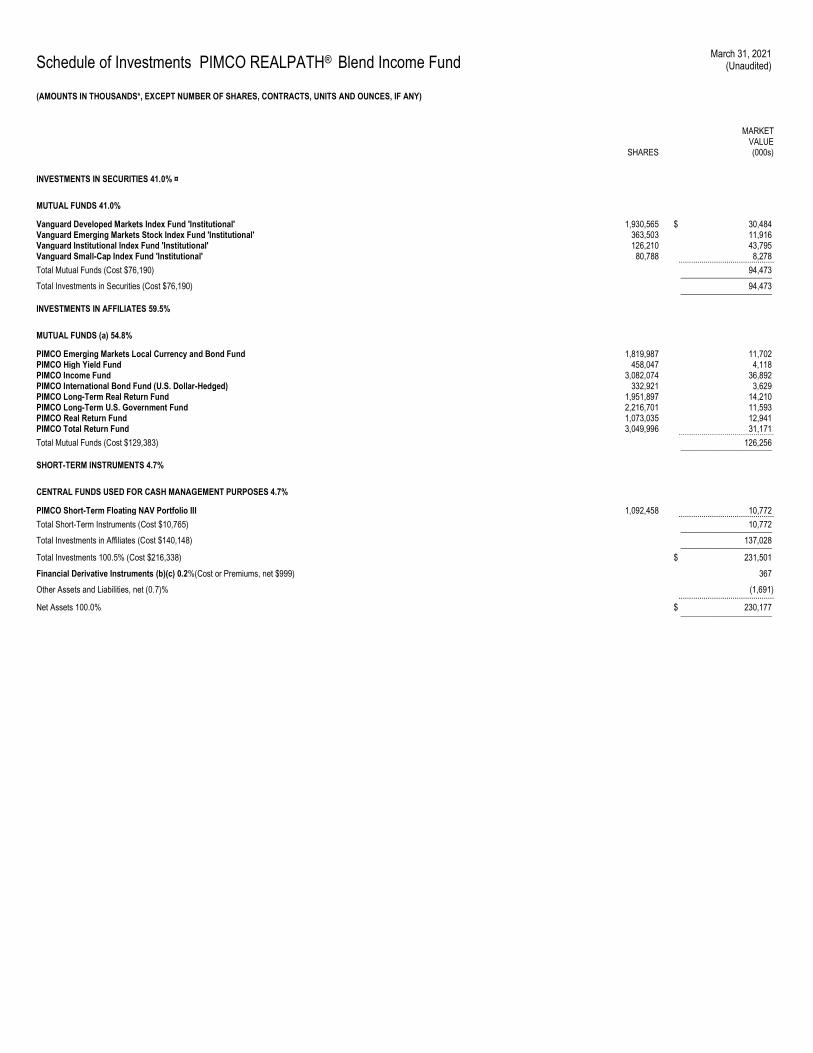
Schedule of Investments PIMCO REALPATH® Blend Income Fund March 31, 2021
(Unaudited)
(AMOUNTS IN THOUSANDS*, EXCEPT NUMBER OF SHARES, CONTRACTS, UNITS AND OUNCES, IF ANY)
SHARES
MARKET VALUE (000s)
INVESTMENTS IN SECURITIES 41.0% ¤
MUTUAL FUNDS 41.0%
Vanguard Developed Markets Index Fund 'Institutional' 1,930,565 $ 30,484 Vanguard Emerging Markets Stock Index Fund 'Institutional' 363,503 11,916 Vanguard Institutional Index Fund 'Institutional' 126,210 43,795 Vanguard Small-Cap Index Fund 'Institutional' 80,788 8,278 .............................................. Total Mutual Funds (Cost $76,190) 94,473 ______________________
Total Investments in Securities (Cost $76,190) 94,473 ______________________
INVESTMENTS IN AFFILIATES 59.5%
MUTUAL FUNDS (a) 54.8%
PIMCO Emerging Markets Local Currency and Bond Fund 1,819,987 11,702 PIMCO High Yield Fund 458,047 4,118 PIMCO Income Fund 3,082,074 36,892 PIMCO International Bond Fund (U.S. Dollar-Hedged) 332,921 3,629 PIMCO Long-Term Real Return Fund 1,951,897 14,210 PIMCO Long-Term U.S. Government Fund 2,216,701 11,593 PIMCO Real Return Fund 1,073,035 12,941 PIMCO Total Return Fund 3,049,996 31,171 .............................................. Total Mutual Funds (Cost $129,383) 126,256 ______________________
SHORT-TERM INSTRUMENTS 4.7%
CENTRAL FUNDS USED FOR CASH MANAGEMENT PURPOSES 4.7%
PIMCO Short-Term Floating NAV Portfolio III 1,092,458 10,772 .............................................. Total Short-Term Instruments (Cost $10,765) 10,772 ______________________
Total Investments in Affiliates (Cost $140,148) 137,028 ______________________
Total Investments 100.5% (Cost $216,338) $ 231,501
Financial Derivative Instruments (b)(c) 0.2%(Cost or Premiums, net $999) 367
Other Assets and Liabilities, net (0.7)% (1,691) ..............................................
Net Assets 100.0% $ 230,177 ______________________
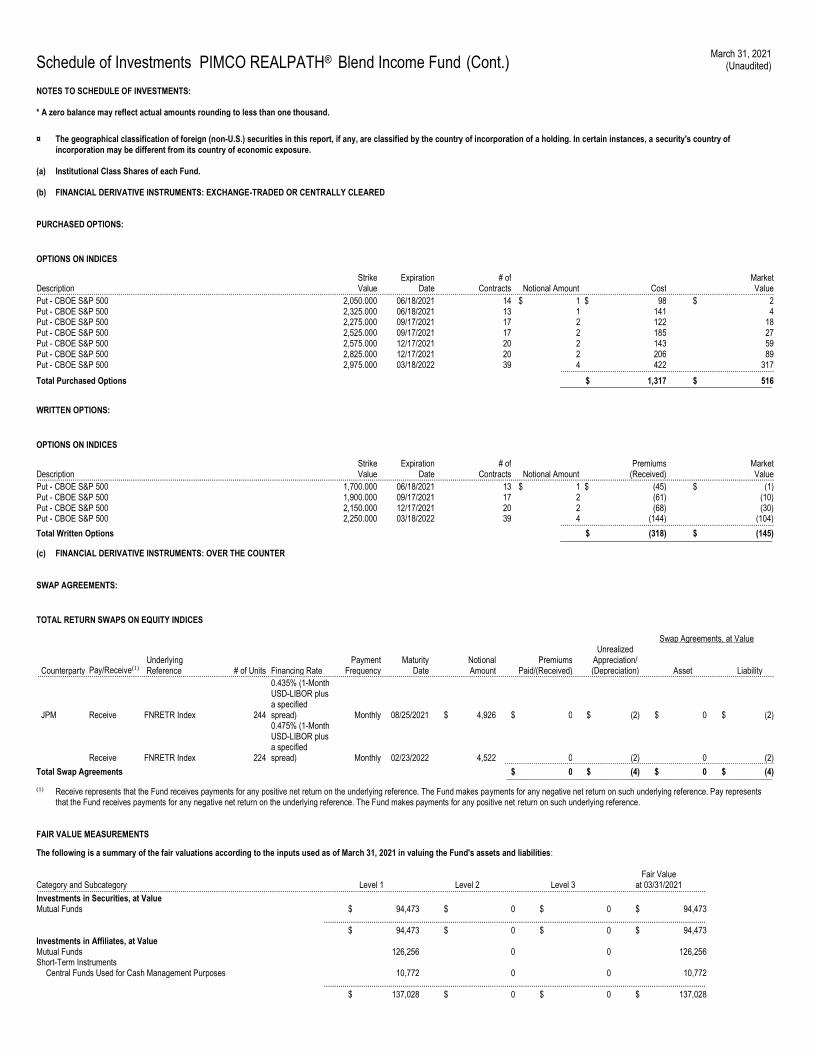
Schedule of Investments PIMCO REALPATH® Blend Income Fund (Cont.) March 31, 2021
(Unaudited)
NOTES TO SCHEDULE OF INVESTMENTS: * A zero balance may reflect actual amounts rounding to less than one thousand.
¤ The geographical classification of foreign (non-U.S.) securities in this report, if any, are classified by the country of incorporation of a holding. In certain instances, a security's country of incorporation may be different from its country of economic exposure.
(a) Institutional Class Shares of each Fund.
(b) FINANCIAL DERIVATIVE INSTRUMENTS: EXCHANGE-TRADED OR CENTRALLY CLEARED
PURCHASED OPTIONS:
OPTIONS ON INDICES
Description Strike Value
Expiration Date
# of Contracts Notional Amount Cost
Market Value ...................................................................................................................................................................................................................................................................................................................................................................
Put - CBOE S&P 500 2,050.000 06/18/2021 14 $ 1 $ 98 $ 2 Put - CBOE S&P 500 2,325.000 06/18/2021 13 1 141 4 Put - CBOE S&P 500 2,275.000 09/17/2021 17 2 122 18 Put - CBOE S&P 500 2,525.000 09/17/2021 17 2 185 27 Put - CBOE S&P 500 2,575.000 12/17/2021 20 2 143 59 Put - CBOE S&P 500 2,825.000 12/17/2021 20 2 206 89 Put - CBOE S&P 500 2,975.000 03/18/2022 39 4 422 317 ....................................................................................................... Total Purchased Options $ 1,317 $ 516 ___________________________________________________
WRITTEN OPTIONS:
OPTIONS ON INDICES
Description Strike Value
Expiration Date
# of Contracts Notional Amount
Premiums (Received)
Market Value ...................................................................................................................................................................................................................................................................................................................................................................
Put - CBOE S&P 500 1,700.000 06/18/2021 13 $ 1 $ (45) $ (1) Put - CBOE S&P 500 1,900.000 09/17/2021 17 2 (61) (10) Put - CBOE S&P 500 2,150.000 12/17/2021 20 2 (68) (30) Put - CBOE S&P 500 2,250.000 03/18/2022 39 4 (144) (104) ....................................................................................................... Total Written Options $ (318) $ (145) ___________________________________________________
(c) FINANCIAL DERIVATIVE INSTRUMENTS: OVER THE COUNTER
SWAP AGREEMENTS:
TOTAL RETURN SWAPS ON EQUITY INDICES
Swap Agreements, at Value
Counterparty Pay/Receive(1) Underlying Reference # of Units Financing Rate
Payment Frequency
Maturity Date
Notional Amount
Premiums Paid/(Received)
Unrealized Appreciation/ (Depreciation) Asset Liability ...................................................................................................................................................................................................................................................................................................................................................................
JPM Receive FNRETR Index 244
0.435% (1-Month USD-LIBOR plus a specified spread) Monthly 08/25/2021 $ 4,926 $ 0 $ (2) $ 0 $ (2)
Receive FNRETR Index 224
0.475% (1-Month USD-LIBOR plus a specified spread) Monthly 02/23/2022 4,522 0 (2) 0 (2) ..................................................................................................................................
Total Swap Agreements $ 0 $ (4) $ 0 $ (4) ________________________________________________________________
(1) Receive represents that the Fund receives payments for any positive net return on the underlying reference. The Fund makes payments for any negative net return on such underlying reference. Pay represents that the Fund receives payments for any negative net return on the underlying reference. The Fund makes payments for any positive net return on such underlying reference.
FAIR VALUE MEASUREMENTS
The following is a summary of the fair valuations according to the inputs used as of March 31, 2021 in valuing the Fund's assets and liabilities:
Category and Subcategory Level 1 Level 2 Level 3 Fair Value
at 03/31/2021 .................................................................................................................................................................................................................................................................................................................................. Investments in Securities, at Value Mutual Funds $ 94,473 $ 0 $ 0 $ 94,473 ........................................................................................................................................................................................ $ 94,473 $ 0 $ 0 $ 94,473 Investments in Affiliates, at Value Mutual Funds 126,256 0 0 126,256 Short-Term Instruments Central Funds Used for Cash Management Purposes 10,772 0 0 10,772 ........................................................................................................................................................................................ $ 137,028 $ 0 $ 0 $ 137,028

Schedule of Investments PIMCO REALPATH® Blend Income Fund (Cont.) March 31, 2021
(Unaudited)
........................................................................................................................................................................................ Total Investments $ 231,501 $ 0 $ 0 $ 231,501 ........................................................................................................................................................................................ Financial Derivative Instruments - Assets
Exchange-traded or centrally cleared $ 0 $ 516 $ 0 $ 516
........................................................................................................................................................................................ Financial Derivative Instruments - Liabilities Exchange-traded or centrally cleared 0 (145) 0 (145) Over the counter 0 (4) 0 (4) ........................................................................................................................................................................................ $ 0 $ (149) $ 0 $ (149) ........................................................................................................................................................................................ Total Financial Derivative Instruments $ 0 $ 367 $ 0 $ 367 ........................................................................................................................................................................................ Totals $ 231,501 $ 367 $ 0 $ 231,868 ____________________________________________________________________________________________ There were no significant transfers into or out of Level 3 during the period ended March 31, 2021.
Notes to Financial Statements
1. INVESTMENT VALUATION AND FAIR VALUE MEASUREMENTS
(a) Investment Valuation Policies The price of a Fund's shares is based on the Fund's net asset value ("NAV"). The NAV of a Fund, or each of its share classes, as applicable, is determined by dividing the total value of portfolio investments and other assets, less any liabilities attributable to that Fund or class, by the total number of shares outstanding of that Fund or class.
On each day that the New York Stock Exchange (“NYSE”) is open, Fund shares are ordinarily valued as of the close of regular trading (normally 4:00 p.m., Eastern time) (“NYSE Close”). Information that becomes known to the Funds or their agents after the time as of which NAV has been calculated on a particular day will not generally be used to retroactively adjust the price of a security or the NAV determined earlier that day. If regular trading on the NYSE closes earlier than scheduled, each Fund reserves the right to either (i) calculate its NAV as of the earlier closing time or (ii) calculate its NAV as of the normally scheduled close of regular trading on the NYSE for that day. Each Fund generally does not calculate its NAV on days during which the NYSE is closed. However, if the NYSE is closed on a day it would normally be open for business, each Fund reserves the right to calculate its NAV as of the normally scheduled close of regular trading on the NYSE for that day or such other time that the Fund may determine.
For purposes of calculating NAV, portfolio securities and other assets for which market quotes are readily available are valued at market value. Market value is generally determined on the basis of official closing prices or the last reported sales prices, or if no sales are reported, based on quotes obtained from established market makers or prices (including evaluated prices) supplied by the Funds' approved pricing services, quotation reporting systems and other third-party sources (together, “Pricing Services”). The Funds will normally use pricing data for domestic equity securities received shortly after the NYSE Close and do not normally take into account trading, clearances or settlements that take place after the NYSE Close. If market value pricing is used, a foreign (non-U.S.) equity security traded on a foreign exchange or on more than one exchange is typically valued using pricing information from the exchange considered by Pacific Investment Management Company LLC (the “Adviser”) to be the primary exchange. A foreign (non-U.S.) equity security will be valued as of the close of trading on the foreign exchange, or the NYSE Close, if the NYSE Close occurs before the end of trading on the foreign exchange. Domestic and foreign (non-U.S.) fixed income securities, non-exchange traded derivatives, and equity options are normally valued on the basis of quotes obtained from brokers and dealers or Pricing Services using data reflecting the earlier closing of the principal markets for those securities. Prices obtained from Pricing Services may be based on, among other things, information provided by market makers or estimates of market values obtained from yield data relating to investments or securities with similar characteristics. Certain fixed income securities purchased on a delayed-delivery basis are marked to market daily until settlement at the forward settlement date. Exchange-traded options, except equity options, futures and options on futures are valued at the settlement price determined by the relevant exchange. Swap agreements are valued on the basis of bid quotes obtained from brokers and dealers or market-based prices supplied by Pricing Services. A Fund's investments in open-end management investment companies, other than exchange-traded funds ("ETFs"), are valued at the NAVs of such investments. Open-end management investment companies may include affiliated funds.
If a foreign (non-U.S.) equity security’s value has materially changed after the close of the security’s primary exchange or principal market but before the NYSE Close, the security may be valued at fair value based on procedures established and approved by the Board of Trustees of the Trust (the “Board”). Foreign (non-U.S.) equity securities that do not trade when the NYSE is open are also valued at fair value. With respect to foreign (non-U.S.) equity securities, a Fund may determine the fair value of investments based on information provided by Pricing Services and other third-party vendors, which may recommend fair value or adjustments with reference to other securities, indices or assets. In considering whether fair valuation is required and in determining fair values, a Fund may, among other things, consider significant events (which may be considered to include changes in the value of U.S. securities or securities indices) that occur after the close of the relevant market and before the NYSE Close. A Fund may utilize modeling tools provided by third-party vendors to determine fair values of foreign (non-U.S.) securities. For these purposes, any movement in the applicable reference index or instrument (“zero trigger”) between the earlier close of the applicable foreign market and the NYSE Close may be deemed to be a significant event, prompting the application of the pricing model (effectively resulting in daily fair valuations). Foreign exchanges may permit trading in foreign (non-U.S.) equity securities on days when the Trust is not open for business, which may result in a Fund's portfolio investments being affected when shareholders are unable to buy or sell shares.
Senior secured floating rate loans for which an active secondary market exists to a reliable degree are valued at the mean of the last available bid/ask prices in the market for such loans, as provided by a Pricing Service. Senior secured floating rate loans for which an active secondary market does not exist to a reliable degree are valued at fair value, which is intended to approximate market value. In valuing a senior secured floating rate loan at fair value, the factors considered may include, but are not limited to, the following: (a) the creditworthiness of the borrower and any intermediate participants, (b) the terms of the loan, (c) recent prices in the market for similar loans, if any, and (d) recent prices in the market for instruments of similar quality, rate, period until next interest rate reset and maturity.
Investments valued in currencies other than the U.S. dollar are converted to the U.S. dollar using exchange rates obtained from Pricing Services. As a result, the value of such investments and, in turn, the NAV of a Fund's shares may be affected by changes in the value of currencies in relation to the U.S. dollar. The value of investments traded in markets outside the United States or denominated in currencies other than the U.S. dollar may be affected significantly on a day that the Trust is not open for business. As a result, to the extent that a Fund holds foreign (non-U.S.) investments, the value of those investments may change at times when shareholders are unable to buy or sell shares and the value of such investments will be reflected in the Fund's next calculated NAV.
Investments for which market quotes or market based valuations are not readily available are valued at fair value as determined in good faith by the Board or persons acting at their direction. The Board has adopted methods for valuing securities and other assets in circumstances where market quotes are not readily available, and has delegated to the Adviser the responsibility for applying the fair valuation methods. In the event that market quotes or market based valuations are not readily available, and the security or asset cannot be valued pursuant to a Board approved valuation method, the value of the security or asset will be determined in good faith by the Board. The Adviser may consult with the Sub-Adviser or Parametric in providing such recommendations or otherwise with respect to valuation of the PIMCO Dividend and Income Fund’s portfolio securities or other assets. Market quotes are considered not readily available in circumstances where there is an absence of current or reliable market-based data (e.g., trade information, bid/ask information, indicative market quotations (“Broker Quotes”), Pricing Services’ prices), including where events occur after the close of the relevant market, but prior to the NYSE Close, that materially affect the values of a Fund's securities or assets. In addition, market quotes are considered not readily available when, due to extraordinary circumstances, the exchanges or markets on which the securities trade do not open for trading for the entire day and no other market prices are available. The Board has delegated, to the Adviser, the responsibility for monitoring significant events that may materially affect the values of a Fund's securities or assets and for determining whether the value of the applicable securities or assets should be reevaluated in light of such significant events.
When a Fund (or, in each instance in this paragraph, as applicable, an Underlying PIMCO Fund or Acquired Fund) uses fair valuation to determine the value of a portfolio security or other asset for purposes of calculating its NAV, such investments will not be priced on the basis of quotes from the primary market in which they are traded, but rather may be priced by another method that the Board or persons acting at their direction believe reflects fair value. Fair valuation may require subjective determinations about the value of a security. While the Trust’s policy is intended to result in a calculation of a Fund's NAV that fairly reflects security values as of the time of pricing, the Trust cannot ensure that fair values determined by the Board or persons acting at their direction would accurately reflect the price that a Fund could obtain for a security if it were to dispose of that security as of the
Notes to Financial Statements (Cont.)
time of pricing (for instance, in a forced or distressed sale). The prices used by a Fund may differ from the value that would be realized if the securities were sold. The Funds' use of fair valuation may also help to deter “stale price arbitrage” as discussed under the "Abusive Trading Practices" section in each Fund's prospectus. (b) Fair Value Hierarchy U.S. GAAP describes fair value as the price that a Fund would receive to sell an asset or pay to transfer a liability in an orderly transaction between market participants at the measurement date. It establishes a fair value hierarchy that prioritizes inputs to valuation methods and requires disclosure of the fair value hierarchy, separately for each major category of assets and liabilities, that segregates fair value measurements into levels (Level 1, 2, or 3). The inputs or methodology used for valuing securities are not necessarily an indication of the risks associated with investing in those securities. Levels 1, 2, and 3 of the fair value hierarchy are defined as follows:
• Level 1 — Quoted prices in active markets or exchanges for identical assets and liabilities.
• Level 2 — Significant other observable inputs, which may include, but are not limited to, quoted prices for similar assets or liabilities in markets that are active, quoted prices for identical or similar assets or liabilities in markets that are not active, inputs other than quoted prices that are observable for the assets or liabilities (such as interest rates, yield curves, volatilities, prepayment speeds, loss severities, credit risks and default rates) or other market corroborated inputs.
• Level 3 — Significant unobservable inputs based on the best information available in the circumstances, to the extent observable inputs are not available, which may include assumptions made by the Board or persons acting at their direction that are used in determining the fair value of investments.
In accordance with the requirements of U.S. GAAP, the amounts of transfers into and out of Level 3, if material, are disclosed in the Notes to Schedule of Investments for each respective Fund. For fair valuations using significant unobservable inputs, U.S. GAAP requires a reconciliation of the beginning to ending balances for reported fair values that presents changes attributable to realized gain (loss), unrealized appreciation (depreciation), purchases and sales, accrued discounts (premiums), and transfers into and out of the Level 3 category during the period. The end of period value is used for the transfers between Levels of a Fund's assets and liabilities. Additionally, U.S. GAAP requires quantitative information regarding the significant unobservable inputs used in the determination of fair value of assets or liabilities categorized as Level 3 in the fair value hierarchy. In accordance with the requirements of U.S. GAAP, a fair value hierarchy, and if material, a Level 3 reconciliation and details of significant unobservable inputs, have been included in the Notes to Schedule of Investments for each respective Fund.
(c) Valuation Techniques and the Fair Value Hierarchy Level 1 and Level 2 trading assets and trading liabilities, at fair value The valuation methods (or “techniques”) and significant inputs used in determining the fair values of portfolio securities or other assets and liabilities categorized as Level 1 and Level 2 of the fair value hierarchy are as follows:
Fixed income securities including corporate, convertible and municipal bonds and notes, U.S. government agencies, U.S. treasury obligations, sovereign issues, bank loans, convertible preferred securities and non-U.S. bonds are normally valued on the basis of quotes obtained from brokers and dealers or Pricing Services that use broker-dealer quotations, reported trades or valuation estimates from their internal pricing models. The Pricing Services' internal models use inputs that are observable such as issuer details, interest rates, yield curves, prepayment speeds, credit risks/spreads, default rates and quoted prices for similar assets. Securities that use similar valuation techniques and inputs as described above are categorized as Level 2 of the fair value hierarchy.
Fixed income securities purchased on a delayed-delivery basis or as a repurchase commitment in a sale-buyback transaction are marked to market daily until settlement at the forward settlement date and are categorized as Level 2 of the fair value hierarchy.
Mortgage-related and asset-backed securities are usually issued as separate tranches, or classes, of securities within each deal. These securities are also normally valued by Pricing Services that use broker-dealer quotations, reported trades or valuation estimates from their internal pricing models. The pricing models for these securities usually consider tranche-level attributes, current market data, estimated cash flows and market-based yield spreads for each tranche, and incorporate deal collateral performance, as available. Mortgage-related and asset-backed securities that use similar valuation techniques and inputs as described above are categorized as Level 2 of the fair value hierarchy.
Common stocks, ETFs, exchange-traded notes and financial derivative instruments, such as futures contracts, rights and warrants, or options on futures that are traded on a national securities exchange, are stated at the last reported sale or settlement price on the day of valuation. To the extent these securities are actively traded and valuation adjustments are not applied, they are categorized as Level 1 of the fair value hierarchy.
Valuation adjustments may be applied to certain securities that are solely traded on a foreign exchange to account for the market movement between the close of the foreign market and the NYSE Close. These securities are valued using Pricing Services that consider the correlation of the trading patterns of the foreign security to the intraday trading in the U.S. markets for investments. Securities using these valuation adjustments are categorized as Level 2 of the fair value hierarchy. Preferred securities and other equities traded on inactive markets or valued by reference to similar instruments are also categorized as Level 2 of the fair value hierarchy.
Equity-linked securities are valued by referencing the last reported sale or settlement price of the linked referenced equity on the day of valuation. Foreign exchange adjustments are applied to the last reported price to convert the linked equity’s trading currency to the contract’s settling currency. These investments are categorized as Level 2 of the fair value hierarchy.
Investments in registered open-end investment companies (other than ETFs) will be valued based upon the NAVs of such investments and are categorized as Level 1 of the fair value hierarchy. Investments in unregistered open-end investment companies will be calculated based upon the NAVs of such investments and are considered Level 1 provided that the NAVs are observable, calculated daily and are the value at which both purchases and sales will be conducted.
Equity exchange-traded options and over the counter financial derivative instruments, such as forward foreign currency contracts and options contracts derive their value from underlying asset prices, indices, reference rates, and other inputs or a combination of these factors. These contracts are normally valued on the basis of quotes obtained from a quotation reporting system, established market makers or Pricing Services (normally determined as of the NYSE Close). Depending on the product and the terms of the transaction,
Notes to Financial Statements (Cont.)
financial derivative instruments can be valued by Pricing Services using a series of techniques, including simulation pricing models. The pricing models use inputs that are observed from actively quoted markets such as quoted prices, issuer details, indices, bid/ask spreads, interest rates, implied volatilities, yield curves, dividends and exchange rates. Financial derivative instruments that use similar valuation techniques and inputs as described above are categorized as Level 2 of the fair value hierarchy.
Centrally cleared swaps and over the counter swaps derive their value from underlying asset prices, indices, reference rates, and other inputs or a combination of these factors. They are valued using a broker-dealer bid quotation or on market-based prices provided by Pricing Services (normally determined as of the NYSE Close). Centrally cleared swaps and over the counter swaps can be valued by Pricing Services using a series of techniques, including simulation pricing models. The pricing models may use inputs that are observed from actively quoted markets such as the overnight index swap rate, London Interbank Offered Rate forward rate, interest rates, yield curves and credit spreads. These securities are categorized as Level 2 of the fair value hierarchy.
Level 3 trading assets and trading liabilities, at fair value When a fair valuation method is applied by the Adviser that uses significant unobservable inputs, investments will be priced by a method that the Board or persons acting at their direction believe reflects fair value and are categorized as Level 3 of the fair value hierarchy.
Short-term debt instruments (such as commercial paper) having a remaining maturity of 60 days or less may be valued at amortized cost, so long as the amortized cost value of such short-term debt instruments is approximately the same as the fair value of the instrument as determined without the use of amortized cost valuation. These securities are categorized as Level 2 or Level 3 of the fair value hierarchy depending on the source of the base price.
2. FEDERAL INCOME TAX MATTERS
Each Fund intends to qualify as a regulated investment company under Subchapter M of the Internal Revenue Code (the “Code”) and distribute all of its taxable income and net realized gains, if applicable, to shareholders. Accordingly, no provision for Federal income taxes has been made.
A Fund may be subject to local withholding taxes, including those imposed on realized capital gains. Any applicable foreign capital gains tax is accrued daily based upon net unrealized gains, and may be payable following the sale of any applicable investments.
In accordance with U.S. GAAP, the Adviser has reviewed the Funds' tax positions for all open tax years. As of March 31, 2021, the Funds have recorded no liability for net unrecognized tax benefits relating to uncertain income tax positions they have taken or expect to take in future tax returns.
The Funds file U.S. federal, state, and local tax returns as required. The Funds' tax returns are subject to examination by relevant tax authorities until expiration of the applicable statute of limitations, which is generally three years after the filing of the tax return but which can be extended to six years in certain circumstances. Tax returns for open years have incorporated no uncertain tax positions that require a provision for income taxes. 3. INVESTMENTS IN AFFILIATES
Each Fund eligible to participate in securities lending may invest the cash collateral received for securities out on loan in the PIMCO Government Money Market Fund under the Securities Lending Agreement. PIMCO Government Money Market Fund is considered to be affiliated with the Funds. A copy of each affiliate fund’s shareholder report is available at the U.S. Securities and Exchange Commission ("SEC") website at www.sec.gov, on the Funds’ website at http://www.pimco.com, or upon request, as applicable. The table below shows the Funds’ transactions in and earnings from investments in the affiliated Fund for the period ended March 31, 2021 (amounts in thousands†): Investments in PIMCO Government Money Market Fund
Fund Name Market Value
06/30/2020 Purchases at
Cost
Proceeds from Sales
Net Realized
Gain (Loss)
Change in Unrealized
Appreciation (Depreciation)
Market Value 03/31/2021
Dividend Income(1)
Realized Net Capital Gain
Distributions(1) ________________________________________________________________________________________________________________________________________________
PIMCO RAE Emerging Markets Fund $ 41,651 $ 190,193 $ (189,846) $ 0 $ 0 $ 41,998 $ 2 $ 0 PIMCO RAE International Fund 43,067 347,904 (326,372) 0 0 64,599 2 0 PIMCO RAE US Fund 10,843 93,645 (101,970) 0 0 2,518 0 0 PIMCO RAE US Small Fund 9,805 115,982 (110,932) 0 0 14,855 1 0 PIMCO RAFI Dynamic Multi-Factor Emerging Markets Equity ETF
6,038
61,571
(65,364)
0
0
2,245
0
0
PIMCO RAFI Dynamic Multi-Factor International Equity ETF
0
2,328
(2,296)
0
0
32
0
0
PIMCO RAFI Dynamic Multi-Factor U.S. Equity ETF 39 411 (397) 0 0 53 0 0 ________________________________________________________________________________________________________________________________________________
† A zero balance may reflect actual amounts rounding to less than one thousand. (1) The tax characterization of distributions is determined in accordance with Federal income tax regulations and may contain a return of capital. The actual tax characterization of distributions received is determined at the end of the fiscal year of the affiliated fund.
The PIMCO RAE Global and PIMCO RAE Global ex-US Funds may invest in Institutional Class shares of the Underlying PIMCO Funds and may also invest in other affiliated funds, and unaffiliated funds, which may or may not be registered under the Act (together with the Underlying Funds, “Acquired Funds”). The Underlying Funds are considered to be affiliated with the PIMCO RAE Global and PIMCO RAE Global ex-US Funds. The tables below show the transactions in and earnings from investments in the Underlying Funds for the period ended March 31, 2021 (amounts in thousands†):
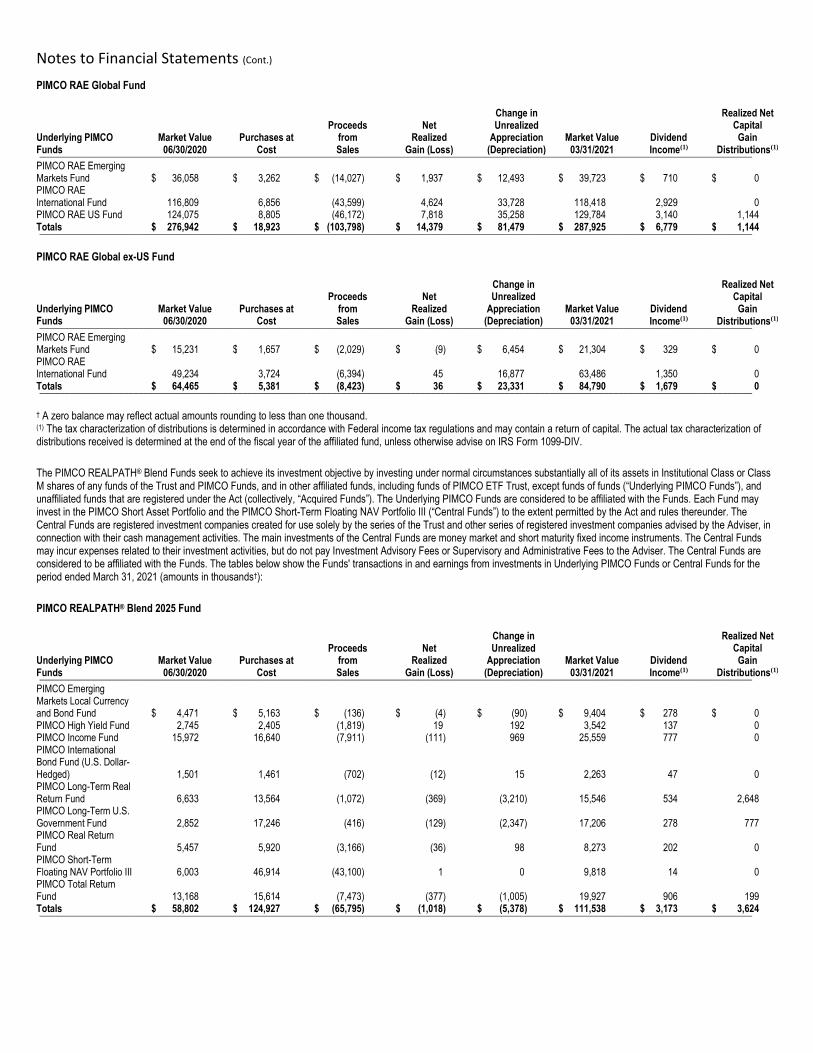
Notes to Financial Statements (Cont.)
PIMCO RAE Global Fund
Underlying PIMCO Funds
Market Value 06/30/2020
Purchases at Cost
Proceeds from Sales
Net Realized
Gain (Loss)
Change in Unrealized
Appreciation (Depreciation)
Market Value 03/31/2021
Dividend Income(1)
Realized Net Capital Gain
Distributions(1) ________________________________________________________________________________________________________________________________________________
PIMCO RAE Emerging Markets Fund $ 36,058 $ 3,262 $ (14,027) $ 1,937 $ 12,493 $ 39,723 $ 710 $ 0 PIMCO RAE International Fund 116,809 6,856 (43,599) 4,624 33,728 118,418 2,929 0 PIMCO RAE US Fund 124,075 8,805 (46,172) 7,818 35,258 129,784 3,140 1,144 Totals $ 276,942 $ 18,923 $ (103,798) $ 14,379 $ 81,479 $ 287,925 $ 6,779 $ 1,144 ________________________________________________________________________________________________________________________________________________
PIMCO RAE Global ex-US Fund
Underlying PIMCO Funds
Market Value 06/30/2020
Purchases at Cost
Proceeds from Sales
Net Realized
Gain (Loss)
Change in Unrealized
Appreciation (Depreciation)
Market Value 03/31/2021
Dividend Income(1)
Realized Net Capital Gain
Distributions(1) ________________________________________________________________________________________________________________________________________________
PIMCO RAE Emerging Markets Fund $ 15,231 $ 1,657 $ (2,029) $ (9) $ 6,454 $ 21,304 $ 329 $ 0 PIMCO RAE International Fund 49,234 3,724 (6,394) 45 16,877 63,486 1,350 0 Totals $ 64,465 $ 5,381 $ (8,423) $ 36 $ 23,331 $ 84,790 $ 1,679 $ 0 ________________________________________________________________________________________________________________________________________________
† A zero balance may reflect actual amounts rounding to less than one thousand. (1) The tax characterization of distributions is determined in accordance with Federal income tax regulations and may contain a return of capital. The actual tax characterization of distributions received is determined at the end of the fiscal year of the affiliated fund, unless otherwise advise on IRS Form 1099-DIV.
The PIMCO REALPATH® Blend Funds seek to achieve its investment objective by investing under normal circumstances substantially all of its assets in Institutional Class or Class M shares of any funds of the Trust and PIMCO Funds, and in other affiliated funds, including funds of PIMCO ETF Trust, except funds of funds (“Underlying PIMCO Funds”), and unaffiliated funds that are registered under the Act (collectively, “Acquired Funds”). The Underlying PIMCO Funds are considered to be affiliated with the Funds. Each Fund may invest in the PIMCO Short Asset Portfolio and the PIMCO Short-Term Floating NAV Portfolio III (“Central Funds”) to the extent permitted by the Act and rules thereunder. The Central Funds are registered investment companies created for use solely by the series of the Trust and other series of registered investment companies advised by the Adviser, in connection with their cash management activities. The main investments of the Central Funds are money market and short maturity fixed income instruments. The Central Funds may incur expenses related to their investment activities, but do not pay Investment Advisory Fees or Supervisory and Administrative Fees to the Adviser. The Central Funds are considered to be affiliated with the Funds. The tables below show the Funds' transactions in and earnings from investments in Underlying PIMCO Funds or Central Funds for the period ended March 31, 2021 (amounts in thousands†):
PIMCO REALPATH® Blend 2025 Fund
Underlying PIMCO Funds
Market Value 06/30/2020
Purchases at Cost
Proceeds from Sales
Net Realized
Gain (Loss)
Change in Unrealized
Appreciation (Depreciation)
Market Value 03/31/2021
Dividend Income(1)
Realized Net Capital Gain
Distributions(1) ________________________________________________________________________________________________________________________________________________
PIMCO Emerging Markets Local Currency and Bond Fund $ 4,471 $ 5,163 $ (136) $ (4) $ (90) $ 9,404 $ 278 $ 0 PIMCO High Yield Fund 2,745 2,405 (1,819) 19 192 3,542 137 0 PIMCO Income Fund 15,972 16,640 (7,911) (111) 969 25,559 777 0 PIMCO International Bond Fund (U.S. Dollar-Hedged) 1,501 1,461 (702) (12) 15 2,263 47 0 PIMCO Long-Term Real Return Fund 6,633 13,564 (1,072) (369) (3,210) 15,546 534 2,648 PIMCO Long-Term U.S. Government Fund 2,852 17,246 (416) (129) (2,347) 17,206 278 777 PIMCO Real Return Fund 5,457 5,920 (3,166) (36) 98 8,273 202 0 PIMCO Short-Term Floating NAV Portfolio III 6,003 46,914 (43,100) 1 0 9,818 14 0 PIMCO Total Return Fund 13,168 15,614 (7,473) (377) (1,005) 19,927 906 199 Totals $ 58,802 $ 124,927 $ (65,795) $ (1,018) $ (5,378) $ 111,538 $ 3,173 $ 3,624 ________________________________________________________________________________________________________________________________________________
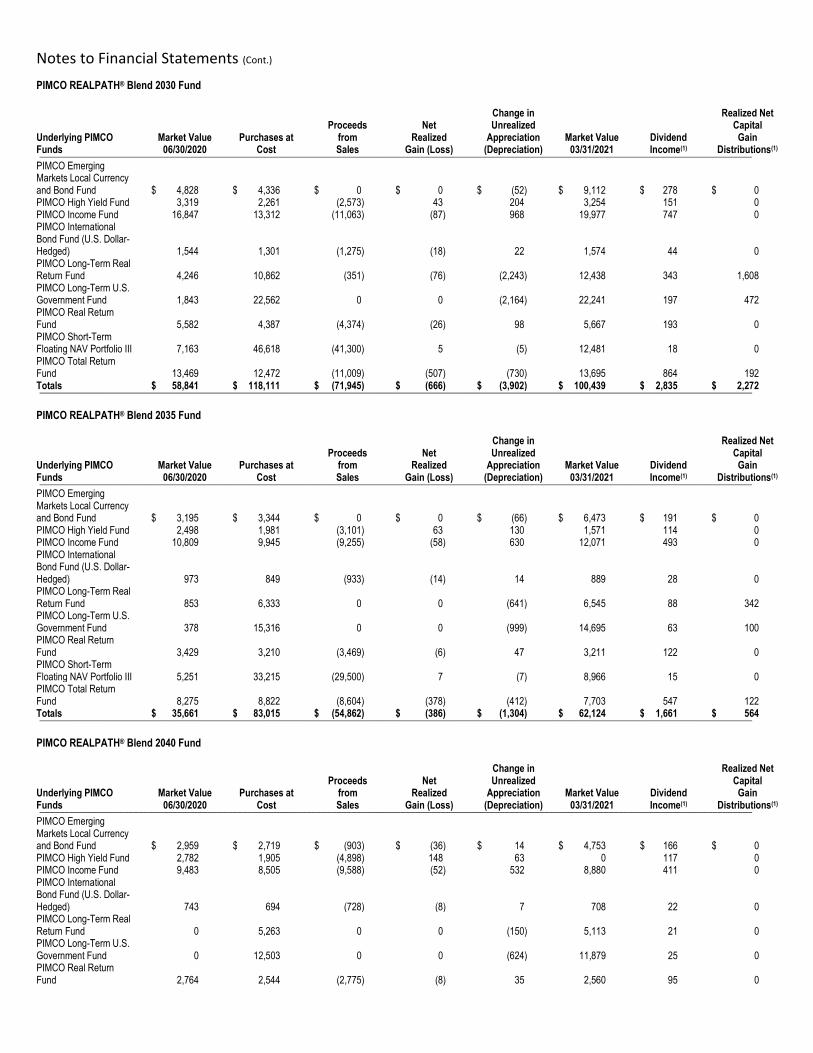
Notes to Financial Statements (Cont.)
PIMCO REALPATH® Blend 2030 Fund
Underlying PIMCO Funds
Market Value 06/30/2020
Purchases at Cost
Proceeds from Sales
Net Realized
Gain (Loss)
Change in Unrealized
Appreciation (Depreciation)
Market Value 03/31/2021
Dividend Income(1)
Realized Net Capital Gain
Distributions(1) ________________________________________________________________________________________________________________________________________________
PIMCO Emerging Markets Local Currency and Bond Fund $ 4,828 $ 4,336 $ 0 $ 0 $ (52) $ 9,112 $ 278 $ 0 PIMCO High Yield Fund 3,319 2,261 (2,573) 43 204 3,254 151 0 PIMCO Income Fund 16,847 13,312 (11,063) (87) 968 19,977 747 0 PIMCO International Bond Fund (U.S. Dollar-Hedged) 1,544 1,301 (1,275) (18) 22 1,574 44 0 PIMCO Long-Term Real Return Fund 4,246 10,862 (351) (76) (2,243) 12,438 343 1,608 PIMCO Long-Term U.S. Government Fund 1,843 22,562 0 0 (2,164) 22,241 197 472 PIMCO Real Return Fund 5,582 4,387 (4,374) (26) 98 5,667 193 0 PIMCO Short-Term Floating NAV Portfolio III 7,163 46,618 (41,300) 5 (5) 12,481 18 0 PIMCO Total Return Fund 13,469 12,472 (11,009) (507) (730) 13,695 864 192 Totals $ 58,841 $ 118,111 $ (71,945) $ (666) $ (3,902) $ 100,439 $ 2,835 $ 2,272 ________________________________________________________________________________________________________________________________________________
PIMCO REALPATH® Blend 2035 Fund
Underlying PIMCO Funds
Market Value 06/30/2020
Purchases at Cost
Proceeds from Sales
Net Realized
Gain (Loss)
Change in Unrealized
Appreciation (Depreciation)
Market Value 03/31/2021
Dividend Income(1)
Realized Net Capital Gain
Distributions(1) ________________________________________________________________________________________________________________________________________________
PIMCO Emerging Markets Local Currency and Bond Fund $ 3,195 $ 3,344 $ 0 $ 0 $ (66) $ 6,473 $ 191 $ 0 PIMCO High Yield Fund 2,498 1,981 (3,101) 63 130 1,571 114 0 PIMCO Income Fund 10,809 9,945 (9,255) (58) 630 12,071 493 0 PIMCO International Bond Fund (U.S. Dollar-Hedged) 973 849 (933) (14) 14 889 28 0 PIMCO Long-Term Real Return Fund 853 6,333 0 0 (641) 6,545 88 342 PIMCO Long-Term U.S. Government Fund 378 15,316 0 0 (999) 14,695 63 100 PIMCO Real Return Fund 3,429 3,210 (3,469) (6) 47 3,211 122 0 PIMCO Short-Term Floating NAV Portfolio III 5,251 33,215 (29,500) 7 (7) 8,966 15 0 PIMCO Total Return Fund 8,275 8,822 (8,604) (378) (412) 7,703 547 122 Totals $ 35,661 $ 83,015 $ (54,862) $ (386) $ (1,304) $ 62,124 $ 1,661 $ 564 ________________________________________________________________________________________________________________________________________________
PIMCO REALPATH® Blend 2040 Fund
Underlying PIMCO Funds
Market Value 06/30/2020
Purchases at Cost
Proceeds from Sales
Net Realized
Gain (Loss)
Change in Unrealized
Appreciation (Depreciation)
Market Value 03/31/2021
Dividend Income(1)
Realized Net Capital Gain
Distributions(1) ________________________________________________________________________________________________________________________________________________
PIMCO Emerging Markets Local Currency and Bond Fund $ 2,959 $ 2,719 $ (903) $ (36) $ 14 $ 4,753 $ 166 $ 0 PIMCO High Yield Fund 2,782 1,905 (4,898) 148 63 0 117 0 PIMCO Income Fund 9,483 8,505 (9,588) (52) 532 8,880 411 0 PIMCO International Bond Fund (U.S. Dollar-Hedged) 743 694 (728) (8) 7 708 22 0 PIMCO Long-Term Real Return Fund 0 5,263 0 0 (150) 5,113 21 0 PIMCO Long-Term U.S. Government Fund 0 12,503 0 0 (624) 11,879 25 0 PIMCO Real Return Fund 2,764 2,544 (2,775) (8) 35 2,560 95 0
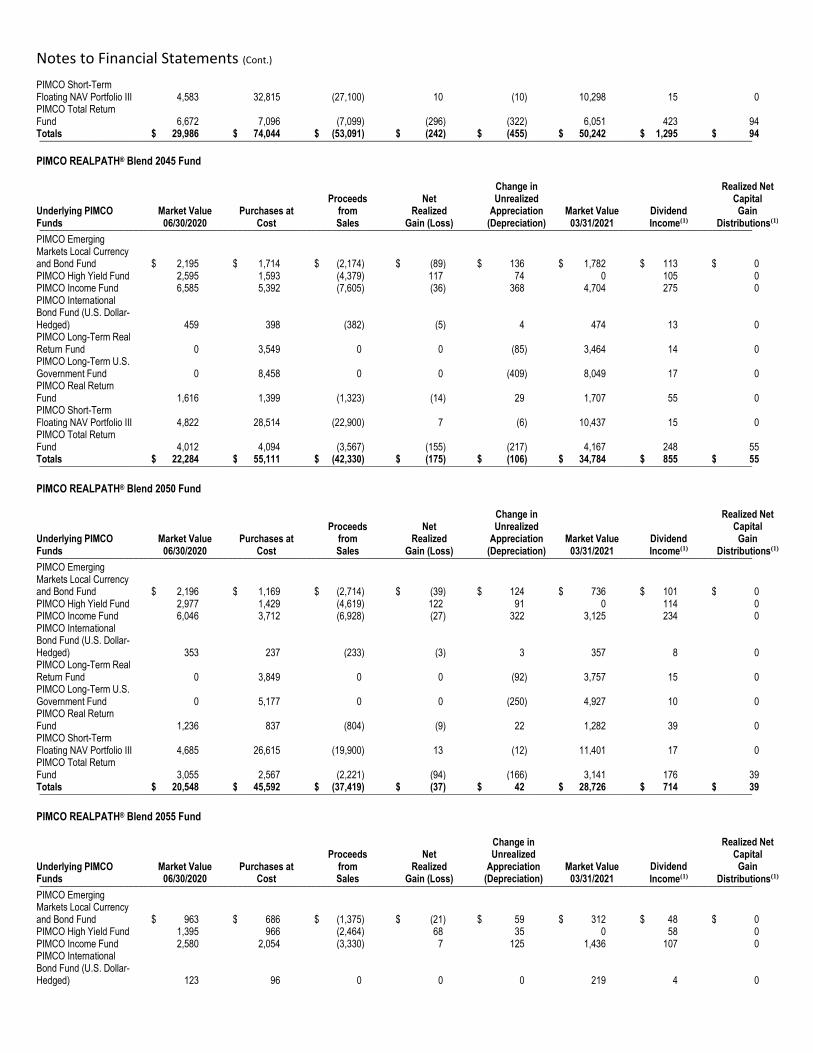
Notes to Financial Statements (Cont.)
PIMCO Short-Term Floating NAV Portfolio III 4,583 32,815 (27,100) 10 (10) 10,298 15 0 PIMCO Total Return Fund 6,672 7,096 (7,099) (296) (322) 6,051 423 94 Totals $ 29,986 $ 74,044 $ (53,091) $ (242) $ (455) $ 50,242 $ 1,295 $ 94 ________________________________________________________________________________________________________________________________________________
PIMCO REALPATH® Blend 2045 Fund
Underlying PIMCO Funds
Market Value 06/30/2020
Purchases at Cost
Proceeds from Sales
Net Realized
Gain (Loss)
Change in Unrealized
Appreciation (Depreciation)
Market Value 03/31/2021
Dividend Income(1)
Realized Net Capital Gain
Distributions(1) ________________________________________________________________________________________________________________________________________________
PIMCO Emerging Markets Local Currency and Bond Fund $ 2,195 $ 1,714 $ (2,174) $ (89) $ 136 $ 1,782 $ 113 $ 0 PIMCO High Yield Fund 2,595 1,593 (4,379) 117 74 0 105 0 PIMCO Income Fund 6,585 5,392 (7,605) (36) 368 4,704 275 0 PIMCO International Bond Fund (U.S. Dollar-Hedged) 459 398 (382) (5) 4 474 13 0 PIMCO Long-Term Real Return Fund 0 3,549 0 0 (85) 3,464 14 0 PIMCO Long-Term U.S. Government Fund 0 8,458 0 0 (409) 8,049 17 0 PIMCO Real Return Fund 1,616 1,399 (1,323) (14) 29 1,707 55 0 PIMCO Short-Term Floating NAV Portfolio III 4,822 28,514 (22,900) 7 (6) 10,437 15 0 PIMCO Total Return Fund 4,012 4,094 (3,567) (155) (217) 4,167 248 55 Totals $ 22,284 $ 55,111 $ (42,330) $ (175) $ (106) $ 34,784 $ 855 $ 55 ________________________________________________________________________________________________________________________________________________
PIMCO REALPATH® Blend 2050 Fund
Underlying PIMCO Funds
Market Value 06/30/2020
Purchases at Cost
Proceeds from Sales
Net Realized
Gain (Loss)
Change in Unrealized
Appreciation (Depreciation)
Market Value 03/31/2021
Dividend Income(1)
Realized Net Capital Gain
Distributions(1) ________________________________________________________________________________________________________________________________________________
PIMCO Emerging Markets Local Currency and Bond Fund $ 2,196 $ 1,169 $ (2,714) $ (39) $ 124 $ 736 $ 101 $ 0 PIMCO High Yield Fund 2,977 1,429 (4,619) 122 91 0 114 0 PIMCO Income Fund 6,046 3,712 (6,928) (27) 322 3,125 234 0 PIMCO International Bond Fund (U.S. Dollar-Hedged) 353 237 (233) (3) 3 357 8 0 PIMCO Long-Term Real Return Fund 0 3,849 0 0 (92) 3,757 15 0 PIMCO Long-Term U.S. Government Fund 0 5,177 0 0 (250) 4,927 10 0 PIMCO Real Return Fund 1,236 837 (804) (9) 22 1,282 39 0 PIMCO Short-Term Floating NAV Portfolio III 4,685 26,615 (19,900) 13 (12) 11,401 17 0 PIMCO Total Return Fund 3,055 2,567 (2,221) (94) (166) 3,141 176 39 Totals $ 20,548 $ 45,592 $ (37,419) $ (37) $ 42 $ 28,726 $ 714 $ 39 ________________________________________________________________________________________________________________________________________________
PIMCO REALPATH® Blend 2055 Fund
Underlying PIMCO Funds
Market Value 06/30/2020
Purchases at Cost
Proceeds from Sales
Net Realized
Gain (Loss)
Change in Unrealized
Appreciation (Depreciation)
Market Value 03/31/2021
Dividend Income(1)
Realized Net Capital Gain
Distributions(1) ________________________________________________________________________________________________________________________________________________
PIMCO Emerging Markets Local Currency and Bond Fund $ 963 $ 686 $ (1,375) $ (21) $ 59 $ 312 $ 48 $ 0 PIMCO High Yield Fund 1,395 966 (2,464) 68 35 0 58 0 PIMCO Income Fund 2,580 2,054 (3,330) 7 125 1,436 107 0 PIMCO International Bond Fund (U.S. Dollar-Hedged) 123 96 0 0 0 219 4 0
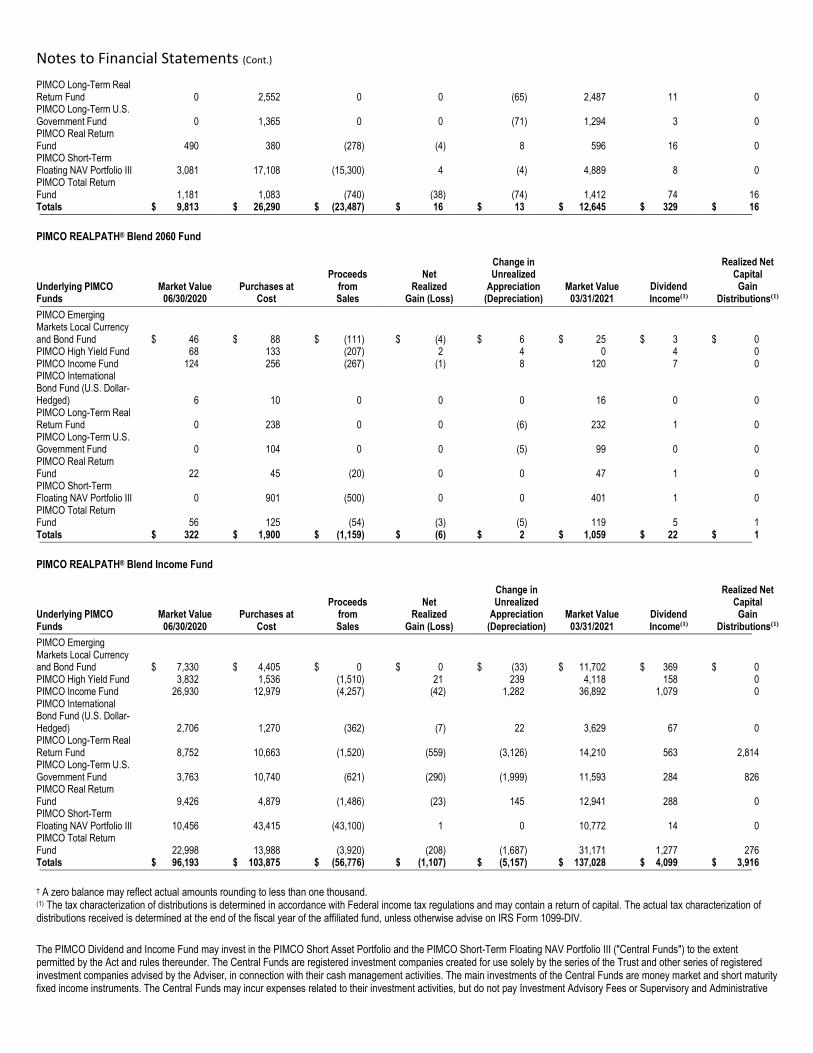
Notes to Financial Statements (Cont.)
PIMCO Long-Term Real Return Fund 0 2,552 0 0 (65) 2,487 11 0 PIMCO Long-Term U.S. Government Fund 0 1,365 0 0 (71) 1,294 3 0 PIMCO Real Return Fund 490 380 (278) (4) 8 596 16 0 PIMCO Short-Term Floating NAV Portfolio III 3,081 17,108 (15,300) 4 (4) 4,889 8 0 PIMCO Total Return Fund 1,181 1,083 (740) (38) (74) 1,412 74 16 Totals $ 9,813 $ 26,290 $ (23,487) $ 16 $ 13 $ 12,645 $ 329 $ 16 ________________________________________________________________________________________________________________________________________________
PIMCO REALPATH® Blend 2060 Fund
Underlying PIMCO Funds
Market Value 06/30/2020
Purchases at Cost
Proceeds from Sales
Net Realized
Gain (Loss)
Change in Unrealized
Appreciation (Depreciation)
Market Value 03/31/2021
Dividend Income(1)
Realized Net Capital Gain
Distributions(1) ________________________________________________________________________________________________________________________________________________
PIMCO Emerging Markets Local Currency and Bond Fund $ 46 $ 88 $ (111) $ (4) $ 6 $ 25 $ 3 $ 0 PIMCO High Yield Fund 68 133 (207) 2 4 0 4 0 PIMCO Income Fund 124 256 (267) (1) 8 120 7 0 PIMCO International Bond Fund (U.S. Dollar-Hedged) 6 10 0 0 0 16 0 0 PIMCO Long-Term Real Return Fund 0 238 0 0 (6) 232 1 0 PIMCO Long-Term U.S. Government Fund 0 104 0 0 (5) 99 0 0 PIMCO Real Return Fund 22 45 (20) 0 0 47 1 0 PIMCO Short-Term Floating NAV Portfolio III 0 901 (500) 0 0 401 1 0 PIMCO Total Return Fund 56 125 (54) (3) (5) 119 5 1 Totals $ 322 $ 1,900 $ (1,159) $ (6) $ 2 $ 1,059 $ 22 $ 1 ________________________________________________________________________________________________________________________________________________
PIMCO REALPATH® Blend Income Fund
Underlying PIMCO Funds
Market Value 06/30/2020
Purchases at Cost
Proceeds from Sales
Net Realized
Gain (Loss)
Change in Unrealized
Appreciation (Depreciation)
Market Value 03/31/2021
Dividend Income(1)
Realized Net Capital Gain
Distributions(1) ________________________________________________________________________________________________________________________________________________
PIMCO Emerging Markets Local Currency and Bond Fund $ 7,330 $ 4,405 $ 0 $ 0 $ (33) $ 11,702 $ 369 $ 0 PIMCO High Yield Fund 3,832 1,536 (1,510) 21 239 4,118 158 0 PIMCO Income Fund 26,930 12,979 (4,257) (42) 1,282 36,892 1,079 0 PIMCO International Bond Fund (U.S. Dollar-Hedged) 2,706 1,270 (362) (7) 22 3,629 67 0 PIMCO Long-Term Real Return Fund 8,752 10,663 (1,520) (559) (3,126) 14,210 563 2,814 PIMCO Long-Term U.S. Government Fund 3,763 10,740 (621) (290) (1,999) 11,593 284 826 PIMCO Real Return Fund 9,426 4,879 (1,486) (23) 145 12,941 288 0 PIMCO Short-Term Floating NAV Portfolio III 10,456 43,415 (43,100) 1 0 10,772 14 0 PIMCO Total Return Fund 22,998 13,988 (3,920) (208) (1,687) 31,171 1,277 276 Totals $ 96,193 $ 103,875 $ (56,776) $ (1,107) $ (5,157) $ 137,028 $ 4,099 $ 3,916 ________________________________________________________________________________________________________________________________________________
† A zero balance may reflect actual amounts rounding to less than one thousand. (1) The tax characterization of distributions is determined in accordance with Federal income tax regulations and may contain a return of capital. The actual tax characterization of distributions received is determined at the end of the fiscal year of the affiliated fund, unless otherwise advise on IRS Form 1099-DIV.
The PIMCO Dividend and Income Fund may invest in the PIMCO Short Asset Portfolio and the PIMCO Short-Term Floating NAV Portfolio III ("Central Funds") to the extent permitted by the Act and rules thereunder. The Central Funds are registered investment companies created for use solely by the series of the Trust and other series of registered investment companies advised by the Adviser, in connection with their cash management activities. The main investments of the Central Funds are money market and short maturity fixed income instruments. The Central Funds may incur expenses related to their investment activities, but do not pay Investment Advisory Fees or Supervisory and Administrative
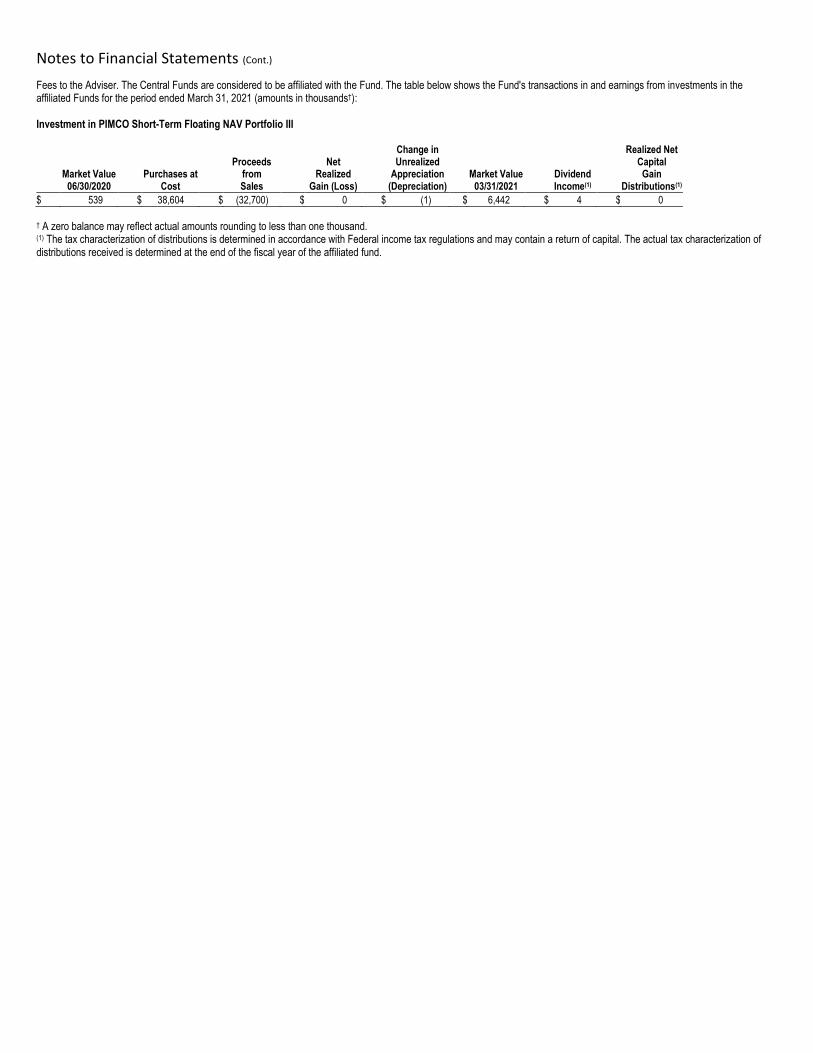
Notes to Financial Statements (Cont.)
Fees to the Adviser. The Central Funds are considered to be affiliated with the Fund. The table below shows the Fund's transactions in and earnings from investments in the affiliated Funds for the period ended March 31, 2021 (amounts in thousands†): Investment in PIMCO Short-Term Floating NAV Portfolio III
Market Value
06/30/2020 Purchases at
Cost
Proceeds from Sales
Net Realized
Gain (Loss)
Change in Unrealized
Appreciation (Depreciation)
Market Value 03/31/2021
Dividend Income(1)
Realized Net Capital Gain
Distributions(1)
$ 539 $ 38,604 $ (32,700) $ 0 $ (1) $ 6,442 $ 4 $ 0
† A zero balance may reflect actual amounts rounding to less than one thousand. (1) The tax characterization of distributions is determined in accordance with Federal income tax regulations and may contain a return of capital. The actual tax characterization of distributions received is determined at the end of the fiscal year of the affiliated fund.
Glossary: (abbreviations that may be used in the preceding statements) (Unaudited)
Counterparty Abbreviations:
AZD Australia and New Zealand Banking Group GLM Goldman Sachs Bank USA MYI Morgan Stanley & Co. International PLCBOA Bank of America N.A. GST Goldman Sachs International RBC Royal Bank of CanadaBPS BNP Paribas S.A. HUS HSBC Bank USA N.A. RYL NatWest Markets Plc
BRC Barclays Bank PLC INDCrédit Agricole Corporate and Investment Bank S.A. SCX Standard Chartered Bank, London
CBK Citibank N.A. JPM JP Morgan Chase Bank N.A. SSB State Street Bank and Trust Co.DUB Deutsche Bank AG JPS J.P. Morgan Securities LLC TDM TD Securities (USA) LLCFBF Credit Suisse International MYC Morgan Stanley Capital Services LLC UAG UBS AG StamfordFICC Fixed Income Clearing Corporation
Currency Abbreviations:ARS Argentine Peso DKK Danish Krone NOK Norwegian KroneAUD Australian Dollar EUR Euro PEN Peruvian New SolBRL Brazilian Real GBP British Pound RUB Russian RubleCAD Canadian Dollar HKD Hong Kong Dollar SEK Swedish KronaCHF Swiss Franc IDR Indonesian Rupiah TRY Turkish New LiraCLP Chilean Peso INR Indian Rupee USD (or $) United States DollarCNH Chinese Renminbi (Offshore) JPY Japanese Yen ZAR South African RandCNY Chinese Renminbi (Mainland) MXN Mexican Peso
Exchange Abbreviations:CBOE Chicago Board Options Exchange OTC Over the Counter
Index/Spread Abbreviations:
ARPPPAArgentina Passive 7 Day Reverse Repurchase Agreement Rate CDX.IG Credit Derivatives Index - Investment Grade PRIME Daily US Prime Rate
BADLARPP Argentina Badlar Floating Rate Notes CMBX Commercial Mortgage-Backed Index S&P 500 Standard & Poor's 500 IndexBP0003M 3 Month GBP-LIBOR CNREPOFIX China Fixing Repo Rates 7-Day SONIO Sterling Overnight Interbank Average Rate
CDX.EM Credit Derivatives Index - Emerging Markets FNRETR FTSE Nareit Equity REITs Total Return Index US0003M ICE 3-Month USD LIBOR
CDX.HY Credit Derivatives Index - High Yield LIBOR03M 3 Month USD-LIBOR
Other Abbreviations:ABS Asset-Backed Security EURIBOR Euro Interbank Offered Rate PJSC Public Joint Stock CompanyADR American Depositary Receipt GDR Global Depositary Receipt REIT Real Estate Investment TrustBABs Build America Bonds JIBAR Johannesburg Interbank Agreed Rate SP - ADR Sponsored American Depositary ReceiptBBR Bank Bill Rate LIBOR London Interbank Offered Rate TBA To-Be-Announced
BBSW Bank Bill Swap Reference Rate LunarMonthly payment based on 28-day periods. One year consists of 13 periods. TBD To-Be-Determined
BTPBuoni del Tesoro Poliennali "Long-term Treasury Bond" NVDR Non-Voting Depositary Receipt TBD%
Interest rate to be determined when loan settles or at the time of funding
CDI Brazil Interbank Deposit Rate OIS Overnight Index Swap TIIETasa de Interés Interbancaria de Equilibrio "Equilibrium Interbank Interest Rate"
CLO Collateralized Loan Obligation PIK Payment-in-Kind
pimco.com
A word about risk: All investments contain risk and may lose value. Investing in the bond market is subject to risks, including market, interest rate,issuer, credit, inflation risk, and liquidity risk. The value of most bonds and bond strategies are impacted by changes in interest rates. Bonds and bondstrategies with longer durations tend to be more sensitive and volatile than those with shorter durations; bond prices generally fall as interest rates rise,and the current low interest rate environment increases this risk. Current reductions in bond counterparty capacity may contribute to decreased marketliquidity and increased price volatility. Bond investments may be worth more or less than the original cost when redeemed. Investing in foreign denominatedand/or domiciled securities may involve heightened risk due to currency fluctuations, and economic and political risks, which may be enhanced in emergingmarkets. Mortgage and asset-backed securities may be sensitive to changes in interest rates, subject to early repayment risk, and their value may fluctuatein response to the market’s perception of issuer creditworthiness; while generally supported by some form of government or private guarantee there is noassurance that private guarantors will meet their obligations. Equities may decline in value due to both real and perceived general market, economic, andindustry conditions. Derivatives may involve certain costs and risks such as liquidity, interest rate, market, credit, management and the risk that aposition could not be closed when most advantageous. Investing in derivatives could lose more than the amount invested. Please refer to the Fund’s prospectusfor a complete overview of the primary risks associated with the Fund.
Holdings are subject to change without notice and may not be representative of current or future allocations.
The geographical classification of foreign securities in this report are classified by the country of incorporation of a holding. In certain instances, asecurity’s country of incorporation may be different from its country of economic exposure.
This material has been distributed for informational purposes only and should not be considered as investment advice or a recommendation of any particularsecurity, strategy or investment product. No part of this material may be reproduced in any form, or referred to in any other publication, without expresswritten permission. PIMCO is a trademark of Allianz Asset Management of America L.P. in the United States and throughout the world. ©2020, PIMCO.
PIMCO Investments LLC, distributor, 1633 Broadway, New York, NY 10019, is a company of PIMCO.
Related Documents