Final Report for NASA Langley Cooperative Agreement: #NNL06-AA04A Piloted Simulation Study of Rudder Pedal Force/Feel Characteristics Ronald A. Hess Dept. of Mechanical and Aeronautical Engineering University of California Davis, CA 95616-5294 Abstract A piloted, fixed-base simulation was conducted in 2006 to determine optimum rudder pedal force/feel characteristics for transport aircraft. As part of this research, an evaluation of four metrics for assessing rudder pedal characteristics previously presented in the literature was conducted. This evaluation was based upon the numerical handling qualities ratings assigned to a variety of pedal force/feel systems used in the simulation study. It is shown that, with the inclusion of a fifth metric, most of the rudder pedal force/feel system designs that were rated poorly by the evaluation pilots could be identified. It is suggested that these metrics form the basis of a certification requirement for transport aircraft. I. Background The crash of American Airlines Flight 587 in November of 2001 led to a recommendation by the National Transportation Safety Board (NTSB) in October of 2004 to “Modify 14 Code of Federal Regulations Part 25 to include a certification standard that will ensure safe handling qualities in the yaw axis throughout the flight envelope, including limits for rudder pedal sensitivity” [1]. This recommendation was issued to the Federal Aviation Administration (FAA). Unfortunately, no adequate data- base currently exists for determining such a certification standard. To begin establishing such a data-base, a piloted simulation study was conducted using the Integrated Flight Deck (IFD) simulator at NASA Langley Research Center. The characteristics of the rudder control system were examined in systematic detail. A preliminary discussion of the simulation results was presented in [2]. Reference [3] suggested four metrics for assessing the safety of rudder pedal force/feel systems in transport aircraft: (1) A maximum value of required pedal force. (2) A minimum value of a linearity index (LI) when applied pedal force is plotted vs pedal deflection in quasi-static fashion. Pedal forces and deflections from trim to maximum values are employed. (3) A minimum value of the linearity index when applied pedal force is plotted vs rudder deflection. The pedal force is a sinusoid yielding maximum pedal 1 https://ntrs.nasa.gov/search.jsp?R=20070018161 2018-07-30T23:31:08+00:00Z

Welcome message from author
This document is posted to help you gain knowledge. Please leave a comment to let me know what you think about it! Share it to your friends and learn new things together.
Transcript
Final Report for NASA Langley Cooperative Agreement: #NNL06-AA04A
Piloted Simulation Study of Rudder Pedal Force/Feel Characteristics
Ronald A. Hess
Dept. of Mechanical and Aeronautical Engineering University of California Davis, CA 95616-5294
Abstract
A piloted, fixed-base simulation was conducted in 2006 to determine optimum rudder pedal force/feel characteristics for transport aircraft. As part of this research, an evaluation of four metrics for assessing rudder pedal characteristics previously presented in the literature was conducted. This evaluation was based upon the numerical handling qualities ratings assigned to a variety of pedal force/feel systems used in the simulation study. It is shown that, with the inclusion of a fifth metric, most of the rudder pedal force/feel system designs that were rated poorly by the evaluation pilots could be identified. It is suggested that these metrics form the basis of a certification requirement for transport aircraft.
I. Background The crash of American Airlines Flight 587 in November of 2001 led to a recommendation by the National Transportation Safety Board (NTSB) in October of 2004 to “Modify 14 Code of Federal Regulations Part 25 to include a certification standard that will ensure safe handling qualities in the yaw axis throughout the flight envelope, including limits for rudder pedal sensitivity” [1]. This recommendation was issued to the Federal Aviation Administration (FAA). Unfortunately, no adequate data-base currently exists for determining such a certification standard. To begin establishing such a data-base, a piloted simulation study was conducted using the Integrated Flight Deck (IFD) simulator at NASA Langley Research Center. The characteristics of the rudder control system were examined in systematic detail. A preliminary discussion of the simulation results was presented in [2]. Reference [3] suggested four metrics for assessing the safety of rudder pedal force/feel systems in transport aircraft: (1) A maximum value of required pedal force.
(2) A minimum value of a linearity index (LI) when applied pedal force is plotted vs pedal deflection in quasi-static fashion. Pedal forces and deflections from trim to maximum values are employed.
(3) A minimum value of the linearity index when applied pedal force is plotted vs
rudder deflection. The pedal force is a sinusoid yielding maximum pedal
1
https://ntrs.nasa.gov/search.jsp?R=20070018161 2018-07-30T23:31:08+00:00Z
deflection at a frequency equal to the maximum dutch-roll mode natural frequency in evidence across the flight envelope.
(4) A maximum value of g’s of lateral acceleration at the cockpit per pound of pedal
force beyond breakout evaluated at a flight condition of maximum dynamic pressure.
Figure 1 and Eq. 1 define the simplified linearity index to be used in evaluating metrics (1) and (2) above. Initial estimates for each of the metric values are:
(1) maximum required pedal force = 100 lbf (2) LI > 0.7 (3) LI > 0.6 (4) cockpit lateral acceleration < 0.005 g’s/lbf.
II. Force/Feel Characteristics Evaluated in Piloted Simulation
Figure 1 A Linearity Index from [3].
)HEBFH(area
)GBCG(area)HABH(area1LI +−= (1)
In order, each of the metrics addresses a specific design issue in rudder pedal force/feel systems, including rudder actuators. Metric (1) suggests maximum required pedal forces based upon anthropometric data for males and females discussed in [3]. Metric (2) is based upon a pilot/vehicle analysis that suggested that highly nonlinear force/feel characteristics may lead to poor response predictability and tracking performance [4]. Metric (3) carries the linearity concept to the control loop from applied pedal force to rudder position, thus encompassing the dynamics of the force/feel characteristics and rudder actuator at a frequency that may be in evidence in lateral-directional control.
2
la1066tz
Rectangle

Finally, metric (4) addresses the issue of control sensitivity in terms of accelerations, a measure that has long been used in pilot-induced oscillation (PIO) studies, e.g. [5]. It should be emphasized that the focus of this report is different than that discussed in [2], where optimum force/feel characteristics were sought. The emphasis here is directed to flagging systems that may be unsafe, as opposed to those that optimize handling qualities.
III. Simulation Details of the experimental protocol can be found in [2] and will only be described briefly here. The aircraft simulated was a twin engine, medium sized transport. The task was a landing approach in crosswind and random turbulence. Severe lateral wind shear was introduced at heights ranging from 100 to 150 ft above ground level. No go-around or landing was allowed. The pilots were requested to track the runway centerline at 50 ft above ground level. Six different lateral windshear scenarios were presented varying in magnitude and direction. Twelve line pilots participated in the study, 7 males and 5 females.
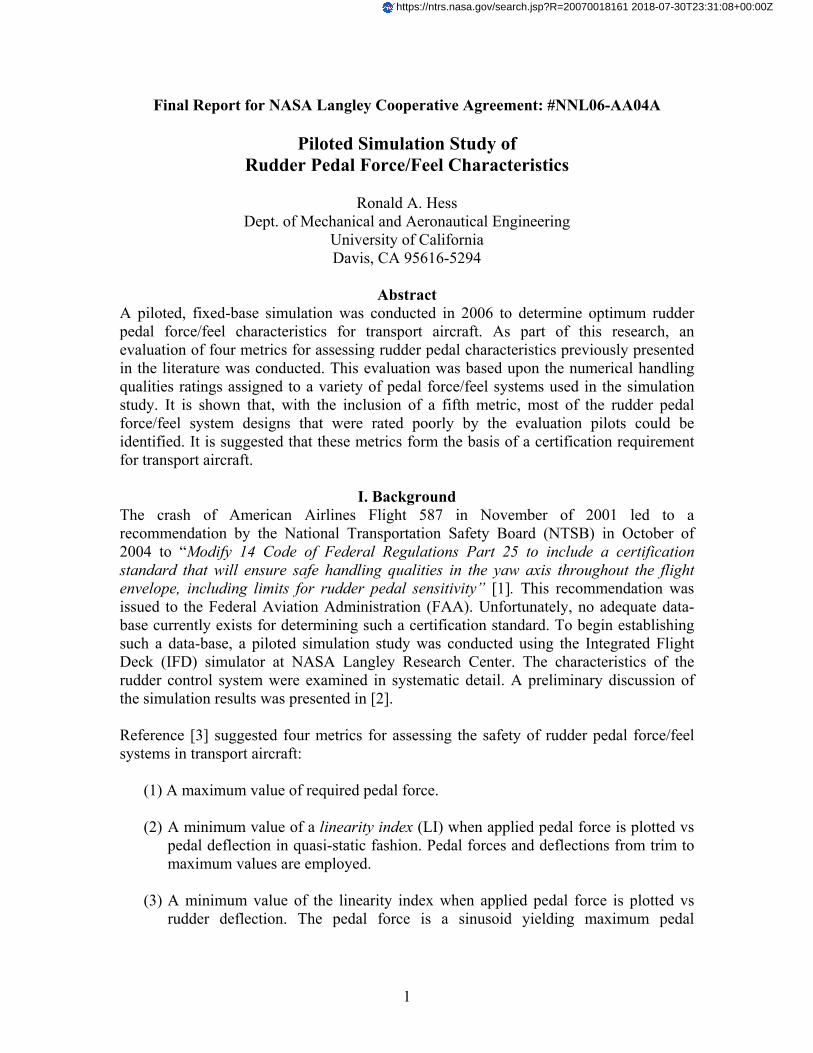
IV. Analysis Approach The analysis to be presented was not the main thrust of the simulation study summarized in [2]. Here, the metrics of the previous section will be used to delineate “safe” from possibly “unsafe” designs, where “safe” and “unsafe” categories will be assigned on the basis of the average pilot opinion ratings that each configuration received. It should be noted that, although metric (4) is intended to be applied at a flight condition of maximum dynamic pressure, it was applied here to the flight condition of the simulation, i.e., landing approach. The 15 different force/feel configurations used in the piloted simulation study are summarized in Table 1. The friction force was kept constant at 1 lbf for all configurations. The damping was 1 lbf/inch/sec. Generation of metrics (2)-(4) was completed off-line using a simple Simulink computer model of the force/feel system, actuator, and a base-line measure of lateral acceleration per pound of pedal force beyond breakout. Figure 2 shows the Simulink model. Figure 3 shows a typical, quasi-static pedal force/displacement plot, here for Config. 1.
3

Figure 2 The Simulink model for metric generation
Table 1. Force/Feel System Characteristics Simulated
Configuration Breakout Force Maximum Force Maximum Displacement (lbf) (lbf) (inches)
1 26.5 90 1 2 9.7 47.1 1.43 3 43.3 47.1 1.43 4 9.7 132.9 1.43 5 43.3 132.9 1.43 6 26.5 30 2.5 7 3.0 90 2.5
8-111 26.5 90 2.5 12 50 90 2.5 13 26.5 150 2.5 14 9.7 47.1 3.57 15 43.3 47.1 3.57 16 9.7 132.9 3.57 17 43.3 132.9 3.57 18 26.5 90 4
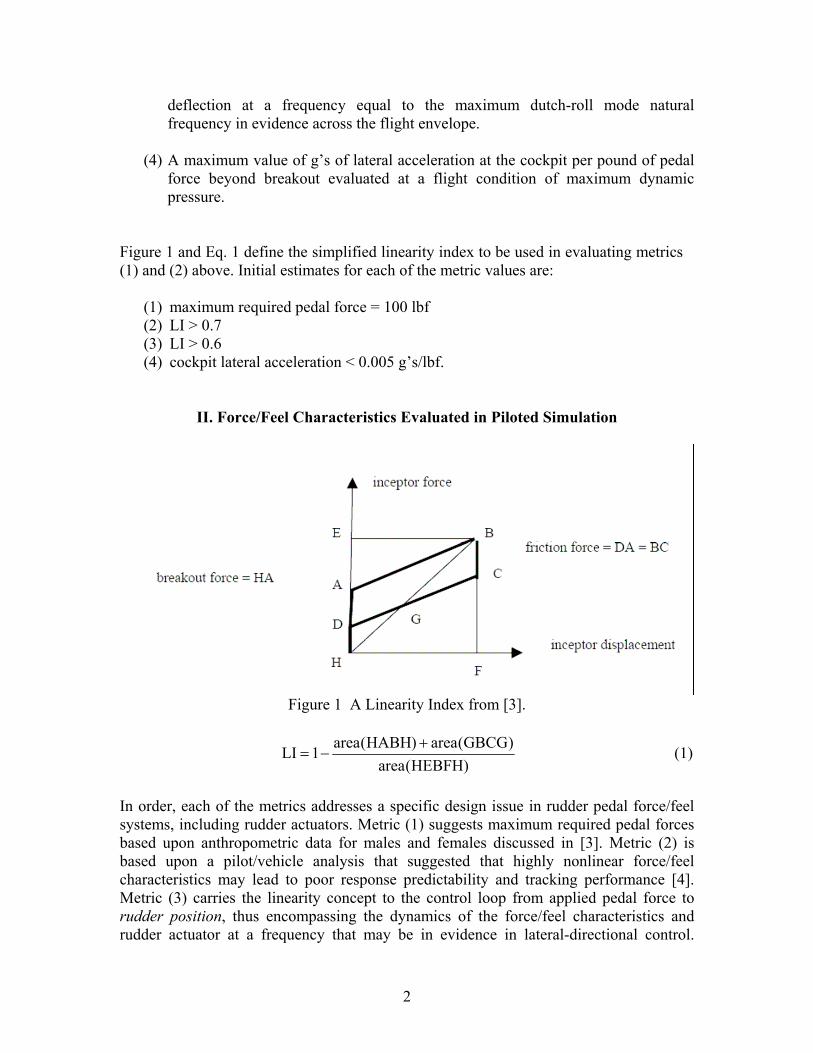
Quasi-static pedal force/displacement plots for each of the 15 configurations are included in the Appendix. Figure 4 shows the dynamic pedal force/rudder displacement plot for Config. 1. Dynamic pedal force/rudder displacement plots for each
4
1 Configurations 8 – 11 were identical and were included in the experimental protocol for the purposes of assessing repeatability in ratings.
la1066tz
Rectangle
Figure 3 Quasi-static pedal force/displacement plot for Config. 1
Figure 4 Dynamic pedal force/rudder displacement plot for Config. 1
of the 15 configurations are also included in the Appendix. The aircraft dutch-roll natural frequency, necessary for calculating metric (3), was obtained directly from the simulation, by applying a pulsive rudder pedal input, and then calculating the natural frequency of the roll-rate response after the rudder inputs were removed. The yaw damper was inoperative in this test. Figure 5 shows one of the plots used to determine the dutch-roll natural frequency of 0.905 rad/sec.
5
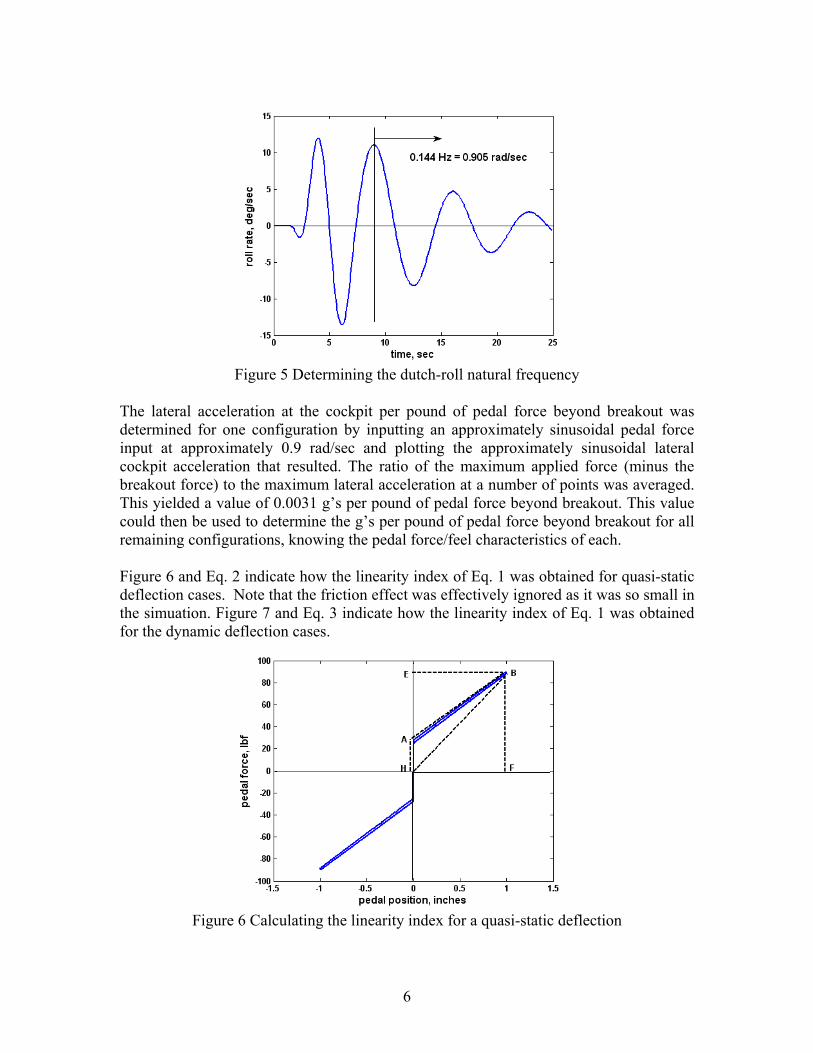
Figure 5 Determining the dutch-roll natural frequency
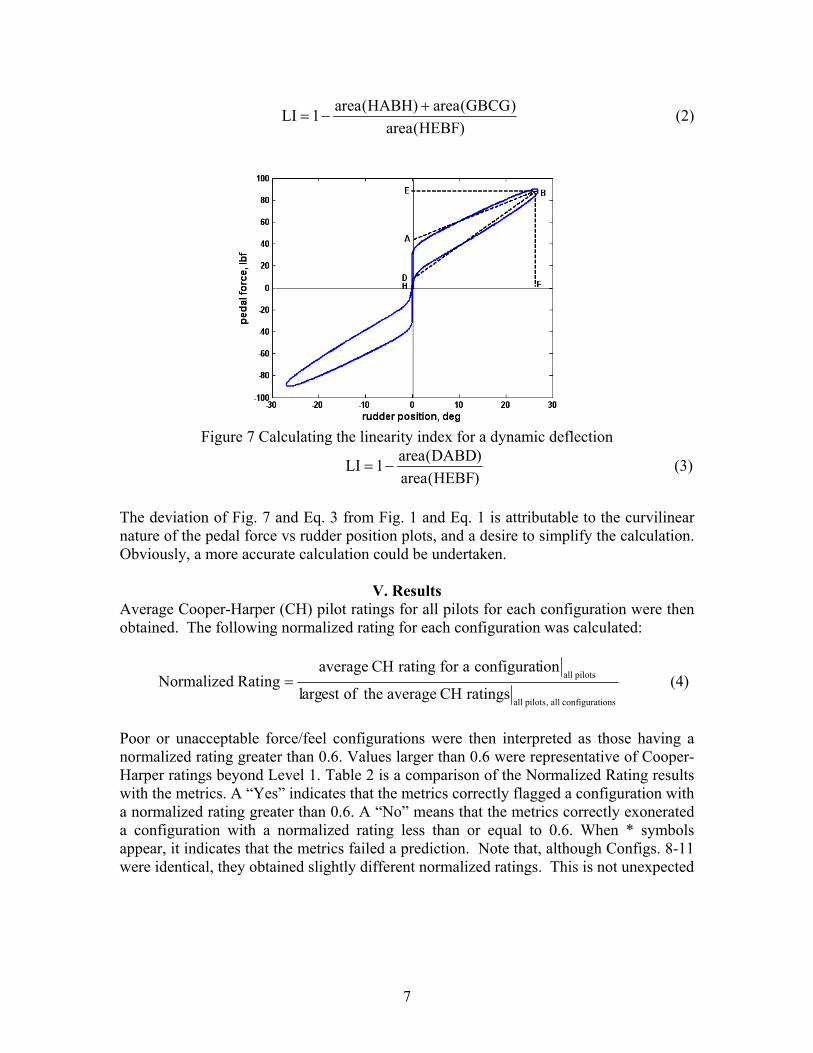
The lateral acceleration at the cockpit per pound of pedal force beyond breakout was determined for one configuration by inputting an approximately sinusoidal pedal force input at approximately 0.9 rad/sec and plotting the approximately sinusoidal lateral cockpit acceleration that resulted. The ratio of the maximum applied force (minus the breakout force) to the maximum lateral acceleration at a number of points was averaged. This yielded a value of 0.0031 g’s per pound of pedal force beyond breakout. This value could then be used to determine the g’s per pound of pedal force beyond breakout for all remaining configurations, knowing the pedal force/feel characteristics of each. Figure 6 and Eq. 2 indicate how the linearity index of Eq. 1 was obtained for quasi-static deflection cases. Note that the friction effect was effectively ignored as it was so small in the simuation. Figure 7 and Eq. 3 indicate how the linearity index of Eq. 1 was obtained for the dynamic deflection cases.
Figure 6 Calculating the linearity index for a quasi-static deflection
6
)HEBF(area
)GBCG(area)HABH(area1LI +−= (2)
Figure 7 Calculating the linearity index for a dynamic deflection
)HEBF(area)DABD(area1−=LI (3)
The deviation of Fig. 7 and Eq. 3 from Fig. 1 and Eq. 1 is attributable to the curvilinear nature of the pedal force vs rudder position plots, and a desire to simplify the calculation. Obviously, a more accurate calculation could be undertaken.
V. Results Average Cooper-Harper (CH) pilot ratings for all pilots for each configuration were then obtained. The following normalized rating for each configuration was calculated:
ionsconfiguratall,pilotsall
pilotsall
ratingsCHaveragetheofestargl
ionconfigurataforratingCHaverageRatingNormalized = (4)
Poor or unacceptable force/feel configurations were then interpreted as those having a normalized rating greater than 0.6. Values larger than 0.6 were representative of Cooper-Harper ratings beyond Level 1. Table 2 is a comparison of the Normalized Rating results with the metrics. A “Yes” indicates that the metrics correctly flagged a configuration with a normalized rating greater than 0.6. A “No” means that the metrics correctly exonerated a configuration with a normalized rating less than or equal to 0.6. When * symbols appear, it indicates that the metrics failed a prediction. Note that, although Configs. 8-11 were identical, they obtained slightly different normalized ratings. This is not unexpected
7
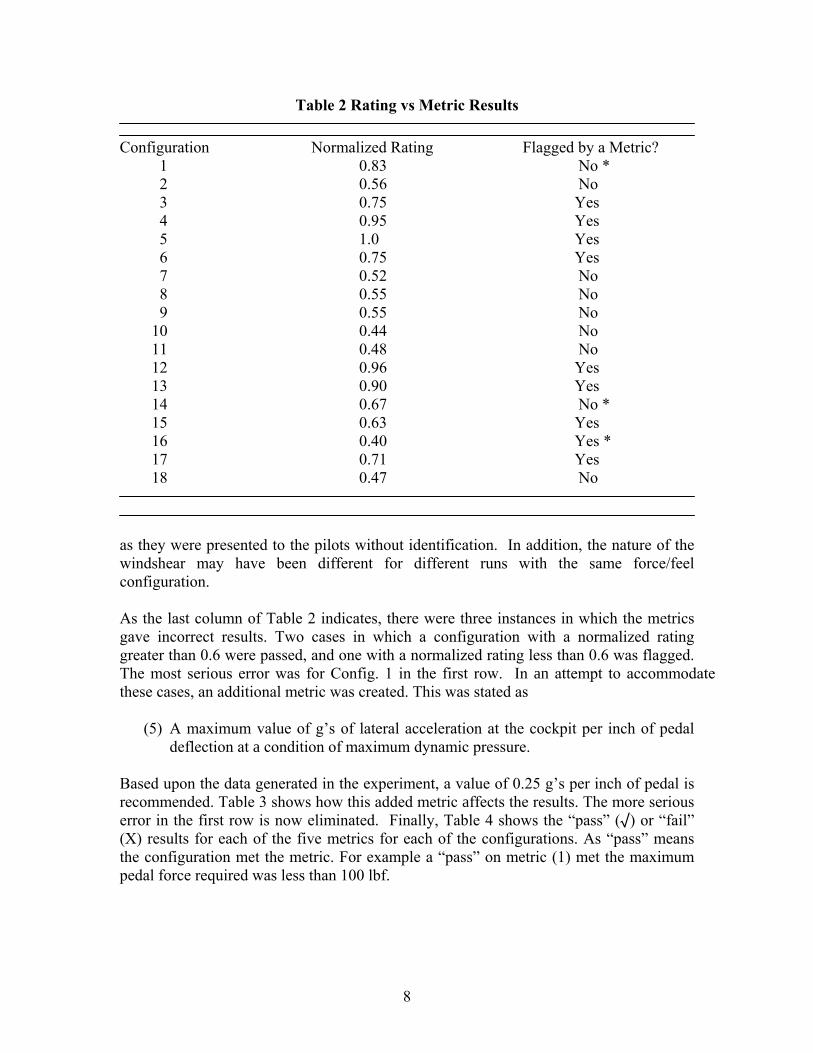
Table 2 Rating vs Metric Results
Configuration Normalized Rating Flagged by a Metric? 1 0.83 No * 2 0.56 No 3 0.75 Yes 4 0.95 Yes 5 1.0 Yes 6 0.75 Yes 7 0.52 No 8 0.55 No 9 0.55 No 10 0.44 No 11 0.48 No 12 0.96 Yes 13 0.90 Yes 14 0.67 No * 15 0.63 Yes 16 0.40 Yes * 17 0.71 Yes 18 0.47 No
as they were presented to the pilots without identification. In addition, the nature of the windshear may have been different for different runs with the same force/feel configuration. As the last column of Table 2 indicates, there were three instances in which the metrics gave incorrect results. Two cases in which a configuration with a normalized rating greater than 0.6 were passed, and one with a normalized rating less than 0.6 was flagged. The most serious error was for Config. 1 in the first row. In an attempt to accommodate these cases, an additional metric was created. This was stated as
(5) A maximum value of g’s of lateral acceleration at the cockpit per inch of pedal deflection at a condition of maximum dynamic pressure.
Based upon the data generated in the experiment, a value of 0.25 g’s per inch of pedal is recommended. Table 3 shows how this added metric affects the results. The more serious error in the first row is now eliminated. Finally, Table 4 shows the “pass” (√) or “fail” (X) results for each of the five metrics for each of the configurations. As “pass” means the configuration met the metric. For example a “pass” on metric (1) met the maximum pedal force required was less than 100 lbf.
8

Table 3 Rating vs Modified Metric Results
Configuration Normalized Rating Metric Fl ag?
17 0.71 Yes 18 0.47 No
s
1 0.83 Yes 2 0.56 No 3 0.75 Yes 4 0.95 Yes 5 1.0 Yes 6 0.75 Yes 7 0.52 No 8 0.55 No 9 0.55 No 10 0.44 No 11 0.48 No 12 0.96 Yes 13 0.90 Yes 14 0.67 No * 15 0.63 Yes 16 0.40 Yes *
Table 4 Metric Pass/Fail Result
Metric Configuration 1 2 3 4 5 1 √ √ √ √ X
1
17 X √ √ √ √ 18 √ √ √ √ √
2 √ √ √ √ √ 3 √ X X X √ 4 X √ √ √ X 5 X √ √ √ X 6 √ X X X √ 7 √ √ √ √ √ 8-1 √ √ √ √ √ 12 √ X √ √ √ 13 √ X √ √ √ 14 √ √ √ √ √ 15 √ X X X √ 16 X √ √ √ √
9
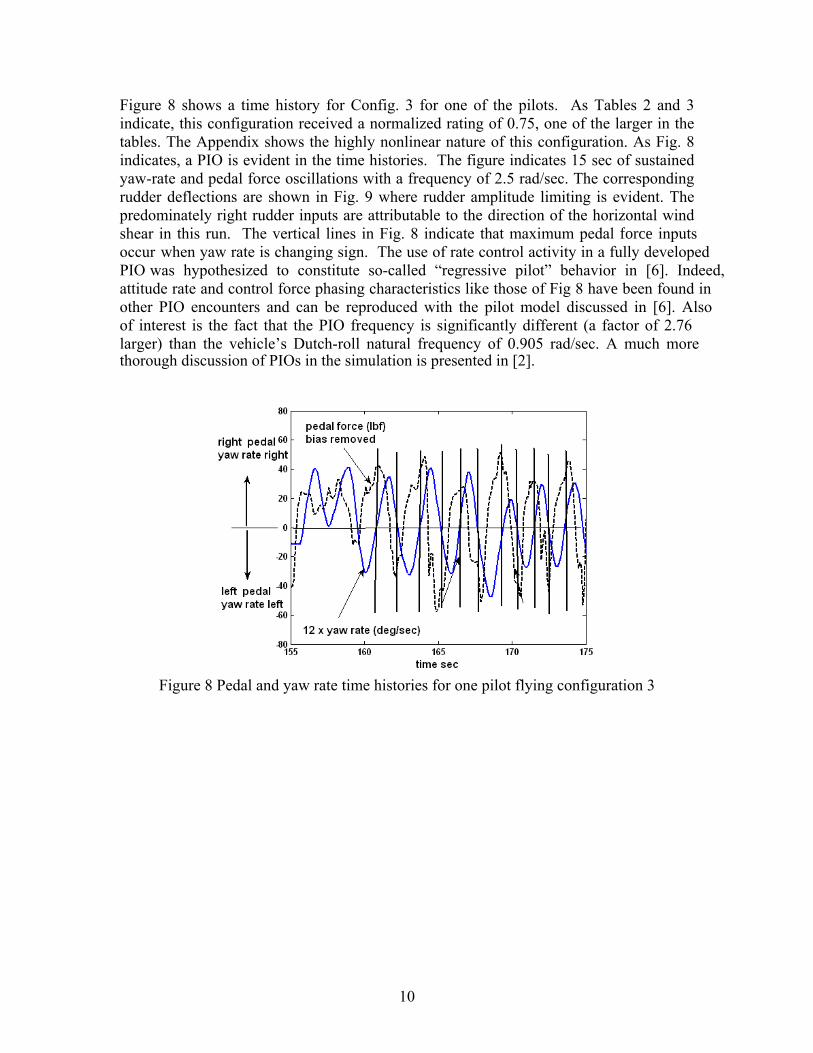
Figure 8 shows a time history for Config. 3 for one of the pilots. As Tables 2 and 3 indicate, this configuration received a normalized rating of 0.75, one of the larger in the tables. The Appendix shows the highly nonlinear nature of this configuration. As Fig. 8 indicates, a PIO is evident in the time histories. The figure indicates 15 sec of sustained yaw-rate and pedal force oscillations with a frequency of 2.5 rad/sec. The corresponding rudder deflections are shown in Fig. 9 where rudder amplitude limiting is evident. The predominately right rudder inputs are attributable to the direction of the horizontal wind shear in this run. The vertical lines in Fig. 8 indicate that maximum pedal force inputsoccur when yaw rate is changing sign. The use of rate control activity in a fully developedPIO was hypothesized to constitute so-called “regressive pilot” behavior in [6]. Indeed, attitude rate and control force phasing characteristics like those of Fig 8 have been found in other PIO encounters and can be reproduced with the pilot model discussed in [6]. Also of interest is the fact that the PIO frequency is significantly different (a factor of 2.76 larger) than the vehicle’s Dutch-roll natural frequency of 0.905 rad/sec. A much more thorough discussion of PIOs in the simulation is presented in [2].
Figure 8 Pedal and yaw rate time histories for one pilot flying configuration 3
10
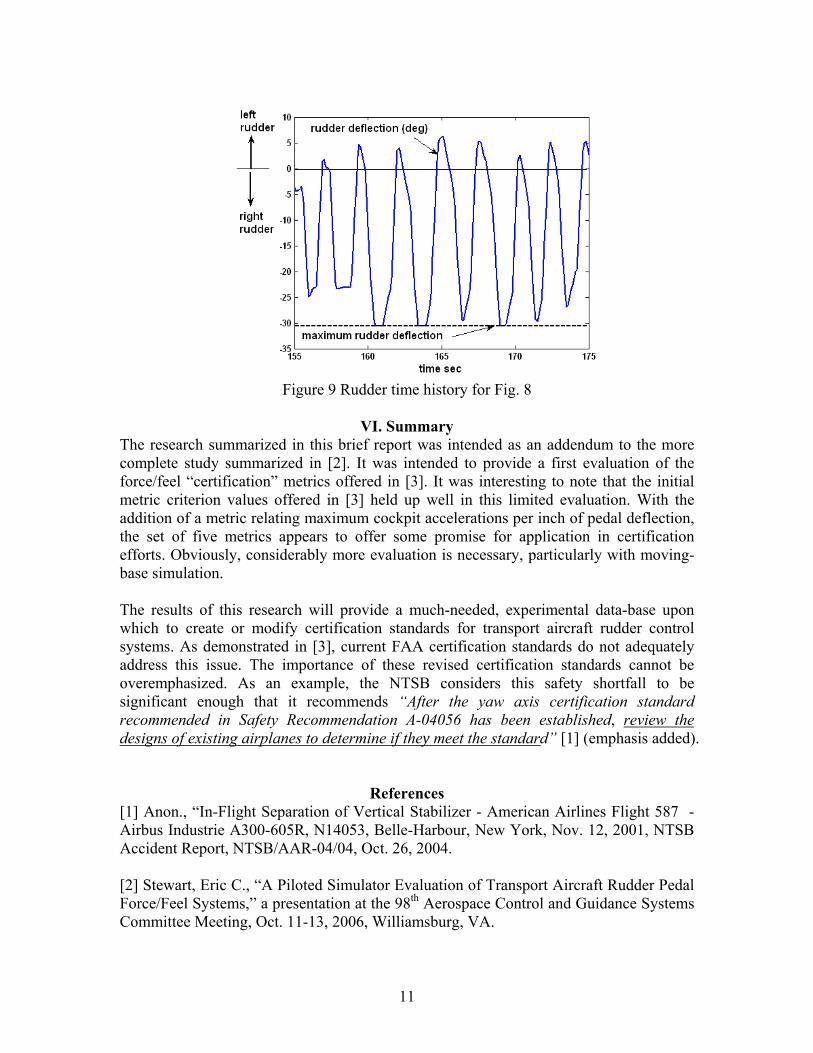
Figure 9 Rudder time history for Fig. 8
VI. Summary
The research summarized in this brief repor was intended as an addendum to the more tcomplete study summarized in [2]. It was intended to provide a first evaluation of the force/feel “certification” metrics offer as interesting to note that the initial
ecessary, particularly with moving-
sport aircraft rudder control
gh that it recommends “After the yaw axis certification standard
ed in [3]. It wmetric criterion values offered in [3] held up well in this limited evaluation. With the addition of a metric relating maximum cockpit accelerations per inch of pedal deflection, the set of five metrics appears to offer some promise for application in certification fforts. Obviously, considerably more evaluation is ne
base simulation. The results of this research will provide a much-needed, experimental data-base upon
hich to create or modify certification standards for tranwsystems. As demonstrated in [3], current FAA certification standards do not adequately address this issue. The importance of these revised certification standards cannot be overemphasized. As an example, the NTSB considers this safety shortfall to be ignificant enous
recommended in Safety Recommendation A-04056 has been established, review the designs of existing airplanes to determine if they meet the standard” [1] (emphasis added).
B/AAR-04/04, Oct. 26, 2004.
eeting, Oct. 11-13, 2006, Williamsburg, VA.
References [1] Anon., “In-Flight Separation of Vertical Stabilizer - American Airlines Flight 587 - Airbus Industrie A300-605R, N14053, Belle-Harbour, New York, Nov. 12, 2001, NTSB
ccident Report, NTSA [2] Stewart, Eric C., “A Piloted Simulator Evaluation of Transport Aircraft Rudder Pedal Force/Feel Systems,” a presentation at the 98th Aerospace Control and Guidance Systems
ommittee MC
11

[3] Hess, R. A., “Certification and Design Issues for Rudder Control Systems in ransport Aircraft,” Journal of Guidance, Control and Dynamics, Vol. 29, No. 5, 2006, p. 1210-1220.
] Hess, R. A., “Rudder Control Strategies and Force-Feel system Designs in Transport ircraft,” Journal of Guidance, Control and Dynamics, Vol. 28, No. 6, 2005, pp. 1251-262.
] Mitchell, D. G., and Klyde, D. H., “Bandwidth Criteria for Category I and II PIOs,” in ilot-Induced Oscillation Research: Statue at the End of the Century, NASA/CP-2001-10389, April, 2001.
] Hess, R. A., “A Unified Theory for Aircraft Handling Qualities and Adverse Aircraft-ilot Coupling,” Journal of Guidance, Control and Dynamics, Vol. 20, No. 6, 1997, pp. 141-1148.
Tp [4A1 [5P2 [6P1
12

Appendix The following plots were used in obtaining the second and third metrics used in Section IV of the main body of this report.
Configuration 1
13
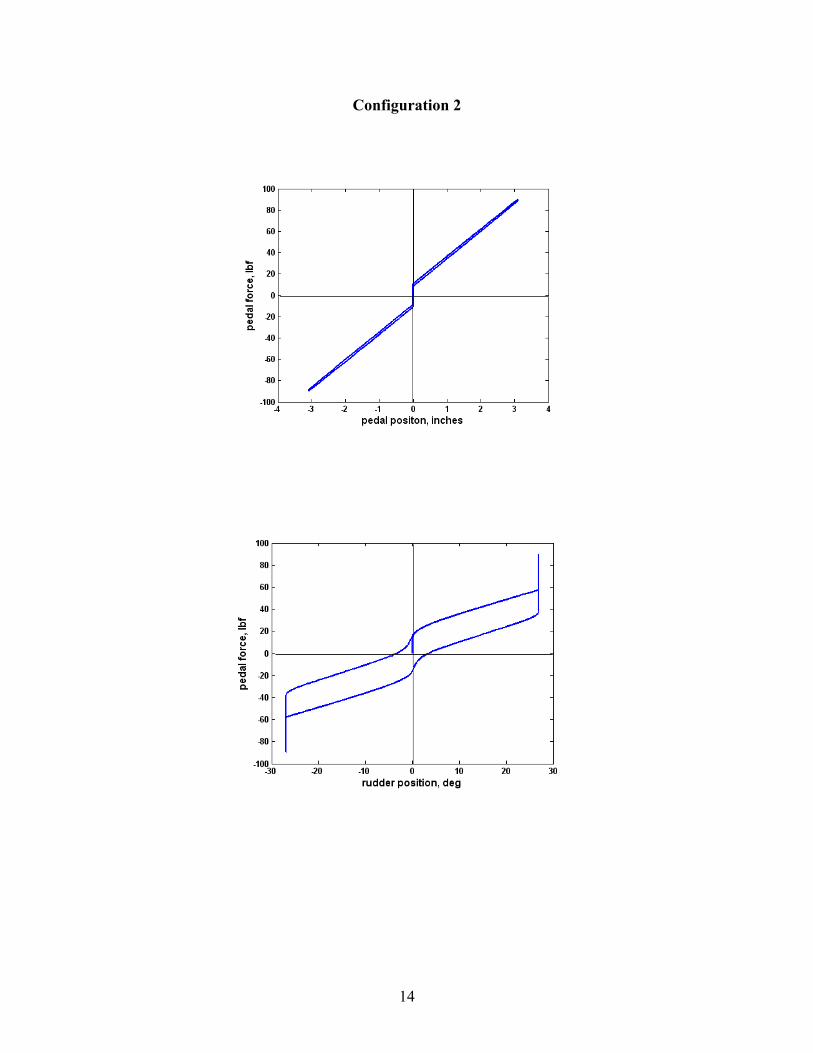
Configuration 2
14
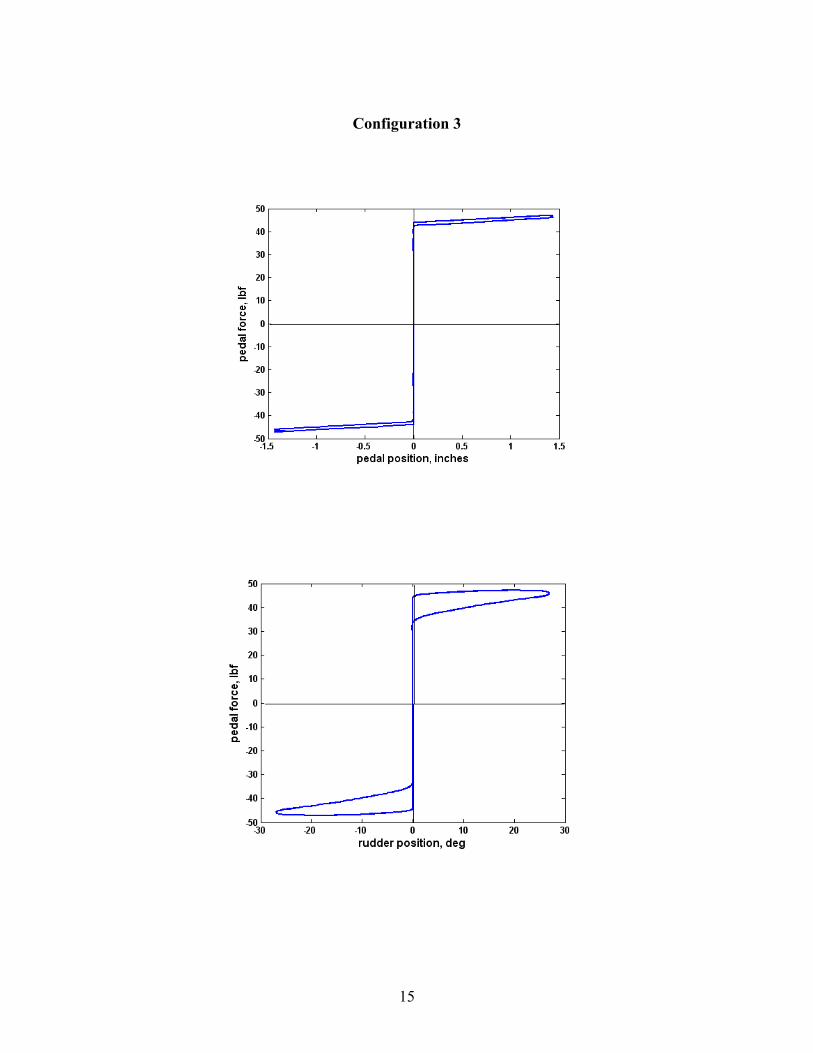
Configuration 3
15
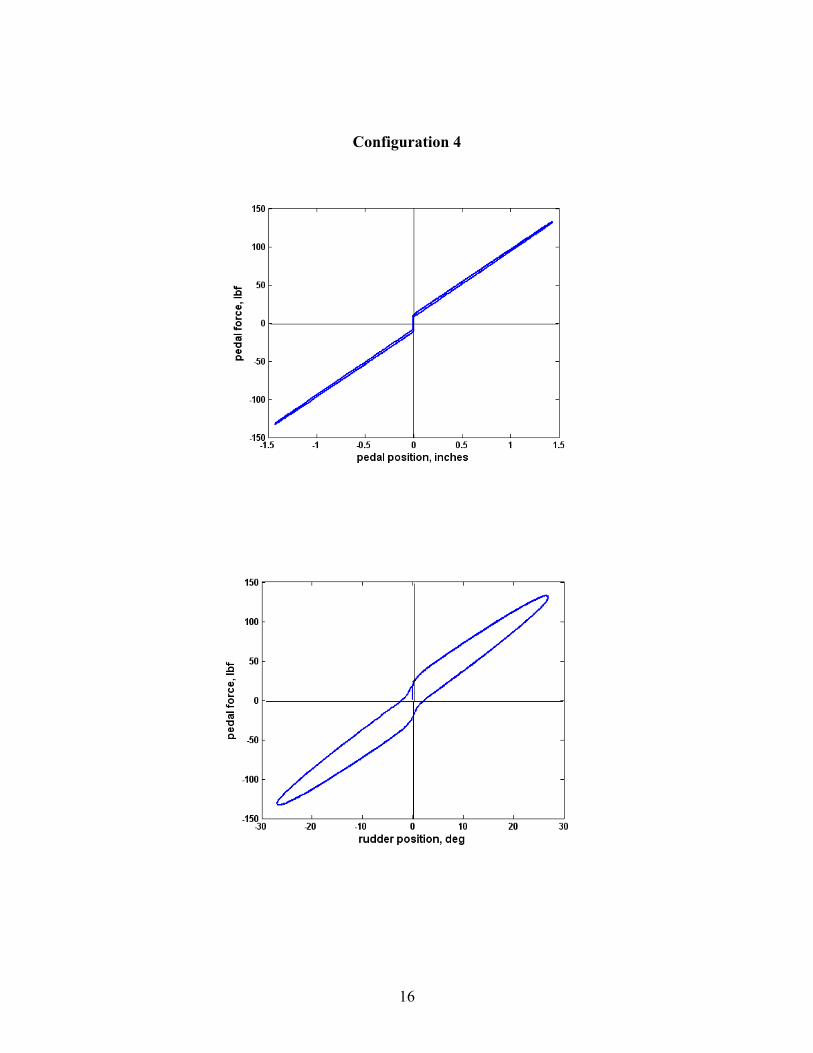
Configuration 4
16
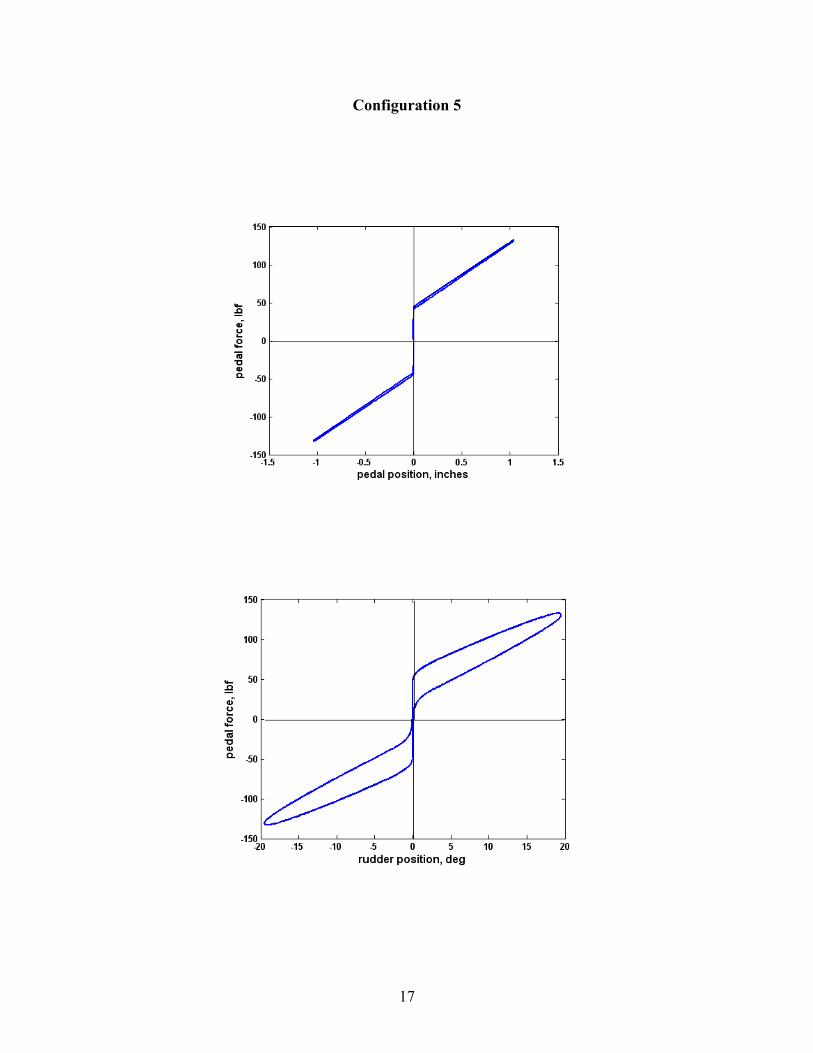
Configuration 5
17
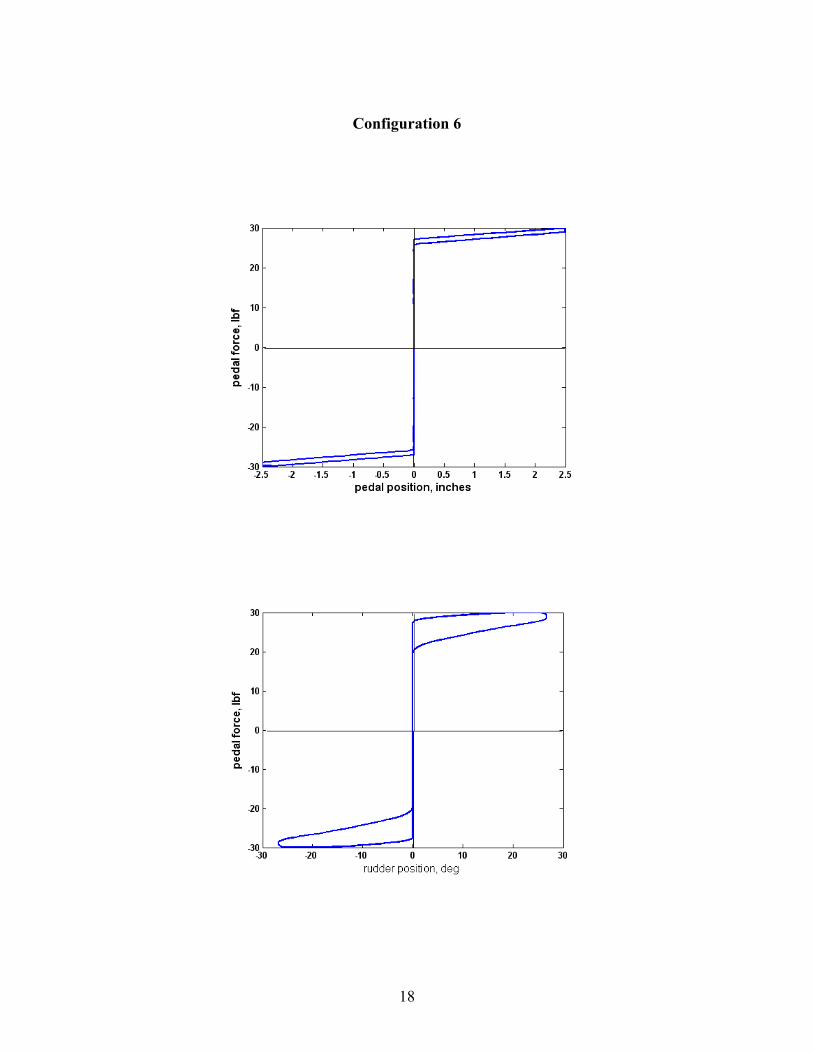
Configuration 6
18
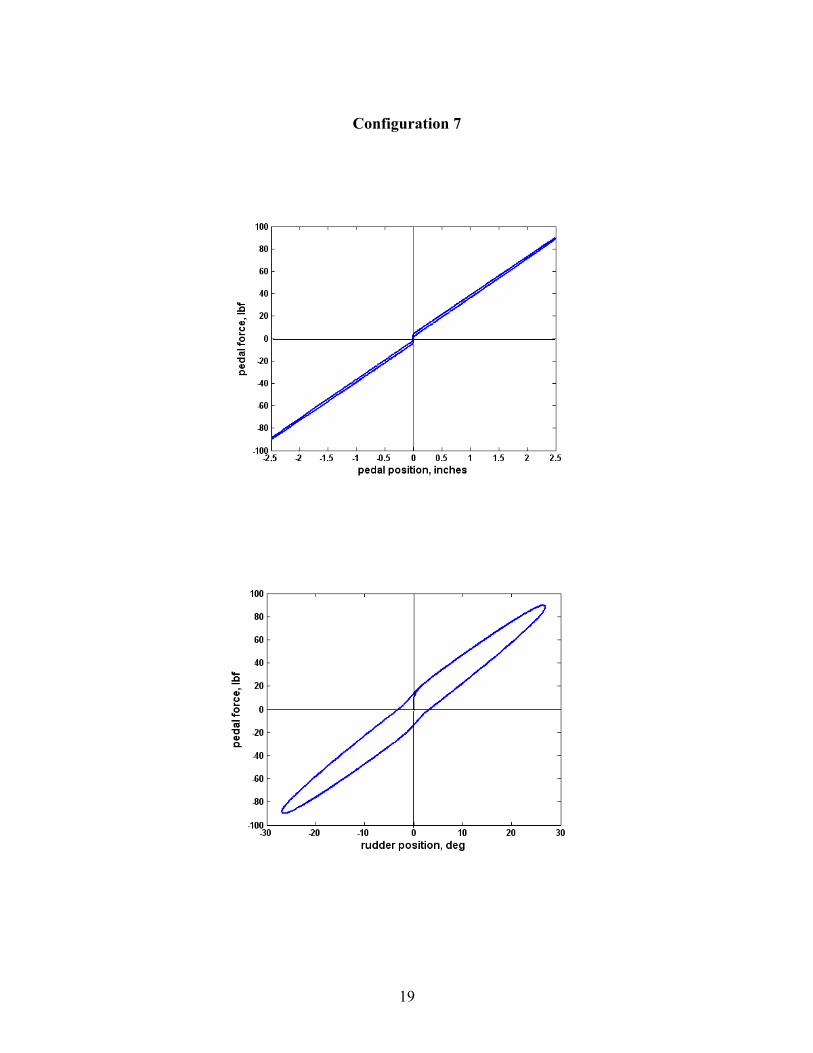
Configuration 7
19

Configurations 8-11
20
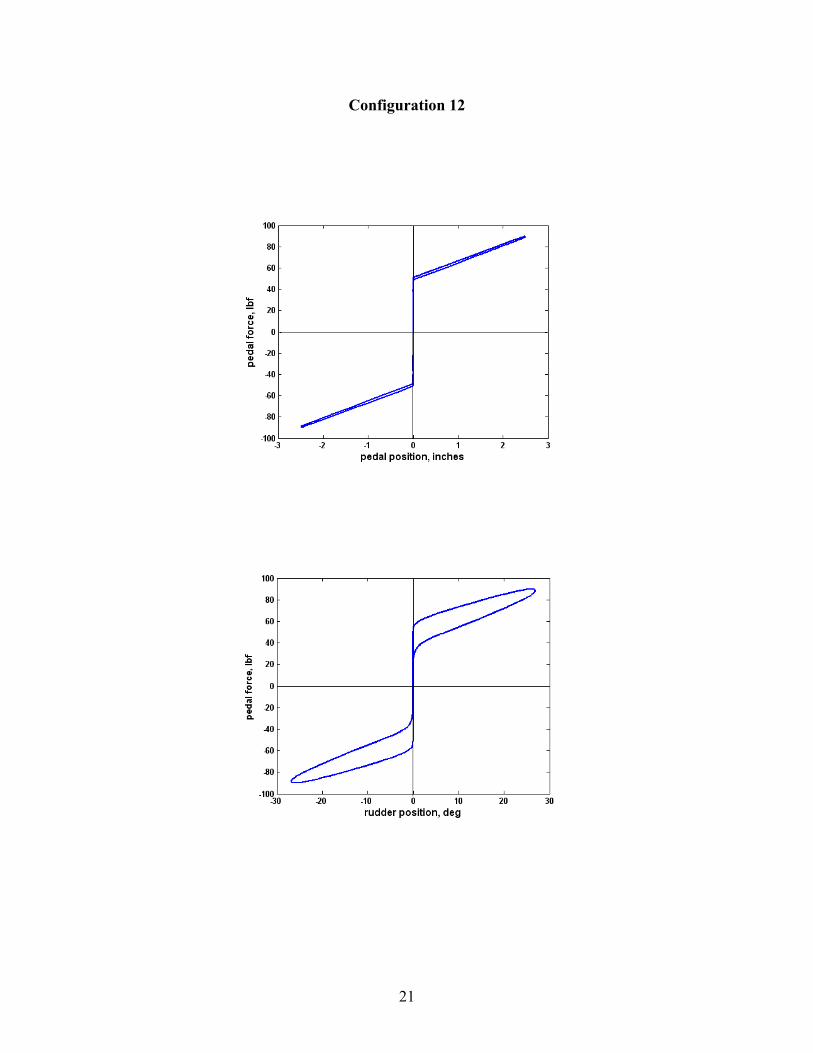
Configuration 12
21
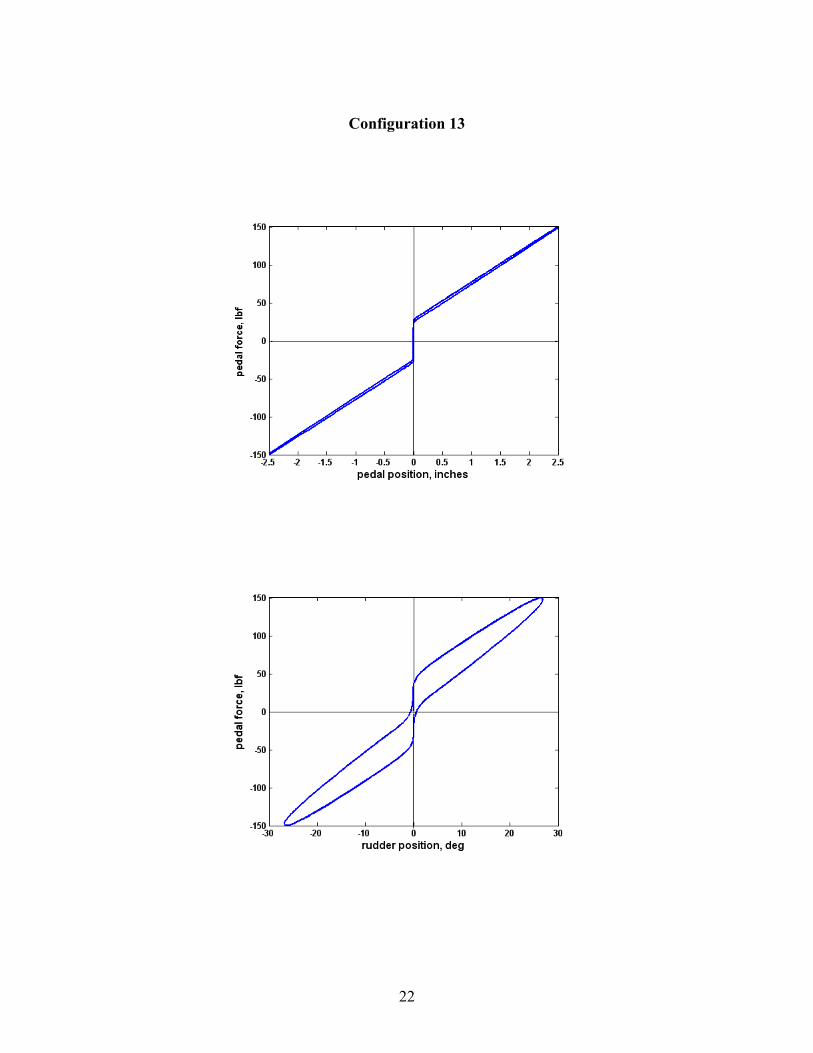
Configuration 13
22
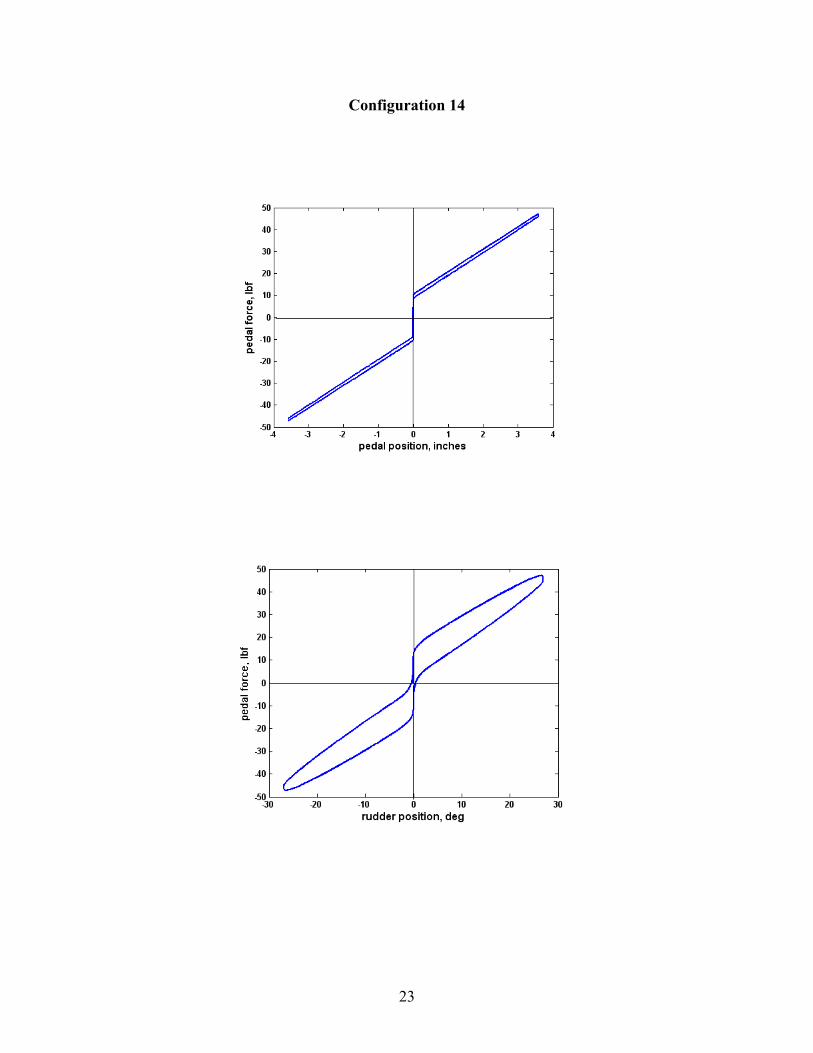
Configuration 14
23
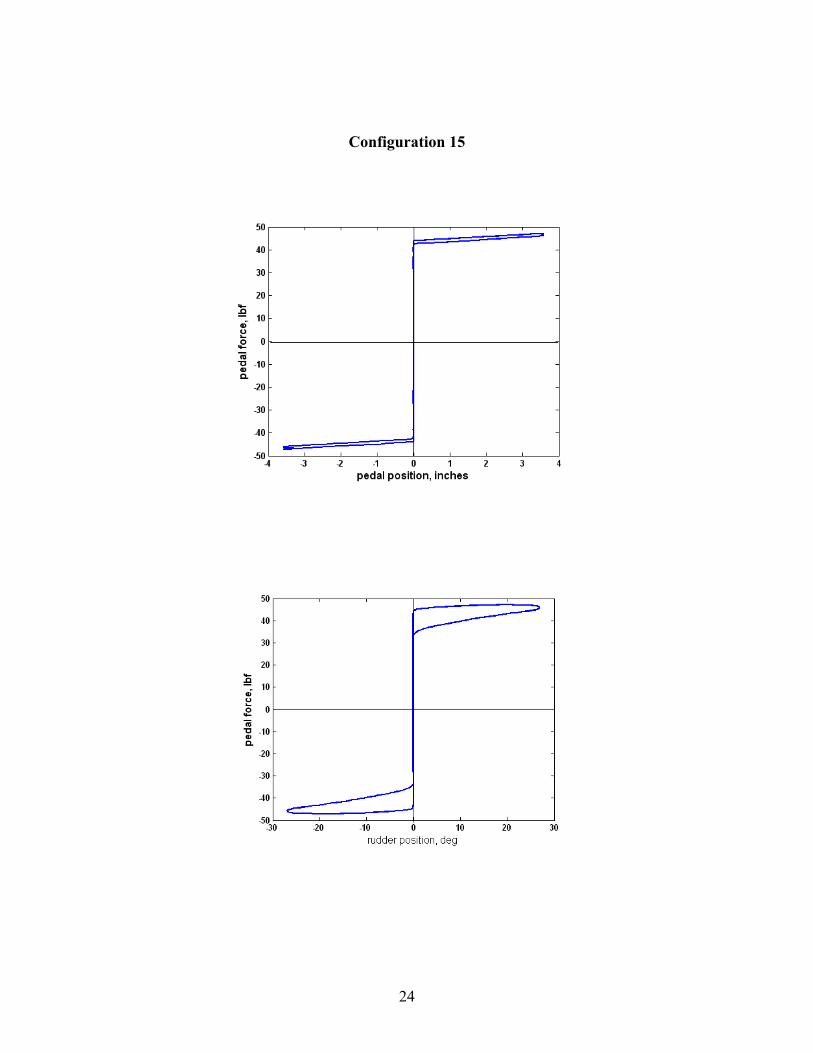
Configuration 15
24
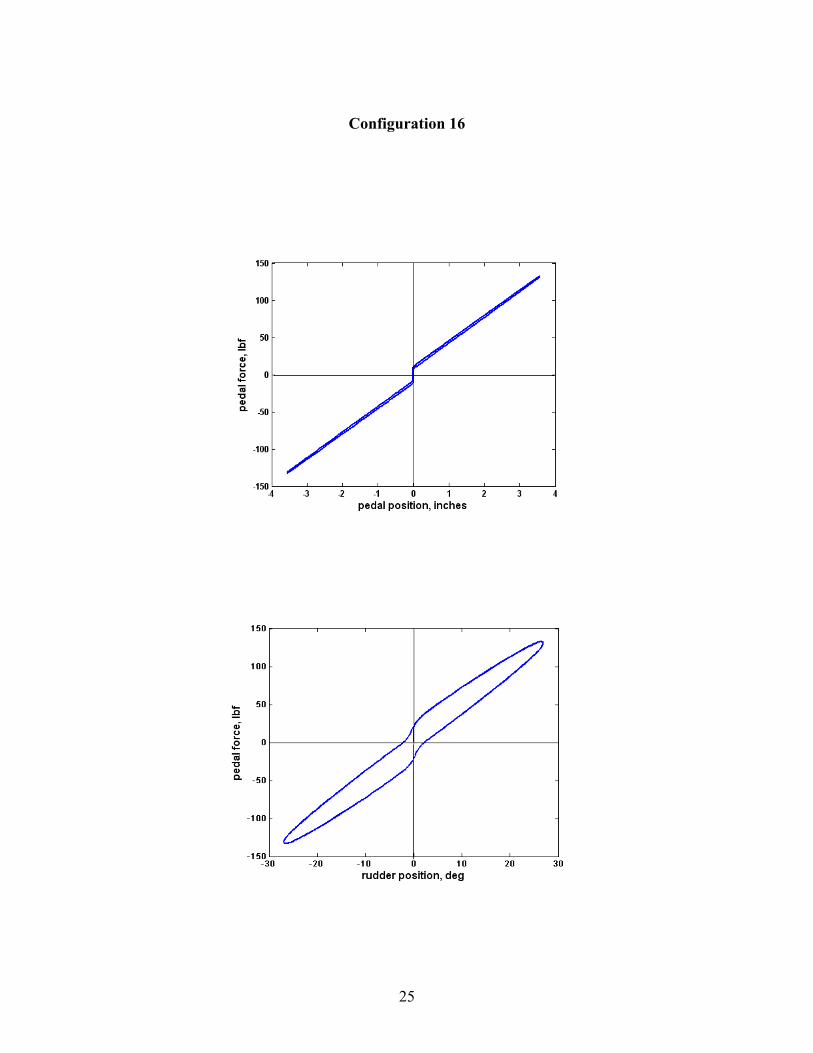
Configuration 16
25
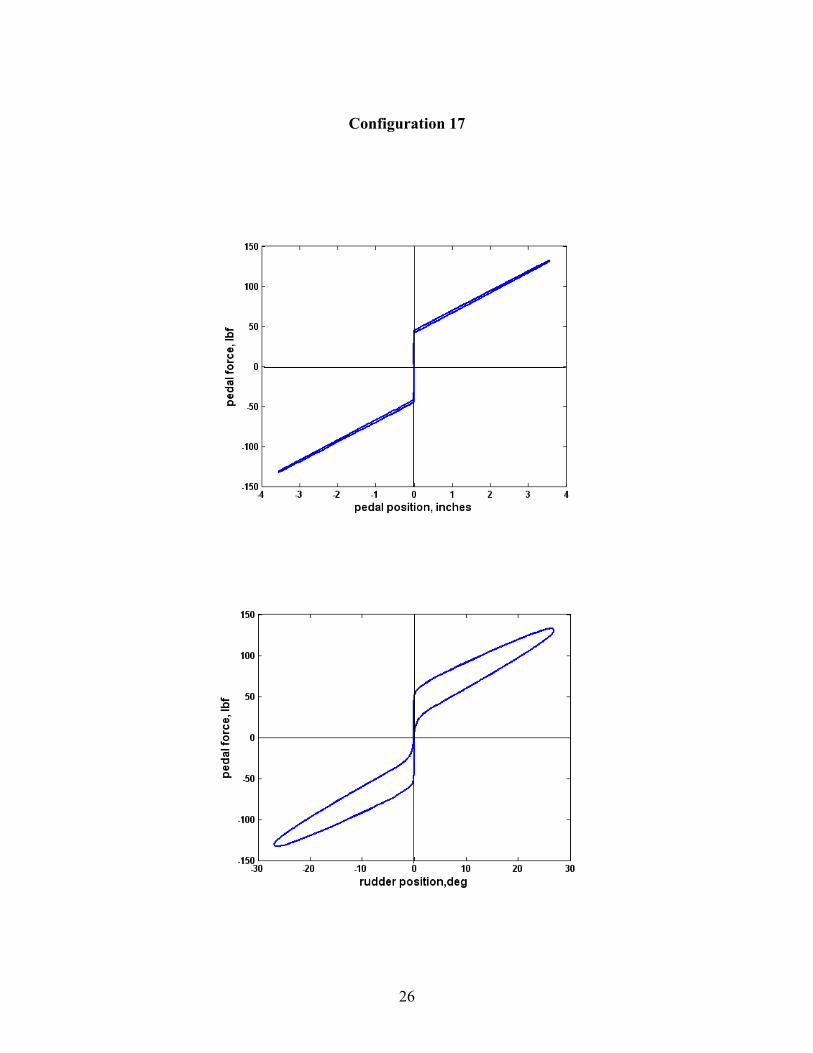
Configuration 17
26

Configuration 18
27
Related Documents