Journal of Financial Economics 11 (1983) 439471. North-Holland Publishing Company THE MARKET VALUE OF CONTROL IN PUBLICLY-TRADED CORPORATIONS* Ronald C. LEASE University of Utah, Salt Lake City, UT 84112, USA John J. MCCONNELL Purdue University, West Lafayette, IN 47907, USA Wayne H. MIKKELSON Dartmouth College, Hanowr. NH 03755, USA Received March 1981, final version received November 1981 This paper tests the hypothesis that the future distribution of payoffs provided by a common stock depends upon whether ownership of the stock also conveys control over the firm’s activities. For 26 firms that had two classes of common stock outstanding, the class with superior voting rights traded at a premium relative to the other class. However, in four firms where the ownership structure of the firm also included a class of voting preferred stock, the class of common with superior voting rights traded at a significant discount relative to the class of common with inferior voting rights. The analysis suggests that there are both benefits and costs of corporate control. 1. Introduction For many years economists have been concerned with problems that arise when security ownership in large corporations is separated from control of the firm’s investment and financing decisions. Various aspects of this topic have been investigated by Berle and Means (1932), Manne (1964,1965), *This paper has benefited from helpful comments by M. Brennan, J. Croft, K. Eades, E. Fama, P. Hess, M. Hopewell, M. Jensen, R. Kadiyala, and R. Ruback, and from presentations at Dartmouth College, Harvard University, Purdue University, the University of Florida, the llniversity of Houston, the University of Minnesota, and the University of Utah. In developing the ideas in this paper the authors also have benefited from many lengthy convensations with G. Schlarbaum and W. Kracaw. We would like to thank Peter Dodd, the referee, for several valuable suggestions. Rick Dark and Scott Linn provided important computational assistance. We are grateful to the Managerial Economics Research Center at the University of Rochester for partial financial support. This paper was completed while John McConnell was at the University of Minnesota. 03044405x/83/$03.00 0 Elsevier Science Publishers

Welcome message from author
This document is posted to help you gain knowledge. Please leave a comment to let me know what you think about it! Share it to your friends and learn new things together.
Transcript

Journal of Financial Economics 11 (1983) 439471. North-Holland Publishing Company
THE MARKET VALUE OF CONTROL IN PUBLICLY-TRADED CORPORATIONS*
Ronald C. LEASE
University of Utah, Salt Lake City, UT 84112, USA
John J. MCCONNELL
Purdue University, West Lafayette, IN 47907, USA
Wayne H. MIKKELSON
Dartmouth College, Hanowr. NH 03755, USA
Received March 1981, final version received November 1981
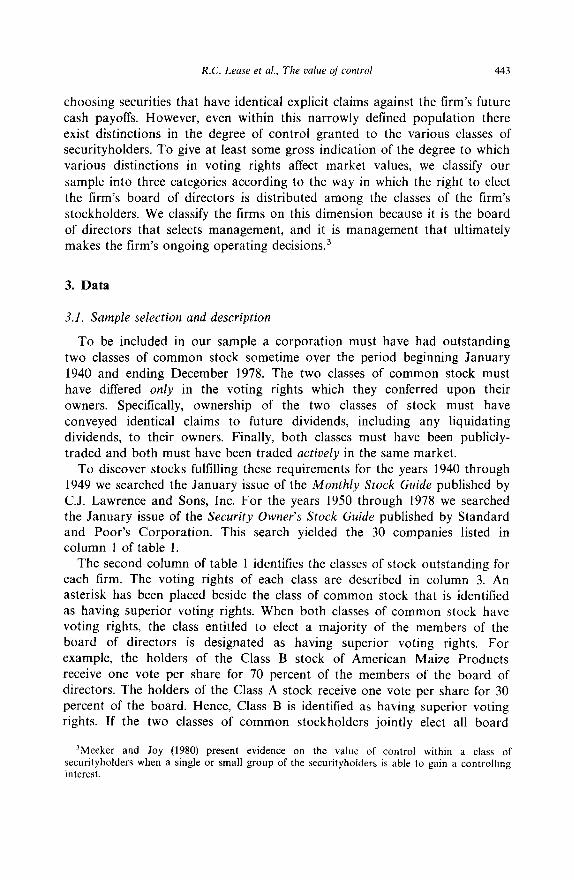
This paper tests the hypothesis that the future distribution of payoffs provided by a common stock depends upon whether ownership of the stock also conveys control over the firm’s activities. For 26 firms that had two classes of common stock outstanding, the class with superior voting rights traded at a premium relative to the other class. However, in four firms where the ownership structure of the firm also included a class of voting preferred stock, the class of common with superior voting rights traded at a significant discount relative to the class of common with inferior voting rights. The analysis suggests that there are both benefits and costs of corporate control.
1. Introduction
For many years economists have been concerned with problems that arise when security ownership in large corporations is separated from control of the firm’s investment and financing decisions. Various aspects of this topic have been investigated by Berle and Means (1932), Manne (1964,1965),
*This paper has benefited from helpful comments by M. Brennan, J. Croft, K. Eades, E. Fama, P. Hess, M. Hopewell, M. Jensen, R. Kadiyala, and R. Ruback, and from presentations at Dartmouth College, Harvard University, Purdue University, the University of Florida, the llniversity of Houston, the University of Minnesota, and the University of Utah. In developing the ideas in this paper the authors also have benefited from many lengthy convensations with G. Schlarbaum and W. Kracaw. We would like to thank Peter Dodd, the referee, for several valuable suggestions. Rick Dark and Scott Linn provided important computational assistance. We are grateful to the Managerial Economics Research Center at the University of Rochester for partial financial support. This paper was completed while John McConnell was at the University of Minnesota.
03044405x/83/$03.00 0 Elsevier Science Publishers

440 R.C. Lease et al., The value of control
Alchian (1969), Alchian and Demsetz (1972), Jensen and Meckling (1976), Fama (1980) Grossman and Hart (1980) and others. The analytical
approaches taken by these authors have varied as have their conclusions. However, a common starting point appears to be the observation by Berle and Means (1932) that separation of security ownership from control of the firm’s activities gives rise to incentives and opportunities for the securityholders’ agents (typically assumed to be the firm’s managers) to direct the firm’s resources away from securityholders to themselves. That is, this literature has addressed the question of whether the securityholders’ payoff
function depends upon the degree to which control over the firm’s activities is delegated to others. A specific example of this concern is manifest in the stylistic convention adopted by Jensen and Meckling (1976).
In their analysis Jensen and Meckling divide stockholders into two groups - an inside shareholder who manages the firm and who has exclusive voting rights and outside shareholders who have no voting rights. Both classes of securityholders are entitled to the same explicit end-of-period dividend payment per share of stock held. However, the inside shareholder is able to augment this stream of future payments by consuming additional non- marketable perquisites. In this setting, there is an incentive for the manager to choose investment and financing policies that benefit himself (i.e., increase his payoff in at least some states of the world), but reduce the payoff to outside securityholders.
This paper tests the hypothesis that the future distribution of consumption opportunities provided by a common stock depends upon whether ownership of the stock also conveys control over the firm’s activities. That is, this paper
tests the hypothesis that control is valued by the capital market. This hypothesis is tested by examining the market prices of the common stocks of companies that have or have had two classes of publicly-traded common stocks outstanding. According to the Articles of Incorporation of the companies that have issued the stocks, the two classes confer upon their owners identical rights to future dividend payments and capital distributions, including any payments in liquidation of the lirm. However, the two classes differ in their rights to vote upon various matters which come before the
stockholders, including (or, perhaps, especially) the election of the members of the corporation’s board of directors. Thus, one class of common stockholders has the potential to exercise greater control over the firm’s investment and financing activities than does the other.
According to standard finance theory, any two securities that provide identical payoffs (i.e., identical future consumption opportunities) in all states of nature must have equal current values. This proposition holds whether markets are perfect or imperfect, whether investors have homogeneous or heterogeneous beliefs, and whether markets are complete or incomplete. Thus, any systematic differences between the prices of the two classes of

R.C. Lease et al., The value of control 441
common stocks in our sample must reflect differences in their future benefit streams.
Stated alternatively, voting rights, per se, are valueless. A common stock that grants voting rights will be valued differently from one that does not only if the future consumption opportunities provided by the two securities also are different. Thus, for example, evidence that a class of common stock with superior voting rights trades at systematically higher prices than an ostensibly identical class of stock with inferior voting rights is consistent with the hypothesis that control over the firm’s activities grants the controlling
class of securityholders some opportunity to receive a higher payoff than the non-controlling class of securityholders in at least some states of nature. This inference would be appropriate despite the fact that the issuing firm’s Articles of Incorporation explicitly entitle the two classes of securities to identical future dividend payments and capital distributions. However, the fact that the Articles of Incorporation require identical payments to the two classes does mean that we may not be able to observe directly the differential payoffs to the two classes of securityholders.’ Nevertheless, a systematic share price differential does permit us to infer that there exists at least the potential for differential future (cash or non-cash) payoffs to the two
classes. The following section elaborates on the way in which corporate charters
can be written to expand or circumscribe the voting rights of various classes
of securityholders. Section 3 describes the sample selection procedure, provides descriptive information on the companies in the sample, and details the way in which the stock price data were gathered. The fourth section presents the results of the analysis of the stock price data. Section 5 contains some commentary on the results. A final section contains a summary and concluding remarks.
2. Voting rights and corporate control
The specific voting rights and, therefore, the degree of control that a specific class of securityholders has over the firm’s activities are spelled out in the firm’s Articles of Incorporation. ’ Typically, the voting right confers upon the stockholder the right to vote in the election of the firm’s board of directors. In some instances that is the only privilege conveyed. In other instances, the
‘For example, by having greater voting power to select the firm’s board of directors and, thereby, to control the firm’s activities, the class of stockholders with superior voting rights may benefit from corporate dealings with themselves, friends, or other companies which they own. Furthermore, the differential benefits associated with the possession of control may be non- pecuniary.
‘W.H.S. Stevens (1938) provides a comprehensive discussion of voting rights and the various forms which they may take.

442 R.C. Lease et al., The value of control
Articles of Incorporation may specify that voting is required for mergers, liquidation of the firm, sale of certain assets, or changes in the Articles of Incorporation. Thus, the degree of control over the firm’s operations conveyed by voting rights varies among firms.
Similarly, there is variation among the voting rights granted to the
different classes of a firm’s securities. For example, a class of common stockholders may have no right to vote for members of the board of directors or it may be given exclusive rights to elect a fixed number or a minority of the members. Likewise, preferred stockholders may be given full or partial voting rights, or they may receive voting rights contingent upon the omission of a stated number of dividend payments.
A different form of contingent voting rights is granted to the holders of a firm’s convertible preferred stock, convertible debt, and warrants. If the owner of one of these securities cashes it in for common stock, his or her voting rights are equivalent to those of a common stockholder.
Furthermore, voting rights may differ in the way in which they can be exercised. For example, voting rights for the board of directors may be cumulative or they may be share-for-share. Or a class of stockholders may be granted fractional voting rights like those of Resorts Inter- national Corporation in which the holders of the Class B stock receive one vote per share while the holders of the Class A stock receive l/100 vote per share.
Given the subtle distinctions among the voting rights conferred upon various classes of securityholders, the ownership structure of most firms is more complex than the simple dichotomy between residual owners and all other securityholders would suggest. It is more complex even than the classification of securityholders into common stockholders, preferred stockholders and creditors would indicate:
Each of the subtle distinctions among the voting rights conferred upon a class of securityholders may translate into subtle differences in the ability of that class to control the activities of the firm. If control is valued, then presumably each of these subtle distinctions would be priced differentially by the capital market. Measurement of the incremental value of these subtle
distinctions is difficult because each security represents not only a right to certain voting privileges, but also an explicit claim against future cash flows of the firm, which may themselves differ in many subtle ways. Because extant pricing models have not yet evolved to the point where valuation of future cash flows can be determined precisely, distinguishing that part of the price of a security due to subtle shadings in the incremental consumption opportunities provided by control from that part due to subtle shadings in explicit claims against future cash flows is no mean task.
This study circumvents the difficult task of distinguishing between value due to control and value due to explicit claims against future cash flows by
R.C. Lease et al., The value of control 443
choosing securities that have identical explicit claims against the firm’s future
cash payoffs. However, even within this narrowly defined population there exist distinctions in the degree of control granted to the various classes of securityholders. To give at least some gross indication of the degree to which various distinctions in voting rights affect market values, we classify our
sample into three categories according to the way in which the right to elect the firm’s board of directors is distributed among the classes of the firm’s stockholders. We classify the firms on this dimension because it is the board of directors that selects management, and it is management that ultimately makes the firm’s ongoing operating decisions.3
3. Data
3.1. Sample selection and description
To be included in our sample a corporation must have had outstanding
two classes of common stock sometime over the period beginning January 1940 and ending December 1978. The two classes of common stock must have differed only in the voting rights which they conferred upon their owners. Specifically, ownership of the two classes of stock must have conveyed identical claims to future dividends, including any liquidating dividends, to their owners. Finally, both classes must have been publicly- traded and both must have been traded actively in the same market.
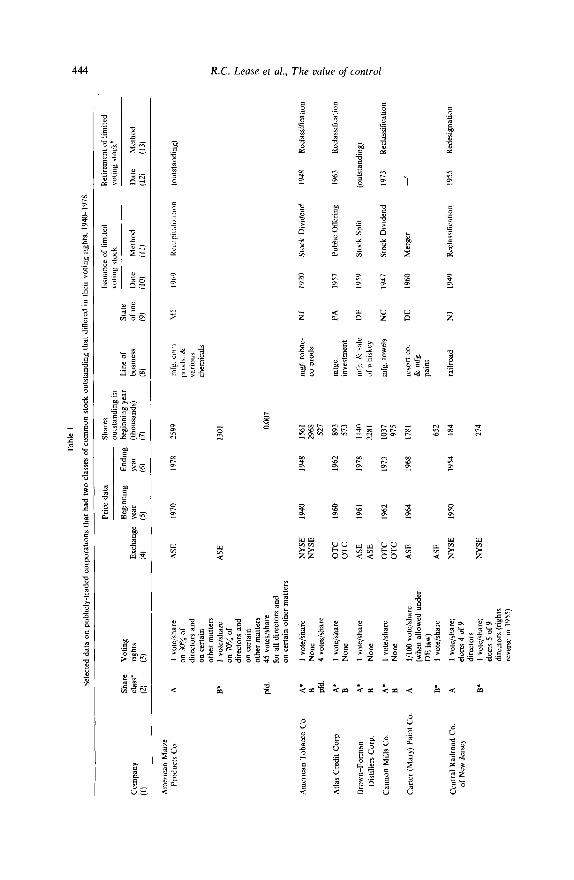
To discover stocks fulfilling these requirements for the years 1940 through 1949 we searched the January issue of the Monthly Stock Guide published by C.J. Lawrence and Sons, Inc. For the years 1950 through 1978 we searched the January issue of the Security Owner’s Stock Guide published by Standard and Poor’s Corporation. This search yielded the 30 companies listed in column 1 of table 1.
The second column of table 1 identifies the classes of stock outstanding for each firm. The voting rights of each class are described in column 3. An asterisk has been placed beside the class of common stock that is identified as having superior voting rights. When both classes of common stock have voting rights, the class entitled to elect a majority of the members of the board of directors is designated as having superior voting rights. For example, the holders of the Class B stock of American Maize Products receive one vote per share for 70 percent of the members of the board of directors. The holders of the Class A stock receive one vote per share for 30 percent of the board. Hence, Class B is identified as having superior voting rights. If the two classes of common stockholders jointly elect all board
‘Meeker and Joy (1980) present evidence on the value of control within a class of securityholders when a single or small group of the securityhoiders is able to gain a controlling interest.
Tab
le
I
S&ct
ed
data
on
pu
bhcl
y-tr
aded
co
rpor
atio
ns
that
ha
d tw
o cl
asse
s or
com
mon
st
ock
outs
tand
ing
that
di
ffer
ed
in
thei
r vo
ting
tight
s,
194&
197X
.
Pric
e da
ta
Shar
e V
otin
g B
egin
ning
clas
sy
righ
ts
Exc
hang
e ye
ar
(21
(31
(41
(51
Shar
es
I~an
ce
or
hmltr
d R
etir
emen
t or
hm
lted
outs
tand
mg
in
votin
g so
ck
vot,n
g cl
ock”
E
ndin
g be
ginn
ing
&a,
L
ine
or
Stat
e
(tho
usan
dsl
busm
ess
or i
nc.
Dat
e M
etho
d D
ate
Met
hod
year
61
0 (8
) (9
1 (I
O1
(III
(I
21
(13)
Com
pany
(I
\ -
ASE
19
70
1978
A
mm
can
Ma
ue
P
rodu
cts
Co.
I
vote
/sha
re
on
30%
or
di
rect
ors
and
on
cert
ain
othe
r m
atte
rs
1 vo
te/s
hare
0n
70%
0r
di
rect
ors
and
on
cuta
n ot
her
mat
ters
45
vote
s/sh
are
ror
all
dire
ctor
s an
d on
cer
tain
ot
her
mat
ters
A
9’
pfd.
A’
B
pld.
A*
B
A’
B
A’
B
A
B*
A
B*
ASE
0.00
7
I vot
e/sh
are
Non
e 4
vote
s/sh
are
NY
SE
NY
SE
I vo
te/s
hare
O
TC
Non
e O
TC
I vo
te/s
hare
NO
W
I vo
te/s
hare
N
OW
l/ltM
vo
te/s
hare
(w
hen
allo
wed
un
der
DE
la
w)
1 vo
te/s
hare
ASE
ASE
OT
C
OT
C
ASE
ASE
65
2
1 vo
te/s
hare
; el
ects
4
of 9
dire
ctor
s I
vote
/sha
re;
elec
ts
5 0r
9
dire
ctor
s (r
ight
s re
vers
e in
19
55)
NY
SE
1950
19
54
184
mlr
oad
N
J 19
49
Rec
lass
ltica
tion
1955
R
edes
igna
tion
NY
SE
274
NJ
I920
St
ock
Dw
dend
19
48
Rec
lass
itica
tton
q K
1940
19
48
1561
29
68
527
mg
T. to
bac-
co
pr
ods.
893
mtg
e.
573
inve
stm
en
t
It40
228
I
Am
eric
an
Tob
acco
C
o.
PA
1957
Pu
bhc
Or&
stin
g 19
63
Rec
lass
dica
tion
i %
DE
19
59
Stoc
k Sp
hf
(out
stan
ding
) G
2
NC
19
47
Stoc
k D
ivid
end
1973
R
ecla
ssili
catto
n h
1960
19
62
1961
19
78
1962
19
73
1964
19
68
Atla
s C
redi
t C
orp.
Bro
wn-
Form
an
Dis
tdle
rs
Cor
p.
Can
non
Mill
s C
o.
1037
97
5
1781
D
E
1960
M
erge
r _r
C
arte
r (M
ary)
Pa
int
Co
Cen
tral
R
alro
ad
Co.
or
New
Je
rsey

* -rl m
Col
hns
Rad
io
Co
0 C
olum
bia
Bro
adca
stm
g Sy
stem
s,
Inc.
Cor
by
(H )
D~
st~
llrr.
L
td.
Di
Glo
rg~o
F
ruit
C
orp.
For
d M
otor
C
o of
A
C
anad
a,
Ltd
. B
’
Han
na
(M
A.)
Co.
Hoo
ver
Co
Har
vey
Hub
bell,
In
c
Kew
anee
01
1 C
o.
Nat
iona
l H
omes
C
orp.
A’
B
A*
B
A’
B
A’
B
A
B’
A
B*
A’ B
pfd
A’
B
A’
B
pld.
A*
B
I vo
te/s
hare
Non
e
Sam
e as
B
exc
ept
elec
ts
: or
drec
tors
w
ith
cum
ulat
we
votin
g E
lect
r ot
her
f of
dnec
tors
by
m
qor~
ly
vote
of
quo
rum
of
B
sha
res
I vot
e/sh
are
Non
e (e
xcep
t on
am
endm
ents
to
A
rt.
“1 I
X)
NO
W
I vot
e/sh
are
(exc
ept
both
cl
asse
s vo
te i
f le
ss
than
2O.M
Xl s
hare
s
outs
tand
mg)
.
Non
e I
vote
/sha
re
NO
W
I vo
te/s
hare
20 v
otes
/sha
re
I vo
te/s
hare
1 v
ote/
shar
e Is
sued
71
69
I vot
e/sh
are
NO
W
4 vo
tes/
shar
e
I vot
e/sh
are
Non
e (e
xcep
t on
ce
rtai
n am
endm
ents
I”
A
U.
or
1°C
1
OT
C
1955
OT
C
NY
SE
1940
NY
SE
ASl
Z
1949
A
SE
Pat
C
oast
lY
5O
Pat
C
oast
ASE
A
SE
OT
C
OT
C
OT
C
OT
C
ASE
ASF
OT
C
OT
C
NY
SE
NY
SE
OT
C
OT
C
1950
1952
1954
I960
1961
I940
1954
195’
)
1958
1963
1959
1959
1961
1957
1978
I966
1946
1962
736
769
957
mfg
. &
tale
>
IA
com
m
equi
p.
broa
dcar
lmg
NY
19
31
795
9X8
mk
123
chem
ral,
I59
agn-
27
3 pr
od,.
1589
70
m
fg
auto
O
NT
IY
2Y
2061
1030
679
I70
641
641
432
950
I901
X60
2270
20
9
crud
e “1
1
prod
‘n
mfg
to
bacc
o
prod
s
489
mg
pref
ab
492
how
e\
ON
T
1928
DE
19
45
OH
19
54
CN
19
60
Dt_
I Y
6O
NJ
I920
IN
I954
I’)5
5
1967
I963

Com
pany
(1)
Shar
e V
otin
g
clas
sa
righ
ts
(2)
(3)
Nie
lsen
(A
.C.)
Co.
A
B’
Nor
th
Am
rr~c
an
Cem
ent
A
Cor
p.
B*
Nor
th
Am
rnca
n R
ayon
Cor
p
A’
B
Park
er
Pen
Co.
, In
c.
Plym
outh
R
ubbe
r C
o.,
Inc.
Pres
iden
ltdl
Rea
lty
Cor
p.
1 vo
te/s
hare
I v
ote/
shar
e an
d el
ect
ma,
or,ty
of d
irec
tors
I vo
te/s
hare
an
d el
ects
all
but
2 di
rect
ors
I vo
te/s
hare
an
d el
ects
2 di
rect
ors
as
a cl
ass
1 vo
te/s
hare
Non
e ex
cept
on
am
endm
ents
10
cha
nge
capa
ilira
tmn
I vo
te/s
hare
N0l
le
I vo
te/s
hare
elec
ts
213
of
dxec
tors
I vo
te/s
hare
ekc1
s l/
3 of
dire
ctor
s
Pric
e da
ta
Shar
es
ouun
dmg
I”
BQ
%U
l1ll
g E
ndin
g bc
gmm
ng
year
L
ine
of
year
(t
hous
ands
) bu
smes
s E
xcha
nge
ye&
(4)
(6)
(7)
(8)
OT
C
OT
C
1965
19
78
3420
1710
ASE
A
SE
1955
I9
60
379
mfg
. ce
men
t
170
NY
CE
19
40
1949
NY
CE
300
mfg
. ra
yon
212
ASE
ASE
1951
19
63
466
mfg
. &
sd
le
466
of p
ens,
et
c.
ASE
ASE
1967
19
7x
815
815
ASE
19
62
1978
46
6 re
al
esta
te
ASE
69
6
TV
&
ra
dio
audi
ence
re
sear
ch
mfg
. pl
astic
spec
ialit
ies
&ru
bber
pr
oduc
ts
Lss
uanc
e of
hm
lted
Rel
irem
ent
of h
mw
d vo
tmg
stoc
k vo
tmg
rtec
kb
Dat
e M
etho
d D
ate
Met
hod
(10)
11
1)
(12)
(1
3)
DE
DE
DE
WI
MA
DE
1965
1952
1928
1951
1963
1962
Rec
apita
lirat
ion
Rig
hts
Olle
nng
Rec
apila
lirat
ion
Stoc
k D
ivid
end
(out
stan
dmg)
1961
M
erge
r
1964
R
ecla
~s0i
cacm
n
(out
stan
ding
)
(out
stan
dmg)

Rrw
rts
lnte
rna~
mna
l
Inc.
She&
r (W
A,
Pen
Co.
Stan
dard
M
illm
g C
o.
Cor
p.
Stan
dard
P
ower
&
L
ight
C
orp.
Tal
on.
1°C
A
B’
A
B’
A
B*
A
B*
i/lo0
vo
te/s
hare
iwhe
n al
low
ed
unde
r
DE
la
ws,
ot
herw
se
I vo
te/s
hare
)
I vo
te/s
hare
Non
e I v
ote/
>ha
re
Non
e I v
ote/
shar
e
NO
”C
I vo
te/s
hare
Ele
ct,
smal
lest
#
&re
ctor
s su
fic~
ent
10 c
onst
itut
e a
mqo
rity
Ele
cts
larg
est
# di
rect
ors
that
co
”stit
”feS
a
mln
orlty
ASE
19
47
1955
13
20
ASE
I vo
te/s
hare
A
SE
NO
”C
ASE
ASE
19
68
197x
32
46
ASE
MSE
M
SE
ASE
A
SE
OT
C
OT
C
367
I957
19
65
1954
19
64
I960
19
62
x44
x43
3094
643
541
2x5
110
1951
19
62
545
545
mfg
. pe
ns
mte
grat
ed
od
co.
DE
DE
mfg. &
ha
k of
flo
ur.
feed
&
fo
od
DE
UIl
l
hold
mg
co.
DE
1957
1928
1955
1930
1951
(out
rtan
dmg)
1965
R
ecla
ssili
callo
n
1968
R
ecla
ssdi
catio
n
(out
slan
dmg)
1955
C
orp.
R
eorg
anlL
atlo
”
1963
R
ecla
vifi
catm
”
-
*Ast
ensk
de
note
s cl
as,
of st
ock
with
su
peno
r vo
ting
nght
s.
“In
a re
clas
se&
&m
to
re
fue
shar
es,
limite
d vo
tmg
shar
es
wer
e re
clas
nfie
d on
a
shar
e-fo
r-sh
are
baas
as
fu
lly-v
otm
g sh
ares
In
a
rede
sign
atio
n to
re
tire
shar
es,
limed
vo
ting
shar
es
wer
e re
desi
gnat
ed
on
a sh
are-
for-
shar
e ba
sis
as
(ully
-vot
ing
shar
es.
In
a”
exch
ange
ol
Ter
ea
ch
shar
e of
lim
ned
vot,“
a sh
ares
w
as
exch
ange
d on
a
shar
e-fo
r-sh
are
basi
s fo
r sh
ares
of
th
e ot
her
clas
s of
co
mm
on
stoc
k.
I”
reca
p~ta
luat
v~ns
bo
th
clas
ses
of s
&k
wer
e ex
chan
ged
on
a sh
ar&
r-sh
are
basi
s fo
r a
new
cl
ass
of v
otin
g st
ock
‘Rem
corp
orat
ed
as
Res
orts
ln
tern
atm
nal
I”
1968
. B
oth
claw
s of
st
ock
wer
e st
ill
outs
tand
mg
I”
Dec
embe
r 19
78
The
re
inco
rpor
atio
n of
M
ary
Car
ter
Pant
s as
R
esor
ts
Inte
rnat
iona
l re
flec
ted
a fu
ndam
enta
l ch
ange
I”
th
e bu
sine
ss
actw
~t~~
of
the
fi
rm.
448 R.C. Lease et al., The value of control
members, the class entitled to more votes per share is designated as having superior voting rights. For example, Class A and Class B common stockholders of Resorts International, Inc. receive l/100 and 1 vote per share, respectively. For this company, Class B stockholders are designated as having superior voting rights.
Four of the companies in the sample had outstanding a class of ,preferred stock that received some voting rights in addition to the two classes of common stock. These preferred stocks are shown in column 2 and their voting rights are described in column 3.
After we identified those companies eligible for inclusion in the sample, we solicited copies of the complete text of the Articles. of Incorporation that were in effect during the’ time that both classes of common stock were outstanding. In most cases the articles were obtained directly from the issuing corporation, from a corporation that had acquired the company in the sample, or from an agency of the state in which the company was incorporated. For some companies we were unable to obtain complete copies
of the Articles, but partial copies of relevant passages were received. For two of the companies we obtained only the description of voting rights contained
in Moody’s Manuals.
To give some indication of the wording of the articles as they relate to the two classes of stock, we quote from the articles of National Homes Corporation:
Holders of Class A common stock and holders of Class B common
stock shall participate equally in all cash and stock dividends declared by the corporation, provided, however, that with respect to any stock dividend declared by the corporation the board of directors may, in its discretion, without the prior vote or consent of either Class of shareholders, declare and distribute to Class A common shareholders shares of Class A or shares of Class B common stock and to Class B common shareholders shares of Class A common stock. (Article 6, paragraph 2)
Each holder of Class A common stock shall be entitled to one vote for each share of such stock outstanding in his name on the books of the corporation.
Holders of Class B common stock have no voting rights, except that upon proposed amendments to the Articles of Incorporation which could (1) impair the right of such holders to share equally with .holders of Class A common stock upon liquidation of the corporation, or (2) impair the right of such holders to share equally with holders of Class A common stock in dividends declared by the corporation (except with

R.C. Lease et al., The value of control 449
respect to stock dividends to the extent set forth in Article 6 hereof), then the holders of Class B com*mon stock shall have the same voting rights as holders of Class A common stock with respect to such proposed amendments.
Upon the resolution of the board of directors approved by the
afhrmative votes of the holders of at least a majority of the outstanding
shares of Class A common stock entitled to vote in respect thereof, all shares of Class B common stock then outstanding may be granted the same voting rights as shares of Class A common stock. (Article 7)
And from the Articles of BrownForman Distillers Corporation:
Every share of the common stock of both classes, whenever and for whatever consideration issued, shall be entitled to the same rights as every other share of common stock in all distributions of earnings or assets of the corporation distributable to the holders of the common
stock. (p. 62, paragraph 3)
Except as herein provided, the holders of the Class A common stock shall have full and exclusive voting powers. The Class B common stock shall be in all respects equal and identical to the Class A common stock except that the holders of the Class B common stock shall have no voting powers in the election of directors, or on any question, except as otherwise provided by the laws of Delaware. (p. 62, paragraph 5)
Column 4 of table 1 shows that four of the companies traded on the New York Stock Exchange (NYSE), 15 traded on the American Stock Exchange (ASE) or its predecessor, the New York Curb Exchange (NYCE), two traded on regional exchanges, and nine traded over-the-counter.
The fifth and sixth columns of the table give the first and last year for which price data were collected for each company. Column 7 shows the number of shares of each class of stock outstanding in the first year the firm entered the sample. In many cases the number of shares outstanding for each class varied over time, but the ratio of the number of Class A to Class B shares for each company typically showed little variation over the time interval in which the firm was in the sample.
The eighth column indicates that there is no particular concentration of the companies by line of business. Column 9 indicates that 13 of the companies were incorporated in Delaware, three in New Jersey, two each in Pennsylvania, Ohio, and Ontario, and one each in Indiana, Wisconsin, Massachusetts, Connecticut, Iowa, Maine, New York. and North Carolina.
Columns 10 and 11 show the year and method of issuance of the class of
450 R.C. Lease et al., The value of control
_ stock we have identified as having inferior voting rights. Four were issued as a stock dividend or stock split; 16 were issued by means of a recapitalization or reclassification of existing stock; three were issued at the time the company was initially incorporated; two were issued through a rights offering; one was issued in a merger with a subsidiary; and one was issued as a new public offering of common stock. The year and method of retirement of the class of stock with inferior voting rights are shown in columns 12 and 13. In 17 cases the method of retirement was a reclassification, recapitaliza- tion, or exchange offer in which the stockholders in both classes became
holders of the same class of voting stock. In every instance, the two classes of shareholders received an equal number of shares in the same class of stock for each share currently held. One retirement was through a merger and another resulted from a corporate reorganization. For nine companies the two classes of common stock were still outstanding at the end of December 1978, the last month for which price data were gathered.
3.2. Stock price data
The source of the market price data was the Wall Street Journal. For each
month (after January of 1940) we examined the share price quotations in the Wall Street Journal for the last trading day of the month. If both classes of stock for a listed company in the sample traded on that day, we recorded the closing prices. If one or both classes did not trade during the last trading day of the month, the next to the last trading day was examined. If both traded that day, the closing prices were recorded. If not, we examined the previous trading bay, and so on, for live days previous to the last trading day of the month. If both stocks did not trade on the same day during this six-day interval, the first live days of the following month were searched, beginning, with the first trading day. If both classes of stock did not trade on the same day during this eleven-day interval, price observations for that month were omitted. The same procedure was followed for stocks traded over-the- counter, except that both bid and ask quotations for both classes of stock were collected. By following this procedure, the stock price data represent approximately synchronous market transactions.
3.3. ClaSsification of the sample
To give some indication of the extent to which differences in voting rights are priced by the capital market, the firms in the sample were separated into three broad categories. As it turns out, even this coarse classification scheme yields some surprising results.
The first category encompasses those companies that had outstanding a class of voting common stock and nonvoting common stock, but no voting preferred stock. For these companies, one class of common stock exercised

R.C. Lease et al., The value of control 451
exclusive control over the board of directors. This group includes Atlas Credit Corporation, Brown-Forman Distillers Corporation, Cannon Mills Company, Collins Radio Company, Corby Distillers, Ltd., Di Giorgio Fruit Corporation, Ford Motor Company of Canada, Ltd., Hanna Company, Hoover Company, Kewanee Oil Company, National Homes Corporation, Nielsen Company, Parker Pen Company, Plymouth Rubber Company, Incorporated, Sheaffer Pen Company, Signal Oil and Gas Company, Standard Milling Company, and Talon, Incorporated.’
The second category encompasses those corporations that had outstanding two classes of common stock, where both classes had some form of voting rights but one class was identified as having superior voting rights. These companies also had no voting preferred stock outstanding, so that the two classes of common stock combined exercised exclusive voting power. This group includes Mary Carter Paint Company, Central Railroad Company of New Jersey, Columbia Broadcasting Systems, Incorporated, North American Cement Corporation, North American Rayon Corporation, Presidential Realty Corporation, Resorts International, Incorporated, Standard Power and Light Corporation, and Harvey Hubbell, Incorporated, prior to May 1969.
In several instances the distinction between the voting rights of the two classes of stock are slight. For example, the holders of the Class B stock of North American Cement Corporation are entitled to one vote per share in the election of a majority of the members of the board. The holders of the Class A stock are entitled to one vote per share for a minority of the members of the board. In short, the Class A stockholders are entitled to a minority position on the board of directors. The Class B stock has been identified as having superior voting rights.
Two additional cases will further illustrate the subtle distinctions between the voting rights of the two classes of common stock for a given company. The holder of the Class A stock of Presidential Realty Corporation receive one vote per share in the election of two-thirds of the members of the board, while the Class B stockholders receive one vote per share in the election of one-third of the members of the board. The Class A stock has been identified as having superior voting rights. For Harvey Hubbell, Incorporated, the Class A stockholders received 20 votes per share for the election of the
board, while the Class B stockholders receive one vote per share. The Class A stock has been identified as having superior voting rights.5
4This classification scheme is based solely on voting rights for election of directors, For example, the Class B stockholders of National Homes Corporation may not vote for members of the board of directors. However, they may vote as a class on any issue that would adversely affect their right to share equally in dividends with-class A stockholders. We classify National Homes as a category 1 company.
‘The effect of the voting irrangement in Presidential Realty Corporation is to give the Class B stockholders an unequivocal right to a minority representation on the board. The effect of the

452 R.C. Lease et al., The value of control
The third category of firms encompasses companies that have or have had outstanding two classes of common stock that differ only in their voting rights plus an issue of preferred stock that has some voting rights. This group includes American Maize Products Company, American Tobacco Company, Liggett and Myers Tobacco Company, and Harvey Hubbell, Incorporated, after May 1969. In May 1969, Hubbell issued a class of voting preferred stock. (Prior to May 1969, Hubbell is classified as a category 2 company).
The Class A shareholders of American Tobacco Company and Liggett and Myers Tobacco Company received one vote per share, while the Class B stockholders had no voting rights. For these two companies, the preferred stockholders were entitled to four votes per share. For American Maize Products Company, the Class B stockholders received one vote per share for 70 percent of the directors, while the Class A stockholders receive one vote per share for 30 percent of the directors. The preferred stockholders are entitled to 45 votes per share for each member of the board of directors. In Harvey Hubbell Corporation the Class A stockholders receive 20 votes per share, while the Class B shareholders receive one vote per share. The preferred stockholders are entitled to one vote per share as well.
For each company in the third category, determination of which class of common stock has superior voting rights is straightforward. These are the Class A stockholders in American Tobacco, Liggett and Myers, and Harvey Hubbell and the Class B stockholders in American Maize Products. However, because the preferred stockholders of each company also have or have had some voting rights, determination of which class or classes of stock would be able to elect a controlling representation to the board of directors is not quite so simple. On a per share basis, the voting preferred stockholders of American Tobacco, Liggett and Myers Tobacco, and American Maize Products have superior voting rights to those of either class of common stock. However, in Harvey I-I-ubbell the Class A stockholders have greater per share voting rights than the preferred stockholders.
4. Analysis of stock prices
4.1. Results with aggregated data
To measure the relative market value of voting rights for each company in
distribution of voting rights is less clearcut in the case of Hubbell Corporation. Representation on the board depends upon the number of shares outstanding. Given a sufficiently large number of Class B shares (relative to the number of Class A shares), the Class B stockholders could elect the entire board. Given a sufficiently small number of shares, the Class B stock could be precluded from any representation on the board. The exact representation will also depend upon whether voting for the board is share-for-share or cumulative. Because our classification scheme is based upon the voting rights per share, we have identified the Class A stockholders as having superior voting power.
R.C. Lease et al., The value of control 453
1.30-
1.25-
I .20-
0.95’ I I I I I I I I I 1 I 940 I%0 I980
YEAR
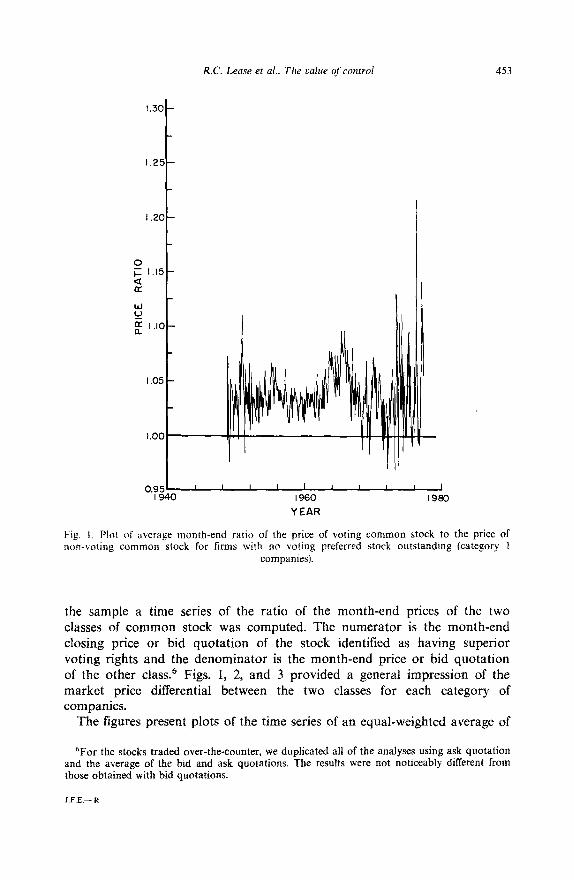
Fig. 1. Plot of average month-end ratio of the price of voting common stock to ^ . . the price of non-voting common stock tar fnms with no votrng preterred stock outstandmg (category 1
companies).
the sample a time series of the ratio of the month-end prices of the two classes of common stock was computed. The numerator is the month-end closing price or bid quotation of the stock identified as having superior voting rights and the denominator is the month-end price or bid quotation of the other class.6 Figs. 1, 2, and 3 provided a general impression of the market price differential between the two classes for each category of companies.
The figures present plots of the time series of an equaI-weighted average of
6For the stocks traded over-the-counter, we duplicated all of the analyses using ask quotation and the average of the bid and ask quotations. The results were not noticeably different from those obtained with bid quotations.
J.F.E.- R

454 R.C. Lease et al., The value of control
I .30 -
1.25-
1.20-
Ol.l5-
s
0” a I .I0 - a
I .05 -
0.951 I I I L I I I I
1940 I960 YEAR
a I980
Fig. 2. Plot of average month-end ratio of the price of common stock with superior voting rights to the price of common stock with inferior voting rights for firms with no voting preferred
stock outstanding (category 2 companies).
the month-end price ratios of the companies in categories 1, 2, and 3,
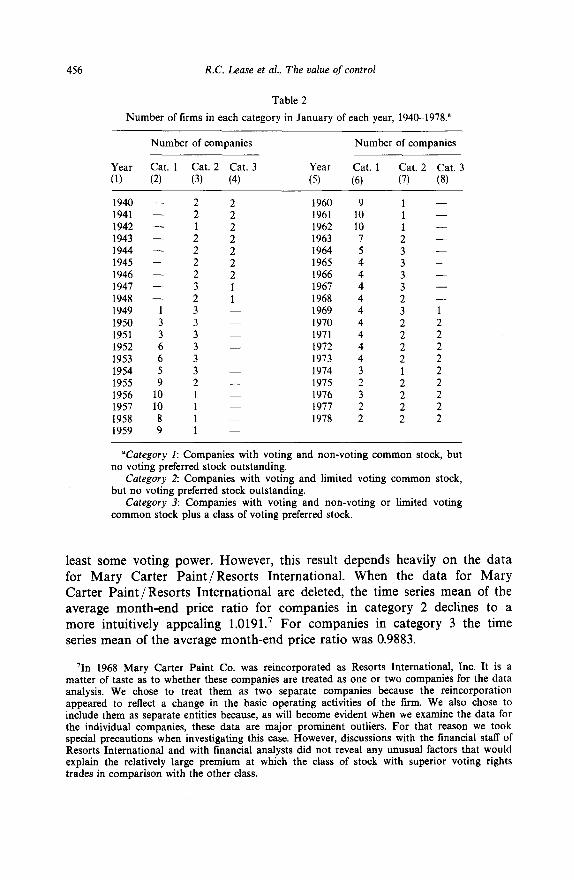
respectively. Over time the companies represented in the plots change as new stocks enter the sample and old ones drop out. Table 2 shows the number of companies included in each category in January of each year. For example, in January 1949, only one company is represented in the plot for category 1 and in January 1955 only two companies are represented in category 2. Over the period 1949 to 1969, no companies are represented in category 3.
Figs. 1 and 2 show that the average month-end price ratios for those companies in categories 1 and 2 were generally greater than 1.0 indicating that superior voting rights for companies in these groups generally commanded a price premium. However, fig. 3 shows that the average month-

R.C. Lease et al., The aalue of control 455
I .30
1.20 I
1.25
0 1.15 -
k cf -
Zl.lO- z a
I .05 -
YEAR
Fig. 3. Plot of average month-end ratio of the price of the common stock with superior voting rights to the price of the common stock with inferior voting rights for firms with voting
preferred stock outstanding (category 3 companies).
end price ratio for category 3 companies was generally less than 1.0, indicating that the common stocks with superior voting rights typically sold at a price discount relative to the common stock with inferior voting rights.
Table 3 displays the mean and sample standard deviation of the average month-end price ratio for each category, along with the total number of observations of each ratio, the number of observations greater than 1.0, and the number of observations less than 1.0. These data provide confirmation of the results shown in figs. 1, 2, and 3.
For the companies in categories 1 and 2 the time series mean of the average month-end price ratios were 1.0379 and 1.0695, respectively. The higher average price ratio for companies in category 2 is surprising given that the class of stock with inferior voting rights for this category had at
456 R.C. Lease et al., The value of control
Table 2
Number of firms in each category in January of each year, 194C-1978.”
Year (1)
Number of companies
Cat. 1 Cat. 2 Cat. 3 (2) (3) (4)
Year (5)
Number of companies
Cat. 1 Cat. 2 Cat. 3 (6) (7) (8)
1940 - 2 2 1941 - 2 2 1942 - 1 2 1943 - 2 2 1944 - 2 2 1945 - 2 2 1946 - 2 2 1947 - 3 1 1948 - 2 1 1949 1 3 1950 3 3 1951 3 3 1952 6 3 - 1953 6 3 1954 5 3 - 1955 9 2 - 1956 10 1 1957 10 1 1958 8 1 1959 9 1
1960 9 1 1961 10 1 1962 10 1 - 1963 7 2 - 1964 5 3 1965 4 3 - 1966 4 3 - 1967 4 3 - 1968 4 2 - 1969 4 3 1 1970 4 2 2 1971 4 2 2 1972 4 2 2 1973 4 2 2 1974 3 1 2 1975 2 2 2 1976 3 2 2 1977 2 2 2 1978 2 2 2
“Category 1: Companies with voting and non-voting common stock, but no voting preferred stock outstanding.
Category 2: Companies with voting and limited voting common stock, but no voting preferred stock outstanding.
Category 3: Companies with voting and non-voting or limited voting common stock plus a class of voting preferred stock.
least some voting power. However, this result depends heavily on the data for Mary Carter Paint /Resorts International. When the data for Mary Carter Paint/Resorts International are deleted, the time series mean of the average month-end price ratio for companies in category 2 declines to a more intuitively appealing 1.0191. ’ For companies in category 3 the time series mean of the average month-end price ratio was 0.9883.
‘In 1968 Mary Carter Paint Co. was reincorporated as Resorts International, Inc. It is a matter of taste as to whether these companies are treated as one or two companies for the data analysis. We chose to treat them as two separate companies because the reincorporation appeared to reflect a change in the basic operating activities of the firm. We also chose to include them as separate entities because, as will become evident when we examine the data for the individual companies, these data are major prominent outliers. For that reason we took special precautions when investigating this case. However, discussions with the financial staff of Resorts International and with financial analysts did not reveal any unusual factors that would explain the relatively large premium at which the class of stock with superior voting rights trades in comparison with the other class.

R.C. Lease et al., The value of control 451
Statistical comparisons of average month-end market price ratios of publicly-traded stocks that differed in their voting rights, 1940-1978
(grouped by category of voting rights).
Cat.”
(1)
Time series mean of month-end average price ratios Sample (price of stock with standard superior voting rights deviation of
Number divided by average of price of stock with month-end companies inferior voting rights) price ratio
(2) (3) (4)
1 18 1.0379 0.0288 2 9 1.0695 0.1126 3 4 0.9883 0.0176
2b 7 1.0191 0.0361
Number of Number of observations observations of average of average month-end month-end price price ratio ratio > 1.0
(5) (6)
Number of observations of average month-end price ratio < 1.0
(7)
1 18 360 336 24 2 9 468 393 61 3 4 214 39 170
2b 7 440 326 81
P-value of t-test
(8)
P-value of sign-test
(9)
P-value of Wilcox matched-pair signed-rank test
(10)
1 18 0.000 0.000 0.000 2 9 0.000 0.000 0.000 3 4 0.000 0.000 0.000
2b 7 0.000 0.000 0.000
“Category I: Companies with voting and non-voting common stock, but no voting preferred stock outstanding.
Category 2: Companies with voting and limited voting common stock, but no voting preferred stock outstanding.
Category 3: Companies with voting and non-voting or limited voting common stock plus a class of voting preferred stock.
bResults for category 2 when data for Mary Carter Paint/Resorts International are deleted.
‘P-value is the probability of observing the computed value of the t-statistic if the log of the true price ratio is zero.

458 R.C. Lease et al., The value of control
The null hypothesis to be tested is that the two classes of stock for the companies in each category are priced identically. Under the null hypothesis, differences in the observed closing prices of the two classes of stock issued by a given company will differ only because of differences in the intra-day trading behavior of the two securities. Because observed closing price differences will reflect differences in the intra-day timing of transactions, reported non-zero differences in the closing prices of the two classes of stocks can be consistent with the null hypothesis. Formal statistical tests are necessary to determine if the closing price differences are sufficiently large and systematic to reject the hypothesis that price differences merely reflect
non-synchronous intra-day trading of the otherwise identically priced stocks. Three tests of the null hypothesis that the two classes of stock of the
companies in each category trade at equal prices were conducted. The first is the t-test that the mean of the logarithms of the average month-end price ratios is equal to zero. The results are presented in column 8 of table 3. For the companies in categories 1 and 2, the mean of the logarithm of the average month-end price ratios is significantly greater than zero at the 0.01 level. For the firms in category 3, the mean of the logarithm of the average monthly price ratios is significantly less than zero at the 0.01 level.
Non-parametric analysis supports the t-test results. For each category, each observation of the average month-end price ratio was categorized as ‘ + ‘, ‘O’, or ‘ -‘, depending upon whether it was > 1.0, = 1.0, or < 1.0. The
sign test and the Wilcox matched-pair sign-ranked test were conducted,
assuming that ‘ + ’ and ‘-’ observations were equally likely to occur. The ‘0 observations were omitted from the computations. Columns 9 and 10 of
table 3 present the results. For companies in category 1, the number of positive observations (336)
exceeds the number of negative observations (24) by a margin that is significant at the 0.01 level according to both the sign and Wilcox tests. The same is also true for companies in category 2. For companies in category 3 there were 170 negative observations and 39 positive ones. The number of _’ observations were significantly greater than the number of ‘+’
observations at the 0.01 level. The statistical analyses of the average month-end price ratio data indicate
that when corporations have only voting and non-voting common stock outstanding, the voting stock trades at a premium relative to the non-voting stock. When corporations have outstanding two classes of common stock both having voting rights, but one of which has voting rights that can be identified as being superior to those of the other class, the one with superior voting rights trades at a premium. However, when a corporation has outstanding two classes of common stock that differ in their voting rights, along with a class of voting preferred stock, the common stock with superior voting rights trades at a discount relative to the common stock with inferior
R.C. Lease et al., The value of control 459
voting rights. Examination of the price data for the individual companies supports these conclusions.
4.2. Results for individual companies
Table 4 contains the mean of the time series of the month-end price ratio for each company (column 2), along with the sample standard deviations of the price ratios (column 3), the total number of monthly observations of the
price ratio for each company (column 4), the number of observations greater than 1.0 (column 5), and the number of observations less than 1.0 (column 6). The mean number of monthly observations of the price ratio per company is 100 and the median is 104, or approximately eight and one-half years of observations. The most observations is 227 months for Columbia Broadcasting Corporation and the fewest is 35 months for Standard Milling
Company. The same three statistical tests described above were conducted with the
data for each individual firm. The results of these tests are reported in columns 7, 8, and 9 of table 4.
For each of the firms in category 1 the mean of the monthly price ratios exceeds 1.0. For the companies in this group, the largest average price
premium is 11.65 percent for Plymouth Rubber; the smallest is 0.68 percent for A.C. Nielsen. The median of the average price premiums is 2.67 percent. According to the t-test, the null hypothesis that the mean of the logarithms of the ratio of prices of the two classes of stock equals zero can be rejected at the 0.01 level of significance for all but one company in category 1. The one company for which the null hypothesis cannot be rejected at that level is Standard Milling, the company with the fewest monthly price observations. For Standard Milling the null hypothesis can be rejected at the 0.03 level of significance according to the t-test.
The results of the non-parametric tests support those of the t-test. For each company in category 1, the number of ‘+’ monthly observations exceeds the number of ‘-’ observations by a significant margin. For all but one company the null hypothesis can be rejected at the 0.01 level according to both the sign test and the Wilcox matched-pair sign-ranked test’. For Standard Milling the hypothesis is rejected at approximately the 0.03 level
according to both non-parametric tests. For companies in category 2, the largest average month-end price
premium is 42.05 percent for Mary Carter Paint Co. The smallest is 0.81 percent for Columbia Broadcasting Systems, Inc. The median of the average price premiums is 2.70 percent. According to the r-test the null hypothesis that the mean of the logarithms of the month-end price ratios equals zero can be rejected at the 0.01 level of significance for every company in this category. Similar results obtain for the non-parametric tests. For each

Tab
le
4 %
St
atis
tical
co
mpa
riso
n\
of
mar
ket
pric
es
of
publ
icly
-tra
ded
stoc
ks
that
di
ffer
ed
in
thei
r vo
ting
righ
ts,
194&
1978
(r
esul
ts
for
indi
vidu
al
com
pani
es).
0
Com
pany
(1)
Tim
e se
ries
m
ean
of m
onth
-end
pr
ice
ratio
s (p
rice
of
sto
ck
with
su
peri
or
votin
g ri
ghts
di
vide
d by
pr
ice
of s
tock
w
ith
infe
rior
vo
ting
righ
ts)
(2)
Cat
egor
y I
Atla
s C
redi
t C
orp.
B
row
n-Fo
rman
D
istil
lers
C
orp.
C
anno
n M
ills
Co.
C
ollin
s R
atio
C
o.
Cor
by
(H.)
Dis
tille
ry,
Ltd
. D
i G
iorg
io
Frui
t C
orp.
Fo
rd
Mot
or
Co.
of
C
anad
a L
td.
Han
na
(M.A
.)
Co.
H
oove
r C
ompa
ny
Kew
anee
O
il C
o.
Nat
iona
l H
omes
C
orp.
N
iels
en
(A.C
.)
Co.
Pa
rker
Pe
n C
o.
Plym
outh
R
ubbe
r C
o.,
Inc.
Sh
eaff
er
(W.A
.)
Pen
co.
Sign
al
Oil
& G
as
Co.
St
anda
rd
Mill
ing
Co.
T
alon
, In
c.
Num
ber
of
Num
ber
of
Sam
ple
obse
rvat
ions
ob
serv
atio
ns
P-va
lue
stan
dard
N
umbe
r of
of
of
of
Wilc
ox
devi
atio
n of
ob
serv
atio
ns
mon
th-e
nd
mon
th-e
nd
P-va
lues
P-
valu
es
mat
ched
-pai
r m
onth
-end
of
mon
th-e
nd
pric
e pr
ice
of
of
sign
ed-r
ank
pric
e ra
tio
pric
e ra
tio
ratio
>
1.0
ratio
<
1.0
t-te
sta
sign
-tes
ts
test
=
(3)
,(4)
(5
) (6
) (7
) (8
) (9
) P 9
1.01
22
0.01
96
36
15
1 0.
001
0.00
0 0.
000
1.04
88
0.07
24
216
151
53
0.00
0 0.
000
0.00
0 1.
0196
0.
0201
13
2 10
6 4
0.00
0 0.
000
0.00
0 1.
0198
0.
0186
48
38
1
0.00
0 0.
000
0.00
0
1.03
01
0.03
44
156
125
24
0.00
0 0.
000
0.00
0 1.
0216
0.
0260
10
4 71
7
0.00
0 0.
000
0.00
0
1.07
55
0.07
44
86
79
4 1.
0233
0.
0189
11
8 10
2 0
1.04
28
0.04
14
39
32
1 1.
0290
0.
0278
60
50
0
1.04
01
0.04
52
100
86
2 1.
0068
0.
0179
16
2 73
33
1.02
64
0.02
97
146
113
16
0.00
0
0.00
0 0.
000
0.00
0 0.
000
0.00
0
0.00
0
1.11
65
0.10
86
98
4
0.00
0 0.
000
0.00
0 0.
000
0.00
0 0.
000
0.00
0
0.00
0
0.00
0 0.
000
0.00
0 0.
000
O.o
oO
0.00
0
0.00
0
0.00
0 0.
000
1.02
42
0.03
59
1.07
50
0.05
22
1.00
74
0.01
92
1.02
96
0.03
48
112 94
107 35
13
3
60
9 0.
000
0.00
0 0.
000
106
1 0.
000
0.00
0 0.
000
5 0
0.02
9 0.
03 1
0.
022
108
13
0.00
0 0.
000
0.00
0

Cat
egor
y 2
Car
ter
(Mar
y)
Pain
t C
o.
Cen
tral
R
ailr
oad
Co.
of
New
Je
rsey
C
olum
bia
Bro
adca
stin
g Sy
stem
s,
Inc.
H
arve
y H
ubbe
ll,
Inc.
(l
/6&
5/69
) N
orth
A
mer
ican
C
emen
t C
orp.
N
orth
A
mer
ican
R
ayon
C
orp.
Pres
iden
tial
Rea
lty
Cor
p.
Res
orts
In
tern
atio
nal,
Inc.
St
anda
rd
Pow
er
& L
ight
C
orp.
Cat
egor
y 3
Am
eric
an
Mai
ze
Prod
ucts
C
o.
Am
eric
an
Tob
acco
C
o.
Har
vey
Hub
bell,
In
c.
(7/6
9-12
/78)
L
igge
tt &
Mye
rs
Tob
acco
co
.
1.42
05
0.28
35
1.03
06
0.08
73
53
60
47
6
28
20
1.00
81
0.01
64
227
138
50
1.01
70
0.02
20
108
81
16
1.01
84
0.03
62
46
30
13
0.00
1
1.00
82
0.02
16
109
62
24
0.00
0
1.02
76
0.05
44
184
103
31
0.00
0
1.25
40
0.22
29
121
113
4 0.
000
1.03
77
0.06
39
96
75
8 0.
000
0.98
51
0.02
75
107
0.98
25
0.01
23
99
0.99
70
0.02
60
116
0.98
55
0.01
27
84
22 5
45
12
65
90
61
70
0.00
9
0.00
0 0.
000
0.00
0 0.
000
0.12
0
0.00
0
0.00
0
0.15
6
0.00
0 0.
000
0.00
7
0.00
0
0.00
0
0.00
0
0.00
0
0.00
0 0.
000
0.07
3
0.00
0
0.00
0
0.04
5
0.00
0 0.
000
0.00
1
0.00
0 .B
0.00
0
O.o
oO
; m
Z
0.00
0 _%
Y
Z E
0.00
0 O
.O@
O
f q
0.03
0 s x ? zi
O
.ooO
“P-v
alue
is
th
e pr
obab
ility
of
ob
serv
ing
the
com
pute
d va
lue
of
the
test
st
atis
tic
if t
he
log
of t
he
true
pr
ice
ratio
is
zer
o.

462 R.C. Lease et al., The value of control
company, except Central Railroad of New Jersey, the null hypothesis can be rejected at the 0.01 level. For this company the distinction in voting rights between the two classes of stock is slight, but even here the null hypothesis can be rejected at the 0.15 level according to the sign test and at the 0.05 level according to the Wilcox test. * Thus, even when the distinction between
the voting rights of the two classes is slight, voting power does appear to command a statistically significant market value.
For the four companies in category 3 the picture is reversed. For each company the mean of the logarithms of the month-end price ratios is less than zero - the class of common stock identified as having superior voting rights traded at a lower price than the class of common stock with inferior voting rights. For three of the four companies the null hypothesis can be
rejected at the 0.01 level according to the t-test. For Harvey Hubbel, the hypothesis can be rejected at the 0.12 level. The average price discounts are 1.49 percent, 1.75 percent, and 1.45 percent, respectively, for American Maize Products, American Tobacco, and Liggett and Myers Tobacco. For Harvey Hubbell the average price discount is only 0.3 percent. For each of these companies the number of ‘-’ monthly observations exceeds the number of ‘+’ observations. For three of the companies the null hypothesis can be
rejected at the 0.01 level according to both non-parametric tests. For Harvey Hubbell, Inc. the hypothesis can be rejected at the 0.07 level according to the sign test and at the 0.03 level according to the Wilcox test. In light of these results it is interesting to recall our earlier discussion of Harvey Hubbell, Inc.
Hubbell issued its voting preferred stock in May 1969. Prior to that time, the company had outstanding Class A common stock that received 20 votes per share and a Class B stock that received 1 vote per share. Before the issuance of the voting preferred, the Class A stock traded at a statistically significant premium relative to the Class B stock. In the period following the issuance of the voting preferred, the Class A stock traded at a significant discount.
Based on the results of the t-test and the non-parametric tests, shares with superior voting rights commanded a statistically significant premium in those cases wherein the company had outstanding either voting and non-voting common stock or two classes of voting common that differed only in their voting rights. Contrarily, common shares identified as having superior voting
“Central Railroad of New Jersey emerged from bankruptcy in 1950. At that time the two classes of common stock were issued. The Class B stock was given one vote per share for live of the nine corporate directors. The Class A stock was given one vote per share for four of the nine members of the board. However, in 1955 the voting rights of the two classes were to be reversed if the Class A stock had not been retired before that time. As it turns out, the Class A stock was retired in early 1955 so our sample covers only the period during which the Class B stock had slightly greater voting power than the Class A stock.

R.C. Lease et al., The value of control 463
rights relative to those of an otherwise identical class of common stock traded at a statistically significant price discount relative to the other class of common when the company also had outstanding a class of voting preferred
stock.’ The answer to the question of whether these premiums and discounts are economically significant lies, to a large extent, in the eye of the beholder.
4.3. Aggregate market values of voting premiums and discounts
To provide some indication of the total dollar amounts and economic importance of the price premiums and discounts, an estimate of the market value of the average month-end premium or discount for each company was calculated as
and
Qji is an estimate of the dollar amount of the price premium for company j in year i; PRjit is the price ratio for company j at month-end t in year i (t = 1 is January, t = 2 is February,. ., t = 12 is’ December); Pji12 is the year-end price of the stock with inferior voting rights outstanding at year-end i for company j; Nji is the number of shares of the common stock with superior voting rights outstanding in year i for company j; and Tj is the number of years for which data are available for company j. This represents the average
difference between the prices of the superior and inferior voting shares multiplied by the number of superior voting shares outstanding. Alternatively, it is the total incremental value of the superior voting class shares above the total value of an equal number of inferior voting class shares. Given that the two classes of common stock are entitled to the same
dividends and other capital payouts, this measures the total dollar market
‘The same three tests were conducted with the time series of month-end price differences. Specilically. a t-test of the hypothesis that the mean price difference between the two share classes equals zero was conducted for each firm and the sign and Wilcox sign-ranked tests were conducted with the differences in prices. The results were indistinguishable from those in table 4. In several cases the log of the price ratios and the price differences were serially correlated. To correct for this problem the correlation coefficient was estimated with the Cochran-Orcutt iterative procedure. The statistical tests were corrected for serial correlation according to the method developed by Kadiyala (1968). See also Theil (1971, ch. 6).

464 R.C. Lease et al., The value of control
Table 5
Estimated total market values of price premiums and discounts of stocks with superior voting rights for companies with two classes of common stock that differed in their voting rights,
194&1978.
Company (1)
Actual dollar Constant 1978 dollars average premium average premium or discount or discount (2) (3)
Category 1
Atlas Credit Corp. Brown-Forman Distillers Corp. Cannon Mills Co. Collins Radio Co. Corby (H.) Distiller, Ltd. Di Giorgio Fruit Corp. Ford Motor Co. of Canada, Ltd. Hanna (M.A.) Co. Hoover Co. Kewanee Oil Co. National Homes Corp. Nielsen (AC.) Co. Parker Pen Co. Plymouth Rubber Co., Inc. Sheaffer (W.A.) Pen Co. Signal Oil & Gas Co. Standard Milling Co. Talon, Inc.
Equal-weighted mean Time-weighted mean Median
Category 2
Carter (Mary) Paint Co. Central R.R. Co. of New Jersey Columbia Broadcasting Systems, Inc. Hubbell (Harvey), Inc. (prior to S/69) North American Cement Corp. North American Rayon Corp. Presidential Realty Corp. Resorts International, Inc. Standard Power & Light Corp.
Equal-weighted mean Time-weighted mean Median L
Category 3
American Maize Products Co. American Tobacco Co. Hubbell (Harvey), Inc. (after S/69) Liggett & Myers Tobacco Co.
Equal-weighted mean Time-weighted mean Median
$ $
248,925 557,138 2,045,619 4,347,025 1,606,322 3,095,567
344,765 843,580 437,930 1,064,8 15
59,969 149,653 404,270 1,006,960
2,445,859 5,962,304 202,082 499,218 740,433 1,604,269 787,329 1,835,679 458,524 736,919 189,619 450,500 287,156 433,833 158,200 332,154
2,384,408 5,558,680 8,695 19,657
250,535 607,434
725,591 1,616,967 854,671 1,881,125 374,518 790,250
1,721,046 204,200 368,446 274,429 132,184 73,182 98,926
1,377,694 293,289
504,822 430,291 274,429
-205,212 .- 268,747 - 1,639,500 -6,186,073
- 130,262 - 168,819 - 964,943 - 3,823,802
- 734,976 -2,611,860 -721,179 - 2,539,144 - 585,072 - 2,046,274
3,569,272 549,513
1,004,144 581,268 316,459 259,851 167,935
1,538,685 760,65 1
971,975 827,819 581,268

R.C. Lease et al., The ualue of control 465
value of the greater control that results from the possession of superior voting rights. The results of these computations for each company are presented in table 5, along with an estimate of the equal-weighted mean, the median, and a time-weighted mean for the companies in each category.” Both the actual dollar and 1978 constant dollar amounts are presented.
For the companies in category 1 the actual dollar equal-weighted mean of the total price premiums is $725,591; the time-weighted mean is $854,671; the median is $374,518. For the individual companies, all but one h,ave estimated market price premiums in excess of $50,000, and all but two have premiums in excess of $100,000. The largest estimated market price, premium is $2,445,859. Only the actual dollar amount of the price premium of Standard Milling Co., $8,695, appears to be of an order of magnitude that can be considered to be of questionable economic significance. The overall impression is that the price premiums of companies in this category are economically important.
A similar conclusion is appropriate for the companies in category 2. The equal-weighted mean of the actual dollar price premiums for these companies is $504,822; the time-weighted mean is $430,291; and the median is $274,429. For the individual companies, the largest estimated price premium is $1,721,046; all have estimates in excess of $50,000; and all but two are in excess of $100,000.
For category 3 companies, the price discounts appear economically sign&ant when measured in actual dollars. For this category the actual dollar equal-weighted mean of the discounts is $734,976; the time-weighted mean is $721,179; and the median is $585,072. For the individual companies, the largest estimated total price discount is $1,639,500 and each is in excess of $100,000.
Because the’ time period studied covers 38 years, a more meaningful comparison of the market value of the premiums and discounts would be on a constant dollar basis. This comparison is given in the last column of table 5 based on 1978 dollars. The market value of the premiums or discounts for each year have been rolled forward to 1978 using the Consumer Price Index from 1940 through 1977.
For companies in category 1, the equal-weighted mean is %1,616,967; the time-weighted mean is $1,881,125 and the median is $790,250. Now all but one company has a market price premium in excess of $100,000. In category 2, the equal-weighted, time-weighted, and median premiums are $971,975, $827,819, and $581,268, respectively. The smallest premium, for Presidential Realty, exceeds $165,000. Finally, for category 3, the discounts in 1978 dollars are $2,611,860, $2,539,144, and $2,046,274, respectively, for the equal-
loThe equal-weighted mean was computed as Bl 0,/J, where Jk is the number of companies in category k. The time-weighted mean was computed as D 1 XI’_“, Q,J(T#&.

466 R.C. Lease et al., The value of control
weighted mean, the time-weighted mean, and the median. The smallest discount, for Harvey Hubbell, is $168,819.
5. Commentary
The evidence in section 4 indicates that when firms have two classes of common stock outstanding that differ only in their voting rights, the shares of the class with the superior voting power command a premium market price relative to the other class. What remains to be determined is the source of the premium. A further puzzle to be resolved is why common stock with dominant voting power sells at a discount to inferior voting stock when an issue of voting preferred also is outstanding.
One possible solution to the puzzles is that the pricing of the classes of shares contradicts a fundamental principle of finance - namely that two securities with identical future payoffs will trade at identical prices. A more satisfying explanation is that voting power entitles the holder of at least one class of stock to incremental direct or indirect payoffs in at least some states of nature.
The corporate charters explicitly state that the two classes of stock are to receive identical cash dividends and that they will share on a pro rata basis if the firm is liquidated. l1 Thus, the source of the incremental cash flow is not obvious. One possible means by which a class of stock could receive a direct incremental payoff is for the board of directors to direct the corporation to buy back some shares of that class at an above-market price. If this were possible, the holders of the class of stock with voting control could elect a board of directors who would direct the company to buy back their stock through a tender offer at an above-market price.
However, the provisions of the corporate charters rule out the possibility of such a stock repurchase. First, if the shares repurchased represent a partial liquidation of the firm, the corporate charter requires that both classes of stock be treated equally. Thus, any tender offer would be required to include both classes. Second, in some instances the courts have recognized cash disbursements by means of share repurchase at a premium price as a cash dividend. Again, that interpretation dictates that both classes be included in the tender offer. Third, many charters state that both classes shall be ‘treated equally in all matters’.
Finally, there is also empirical support for the view that the corporate charters prohibit, either directly or indirectly, such tender offers. We searched the Wall Street Journal Index for the years 1958-1978 and the index of the Commercial and Financial Chronicle for the years 194&1957 for any instances
“From the Moody’s Manuals we determined that the two classes of stock issued by each company did, in fact, receive identical cash and stock dividends.

R.C. Lease et al., The value of control 467
in which the firms in the sample were engaged in tender offers to repurchase shares of the class of common stock with superior voting rights on favorable terms. We found none.
Yet another way in which the firm can provide direct incremental cash payments is to issue new stock to one class of stockholders at a below- market price through a rights offering. However, a search of the corporate charters revealed that only four of the companies in our sample grant the preemptive right. Three of these companies grant identical preemptive rights to both classes of stock.12 For American Maize Products only the superior voting shares (Class B) have preemptive rights. However, the Class B shares of American Maize Products are priced at a discount relative to the Class A shares. That is, the Class A shares of American Maize Products are valued higher than the Class B shares even though they carry inferior voting rights and no preemptive rights. For the other companies in the sample the corporate charters appear to preclude this mechanism as a means for granting explicit incremental payoffs to the holders of one class of common stock.
There may, of course, be other ways in which the firm can make direct incremental cash payoffs to one class of common stockholders. However, all of the obvious ways appear to be banned by the Articles of Incorporation leaving indirect cash and non-cash payments as the alternative explanation.13
Both Manne (1964) and Jensen and Meckling (1976) suggest that control or voting control of a corporation is valuable. The source of the value is the additional compensation and perquisites that the controlling securityholders can accord themselves. The market price premiums computed for the class of shares with superior voting rights for the category 1 and 2 companies is consistent with that hypothesis. However, this line of argument is at best only a partial answer. It cannot explain the observed price discounts on common stock with superior voting rights when voting preferred stock is also outstanding. It could be argued, of course, that incremental salaries and perquisites are captured by the voting preferred stockholders. At an extreme, however, the two classes of common stock should then sell at identical prices.
An alternative explanation of the discounts is that there are some costs as
rZExcept that Class A stockholders have the right to subscribe to new issues of Class A shares and Class B stockholders have the right to subscribe to new issues of Class B shares.
r3The observation that the share price premium can be explained by potential future tender offers at differential prices is consistent with the hypothesis that control gives rise to incremental direct or indirect payoffs. That is, a potential acquirer or ‘raider’ should be willing to offer the same tender price for both classes of stock unless ownership of one class provides some incremental benefits in at least one state of nature. Interestingly, in the one case in our sample in which a firm was acquired, both classes of shareholders were treated equally. Specifmally, according to the terms of the merger, Marquette Cement Company exchanged 1.25 shares of its common stock for each share of Class A and Class B stock of North American Cement.

468 R.C. Lease et al., The due of control
well as benefits associated with corporate control. For the majority of firms in our sample, the class of shares with superior voting rights traded at a premium relative to the non-voting or limited voting shares. In these cases the incremental positive payoffs to those holding voting control appear to outweigh any costs that might be associated with this privilege. However, when voting control is shared with or held by a -class of voting preferred stock, the incremental value of the control may be diluted such that potential costs of voting control dominate and the superior voting class of common trades at a discount relative to the inferior voting class of common.14
In the final analysis, although we can speculate on the origin of the observed voting premiums and discounts, we are unable to provide a complete and internally consistent explanation for the relationship between the prices of classes of common stock that differ only in the degree of control over’ the firm’s activities which they confer upon their owners. We can, however, safely reject the null hypothesis that we set out to test. Specifically, the accumulated evidence indicates that there is a consistent relationship between security value and corporate control. The straightforward implication is that the future potential consumption opportunities provided
r4The curiosities raised by these results motivated us to investigate other aspects of the firms in the sample. To do so we examined every reference to each company that appeared in the Wall Street Journal Index from 1958 throuah 1978 and in the Commercial and Financial Chronicle Index from 1940 through 1958. We-also examined all available annual reports and prospectuses, although these were not comprehensive for each company in the sample. Finally, we examined the annual write-ups in Moody’s Manuuls for each year the company had two classes of stock outstanding. This search yielded very little information of significance. For example, none of the companies were the target of a tender offer during the time both classes of stock were outstanding and none were involved in contested proxy votes.
We did conduct three additional examinations of the data based on the information gathered. First, for ten of the companies it was possible to identify ‘announcement’ dates on which information regarding the issuance or retirement of the limited voting shares appeared in the financial press. We conducted an ‘event-time’ study of common stock returns centered around these dates. The results were inconclusive.
Second, annual meeting dates were also obtained from the Moody’s Manuals. For each company the mean price ratio five months, four months, three months, two months and one month before the annual meeting was compared with the mean price ratio one month and two months after the annual meeting. Again the results were inconclusive.
Third, the month-end price ratios were examined for the twelve months preceding the retirement of the two classes of shares. For six companies in categories 1 and 2 our price data included the month immediately preceding the retirement of the two classes of shares. In all six cases the explicit payoffs to both classes at(retirement were identical. Twelve months prior to retirement the average month-end price ratto of the six firms was 1.028. Six months prior to retirement the average ratio was 1.014. During the month immediately preceding retirement the average price ratio was 1.005. At that time the largest of the six price ratios was 1.015 and three of the six ratios were 1.000. The decline in average price ratios over the twelve months prior to retirement suggests that the present value of incremental benefits decreases after the announcement that the two classes of shares are to be retired on identical terms. These average ratios do not identify the source of the price differences twelve months prior to retirement, but the general decline in the average ratio prior to retirement suggests that the differences between the valuations of the classes represent the present value of a stream of incremental benefits into the future.

R.C. Lease et al., The value of control 469
by a common stock depend upon the degree to which ownership of the security also conveys control over the firm’s activities.r5
6. Summary and conclusion
In this paper we test the hypothesis that the future consumption opportunities provided by a common stock depend upon the degree of control over the firm’s activities which ownership of the stock conveys. The hypothesis is tested with a sample of 30 firms that have had two classes of common stock outstanding sometime over the interval 1940 to 1978. According to the Articles of Incorporation of the companies that issued the stocks, the two classes confer upon their owners identical rights to future dividend payments and capital distributions. However, the two classes differ in the voting rights which they confer upon their owners. Thus, the two classes of stockholders differ in the degree of control they can exercise over the firm’s activities. In addition to two classes of common stocks, four of the companies in the sample had outstanding a class preferred stock which conveyed some voting rights.
For the 26 firms that have had two classes of common stock outstanding, but have had no voting preferred stock outstanding, the class of common stock with superior voting rights generally has traded at a premium relative to the other class of common stock. This relationship has persisted through time and across firms. The average of the mean price premiums for the stocks in this group of firms was 5.44 percent. For 729 of 828 monthly observations (or 88 percent) the equal-weighted average of the ratios of the month-end prices of the stock with superior voting rights to the price of the stock with inferior voting rights was greater than 1.0. However, the relative pricing was reversed for the four firms with an ownership structure that also included a class of voting preferred stock. For these firms the class of common stock with superior voting rights typically has traded at a discount relative to the class of common stock with inferior voting rights. The average of the mean price discounts for the stocks in this group of firms was 1.25 percent. For 170 of 214 observations (or 79 percent) the monthly equal- weighted average price ratios of the class of common stock with superior voting to the class of stock with inferior voting rights were less than 1.0.
For those firms with consistent voting premiums the most plausible explanation is that the holders of the common stock with superior voting rights have the potential to receive some incremental benefits that are not
“It has been suggested that the observed price differences between the two classes of stock are due to dilIerences in their trading ‘liquidity’. That is, it has been suggested that the premium is associated with the class of stock having greater trading volume. In general, we found the opposite to be true. The class of stock with inferior voting rights traded more frequently and in greater volume than the other class.

470 RX. Lmse et al., The value of control
received by the holders of the common stock with inferior voting rights. But the Articles of Incorporation imply that the premiums are not due to differential direct dividend payments or capital distributions. Instead, holders of the claims with superior voting rights appear to have the potential to receive some form of indirect cash or nonpecuniary payoff not received by the holders of the other class of common stock. The precise form of these indirect payoffs is unknown.
For those firms with consistent voting discounts the most plausible explanation is that there are some incremental costs borne by the holders of the class of common stock with superior voting rights that are not borne by the other class of common stockholders. The fact that the costs predominate in those cases where the firm also has outstanding a class of voting preferred stock suggests that the way in which the benefits and costs of corporate control are distributed among securityholders depends to some degree upon the complexity of the firm’s ownership structure.
A final caveat is in order. Although our evidence suggests that there are both costs and benefits to corporate control, it does not imply that differences in voting rights bring about the expropriation of any class of the firm’s securityholders. Presumably, the observed price differences accurately reflect differential expected payoffs to the two classes of stockholders. Additionally, the observed systematic price differences do not imply that the firms’ investment and financing decisions are suboptimal. The price differences may reflect unequal indirect cash or non-cash payoffs that are consistent with the maximization of firm value.
References
Alchian, A.A., 1969, Corporate management and property rights, in: H.G. Manne, ed., Economic policy and the regulation of corporate securities (American Enterprise Institute, Washington, DC).
Alchian, A.A. and H. Demsets, 1972, Production, information cost, and economic organization, American Economic Review 62, no. 5, 777-795.
Bank and Financial Manual, 1940-1978 (Moody’s Investors Service, New York). Berle, A.A., Jr. and G.C. Means, 1932. The modern corporation and private property
(Macmillan, New York). Commercial and Financial Chronicle, 1940-1957 (Wm. B. Dana Co., New York). Fama, E.E., 1980, Agency problems and the theory of the firm, Journal of Political Economy
88, no. 2,288307. Grossman, S.J. and O.D. Hart, 1980, Takeover bids, the free-rider problem, and the theory of
the cornoration, Bell Journal of Economics 11, no. 1,42-69. Industrial Manual, 1940-1978 (Moody’s Investor Service, New York). Jensen, M.C. and W.H. Meckling, 1976, Theory of the firm: Managerial behavior, agency costs,
and ownership structure, Journal of Financial Economics 3, no. 4, 305-360. Kadiyala, K.R., 1968, A transformation used to circumvent the problem of autocorrelation,
Econometrica 35, no. 136.93-96. Manne, H.G., 1964, Some theoretical aspects of share voting, Columbia Law Review 64, 534
554. Manne, H.G., 1965, Mergers and the market for corporate control, Journal of Political Economy
73, no. 2, 11@120.

R.C. Lease et al., The value of control 411
Meeker, L.G. and O.M. Joy, 1980, Price premiums for controlling shares of closely held stock, Journal of Business 53, no. 3,297-314.
Monthly Stock Guide, 1940-1949 (G.J. Lawrence and Sons, New York). Security Owner’s Stock Guide, 1950-1978 (Standard and Poor’s, New York). Stevens, W.H.S., 1938, Voting rights of capital stock and the shareholders, Journal of Business
11, no. 4, 311-348. Theil, H., 1971, Principles of econometrics (Wiley, New York). Transportation Manual, 1940-1978 (Moody’s Investors Service, New York). Wall Street Journal, 1940-1979 (Dow-Jones, New York). Wall Street Journal Index, 1958-1979 (Dow-Jones, New York).
Related Documents