BioMed Central Page 1 of 7 (page number not for citation purposes) BMC Genomics Open Access Research article Pigs in sequence space: A 0.66X coverage pig genome survey based on shotgun sequencing Rasmus Wernersson †1 , Mikkel H Schierup †2 , Frank G Jørgensen 2 , Jan Gorodkin 3 , Frank Panitz 4 , Hans-Henrik Stærfeldt 1 , Ole F Christensen 2 , Thomas Mailund 2 , Henrik Hornshøj 4 , Ami Klein 3 , Jun Wang 5,6 , Bin Liu 6 , Songnian Hu 6 , Wei Dong 6 , Wei Li 6 , Gane KS Wong 6 , Jun Yu 6 , Jian Wang 6 , Christian Bendixen 4 , Merete Fredholm 3 , Søren Brunak 1 , Huanming Yang* 6 and Lars Bolund* 5,6 Address: 1 Center for Biological Sequence Analysis, Technical University of Denmark, Lyngby, Denmark, 2 Bioinformatics Research Center, University of Aarhus, Aarhus, Denmark, 3 Division of Genetics, The Royal Veterinary and Agricultural University, Copenhagen, Denmark, 4 Department of Animal Breeding and Genetics, Danish Institute of Agricultural Sciences, Foulum, Denmark, 5 Institute of Human Genetics, University of Aarhus, Aarhus, Denmark and 6 Beijing Genomics Institute, Beijing, China Email: Rasmus Wernersson - [email protected]; Mikkel H Schierup - [email protected]; Frank G Jørgensen - [email protected]; Jan Gorodkin - [email protected]; Frank Panitz - [email protected]; Hans-Henrik Stærfeldt - [email protected]; Ole F Christensen - [email protected]; Thomas Mailund - [email protected]; Henrik Hornshøj - [email protected]; Ami Klein - [email protected]; Jun Wang - [email protected]; Bin Liu - [email protected]; Songnian Hu - [email protected]; Wei Dong - [email protected]; Wei Li - [email protected]; Gane KS Wong - [email protected]; Jun Yu - [email protected]; Jian Wang - [email protected]; Christian Bendixen - [email protected]; Merete Fredholm - [email protected]; Søren Brunak - [email protected]; Huanming Yang* - [email protected]; Lars Bolund* - [email protected] * Corresponding authors †Equal contributors Abstract Background: Comparative whole genome analysis of Mammalia can benefit from the addition of more species. The pig is an obvious choice due to its economic and medical importance as well as its evolutionary position in the artiodactyls. Results: We have generated ~3.84 million shotgun sequences (0.66X coverage) from the pig genome. The data are hereby released (NCBI Trace repository with center name "SDJVP", and project name "Sino-Danish Pig Genome Project") together with an initial evolutionary analysis. The non-repetitive fraction of the sequences was aligned to the UCSC human-mouse alignment and the resulting three-species alignments were annotated using the human genome annotation. Ultra- conserved elements and miRNAs were identified. The results show that for each of these types of orthologous data, pig is much closer to human than mouse is. Purifying selection has been more efficient in pig compared to human, but not as efficient as in mouse, and pig seems to have an isochore structure most similar to the structure in human. Conclusion: The addition of the pig to the set of species sequenced at low coverage adds to the understanding of selective pressures that have acted on the human genome by bisecting the evolutionary branch between human and mouse with the mouse branch being approximately 3 Published: 10 May 2005 BMC Genomics 2005, 6:70 doi:10.1186/1471-2164-6-70 Received: 13 December 2004 Accepted: 10 May 2005 This article is available from: http://www.biomedcentral.com/1471-2164/6/70 © 2005 Wernersson et al; licensee BioMed Central Ltd. This is an Open Access article distributed under the terms of the Creative Commons Attribution License (http://creativecommons.org/licenses/by/2.0 ), which permits unrestricted use, distribution, and reproduction in any medium, provided the original work is properly cited.

Welcome message from author
This document is posted to help you gain knowledge. Please leave a comment to let me know what you think about it! Share it to your friends and learn new things together.
Transcript
BioMed CentralBMC Genomics
ss
Open AcceResearch articlePigs in sequence space: A 0.66X coverage pig genome survey based on shotgun sequencingRasmus Wernersson†1, Mikkel H Schierup†2, Frank G Jørgensen2, Jan Gorodkin3, Frank Panitz4, Hans-Henrik Stærfeldt1, Ole F Christensen2, Thomas Mailund2, Henrik Hornshøj4, Ami Klein3, Jun Wang5,6, Bin Liu6, Songnian Hu6, Wei Dong6, Wei Li6, Gane KS Wong6, Jun Yu6, Jian Wang6, Christian Bendixen4, Merete Fredholm3, Søren Brunak1, Huanming Yang*6 and Lars Bolund*5,6Address: 1Center for Biological Sequence Analysis, Technical University of Denmark, Lyngby, Denmark, 2Bioinformatics Research Center, University of Aarhus, Aarhus, Denmark, 3Division of Genetics, The Royal Veterinary and Agricultural University, Copenhagen, Denmark, 4Department of Animal Breeding and Genetics, Danish Institute of Agricultural Sciences, Foulum, Denmark, 5Institute of Human Genetics, University of Aarhus, Aarhus, Denmark and 6Beijing Genomics Institute, Beijing, China
Email: Rasmus Wernersson - [email protected]; Mikkel H Schierup - [email protected]; Frank G Jørgensen - [email protected]; Jan Gorodkin - [email protected]; Frank Panitz - [email protected]; Hans-Henrik Stærfeldt - [email protected]; Ole F Christensen - [email protected]; Thomas Mailund - [email protected]; Henrik Hornshøj - [email protected]; Ami Klein - [email protected]; Jun Wang - [email protected]; Bin Liu - [email protected]; Songnian Hu - [email protected]; Wei Dong - [email protected]; Wei Li - [email protected]; Gane KS Wong - [email protected]; Jun Yu - [email protected]; Jian Wang - [email protected]; Christian Bendixen - [email protected]; Merete Fredholm - [email protected]; Søren Brunak - [email protected]; Huanming Yang* - [email protected]; Lars Bolund* - [email protected]
* Corresponding authors †Equal contributors
AbstractBackground: Comparative whole genome analysis of Mammalia can benefit from the addition ofmore species. The pig is an obvious choice due to its economic and medical importance as well asits evolutionary position in the artiodactyls.
Results: We have generated ~3.84 million shotgun sequences (0.66X coverage) from the piggenome. The data are hereby released (NCBI Trace repository with center name "SDJVP", andproject name "Sino-Danish Pig Genome Project") together with an initial evolutionary analysis.
The non-repetitive fraction of the sequences was aligned to the UCSC human-mouse alignment andthe resulting three-species alignments were annotated using the human genome annotation. Ultra-conserved elements and miRNAs were identified. The results show that for each of these types oforthologous data, pig is much closer to human than mouse is. Purifying selection has been moreefficient in pig compared to human, but not as efficient as in mouse, and pig seems to have anisochore structure most similar to the structure in human.
Conclusion: The addition of the pig to the set of species sequenced at low coverage adds to theunderstanding of selective pressures that have acted on the human genome by bisecting theevolutionary branch between human and mouse with the mouse branch being approximately 3
Published: 10 May 2005
BMC Genomics 2005, 6:70 doi:10.1186/1471-2164-6-70
Received: 13 December 2004Accepted: 10 May 2005
This article is available from: http://www.biomedcentral.com/1471-2164/6/70
© 2005 Wernersson et al; licensee BioMed Central Ltd. This is an Open Access article distributed under the terms of the Creative Commons Attribution License (http://creativecommons.org/licenses/by/2.0), which permits unrestricted use, distribution, and reproduction in any medium, provided the original work is properly cited.
Page 1 of 7(page number not for citation purposes)
BMC Genomics 2005, 6:70 http://www.biomedcentral.com/1471-2164/6/70
times as long as the human branch. Additionally, the joint alignment of the shot-gun sequences tothe human-mouse alignment offers the investigator a rapid way to defining specific regions foranalysis and resequencing.
BackgroundThe domesticated pig (Sus scrofa) is an obvious choice forgenome sequencing, because of its important economicvalue for meat production and its relevance to biomedicalresearch. The evolutionary position of the pig as an artio-dactyl, where no other large scale sequencing efforts haveso far been published, makes it valuable for comparativegenomics.
Comparative vertebrate genome analysis – e.g. with theaim of understanding evolutionary pressures on thehuman sequence – is most cost-effective with relativelylow coverage, genome wide sequencing of species at dif-ferent evolutionary distances [1,2]. The mouse and ratgenomes [3,4] and the chimpanzee genome [5] haveoffered sequences, which are evolutionary quite distantand very close to the human genome sequence, respec-tively. The evolutionary close chimpanzee sequence canpinpoint significant recent changes in genes, but is notefficient for identification of important regions by com-parative approaches because many regions are extremelyconserved by chance effects and differences in mutationrates over the genome. The more distantly related rodentsequences are useful in the search for conserved regions ofbiological importance. However, more species areneeded, and an artiodactyl like pig is an obvious choicefor the following reasons. 1), By comparing rodents andhuman, it is not possible to determine whether observabledifferences, e.g. difference in isochore structure, aremainly due to changes in the rodent or primate lineagesince their divergence (approximately 90 million yearsago, see 6); 2) Rodents have only a subset of the biologicalfunctions important to humans. By including pig addi-tional functions will be covered; 3) Even though rodents,artiodactyls and primates diverged at approximately thesame time [6,7], molecular evolution has been faster inthe rodent branch, thus the pig is expected to be closer insequence to human than mouse is. The importance ofthese points is generally appreciated and comparativegenomics sequencing initiatives focusing on restrictedregions of the genomes have recently provided muchinsight [e.g. [1,2]].
The Chinese-Danish pig sequencing consortium has gen-erated about 3.84 million high quality sequences from 5pig breeds. The present study releases these data andreports an initial evolutionary analysis which confirmsthat pig and human are closer in sequence space andquantifies the rates of evolution in the pig, rodent and
human lineages for various categories of the genomesequences.
ResultsTable 1 shows the amount of high quality sequenceobtained from 5 pig breeds (NCBI Trace repository undercenter name "SDJVP", and project name "Sino-Danish PigGenome Project"). The average trimmed length of the~3.84 million sequences was 543 base pairs, yielding atotal of 2.1 billion base pairs, equivalent to 0.66X cover-age of redundancy of the 3.15 billion base pair piggenome. It is expected that 1-(1-543/3.15 × 109)^3.84 ×106 = 48% of the pig genome sequence has been hit atleast once by this sequencing project. The low coverageprevents making a real assembly of the pig sequences and,thus, the contig coverage is not estimated. The analyses aretherefore based on a very large number of short align-ments. Repeatmasking (supplementary Table 1) masked36% of all base pairs. The distribution of repeat types isoverall very similar to what is observed in human, exceptfor the expected absence of Alu-elements (Additional file1). Overall, 38% of the coding fraction of the human-mouse alignment, 38% of the 5' UTR, 33 % of the 3' UTR,23% of the intron region and 24% of the intergenic regioncould be expanded to a three-species alignment with theaddition of the pig reads. This coverage of the human-mouse alignment by the pig genome sequences was closeto our prior expectation. Since only 48% of the base pairsin the pig genome are expected to have been hit, we wouldonly expect to hit at most 48% of the human-mouse align-ment, assuming perfect conservation. However, in prac-tice there is some lack of power in BLAST due to thefragmented nature of the pig shotgun reads (being
Table 1: Overview of the number of raw reads generated from each breed.
Breed Number of high quality reads
Number of bases
Hampshire 707,281 363,550,668Yorkshire 1,204,666 652,086,833Landrace 650,609 342,562,503Duroc 1,015,722 574,663,060ErHuaLian 256,993 150,835,661Total 3,835,271 2,083,698,725
Page 2 of 7(page number not for citation purposes)
BMC Genomics 2005, 6:70 http://www.biomedcentral.com/1471-2164/6/70
fragmented even more by the repeatmasking), and weexpect that some of the human-mouse alignment has nolonger an orthologues region in the pig genome. For thenon-coding regions, the coverage of the human-mousealignment by the pig genome sequences is lower than forthe coding regions, but this may be explained by lowerselective constraints and a much higher rate of insertions-deletions in these regions.
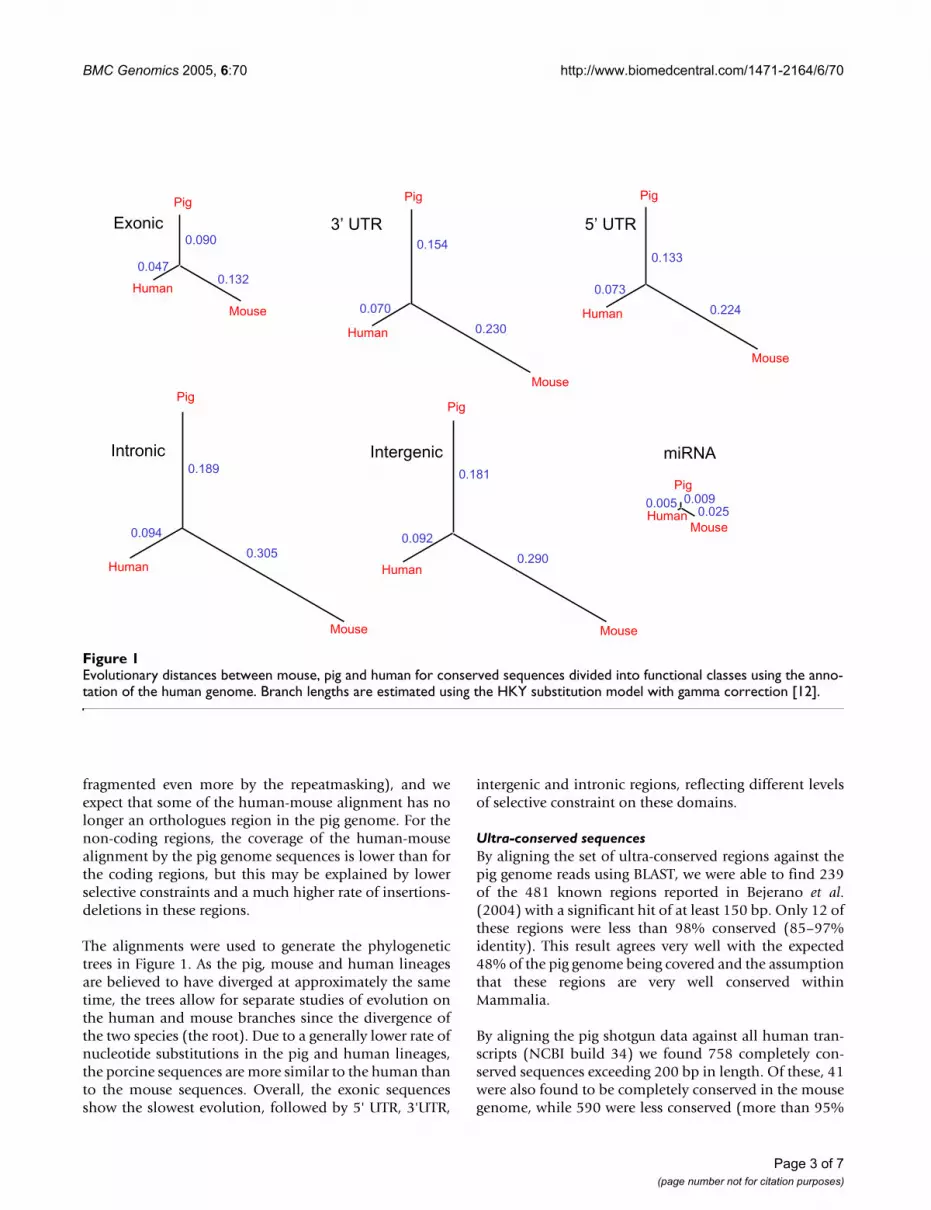
The alignments were used to generate the phylogenetictrees in Figure 1. As the pig, mouse and human lineagesare believed to have diverged at approximately the sametime, the trees allow for separate studies of evolution onthe human and mouse branches since the divergence ofthe two species (the root). Due to a generally lower rate ofnucleotide substitutions in the pig and human lineages,the porcine sequences are more similar to the human thanto the mouse sequences. Overall, the exonic sequencesshow the slowest evolution, followed by 5' UTR, 3'UTR,
intergenic and intronic regions, reflecting different levelsof selective constraint on these domains.
Ultra-conserved sequencesBy aligning the set of ultra-conserved regions against thepig genome reads using BLAST, we were able to find 239of the 481 known regions reported in Bejerano et al.(2004) with a significant hit of at least 150 bp. Only 12 ofthese regions were less than 98% conserved (85–97%identity). This result agrees very well with the expected48% of the pig genome being covered and the assumptionthat these regions are very well conserved withinMammalia.
By aligning the pig shotgun data against all human tran-scripts (NCBI build 34) we found 758 completely con-served sequences exceeding 200 bp in length. Of these, 41were also found to be completely conserved in the mousegenome, while 590 were less conserved (more than 95%
Evolutionary distances between mouse, pig and human for conserved sequences divided into functional classes using the anno-tation of the human genomeFigure 1Evolutionary distances between mouse, pig and human for conserved sequences divided into functional classes using the anno-tation of the human genome. Branch lengths are estimated using the HKY substitution model with gamma correction [12].
Exonic 5’ UTR3’ UTR
Intronic Intergenic
Human0.290
0.181
0.092
Mouse
Pig
Human 0.0250.0090.005
Mouse
Pig
miRNA
Human0.305
0.189
0.094
Mouse
Pig
Human 0.230
0.154
0.070
Mouse
Pig
Human 0.224
0.133
0.073
Mouse
Pig
Human0.132
0.090
0.047
Mouse
Pig
Page 3 of 7(page number not for citation purposes)

BMC Genomics 2005, 6:70 http://www.biomedcentral.com/1471-2164/6/70
identity over at least 80% of the length). BLASTing humantranscripts vs. the fully assembled mouse genome (NCBIbuild 32), we found 2709 ultra-conserved regions. Whenaligning this set of sequences against the artificially frag-mented mouse genomic dataset using BLAST it was onlypossible to classify 664 (24.5%) as ultra-conserved – lessthan the 758 elements found in the human-pigcomparison.
miRNAThe set of pig miRNAs (1) was compared to human andmouse and it was possible to obtain 50 three-way align-ments. The evolutionary tree in Figure 1 was constructedusing the HKY+gamma model from these alignments withgap positions removed. By construction, the miRNAs aremore conserved than even the protein coding sequences,but with pig and human being phylogenetically closest.For the 50 triple-alignments, we obtained 25 cases wherepig is closer to human than to mouse, 2 cases where pig iscloser to mouse than to human, and 23 cases where pig isequally distant to human and mouse.
GC contentThe intra-genomic variation in GC content among theindividual alignments reflects the isochore structure of thegenome. Thus, from the three species alignments, we cal-culated the GC content for each functional sequence classfor each aligned fragment. For a given type of sequence,only alignments having more than 40 nucleotides of thespecific type were used. Table 2 shows that the mean GCcontent is similar among the three species. The varianceamong alignments in GC content is generally lower inmouse than in pig and human, but mostly so for codingsequences, followed by the UTR and intron regions (Table2). Figure 2 shows the distribution of GC% for the codingalignments. The reduced variability in GC content inmouse compared to human has been shown previously,e.g. Figure 8a in [4]. The results presented here suggest avery similar pattern in human and pig.
DiscussionEven though divergence between pig and human occurredapproximately at the same time as the divergence betweenhuman and mouse, the pig sequence is much more simi-lar to the human sequence. Thus, the availability of thepig sequence effectively subdivides the human-mouseevolutionary branch at a position closest to human. Thisimplies that one can determine which changes occurredon the human and mouse branches, respectively, sincetheir divergence. The results of the phylogenetic analysis
Table 2: Average GC content and the variance among alignments exceeding 40 bp for each species and each functional category. Variance is standardized to the variance observed in the human sequence.
Mean GC content Variance GC content
Type of sequence
Human Mouse Pig Human Mouse Pig
Intron 0.390 0.413 0.407 1 0.82 1.02Coding 0.487 0.500 0.496 1 0.69 1.013' UTR 0.404 0.426 0.418 1 0.77 1.035' UTR 0.595 0.593 0.592 1 0.81 0.92Intergenic 0.384 0.399 0.396 1 0.91 1.01
The distribution of GC content in exons for human, pig and mouseFigure 2The distribution of GC content in exons for human, pig and mouse. Only alignments with more than 40 base pairs of exon sequence were used.
0.0 0.2 0.4 0.6 0.8 1.0
0.00
0.05
0.10
0.15
Exon
GC content
Fra
ctio
n of
alig
nmen
ts
HomoMusSus
Page 4 of 7(page number not for citation purposes)

BMC Genomics 2005, 6:70 http://www.biomedcentral.com/1471-2164/6/70
show that the relative length of the mouse, human and pigbranches are different for the different types of data.Intronic sites and intergenic sites show a similar pattern,which also closely resembles that of synonymous sites[see [7]], reflecting that purifying selection is probablyweak and similar for these regions. It is noteworthy thatintergenic branch lengths are slightly shorter than intronicones (and both are shorter than synonymous sites, see[7]). This may reflect either 1) more selective constraintson intergenic sequences than intronic, i.e. parts of theannotated intergenic sequences are indeed genic, or 2) abias in the construction of the human-mouse alignmentthat make it easier to align sequence close to the con-served exons so that somewhat more divergent intronicsequence can be detected. The differences in evolutionaryrates among the three species are most likely attributableto differences in generation times since they diverged.Non-synonymous sites show shorter branches that aremuch more similar in lengths among the species [7]. Thisreflects purifying selection, which has been strongest inthe mouse lineage, followed by pig and then human[20,21]. The reason for this may be the larger averagepopulation size in the mouse since divergence. The UTRregions shows more selective constraint than introns.
The similarity between human and pig adds to therecently reported ultra-conserved regions [14]. Pig andhuman share more ultra-conserved regions than humanand mouse, and (correcting for the coverage in the datapresented) virtually all of the ultra-conserved elementsdefined by Bejerano et al. [14] are also found in pig andtherefore most likely in the artiodactyls lineage.
Variation in GC content along the genome (isochorestructure) is more pronounced in primates than inrodents [4,5]. The present results extend these findingsand put artiodactyls in line with primates – lending fur-ther support to the suggestion that isochore evolution inrodents deviates from all other lineages, possibly becauseof extensive genome rearrangements [22].
ConclusionA 0.66X coverage pig genome survey is hereby released.Even though it is only a beginning, the data offer manyanalytical possibilities and should also stimulate theinternational initiatives to generate a complete draft of thepig genome. The initial analysis of the data adds to ourunderstanding of the evolutionary relationships ofhumans, mice and pigs. Further comparative genomicstudies and more detailed genetic analyses will greatlyimprove our ability to elucidate pig as well as human biol-ogy and medicine.
MethodsGeneration of pig shot-gun sequencesGenomic DNA was extracted from blood samples from 5different breeds of Sus scrofa (domestic pig): ErHuaLian,Duroc, Landrace, Yorkshire and Hampshire. Followingmechanical shearing, DNA fragments (1–3 kb) were iso-lated by gel electrophoresis and cloned into the SmaIrestriction site of the pUC18 plasmid using blunt-endligation. After transformation into E. coli (strain DH5a)and selection on LB-plates, individual clones were pickedfor the library. The quality of a library was checked bysequencing a small number of plasmids, which wereassembled by phrap and aligned by BLAST to validate therandomness of the library and the proportion of contam-inations – including mitochondrial DNA, human frag-ments and vector sequences. If the library was eligible,plasmid DNA was extracted from the individual clonesusing the membrane-filter method (Millipore). The piggenomic inserts were sequenced using the M13 bidirec-tional sequencing primers on the MegaBACE1000platform using ET dye terminator. The chromatogramswere registered in a relational database tracking allgenerated data to eliminate duplicated work and check forerrors. Using phred v. 0.020425.c with a quality cut-off of0.05 and the -trim_alt parameter the chromatograms weretraced and the resulting traces were masked for vectorsequences using CROSSMATCH (0.990329). Resultingsequences were resubmitted to the relational database andprepared for submission. Following removal of contami-nation from vector and bacterial host, we retained3,835,271 reads of at least 150 bp.
All sequences with trace files have been submitted to theEnsembl/NCBI Trace repository under the center name"SDJVP", and project name "Sino-Danish Pig GenomeProject".
Repetitive elementsStandard masking of repetitive sequences was performedusing Repeatmasker version 2004/03/06 with RepBaseUpdate 8.12 with Sus scrofa as query species, using defaultsettings.
Construction of three species alignmentsThe newest build of the human-mouse pairwise align-ment (hg17/mm5) based on the improved blastZ algo-ritm [8] was downloaded from the UCSC genomebrowser [9] and the repeatmasked shotgun-sequenceswere BLAST'ed up against this alignment using Megablast[10] with the following settings: (w) word size = 12, (e)minimum e-value = 0.0001, (x) extension parameter = 50,(u) Repeatmasked query sequences = True. Resulting hitswere then used as tags to build the alignment around (seebelow).
Page 5 of 7(page number not for citation purposes)

BMC Genomics 2005, 6:70 http://www.biomedcentral.com/1471-2164/6/70
All query sequences with multiple blast hits on differentparts of the human-mouse alignment (approximately10%) were removed at this point and only the remainingpig sequences were used in the further analyses. This wasdone to conservatively eliminate paralogous hits. Theindividual blast hits were used to position the pig querysequences on a specific part of the human-mouse align-ment. For each BLAST hit a region extending 300 basepairs in both directions was then realigned using DIA-LIGN version 2.2.1 with default parameters [11]. Regionsthat afterwards were not considered by DIALIGN to bealigned were removed at this point. Subsequently anannotation file (refGene.txt) of the human genome(hg17) was downloaded from the UCSC genome serverand used to annotate each position in the alignmentaccording to the following classes 1) protein-coding exon(with reading frame position), 2) intron, 3) 5' UTR, 4) 3'UTR, and 5) intergenic. Phylogenetic analyses were per-formed on each of these classes separately.
Estimation of phylogenetic treesA combined alignment for each of the five functionalclasses was constructed by concatenating the many smallthree species alignments, and gap positions wereremoved. For each class of data (exon, 5'UTR, 3'UTR,intron and intergenic), the implementation of theHKY85+GAMMA model [12] in PAML v. 3.14 [13] wasused to estimate the number of substitutions in each evo-lutionary branch.
Analysis of ultra-conserved regionsThe data set containing the 481 ultra-conserved regionsdefined by Bejerano et al. [14] was downloaded and usedfor the first part of this analysis. We estimated how manyof these regions that can be found in the pig genome shot-gun sequences by a simple BLAST (blastn) approachretaining only hits of a length of 150 bp or more. Sincethese ultra-conserved regions are based on external data,artefacts due to the relatively low coverage of the piggenome sequences are not important here.
In the second part of the analysis (searching for novelultra-conserved regions), it was important to address theartefacts that arise from searching for ultra conservedregions in a fragmented dataset. In order to do a compara-ble search for ultra-conserved regions against the mouseand pig genomes, we artificially created a mouse data setresembling the fragmented pig shotgun data set. Since theidentification criteria we use is 100% conservation over200 bp or more, the length of the individual read as wellas the quality become a major factor. The fragmentedmouse data set was generated by downloading all ~79million reads of the NCBI trace database, shuffle theserandomly, and pick single reads until the same amount ofnucleotides was reached as in the pig genomic reads data-
set. Only pig reads with length > 200 bp were used and thedata set consisted of 2,034,999,640 bp from pig and2,665,153 reads (2,034,999,649 bp) from mouse.
Construction of the miRNA data setThe reads were BLAST searched [15] (default options)against the miRNA hairpin database [16] and matches ofat least 60 nucleotides clustered. The obtained set of 219clusters contained redundancy as the same pig reads hitthe same miRNAs from different species (human, mouse,etc.). This could be converted into a unique set of 68 clus-ters (each containing 2–5 reads), i.e. each type of miRNAis now only represented once. Each cluster was assembledwith Cap3 [17] from TGICL [18]. As a result 84 contigsand singletons were obtained and BLAST searched backagainst the miRNA database. Matches with more than95% identity in an alignment length larger than 95% ofthe miRNA hairpin length were selected. This resulted in54 hairpins complying with the criteria defined in Ambroset al. [19]. In total 51 different mature sequences are cov-ered in the 54 hairpins.
Authors' contributionsLB, HY, CB, MF, SB initiated and coordinated the project,JUW, BL, SH, WD, WL, JY, JIW, HY organized the sequenc-ing work, FP, HHS, HH, AK cleaned up the data and cre-ated the database, RW, MHS, FGJ, JG, OFC, TM performedthe analyses, RW, MHS, FG, OFC, JUW, GW, LB draftedthe paper. All authors have read and approved the paper.
Additional material
AcknowledgementsThis study was supported by grants from: Danish National Committee for Pig Production, Danish Trans-Disciplinary Research Programme: "Compar-ative Genomics Focusing on Man and Pig", Danish National Research Foun-dation: "Danish Platform for Integrative Biology", The Danish Technical Research Council, Danish Center for Scientific Computing, Chinese Acad-emy of Sciences, Chinese Ministry of Science and Technology, Natural Sci-ence Foundation of China. We acknowledge the Sino-Danish Pig Genome Consortium consisting of The Danish Veterinary and Agricultural Univer-sity (KVL), Denmark, the Danish Institute of Agricultural Sciences (DIAS),
Additional File 1Distribution of repetitive elements in the pig genome survey sequences. Data obtained from Repeatmasking of shotgun sequencesClick here for file[http://www.biomedcentral.com/content/supplementary/1471-2164-6-70-S1.doc]
Additional File 2Details of investigated miRNAs.Click here for file[http://www.biomedcentral.com/content/supplementary/1471-2164-6-70-S2.doc]
Page 6 of 7(page number not for citation purposes)
BMC Genomics 2005, 6:70 http://www.biomedcentral.com/1471-2164/6/70
Publish with BioMed Central and every scientist can read your work free of charge
"BioMed Central will be the most significant development for disseminating the results of biomedical research in our lifetime."
Sir Paul Nurse, Cancer Research UK
Your research papers will be:
available free of charge to the entire biomedical community
peer reviewed and published immediately upon acceptance
cited in PubMed and archived on PubMed Central
yours — you keep the copyright
Submit your manuscript here:http://www.biomedcentral.com/info/publishing_adv.asp
BioMedcentral
Denmark, and the Beijing Genomics Institute/James D. Watson Institute of Genome Sciences (BGI/WIGS), China.
References1. Blakesley RW, Hansen NF, Mullikin JC, Thomas PJ, McDowell JC,
Maskeri B, Young AC, Benjamin B, Brooks SY, Coleman BI, Gupta J,Ho SL, Karlins EM, Maduro QL, Stantripop S, Tsurgeon C, Vogt JL,Walker MA, Masiello CA, Guan X, Bouffard GG, Green ED: Anintermediate grade of finished genomic sequence suitablefor comparative analyses. Genome Research 2004, 14:2235-2244.
2. Thomas JW, Touchman JW, Blakesley RW, Bouffard GG, Beckstrom-Sternberg SM, Margulies EH, Blanchette M, Siepel AC, Thomas PJ,McDowell JC, Maskeri B, Hansen NF, Schwartz MS, Weber RJ, KentWJ, Karolchik D, Bruen TC, Bevan R, Cutler DJ, Schwartz S, ElnitskiL, Idol JR, Prasad AB, Lee-Lin SQ, Maduro VV, Summers TJ, PortnoyME, Dietrich NL, Akhter N, Ayele K, Benjamin B, Cariaga K, BrinkleyCP, Brooks SY, Granite S, Guan X, Gupta J, Haghighi P, Ho SL, HuangMC, Karlins E, Laric PL, Legaspi R, Lim MJ, Maduro QL, Masiello CA,Mastrian SD, McCloskey JC, Pearson R, Stantripop S, Tiongson EE,Tran JT, Tsurgeon C, Vogt JL, Walker MA, Wetherby KD, Wiggins LS,Young AC, Zhang LH, Osoegawa K, Zhu B, Zhao B, Shu CL, De JongPJ, Lawrence CE, Smit AF, Chakravarti A, Haussler D, Green P, MillerW, Green : Comparative analyses of multi-species sequencesfrom targeted genomic regions. Nature 2003, 424:788-793.
3. Waterston RH, Lindblad-Toh K, Birney E, Rogers J, Abril JF, AgarwalP, Agarwala R, Ainscough R, Alexandersson M, An P, Antonarakis SE,Attwood J, Baertsch R, Bailey J, Barlow K, Beck S, Berry E, Birren B,Bloom T, Bork P, Botcherby M, Bray N, Brent MR, Brown DG, BrownSD, Bult C, Burton J, Butler J, Campbell RD, Carninci P, Cawley S,Chiaromonte F, Chinwalla AT, Church DM, Clamp M, Clee C, CollinsFS, Cook LL, Copley RR, Coulson A, Couronne O, Cuff J, Curwen V,Cutts T, Daly M, David R, Davies J, Delehaunty KD, Deri J, Dermitza-kis ET, Dewey C, Dickens NJ, Diekhans M, Dodge S, Dubchak I, DunnDM, Eddy SR, Elnitski L, Emes RD, Eswara P, Eyras E, Felsenfeld A,Fewell GA, Flicek P, Foley K, Frankel WN, Fulton LA, Fulton RS, FureyTS, Gage D, Gibbs RA, Glusman G, Gnerre S, Goldman N, GoodstadtL, Grafham D, Graves TA, Green ED, Gregory S, Guigo R, Guyer M,Hardison RC, Haussler D, Hayashizaki Y, Hillier LW, Hinrichs A,Hlavina W, Holzer T, Hsu F, Hua A, Hubbard T, Hunt A, Jackson I,Jaffe DB, Johnson LS, Jones M, Jones TA, Joy A, Kamal M, Karlsson EK,Karolchik D, Kasprzyk A, Kawai J, Keibler E, Kells C, Kent WJ, KirbyA, Kolbe DL, Korf I, Kucherlapati RS, Kulbokas EJ, Kulp D, Landers T,Leger JP, Leonard S, Letunic I, Levine R, Li J, Li M, Lloyd C, Lucas S,Ma B, Maglott DR, Mardis ER, Matthews L, Mauceli E, Mayer JH,McCarthy M, McCombie WR, McLaren S, McLay K, McPherson JD,Meldrim J, Meredith B, Mesirov JP, Miller W, Miner TL, Mongin E,Montgomery KT, Morgan M, Mott R, Mullikin JC, Muzny DM, NashWE, Nelson JO, Nhan MN, Nicol R, Ning Z, Nusbaum C, O'ConnorMJ, Okazaki Y, Oliver K, Overton-Larty E, Pachter L, Parra G, PepinKH, Peterson J, Pevzner P, Plumb R, Pohl CS, Poliakov A, Ponce TC,Ponting CP, Potter S, Quail M, Reymond A, Roe BA, Roskin KM,Rubin EM, Rust AG, Santos R, Sapojnikov V, Schultz B, Schultz J,Schwartz MS, Schwartz S, Scott C, Seaman S, Searle S, Sharpe T,Sheridan A, Shownkeen R, Sims S, Singer JB, Slater G, Smit A, SmithDR, Spencer B, Stabenau A, Stange-Thomann N, Sugnet C, Suyama M,Tesler G, Thompson J, Torrents D, Trevaskis E, Tromp J, Ucla C,Ureta-Vidal A, Vinson JP, Von Niederhausern AC, Wade CM, Wall M,Weber RJ, Weiss RB, Wendl MC, West AP, Wetterstrand K,Wheeler R, Whelan S, Wierzbowski J, Willey D, Williams S, WilsonRK, Winter E, Worley KC, Wyman D, Yang S, Yang SP, Zdobnov EM,Zody MC, Lander ES, Mouse Genome Sequencing Consortium: Ini-tial sequencing and comparative analysis of the mousegenome. Nature 2002, 420:520-562.
4. Rat Genome Sequencing project consortium: Genome sequenceof the Brown Norway rat yields insight into mammalianevolution. Nature 2004, 428:493-521.
5. The international Chimpanzee Chromosome 22 Consortium: DNAsequence and comparative analysis of chimpanzee chromo-some 22. Nature 2004, 429:382-388.
6. Springer MS, Murphy WJ, Eizirik E, O'Brien SJ: Placental mammaldiversification and the Cretaceous-Tertiary boundary. ProcNatl Acad Sci USA 2003, 100:1056-1061.
7. Jørgensen FG, Hobolth A, Jensen HH, Bendixen C, Fredholm M, Sch-ierup MH: Comparative analysis of protein coding sequences
from Human, Mouse and the domesticated Pig. BMC Biology2005, 3:2.
8. Schwartz SW, Kent J, Smit A, Zhang Z, Baertsch R, Hardison RC,Haussler D, Miller W: Human-Mouse Alignments withBLASTZ. Genome Res 2003, 13:103-107.
9. Kent WJ, Sugnet C, Furey T, Roskin K, Pringle T, Zahler A, HausslerD: The human genome browser at UCSC. Genome Res 2002,12:996-1006.
10. Zhang Z, Schwartz S, Wagner L, Miller W: A greedy algorithm foraligning DNA sequences. J Comput Biol 2000, 7:203-214.
11. Morgenstern B: DIALIGN 2: Improvement of the segment-to-segment approach to multiple sequence alignment. Bioinfor-matics 1999, 15:211-218.
12. Hasegawa M, Kishino H, Yano T: Dating of the human-ape split-ting by a molecular clock of mitochondrial DNA. J Mol Evol1985, 22:160-174.
13. Yang Z: PAML: A program package for phylogenetic analysisby maximum likelihood. Comput Appl Biosci 1997, 13:555-556.
14. Bejerano G, Pheasant M, Makunin I, Stephen S, Kent WJ, Mattick JS,Haussler D: Ultraconserved elementsin the human genome.Science 2004, 304:1321-1325.
15. Altschul SF, Madden TL, Schaffer AA, Zhang J, Zhang Z, Miller W, Lip-man DJ: Gapped BLAST and PSI-BLAST: a new generation ofprotein database search programs. Nucleic Acids Res 1997,25:3389-3402.
16. Griffiths-Jones S: The miRNA Registry. Nucleic Acids Res2004:D109-D111.
17. Huang X, Madan A: CAP3: A DNA sequence assemblyprogram. Genome Res 1999, 9:868-877.
18. Pertea G, Huang X, Liang F, Antonescu V, Sultana R, Karamycheva S,Lee Y, White J, Cheung F, Parvizi B, Tsai J, Quackenbush J: TIGRGene Indices clustering tools (TGICL): a software system forfast clustering of large EST datasets. Bioinformatics 2003,19:651-652.
19. Ambros V, Bartel B, Bartel DP, Burge CB, Carrington JC, Chen X,Dreyfuss G, Eddy SR, Griffiths-Jones S, Marshall M, Matzke M, RuvkunG, Tuschl T: A uniform system for microRNA annotation. RNA2003, 9:277-279.
20. Ohta T: An examination of the generation-time effect onmolecular evolution. Proc Natl Acad Sci USA 1993, 90:10676-10680.
21. Ohta T: Synonymous and nonsynonymous substitutions inmammalian genes and the nearly neutral theory. J Mol Evol1995, 40:56-63.
22. Belle EM, Duret L, Galtier N, Eyre-Walker A: The decline of iso-chores in mammals: an assessment of the GC content varia-tion along the mammalian phylogeny. J Mol Evol 2004,58:653-660.
Page 7 of 7(page number not for citation purposes)
http://www.ncbi.nlm.nih.gov/entrez/query.fcgi?cmd=Retrieve&db=PubMed&dopt=Abstract&list_uids=3934395
http://www.ncbi.nlm.nih.gov/entrez/query.fcgi?cmd=Retrieve&db=PubMed&dopt=Abstract&list_uids=3934395
http://www.ncbi.nlm.nih.gov/entrez/query.fcgi?cmd=Retrieve&db=PubMed&dopt=Abstract&list_uids=9367129
http://www.ncbi.nlm.nih.gov/entrez/query.fcgi?cmd=Retrieve&db=PubMed&dopt=Abstract&list_uids=9367129
http://www.ncbi.nlm.nih.gov/entrez/query.fcgi?cmd=Retrieve&db=PubMed&dopt=Abstract&list_uids=9254694
http://www.ncbi.nlm.nih.gov/entrez/query.fcgi?cmd=Retrieve&db=PubMed&dopt=Abstract&list_uids=9254694
http://www.ncbi.nlm.nih.gov/entrez/query.fcgi?cmd=Retrieve&db=PubMed&dopt=Abstract&list_uids=8248159
http://www.ncbi.nlm.nih.gov/entrez/query.fcgi?cmd=Retrieve&db=PubMed&dopt=Abstract&list_uids=8248159
http://www.ncbi.nlm.nih.gov/entrez/query.fcgi?cmd=Retrieve&db=PubMed&dopt=Abstract&list_uids=7714912
Related Documents