Foresight Exploiting the Electromagnetic Spectrum State of the Science Review Picturing people: non-intrusive imaging Douglas J Paul Cavendish Laboratory, University of Cambridge This review does not represent the view of the DTI or Government policy, but is an account of the state of the art in the field by the commissioned author. This document is one of four state of the science reviews produced for the four topics selected for detailed study in the Foresight Exploiting the Electromagnetic Spectrum project. Further details are available at the Foresight web site: http://www.foresight.gov.uk/ Contact the Foresight Exploiting the Electromagnetic Spectrum team at: Foresight Directorate Office of Science and Technology 1 Victoria Street London SW1H 0ET Fax: 020 7215 0054 E-mail: [email protected] 1

Welcome message from author
This document is posted to help you gain knowledge. Please leave a comment to let me know what you think about it! Share it to your friends and learn new things together.
Transcript
Foresight Exploiting the Electromagnetic Spectrum
State of the Science Review
Picturing people: non-intrusive imaging
Douglas J Paul Cavendish Laboratory, University of Cambridge
This review does not represent the view of the DTI or Government policy, but is an account of the state of the art in the field by the commissioned author. This document is one of four state of the science reviews produced for the four topics selected for detailed study in the Foresight Exploiting the Electromagnetic Spectrum project. Further details are available at the Foresight web site: http://www.foresight.gov.uk/ Contact the Foresight Exploiting the Electromagnetic Spectrum team at: Foresight Directorate Office of Science and Technology 1 Victoria Street London SW1H 0ET Fax: 020 7215 0054 E-mail: [email protected]
1

Summary
Non-intrusive imaging affects almost every person in the UK at some level. From
close circuit television (CCTV) cameras in cities through x-rays and MRI at
hospitals to the metal detectors at airports, few people can live without crossing a
non-intrusive imaging technology at some time in their lives. The fast pace of
technology is going to increase the number of non-intrusive imaging techniques
and systems in the future.
Historically the UK has been involved in the development of a number of imaging
modalities including x-ray, radar, sonar, MRI and x-ray computed
tomography (CT). The UK has a strong presence in new emerging imaging
modalities including microwave, terahertz and infrared. The UK also has strength
in component technologies and techniques including contrast agents, image
analysis techniques and superconducting magnets.
In medical imaging there are clear drivers towards non-ionising modalities (non-
intrusive imaging) such as ultrasound, MRI and thermography rather than PET,
x-ray CT and gamma-ray, where possible. Many of the ionising technologies still
provide functional and diagnostic information that cannot yet be obtained from
the non-invasive technologies. There is also a substantial drive towards
multimodal imaging systems where the high resolution of one technique is
combined with the functional information of another to allow diagnosis which was
previously impossible or difficult with the one technique. Genetic research on
small animals is also driving new small scale imaging tools such as PET, MRI
and x-ray CT. The visible and near infrared are presently poorly utilised by the
medical community but potentially may allow new techniques especially in biopsy
and cancer screening if technical problems can be solved.
Security imaging is presently driven by the application of detection of suicide
bombers and improved airport security in the present world climate. Microwave
2

and terahertz technologies have demonstrated potential in these areas but are
still immature technologies requiring further research.
The terahertz region of the spectra is the one area where little has been clearly
achieved due to the lack of practical sources and detectors. With recent
technological advances the first systems are becoming available and first
demonstrations of a number of different applications have been achieved. All
molecules (biological, organic, inorganic, etc) have vibrational and rotational
spectra that lie in the terahertz frequency range with signatures resulting from
intra- and inter-molecular interactions. The wavelengths are short enough to
enable sub-millimetre imaging while long enough to penetrate many materials
allowing hidden objects to be imaged. The UK has a strong presence in this field
both industrially and academically and there are numerous potential applications
ranging from explosive identification and suicide bomber detection to skin cancer
imaging.
In all areas of imaging, image analysis and display is required. The UK has
significant expertise in the development of a number of the algorithms and
techniques presently used for image analysis and the extraction of additional
information. Automated image recognition along with automated diagnosis for the
medical fields are areas with good potential for breakthroughs in image analysis
software.
Database and information management along with fast delivery of imaging
information are areas which need to be addressed as the size and number of
images increases as technology improves. There is already some funding
through EPSRC for e-GRID and information extraction from images but more
investment could put the UK into a very strong world position. While the UK has
little manufacturing of the microelectronic components in computers, hard disk
drives and storage media, it does have significant expertise in computer
architecture (e.g. ARM Holdings) and computer systems design.
3
Contents 1. Introduction and Background 6 1.1 Present Exploitation of the Electromagnetic Spectrum 6 1.2 Imaging Systems 7 1.3 Limitations: Resolution, Detectivity, Screening, Speed, Cost 7 1.4 Technology Push, Application Pull 122. Drivers for Medical and Security Imaging 13 2.1 Applications Drivers, Technology Drivers and Markets for Medical
Imaging 13
2.2 Applications Drivers, Technology Drivers and Markets for Security Imaging
14
3. Imaging Technologies 18 3.1 Electrical and Magnetic Source Imaging 18 3.1.1 Background to Electrical and Magnetic Source and Impedance
Imaging 18
3.1.2 Present Electrical and Magnetic Source Imaging Technology 19 3.1.3 Future and Emerging Electrical and Magnetic Source Imaging
Technology 19
3.2 Ultrasound and Sonar 20 3.2.1 Background to Ultrasound and Sonar 20 3.2.2 Present Ultrasound and Sonar Technology 21 3.2.3 Future and Emerging Ultrasound and Sonar Technology 21 3.3 Magnetic Resonance Imaging and Nuclear Magnetic Resonance 23 3.3.1 Background to MRI and NMR 23 3.3.2 Present MRI and NMR Technology 24 3.3.3 Future and Emerging MRI and NMR Technology 24 3.4 Microwave Imaging 27 3.4.1 Background to Microwave Imaging 27 3.4.2 Present Microwave Imaging Technology 28 3.4.3 Future and Emerging Imaging Technology 29 3.5 Terahertz Imaging 29 3.5.1 Background to Terahertz Technology 29 3.5.2 Present Terahertz Technology 30 3.5.3 Future and Emerging Terahertz Technology 30 3.6 Infrared Imaging 33 3.6.1 Background to Infrared Imaging 33 3.6.2 Present Infrared Imaging Technology 33 3.6.3 Future and Emerging Infrared Imaging Technology 35
4

3.7 Visible Imaging 36 3.7.1 Background to Visible Imaging 36 3.7.2 Present Visible Imaging Technology 37 3.7.3 Future and Emerging Visible Imaging Technology 37 3.8 X-ray Imaging 39 3.8.1 Background to x-ray Imaging 39 3.8.2 Present x-ray Imaging Technology 39 3.8.3 Future and Emerging x-ray Imaging Technology 40 3.9 Radionuclide Imaging 41 3.9.1 Background to Radionuclide Imaging 41 3.9.2 Present Radionuclide Imaging 41 3.9.3 Future and Emerging Radionuclide Imaging 42 3.10 Hybrid Technologies and Data Fusion 43 3.11 Other Emerging Non-invasive Imaging Technology or Developments 444. Developments in Component Technologies 44 4.1 Image Analysis and Display 44 4.2 Phase Contrast Techniques 46 4.3 General Components: Computer and Data Storage Technology 475. Health, Safety, Ethical and Civil Liberty Issues of Imaging Technologies and
Applications 50
5.1 Health and Safety 50 5.2 Ethics and Medical Imaging 51 5.3 Civil Liberty 516. Conclusions 52 Acknowledgments 55Appendix 56I. References 56II. UK Expertise 61III. Acronyms and Technical Terms 63
5

1. Introduction and Background
1.1 Present Exploitation of the Electromagnetic Spectrum
Imaging can be described as the display of the interactions of radiation of a
particular frequency or frequencies with the body being imaged. Images of a
complex body can reveal characteristics of the body such as transmissivity,
opacity, emissivity, reflectivity, conductivity and magnetisability. Images that
reveal one or more of these properties can also be analysed to extract additional
information. As an example the properties of x-rays transmitted through some
body can be used to extract the effective atomic number, physical density and
electron density.
Historically medical and security or defence imaging have been linked mainly due
to the similar requirements of sources, detectors or underlying techniques for
very different imaging applications. As an example, sonar techniques for
detecting submarines were later transferred and developed into the medical field
of ultrasound imaging. Scintillator counters and nuclear reactor prepared
isotopes were developed during the Manhattan project before appearing much
later in medical imaging systems.
Fig. 1 is a schematic diagram of the electromagnetic spectrum giving the energy
and wavelength of different photons as a function of frequency. The major
allocation of bands are shown although the precise division between different
bands and also the actual names used vary in a number of different fields. On
the right of Fig. 1, the typical type of photonic interaction with material is listed
ranging from interactions at the nuclear level at the highest frequency to
interactions with the nuclear spin at the lowest frequency. It is these interactions
which define the type of information that can be extracted using different
frequencies of radiation for imaging purposes and determine what parts of the
spectrum can be exploited.
6

Most of the electromagnetic spectrum is now exploited for imaging purposes to
some level. The terahertz is one region which is substantially under-exploited
due to a lack of cheap and compact sources and detectors.
1.2 Imaging Systems
Imaging systems can be divided into a number of different types (Fig. 2). Active
systems are where a source of radiation is used to illuminate the body being
imaged and some form of detection is used to form the image. Passive systems
rely on the detection of the emission from the body itself or of reflection or
interactions with background sources of radiation. Each of these types of system
can be subdivided into direct-detection, time-gated or heterodyne. Heterodyne
detection is where a local source close to the frequency of the detected signal is
mixed with the signal to provide amplification through interference. Time-gated
imaging includes both interferometric and tomographic imaging as both use the
time of flight of a photon to extract additional information, either by adding a
delay or by measurement at different distances or angles. Direct-detection is a
system where the photon is directly absorbed in the detector without any
additional techniques before detection to improve image quality or information.
1.3 Limitations: Resolution, Detectivity, Screening, Speed, Cost
Resolution limit: The resolution limit for a system with a lens forming the image
is derived by considering when the centre of the Airy’s disc of one point source
falls on the first minimum of the Airy’s disc of a second point source of radiation.
This defines the Rayleigh or diffraction limit of resolution as
Dfλ22.1min =∆λ (m) (1)
where f is the focal length and D is the aperture diameter. Appropriate lenses are
not available for frequencies above the ultraviolet apart from electromagnetic
lenses for charged particles such as electrons and protons1. Equation (1) states
7

that the resolution is proportional to the wavelength of the radiation being used.
Noise-Equivalent Power (NEP): The noise equivalent power of a photodetector
is defined as the power that corresponds to the incident rms (root mean square)
optical power ( 2/optrms mPp = with m the modulation index) required such that
the signal-to-noise ratio is one in a bandwidth of 1 Hz2.
Fig. 1: The electromagnetic spectrum with designated bands and the main electromagnetic
interaction mechanisms with atoms for imaging at different frequencies, energies and
wavelengths.
8

Fig. 2: The different types of imaging systems with some examples.
Detectivity (D*): The detectivity of a photodetector is defined as
NEPAD ν∆
=* (cm√(Hz)/W) (2)
where A is the cross-sectional area of the detector in cm, ∆ν is the bandwidth of
the circuit and NEP is the noise equivalent power2.
Noise equivalent temperature difference (NE∆T): The NE∆T is used
frequently in the infrared and microwave community to compare the sensitivity of
detectors. It is defined as the minimum temperature difference that can be
measured with a signal-to-noise ratio of 1 in a bandwidth of 1 Hz. In the
Rayleigh-Jeans limit this gives
ν∆=∆Τ
BnkNEPNE (K) (3)
where n is the number of modes, kB is Boltzmann’s constant and ∆ν is the
bandwidth.
Quantum efficiency: The quantum efficiency of a photodetector is the number
of electron-hole pairs generated for each incident photon
opt
p
Ph
qI νη = (4)
where Ip is the photogenerated current from the absorption of incident optical
power, Popt at frequency ν, q is the electronic charge and h is Planck’s constant2.
Skin depth: The skin depth is the length scale of the exponential attenuation of
radiation in conducting materials. It is defined as 9

πνµσδ 1
= (m) (5)
where ν is the frequency, µ is the permittivity and σ is the conductivity of the
material. It is especially important for metals where the skin depth can be very
small leading to complete screening of the radiation. This can also be important
for clothes in security screening or medical imaging or for different parts of the
body such as skin1.
Speed: The maximum time for obtaining an image is related to the application.
For security applications where real-time video rate is required, it is normally
defined as 30 frames per second (fps). In medical imaging the maximum imaging
time can sometimes be limited by the ability of people to hold their breath or to
the time a child can controllably be kept still. Longer times can therefore reduce
resolution if the body being imaged is moving during acquisition. High speed
imaging normally suggests the need for focal-plane arrays of detectors and
sources allowing parallel rather than serial data acquisition.
Cost: Reducing system cost is always important if availability and market
exposure is to increase. While for defence applications high costs can be
tolerated in a number of applications, high costs for medical imaging results in
few hospitals with access to an imaging modality. Cheap, automated systems
allow accurate diagnosis even at a GP surgery, reducing patient waiting times
and providing fast diagnosis.
Semiconductor manufacturing techniques available for sources below 1 PHz
demonstrate the ability in many regions of the electromagnetic spectrum for
cheap, large and compact arrays of sources and detectors to be realised. The
cost of sources scales in an approximate linear fashion between 1 GHz and the
visible except for a region between approximately 100 GHz to 10 THz. In this
region present sources costs are orders of magnitude above the rest of the
spectrum (Fig. 3)3.
10

There are still many areas where reduced cost could provide significantly higher
access to a particular technology especially in a number of medical applications.
Fig. 3: Schematic diagram showing approximate source costs as a function of frequency.
Between 0.1 and 10 THz the cost of sources is substantially higher than other parts of the
electromagnetic spectrum3.
11

Fig. 4: The transparency of the atmosphere at sea level. Data is taken from the HITRAN 2000
database14 with fog and rain data from15, 16.
1.4 Technology Push, Applications Pull
Most of the early imaging technologies have originally been developed by
technology push. Technology push is the normal driving force if suitable sources
or detectors are not available for an application as it is the availability of
technology that drives the application. In a number of cases it is the application
which drives new technology development. A good example is ultrasound which
was developed by using much of the technology already available for sonar but
the application of the technology to human imaging pulled the technology into a
specific application.
12

2. Drivers for Medical and Security Imaging 2.1 Applications Drivers, Technology Drivers and Markets for Medical Imaging
The current global market for medical imaging is around £8.8 billion per annum.
The main drive from applications in medical imaging is related to moving to safer
imaging techniques where especially non-ionising sources of radiation are used.
MRI, infrared or ultrasound are therefore preferred technologies compared to x-
ray, gamma or PET from a safety perspective4. There is still key information
which can only be extracted by radiology or nuclear medicine modalities and
hence multimodality image fusion is a major application driving research and new
systems. There are also other ethical drivers in determining which imaging
modalities will be favoured.
There is a drive to less invasive surgical techniques which can also be helped
with new imaging modalities4. Higher resolution is also being used for
identification of better imaging targets by genome-based approaches. Such
techniques are aimed at diagnosis of disease at the molecular level5. Imaging for
medical robotic applications is also a driver where guidance through imaging
modalities can be used to guide robotics used for surgery6,7.
Technology drivers in most areas of medical imaging are cost reduction, faster
image acquisition times and higher resolution and/or sensitivity. This is especially
true in techniques such as PET and MRI which are used much more frequently in
hospitals in the US than in the UK due to cost restraints.
The increased rise in resolution in many techniques such as computed
tomography x-ray scanning and MRI has resulted in many hospitals experiencing
dramatic and often exponential increases in the amount of data generated4.
Computer speed and power along with increased memory storage, therefore, are
key technology components for image analysis and storage. The ability to
13

search, process and analyse data is limited by the available computer technology
- both hardware and software. The data explosion is predicted to get worse as
multimodality imaging increases. Technology is required to allow fast automated
extraction of relevant information from large databases to allow clinical
diagnosis4.
The visible and infrared regions of the spectra have to date been poorly utilised
for medical imaging. Problems of absorption, low resolution and non-specificity
have resulted in the techniques being unpopular with clinicians. New technology
in these fields could potentially open up new imaging techniques and
methodologies.
The terahertz or far-infrared part of the spectrum has potential for medical
imaging as all molecules have parts of their vibrational and rotational spectra in
this region8. There have been a number of first demonstrations of medical
applications but this region is limited by the available technology9,10,11.
Technology is therefore the driver for the appearance of practical imaging
systems. Some oncology applications are now in pre-clinical trials but very little
detailed work has been completed. There are also no studies of the interaction of
the radiation with biological tissue and numerous ethical issues have yet to be
considered.
Table 1 gives a summary and comparison of the main medical imaging
modalities including emerging technologies.
2.2 Applications Drivers, Technology Drivers and Markets for Security Imaging
Security imaging at airports is potentially the largest market for security imaging
systems outside military markets. The US has 400 airports with a market of £3.2
billion for security imaging systems for people and luggage. The UK has over 45
airports with commercial flights and worldwide there are over 1520
14

Plan
ar X
-ray
X-ra
y C
T
Gam
ma
cam
era
imag
e
Gam
ma
cam
era
SPEC
T
PET
Ultr
asou
nd B
-sca
n +
Dop
pler
imag
e
MR
I im
age
MR
I spe
ctru
m
Hyp
erpo
laris
ed M
RI
Ther
mog
ram
OC
T
Tera
hert
z Pu
lsed
Im
agin
g
Tera
hert
z Sp
ectr
osco
py
Ionising radiation? Yes Yes Yes Yes Yes No No No No No No No No Anatomy or functional A A F F F A+F A+F F F F A(+F) A+F FData acquisition time <1 s few s 5 min 20min 20min 1 s 20min 20min 1 s <<1 s 10 s 1 min <1s Data reconstruction + process time
2 min 2 min <1 s 10min 10min < 1 s 2 min < 1 s < 1 s << 1 s <1 s < 1 s < 10 s
Patient handling time 5 min 30min 10min 30min 30min 10min 1 hr >1hr 10min 10min 10min 10min 10minSpatial resolution <1mm >1mm >5mm >5mm >5mm >30µm >1mm >1mm >1mm >1mm >15µm >20µm >20µm Depth >body >body >body>body >body >body>body >body >body 3mm 3mm3mm 3mmSensitivity (1 poor to 5 great)
2 4 2 3 4 3 4 2 4 4 3 4 5
Availability of equipment in NHS hospitals (1 poor to 5 good)
5
2
3
2
1
5
1
1
1
2
2
1
1
Capital cost of equipment
£70k £500k £300k £200k £0.5-2M £10k £0.8k £1.5M £0.9M £50k <£50k £250k £250k
Table 1: Comparison of commercial and emerging research medical imaging modalities (modified from17). Sensitivity of a diagnostic technique can be defined as the number of correct positive assessments divided by the number of truly positive cases.
15
airports registered for commercial flights suggesting a total market of around £10
billion for airport security scanning.
One of the main applications drivers at present from anti-terrorist applications is
detection of suicide bombers12. At present only hand searching can be used on
people due to safety concerns with x-ray techniques. The US military estimate
that the death of a service personnel costs around $2M including funeral, legal
and pension costs for the deceased’s family. The only present solution is a low-
dose x-ray technology which cannot be used in any western countries and the
use in a number of other countries poses serious ethical issues. Technology for
detection of human suicide bombers in airports or at an entrance to a compound
or government building can certainly be envisaged as a walk-through system with
operators remote from potential suspects.
The detection threshold distance for suicide bombers can be reduced if
appropriate protection screens can be used for equipment and operators12. For
airports, scanning rates for people require a maximum imaging time of around 20
seconds although ideally this should be well below 10 seconds. For military
personnel in hostile countries video rate (30 frames per second) is required for
soldiers walking through crowded city areas such as streets or markets. The lack
of transparency in certain parts of the atmosphere limits the technologies which
might be able to be used over large distances for suicide bomber detection
(Fig. 4).
Large vehicle bomb detection is much more difficult to envisage especially in
populated areas due to the screening properties of metals used for the vehicle
bodies. Only high energy radiation such as x-rays can penetrate such metal but
such radiation has health restrictions12.
For the UK police, firearms detection on suspects is now a major applications
driver especially with the present increase in firearms offences. Imaging time for
such an application needs to be of the order of a second and preferably real-time
16

or video rate. The technology needs to be portable, battery powered and
compact. As there is no present remote solution to this problem, any new
technology could have significant market penetration especially in foreign
countries such as the US with its large number of legally carried guns.
Automotive and aircraft radar to allow navigation and target acquisition in fog is
extremely difficult in the infrared due to strong absorption (Fig. 4) but in the W-
band between 90 to 100 GHz there is a good window of operation. These
applications are major drivers to develop W-band (Fig. 5) imaging components
and systems. Most of the development work is military-based at present but there
is a substantial commercial aviation market which can be targeted with
appropriate technology.
The terahertz is a technologically developing area with many first demonstrations
of applications but little detailed research. The combination of transparency to
clothing combined with spectroscopy of illicit materials such as narcotics,
bioweapons or explosives could allow detection and potentially identification of
many different types of materials9. Imaging and spectroscopic identification of
explosives through a number of layers of clothes has been demonstrated at 1
metre distance but requires development to allow imaging at safe distances13.
This field is still very young and is presently driven by the availability of
technology.
Infrared technology has been driven by night-vision applications for the military.
Such technology is now extremely advanced with many different products
available for passive imaging particularly in the 8 to 12 µm window of the
spectrum (Fig. 4) and at shorter wavelengths. The field is still technology driven
better performance (and/or cheaper) detector technology becoming available will
open new applications.
The technology for the visible part of the spectrum is now being driven by
entertainment and consumer products such as digital cameras for imaging
17

applications. The charged coupled displays (CCDs) now available in cameras
cost around £400 for 5 million pixels and £1300 for 12 million pixels. Such CCDs
are also available in security cameras both for operation in city streets and in
cheaper systems for small businesses and homes. Such systems also use
computer technology rather than video to record and store information,
significantly reducing the cost of systems and their operation.
X-ray systems are still prevalent for airport baggage and cargo imaging. The
main driver is increased sensitivity for functional identification. There are also
low-dose x-ray systems available for weapons detection on humans but there are
significant ethical implications to the use of such ionising radiation techniques.
3. Imaging Technologies 3.1 Electrical and Magnetic Source Imaging
3.1.1 Background to Electrical and Magnetic Source and Impedance Imaging
Electrical or magnetic imaging in this section relates to techniques from ~10 MHz
in frequency down to 1 Hz. At such frequencies the wavelength is greater than
10 m and resolution is a significant issue. All the techniques described below are
both non-ionising and non-invasive. The techniques also provide additional
information to other more standard techniques.
Electrical source imaging (ESI) uses electrical field measurements to construct
maps of the underlying electrical activity. Nerve impulses are electrical currents
that propagate in neural tissue and ESI measures the electrical fields that are
produced by the current flow. ESI is an extension of electroencephalography
(EEG) and electrocardiography (ECG) that permit identification of sources of
intense electrical activity in the brain and heart18,19.
18

Magnetic source imaging (MSI) or magnetic induction tomography constructs
images from either the magnetic fields emerging from electrical current flow from
neural and other tissue18 or from measuring eddy currents induced by applied
magnetic fields20. Superconducting quantum interference devices (SQUIDs) are
used to map out the magnetic activity of numerous parts of the body but
especially the brain (magnetoencelphalography)21.
Electrical impedance imaging or applied potential tomography is based on
measuring the difference in electrical conduction and / or permittivity (potential
difference) that occurs among tissues when a voltage is applied18,20-23. Since
certain tissues exhibit large differences in electrical resistivity, high contrast
resolution should be achievable if the problems of spatial resolution can be
solved22.
For security imaging metal detection uses techniques in this part of the frequency
spectrum.
3.1.2 Present Electrical and Magnetic Source Imaging Technology
At present there are no commercial ESI, MSI or electrical impedance imaging
systems on the market. All present systems are being used as research tools.
Metal detectors either as portal walk-through systems or hand-held detectors are
a mature technology with many companies selling such systems.
3.1.3 Future and Emerging Electrical and Magnetic Source Imaging Technology
All three medical techniques described in 3.1.1 are emerging techniques that
have particular advantages for extracting specific information but have only been
used as research tools in combination with other techniques such as PET or
MRI.
19

ESI has the potential to improve the diagnosis of certain abnormalities such as
epilepsy and disorders in impulse conduction in the heart18. It could also be
useful in guiding surgical procedures and in monitoring the effectiveness of
certain drug treatments.
There are severe limitations to ESI which include:
1. Poor spatial resolution (e.g. 30 mm in detection of the thorax22).
2. Significant absorption of the radiation in bone.
3. Difficulties in identifying and localising multiple sources of electrical
activity from the remote measurement of electric fields.
MSI is a far newer technique with the first reports of the technique dated around
1992. The technique has been researched as a potential methodology for clinical
evaluation of epilepsy, migraine headaches and diabetic comas18. It may also
have potential applications in studying brain responses to a variety of conditions
including auditory, olfactory and visual stimuli. MSI is also showing promise for
studying the physiology of neural tissue and the cognitive properties of the
brain18-20.
The main limitation with electrical impedance imaging is that there is seldom a
single resistance path between two electrodes placed on the human body. The
major applications which are under research include cardiac output
measurements, pulmonary oedema monitoring and tissue characterisation in
breast cancer18,22,23.
3.2 Ultrasound and Sonar
3.2.1 Background to Ultrasound and Sonar
Ultrasound and sonar are techniques which rely on the reflection and refraction
at interfaces between two media with different acoustic refractive indices of
20

longitudinal waves. Ultrasound also extracts additional information from the
absorption of the signal as it is transmitted though different materials along with
using interference effects from the coherence of the radiation. As sound waves
propagate at significantly slower velocities than electromagnetic waves (e.g.
1540 m/s in the soft tissue of a human17) the wavelength associated with a
1 MHz sound wave is 1.5 mm and 0.1 mm at 15 MHz. For sonar systems the
velocity of sound in water is around 440 m/s corresponding to 0.5 mm at 1 MHz
and 5 cm at 10 kHz. For these wavelengths wave optics is appropriate rather
than geometrical optics and both diffraction and interference limit the resolution
of the techniques. That is, the resolution is already at the limit set by the optics
and so other techniques must be used for improvement.
3.2.2 Present Ultrasound and Sonar Technology
Ultrasound systems are presently sold by a large number of different companies
including GE Medical Systems, Siemens, Toshiba and Hitachi along with a few
UK companies including Dynamic Imaging. Ultrasound systems are cheaper to
purchase, operate and maintain than x-ray computed tomography and MRI
systems.
Sonar systems are sold by many UK and foreign companies with numerous
applications from naval, mapping of the ocean floor24, navigation in shallow
waters to detection of cables and oil rig inspection.
3.2.3 Future and Emerging Ultrasound and Sonar Technology
Developments are still being pursued for new high-density transducer arrays, one
and one-half dimensional transducers, broad band transducers, increased
scanner bandwidth and more sophisticated image formation and analysis
routines25. Functional ultrasound and quantitative measurements are also now
possible where previously it was believed that ultrasound could not obtain such
information25.
21

Ultrasound is getting much better for vascular applications particularly. Sound
waves are used to break up blockages in arteries so that the remaining pieces
are small enough to be transported away in the bloodstream from the blockage26.
Longitudinal sound waves require rigid equipment for the production of
ultrasound which is not easy to deploy to many parts of the body especially
during surgery. Transverse sound waves are being developed which can be
waveguided down flexible tubes allowing much more compatibility with present
techniques4.
Ultrasound research is also aimed at trying to produce functional information for
clinical applications. The Doppler effect can be used to monitor any changes in
blood flow and could potentially be used to monitor anti-angiogenesis cancer
therapies27 which attack the growth of new blood vessels in tumours4. At present
ultrasound is only a qualitative modality for such applications and quantitative
data is required.
There is potential for interventional ultrasound with, e.g., sound activated
liposomes. Different contrast agents are also being researched to enhance
images. Suspensions of small bubbles which are only a few microns in diameter
are used as ultrasound contrast agents and exposure to the ultrasound
frequencies resonates the bubbles increasing the reflected signal28,29. High
intensity pulses can burst the bubbles resulting in even higher contrast. Such
techniques are also being investigated as possible methods for targeted drug
delivery4.
Research in sonar systems is predominantly aimed at image analysis techniques
from efforts to obtain additional information for instance in tomographic mapping
of the ocean floor24 through wavelet analysis to study sediments on the ocean
floor30 to techniques for reducing errors from towed arrays31.
22

3.3 Magnetic Resonance Imaging and Nuclear Magnetic Resonance
3.3.1 Background to MRI and NMR
Magnetic Resonance Imaging (MRI) through nuclear magnetic resonance (NMR)
can now be used to image almost any organ in the human body4,17. The MRI
technique measures the distribution of water molecules when placed in a
magnetic field using radio waves and hence is non-intrusive and involves non-
ionising radiation. The UK has been one of the pioneering countries of MRI and
in 2003 the Nobel Prize for Medicine was awarded to Sir Peter Mansfield of
Nottingham University and Paul Lauterbur of the University of Illinois in
recognition of their work in developing the technique. MRI is derived from the
original development of nuclear magnetic resonance by Felix Bloch and Edward
Purcell in 1946.
MRI and NMR use the fact that the hydrogen nuclei within water molecules have
an inherent magnetic moment due to the nuclear spin17. If the spins are placed in
a magnetic field, quantum mechanics dictates that the nuclear spin must be
parallel (lower energy state) or anti-parallel (higher energy state) to the magnetic
field pulse of electromagnetic radiation with frequency
Bmeg
pπν
4= (5)
can excite the nuclear spins to the higher energy state (e is the electron charge,
g is the g-factor for the nucleus, mp is the proton mass and B is the applied
magnetic field). For a 1 T magnetic field, the transition frequency is 42.6 MHz.
When the nuclear spin realign with the applied magnetic field, a radio signal of
the same frequency is emitted.
MRI uses a second, weaker magnetic field with a gradient that decreases linearly
in strength across the sample. This field changes the frequency at which
hydrogen nuclei absorb and emit radiation across the sample and hence spatial
23

information can also be extracted from the sample. NMR is typically used in
chemistry and biochemistry laboratories to identify a large number of different
nuclei in a sample and obtain the relative abundances of the different species.
3.3.2 Present MRI and NMR Technology
There are numerous companies selling MRI machines at present including GE
Medical, Siemens and the UK company Resonance Instruments. The costs are
still relatively high and the availability in NHS UK hospitals is still not complete.
NMR systems are sold by the UK companies Oxford Instruments and Resonance
Instruments although the main companies for chemical NMR spectrometers are
Bruker, Jeol and Varian. UK companies such as Oxford Instruments and Magnex
Scientific also sell superconducting magnets for NMR and MRI systems.
Nuclear quadrupole systems are predominantly in development and testing
although a US company Quantum Magnetics sells explosive detection imagers
for airports.
3.3.3 Future and Emerging MRI and NMR Technology
The single greatest problem of MRI is the sensitivity of the technique. One
approach to dealing with this is to increase magnetic field strength. This has
been a widely favoured approach though it is also by far the most expensive.
Alternative strategies include improvement in radio frequency coil design and
increased polarisation particularly for the lower sensitivity nuclei such as 13C.
Work, however, has proceeded somewhat slowly, is limited in scope and - for
polarisation- still is focused in basic physics/chemistry laboratories. High
temperature superconducting (HTS) magnets are presently being researched
both for increasing magnetic fields but also to increase the operating temperature
for better signal to noise ratios32,33.
MRI scanners used during surgery must have open magnet structures to allow
24

the surgeon to have full access to the patient. Such magnet systems have limited
magnetic fields of up to 0.6 T while closed bore systems can have 3 T or more.
These lower fields produce lower signal to noise ratio and poorer resolution.
Potential solutions are unlikely to result in cheaper MRI tools. MRI guided
procedures are being used for numerous applications including neurosurgery and
cardiac operations where accuracy and risk from x-ray exposure are a prime
importance4.
Functional MRI is one of the areas with significant research interest. Techniques
to investigate the human brain, such as blood oxygenation level dependent
functional MRI34,35 along with structural, biochemical and functional pathological
information from multiple sclerosis36 demonstrate the direction in which the
research is being pushed. The functional MRI techniques are attempting to
obtain information which previously was only available by radiological techniques
such as PET, but using a non-invasive and non-ionising technology. For the brain
imaging, neurons are about 5 to 10 µm in spacing and resistance arterioles are
about 0.5 to 1.0 mm in spacing while present MRI resolution is of order of 1 to a
few mm35. A number of techniques are being researched to improve the
resolution. This is covered in another EEMS project state of the science review
‘Inside the wavelength: electromagnetics in the near field’.
Micro-MRI in conjunction with new image processing techniques and feature
extraction techniques is being used to obtain detailed structural information of
vertebrae bones37. While resolution is limited by the signal-to-noise ratio, the
voxel size achievable in vivo is of the same order of thickness as the trabeculae
(100 to 150 µm). Such techniques are being used in the study of
postmenopausal osteoporosis, male hypogonadism and secondary
hyperparathyroidism.
Genetics and MRI imaging is of real interest. A number of proofs of principle
have been achieved38,39. Basically, imaging might be difficult as a quantitative
trait marker simply because of the numbers of studies that would be needed.
25

However, it may be extremely good for:
1. Exploring heterogeneity in populations otherwise phenotypically
indistinguishable, or, if a trait is clear by imaging, refining phenotypic definition in
otherwise indistinguishable groups (e.g. pre-symptomatic Alzheimers)
2. Defining specific functional and structural features associated with the tails
of behavioural curves.
3. Helping to understand on a systems level the expression of genetically
transmitted traits (e.g., understanding the evolution of pathology in an inherited
disease as a clue to mechanisms of progression).
Hyperpolarisation is the enhancement of nuclear spin by irradiating atoms with
polarised light40,41. Typical atoms include 3He, 129Xe, 13C, which can have
increases of nuclear spin polarisation of over 104 when optically pumped40-43. The
technique therefore opens up MRI imaging of the lungs and pulmonary airspaces
including morphologic imaging of airways and alveolar spaces and analysis of
the intrapulmonary distribution of inhaled aliquots of the tracer gases40,41. While
the natural abundance of 13C in biological molecules is too low to be used for
MRI, hyperpolarisation enhancement of 104 of the nuclear spins have allowed
subsecond angiography in small animals to be obtained42. Hence the
hyperpolarisation technique allows 13C to become relevant for practical medical
and diagnostic work. Injected molecules in rabbits have been tracked by MRI of
hyperpolarised 13C in the injected molecules41.
Nuclear quadrupole resonance techniques are an emerging technology being
investigated for security imaging. SQUIDs are used for the remote measurement
of magnetic fields especially for the detection of explosives through NMR
detection of 14N. Research is presently aimed at detection of landmines44-46. One
US company sells portal detectors for people and imagers for baggage and
postal imaging.
26

3.4 Microwave Imaging
3.4.1 Background to Microwave Imaging
In this section microwaves will be defined as the region from 1 GHz to W-band
(110 GHz) (Fig. 5) where there are plenty of sources and detectors on the
market. The microwave part of the spectrum has good atmospheric transparency
to radiation over most of this range (Fig. 4) although there is a strong absorption
from an oxygen line at 80 GHz. Millimetre wave systems can penetrate poor
weather and battlefield obscurants far better than infrared or visible systems.
There are a significant number of applications using this part of the spectrum
(Fig. 6) and for non-intrusive imaging many of the main communications regions
need to be excluded to avoid interference effects.
Fig. 5: The band designations for the microwave part of the electromagnetic spectrum above 8
GHz
The region has to date predominantly been used for security imaging47 especially
to see through fog and rain (Fig. 4) but there is research on microwave
tomography for medical applications48 and also automotive imaging for
navigation in fog (Fig. 6). Systems have also been used to demonstrate
concealed weapons detection on humans as clothes are transparent in this
frequency range (approximately constant transparency between 60 and 150
GHz)49-52. The technology has also been used for the detection of illegal
passengers on lorries as 90 % of lorries in Europe have non-metallic sides53.
From Fig. 1 and Fig. 4 it should be clear that there is a drive towards lower
frequencies in the microwave region since the atmosphere and also clothes are 27

more transparent at the lower frequencies but then the wavelength is increasing
and so resolution does become an issue.
3.4.2 Present Microwave Imaging Technology
The UK is well placed in this field for passive millimetre wave imaging systems
with the work of QinetiQ49-58. Systems operating at 35 GHz54 and 94 GHz55 have
been used as demonstrators for numerous applications. The QinetiQ 94 GHz
system uses mechanical scanning along with compact folded optics54. These
systems operate at video rate with a field of view of 60 degrees by 30 degrees
with diffraction limited performance (that is, at the limit of the optical system) over
two thirds of the field of view. They have the potential to be used not just for
military imaging applications but also for airport security and the illegal smuggling
of people at ports.
Fig.6: The designated frequencies and bands for a number of different applications in the
microwave part of the electromagnetic spectrum
Compared to many imaging technologies the systems are not expensive, the
major costs are probably the Indium Phosphide (InP) MMIC used as detectors.
There is therefore the potential to reduce the cost of systems as new technology
becomes available.
There is plenty of research in microwave tomography for medical applications48,49
but few systems are being marketed commercially.
28

3.4.3 Future and Emerging Imaging Technology
The component technologies required for microwave imaging systems continue
to improve due to the relentless improvement in semiconductor technology. InP
MMICs are presently the main semiconductor technology for W-band power
amplifiers and low noise amplifiers (LNAs) while at the lower frequencies GaAs
technology dominates. At the lowest frequencies (1 GHz) Si is now a competing
technology60 and SiGe HBTs now provide many power amplifiers and LNAs in
mobile phones and in consumer products below 10 GHz60. The cost of the
detectors will therefore continue to fall as semiconductor technology progresses.
Microwave tomography in medical imaging is being aimed at a number of
applications including cardiovascular applications48.
3.5 Terahertz Imaging
3.5.1 Background to Terahertz Technology
For this review it is practical to define the terahertz region of the electromagnetic
spectrum as that from above W-band (110 GHz) to 10 THz. This then defines the
terahertz region of the spectrum as that which has not been fully utilised due to
the lack of practical, cheap and coherent sources. It is only in the last 6 years
that suitable sources and detectors have become available in the research
laboratories (Fig. 7) and the first commercial imaging system (TeraView Ltd.)
became available in 20029. All molecules (biological, organic, inorganic, etc)
have vibrational and rotational spectra that lie in the terahertz frequency range
with signatures resulting from intra- and inter-molecular interactions (Fig. 1)8,10,11.
The wavelengths are short enough to enable sub-millimetre imaging while long
enough to penetrate many materials allowing hidden objects to be imaged.
Techniques, therefore, allow 3D imaging of many objects8,9.
While there have been many first demonstrations of terahertz imaging in different
29

applications, there are very few, if any detailed studies as yet.
3.5.2 Present Terahertz Technology
At present there is a single terahertz imaging system commercially available
which is sold by TeraView Ltd. in Cambridge7. The UK is therefore extremely
strong in this emerging field both from an industrial but also academic basis. The
imager uses photomixer technology with a femtosecond pulsed laser illuminating
low temperature GaAs as the broadband terahertz source (300 GHz to 3 THz).
The system uses rastering of a single spot to build up an image and the detected
signal is mixed optically with the original laser source to provide coherent
detection. Imaging time is between 10s of seconds to minutes depending on the
resolution used. The femtosecond laser pushes the cost of such systems to over
£250k.
3.5.3 Future and Emerging Terahertz Technology
There are very few terahertz components such as power amplifiers, LNAs or
mixer technologies commercially available and this is where most development is
still required before cheap, efficient and compact terahertz systems can be
produced (see Fig. 7 for present sources). The terahertz is predominantly being
driven by technological development as better sources and detectors are
required before applications can be pursued.
30

Fig.7: The present sources of radiation between 100 GHz and 10 THz10, 11, 61-64. QCL=quantum
cascade laser, RTD=resonant tunnelling diode, MMIC=monolithic microwave integrated circuit.
There are many first demonstrations of applications in the terahertz with regard
to non-intrusive imaging and these will be reviewed below.
Medical imaging and diagnostics: Work at Cambridge has demonstrated the
ability to detect basal skin carcinomas8,65,66 (the most prevalent form of skin
cancer). The ability of terahertz pulsed imaging to recognize high contrast
between small changes in the density of soft tissues suggest great promise in
cancer detection. Clinical trials are now being started on this technique. The
current global market for medical imaging is US $14.1 billion per annum and
business analysis has suggested that terahertz might be able to capture 10 % of
this within 10 years.
31

Dental imaging: Terahertz has been used to image dentine, enamel and pulp
cavity in teeth67. It has also demonstrated imaging of early caries (tooth erosion -
Fig. 2) therefore allowing dentists to prevent cavity formation and may aid the
identification of periodontal disease68. Terahertz imaging has also been used to
measure the thickness of enamel (Fig. 2) and the amount of demineralisation in
teeth, a growing problem with the large consumption of highly acidic, fizzy
drinks9,67. Terahertz produces higher contrast images than x-rays and is non-
ionising.
Security scanning: While x-rays can be used to detect metals and numerous
sharp objects, health concerns limit their use in scanning humans. Terahertz,
however, has been used to detect metal, plastic, GRP and ceramic knives
underneath a number of layers of different clothing materials69,70. Transmission
through cotton teeshirts is almost 90 % while leather transmits 8 % and a
computer laptop bag 3 %70. One major problem is the complete absorption by
metals which limits the applicability without other techniques such as x-ray for
baggage inspection. Initial research has also demonstrated the potential for
identifying unknown substances such as drugs or explosives69. Explosives
detection on people through a number of layers of clothes has demonstrated
explosives detection on people at a distance of 1 m in the research laboratory
with spectroscopic identification of the explosive13.
Postal scanning: Initial results on letters have shown that THz can detect the
number of pages in a letter and also detect materials between pages including
ink69. There is therefore the possibility of scanning mail to identify dangerous
materials71.
Biological weapons detection: The US Army Research Office has been
funding research on detection of a number of pathogens including anthrax.
Similar DNA species of fish have been differentiated which is useful in the first
stages of determining whether biological material is dangerous but unique
determination of pathogens has yet to be demonstrated by any technique 72.
32

Landmine detection: Modern plastic landmines are significantly more difficult to
detect than older mines with metallic parts. THz detection potentially provides a
more robust and accurate detection technique than the present schemes73.
3.6 Infrared Imaging
3.6.1 Background to Infrared Imaging
Infrared technology has been driven by predominantly military applications for
night-vision imaging72. The technology has also been applied for thermal security
cameras and for the fire service to image through smoke. As almost everything
emits a blackbody spectrum in the infrared most imaging systems are passive.
On the medical side there is work on thermography but the non-specificity of the
technique has limited the potential applications and use73. With new technology
now offering better detectivity and NE∆T of 0.04 K or better at video rates, there
may be a new opportunity for thermography as a non-ionising and non-intrusive
technique.
Predictive maintenance by using thermal imaging of electrical and production
machinery is also a growing market for infrared non-invasive passive imaging
systems.
3.6.2 Present Infrared Imaging Technology
Available infrared detector technology includes:
1. Bolometers and Microbolometers: operate by measuring the resistance of a
material with a temperature dependent resistance. Microbolometers can be
fabricated using microelectronics fabrication techniques allowing large arrays to
be fabricated at low cost.
33
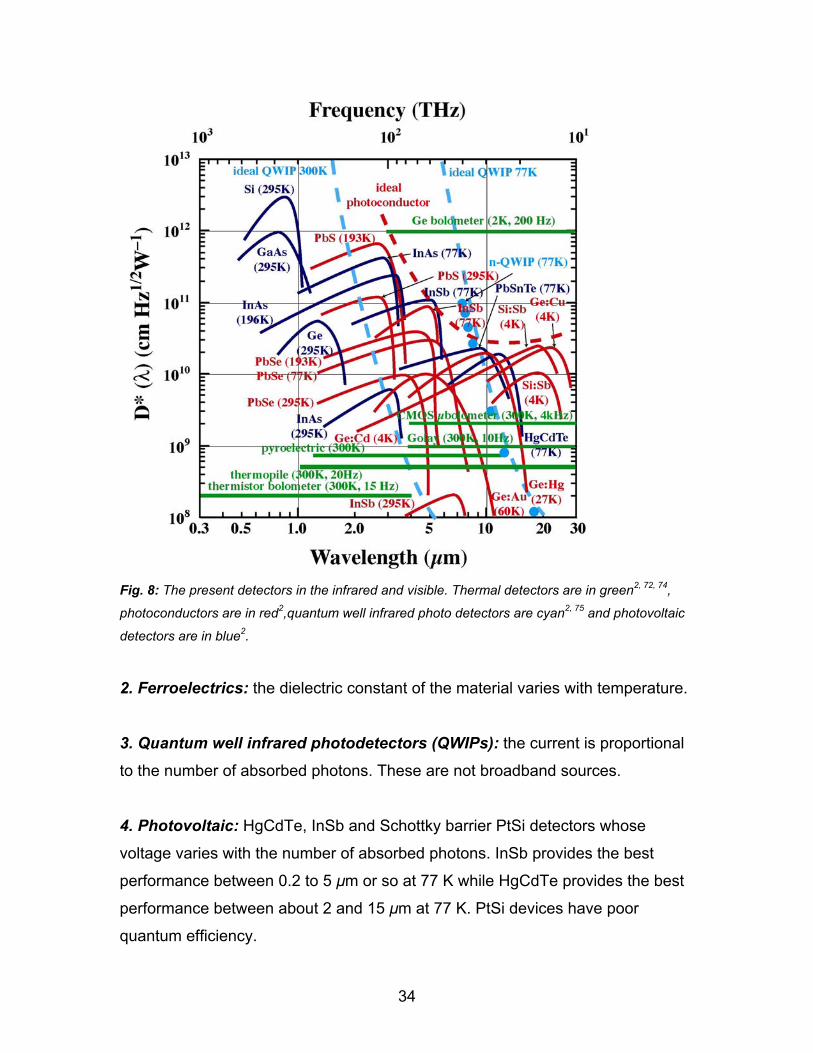
Fig. 8: The present detectors in the infrared and visible. Thermal detectors are in green2, 72, 74,
photoconductors are in red2,quantum well infrared photo detectors are cyan2, 75 and photovoltaic
detectors are in blue2.
2. Ferroelectrics: the dielectric constant of the material varies with temperature.
3. Quantum well infrared photodetectors (QWIPs): the current is proportional
to the number of absorbed photons. These are not broadband sources.
4. Photovoltaic: HgCdTe, InSb and Schottky barrier PtSi detectors whose
voltage varies with the number of absorbed photons. InSb provides the best
performance between 0.2 to 5 µm or so at 77 K while HgCdTe provides the best
performance between about 2 and 15 µm at 77 K. PtSi devices have poor
quantum efficiency.
34

5. Thermal detectors: Golay cells operate by detecting the change in pressure
of a gas as a function of temperature. These detectors are slow and cannot
easily be made into arrays.
The best detector is a function of the precise frequency required to be detected.
CMOS fabricated microbolometers are just emerging and allow large focal plane
arrays of detectors to be fabricated cheaply and offer excellent detectivity
at 300 K below about 5 µm (Fig. 8) with NE∆T of about 0.2 K76. For higher
detectivity, detectors require cooling. QWIPs at 77 K have demonstrated the
highest detectivity below about 9 µm and photoconductors at 4 K are required for
high detectivity in the far infrared. At 77 K QWIP focal plane arrays can now
achieve NE∆T of 20 mK with a detectivity of 1011 cm√Hz/W 77.
Complete thermal imaging systems exist for many different applications and are
manufactured and sold by a large number of UK companies. The UK has
significant expertise in this field.
3.6.3 Future and Emerging Infrared Imaging Technology
Research is still aimed at improving passive detector technology especially
techniques which can produce large focal-plane arrays of detectors which have
better detectivity, higher operating temperatures and better NE∆Ts.
Skin and subcutaneous tissue are partially transparent in the visible and near-
infrared78. Breast cancer detection is being researched in this part of the
spectrum combined with the visible as a non-invasive and non-ionising
alternative to x-ray techniques78.
A developing field is that of chemical imaging cameras where infrared technology
using focal-plane detector arrays from military technology are used to produce
chemically specific composition and distribution in samples in seconds80,81.
35

3.7 Visible Imaging
3.7.1 Background to Visible Imaging
Visible imaging is probably the oldest field in this review but to some extent it is
limited to imaging surfaces or near subsurfaces by the poor penetration depth of
most materials in the visible. There are now numerous security cameras in most
UK cities, all linked to the police to provide security imaging for crime prevention
applications.
Medical imaging also uses visible techniques, predominantly for skin problems or
near surface imaging but also for many surgical procedures such as with
endoscopes. While such techniques are invasive, they have significantly
improved patient recovery time for certain surgeries where key hole techniques
can be used. The ability to guide visible radiation down flexible fibre optic cables
can provide information which is not easy to obtain using other imaging
modalities. Such systems are also extremely useful for many other applications
such as pipe inspection in hazardous environments, etc.
Optical coherence tomography (OCT) is an emerging biomedical imaging
technique that now performs high resolution, cross-sectional tomographic
imaging of microstructure in biological systems82,83. The commercial systems are
based on a fibre optic Michelson interferometer with a low-coherence length light
source. OCT has achieved image resolutions of 1 to 15 µm84 with the penetration
depth in tissue limited by optical scattering to 2 to 3 mm85. Although the depth is
shallow compared to many other modalities, the resolution is 2 to 3 orders of
magnitude finer than conventional ultrasound, MRI or x-ray CT. The resolution is
approaching that of conventional histopathology.
OCT technology provides in-situ imaging in real time allowing surgical guidance,
guidance of biopsy or investigation of dynamic response to therapeutic agents.
OCT imaging may be carried out using non-invasive or minimally invasive
36
delivery systems such as microscopes, handheld probes, endoscopes, catheters,
laparoscopes and needles. OCT can also perform functional imaging such as
spectroscopic imaging of tissue properties, Doppler blood flow measurement and
quantification of blood oxygenation or tissue birefringence83.
3.7.2 Present Visible Imaging Technology
The original drive for large focal plane arrays of detectors in the visible and the
corresponding optics was driven by spy planes and satellites for military
reconnaissance. Charge couple devices (CCDs) in commercially available digital
cameras now offer 5 million pixels for under £400 and 12 million pixels for £1300.
These are fabricated using silicon microelectronics and as such the UK does not
have any native manufacturing companies. The major profit, however, is related
to the system, architecture and operation of such systems. The UK has many
companies which design and sell complete visible imaging systems for many
different applications. Complete security systems for homes or small businesses
are now available which use computer technology rather than video to record
images from digital cameras thus substantially reducing costs.
There are many visible and laser-based imaging systems for medical
applications. Most are aimed at simple inspection while research is aimed at
obtaining more information from biological specimens86,87. OCT systems are
dominated by the US company Carl Zeiss Meditec with over 1500 tools in
hospitals worldwide.
3.7.3 Future and Emerging Visible Imaging Technology
Medical optical imaging remains one of the great unrealised areas of potential. If
problems of detection sensitivity, tissue absorption and scattering could be
satisfactorily solved, it offers a new approach to highly specific “tag imaging” (like
PET) without radiation. Applications include breast cancer detection78, optical
37

biopsy87, and molecular imaging87. Research is also aimed at finding contrast
agents to improve present technology88.
OCT is heavily dependent on the technology base of photonics and lasers. The
recent short pulse laser sources have enabled the image resolution to be
reduced to the order of 1 µm. The fibre and diode femtosecond lasers being
developed may be able to reduce this further. The high resolution allows cellular-
level image resolution producing visualisation of mitotic cycles and a track for cell
migration84,89. Single photon detection will also improve the OCT technique.
Superconducting / insulating / superconducting (SIS) detectors were the first to
achieve single photon detection sensitivity but are limited to liquid He
temperatures90. HTS may improve this to 77 K but there are technological
problems with the ceramic HTS materials. Semiconductor quantum dots have
already demonstrated single photon detection at 4 K integrated in a conventional
field effect transistor (FET) to provide an amplified electrical output91. Quantum
dot technology is now close to 77 K and has the potential with development to
reach room temperature operation. Using semiconductor materials it also has the
potential to be fabricated into large arrays at cheap cost.
Broadband light sources are also attractive for spectroscopic OCT imaging
providing functional information83. The different optical properties of tissues allow
enhanced tissue contrast through spectroscopic imaging. In addition, it is
possible to perform quantitative imaging of tissue chromophores or functional
state. Metabolic indicators such as tissue hydration or oxygenation of
haemoglobin in vascular tissue can be measured92. Other tissue properties such
as birefringence can be imaged and quantitatively measured93.
38

3.8 X-ray Imaging
3.8.1 Background to x-ray Imaging
X-ray imaging is the original medical imaging technology with the first medical x-
ray image being taken in Birmingham in January 1896 after the discovery of x-
rays by Roentgen at the University of Wurzburg in November 1895. The
transmission and detection of x-rays is still the basis of numerous medical
imaging techniques including radiography, angiography, fluoroscopy and
conventional mammography examinations. Since x-rays are ionising radiation,
such techniques are not completely non-invasive although in applications such
as imaging the lungs, other cheap and practical techniques are far more invasive.
For security monitoring a large number of items can be scanned without the
requirement of opening every item, reducing time and cost of weapons or
narcotics detection.
3.8.2 Present x-ray Imaging Technology
There are many different companies selling x-ray tools for medical imaging
including GE Medical, Philips, Siemens, Toshiba and Hitachi. These tools are
used for many different applications or modalities in medical imaging including
radiography, angiography, fluoroscopy and conventional mammography
examinations.
Medical systems range from planar x-ray systems to modern computed
tomography (CT) systems designed to produce a series of 2D slices through the
body. The planar x-ray systems can be divided into cassette-based computed
radiography systems94 and instant-readout digital radiography systems95. Digital
radiography systems can be further divided into direct or indirect conversion
systems where the x-ray is either directly converted into an electrical signal or for
the indirect process first converted into a photon which is then converted into an
electrical signal. Modern equipment has moved from film-based systems to
39

digital systems which use caesium-iodide scintillators coupled to flat-panel
detectors. Charged coupled device arrays (CCD) are also used for detection in
some systems.
CT systems are also available in either sequential scanning of consecutive slices
or multi-slice spiral systems which now allow resolution down to ~1 mm96. The
latter systems are substantially faster and can have reduced radiation doses (up
to 50 %) compared to the former with appropriate techniques96.
For x-ray security scanning for baggage and cargo there are a large number of
commercially available systems.
3.8.3 Future and Emerging x-ray Imaging Technology
A significant part of research in x-ray technology is the development of arrays of
detectors with higher sensitivity particularly for medical imaging where such
detectors allow the reduction of radiation dose to the patient94-98.
Fast CT has a real role, particularly because of clinical practicalities (e.g.
perfusion imaging, angiography), but may have something of a limited range of
entirely novel applications, just because x-ray computed tomography contrast
mechanisms are limited. As scanning speeds improve Dynamic CT imaging is
also developing as scanning speeds improve where reconstructing image
sequences to see the dynamic nature of the living human body is of primary
interest99.
CT is presently being fused with other techniques such as PET and MRI (since it
provides higher resolution) to provide anatomical information, but, for example,
PET is especially good at mapping areas of metabolic hyperactivity.
40

3.9 Radionuclide Imaging
3.9.1 Background to Radionuclide Imaging
Unsealed radiopharmaceutical imaging in the form of gamma camera, single-
photon emission computerised tomography (SPECT) and positron emission
tomography (PET) cannot strictly be considered non-intrusive forms of imaging
as ionising sources of radiation are used but the associated low morbidity of
patients does allow these functional techniques to be classed as such. These
techniques all rely on the detection of gamma-ray, x-ray or positron emission
from radionuclides in the human body which are used to label substrates,
ligands, drugs, antibodies, neurotransmitters and other compounds which are
tracers of specific biochemical or physiological processes. As such these are
functional imaging modalities that provide clinical information regarding
biochemical and physiological processes in patients. Since changes in the
biochemical or physiological processes are frequently the first manifestations of
disease before structural changes can be imaged, the techniques provide an
important role in evaluating and managing patients with disease100.
3.9.2 Present Radionuclide Imaging
Anger designed the original so-called Anger gamma camera in the 1960s and the
gamma cameras101 found in most routine nuclear medicine departments
(manufactured by GE Medical, Philips Medical and Siemens) and very little has
changed from the original design. The basis of the camera design for all three
techniques relies on scintillations (NaI(Tl) for gamma-ray and SPECT with
bismuth germinate (BGO) for PET). Gamma-ray and SPECT require collimation
of the beam while PET uses detection coincidence of the two photons created by
annihilation and travelling in the opposite directions. Photomultiplier tube arrays
are then used to collect the visible photons and convert the light into electrical
signals.
41

There are about 400 PET scanners in hospitals worldwide with 12 in UK research
institutes or hospitals and 3 commercial organisations offering PET scans in the
UK. There are more gamma camera systems but again numbers are limited in
UK hospitals. As cyclotrons are required to generate the short half-life
radionuclides (e.g. 15O) for PET systems, the costs of complete systems
including the preparation of the radionuclides are relatively high (~£2M). A
gamma camera typically costs £300k to £400k.
3.9.3 Future and Emerging Radionuclide Imaging
The major disadvantage of gamma camera, PET and SPECT systems is the
relatively poor resolution. Typical resolution is limited to around 5 mm or greater.
The clear benefits of these functional imaging techniques to the UK have been
stated102,103 but research is required on improved resolution.
One of the promising approaches to gamma ray detection is the use of
semiconductor detectors such as CdTe104 and CdZnTe105. Both can be used at
room temperature and convert single photons of tens to hundreds keV energy
directly into electrical signals. The increase in spatial and energy resolution of
these techniques is translated into higher contrast resolution and improved
detection of abnormalities. The second technique being pursued is the use of
silicon CCD detectors in place of the photomultiplier tubes105. Both technologies
reduce the weight of the camera to a level which allow more portable applications
rather than a fixed portal system.
Attenuation correction systems are also being developed to circumvent the
physical phenomena that degrade the degree to which the detected counts
represent tracer activity and thus degrade diagnostic accuracy106.
There have been a number of attempts at reducing the cost of systems, as this is
the major factor in the low number of systems in hospitals worldwide. The cost
42

and imaging performance are directly related to the total number and type of
detector surrounding the patient. The standard BGO geometry detectors are
normally arranged in ring formation and new geometries have been attempted to
reduce the number of detector elements and hence cost whilst maintaining the
imaging performance107,108.
3.10 Hybrid Technologies and Data Fusion
There is substantial research at present to develop the potential for integrating
different imaging modalities in a simple way. For example, it is now possible to
obtain electroencephographic and functional imaging and structural imaging data
all in one examination. The techniques, however, remain cumbersome.
Similarly, demonstrations in animals have shown how PET and MRI data can be
obtained together. Finding these approaches to joint data acquisition and mutual
information promises to enhance the potential of the techniques4,5.
Hybrid imaging systems are also a major emerging area with PET/SPECT,
PET/MRI and PET/CT scanners being developed especially for cancer imaging.
PET is especially good at mapping areas of metabolic hyperactivity (a high
indication of cancer being present) while multi-slice CT has sub-millimetre
resolution providing a clear picture of anatomical detail. By combining the two
techniques, tumours can be accurately located and the size and shape
assessed. This is potentially valuable when characterising or staging tumours
when they are first diagnosed and then monitoring their response to treatment.
PET has a role both in metabolic imaging (with resolution enhancement in part by
data fusion with structural MRI) and in rather cutting-edge techniques such as
receptor mapping, benefiting from the high sensitivity and potential specificity.
There are also major developments in high resolution, low-cost micro-PET
imagers for small laboratory animals to allow research in genetics5,100. There are
three options for generating combined systems such as the PET / CT combined
system: a) collect the PET and CT images separately and then use software to
combine the data, b) fix a patient to the bed and then quickly obtain both images
43

in separate machines or c) develop hybrid machines with both imaging
technologies. The first two techniques have significant disadvantages but can be
used with minimum new capital costs. The third is that preferred by the
equipment manufacturers mainly because of the ability to sell new machines.
3.11 Other Emerging Non-invasive Imaging Technology or Developments
One of the emerging or longer term areas of imaging for the medical field is out-
of-hospital or health monitoring in the home109-111. With advancements in sensor
technology along with communications and IT, there are an increasing number of
papers in the literature discussing options for wearable sensors and imaging.
While much of the literature is aimed at non-imaging applications, similar local
area networking (LAN) reading of sensors and transmission of data to a local
doctor or hospital can be envisaged for imaging applications. It is more likely that
local doctors will use such technology first to send data and gain diagnosis from
a specialist in a non-local hospital rather than true health monitoring in the home.
Cost is likely to be the major limitation to such technology being adopted
although the communications infrastructure is becoming more widespread.
4. Developments in Component Technologies 4.1 Image Analysis and Display
Powerful new approaches to analysis of outcome data based on collection of
information from multiple sources including clinical, testing, imaging are being
incorporated into novel clinical trials. These approaches include adaptive
designs, in which prospectively acquired information defining, for example,
subgroups can be used to provide the most sensitive outcomes measures. This
should be particularly useful in finding efficient strategies for early Phase II trials.
Radiology is in general still dominated by practitioners who read simply by visual
44

inspection. This approach suffers from considerable observer bias along with
variable sensitivity and specificity. Automating the process of extracting or
recognising objects out of an image is useful in many imaging applications as
potentially allowing automated diagnosis or recognition of dangerous events or
objects in military or security applications112. There are a variety of modern
techniques for comparison between normative data basis with specific image
data in order to identify pathology. Demonstrations of the potential of this have
been made in research laboratories, but refinement and wide practical
implementation of this technology has yet to be performed. There is a need for
research concerning problems of effectively matching tissues between images
(problems such as non-linear warping), developing tissue classification
approaches based on multimodal datasets and incorporation of prior information
in effective ways.
Image segmentation, that is, the process of defining objects in images, remains
the most challenging problem in image processing. Object regions manifest
themselves in images with a heterogeneity of image intensities owing to the
inherent object material heterogeneity, and to artifacts such as blurring, noise
and background variations introduced by the imaging system. Knowledgable
observers can perceive object regions as a gestalt despite this graduation of
intensities. The ‘fuzzy correctedness’ framework is one image analysis technique
which defines how the image elements hang together spatially in spite of their
graduation of intensities113. In defining objects in a given image, the strength of
correctedness between every pair of image elements is considered, which in turn
is determined by considering all possible connecting paths between the pair. This
research technique is being used in the fields of multiple sclerosis of the brain,
magnetic resonance and computer tomographic angiography, brain tumour,
mammography, upper airway disorder in children and colonography112,113.
CT is a computationally intensive process and one attempt to produce lower cost
systems is the use of fast Fourier transforms (FFTs) for Fourier-based
reconstruction114,115. These techniques can be implemented cost effectively using
off-the-shelf components such as digital signal processors (DSPs) which are
45

used in all forms of imaging applications and already have a strong market in
graphics cards for personal computers.
The Fourier reconstruction requires images to be acquired using a fan beam data
scanner to obtain a radial set of projections. Once the data is obtained it goes
through preprocessing (filtering), weighting and a rebinning before the Fourier
reconstruction is implemented14.
The hybrid imaging discussed in section 3.10 has produced a number of software
systems aimed at registration of parts in different images116 along with automated
procedures for aligning images from different modalities or detecting large
misregistration117.
4.2 Phase Contrast Techniques
Contrast / Imaging agents are an increasingly exciting field. Medical imaging is
now moving from simpler techniques which highlight structural ‘contrast’ between
different tissue types, to sophisticated ‘molecular imaging’ agents, capable of pin-
pointing very early stage pre-symptomatic functional changes in tissues.
Examples under development include hypoxia for cancer (PET), cell tracking
(PET, MRI) in cell therapy, microglia activation (PET), gene expression tracking
(optical, MRI). Ultrasound cavitation may also be an appropriate contrast
mechanism in certain situations, though it lacks the molecular ‘precision’ of
nuclear imaging29. Imaging agents have the transformational potential to drive
earlier diagnosis and as a result better and more cost effective health outcomes.
Regulation and poor uptake of new agents inhibit research in this area in the UK.
Despite this the UK-based company Amersham is the world leader in this field.
Over the last 5 years, our knowledge of true molecular biology has expanded
exponentially through the decoding of the human genome. It is the belief of
some that the major scientific challenge of the early 21st century is to translate
46

this ‘raw’ molecular knowledge into useful biomedical products. There is
consensus that advances will come quicker in molecular diagnostics than in
genomically-derived therapeutics, which will take longer to develop. The major
medical challenge is therefore to transfer this genomic and proteomic knowledge
into practical imaging products. Early diagnosis has the potential to transform the
cost and quality of health services along with creating a significant export base
for UK industry. Early diagnosis also has the power to enhance the effect of
prevention campaigns. These often founder due to the individual’s ignorance of
early pre-disease changes taking place in their bodies, which, if unmanaged, will
lead to debilitating and expensive clinical conditions in later years. The
development of such products will demand a multidisciplinary approach involving
experts from the fields of biological sciences, chemistry, computer science,
engineering, medicine and physics coupled with industrialists to fully address the
requirements of these molecular imaging techniques.
Phase maps in an image may contain additional information about the body
being imaged. For example the velocity of blood flow can be encoded in the
phase of MRI signals118. Phase unwrapping is the technique used to attempt to
extract such information with a number of different analysis techniques119. The
UK has a number of strengths in this area. Phase-based frequency estimation is
a related field which uses analysis to remove unwanted noise which may distort
the phase information120.
4.3 General Components: Computer and Data Storage Technology
Many of the techniques described above rely on data processing and analysis to
enable the imaging technology, to enhance the images obtained or to extract
additional information from an image. Key to all these imaging modalities is the
available computing power and also the ability to store such data. The
semiconductor industry publishes a roadmap60 every 2 years to analyse what is
required for the industry to maintain the exponential improvement in technology
which has been achieved over the last 40 years (and arguably centuries). Recent
47
analysis suggests that this exponential increase in performance is unlikely to be
halted before 2015 at least from technological issues121,122.
The basis of the improvement in performance has been termed Moore’s law123
after Gordon Moore who first analysed the technology scaling in 1965. He
demonstrated that transistor feature size decreases by a factor of 2 roughly every
18 months. This is predicted to continue until around 2015 where the feature size
becomes less than 10 nm and quantum mechanics produces a number of
problems preventing further transistor miniaturisation. The decrease in feature
size produces an increase in the number of transistors and this accounts for the
improvement in computer processing unit (CPU) performance (Fig. 9) and the
increase in dynamic random access memory (DRAM) density60 (Fig. 10).
Fig. 9 plots data from the literature and data sheets from companies of different
processors and supercomputers124. While the actual performance of a CPU is
dependent on the application, software and efficiency, the graph plots the
number of floating point operations that have been achieved by different
processors per second as this gives a good software- and applications-
independent performance estimate. Fig. 10 plots the major semiconductor
memory along with magnetic hard disk data from IBM125. While DRAM is
predicted to scale until at least 2015, present magnetic disk technology will hit
problems within 5 years when the superparamagnetic limit of the present
technology is reached. A number of new technologies are being researched to try
to circumvent this problem. For imaging processing, latency is the biggest
problem which is related to the bandwidth of the buses in the different parts of
the computer. The off-microprocessor address bus is typically running at about
one tenth the microprocessor clock speed and therefore is also increasing
exponentially with time. This accounts for the semiconductor memory to
microprocessor data transfer (and vice versa). The access time to hard disks has
been reducing much more slowly and this is likely to be the limiting factor. As
DRAM and flash become cheaper and magnetic RAM becomes more prevalent,
48
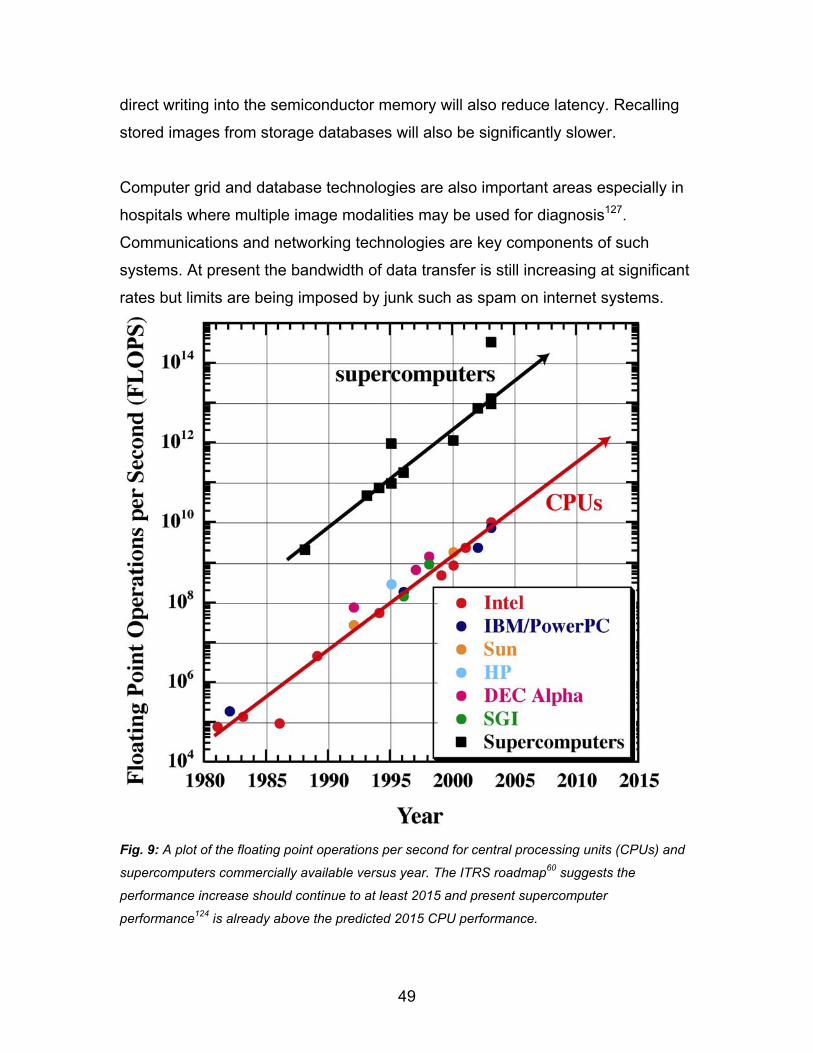
direct writing into the semiconductor memory will also reduce latency. Recalling
stored images from storage databases will also be significantly slower.
Computer grid and database technologies are also important areas especially in
hospitals where multiple image modalities may be used for diagnosis127.
Communications and networking technologies are key components of such
systems. At present the bandwidth of data transfer is still increasing at significant
rates but limits are being imposed by junk such as spam on internet systems.
Fig. 9: A plot of the floating point operations per second for central processing units (CPUs) and
supercomputers commercially available versus year. The ITRS roadmap60 suggests the
performance increase should continue to at least 2015 and present supercomputer
performance124 is already above the predicted 2015 CPU performance.
49

Fig. 10: A plot of magnetic hard disc drive and dynamic random access memory (DRAM) areal
memory density as a function of year. For present magnetic drives, the super-paramagnetic limit
to the technology is also plotted60, 125.
5. Health, Safety, Ethical and Civil Liberty Issues of Imaging Technologies and Applications
5.1 Health and Safety
Health and safety considerations are always required when developing new
techniques. Imaging modalities with ionising radiation have always had to be
designed with the health and safety of both operator and the patient in mind18.
For new technologies where non-ionising radiation is being produced,
consideration must be given to interactions which may be harmful to humans.
Examples of emerging areas include microwave ovens and mobile phones which
operate either at or close to the vibrational frequency of water molecules.
Terahertz is a good example where the radiation corresponds to the vibrational
and rotational frequencies of most biological molecules.
50

5.2 Ethics and Medical Imaging
To a large extent the ethics of medical imaging, and in particular the relationship
of the companies which manufacture and research medical imaging modalities,
has a large number of common features with the pharmaceutical industry108.
There are three main ethical concerns with medical imaging:
1. The possibility that associations between doctors and medical imaging
companies may serve commercial objectives of industry and acquisitive interests
of clinicians rather than legitimate care, educational or research goals, thereby
compromising the primary ethical obligation of doctors to patients, dividing the
loyalties of doctors and undermining the basic trust on which clinical relationships
depend.
2. The risk that product promotions from companies will inappropriately influence
doctor’s decisions.
3. The danger that industrial involvement in research will lead to distortions in
scientific evidence and prevent independent assessment of data.
5.3 Civil Liberty
There is a growing debate about the use of the numerous images which are now
readily available to the police, law courts, security services and government. With
CCD cameras in every major UK city and medical imaging data of patients stored
on computer networks in hospitals, the issue is one of confidentiality and of when
data can be used ethically or for legal purposes without the individual’s consent.
As computer databases of images increase, this problem is going to become
more significant in the future. To a large extent civil liberties will be controlled
through the legal process such as the Data Protection Act 1998, but as science
and technology is progressing at such a fast pace, the law does not always keep
up. This issue is far more complex when security imaging is discussed as many
lives may depend on the information which has been obtained from an imaging
51

modality. With a number of security scanning systems able to image through
people’s clothing, there are also issues over the right to capture such images,
confidentiality and discreet use of the images produced.
6. Conclusions
Non-intrusive imaging is a field which is presently growing and has substantial
world-wide markets. The medical imaging market is approximately £8.8 billion
per annum, airport security is around £10 billion and anti-terrorism and defence
sectors are certainly >£10 billion per annum. The UK has had a strong position
historically of being involved in many of the developments of modern imaging
technologies for numerous applications. These include the first use of x-rays, the
development of MRI and x-ray computed tomography. The UK also has a strong
position in world terms with a number of imaging modalities which are presently
emerging technologies including microwave, W-band, terahertz and infrared
technologies from both industrial and academic perspectives. There are a
number of areas of imaging research and development where government help
and steer would significantly help UK industry.
In medical imaging there are substantial benefits to UK society but the research
cannot always be commercially driven. One of the problems in addressing MRI
research issues has been that while industry can see the possible benefits, any
individual company also appreciates that the results of investment in developing
the technology would be shared and thus not clearly provide a “competitive
edge”. This is exactly the sort of situation in which Government needs to step in,
develop and to some extent nurture technologies where appropriate and make
them available for industrial exploitation in a way that maximises competition.
Table 1 shows a comparison of some of the important parameters in medical
imaging. The clear drivers in medical imaging are aimed at moving to
technologies which are less invasive and non-ionising such as ultrasound, MRI
and thermography rather than PET, x-ray CT and gamma-ray. The real need is
52

development of cheaper technologies which provide functional information. While
ultrasound and thermography can be qualitative and in some applications non-
specific, there is a drive for attempting to develop these technologies into full
diagnostic tools in the hope of replacing the present expensive and/or ionising
modalities. There is also a substantial drive for multimodal imaging systems
where for instance the high resolution of one technique may be combined with
the functional information of another.
Imaging research is also being driven by genetics applications where miniature
PET, MRI and CT scanners are being developed to image mice which are being
studied in genetics research. The visible and near infrared part of the spectrum is
presently poorly utilised by the medical imaging community due to the poor
detection sensitivity, tissue absorption and scattering. If these could be solved
there is great potential for a number of applications including breast cancer
screening.
The clear applications drivers in security imaging at present are detection of
suicide bombers along with explosives identification for airports. A number of
microwave and terahertz technologies have shown through first demonstrations
that they have potential in these areas but significantly more research is required
before products will be available.
The terahertz region of the spectra is the one area where little has been clearly
achieved due to the lack of practical sources and detectors. As technology
progresses, systems are now available and first demonstrations of a number of
different applications have been achieved. All molecules (biological, organic,
inorganic, etc) have vibrational and rotational spectra that lie in the terahertz
frequency range with signatures resulting from intra- and inter-molecular
interactions. The wavelengths are short enough to enable sub-millimetre imaging
while long enough to penetrate many materials allowing hidden objects to be
imaged. The UK has a strong presence in this field both industrially and
53

academically and there are numerous potential applications ranging from
explosive identification and suicide bomber detection to skin cancer imaging.
In all areas of imaging, image analysis and display is required. The UK has
significant expertise in the development of a number of the algorithms and
techniques presently used for image analysis and the extraction of additional
information. Automated image recognition along with automated diagnosis for
the medical fields are areas with good potential for breakthroughs in image
analysis software.
Database and information management along with fast delivery of imaging
information are areas which need to be addressed as the size and number of
images increases as technology improves. There is already some funding
through EPSRC for e-GRID and information extraction from images but more
investment could put the UK into a very strong world position. While the UK has
little manufacturing of the microelectronic components in computers, hard disk
drives and storage media, it does have significant expertise in computer
architecture (e.g. ARM Holdings) and computer systems design.
54

Acknowledgements This review is funded by the UK Department of Trade and Industry in the
framework of the Foresight ‘Exploiting the Electromagnetic Spectrum’ (EEMS)
project.
The author acknowledges the following for contributions during the
preparation of this report:
• Foresight EEMS – ‘Picturing people: non-intrusive imaging’ action group:
o Brian Allen, e2v Technologies o David Burrows, DSTL o Prof. David Delpy, University College London, London o Prof Paul Matthews, Professor of Neurology; Director, Centre for
Functional Magnetic Resonance Imaging of the Brain, University of Oxford
o Prof Mike Pepper, Cavendish Laboratory, University of Cambridge o Dr Clifford Smith, Amersham Health Research o Mike Brady, University of Oxford o Allyson P C Reed, Qinetiq o Brian Maddison, RAL o Andrew Mackintosh, Oxford Instruments o Mel King, Department of Health, Medicines and Healthcare product
Regulatory Agency o Lizzy Hylton, EPSRC o Peter Dukes, MRC o Delyth Morgan, MRC o James Barlow, Imperial College
• Dr Alison Bolster, Consulting Clinical Physicist, Royal Hospital, Glasgow • Dr Mike Kemp, TeraView Ltd., Cambridge • Dr Edmund Linfield, Cavendish Laboratory, University of Cambridge • Dr Alistair Rose, Crime Prevention Programme Manager, EPSRC • Foresight: A. Jackson, F. Harrison, S. Bass, C. Hepworth, N. Pitter
55

Appendix I. References 1E. Hecht “Optics: 4th ed.” Addison Wesley (2002). 2C.C. Davies “Lasers and Electro-Optics: Fundamental and Engineering” Cambridge University Press (1996). 3M. Rosker, “Sub-millimetre and Terahertz Imaging” DARPA workshop on Sub-mm and Terahertz Imaging” Washington, September (2003). 4P. Gould “The rise and rise of medical imaging” Physics World, August (2003). 5H.R. Herschman “Molecular imaging: looking at problems, seeing solutions” Science 302, 605 (2003). 6R.H. Taylor and D. Stoianovici “Medical robotics in computer-integrated surgery” IEEE Trans. Robotic Autom. 19, 763 (2003). 7A. Krupta et al. “Autonomous 3D positioning of surgical instruments in robotised Laparoscopic surgery using visual servoing” IEEE Trans. Robotic Autom. 19, 842 (2003). 8D.D Arnone et al “Terahertz imaging comes into view” Phys. World 13, 35 (April 2000). 9http://www.teraview.co.UK/ 10D.L. Woodward et al. (Eds.) “Terahertz Sensing Technology Vol. 1” World Scientific (2003). 11D. Mittleman (Ed.) “Sensing with Terahertz Radiaiton” Springer-Verlag (2003). 12L. Wasserzug, Department of Homeland Security, US “Explosives detection” DARPA workshop on Sub-mm and Terahertz Imaging” Washington, September (2003). 13M. Kemp, “Terahertz imaging: Architecture, results and futures” DARPA workshop on Sub-mm and Terahertz Imaging” Washington, September (2003). 14http://www.hitran.com/ 15http://www.watervaporcontinuum.com/refs_am.html 16J.R. Pardo et al., “Atmospheric transmission at microwaves (ATM): an improved model for millimetre / submillimetre applicaitons” IEEE Trans. Antennas Propagation 49, 1683 (2001). 17S. Webb (Ed.) “The Physics of Medical Imaging” IOP Publishing (1988). 18W.R. Hendee and E.R. Ritenour “Medical Imaging Physics: 4th Ed.” Wiley-Liss (2002). 19National Research Council, Institute of Medicine of the National Academy of Sciences “Mathematics and Physics of Emerging Biomedical Imaging”, National Academy Press (1996). 20H. Griffiths, “Magnetic induction tomography” Meas. Sci. Technol. 12, 1126 (2001). 21O.V. Lounasmaa et al. “Information processing in the human brain: Magnetoencephalographic approach” Proc. Nat. Acad. Sci. USA 93, 8809 (1996). 22B.H. Brown, “Medical impedance tomography and process impedance tomography: a brief review” Meas. Sci. Technol. 12, 991 (2001). 23D.C. Barber and B.H. Brown “Applied potential tomography” J. Phys. E: Sci. Instrument 17, 723 (1984). 56

24G.R. Potty and J.H. Miller “Tomographic mapping of sediments in shallow water” IEEE J. Oceanic Eng. 28, 186 (2003). 25S. Lori Bridal et al., “Milestones on the road to higher resolution, quantitative and functional ultrasonic imaging” Proc. IEEE 91, 1543 (2003). 26T. Ishikawa et al. “Functional and histological changes in rat femoral arteries by HIFU exposure” Ultrasound Med. Biol. 29, 1471 (2003). 27M. Emoto et al. “Effect of angiogenesis inhibitor TNP-470 on the growth, blood flow, and microvessel density in zenografts of human uterine carcinosarcoma in nude mice” Gynecol. Oncol. 89, 88 (2003). 28B.C. Tran et al. “Microbubble-enhanced cavitation for noninvasive ultrasound surgery” IEEE T. Ultrasound Ferr. 50, 1296 (2003). 29T. Giesecke and K. Hynynen “Ultrasound-mdeiated cavitation thresholds of liquid perfluorocarbon droplets in vitro” Ultrasound Med. Biol. 29, 1359 (2003). 30L. Atallah and P.J. Probert Smith “Using wavelet analysis to classify and segment sonar signal scattered from underwater sea beds “Int. J. Remote Sensing 24, 4113 (2003). 31F. Lu et al., “New towed array shape estimation scheme for real time sonar systems” IEEE J. Oceanic Eng. 28, 552 (2003). 32Y. Iwasa, “HTS magnets: stability; protection; cryogenics; economics; current stability / protection activities at FBML” Cryogenics 43, 303 (2003). 33H.G. Lee et al. “A high temperature superconducting double-pancake insert for an NMR magnet” IEEE. Trans. Appl. Supercond. 13, 1546 (2003). 34P.M. Matthews and P. Jezzard “Functional magnetic resonance imaging” Preprint 35R. Turner and R.J. Ordidge “Technical challenges of functional magnetic resonance imaging” IEEE Eng. Med. Biol. p42 (Sept/Oct 2000). 36A. Cifelli et al., “Magnetic resonance imaging for visualisation of the pathology of multiple sclerosis” Preprint 37F.W. Wehrli et al., “Noninvasive assessment of bone architecture by magnetic resonance micro-imaging-based virtual bone biopsy” Proc. IEEE 91, 1520 (2003). 38P. Thompson et al., “Mapping genetic influences on human brain structure” Annals Med. 34, 523 (2002). 39D. Weinberger et al., “Prefrontal neurons and the genetics of schizophrenia” Biol. Psychiat. 51, 271 (2002). 40B. Eberle et al. “Hyperpolarised gases in magnetic resonance: a new tool for functional imaging of the lung” Swiss Med. Weekly 131, 503 (2001). 41K. Golman et al. “Molecular imaging using hyperpolarised 13C” British J. Radiology (Preprint) 42K. Golman et al. “Parahydrogen-induced polarisation in imaging: subsecond 13C angiography” Mag. Res. Med. 46, 1 (2001). 43H.E. MÜller et al. “MRI of the lungs using hyperpolarised noble gases” Mag. Res. Med. 47, 1029 (2002). 44http://www.nims.go.jp/eng/smc/smc-05.html 45J.A.S. Smith “Nuclear quadrupole resonance and relaxation” Ann. Rep. Prog. Chem. 94, 259 (1998). 46M. Blanz et al. “A fast field-cycling NMR NQR spectrometer” Meas. Sci. Technol. 4, 48 (1993).
57

47R. Appleby et al., “High-performance passive millimetre-wave imaging” Opt. Eng. 32, 1370 (1993). 48S. Semenov et al., “Microwave tomography for biomedicaine: Cardiovascular applications” Med. Phys. 30, 1541 (2003). 49R. Appleby, “Passive millimetre wave imaging reveals weaponry” Eng. Technol. 5, 16 (2002). 50N.A. Salmon et al., “Scene simulation of passive millimetre wave images of plastic and metal objects” Proc. SPIE 4719, 397 (2002). 51N.A. Salmon et al., “Scene simulation of passive millimetre wave images of plastic and metal objects” Proc. SPIE 4491, 52 (2001). 52G.N. Sinclair et al., “Passive millimetre-wave concealed weapon detection” Proc. SPIE 4232, 142 (2001). 53G.N. Sinclair et al., “Detection of illegal passengers in lorries using a passive millimetre wave scanner” Proc. IEEE 36th Annual Int. Carnahan Conference on Security Technology, p167 (2002). 54R.N. Anderton et al., “Security scanning at 35 GHz” Proc. SPIE 4373, 16 (2001). 55R. Appleby et al., “Mechanically scanned real-time passive millimetre wave imaging at 94 GHz” Proc. SPIE 5077, 1 (2003). 56N.A. Salmon et al., “Electronic scanning for passive millimetre-wave imaging” Proc. SPIE 5077, 71 (2003). 57P.R. Coward and R. Appleby, “Development of an illumination chamber for indoor millimetre-wave imaging” Proc. SPIE 5077, 54 (2003). 58A.R. Harvey and R. Appleby “Passive mm-wave imaging from UAVs using aperature synthesis” Aeronautical J. 107, 87 (2003). 59E.L. Ritman “Evolution of medical tomographic imaging - As seen from a Darwinian perspective” Proc. IEEE 91, 1483 (2003). 60http://public.itrs.net/ 61Y.C. Shen et al., “An ultra-broadband terahertz spectroscopic system“ Submitted for publication 62R. Bates et al., ”Interwell intersubband electroluminescence from Si/SiGe quantum cascade emitters“ Appl. Phys. Lett. 83, 4092 (2003). 63G. Scalari et al., “Far-infrared (87 µm) bound-to-continuum quantum-cascade lasers operating up to 90 K” Appl. Phys. Lett. 82, 3165 (2003). 64E. Linfield, private communication 65R.M. Woodward et al., “Terahertz pulse imaging of ex vivo basal cell carcinoma” J. Invest. Dermatology 120, 72 (2003). 66R.M. Woodward et al., “Terahertz pulsed imaging of skin cancer in the time and frequency domain” 29, 257 (2003). 67D.A. Crawley et al., “Three dimensional terahertz pulse imaging of dental tissue” J. Biomedical Opt. 8, 303 (2003). 68D.A. Crawley et al., “Terahertz pulse imaging: A pilot study of potential applications in dentistry” Caries Res. 37, 352 (2003). 69M.C. Kemp et al., “Security applications of terahertz technology” Proc. SPIE 5070, 44 (2003). 70J. Xu et al., “Advancing terahertz time-domain spectroscopy for remote detection and tracing” Proc. SPIE 5070, 17 (2003). 71D. Zimdars “Fiber-pigtailed terahertz time domain spectroscopy instrumetation
58

for package inspection and security imaging” Proc. SPIE 5070, 108 (2003). 72L.A. Vanderberg, “Detection of biological agents: looking for bugs in all the wrong places” Applied Spectroscopy 54, 376A (2000). 73R. Osiander et al., “Mine field detection and identification using THz spectroscopic imaging” Proc. SPIE 5070, 1 (2003). 74P.L. Richards “Bolometers for infrared and millimetre waves” J. Appl. Phys. 76, 1 (1994). 75B.F. Jones “A reappraisal of the use of infrared thermal image analysis in medicine” IEEE Trans. Medical Imaging 17, 1019 (1998). 76D.S. Tezcan et al “A low-cost uncooled infrared microbolometer detector in standard CMOS technology” IEEE Trans. Elec. Dev. 50, 494 (2003). 77S.D. Gunapala et al., “640x512 pixel long-wavelength infrared narrowband, multiband and broadband QWIP focal plane arrays” IEEE Trans Elec. Dev. (Dec 2003). 78S.B. Colak et al. “Clinical optical tomography and NIR spectroscopy for breast cancer detection” IEEE J. Sel. Top. Quantum 5, 1143 (1999). 80R.A. Crocombe et al., “FTIR spctroscopic imaging in the infrared - fingerprint region using an MCT detector array” Microscopy Microanalysis 3 (S2), 863 (1997). 81R.J. Huppi et al., “FTIR spectroscopy imaging using an infrared focal-plane array detector” Anal. Chem. vol., 3377 (1995). 82J.M. Schmitt “Optical coherence tomography (OCT): A review” IEEE J. Sel. Topics Quant. Elec. 5, 1205 (1999). 83J.G. Fujimoto “Optical coherence tomography for ultrahigh resolution in vivo imaging” Nature Biotechnol. 21, 1361 (2003). 84W. Drexler “In vivo ultra-high resolution optical coherence tomography” Optics Lett. 24, 1221 (1999). 85J.M. Schmitt et al. “Optical-coherence tomography of a dense tissue: statistics of attenuation and backscattering” Phys. Med. Biol. 39, 1705 (1994). 86K.J. Halbhuber and K. Konig “Modern laser scanning microscopy in biology, biotechnology and medicine” Ann. Anat. 185, 1 (2003). 87O. Minet et al. ”The medical use of rescaling procedures in optical biopsy and optical molecular imaging” J. Fluorescence 12, 201 (2002). 88K. Licha “Contrast agents for optical imaging” Top Current Chem. 222, 1 (2002). 89S.A. Boppart et al. “In vivo cellular optical coherence tomography imaging” Nat. Med. 4, 861 (1998). 90P. Verhoeve et al. “Single photon detection at visible and x-ray wavelengths with Nb-Al superconducting tunnel junctions” J. Appl. Phys. 83, 6118 (1998). 91A.J. Shields et al., “Detection of single photons using a field-effect transistor gated by a layer of quantum dots” Appl. Phys. Lett. 76, 3673 (2000). 92D.L. Faber et al “Light absorption of (oxy)hemoglobin assessed by spectroscopic optical coherence tomography” Optics Lett. 28, 1436 (2003). 93J.F. De Boer et al. “Two-dimensional birefringence imaging in biological tissue by polarisation-sensitive optical coherence tomography” Optics Lett. 22, 934 (1997). 94J.A. Rowland “The physics of computed radiography” Phys. Med. Biol. 47, R123 (2002).
59

95X. Cao and H.K. Huang “Current status and future advances of digital radiography and PACS” IEEE Eng. Med. Biol. p80 (Sept/Oct 2000). 96T.O.J. Fuchs et al., “Fast volume scanning approaches by x-ray computed tomography” Proc. IEEE 91, 1492 (2003). 97D.M. Hansell “Imaging lungs with computed tomography” IEEE Eng. Med. Biol. p71 (Sept/Oct 2000). 98J.T. Dobbins III and D.J. Godfrey “Digital x-ray tomosynthesis: current state of the art and clinical potential” Phys. Med. Biol. 48, R65 (2003). 99S. Bonnet et al., “Dynamic x-ray computed tomography” Proc. IEEE 91, 1574 (2003). 100E.V. Garcia et al., “Advances in nuclear emission PET and SPECT imaging” IEEE Eng. Med. Biol. p21 (Sept/Oct 2000). 101H.O. Anger “Scintillation camera with multichannel collimators” J. Nuclear Med. 5, 515 (1964). 102Intercollegiate Standing Committee on Nuclear Medicine “Nuclear medicine and radionuclide imaging: a strategy for provision in the UK.” Royal College of Physicians, London (2003). 103Intercollegiate Standing Committee on Nuclear Medicine “Nuclear medicine strategy for the provision of PET in the UK.” Royal College of Physicians, London (2003). 104I. Mori et al. “The CdTe detector module and its imaging performance” Ann. Nuclear Med. 15, 487 (2001). 105G.J. Gruber et al., “A discrete scintillation camera module using silicon photodiode readout of CSI(Tl) crystals for breast cancer imaging” IEEE Trans. Nuclear Sci. 45, 1063 (1998). 106E.V. Garcia “Quantitative myocardinal perfusion single-photon emission computed tomographic imaging: Quo vadis?” J. Nuclear Cardiol. 1, 83 (1994). 107D.L. Bailey et al. “A continuously rotating PET camera: Performance characteristics, initial clinical studies and installation considerations in a nuclear medicine department” Euro. J. Nuclear Med. 24, 6 (1997). 108D.W. Townsend et al. “Fully three-dimensional reconstruction for a PET camera with retractable septa” IEEE Trans. Med. Imaging 10, 505 (1991). 109R. Davies et al. “Personal sensors for the diagnosis and management of metabolic disorders” IEEE Eng. Med. Biol. p32 (Jan/Feb 2003). 110S. Park and S. Jayaraman “Enhancing the quality of life through wearable technology” IEEE Eng. Med. Biol. p41 (May/June 2003). 111I. Korhonen et al. “Health monitoring in the home for the future” IEEE Eng. Med. Biol. p66 (May/June 2003). 112J.K. Udupa et al., “Relative fuzzy correctedness and object definition: Theoru, algorithms and applications in image segmentation” IEEE Trans. Pattern Analysis Machine Intellegence 24, 1485 (2002). 113J.K. Udupa et al., “Fuzzy Connectedness and Image Segmentation” Proc. IEEE 91, 1649 (2003). 114A. Chihoub “Fourier-based reconstruction for CT: a parallel processing perspective” IEEE Eng. Med. Biol. p99 (Nov/Dec 2002). 115J.D. O’Sullivan “A fast sinc function gridding algorithm for Fourier inversion in computer tomography” IEEE Trans. Med. Imag. MI4, 200 (1985). 116D. Tomazevic et al. “3D/2D registration of CT and MR to x-ray imaging” IEEE
60

Trans. Med. Imaging 22, 1407 (2003). 117C.E. Rodriguez-Carranza and M.H. Loew “Design and evaluaion of an automatic procedure for detection of large misregistration of medical images” IEEE Trans. Med. Imaging 22, 1445 (2003). 118I.R. Yound and G.M. Bydder “Phase Imaging” in Magnetic Resonance Imaging 2nd Ed, D.D. Stark and W.G. Bradley, Eds., Mosby Year Book (1992). 119S. Chavez et al “Understanding phase maps in MRI: A new cutline phase unwrapping method” IEEE Trans. Med. Imaging 21, 966 (2002). 120M.L. Fowler “Phase based frequency estimation: a review” Digital Sig. Processing 12, 590 (2002). 121House of Lords Select Commitee on Science and Technology “Chips for Everything: Britain’s opportunities in a key global market” The Stationery Office (2002). 122R. Compano “Technology Roadmap for Nanoelectronics” EC (2000) (http://www.cordis/lu/ist/fetnid.htm). 123G.E. Moore “Cramming more components onto integrated circuits” Electronics 38(8), 19th April (1965). 124http://www.top500.org/ 125http://www.almaden.ibm.com/st/magnetism/ms/index.shtml 126M.W. Vannier et al., “Matching clinical and biological needs with emerging imaging technologies” Proc. IEEE 91, 1562 (2003). 127P.A. Komesaroff and I.H. Kerridge “Ethical issues concerning the relationship between medical practitioners and the pharmaceutical industry” Med. J. Aus. 176, 118 (2002). II. UK Expertise
a) Industrial
Security Imaging: QinetiQ, e2V, BAE Systems, Forensic Alliance Ltd., Forensic Science Service Ltd., Spatial Imaging Ltd. Sonar: Ultra Electronics, Chelsea Technology Group, BAE Systems, Thales (Thomson Marconi), GeoAcoustics Ltd., Son-ix Technologies Ltd. Terahertz: TeraView Ltd., QMC Instruments, Thomas Keating Ltd. Medical Imaging: Amersham (now part of GE), Xograph, Oxford Instruments (components), Marconi (components), e2V (components), Dynamic Imaging Ltd. Image Analysis: Perceptive Instruments, Phase Vision, Image Associates, Dynamic Data Links, Image Scan Misc. Imaging Components: Leica Microsystems UK Ltd., Alrad Instruments Ltd.
61

b) Academic
Medical Impedance Imaging: Brian Brown or David Barber, University of Sheffield MEG: Krishna Singh, University of Aston Ultrasound: RW Prager, University of Cambridge, Peter Wells, United Bristol Healthcare Trust: Jeff Bamber, Institute of Cancer Research and Royal Marsden Hospital NHS Trust. MRI: Paul Matthews, University of Oxford; Ian Young, Imperial College; D. Rueckert, Imperial College; S. Webb, Institute of Cancer Research; Y Zheng, UCL; A. Connelly, UCL; N.G. Papadakis, University of Sheffield; D.L.G. Hill, King’s Colege London; D. Atkinson, King’s College London; D.C. Alexander, UCL; C.A. Clark, St. Georges Hospital Medical School Terahertz: Mike Pepper, Ed Linfield, Richard Pye, University of Cambridge; Bob, Miles, Giles Davies, E. Berry and M.A. Smith, University of Leeds; D.A. Berk, University of Manchester; Martin Chamberlain, University of Durham Visible / NIR: David Delpy, UCL; Jeremy Hebden, UCL; A.P. Gibson, UCL X-ray / CT: K.D. Rogers, Cranfield University PET: A.J. Reader, UMIST Optical tweezers / near field: Kishan Dholakia or Wilson Sibbett (St. Andrews University) Component Technology: R.D. Speller, UCL Image Analysis Technology: MC Fairhurst, Leigh House Hospital; M. Niranjan, University of Sheffield; S.M. Smith, University of Oxford; D. Atkinson, King’s College London; J.P. Siebert, University of Glasgow; Y. Demiris, Imperial College; R.J. Lapeer, University of East Anglia; P.R. Hoskins, University of Edinburgh; F. Bello, Imperial College; A. Hoppe, Kingston University; J.M. Brady, University of Oxford; D. Rueckert, Imperial College; A. Bhalerao, King’s College London; G.Z. Yang, Imperial College, A. Todd-Pokropek, UCL Computing and Database: J.M. Brady, University of Oxford; N.R. Shadbolt, University of Southampton; T.A. Rodden, University of Nottingham; P.N. Angel, University of Glamorgan; C.J. Taylor, University of Manchester, P.C.W. Beatty, University of Manchester; J.V. Hajnal, Imperial College; D.L.G. Hill, King’s College London; A. Todd-Pokropek, UCL; S.R. Arridge, UCL; D.T Delpy, UCL; D.J. Hawkes, King’s College London; L. Tarassenko, University of Oxford; J. Graham, University of Manchester; A.D. Linney, UCL; S.M. Smith, University of
62

Oxford; S. Astley, University of Manchester; C.J. Taylor, University of Manchester; T.F. Cootes, University of Manchester; A. Jackson, University of Manchester; P.K. Marsden, King’s College London Security Microwave / mm-wave: Y. Petillot, Heriot-Watt University Sonar: P.J. Probert Smith, University of Oxford Terahertz: Mike Pepper, Douglas Paul, University of Cambridge; Giles Davies, Bob Miles, University of Leeds Infrared: G. Bullard, Heriot-Watt University Imaging Technology: M. Petrou, University of Surrey; J.M. Girkin, University of Stathclyde; A.J. Harris, University of Glamorgan; M.P. Evison, University of Sheffield; H.N. McMurray, University of Wales Swansea Image analysis: G.A. Jones, Kingston University; G.E. Pike, Open University; C.J. Solomon, University of Kent; F. Deravi, University of Kent; S. Gong, Queen Mary London; P. Hancock, University of Stirling; J. Ming, Queens University Belfast Computing and Database: A. Hirschfield, University of Liverpool; Q. Shen, University of Edinburgh; D.R. Bull; University of Bristol; D.R. Parish, Loughborough University III. Acronyms and Technical Terms CCD - charged coupled device CCTV - close circuit television CPU - central processing unit CT - computed tomography DRAM - dynamic random access memory DSP - digital signal processor ECG - electrocardiography EEG - electroencephalography ESI - electrical source imaging FFT - fast Fourier transform GRP - glass reinforced plastic HBT - heterobipolar transistor HTS - high temperature superconductor hyperpolarisation - the optical pumping of an atom to enhance the nuclear spin polarisation LAN - local area network LNA - low noise amplifiers MMIC - monolithic microwave integrated circuit MRI - magnetic resonance imaging
63
64
MSI - magnetic source imaging NE∆T - noise equivalent differential temperature NEP - noise equivalent power NMR - nuclear magnetic resonance OCT - optical coherence tomography PET - positron emission tomography QCL - quantum cascade laser quantum efficiency - the number of electron-hole pairs created in a photodetector per incident photon QWIP - quantum well infrared photodetector RAM - random access memory RTD - resonant tunnelling diode SIS - superconductor-insulator-superconductor (Josephson junction) skin depth - the length scale of the exponential attenuation of radiation in a material SPECT - single photon emission computerised tomography SQUID - superconducting quantum interference device
Related Documents