© 2013 Towers Watson. All rights reserved. The World’s 500 Largest Asset Managers The P&I/Towers Watson global 500 ranking is prepared using joint research by Pensions & Investments and Towers Watson Year end 2012

Welcome message from author
This document is posted to help you gain knowledge. Please leave a comment to let me know what you think about it! Share it to your friends and learn new things together.
Transcript

© 2013 Towers Watson. All rights reserved.
The World’s 500 Largest Asset
Managers
The P&I/Towers Watson global 500 ranking is prepared using
joint research by Pensions & Investments and Towers Watson
Year end 2012

towerswatson.com
© 2013 Towers Watson. All rights reserved. Proprietary and Confidential. For Towers Watson and Towers Watson client use only.
2
Contents
Executive Summary 3
Analysis
– Section 1: Total value of assets and growth rates 6
– Section 2: Analysis of the largest 20 asset managers 10
– Section 3: Passive management 17
Contact details and limitations of reliance 21
Appendix – Complete ranking 22
Page

towerswatson.com
© 2013 Towers Watson. All rights reserved. Proprietary and Confidential. For Towers Watson and Towers Watson client use only.
3
Executive Summary

towerswatson.com
© 2013 Towers Watson. All rights reserved. Proprietary and Confidential. For Towers Watson and Towers Watson client use only.
4
Executive summary
Total assets under management of the 500 managers included in the ranking totalled US$ 68 trillion at the end of 2012, up 8.2% from the end of 2011.
The first two positions in the ranking include the same managers, with BlackRock in the first position for the third consecutive year. Vanguard overcame State Street Global and is now in the third position.
Assets under management of North American managers were
US$ 35.9 trillion at 2012 year end, an increase of 8.3% from the
previous year. The assets managed by European managers
also increased by 12.5%, ending on US$ 24 trillion.
Japanese managers ended 2012 with US$ 4.8 trillion, the only
decrease in assets during 2012 (-8.7%).
The Top 20 managers’ share of the total assets increased from
38.7% to 41.4%.
“AUM increased 8.2%
in 2012”
“BlackRock remained
in the top spot”
“AUM of North
American and
European managers
increased, whilst
Japanese managers
experienced a
decrease”
“Top 20 managers
increased their share
in the total 500”

towerswatson.com
© 2013 Towers Watson. All rights reserved. Proprietary and Confidential. For Towers Watson and Towers Watson client use only.
5
Executive summary
U.S. managers in the Top 20 managed 64.2% of total AUM for
that group, while European managers had a share of 35.8%.
No Japanese companies made it to the top 20 this year.
By number, bank-owned managers accounted the majority,
increased from 8 to 9 managers. Independent managers
maintain the 8 members of the top 20. Only 3 managers are
insurer-owned managers.
Assets under management of managers from developing
countries slightly increased its share from 3.7% to 3.8%.
“Bank-owned
managers and
Independent
managers shared the
majority of the Top 20
segment.”
“Assets under
management from
developing countries
slightly increased”
“U.S. managers
dominated the Top 20
group once again.”

towerswatson.com
© 2013 Towers Watson. All rights reserved. Proprietary and Confidential. For Towers Watson and Towers Watson client use only.
6
Analysis
Section 1: Total value of assets and growth rates

towerswatson.com
© 2013 Towers Watson. All rights reserved. Proprietary and Confidential. For Towers Watson and Towers Watson client use only.
7
Total value of assets managed Split by manager domicile
• Assets under management of the world’s top 500 managers increased by 8.2% in 2012, which is still below its 2007 level.
• Japanese managers’ assets declined 8.7% in 2012, while European managers’ assets as well as U.S. managers’ assets
increased 12.5% and 8.3% respectively.

towerswatson.com
© 2013 Towers Watson. All rights reserved. Proprietary and Confidential. For Towers Watson and Towers Watson client use only.
8
Total value of assets managed Split by segment
• The Top 20 managers increased their assets by 6.9% at the expense of the other segments which all experienced a
reduction in their share of assets.

towerswatson.com
© 2013 Towers Watson. All rights reserved. Proprietary and Confidential. For Towers Watson and Towers Watson client use only.
9
Distribution of assets by country 10 year overview – 2002 to 2012
The last decade has seen an increase of the representation
of managers from the US. In contrast, the Japanese and
several European markets have experienced a relative
decline in the global asset management industry.

towerswatson.com
© 2013 Towers Watson. All rights reserved. Proprietary and Confidential. For Towers Watson and Towers Watson client use only.
10
Analysis
Section 2: Analysis of the largest 20 asset managers

towerswatson.com
© 2013 Towers Watson. All rights reserved. Proprietary and Confidential. For Towers Watson and Towers Watson client use only.
11
Total value of assets managed by top 20 Split by manager domicile
• Top 20 managers’ assets for all regions, except Japan, experienced an increase in 2012.
• In 2012, there were 12 U.S. managers in the top 20 and the remaining managers were all European.
• The U.S. based managers accounted for a share of 64.2% of top 20 assets at the end of 2012 (64.2% at the end of
2011).

towerswatson.com
© 2013 Towers Watson. All rights reserved. Proprietary and Confidential. For Towers Watson and Towers Watson client use only.
12
Annual growth of 500 vs. growth of top 20

towerswatson.com
© 2013 Towers Watson. All rights reserved. Proprietary and Confidential. For Towers Watson and Towers Watson client use only.
13
Top 20 managers by manager type
• At the end of 2012, bank-owned and independent managers accounted for the majority in the top 20,
while insurer-owned asset managers were a minority.
towerswatson.com
© 2013 Towers Watson. All rights reserved. Proprietary and Confidential. For Towers Watson and Towers Watson client use only.
14
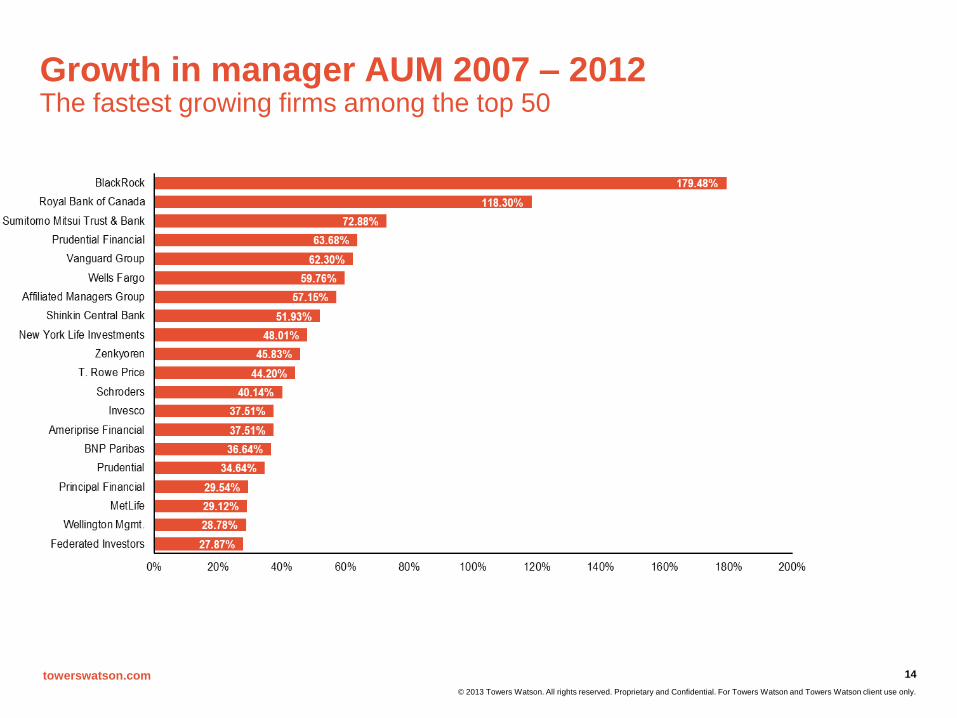
Growth in manager AUM 2007 – 2012 The fastest growing firms among the top 50

towerswatson.com
© 2013 Towers Watson. All rights reserved. Proprietary and Confidential. For Towers Watson and Towers Watson client use only.
15
Growth in manager AUM 2007 – 2012 The fastest growing firms among the top 50
Manager Rank change Market
Royal Bank of Canada +50 (98→48) Canada
Sumitomo Mitsui Trust & Bank +33 (71→38) Japan
Shinkin Central Bank +31 (81→50) Japan
New York Life Investments +30 (79→49) U.S.
Affiliated Managers Group +25 (66→41) U.S.
Wells Fargo +24 (55→31) U.S.
Schroders +24 (69→45) U.K.
T. Rowe Price +18 (47→29) U.S.
Zenkyoren +18 (51→33) Japan
Invesco +16 (38→22) U.S.

towerswatson.com
© 2013 Towers Watson. All rights reserved. Proprietary and Confidential. For Towers Watson and Towers Watson client use only.
16
Growth in manager AUM 2007 – 2012 The fastest growing firms among the top 50
Manager Rank change Market
Principal Financial +15 (58→43) U.S.
Federated Investors +15 (61→46) U.S.
Prudential +14 (39→25) U.K.
Ameriprise Financial +14 (44→30) U.S.
Prudential Financial +13 (25→12) U.S.
Nippon Life Insurance +13 (36→23) Japan
Dai-ichi Luife Insurance +13 (60→47) Japan
Metlife +12 (33→21) U.S.
Wellington Management +11 (31→20) U.S.
Sun Life +11 (43→32) Canada

towerswatson.com
© 2013 Towers Watson. All rights reserved. Proprietary and Confidential. For Towers Watson and Towers Watson client use only.
17
Analysis
Section 3: Passive management

towerswatson.com
© 2013 Towers Watson. All rights reserved. Proprietary and Confidential. For Towers Watson and Towers Watson client use only.
18
Annual growth of passive management vs. growth of 500
CAGR of 500 since 2002: 6.14%
CAGR of passive since 2002: 13%

towerswatson.com
© 2013 Towers Watson. All rights reserved. Proprietary and Confidential. For Towers Watson and Towers Watson client use only.
19
Total value of AUM of leading passive managers with annual growth rate
CAGR since 02: 12.8%

towerswatson.com
© 2013 Towers Watson. All rights reserved. Proprietary and Confidential. For Towers Watson and Towers Watson client use only.
20
Value of passive AUM of leading passive managers - At Dec. 31, 2012
Data available as of June 30.
The assets of BlackRock reflect a restated amount.

towerswatson.com
© 2013 Towers Watson. All rights reserved. Proprietary and Confidential. For Towers Watson and Towers Watson client use only.
21
Contact details and limitations of reliance Contact details
Jessica Gao
Towers Watson Investment +44 207 227 2061
James Price
Towers Watson Investment +44 207 227 2560
In preparing this report at times we have relied upon data supplied to us by third parties. While
reasonable care has been taken to gauge the reliability of this data, this report carries no guarantee of
accuracy or completeness and Towers Watson cannot be held accountable for the misrepresentation
of data by third parties involved.
This report is based on information available to Towers Watson at the date of the report and takes no
account of subsequent developments after that date. It may not be modified or provided to any other
party without Towers Watson’s prior written permission. It may also not be disclosed to any other
party without Towers Watson’s prior written permission except as may be required by law. In the
absence of our express written agreement to the contrary, Towers Watson accepts no responsibility
for any consequences arising from any third party relying on this report or the opinions we have
expressed. This report is not intended by Towers Watson to form a basis of any decision by a third
party to do or omit to do anything.

towerswatson.com
© 2013 Towers Watson. All rights reserved. Proprietary and Confidential. For Towers Watson and Towers Watson client use only.
22
Appendix
Complete ranking

towerswatson.com
© 2013 Towers Watson. All rights reserved. Proprietary and Confidential. For Towers Watson and Towers Watson client use only.
23
Ranking – 2012
Rank Manager Market Total assets Rank Manager Market Total assets
1. BlackRock U.S. $3,791,588 26. Legg Mason U.S. $648,879
2. Allianz Group Germany $2,447,820 27. Generali Group Italy $647,611
3. Vanguard Group U.S. $2,215,216 28. Aegon Group Netherlands $605,048
4. State Street Global U.S. $2,086,200 29. T. Rowe Price U.S. $576,800
5. Fidelity Investments U.S. $1,888,296 30. Ameriprise Financial U.S. $562,400
6. AXA Group France $1,474,568 31. Wells Fargo U.S. $537,100
7. J.P. Morgan Chase U.S. $1,431,165 32. Sun Life Financial Canada $534,663
8. Bank of New York Mellon U.S. $1,385,863 33. Zenkyoren Japan $531,948
9. BNP Paribas France $1,303,989 34. Mitsubishi UFJ Financial Japan $529,152
10. Deutsche Bank Germany $1,247,477 35. Morgan Stanley U.S. $516,567
11. Capital Group U.S. $1,147,411 36. TIAA-CREF U.S. $510,918
12. Prudential Financial U.S. $1,060,250 37. MassMutual Financial U.S. $508,000
13. UBS Switzerland $999,758 38. Sumitomo Mitsui Trust & Bank Japan $456,098
14. Amundi Asset Mgmt. France $961,245 39. Crédit Suisse Switzerland $445,988
15. HSBC Holdings U.K. $910,000 40. Aviva U.K. $443,382
16. Goldman Sachs Group U.S. $854,000 41. Affiliated Managers Group U.S. $431,800
17. Franklin Templeton U.S. $781,769 42. Old Mutual South Africa $423,540
18. Natixis France $779,317 43. Principal Financial U.S. $403,000
19. Northern Trust Global U.S. $758,943 44. Great-West Lifeco Canada $389,528
20. Wellington Mgmt. U.S. $757,729 45. Schroders U.K. $382,068
21. MetLife U.S. $721,286 46. Federated Investors U.S. $379,771
22. Invesco U.S. $687,680 47. Dai-ichi Life Insurance Japan $362,051
23. Nippon Life Insurance Japan $662,939 48. Royal Bank of Canada Canada $353,371
24. Legal & General Group U.K. $655,824 49. New York Life Investments U.S. $347,004
25. Prudential U.K. $654,209 50. Shinkin Central Bank Japan $345,149

towerswatson.com
© 2013 Towers Watson. All rights reserved. Proprietary and Confidential. For Towers Watson and Towers Watson client use only.
24
Ranking – 2012
Rank Manager Market Total assets Rank Manager Market Total assets
51. Samsung Group South Korea $338,467 76. TD Asset Mgmt. Canada $209,451
52. Meiji Yasuda Life Insurance Japan $337,113 77. Dekabank Group Germany $209,242
53. Zurich Financial Services Switzerland $333,933 78. Unicredit Group Italy $208,662
54. Northwestern Mutual U.S. $322,541 79. Neuberger Berman U.S. $205,046
55. Munich RE Germany $314,512 80. SEB Sweden $204,007
56. Intesa SanPaolo Italy $305,911 81. Eaton Vance U.S. $199,508
57. Lloyds Banking Group U.K. $305,459 82. Dodge & Cox U.S. $189,510
58. Rabobank Group Netherlands $292,311 83. Nordea Denmark $185,425
59. Macquarie Group Australia $290,134 84. La Poste France $181,704
60. Aberdeen Asset Mgmt. U.K. $289,547 85. PGGM Netherlands $175,757
61. Nomura Holdings Japan $277,323 86. Banco Sabadell Spain $173,979
62. Standard Life U.K. $270,923 87. Resona Trust & Banking Japan $172,299
63. Dimensional Fund Advisors U.S. $262,200 88. Lombard Odier Darier Hentsch Switzerland $169,598
64. Union Investment Germany $260,992 89. MS&AD Insurance Group Japan $169,213
65. DZ BANK Germany $251,788 90. Lazard U.S. $167,060
66. Sumitomo Life Insurance Japan $243,276 91. Itaú Brazil $164,793
67. ING Groep Netherlands $241,601 92. Swiss Life Group Switzerland $162,486
68. Mizuho Financial Group Japan $239,551 93. Nikko Asset Mgmt. Japan $162,000
69. Manulife Financial Canada $237,637 94. Janus Capital Group U.S. $156,756
70. Hartford Financial U.S. $231,777 95. Banco Santander Central Spain $156,121
71. Charles Schwab Investment U.S. $224,462 96. F&C Asset Mgmt. U.K. $153,820
72. Nuveen Investments U.S. $218,555 97. Pictet Asset Mgmt. Switzerland $151,970
73. Banco do Brasil Brazil $216,701 98. Commonwealth Bank Group Australia $151,643
74. Banco Bradesco Brazil $211,911 99. Crédit Mutuel France $147,430
75. BBVA Spain $210,115 100. Bridgewater Associates U.S. $142,100

towerswatson.com
© 2013 Towers Watson. All rights reserved. Proprietary and Confidential. For Towers Watson and Towers Watson client use only.
25
Ranking – 2012
Rank Manager Market Total assets Rank Manager Market Total assets
101. SEI Investments U.S. $140,573 126. NAB/MLC Australia $100,598
102. Guggenheim Investments U.S. $138,114 127. Caixa Economica Federal Brazil $100,271
103. Stifel Financial U.S. $137,855 128. Covéa Group France $100,036
104. AMP Australia $133,356 129. Waddell & Reed U.S. $96,365
105. Baillie Gifford U.K. $132,491 130. General Re - New England U.S. $92,019
106. Le Groupe LCF Rothschild France $132,148 131. CBRE Global Investors U.S. $92,000
107. Lord, Abbett U.S. $129,366 132. Aquiline Capital U.S. $91,434
108. GAM Holding Switzerland $127,144 133. CIBC Group Canada $88,153
109. Geode Capital Mgmt. U.S. $124,654 134. Nationwide Financial U.S. $87,679
110. American Century U.S. $124,552 135. Union Bancaire Privée Switzerland $87,575
111. Danske Bank Denmark $121,764 136. EFG Group Switzerland $86,112
112. IGM Financial Group Canada $121,071 137. DnB NOR Norway $86,085
113. GE Asset Mgmt. U.S. $119,857 138. NISA Investment U.S. $85,425
114. Swedbank Sweden $119,824 139. Mapfre Spain $85,410
115. Mn Services Netherlands $119,546 140. Thornburg Investment U.S. $83,729
116. Groupama France $119,426 141. Kutxabank Spain $82,407
117. Commerzbank Germany $114,969 142. Payden & Rygel U.S. $81,816
118. PNC Financial U.S. $112,486 143. Baloise Asset Mgmt. Switzerland $81,155
119. Talanx Group Germany $111,073 144. Royal London Group U.K. $80,442
120. Pearl Group U.K. $110,812 145. Sanlam South Africa $79,370
121. Grantham, Mayo v. Otterloo U.S. $106,155 146. Storebrand Group Norway $79,134
122. Brookfield Asset Mgmt. Canada $104,503 147. Oaktree Capital U.S. $77,051
123. Henderson Global Investors U.K. $104,009 148. CI Financial Canada $75,959
124. Investec Group South Africa $103,844 149. Kohlberg Kravis Roberts U.S. $75,528
125. Dexia Asset Mgmt. Belgium $101,754 150. Artisan Partners U.S. $74,334

towerswatson.com
© 2013 Towers Watson. All rights reserved. Proprietary and Confidential. For Towers Watson and Towers Watson client use only.
26
Ranking – 2012
Rank Manager Market Total assets Rank Manager Market Total assets
151. AQR Capital Mgmt. U.S. $74,200 176. Ares Mgmt. U.S. $58,471
152. First Eagle Investment U.S. $72,916 177. Fiera Sceptre Canada $57,221
153. QIC Australia $72,907 178. Man Investments U.K. $57,000
154. Regions Financial U.S. $72,700 179. Swisscanto Switzerland $56,745
155. PineBridge Investments U.S. $71,688 180. SNS Asset Mgmt. Netherlands $56,295
156. Hanwha Group South Korea $71,113 181. Anima Italy $54,181
157. Ashmore Investment U.K. $71,000 182. KBL Financial Services Netherlands $54,049
158. IDUNA Gruppe Germany $70,831 183. Versicherungskammer Bayern Germany $53,537
159. Mercer U.S. $69,800 184. Fortress Investment Group U.S. $53,430
160. Research Affiliates U.S. $69,537 185. Daiwa Securities Group Japan $53,414
161. Sumitomo Mitsui Asset Mgmt. Japan $68,897 186. Brown Brothers Harriman U.S. $52,899
162. Mondrian Investment U.K. $68,248 187. MMI Holdings South Africa $52,429
163. Delta Lloyd Asset Mgmt. Netherlands $67,924 188. Goodman Investment Canada $51,366
164. Fukoku Mutual Life Insurance Japan $67,267 189. China Asset Mgmt. China $50,497
165. Vontobel Asset Mgmt. Switzerland $67,183 190. UBI Banca Italy $50,356
166. Mesirow Financial U.S. $66,535 191. Irish Life & Permanent Group Ireland $50,116
167. Tokio Marine Holdings Japan $65,697 192. KeyCorp U.S. $49,684
168. LSV Asset Mgmt. U.S. $65,027 193. William Blair U.S. $49,613
169. PRIMECAP U.S. $63,661 194. Harvest Fund Mgmt. China $48,772
170. Stone Harbor Investment U.S. $62,743 195. RidgeWorth Capital U.S. $48,083
171. Wilmington Trust U.S. $61,479 196. LaSalle Investment U.S. $47,691
172. Industrial Alliance Insurance Canada $60,332 197. PFM Asset Mgmt. U.S. $47,354
173. Monte dei Paschi di Siena Italy $58,859 198. Royal Bank of Scotland U.K. $46,683
174. Warburg Gruppe Germany $58,636 199. Raymond James Financial U.S. $46,527
175. Westpac/BT Australia $58,596 200. NKSJ Holdings Japan $45,951

towerswatson.com
© 2013 Towers Watson. All rights reserved. Proprietary and Confidential. For Towers Watson and Towers Watson client use only.
27
Ranking – 2012
Rank Manager Market Total assets Rank Manager Market Total assets
201. Cohen & Steers U.S. $45,839 226. City National U.S. $38,240
202. American Beacon Advisors U.S. $45,800 227. Partners Group Switzerland $37,794
203. Virtus Investment U.S. $45,537 228. Mirae Asset Financial Group South Korea $37,653
204. Manning & Napier U.S. $45,209 229. Berenberg Bank Germany $37,266
205. Davis Advisors U.S. $45,140 230. HarbourVest Partners U.S. $37,143
206. Connor Clark & Lunn Canada $44,602 231. Van Eck Associates U.S. $36,635
207. KBC Asset Mgmt. Belgium $44,297 232. GAMCO Investors U.S. $36,405
208. Coronation Fund Managers South Africa $44,145 233. China Southern Fund Mgmt. China $36,258
209. Fisher Investments U.S. $43,893 234. F Van Lanschot Netherlands $35,944
210. Northern Cross U.S. $43,738 235. Metzler Seel Sohn Germany $35,796
211. OP Bank Group Finland $43,212 236. National Bank of Canada Canada $35,733
212. Folksam Sweden $43,163 237. Income Research & Mgmt. U.S. $35,466
213. Jupiter U.K. $42,483 238. Banco Popolare Società Italy $35,284
214. Fort Washington U.S. $42,465 239. Erste-Sparinvest Kapitalanlage Austria $34,887
215. Marathon-London U.K. $42,263 240. Record Currency U.K. $34,830
216. Mediolanum Italy $41,974 241. Uniqa Finanz Group Austria $34,765
217. Raiffeisen Capital Austria $41,759 242. Ohio National U.S. $34,700
218. Allan Gray South Africa $41,174 243. Bank Degroof Belgium $34,623
219. Arrowstreet Capital U.S. $41,117 244. Southeastern Asset Mgmt. U.S. $34,598
220. STANLIB South Africa $41,110 245. KGAL Germany $33,204
221. Hermes U.K. $40,514 246. Greystone Managed Canada $33,103
222. Industry Funds Mgmt. Australia $40,258 247. UMB Financial U.S. $33,100
223. AGF Investments Canada $39,767 248. Beutel Goodman Canada $32,844
224. Challenger Financial Australia $39,721 249. Strategic Investment Group U.S. $32,020
225. LGT Group Switzerland $38,739 250. Helaba Invest Germany $31,931

towerswatson.com
© 2013 Towers Watson. All rights reserved. Proprietary and Confidential. For Towers Watson and Towers Watson client use only.
28
Ranking – 2012
Rank Manager Market Total assets Rank Manager Market Total assets
251. Brown Advisory U.S. $31,920 276. Angelo, Gordon U.S. $25,000
252. Cazenove Capital Mgmt. U.K. $31,822 277. Perpetual Australia $24,856
253. DuPont Capital U.S. $31,262 278. Pathway Capital U.S. $24,629
254. Desjardins Group Canada $30,972 279. Commonfund U.S. $24,568
255. Calamos Advisors U.S. $30,580 280. Epoch Investment Partners U.S. $24,534
256. E Fund Mgmt. China $30,223 281. RS Investments U.S. $24,443
257. Caixa Gestão de Activos Portugal $30,122 282. Investment Solutions Holdings South Africa $24,389
258. Jarislowsky Fraser Canada $30,094 283. Hines U.S. $24,312
259. Reliance Capital India $29,965 284. Adams Street Partners U.S. $24,028
260. Fayez Sarofim U.S. $29,816 285. Hamilton Lane U.S. $23,815
261. Cutwater Asset Mgmt. U.S. $29,780 286. Starwood Capital U.S. $23,774
262. Nürnberger Germany $29,522 287. ICMA Retirement U.S. $23,599
263. RhumbLine Advisers U.S. $28,532 288. T&D Holdings Japan $23,548
264. D.E. Shaw Group U.S. $28,400 289. Quoniam Asset Mgmt. Germany $23,149
265. Safra Brazil $28,282 290. Royal & SunAlliance U.K. $23,099
266. Clarion Partners U.S. $27,904 291. Shenkman Capital U.S. $23,054
267. Bank Syz Switzerland $27,355 292. Gruppo Azimut Italy $22,580
268. Mirabaud Group Switzerland $27,355 293. Arca Italy $22,526
269. Fifth Third Bancorp U.S. $27,000 294. Bosera Asset Mgmt. China $21,712
270. Brandes Investment U.S. $26,943 295. Renaissance Technologies U.S. $21,637
271. Commerce Trust U.S. $26,458 296. EARNEST Partners U.S. $21,438
272. Heitman U.S. $26,257 297. Gruppo Bancario Credito EmilianoItaly $21,428
273. Advantus Capital U.S. $26,161 298. First Pacific Advisors U.S. $21,405
274. Korea Investment Holdings South Korea $25,762 299. Colchester Global Investors U.K. $21,304
275. Co-operators Group Canada $25,601 300. Davidson U.S. $21,189

towerswatson.com
© 2013 Towers Watson. All rights reserved. Proprietary and Confidential. For Towers Watson and Towers Watson client use only.
29
Ranking – 2012
Rank Manager Market Total assets Rank Manager Market Total assets
301. Frankfurt-Trust Germany $21,144 326. GF Fund Mgmt. China $17,833
302. Bentall Kennedy U.S. $20,991 327. Fullgoal Fund Mgmt. China $17,480
303. ESAF Portugal $20,879 328. King Street Capital U.S. $17,400
304. Robert W. Baird U.S. $20,523 329. Hunt U.S. $17,169
305. COMGEST France $20,483 330. Grupo Banco Popular Spain $17,057
306. Universal-Investment Germany $20,483 331. ICBC Credit Suisse China $16,971
307. Votorantim Brazil $20,420 332. Oddo France $16,783
308. Boston Private Financial U.S. $20,417 333. Fred Alger Mgmt. U.S. $16,712
309. Artemis Investment U.K. $20,282 334. International Value Advisers U.S. $16,595
310. Inland Group U.S. $20,200 335. Baron Capital Group U.S. $16,472
311. AJO U.S. $20,138 336. Mawer Investment Canada $16,451
312. Caja Madrid Group Spain $19,565 337. Wiener Stadtische Austria $16,276
313. Caixa Catalunya Group Spain $19,558 338. Causeway Capital U.S. $16,190
314. BOK Financial U.S. $19,149 339. Carnegie Investment Sweden $15,976
315. Hotchkis & Wiley U.S. $18,777 340. Svenska Handelsbanken Sweden $15,976
316. SCOR France $18,501 341. Fiduciary Mgmt./Milwaukee U.S. $15,914
317. HDFC Asset Mgmt. India $18,443 342. Huntington Bancshares U.S. $15,900
318. Perennial Investment Australia $18,438 343. Bank of China Investment China $15,845
319. Gruppo Bipiemme Italy $18,236 344. Prescient Investment South Africa $15,741
320. Highland Capital (Texas) U.S. $18,209 345. BCV Switzerland $15,662
321. ProLogis Private Capital U.S. $18,150 346. World Asset Mgmt. U.S. $15,496
322. Platinum Asset Mgmt. Australia $18,097 347. Da Cheng Fund Mgmt. China $15,362
323. Paulson U.S. $18,055 348. Eagle Capital U.S. $15,132
324. Petercam Belgium $18,026 349. Madison Investment U.S. $15,070
325. Oak Hill Advisors U.S. $17,970 350. Munder Capital U.S. $15,055

towerswatson.com
© 2013 Towers Watson. All rights reserved. Proprietary and Confidential. For Towers Watson and Towers Watson client use only.
30
Ranking – 2012
Rank Manager Market Total assets Rank Manager Market Total assets
351. Wintrust Financial U.S. $15,000 376. Rainier Investment U.S. $12,597
352. CCB Principle Asset Mgmt. China $14,967 377. Yinhua Fund Mgmt. China $12,580
353. J O Hambro Capital U.K. $14,910 378. Edinburgh Partners U.K. $12,471
354. Hua An Fund Mgmt. China $14,756 379. Leith Wheeler Investment Canada $12,451
355. Mutual of America U.S. $14,648 380. Horsley Bridge Partners U.S. $12,248
356. Sit Investment U.S. $14,598 381. China Universal Asset Mgmt. China $12,116
357. Grupo March Spain $14,403 382. Calvert Investment U.S. $12,068
358. Close Brothers Group U.K. $14,302 383. Prime Advisors U.S. $12,013
359. Westbrook Partners U.S. $14,283 384. Foyston, Gordon & Payne Canada $11,658
360. Kepler Fonds KAG Austria $14,219 385. Ibercaja Spain $11,649
361. Westwood Holdings U.S. $14,167 386. EII Capital Mgmt. U.S. $11,543
362. Westfield Capital U.S. $14,155 387. Colony Capital U.S. $11,300
363. Birla Sun Life Asset Mgmt. India $13,986 388. Luther King Capital U.S. $11,264
364. Guardian Capital Canada $13,810 389. Burgundy Asset Mgmt. Canada $11,034
365. WHV Investment U.S. $13,756 390. Tocqueville Asset Mgmt. U.S. $10,945
366. Hexavest Canada $13,706 391. Sage Advisory Services U.S. $10,939
367. Unigestion Switzerland $13,700 392. Turner Investments U.S. $10,731
368. C.S. McKee U.S. $13,465 393. Marathon Asset Mgmt. U.S. $10,700
369. Cramer Rosenthal McGlynn U.S. $13,378 394. DRA Advisors U.S. $10,581
370. Wasatch Advisors U.S. $13,368 395. Los Angeles Capital U.S. $10,398
371. Pacific Income Advisers U.S. $13,343 396. Bankinter Spain $10,381
372. Gruppo Banca Carige Italy $13,215 397. StepStone Group U.S. $10,372
373. Montag & Caldwell U.S. $12,935 398. Charter Hall Group Australia $10,371
374. UTI Asset Mgmt. India $12,849 399. Portfolio Advisors U.S. $10,343
375. ASB Capital Mgmt. U.S. $12,833 400. Amalgamated Bank U.S. $10,231

towerswatson.com
© 2013 Towers Watson. All rights reserved. Proprietary and Confidential. For Towers Watson and Towers Watson client use only.
31
Ranking – 2012
Rank Manager Market Total assets Rank Manager Market Total assets
401. Cantillon Capital Mgmt. U.S. $9,996 426. Guotai Fund Mgmt. China $8,609
402. Kimco Realty U.S. $9,872 427. Peregrine Holdings South Africa $8,574
403. Penghua Fund Mgmt. China $9,827 428. Pacific Alternative Asset U.S. $8,558
404. BPI Portugal $9,817 429. China Merchants Fund Mgmt. China $8,549
405. State Bank of India India $9,697 430. Value Partners Hong Kong $8,500
406. Denver Investments U.S. $9,565 431. BOCI-Prudential Hong Kong $8,483
407. International Fund Mgmt. China $9,555 432. Maple-Brown Abbott Australia $8,400
408. New Brunswick Investment Canada $9,429 433. Gulf International Bank U.K. $8,200
409. Diamond Hill Capital U.S. $9,429 434. Rock Creek Group U.S. $8,200
410. Neptune Investment U.K. $9,425 435. Kornitzer Capital U.S. $8,153
411. JCP Investment Partners Australia $9,222 436. EnTrust Capital U.S. $8,137
412. Tortoise Capital U.S. $9,206 437. Rongtong Fund Mgmt. China $8,074
413. WEDGE Capital U.S. $9,202 438. Ramius U.S. $8,071
414. Lend Lease Australia $9,126 439. Iridian Asset Mgmt. U.S. $8,032
415. Piper Jaffray U.S. $9,051 440. Silvercrest Asset Mgmt. U.S. $8,021
416. Jacobs Levy Equity U.S. $9,017 441. Odey Asset Mgmt. U.K. $8,000
417. Segall Bryant & Hamill U.S. $8,937 442. Opus Investment U.S. $7,960
418. Titanium Asset Mgmt. U.S. $8,855 443. BNG Netherlands $7,929
419. TT International U.K. $8,800 444. M.D. Sass Group U.S. $7,880
420. Synovus Financial U.S. $8,790 445. Abbott Capital U.S. $7,733
421. Kyobo Life Insurance South Korea $8,786 446. Bahl & Gaynor U.S. $7,661
422. Martin Currie U.K. $8,723 447. Ersel Group Italy $7,651
423. Driehaus Capital U.S. $8,685 448. Numeric Investors U.S. $7,616
424. Bank of Comm. Schroders China $8,616 449. Paradice Investment Australia $7,590
425. Axiom International U.S. $8,612 450. Herndon Capital U.S. $7,562

towerswatson.com
© 2013 Towers Watson. All rights reserved. Proprietary and Confidential. For Towers Watson and Towers Watson client use only.
32
Ranking – 2012
Rank Manager Market Total assets Rank Manager Market Total assets
451. Congress Asset Mgmt. U.S. $7,498 476. Dongbu South Korea $6,430
452. Caisse de Depôt et Placement Canada $7,446 477. PCCP U.S. $6,422
453. McKinley Capital U.S. $7,408 478. Beach Point Capital U.S. $6,403
454. Lion Fund Mgmt. China $7,351 479. Boston Trust & Investment U.S. $6,377
455. Samson Capital U.S. $7,318 480. Quadrant Real Estate U.S. $6,345
456. Merganser Capital U.S. $7,303 481. Invesco Great Wall Fund Mgmt. China $6,324
457. Crestline Investors U.S. $7,300 482. Smith Breeden U.S. $6,297
458. Lupus Alpha Asset Mgmt. Germany $7,268 483. Analytic Investors U.S. $6,248
459. KBS U.S. $7,267 484. Independence Capital U.S. $6,189
460. Northcape Capital Australia $7,264 485. Huatai-PineBridge Investment China $6,099
461. Johnson Investment Counsel U.S. $7,235 486. Richmond Capital U.S. $6,094
462. Horizon Kinetics U.S. $7,231 487. Advent Capital U.S. $6,092
463. SkyBridge Capital U.S. $7,137 488. Aurion Canada $6,019
464. PENN Capital U.S. $7,051 489. Adrian Lee & Partners U.K. $6,000
465. Progress Investment U.S. $7,039 490. Capital At Work Group Belgium $5,947
466. Beacon Capital U.S. $7,036 491. Glenmede Investment U.S. $5,929
467. Westwood Global U.S. $6,928 492. Fortune SGAM Fund Mgmt. China $5,891
468. Parnassus Investments U.S. $6,847 493. L&B Realty U.S. $5,831
469. DePrince, Race & Zollo U.S. $6,766 494. UBS SDIC China $5,817
470. Rockwood Capital U.S. $6,755 495. Zazove Associates U.S. $5,800
471. AREA Property Partners U.S. $6,701 496. KMAMCL India $5,779
472. SPARX Group Japan $6,636 497. Oechsle Int'l U.S. $5,766
473. Cambiar Investors U.S. $6,590 498. Hoisington Investment U.S. $5,704
474. Lighthouse Partners U.S. $6,500 499. Mercator Asset Mgmt. U.S. $5,642
475. Chandler Asset Mgmt. U.S. $6,431 500. Polaris Capital U.S. $5,554
Related Documents


