SPECIAL FEATURE Stoichiometry in Ecology C. A. Klausmeier E. Litchman T. Daufresne S. A. Levin Phytoplankton stoichiometry Received: 29 November 2007 / Accepted: 20 January 2008 / Published online: 6 March 2008 Ó The Ecological Society of Japan 2008 Abstract Because phytoplankton live at the interface between the abiotic and the biotic compartments of ecosystems, they play an important role in coupling multiple nutrient cycles. The quantitative details of how these multiple nutrient cycles intersect is determined by phytoplankton stoichiometry. Here we review some classic work and recent advances on the determinants of phytoplankton stoichiometry and their role in deter- mining ecosystem stoichiometry. First, we use a model of growth with flexible stoichiometry to reexamine Rhee and Goldman’s classic chemostat data. We also discuss a recent data compilation by Hall and colleagues that illustrates some limits to phytoplankton flexibility, and a model of physiological adaptation that can account for these results. Second, we use a model of resource allo- cation to determine the how the optimal nitrogen-to- phosphorus stoichiometry depends on the ecological conditions under which species grow and compete. Third, we discuss Redfield’s mechanism for the homeo- stasis of the oceans’ nitrogen-to-phosphorus stoichiom- etry and show its robustness to additional factors such as iron-limitation and temporal fluctuations. Finally, we suggest areas for future research. Keywords Phytoplankton Stoichiometry Redfield ratio Theory Introduction Phytoplankton have played an important role in the development of the field of ecological stoichiometry (Sterner and Elser 2002). This can be attributed to two causes. First, phytoplankton make an ideal model system for studying both the biochemistry (Calvin and Benson 1948) and the ecological interactions of photosynthetic organisms (Tilman 1977). Second, phytoplankton are responsible for approximately half of the world’s pri- mary production (Field et al. 1998), and therefore play an important role in coupling global biogeochemical cycles (Sarmiento and Gruber 2006; Falkowski and Raven 2007). For these reasons, phytoplankton stoichi- ometry has received extensive attention, including the seminal studies of Droop, Rhee, and Goldman in the 1970s. After that, research in the area diminished. Per- haps it was thought that the subject was completely understood (a comment we’ve received in reviews of some of our recent manuscripts on the topic). However, recently research in phytoplankton stoichiometry has revived, supporting some parts of the accepted wisdom, while overturning other parts. In this article we give an overview of the subject, including both historical and recent research (but biased towards our own work), and suggest areas of future research, using a framework of mathematical models to unify concepts. We focus on the physiological and ecosystem levels and, due to space, neglect the manifold effects of phytoplankton stoichi- ometry on higher trophic levels (Urabe and Sterner 1996; Loladze et al. 2000) as well as the feedbacks from higher trophic levels on phytoplankton stoichiometry (Sterner 1990; Hessen and Andersen 1992). Any discussion of phytoplankton stoichiometry should start with the work of Alfred Redfield (1934, 1958; Falkowski 2000). Based on work by Fleming (1940), Redfield (1958) declared the average atomic C. A. Klausmeier (&) E. Litchman W. K. Kellogg Biological Station, Michigan State University, Hickory Corners, MI 49060, USA E-mail: [email protected], [email protected] Tel.: +1-269-6714987 Fax: +1-269-6712351 T. Daufresne Comportement et Ecologie de la Faune Sauvage, Institut National de la Recherche Agronomique, Chemin de Borde-Rouge, Auzeville, BP 52627, 31326 Castanet-Tolosan Cedex, France E-mail: [email protected] S. A. Levin Department of Ecology and Evolutionary Biology, Princeton University, Princeton, NJ 08544, USA E-mail: [email protected] Ecol Res (2008) 23: 479–485 DOI 10.1007/s11284-008-0470-8

Welcome message from author
This document is posted to help you gain knowledge. Please leave a comment to let me know what you think about it! Share it to your friends and learn new things together.
Transcript

SPECIAL FEATURE Stoichiometry in Ecology
C. A. Klausmeier Æ E. Litchman Æ T. Daufresne
S. A. Levin
Phytoplankton stoichiometry
Received: 29 November 2007 / Accepted: 20 January 2008 / Published online: 6 March 2008� The Ecological Society of Japan 2008
Abstract Because phytoplankton live at the interfacebetween the abiotic and the biotic compartments ofecosystems, they play an important role in couplingmultiple nutrient cycles. The quantitative details of howthese multiple nutrient cycles intersect is determined byphytoplankton stoichiometry. Here we review someclassic work and recent advances on the determinants ofphytoplankton stoichiometry and their role in deter-mining ecosystem stoichiometry. First, we use a modelof growth with flexible stoichiometry to reexamine Rheeand Goldman’s classic chemostat data. We also discuss arecent data compilation by Hall and colleagues thatillustrates some limits to phytoplankton flexibility, and amodel of physiological adaptation that can account forthese results. Second, we use a model of resource allo-cation to determine the how the optimal nitrogen-to-phosphorus stoichiometry depends on the ecologicalconditions under which species grow and compete.Third, we discuss Redfield’s mechanism for the homeo-stasis of the oceans’ nitrogen-to-phosphorus stoichiom-etry and show its robustness to additional factors suchas iron-limitation and temporal fluctuations. Finally, wesuggest areas for future research.
Keywords Phytoplankton Æ Stoichiometry Æ Redfieldratio Æ Theory
Introduction
Phytoplankton have played an important role in thedevelopment of the field of ecological stoichiometry(Sterner and Elser 2002). This can be attributed to twocauses. First, phytoplankton make an ideal model systemfor studying both the biochemistry (Calvin and Benson1948) and the ecological interactions of photosyntheticorganisms (Tilman 1977). Second, phytoplankton areresponsible for approximately half of the world’s pri-mary production (Field et al. 1998), and therefore playan important role in coupling global biogeochemicalcycles (Sarmiento and Gruber 2006; Falkowski andRaven 2007). For these reasons, phytoplankton stoichi-ometry has received extensive attention, including theseminal studies of Droop, Rhee, and Goldman in the1970s. After that, research in the area diminished. Per-haps it was thought that the subject was completelyunderstood (a comment we’ve received in reviews ofsome of our recent manuscripts on the topic). However,recently research in phytoplankton stoichiometry hasrevived, supporting some parts of the accepted wisdom,while overturning other parts. In this article we give anoverview of the subject, including both historical andrecent research (but biased towards our own work), andsuggest areas of future research, using a framework ofmathematical models to unify concepts. We focus on thephysiological and ecosystem levels and, due to space,neglect the manifold effects of phytoplankton stoichi-ometry on higher trophic levels (Urabe and Sterner 1996;Loladze et al. 2000) as well as the feedbacks from highertrophic levels on phytoplankton stoichiometry (Sterner1990; Hessen and Andersen 1992).
Any discussion of phytoplankton stoichiometryshould start with the work of Alfred Redfield (1934,1958; Falkowski 2000). Based on work by Fleming(1940), Redfield (1958) declared the average atomic
C. A. Klausmeier (&) Æ E. LitchmanW. K. Kellogg Biological Station,Michigan State University,Hickory Corners, MI 49060, USAE-mail: [email protected], [email protected].: +1-269-6714987Fax: +1-269-6712351
T. DaufresneComportement et Ecologie de la Faune Sauvage,Institut National de la Recherche Agronomique,Chemin de Borde-Rouge, Auzeville,BP 52627, 31326 Castanet-Tolosan Cedex, FranceE-mail: [email protected]
S. A. LevinDepartment of Ecology and Evolutionary Biology,Princeton University, Princeton, NJ 08544, USAE-mail: [email protected]
Ecol Res (2008) 23: 479–485DOI 10.1007/s11284-008-0470-8

C:N:P ratio of phytoplankton to be 106:16:1, a ratiowhich has since been enshrined as the ‘‘Redfield ratio’’.Recent work has extended the Redfield ratio to includetrace elements (Quigg et al. 2003); the average compo-sition of phytoplankton in this study was found to beC124N16P1S1.3K1.7Mg0.56Ca0.5Fe0.0075Zn0.0008Cu0.00038Cd0.00021Co0.00019. While expanding our knowledge ofphytoplankton stoichiometry to include trace elements,the original Redfield trio of C:N:P remained markedlyunchanged.
A more fundamental change in our conception of thephytoplankton stoichiometry has been a greater appre-ciation of its variability (Michaels et al. 2001; Karl et al.2001). Although originally designated as an average, theRedfield ratio has sometimes been misconstrued as theuniversal and constant stoichiometry of phytoplankton.Recent research has emphasized the variability of phy-toplankton stoichiometry in space and time and betweendifferent species (Michaels et al. 2001; Karl et al. 2001).
The Droop curve relating growth rate to the intra-cellular quota (Q) of an element provides a useful con-struct for thinking about variability in phytoplanktonstoichiometry (Droop 1968; Caperon 1968; Fig. 1; seealso the historical review by Leadbeater 2006). Growthrate is zero at the minimum quota (Qmin), and increaseswith additional nutrient supply, asymptoticallyapproaching a theoretical maximum growth rate (l¥) atinfinite quota. We can interpret the minimum quota asthe element used in cellular structure and machinery, andall quota above the minimum quota as nutrient stored forfuture growth (Caperon 1968). This is a gross oversim-plification of reality, but allows us to investigate twolevels of variability in phytoplankton stoichiometry: thatof overall stoichiometry (question 1 below) and that ofcellular machinery (resource needs) (question 2 below).
Question 1: What determines overall stoichiometry(structure + stores)?
Classic chemostat experiments in the 1970s identified twokey factors that interact to affect overall phytoplanktonstoichiometry: nutrient supply ratio (Rhee 1978) and
growth rate (Goldman et al. 1979). Rhee fixed the dilution(growth) rate and varied the N:P supply ratio. He foundthat Scenedesmus stoichiometry matched the N:P supplyratio over a range from 5 to 80. Goldman and colleagues(1979) performed an orthogonal set of experiments: theyfixed the N:P supply ratio and varied the dilution(growth) rate. They found that phytoplankton N:P mat-ched the N:P supply at low growth rates (as Rhee found),but high growth rates converged on a single N:P ratio,regardless of the identity of the limiting nutrient. Theyinterpreted this single ratio at high growth rates as theRedfield ratio (although the numerical value from theirexperiments was clearly not 16:1).
We set out to understand these results using a simplemathematical model of phytoplankton growth ontwo essential nutrients with flexible stoichiometry(Klausmeier et al. 2004a). All the components wereavailable ‘‘off the shelf’’: chemostat nutrient supply,Michaelis–Menten uptake kinetics, and Droop growthfunctions linked by Liebig’s law of the minimum. Sur-prisingly, this model was not investigated until 1997(Legovic and Cruzado 1997) and not in the context ofcontrols of phytoplankton stoichiometry. The model’sdynamics are not particularly interesting: it has a un-ique, globally stable equilibrium point (De Leenheeret al. 2006). What is biologically interesting is that themodel captures both Rhee’s and Goldman’s classicalchemostat results (Fig. 2). Of course there are limits tothe flexibility of phytoplankton stoichiometry, leadingthis model to not fit well at extreme N:P supplies(Klausmeier et al. 2004a; Smith and Yamanaka 2007).
The flexibility of overall phytoplankton stoichiome-try as exemplified by Rhee’s Scenedesmus has been takenas one of the fundamentals of ecological stoichiometry(Sterner and Elser 2002). Recently, Hall and colleaguesreexamined the generality of this result and found itmuch more restricted than previously assumed (Hallet al. 2005). In natural lakes and experimental meso-cosms, the N:P of seston did not match N:P supply, butwas much more constant. Even more surprising, labo-ratory cultures also deviated from perfect N:P flexibilityin the same way. It turns out that Rhee’s results were theexception rather than the rule.
There are a number of possible explanations for thisdiscrepancy (Hall et al. 2005). First, as Goldman’sexperiments (1979) and our model results (Fig. 2b,Klausmeier et al. 2004a) show, at high growth rates wedo not expect a perfect correspondence between phyto-plankton N:P and supply N:P. Second, there may be aninhibition of nutrient uptake at high internal concen-trations, a result known from experimental work(Gotham and Rhee 1981). When incorporated intomodels, this uptake inhibition can prevent perfect flexi-bility, either instantaneously (Hall et al. 2005; Smith andYamanaka 2007) or with a time lag (Klausmeier et al.2007).
Our model (Klausmeier et al. 2004a) also clarified themeaning of the N:P ratio converged upon at high dilu-tion rates. Goldman and colleagues called it the Redfield
Fig. 1 Droop function relating growth rate to cellular quota(nutrient per cell)
480
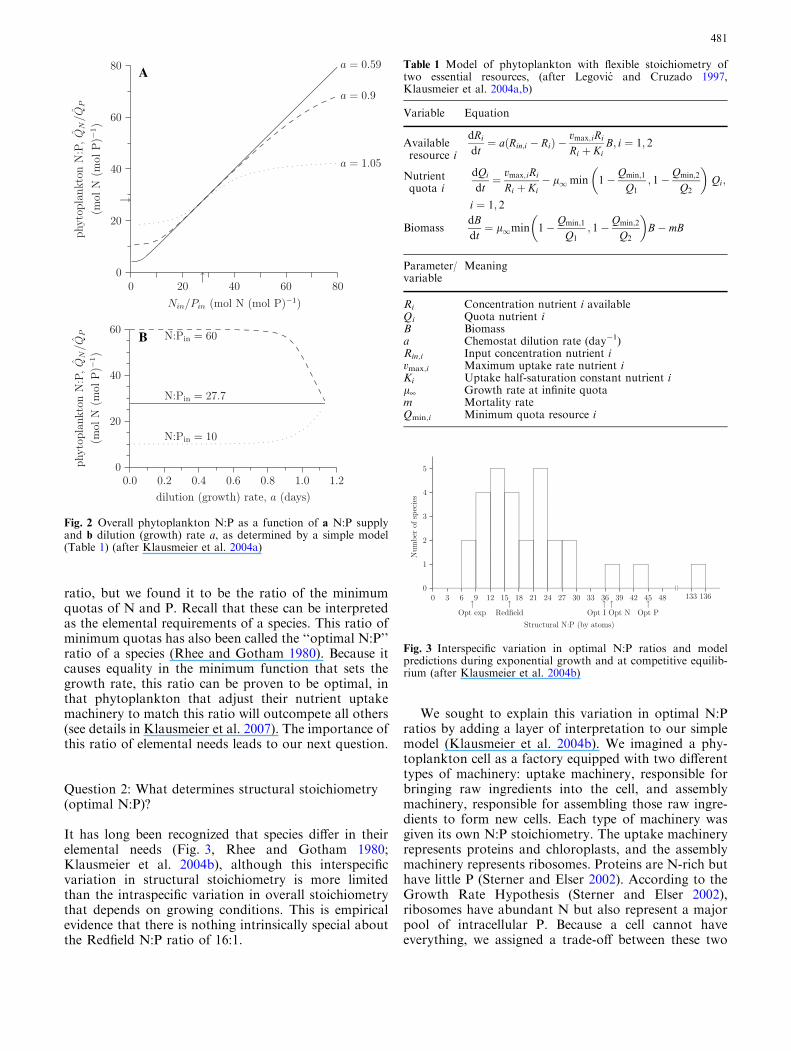
ratio, but we found it to be the ratio of the minimumquotas of N and P. Recall that these can be interpretedas the elemental requirements of a species. This ratio ofminimum quotas has also been called the ‘‘optimal N:P’’ratio of a species (Rhee and Gotham 1980). Because itcauses equality in the minimum function that sets thegrowth rate, this ratio can be proven to be optimal, inthat phytoplankton that adjust their nutrient uptakemachinery to match this ratio will outcompete all others(see details in Klausmeier et al. 2007). The importance ofthis ratio of elemental needs leads to our next question.
Question 2: What determines structural stoichiometry(optimal N:P)?
It has long been recognized that species differ in theirelemental needs (Fig. 3, Rhee and Gotham 1980;Klausmeier et al. 2004b), although this interspecificvariation in structural stoichiometry is more limitedthan the intraspecific variation in overall stoichiometrythat depends on growing conditions. This is empiricalevidence that there is nothing intrinsically special aboutthe Redfield N:P ratio of 16:1.
We sought to explain this variation in optimal N:Pratios by adding a layer of interpretation to our simplemodel (Klausmeier et al. 2004b). We imagined a phy-toplankton cell as a factory equipped with two differenttypes of machinery: uptake machinery, responsible forbringing raw ingredients into the cell, and assemblymachinery, responsible for assembling those raw ingre-dients to form new cells. Each type of machinery wasgiven its own N:P stoichiometry. The uptake machineryrepresents proteins and chloroplasts, and the assemblymachinery represents ribosomes. Proteins are N-rich buthave little P (Sterner and Elser 2002). According to theGrowth Rate Hypothesis (Sterner and Elser 2002),ribosomes have abundant N but also represent a majorpool of intracellular P. Because a cell cannot haveeverything, we assigned a trade-off between these two
A
B
Fig. 2 Overall phytoplankton N:P as a function of a N:P supplyand b dilution (growth) rate a, as determined by a simple model(Table 1) (after Klausmeier et al. 2004a)
Table 1 Model of phytoplankton with flexible stoichiometry oftwo essential resources, (after Legovic and Cruzado 1997,Klausmeier et al. 2004a,b)
Variable Equation
Availableresource i
dRi
dt¼ aðRin;i � RiÞ �
vmax;iRi
Ri þ KiB; i ¼ 1; 2
Nutrientquota i
dQi
dt¼ vmax;iRi
Ri þ Ki� l1min 1� Qmin;1
Q1; 1� Qmin;2
Q2
� �Qi;
i ¼ 1; 2
BiomassdBdt¼ l1min 1� Qmin;1
Q1; 1� Qmin;2
Q2
� �B� mB
Parameter/variable
Meaning
Ri Concentration nutrient i availableQi Quota nutrient iB Biomassa Chemostat dilution rate (day�1)Rin,i Input concentration nutrient ivmax,i Maximum uptake rate nutrient iKi Uptake half-saturation constant nutrient il¥ Growth rate at infinite quotam Mortality rateQmin,i Minimum quota resource i
Fig. 3 Interspecific variation in optimal N:P ratios and modelpredictions during exponential growth and at competitive equilib-rium (after Klausmeier et al. 2004b)
481

types of cellular machinery. A species allocation strategydetermines its structural stoichiometry as well as itsecophysiological parameters. Thus, the problem of cal-culating structural N:P needs could be reduced to find-ing the optimal allocation between ribosomes andproteins (Falkowski 2000; Geider and La Roche 2002).
But what is optimal? It depends on the conditionsunder which species grow and compete. We examinedtwo extreme cases that bracket the range of possibilities.In a nonequilibrium, high-resource environment, theoptimal strategy is one that maximizes its exponentialgrowth rate lmax. In a steady-state, low-resource envi-ronment, the optimal strategy is one that can reduce thelimiting resource to the lowest level (R*) (Tilman 1982).Since we have algebraic expressions for both of thesefitness measures, it is easy to find the optimal allocationstrategy and therefore the optimal structural N:P in eachcase. When parameterized, the model predicts structuralN:P ratios to vary from 8.2 during exponential growthto 35.8, 37.4, and 45.0 at competitive equilibriumdepending on the limiting resource (light, N, or P,respectively) (Klausmeier et al. 2004b). These values areclose to the range of observed structural N:P ratios(Fig. 3), lending theoretical support to the idea that theRedfield ratio is not intrinsically special. If the mix ofexponential growth and equilibrium phases wouldchange in the ocean, then so would the average N:Pcomposition of the phytoplankton.
As an aside, we note the terminological train wreckconcerning the word ‘‘optimal’’ that we have been partyto (Leonardos and Geider 2004). The ratio of minimumquotas is known as an ‘‘optimal ratio’’ because a speciesthat achieves this ratio outcompetes others that do not(Rhee and Gotham 1980; Klausmeier et al. 2007), atleast if we assume that species have a single l¥ value forboth elements (Terry et al. 1985). Another use of thephrase ‘‘optimal ratio’’ is ‘‘the elemental ratio of speciesgrowing during their optimal conditions’’ (e.g., Hille-brand and Sommer 1999). These are identical given ourtheoretical results (Fig. 1b), given the same provisoconcerning l¥ values. Finally, what we have done here(Klausmeier et al. 2004b) is derive the best possible ratioof minimum quotas, that is, the optimal optimal N:Pratio. Although this phrase is more accurate, it isprobably better disregarded.
Question 3: Why do phytoplankton and ocean N:Ps(almost) match?
The final question we would like to address brings usback to Redfield (1934, 1958). That is, why is the aver-age N:P ratio of phytoplankton and that of the ocean asa whole so similar? Redfield offered three explanations:(1) over long time scales, phytoplankton have adapted tothrive on the chemical composition of the ocean; (2) overlong time scales, the ocean has changed to match whatphytoplankton require; and (3) it is just a coincidence(Redfield 1958). The third hypothesis is hard to test. Thefirst hypothesis is intuitively appealing, while the secondseems non-Darwinian. Despite this, Redfield favored thesecond hypothesis of biotic control over oceanic N:P,which is now considered to be true (Falkowski 2000).
What mechanism could account for this counterin-tuitive explanation? Redfield (1958) suggested thatcompetition between nitrogen-fixing and non-fixingphytoplankton could determine the N:P ratio of theocean. If the ocean’s N:P ever became too low, nitrogen-fixing species would dominate by fixing atmospheric N,and increase the ocean’s N:P ratio as they die anddecompose. Recently, two simple models of the oceandemonstrated that this mechanism could operate asRedfield suggested (Tyrell 1999; Lenton and Watson2000). This explanation can be recast in terms of Til-man’s (1982) graphical approach to resource competi-tion (Fig. 4, Schade et al. 2005). Non-fixing species havea right-angled zero net growth isocline (ZNGI) typical ofessential resources, while the nitrogen-fixer has a verticalZNGI because it can grow with no nitrate available.Consumption vectors reflect that non-fixers consumeboth phosphate and nitrate while N-fixers consume onlyphosphate. This sets a wedge-shaped region of supplypoints that lead to coexistence. Finally, in a completelyclosed system, the supply point corresponds to the N:Pratio in deep waters. Over long time scales this pointmoves up as nitrogen-fixers die and increase the deepwater N pool. In a closed system, this process wouldcontinue until the supply point reached the upperboundary of the coexistence region, set by the N:P needsof the non-fixer. The continual N loss due to denitrifi-cation and sedimentation prevents the nitrogen-fixersfrom fixing themselves out of existence.
Fig. 4 Graphical model of theregulation of N:P in the oceanby competition betweenN-fixing and non-fixingphytoplankton (after Schadeet al. 2005)
482

One argument that could be made against this modelis that recent evidence shows that nitrogen-fixers areoften limited by light or iron (Falkowski 2000; Berman-Frank et al. 2001; Hood et al. 2004; Mills et al. 2004). Tosee if the widespread limitation of N-fixers by factorsother than P would break Redfield’s homeostaticmechanism, we modified Tyrell’s (1999) model to in-clude two upper ocean boxes, one where both N-fixersand non-fixers can live and one where N-fixers are ex-cluded (Lenton and Klausmeier 2007). We found thatRedfield’s homeostatic mechanism was remarkably ro-bust to this complication. When N-fixers were restrictedto a small part of the ocean’s surface, their density thereincreased to mostly compensate. Even when N-fixerswere restricted to 20% of the ocean’s surface, the deepocean N:P was kept between 11 and 14.6. We also foundthat the N:P stoichiometry of N-fixers had very littleeffect on the ocean’s N:P, but the N:P stoichiometry ofthe non-fixers had a large effect (Lenton and Klausmeier2007).
One complication that we uncovered was that Tyrell’s(1999) model coupling the N-and P-cycles did not al-ways reach a stable equilibrium point, but could give riseto sustained large-scale oscillations with an approxi-mately 300-year period (Lenton and Klausmeier 2007).The ocean’s N:P ratio and overall abundance of N-fixersdo not oscillate at this frequency, so something needs tobe done to account for this behavior. It is likely that, ifthis dynamic were embedded in a spatially-explicitmodel, spatiotemporal oscillations would result, leadingto local instability but global stability (Pascual and Le-vin 1999; Durrett and Levin 2000), but we will not knowfor sure until such a model is constructed. These self-sustained oscillations may permit the coexistence ofmore phytoplankton species than possible at equilibrium(Huisman and Weissing 1999; T. Daufresne et al.,manuscript in preparation.).
Future directions
Here we briefly outline some directions for future re-search that might prove fruitful.
Derive the Droop model from individual behavior
The way in which we and others have used the Droopfunction (Fig. 1) is to treat nutrient quota as the inde-pendent variable and growth rate as the dependentvariable, that is to say that quota determines growthrate. This is actually the opposite of how Droop (1968)and Caperon (1968) originally discovered this relation-ship, which was by running a series of chemostats withvarying dilution rates and measuring the nutrient quotaat equilibrium. At steady state, the results are identical,but an important use of the variable internal storesmodels is understanding dynamics away from equilib-rium (Grover 1991; Ducobu et al. 1998) where this
discrepancy may become important. We suggest that animportant open problem is to put the Droop model on afirm foundation, starting from an individual-basedmodel and scaling up to population dynamics (Metz andDiekmann 1986; Pascual and Caswell 1997) to derive thesteady-state relationship between the growth rate andquota.
Include energy
The models we have discussed have focused on chemicalresources, yet light energy is obviously also important tophototrophs. The balance between light and nutrients isknown to affect many aspects of ecosystem structure(Sterner et al. 1997) and the effect of light supply onnutrient stoichiometry is becoming understood (Diehlet al. 2005; Jager et al. 2008). To what extent carbon/light be modeled in a similar way to the Droop model(Zonneveld et al. 1997)? How do light supply and fluc-tuations affect elemental stoichiometry (Litchman et al.2004)? There has been much work on modeling photo-adaptation of chlorophyll (e.g., Geider et al. 1996;Zonneveld 1997), but less work coupling chlorophylland nutrient dynamics (but see Geider et al. 1998 andArmstrong 1999). This remains an area in need of fur-ther work, perhaps based on Kooijman’s DEB theory(Kooijman 2000).
C-limitation
Free CO2 can often be limiting in the water, especially inmarine environments (Stumm and Morgan 1981). Manyspecies of phytoplankton, including cyanobacteria,possess mechanisms to increase the efficiency of photo-synthesis by taking up different forms of inorganic car-bon (CO2, HCO3
�) and concentrating CO2 aroundRubisco, the main photosynthetic (carbon fixation) en-zyme (Badger et al. 2002; Raven 2003). High concen-tration of inorganic carbon around Rubisco inhibits theoxygenase function (photorespiration) of this enzymeand hence decreases inhibition of photosynthesis byoxygen. Carbon-concentrating mechanisms (CCMs)thus influence the resulting C:nutrient stoichiometries ofphytoplankton cells. Nutrient limitation can, in turn,down-regulate CCMs (Beardall et al. 2005), furthermodulating C:nutrient ratios.
Consider multiple constraints and dynamicsof acclimation
In our studies, we have considered only a single con-straint between uptake of two resources (Klausmeieret al. 2007) or uptake of resource and cellular assembly(Klausmeier et al. 2004b). Phytoplankton require mul-tiple resources and they also face multiple constraintsthat restrict the metabolic strategies they can employ to
483

obtain these resources. For example, there are the nestedconstraints of allocation of multiple elements, energy forassembly and operation of cellular machinery, andphysical space to put the machinery (Aksnes and Egge1991). It would be instructive to simultaneously considermultiple constraints on phytoplankton metabolic strat-egies. Initial attempts in this direction have been quitecomplex (Flynn 2003). Perhaps ideas could be borrowedfrom ecology’s sister field of economics, where multipleconstraints are also the rule, or from models of terres-trial primary producers (Rastetter and Shaver 1992).
Spatiotemporal variability as a mechanismof coexistence
In our work in deriving the optimal N:P ratio of phy-toplankton (Klausmeier et al. 2004b) we considered twoextreme ecological scenarios: competition to exclusionand maximal exponential growth. Implicitly, we as-sumed that the real world is a mixture of these extremesthat would select for an intermediate community N:Pratio. Whether that community consists of a single best-adapted type or a more diverse collection of species wasunaddressed, but is a classic question of planktoncommunity ecology (Hutchinson 1961). It is well knownthat spatial (Levin 1974), temporal (Armstrong andMcGehee 1980; Huisman and Weissing 1999; Litchmanand Klausmeier 2001), and spatiotemporal variability[externally-forced (Snyder 2007) and generated by pat-chy nutrient recycling by grazers (Kato et al. 2007)] canall contribute to species diversity. How these mecha-nisms of diversity and the physiological trade-offs be-tween ecological strategies interact to determine thestoichiometric diversity of phytoplankton communitiesis still an open question.
Acknowledgments We thank Akiko Satake for the invitation topresent this lecture at the Ecological Society of Japan’s 54th AnnualMeeting and for the hospitality we received.We thank S. Lan Smith,and Kohei Yoshiyama for useful discussions and Jotaro Urabe forcomments on the manuscript. This research was supported by NSFgrants DEB-0610531 (E.L.), DEB-0610532 (C.K.), DEB-0083566(S.A.L.), and grants from the James S. McDonnell Foundation(C.A.K. and E.L) and the Andrew Mellon Foundation (S.A.L.).This is contribution # 1458 from the Kellogg Biological Station.
References
Aksnes DL, Egge JK (1991) A theoretical model for nutrient up-take in phytoplankton. Mar Ecol Prog Ser 70:65–72
Armstrong RA, McGehee R (1980) Competitive exclusion. AmNat 115:151–170
Armstrong RA (1999) An optimization-based model of iron-light-ammonium colimitation of nitrate uptake and phytoplanktongrowth. Limnol and Oceanogr 44:1436–1446
Badger MR, Hanson D, Price GD (2002) Evolution and diversityof CO2 concentrating mechanisms in cyanobacteria. FunctPlant Biol 29:161–173
Beardall J, Roberts S, Raven JA (2005) Regulation of inorganiccarbon acquisition by phosphorus limitation in the green algaChlorella emersonii. Can J Bot 83:859–864
Berman-Frank I, Cullen JT, Shaked Y, Sherrell RM, FalkowskiPG (2001) Iron availability, cellular iron quotas, and nitrogenfixation in Trichodesmium. Limnol Oceanogr 46:1249–1260
Calvin M, Benson AA (1948) The path of carbon in photosyn-thesis. Science 107:476–480
Caperon J (1968) Population growth response of Isochrysis gal-bana to nitrate variation at limiting concentrations. Ecology49:866–872
De Leenheer P, Levin SA, Sontag ED, Klausmeier CA (2006)Global stability in a chemostat with multiple nutrients. J MathBiol 52:419–438
Diehl S, Berger S, Wohrl R (2005) Flexible nutrient stoichiometrymediates environmental influeces on phytoplankton and itsresources. Ecology 86:2931–2945
Droop MR (1968) Vitamin B12 and marine ecology. IV. Thekinetics of uptake, growth and inhibition in Monochrysislutheri. J Mar Biol Assoc U K 48:689–733
Ducobu H, Huisman J, Jonker RR, Mur LR (1998) Competitionbetween a prochlorophyte and a cyanobacterium under variousphosphorus regimes: comparisons with the Droop model.J Phycol 34:467–476
Durrett R, Levin SA (2000) Lessons on pattern formation fromPlanet WATOR. J Theor Biol 205:201–214
Falkowski PG (2000) Rationalizing elemental ratios in unicellularalgae. J Phycol 36:3–6
Falkowski PG, Raven JA (2007) Aquatic photosynthesis, 2nd edn.Princeton University Press, New Jersey
Fleming RH (1940) The composition of plankton and units forreporting populations and production. Proceedings of the SixthPacific Science Congress 3:535–540
Flynn KJ (2003) Modelling multi-nutrient interactions in phyto-plankton: balancing simplicity and realism. Prog Oceanogr56:249–279
Field CB, Behrenfeld MJ, Randerson JT, Falkowski P (1998) Pri-mary production of the biosphere: integrating terrestrial andoceanic components. Science 281:237–240
Geider RJ, MacIntyre HL, Kana TM (1996) A dynamic model ofphotoadaptation in phytoplankton. Limnol Oceanogr 41:1–15
Geider RJ, MacIntyre HL, Kana TM (1998) A dynamic regulatorymodel of phytoplanktonic acclimation to light, nutrient, andtemperature. Limnol Oceanogr 43:679–694
Geider RJ, La Roche J (2002) Redfield revisited: variability ofC:N:P in marine microalgae and its biochemical basis. Eur JPhycol 37:1–17
Goldman JC, McCarthy JJ, Peavey DG (1979) Growth rateinfluence on the chemical composition of phytoplankton inoceanic waters. Nature 279:210–215
Gotham IJ, Rhee G-Y (1981) Comparative kinetic studies ofphosphate-limited growth and phosphate uptake in phyto-plankton in continuous culture. J Phycol 17:257–265
Grover JP (1991) Resource competition in a variable environment:phytoplankton growing according to the variable-internal-stores model. Am Nat 138:811–835
Hall SR, Smith VH, Lytle DA, Leibold MA (2005) Constraints onprimary producer N:P stoichiometry along N:P supply ratiogradients. Ecology 86:1894–1904
Hessen DO, Andersen T (1992) The algae-grazer interface: feed-back mechanism linked to elemental ratios and nutrient cycling.Arch Hydrobiol Ergeb Limnol 35:111–120
Hillebrand H, Sommer U (1999) The nutrient stoichiometry ofbenthic microalgal growth: Redfield proportions are optimal.Limnol Oceanogr 44:440–446
Hood RR, Coles VJ, Capone DG (2004) Modeling the distributionof Trichodesmium and nitrogen fixation in the Atlantic Ocean.J Geophys Res 109:1–25
Hutchinson GE (1961) The paradox of the plankton. Am Nat95:137–145
Huisman J, Weissing FJ (1999) Biodiversity of plankton by speciesoscillations and chaos. Nature 402:407–410
Jager CG, Diehl S, Matauschek C, Klausmeier CA, Stibor H (2008)Transient dynamics of pelagic producer-grazer systems in agradient of nutrients and mixing depths. Ecology (in press)
484

Karl DM, Bjorkman KM, Dore JE, Fujieki L, Hebel DV, Houli-han T, Letelier RM, Tupas LM (2001) Ecological nitrogen-to-phosphorus stoichiometr at station ALOHA. Deep Sea Res II48:1529–1566
Kato S, Urabe J, Kawata M (2007) Effects of temporal and spatialheterogeneities created by consumer-driven nutrient recyclingon algal diversity. J Theor Biol 245:364–377
Klausmeier CA, Litchman E, Levin SA (2004a) Phytoplanktongrowth and stoichiometry under multiple nutrient limitation.Limnol Oceanogr 49:1463–1470
Klausmeier CA, Litchman E, Daufresne T, Levin SA (2004b)Optimal nitrogen-to-phosphorus stoichiometry of phytoplank-ton. Nature 429:171–174
Klausmeier CA, Litchman E, Levin SA (2007) A model of flexibleuptake of two essential resources. J Theor Biol 246:278–289
Kooijman SALM (2000) Dynamic energy and mass budgets inbiological systems. Cambridge University Press
Legovic T, Cruzado A (1997) A model of phytoplankton growth onmultiple nutrients based on the Michaelis–Menten–Monoduptake, Droop’s growth and Liebig’s law. Ecol Model 99:19–31
Lenton TM, Watson AJ (2000) Redfield revisited: 1. Regulation ofnitrate, phosphate, and oxygen in the ocean. Global Biogeo-chem Cycles 14:225–248
Lenton TM, Klausmeier CA (2007) Biotic stoichiometric controlson the deep ocean N:P ratio. Biogeosci 4:353–367
Leonardos N, Geider RJ (2004) Responses of elemental and bio-chemical composition of Chaetoceros muelleri to growth undervarying light and nitrate:phosphate supply ratios and theirinfluence on critical N:P. Limnol Oceanogr 49:2105–2114
Leadbeater BSC (2006) The ‘Droop equation’—Michael Droopand the legacy of the ‘cell-quota model’ of phytoplanktongrowth. Protist 157:345–358
Levin SA (1974) Dispersion and population interactions. Am Nat108:207–228
Litchman E, Klausmeier CA (2001) Competition of phytoplanktonunder fluctuating light. Am Nat 157:170–187
Litchman E, Klausmeier CA, Bossard P (2004) Phytoplanktonnutrient competition under dynamic light regimes. LimnolOceanogr 49:1457–1462
Loladze I, Kuang Y, Elser JJ (2000) Stoichiometry in producer-grazer systems: linking energy flow with nutrient cycling. BullMath Biol 62:1137–1162
Metz JAJ, Diekmann O (1986) The dynamics of physiologicallystructured populations. Springer, Berlin
Michaels AF, Karl DM, Capone DG (2001) Elemental stoichi-ometry, new production, and nitrogen fixation. Oceanography14:68–77
Mills MM, Ridame C, Davey M, La Roche J, Geider RJ (2004)Iron and phosphorus co-limit nitrogen fixation in the easterntropical North Atlantic. Nature 429:292–294
Quigg A, Finkel ZV, Iwin AJ, Rosenthal Y, Ho T-Y, ReinfelderJR, Schofield O, Morel FMM, Falkowski PG (2003) The evo-lutionary inheritance of elemental stoichiometry in marinephytoplankton. Nature 425:291–294
Pascual M, Caswell H (1997) From the cell cycle to populationcycles in phytoplankton-nutrient interactions. Ecology 78:897–912
Pascual M, Levin SA (1999) From individuals to population den-sities: searching for the intermediate scale of nontrivial deter-minism. Ecology 80:2225–2236
Rastetter EB, Shaver GR (1992) A model of multiple elementlimitation for acclimating vegetation. Ecology 73:1157–1174
Raven JA (2003) Inorganic carbon concentrating mechanisms inrelation to the biology of algae. Photosyn Res 77:155–171
Redfield AC (1934) In: Daniel RJ (ed) James Johnstone memorialvolume. On the proportions of organic derivatives in sea waterand their relation to the composition of plankton. UniversityPress of Liverpool, pp 176–192
Redfield AC (1958) The biological control of chemical factors inthe environment. Am Sci 46:205–221
Rhee G-Y (1978) Effects of N:P atomic ratios and nitrate limitationon algal growth, cell composition, and nitrate uptake. LimnolOceanogr 23:10–25
Rhee G-Y, Gotham IJ (1980) Optimum N:P ratios and coexistenceof planktonic algae. J Phycol 16:486–489
Sarmiento JL, Gruber N (2006) Ocean biogeochemical dynamics.Princeton University Press, New Jersey
Schade JD, Espeleta JF, Klausmeier CA, McGroddy ME, ThomasSA, Zhang L (2005) A conceptual framework for ecosystemstoichiometry: balancing resource supply and demand. Oikos109:40–51
Smith SL, Yamanaka Y (2007) Optimization-based model of multi-nutrient uptake kinetics. Limnol Oceanogr 52:1545–1558
Snyder RE (2007) Spatiotemporal population distributions andtheir implications for species coexistence in a variable envi-ronment. Theor Popul Biol 72:7–20
Sterner RW (1990) The ratio of nitrogen to phosphorus resuppliedby herbivores: zooplankton and the algal competitive arena.Am Nat 136:209–229
Sterner RW, Elser JJ, Fee EJ, Guildford SJ, Chrzanowski TH(1997) The light:nutrient ratio in lakes: the balance of energyand materials affects ecosystem structure and process. Am Nat150:663–684
Sterner RW, Elser JJ (2002) Ecological stoichiometry: The biologyof elements from molecules to the biosphere. Princeton Uni-versity Press
Stumm W, Morgan JJ (1981) Aquatic chemistry: an introductionemphasizing chemical equilibria in natural waters. Wiley, NewYork
Terry KL, Law EA, Burns DJ (1985) Growth rate variation of theN:P requirement ratio of phytoplankton. J Phycol 21:323–329
Tilman D (1977) Resource competition between planktonic algae:an experimental and theoretical approach. Ecology 58:338–348
Tillman D (1982) Resource competition and community structure.Princeton University Press
Tyrell T (1999) The relative influences of nitrogen and phosphoruson oceanic primary productivity. Nature 400:525–531
Urabe J, Sterner RW (1996) Regulation of herbivore growth by thebalance of light and nutrients. Proc Natl Acad Sci USA93:8465–8469
Zonneveld C (1997) Modeling effects of photoadaptation on thephotosynthesis-irradiance curve. J Theor Biol 186:381–388
Zonneveld C, van den Berg HA, Kooijman SALM (1997) Model-ing carbon cell quota in light-limited phytoplankton. J TheorBiol 188:215–226
485
Related Documents