Original Research Article Phytate, zinc, iron and calcium content of common Bolivian food, and implications for mineral bioavailability Claudia E. Lazarte a,b, *, Nils-Gunnar Carlsson c , Annette Almgren c , Ann-Sofie Sandberg c , Yvonne Granfeldt a a Department of Food Technology, Engineering and Nutrition, Lund University, P.O. Box 124, 22100 Lund, Sweden b Food and Natural Products Center, San Simon University, Cochabamba, Bolivia c Department of Food Science, Chalmers University of Technology, S-40229 Go ¨teborg, Sweden 1. Introduction In the rural areas of developing countries, the diets are mainly plant-based with a limited amount of animal-source foods, including dairy products. These types of diet usually have a low bioavailability of minerals (mainly zinc, iron and calcium) due to the presence of absorption inhibitors such as phytates, tannins, oxalates and others (Lo ¨ nnerdal, 2002; Sandberg, 2002). It has been reported that phytate (myo-inositol-6-phosphate) is the main inhibitor of zinc absorption and that it affects the absorption of other divalent minerals, mostly iron and calcium. Phytate is mainly found in cereal grains, legume seeds and, in a lower concentration, in tubers and roots (Connie and Srimathi, 2001; Lo ¨ nnerdal, 2000, 2002). The inhibitory effect of phytates on the absorption of minerals is due to the formation of insoluble and indigestible phytate–mineral complexes in the gut (Sandstrom, 1997). This negative effect depends not only on the amount of phytate in the food, but also on the molar ratios of phytate:mineral, which have already been studied, and desirable molar ratios of phytate:mineral are suggested as an indicator of the adequate bioavailability of the minerals (Hotz and Brown, 2004; Hotz et al., 2003). The suggested phyate:zinc molar ratio (Phy:Zn) is <15, although it has been seen that even Phy:Zn ratios between 5 and 15 have a negative effect over the zinc bioavailability (WHO, 1996). For diets high in both phytate and calcium, the molar ratio Phy*Ca:Zn (phytate*cal- cium:zinc) is more useful for assessing the zinc bioavailability. In Journal of Food Composition and Analysis 39 (2015) 111–119 A R T I C L E I N F O Article history: Received 26 September 2013 Received in revised form 11 November 2014 Accepted 25 November 2014 Available online 14 January 2015 Keywords: Phytate Anti-nutrient Minerals Bioavailability Plant-based diet Zinc Iron Calcium Food analysis Food composition Food frequency questionnaire Food composition database Bolivian food composition table Dietary intake A B S T R A C T The content of zinc, iron, calcium and phytate in the 16 most consumed foods from 5 villages in a tropical rural area of Bolivia was analyzed. The food items were selected according to a completed food frequency questionnaire. Minerals were analyzed by atomic absorption and phytates by HPIC chromatography. The molar ratios of phytate:mineral are presented as indication of the mineral bioavailability. Within the analyzed food, quinoa is a potential source of minerals: zinc 3.65, iron 5.40 and calcium 176 mg/100 g; however, it also has the highest content of phytate 2060 mg/100 g. Cereals and legumes showed high concentration of phytates (from 142 to 2070 mg/100 g), roots and tubers have lower concentrations (from 77 to 427 mg/100 g). In general, both phytate contents and molar ratios Phy:Zn (phytate:zinc), Phy:Fe (phytate:iron) and Phy:Ca (phytate:calcium) in most of the analyzed foods were at levels likely to inhibit the absorption of these minerals. Significant positive associations (p < 0.01) were found between the level of phytate and minerals in food, for zinc (r = 0.714), iron (r = 0.650) and calcium (r = 0.415). The results compared to data from USA or from Bolivia showed some discrepancies, confirming the need for more reliable data for dietary evaluations and interventions. ß 2015 Elsevier Inc. All rights reserved. * Corresponding author at: Getingeva ¨gen 60, P.O. 22100 (Box 124), Lund, Sweden. Tel.: +46 46 2224924. E-mail addresses: [email protected] (C.E. Lazarte), [email protected] (N.-G. Carlsson), [email protected] (A. Almgren), ann-sofi[email protected] (A.-S. Sandberg), [email protected] (Y. Granfeldt). Contents lists available at ScienceDirect Journal of Food Composition and Analysis jo u rn al ho m epag e: ww w.els evier .c om /lo cat e/jfc a http://dx.doi.org/10.1016/j.jfca.2014.11.015 0889-1575/ß 2015 Elsevier Inc. All rights reserved.

Welcome message from author
This document is posted to help you gain knowledge. Please leave a comment to let me know what you think about it! Share it to your friends and learn new things together.
Transcript

Journal of Food Composition and Analysis 39 (2015) 111–119
Original Research Article
Phytate, zinc, iron and calcium content of common Bolivian food,and implications for mineral bioavailability
Claudia E. Lazarte a,b,*, Nils-Gunnar Carlsson c, Annette Almgren c, Ann-Sofie Sandberg c,Yvonne Granfeldt a
a Department of Food Technology, Engineering and Nutrition, Lund University, P.O. Box 124, 22100 Lund, Swedenb Food and Natural Products Center, San Simon University, Cochabamba, Boliviac Department of Food Science, Chalmers University of Technology, S-40229 Goteborg, Sweden
A R T I C L E I N F O
Article history:
Received 26 September 2013
Received in revised form 11 November 2014
Accepted 25 November 2014
Available online 14 January 2015
Keywords:
Phytate
Anti-nutrient
Minerals
Bioavailability
Plant-based diet
Zinc
Iron
Calcium
Food analysis
Food composition
Food frequency questionnaire
Food composition database
Bolivian food composition table
Dietary intake
A B S T R A C T
The content of zinc, iron, calcium and phytate in the 16 most consumed foods from 5 villages in a tropical
rural area of Bolivia was analyzed. The food items were selected according to a completed food frequency
questionnaire. Minerals were analyzed by atomic absorption and phytates by HPIC chromatography. The
molar ratios of phytate:mineral are presented as indication of the mineral bioavailability. Within the
analyzed food, quinoa is a potential source of minerals: zinc 3.65, iron 5.40 and calcium 176 mg/100 g;
however, it also has the highest content of phytate 2060 mg/100 g. Cereals and legumes showed high
concentration of phytates (from 142 to 2070 mg/100 g), roots and tubers have lower concentrations
(from 77 to 427 mg/100 g). In general, both phytate contents and molar ratios Phy:Zn (phytate:zinc),
Phy:Fe (phytate:iron) and Phy:Ca (phytate:calcium) in most of the analyzed foods were at levels likely to
inhibit the absorption of these minerals. Significant positive associations (p < 0.01) were found between
the level of phytate and minerals in food, for zinc (r = 0.714), iron (r = 0.650) and calcium (r = 0.415). The
results compared to data from USA or from Bolivia showed some discrepancies, confirming the need for
more reliable data for dietary evaluations and interventions.
� 2015 Elsevier Inc. All rights reserved.
Contents lists available at ScienceDirect
Journal of Food Composition and Analysis
jo u rn al ho m epag e: ww w.els evier . c om / lo cat e/ j fc a
1. Introduction
In the rural areas of developing countries, the diets are mainlyplant-based with a limited amount of animal-source foods,including dairy products. These types of diet usually have a lowbioavailability of minerals (mainly zinc, iron and calcium) due tothe presence of absorption inhibitors such as phytates, tannins,oxalates and others (Lonnerdal, 2002; Sandberg, 2002). It has beenreported that phytate (myo-inositol-6-phosphate) is the maininhibitor of zinc absorption and that it affects the absorption of
* Corresponding author at: Getingevagen 60, P.O. 22100 (Box 124), Lund, Sweden.
Tel.: +46 46 2224924.
E-mail addresses: [email protected] (C.E. Lazarte),
[email protected] (N.-G. Carlsson), [email protected]
(A. Almgren), [email protected] (A.-S. Sandberg),
[email protected] (Y. Granfeldt).
http://dx.doi.org/10.1016/j.jfca.2014.11.015
0889-1575/� 2015 Elsevier Inc. All rights reserved.
other divalent minerals, mostly iron and calcium. Phytate is mainlyfound in cereal grains, legume seeds and, in a lower concentration,in tubers and roots (Connie and Srimathi, 2001; Lonnerdal, 2000,2002).
The inhibitory effect of phytates on the absorption of minerals isdue to the formation of insoluble and indigestible phytate–mineralcomplexes in the gut (Sandstrom, 1997). This negative effectdepends not only on the amount of phytate in the food, but also onthe molar ratios of phytate:mineral, which have already beenstudied, and desirable molar ratios of phytate:mineral aresuggested as an indicator of the adequate bioavailability of theminerals (Hotz and Brown, 2004; Hotz et al., 2003). The suggestedphyate:zinc molar ratio (Phy:Zn) is <15, although it has been seenthat even Phy:Zn ratios between 5 and 15 have a negative effectover the zinc bioavailability (WHO, 1996). For diets high in bothphytate and calcium, the molar ratio Phy*Ca:Zn (phytate*cal-cium:zinc) is more useful for assessing the zinc bioavailability. In
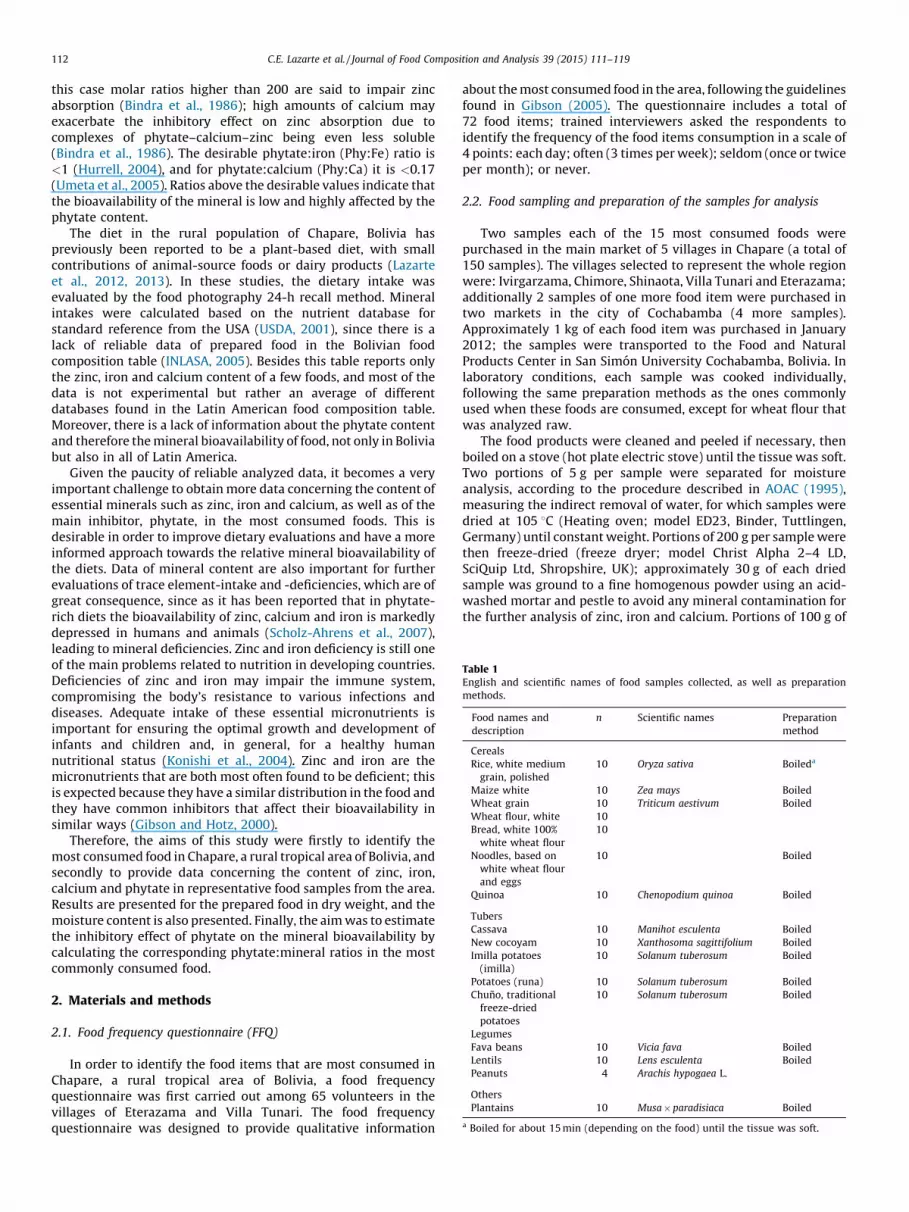
Table 1English and scientific names of food samples collected, as well as preparation
methods.
Food names and
description
n Scientific names Preparation
method
Cereals
Rice, white medium
grain, polished
10 Oryza sativa Boileda
Maize white 10 Zea mays Boiled
Wheat grain 10 Triticum aestivum Boiled
Wheat flour, white 10
Bread, white 100%
white wheat flour
10
Noodles, based on
white wheat flour
and eggs
10 Boiled
Quinoa 10 Chenopodium quinoa Boiled
Tubers
Cassava 10 Manihot esculenta Boiled
New cocoyam 10 Xanthosoma sagittifolium Boiled
Imilla potatoes
(imilla)
10 Solanum tuberosum Boiled
Potatoes (runa) 10 Solanum tuberosum Boiled
Chuno, traditional
freeze-dried
potatoes
10 Solanum tuberosum Boiled
Legumes
Fava beans 10 Vicia fava Boiled
Lentils 10 Lens esculenta Boiled
Peanuts 4 Arachis hypogaea L.
Others
Plantains 10 Musa � paradisiaca Boiled
a Boiled for about 15 min (depending on the food) until the tissue was soft.
C.E. Lazarte et al. / Journal of Food Composition and Analysis 39 (2015) 111–119112
this case molar ratios higher than 200 are said to impair zincabsorption (Bindra et al., 1986); high amounts of calcium mayexacerbate the inhibitory effect on zinc absorption due tocomplexes of phytate–calcium–zinc being even less soluble(Bindra et al., 1986). The desirable phytate:iron (Phy:Fe) ratio is<1 (Hurrell, 2004), and for phytate:calcium (Phy:Ca) it is <0.17(Umeta et al., 2005). Ratios above the desirable values indicate thatthe bioavailability of the mineral is low and highly affected by thephytate content.
The diet in the rural population of Chapare, Bolivia haspreviously been reported to be a plant-based diet, with smallcontributions of animal-source foods or dairy products (Lazarteet al., 2012, 2013). In these studies, the dietary intake wasevaluated by the food photography 24-h recall method. Mineralintakes were calculated based on the nutrient database forstandard reference from the USA (USDA, 2001), since there is alack of reliable data of prepared food in the Bolivian foodcomposition table (INLASA, 2005). Besides this table reports onlythe zinc, iron and calcium content of a few foods, and most of thedata is not experimental but rather an average of differentdatabases found in the Latin American food composition table.Moreover, there is a lack of information about the phytate contentand therefore the mineral bioavailability of food, not only in Boliviabut also in all of Latin America.
Given the paucity of reliable analyzed data, it becomes a veryimportant challenge to obtain more data concerning the content ofessential minerals such as zinc, iron and calcium, as well as of themain inhibitor, phytate, in the most consumed foods. This isdesirable in order to improve dietary evaluations and have a moreinformed approach towards the relative mineral bioavailability ofthe diets. Data of mineral content are also important for furtherevaluations of trace element-intake and -deficiencies, which are ofgreat consequence, since as it has been reported that in phytate-rich diets the bioavailability of zinc, calcium and iron is markedlydepressed in humans and animals (Scholz-Ahrens et al., 2007),leading to mineral deficiencies. Zinc and iron deficiency is still oneof the main problems related to nutrition in developing countries.Deficiencies of zinc and iron may impair the immune system,compromising the body’s resistance to various infections anddiseases. Adequate intake of these essential micronutrients isimportant for ensuring the optimal growth and development ofinfants and children and, in general, for a healthy humannutritional status (Konishi et al., 2004). Zinc and iron are themicronutrients that are both most often found to be deficient; thisis expected because they have a similar distribution in the food andthey have common inhibitors that affect their bioavailability insimilar ways (Gibson and Hotz, 2000).
Therefore, the aims of this study were firstly to identify themost consumed food in Chapare, a rural tropical area of Bolivia, andsecondly to provide data concerning the content of zinc, iron,calcium and phytate in representative food samples from the area.Results are presented for the prepared food in dry weight, and themoisture content is also presented. Finally, the aim was to estimatethe inhibitory effect of phytate on the mineral bioavailability bycalculating the corresponding phytate:mineral ratios in the mostcommonly consumed food.
2. Materials and methods
2.1. Food frequency questionnaire (FFQ)
In order to identify the food items that are most consumed inChapare, a rural tropical area of Bolivia, a food frequencyquestionnaire was first carried out among 65 volunteers in thevillages of Eterazama and Villa Tunari. The food frequencyquestionnaire was designed to provide qualitative information
about the most consumed food in the area, following the guidelinesfound in Gibson (2005). The questionnaire includes a total of72 food items; trained interviewers asked the respondents toidentify the frequency of the food items consumption in a scale of4 points: each day; often (3 times per week); seldom (once or twiceper month); or never.
2.2. Food sampling and preparation of the samples for analysis
Two samples each of the 15 most consumed foods werepurchased in the main market of 5 villages in Chapare (a total of150 samples). The villages selected to represent the whole regionwere: Ivirgarzama, Chimore, Shinaota, Villa Tunari and Eterazama;additionally 2 samples of one more food item were purchased intwo markets in the city of Cochabamba (4 more samples).Approximately 1 kg of each food item was purchased in January2012; the samples were transported to the Food and NaturalProducts Center in San Simon University Cochabamba, Bolivia. Inlaboratory conditions, each sample was cooked individually,following the same preparation methods as the ones commonlyused when these foods are consumed, except for wheat flour thatwas analyzed raw.
The food products were cleaned and peeled if necessary, thenboiled on a stove (hot plate electric stove) until the tissue was soft.Two portions of 5 g per sample were separated for moistureanalysis, according to the procedure described in AOAC (1995),measuring the indirect removal of water, for which samples weredried at 105 8C (Heating oven; model ED23, Binder, Tuttlingen,Germany) until constant weight. Portions of 200 g per sample werethen freeze-dried (freeze dryer; model Christ Alpha 2–4 LD,SciQuip Ltd, Shropshire, UK); approximately 30 g of each driedsample was ground to a fine homogenous powder using an acid-washed mortar and pestle to avoid any mineral contamination forthe further analysis of zinc, iron and calcium. Portions of 100 g of

C.E. Lazarte et al. / Journal of Food Composition and Analysis 39 (2015) 111–119 113
dried sample were transported to Sweden for the analysis ofphytate content. All the analyses were made in duplicate. Table 1presents the common names, scientific names and preparationmethods of each food.
2.3. Mineral and phytate analysis
For the mineral analysis, the chemicals used were nitric acidand hydrogen peroxide (TraceSELECT for trace analysis, FLUKASigma–Aldrich Co., St. Louis, MO, USA). To avoid interferences, allthe glassware was properly washed, immersed in 5% nitric acidsolution overnight, doubly rinsed with de-ionized water beforeuse, and non-metallic accessories were used, for example, plasticspatulas. Approximately 500 mg of each ground sample wasweighed and digested with the chemicals in Teflon vessels in amicrowave reaction system (Model Multiwave PRO, Anton PaarCo., Ashland, VA, USA). After digestion, samples were diluted to25 mL with de-ionized water. Zinc, iron and calcium werequantified by flame atomic absorption spectrometry with air–acetylene flame (Model AAnalyst 200, Perkin Elmer Corp.,Waltham, MA, USA) at 213.9, 248.3 and 422.7 nm wavelengthsfor each mineral respectively. For the calcium determination,lanthanum oxide (1%w/v) (Sigma–Aldrich Co., St. Louis, MO, USA)was added to standards and samples before analysis in order tosuppress phosphorus interference.
A calibration curve of 5 points was prepared for each mineral(100–2000 mg/l) from certified Atomic Absorption Standardsolutions (1000 ppm) (Pure standards for atomic absorption,Perkin-Elmer Corp., Waltham, MA, USA). The limit of detectionwas from 15–30 mg/l for zinc and iron and 60–80 mg/l for calcium.To validate the analysis, certified reference materials for traceelements BCR1 were used: rice flour (IRMM 804 FLUKA Sigma–Aldrich Co., St. Louis, MO, USA), for zinc the certified value is23.1 � 1.9 mg/kg and the analyzed was 22.8 � 0.5 mg/kg and bovineliver (BCR185R FLUKA Sigma–Aldrich Co., St. Louis, MO, USA), wherethe certified value for zinc is 138.6 � 2.1 mg/kg and the analyzed was136.1 � 3.2 mg/kg.
For quality control: in each batch of microwave digestion(16 Teflon vessels), one vessel was used for digestion of a certifiedreference material, and one vessel was used as a blank analysis,containing the nitric acid and peroxide hydrogen but not thesamples; these were digested together with the food samplescontained in the other14 vessels. The mineral content of thereference materials and blanks was determined by atomicabsorption at the same time as the food samples to check theprecision and accuracy of the procedures. Two standards from thestandard curve were controlled after each ten measurements. Therelative standard deviation (RSD %) was below 5% for eachmeasurement.
Phytate was analyzed as inositol hexaphosphate InsP6, in all ofthe samples, by high-performance ion chromatography (HPIC)according to the method described by Carlsson et al. (2001). Ap-proximately 500 mg of the samples previously dried and groundwere weighed and extracted with 0.5 M HCl for 3 h at roomtemperature (20 8C) under magnetic stirring. The extracts werefrozen overnight, thawed and centrifuged at 12,000 � g for 10 min;the supernatants were decanted, and 50 mL of supernatants wereinjected and analyzed by HPIC with a HPIC Omni Pac PAX-100(4 mm � 250 mm) analytical column, and a PAX-100(4 mm � 50 mm) guard-column (Columns from Dionex Corp.,Sunnyvale, CA, USA). The inositol phosphates were detected andquantified after a post-column reaction with Fe(NO3)3�9H2O(Sigma–Aldrich Co., St. Louis, MO, USA), the absorbance wasmonitored at 290 nm using UV detection (Waters 486, tunableabsorbance detector, Massachusetts, USA). All the regents wereof analytical grade (Sigma–Aldrich Co., St. Louis, MO, USA), and
de-ionized water was used. The limit of detection of the methodwas previously detected as13 mg/100 g (Carlsson et al., 2001).
The results of zinc, iron, calcium and phytate concentrations ineach of the analyzed food items are presented on dry weight (DW)basis as the mean � SD (mg/100 g DW), and the moisture content aspercentage is also presented for each food.
2.4. Estimation of relative mineral bioavailability
In order to estimate the relative bioavailability of zinc, iron andcalcium and to give an indication of the inhibitory effect ofphytates on the bioavailability of these minerals in the food items,the molar ratios Phy:Zn, Phy:Fe, Phy:Ca and Phy*Ca:Zn werecalculated. As molecular weight of phytate 660.3 g/mol was used.
3. Results
3.1. Food frequency questionnaire (FFQ)
The food consumption frequencies of animal-source food,cereals, tubers and legumes are presented in Figs. 1–4; the barsindicate the type of food and the percentages of consumption at thelevels of: each day, often, seldom and never. The most commonanimal-source food was egg, followed by chicken and beef (Fig. 1).The consumption of dairy foods was very low, only 9% of thevolunteers consumed milk often, none of them each day.
The most consumed cereal products (Fig. 2) were rice andbread; the first seven food items (rice, bread, noodles, maize, wheatflour, wheat grain and quinoa) from this group were selected forthe mineral and phytate analysis. The most consumed tubers androots (Fig. 3) were potatoes (2 varieties, imilla and runa), cassava,new cocoyam and chuno; all of these were selected for analysis.Regarding legumes (Fig. 4): fava beans, lentils and peanuts werethe most consumed, and selected for analysis. Additionalinformation about the frequency of consumption of vegetables,fruits and types of fat is presented in Table 2. Of these foods,plantain was selected for the analysis, because it is highlyconsumed and the portion size consumed is bigger compared tothat of the other vegetables or fruits; besides, it is produced in thetropical area.
3.2. Mineral and phytate analysis
The results of, zinc, iron, calcium and phytate content in dryweight and moisture percentages are presented in Table 3. The zinccontent was the highest in legumes: fava beans, lentils and peanuts(3.33–4.64 mg/100 g), followed by cereals: quinoa, wheat grain,maize, noodles, wheat flour, rice (1.52–3.65 mg/100 g) and, finally,bread (1.00 mg/100 g). Among the tubers, new cocoyam (2.32 mg/100 g) had the highest amount of zinc followed by cassava(1.48 mg/100 g). The content of zinc in potatoes was low, and thelowest in chuno (0.94–1.13 mg/100 g).
Iron concentration was the highest in lentils and quinoa(6.43 and 5.40 mg/100 g), followed by the content in wheat flour,which was comparable to the content in bread, noodles, fava beansand peanuts (2.54–5.24 mg/100 g). Among the tubers, the highestiron content was found in chuno (2.14 mg/100 g) followed by newcocoyam, and then potatoes, and the lowest was to be found incassava (0.83–1.84 mg/100 g).
Calcium content was the highest in bread and quinoa (176–187 mg/100 g); the other cereals: noodles, wheat grain, wheatflour, rice and maize had lower values (21–87 mg/100 g). Thecalcium content in lentils and fava beans (115–131 mg/100 g) wassimilar to the content in chuno, new cocoyam and cassava (93–120 mg/100 g). Peanuts had a lower content (50 mg/100 g) and the

82
64
53
47
38
23
13
9
9
9
2
18
36
47
49
62
73
67
64
84
84
36
100
89
69
67
56
33
9
4
4
20
27
7
7
62
11
31
33
44
67
91
0 10 20 30 40 50 60 70 80 90 100
Eggs
Chicken
Chick en giblets
Dry beef meat
Beef meat
Sardine
Tuna
Fish
Milk-powder
Chee se
Milk-liquid
Beef liver
Pork
Beef heart
Lamb
Wil d pork
Yogurth
Minced meat
Food con sumption (%)
Each day Often Seldom Never
Fig. 1. Frequency of animal-source food consumption.
C.E. Lazarte et al. / Journal of Food Composition and Analysis 39 (2015) 111–119114
lowest was found in the two varieties of potatoes and plantain (28–37 mg/100 g).
The highest phytate content was found in cereals: quinoa,wheat grain, maize (1020–2060 mg/100 g) and legumes: peanuts,fava beans and lentils (846–2070 mg/100 g). The phytate level waslower in noodles, wheat flour, rice and bread (99–468 mg/100 g).Regarding tubers, the highest phytate content was found in newcocoyam (427 mg/100 g), followed by potato runa, cassava andpotato imilla (77–207 mg/100 g); the phytate in chuno (58 mg/100 g) was the lowest in this group. Phytate content in plantainwas the lowest of all (22 mg/100 g).
3.3. Relative mineral bioavailability
The molar ratios, Phy:Zn, Phy:Fe, Phy:Ca and Phy*Ca:Zn arepresented in Table 4. Five out of seven cereal foods had molar ratiosof Phy:Zn above the critical molar ratio 15 (WHO, 1996), quinoabeing the highest among the cereals Phy:Zn (56.5 � 9.3), followed
Fig. 2. Frequency of cereals consumption.
by wheat grain (51.5 � 8.6), and only white bread and rice had Phy:Znratios below 15. All legumes had Phy:Zn above 15, with the highestfor peanuts (61.5 � 1.4). Regarding tubers: new cocoyam and potatoruna were above 15, but not potato imilla, chuno or cassava;regarding the legumes: fava beans and lentils were above 15. Fur-thermore, according to the molar ratios Phy*Ca:Zn, the phytate levelin white bread is also likely to compromise the zinc absorption withmolar ratios >200 (Bindra et al., 1986); only rice, potato imilla, chunoand plantain showed Phy*Ca:Zn below 200. This point to that the zincbioavailability in most of the analyzed food is compromised by thephytate content.
None of the analyzed food items showed molar ratios of Phy:Febelow 1, the level which is said to be adequate for iron absorption(Hurrell, 2004). The highest Phy:Fe ratios were for peanuts(68.8 � 2.4), maize (44.4 � 4.2), wheat grain (36.7 � 8.1) and quinoa(33.3 � 8.0), indicating that iron absorption from these foods mightbe significantly inhibited by phytate content. Regarding the molarratios of Phy:Ca, ten out of the fifteen food items had Phy:Ca valuesabove the critical molar ratio 0.17 (Umeta et al., 2005); the highestwere found in maize (3.01 � 0.61), peanuts (2.50 � 0.16), wheat grain(1.46 � 0.38) and quinoa (0.72 � 0.14). Thus, the phytate content inmost of the analyzed food was at levels likely to compromiseabsorption of zinc, iron and calcium markedly.
Fig. 3. Frequency of tubers and roots consumption.
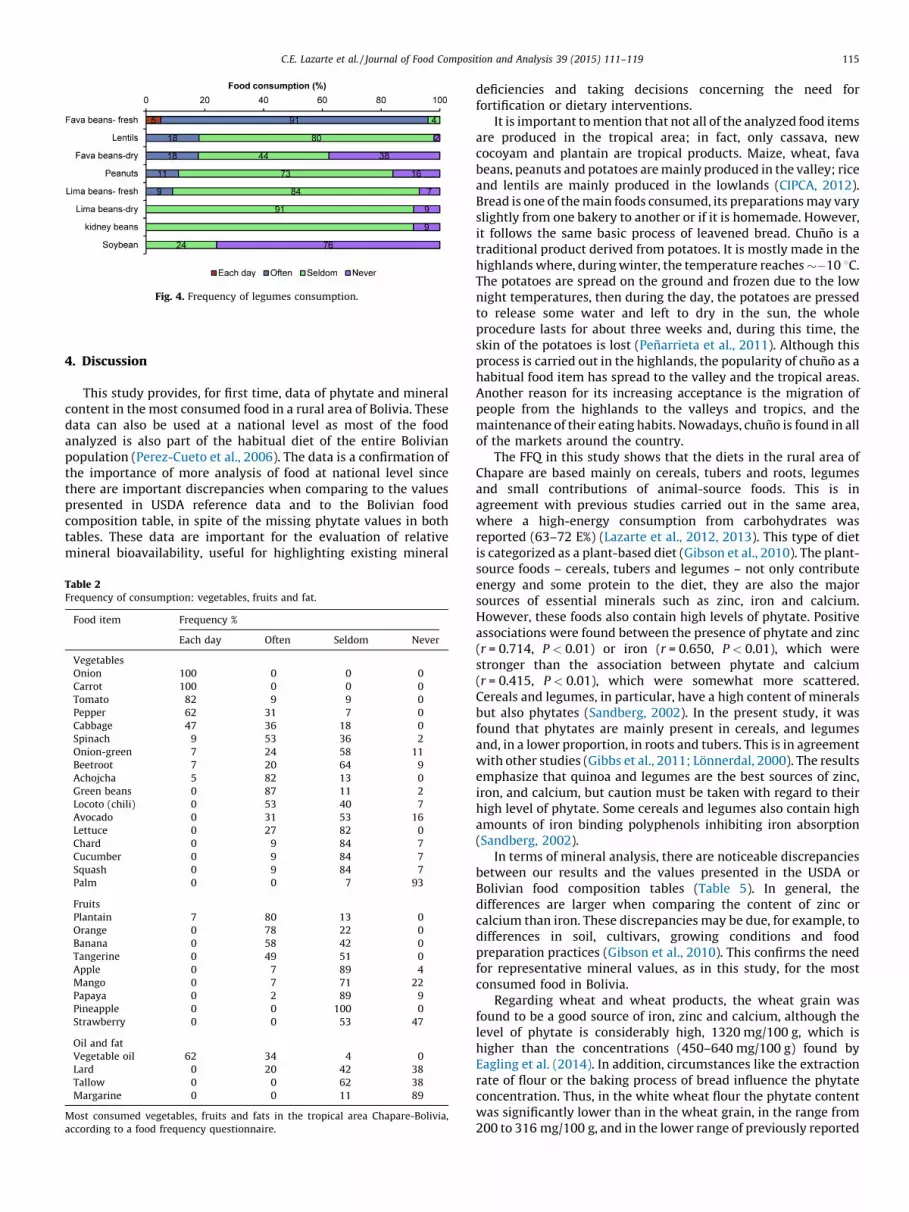
Fig. 4. Frequency of legumes consumption.
C.E. Lazarte et al. / Journal of Food Composition and Analysis 39 (2015) 111–119 115
4. Discussion
This study provides, for first time, data of phytate and mineralcontent in the most consumed food in a rural area of Bolivia. Thesedata can also be used at a national level as most of the foodanalyzed is also part of the habitual diet of the entire Bolivianpopulation (Perez-Cueto et al., 2006). The data is a confirmation ofthe importance of more analysis of food at national level sincethere are important discrepancies when comparing to the valuespresented in USDA reference data and to the Bolivian foodcomposition table, in spite of the missing phytate values in bothtables. These data are important for the evaluation of relativemineral bioavailability, useful for highlighting existing mineral
Table 2Frequency of consumption: vegetables, fruits and fat.
Food item Frequency %
Each day Often Seldom Never
Vegetables
Onion 100 0 0 0
Carrot 100 0 0 0
Tomato 82 9 9 0
Pepper 62 31 7 0
Cabbage 47 36 18 0
Spinach 9 53 36 2
Onion-green 7 24 58 11
Beetroot 7 20 64 9
Achojcha 5 82 13 0
Green beans 0 87 11 2
Locoto (chili) 0 53 40 7
Avocado 0 31 53 16
Lettuce 0 27 82 0
Chard 0 9 84 7
Cucumber 0 9 84 7
Squash 0 9 84 7
Palm 0 0 7 93
Fruits
Plantain 7 80 13 0
Orange 0 78 22 0
Banana 0 58 42 0
Tangerine 0 49 51 0
Apple 0 7 89 4
Mango 0 7 71 22
Papaya 0 2 89 9
Pineapple 0 0 100 0
Strawberry 0 0 53 47
Oil and fat
Vegetable oil 62 34 4 0
Lard 0 20 42 38
Tallow 0 0 62 38
Margarine 0 0 11 89
Most consumed vegetables, fruits and fats in the tropical area Chapare-Bolivia,
according to a food frequency questionnaire.
deficiencies and taking decisions concerning the need forfortification or dietary interventions.
It is important to mention that not all of the analyzed food itemsare produced in the tropical area; in fact, only cassava, newcocoyam and plantain are tropical products. Maize, wheat, favabeans, peanuts and potatoes are mainly produced in the valley; riceand lentils are mainly produced in the lowlands (CIPCA, 2012).Bread is one of the main foods consumed, its preparations may varyslightly from one bakery to another or if it is homemade. However,it follows the same basic process of leavened bread. Chuno is atraditional product derived from potatoes. It is mostly made in thehighlands where, during winter, the temperature reaches ��10 8C.The potatoes are spread on the ground and frozen due to the lownight temperatures, then during the day, the potatoes are pressedto release some water and left to dry in the sun, the wholeprocedure lasts for about three weeks and, during this time, theskin of the potatoes is lost (Penarrieta et al., 2011). Although thisprocess is carried out in the highlands, the popularity of chuno as ahabitual food item has spread to the valley and the tropical areas.Another reason for its increasing acceptance is the migration ofpeople from the highlands to the valleys and tropics, and themaintenance of their eating habits. Nowadays, chuno is found in allof the markets around the country.
The FFQ in this study shows that the diets in the rural area ofChapare are based mainly on cereals, tubers and roots, legumesand small contributions of animal-source foods. This is inagreement with previous studies carried out in the same area,where a high-energy consumption from carbohydrates wasreported (63–72 E%) (Lazarte et al., 2012, 2013). This type of dietis categorized as a plant-based diet (Gibson et al., 2010). The plant-source foods – cereals, tubers and legumes – not only contributeenergy and some protein to the diet, they are also the majorsources of essential minerals such as zinc, iron and calcium.However, these foods also contain high levels of phytate. Positiveassociations were found between the presence of phytate and zinc(r = 0.714, P < 0.01) or iron (r = 0.650, P < 0.01), which werestronger than the association between phytate and calcium(r = 0.415, P < 0.01), which were somewhat more scattered.Cereals and legumes, in particular, have a high content of mineralsbut also phytates (Sandberg, 2002). In the present study, it wasfound that phytates are mainly present in cereals, and legumesand, in a lower proportion, in roots and tubers. This is in agreementwith other studies (Gibbs et al., 2011; Lonnerdal, 2000). The resultsemphasize that quinoa and legumes are the best sources of zinc,iron, and calcium, but caution must be taken with regard to theirhigh level of phytate. Some cereals and legumes also contain highamounts of iron binding polyphenols inhibiting iron absorption(Sandberg, 2002).
In terms of mineral analysis, there are noticeable discrepanciesbetween our results and the values presented in the USDA orBolivian food composition tables (Table 5). In general, thedifferences are larger when comparing the content of zinc orcalcium than iron. These discrepancies may be due, for example, todifferences in soil, cultivars, growing conditions and foodpreparation practices (Gibson et al., 2010). This confirms the needfor representative mineral values, as in this study, for the mostconsumed food in Bolivia.
Regarding wheat and wheat products, the wheat grain wasfound to be a good source of iron, zinc and calcium, although thelevel of phytate is considerably high, 1320 mg/100 g, which ishigher than the concentrations (450–640 mg/100 g) found byEagling et al. (2014). In addition, circumstances like the extractionrate of flour or the baking process of bread influence the phytateconcentration. Thus, in the white wheat flour the phytate contentwas significantly lower than in the wheat grain, in the range from200 to 316 mg/100 g, and in the lower range of previously reported

Table 3Zinc, iron, calcium and phytate contents of main food consumed in Chapare-Bolivia, mean � SD (min. to max.) in dry weight (DW).
Food item n Moisture g/100 g Zinc mg/100 g Iron mg/100 g Calcium mg/100 g Phytate mg/100 g
Wheat grain 10 66.0 � 3.4 2.56 � 0.24 3.24 � 1.09 57 � 10 1320 � 140
(2.27–2.98) (2.19–5.16) (45–74) (1170–1620)
Wheat flour 10 8.6 � 1.0 1.52 � 0.22 5.24 � 0.57 51 � 4 272 � 41
(1.15–1.78) (4.59–6.31) (47–58) (200–316)
White bread 10 21.0 � 1.4 1.00 � 0.09 5.11 � 0.30 187 � 47 99 � 20
(0.89–1.16) (4.45–5.43) (142–248) (78–134)
Maize 10 58.2 � 3.5 2.42 � 0.39 1.96 � 0.44 21 � 6 1020 � 180
(2.02–3.16) (1.57–2.72) (17–28) (880–1420)
Rice 10 66.5 � 3.5 1.64 � 0.17 0.49 � 0.45 27 � 15 142 � 35
(1.33–1.82) (0.42–0.55) (15–56) (86–190)
Noodles 10 64.8 � 2.0 1.77 � 0.43 4.92 � 1.36 87 � 5 468 � 47
(1.18–2.28) (3.20–7.34) (84–97) (369–524)
Quinoa 10 73.1 � 2.3 3.65 � 0.32 5.40 � 0.84 176 � 19 2060 � 230
(3.13–4.12) (3.95–6.27) (144–200) (1530–2280)
Cassava 10 69.0 � 2.2 1.48� 0.25 0.83 � 0.06 93 � 11 199 � 70
(1.19–1.93) (0.74–0.94) (71–110) (115–312)
New cocoyam 10 70.7 � 1.2 2.32 � 0.82 1.84 � 0.47 113 � 65 427 � 95
(1.74–3.96) (1.31–2.54) (72–236) (275–528)
Potato imilla 10 74.2 � 1.6 1.03 � 0.13 1.50 � 0.35 37 � 9 77 � 29
(0.82–1.19) (0.83–1.73) (25–48) (59–136)
Potato runa 10 77.0 � 1.8 1.13 � 0.19 1.66 � 0.23 37 � 13 207 � 75
(0.92–1.44) (1.45–2.17) (19–58) (110–333)
Chuno 10 74.0 � 3.4 0.94 � 0.16 2.14 � 0.50 120 � 36 58 � 8
(0.75–1.30) (1.22–2.68) (75–173) (47–75)
Fava beans 10 75.0 � 1.7 4.64 � 0.55 4.71 � 0.47 115 � 21 1170 � 320
(3.83–5.54) (3.91–5.56) (83–140) (840–1690)
Lentils 10 62.6 � 3.4 3.49 � 0.35 6.43 � 0.18 131 � 18 846 � 82
(3.03–4.02) (6.11–6.67) (109–164) (747–961)
Peanuts 4 3.64 � 0.5 3.33 � 0.30 2.54 � 0.25 50 � 2 2070 � 220
(3.04–3.60) (2.28–2.76) (48–52) (1860–2310)
Plantain 10 71.7 � 2.0 0.75 � 0.34 1.36 � 0.29 41 � 8 22 � 6
(0.56–1.43) (1.10–1.84) (28–52) (17–36)
Table 4Molar ratios of phytate*calcium to zinc and phytate to zinc, iron and calcium in
most consumed plant-food in Chapare-Bolivia, mean � SD (min. to max.), in dry
weight (DW).
Food item Phy*Ca:Zn Phy:Zn Phy:Fe Phy:Ca
Wheat grain 729 � 162 51.5 � 8.6 36.7 � 8.1 1.46 � 0.38
(1060–2020) (42.5–67.9) (25.6–47.2) (1.04–2.16)
Wheat flour 226 � 21 17.7 � 1.3 4.4 � 0.9 0.32 � 0.06
(401–509) (15.5–20.2) (2.9–5.6) (0.21–0.38)
White bread 458 � 166 9.8 � 1.9 1.6 � 0.4 0.03 � 0.01
(323–774) (6.7–12.5) (1.2–2.4) (0.02–0.05)
Maize 222 � 62 41.8 � 4.5 44.4 � 4.2 3.01 � 0.61
(303–662) (35.8–49.9) (37.4–49.3) (2.00–3.76)
Rice 53 � 21 8.5 � 1.6 24.9 � 7.0 0.41 � 0.23
(38–101) (5.7–10.7) (13.3–34.2) (0.09–0.73)
Noodles 611 � 151 27.4 � 6.0 8.7 � 2.7 0.32 � 0.03
(441–856) (20.7–37.0) (4.5–12.6) (0.26–0.36)
Quinoa 2470 � 340 56.5 � 9.3 33.3 � 8.0 0.72 � 0.14
(1890–2880) (40.2–69.6) (20.6–47.0) (0.49–0.96)
Cassava 311 � 107 13.5 � 4.8 20.5 � 8.1 0.13 � 0.05
(121–491) (7.8–20.4) (11.7–35.5) (0.07–0.21)
New cocoyam 506 � 210 20.1 � 7.3 21.6 � 8.8 0.30 � 0.14
(212–895) (8.3–28.4) (9.6–31.3) (0.07–0.41)
Potato imilla 71 � 35 7.3 � 2.3 4.59 � 1.94 0.13 � 0.03
(40–134) (5.2–11.9) (2.9–7.1) (0.08–0.18)
Potato runa 179 � 119 18.4 � 6.5 10.3 � 2.4 0.37 � 0.16
(68–545) (9.50–29.0) (6.2–14.1) (0.15–0.65)
Chuno 181 � 45 6.3 � 1.7 2.4 � 0.8 0.03 � 0.01
(122–258) (4.1–9.4) (1.6–3.7) (0.02–0.06)
Fava beans 717 � 208 25.3 � 7.1 21.0 � 4.5 0.66 � 0.27
(972–2070) (17.4–35.6) (15.7–26.6) (0.37–1.04)
Lentils 791 � 142 24.2 � 2.9 11.1 � 0.9 0.40 � 0.07
(1240–2120) (18.5–27.8) (9.8–12.2) (0.29–0.50)
Peanuts 772 � 48 61.5 � 1.4 68.8 � 2.4 2.50 � 0.16
(726–828) (60.7–63.6) (66.2–71.0) (2.32–2.69)
Plantain 35 � 17 3.4 � 1.6 1.4 � 0.4 0.03 � 0.01
(11–61) (1.2–6.2) (0.8–1.9) (0.02–0.05)
C.E. Lazarte et al. / Journal of Food Composition and Analysis 39 (2015) 111–119116
values for phytate in wheat flour (154–1750 mg/100 g) (Febleset al., 2002; Garcıa-Estepa et al., 1999). The high variabilitybetween different wheat flours is above all attributed to theextraction rate of the flours, as phytate is mainly distributed in theexternal covers, in the pericarp and in the aleurone layer of thewheat; a process like dehulling effectively removes significantamounts of phytates (Majzoobi et al., 2014; Salunke et al., 2012).
However, during dehulling not only phytate is lost but also animportant amount of minerals. Thus, white wheat flour, forexample, had 40% less zinc than wheat grain. The reason why theiron content was higher in the white wheat flour compared to thewhole wheat grain is that, due to the fortification policies inBolivia, wheat flour must be fortified with iron at a level of 6 mg/100 g (David, 2004). Therefore, Phy:Fe in white wheat flour was asmuch as 88% lower than in wheat grain. Also, the Phy:Zn andPhy:Ca ratios were lower by 66% and 78% respectively, anindication of a higher mineral bioavailability. Notwithstanding,this reduction in phytate:mineral levels was not enough to reachadequate ratios (Table 3), and wheat flour is also considered a foodwith low mineral bioavailability.
The concentration of phytate in white wheat bread (99 mg/100 g)was 63% lower than in the white wheat flour (272 mg/100 g); theseresults are in agreement with previous studies. Ma et al. (2005)reported the phytate concentrations in wheat bread (29.1 mg/100 g)to be 89% lower than in wheat flour (217.87 mg/100 g) and Garcıa-Estepa et al. (1999) showed a reduction of 50% (from 298 to 148 mg/100 g) of phytate during the bread making process. The phytatereduction during the breadmaking procedure is attributed toendogenous phytase activity of the wheat flour, which is influencedby acidity of the dough and the temperature and to a minor extent onthe action of yeast phytase (Turk and Sandberg, 1992). Withsourdough fermentation it is possible to obtain an almost completedegradation of phytate (Larsson and Sandberg, 1991).
Table 5Comparison of zinc, iron and calcium analyzed in the selected food with values in the nutrient database for standard reference USDA and with the Bolivian food composition
table, in dry weight (DW).
Food items Zinc
analyzed
Zinc USDAa Zinc BFCTb Iron
analyzed
Iron USDA Iron BFCT Calcium
analyzed
Calcium
USDA
Calcium
BFCT
Wheat grain (mg/100 g) 2.56 3.68 (�30) 4.16 (�39) 3.24 5.04 (�36) 3.00 (8) 57 35 (61) 59 (�3)
Wheat flour (mg/100 g) 1.52 0.80 (90) 0.60 (153) 5.24 5.27 (�1) 6.53 (�20) 51 17 (202) 63 (�18)
White bread (mg/100 g) 1.00 1.88 (�47) 2.00 (�50) 5.11 5.38 (�5) 4.00 (28) 187 221 (�16) 46 (302)
Maize (mg/100 g) 2.42 2.47 (�2) 2.00 (21) 1.96 3.02 (�35) 2.80 (�30) 21 8 (174) 13 (60)
Rice (mg/100 g) 1.64 1.34 (22) 1.16 (41) 0.49 4.75 (�90) 1.45 (�66) 27 10 (180) 13 (107)
Noodles (mg/100 g) 1.77 2.01 (�12) 1.00 (77) 4.92 4.56 (8) 3.50 (41) 89 37 (138) 60 (48)
Quinoa (mg/100 g) 3.65 3.83 (�5) 3.10 (18) 5.40 5.25 (3) 5.70 (�5) 176 60 (195) 134 (31)
Cassava (mg/100 g) 1.67 0.84 (99) 0.50 (234) 0.83 1.80 (�54) 1.36 (�39) 93 40 (135) 135 (�30)
New cocoyam (mg/100 g) 2.32 – – 1.84 – – 113 – –
Potato imilla (mg/100 g) 1.03 1.20 (�14) 0.40 (158) 1.50 1.38 (9) 1.23 (22) 37 36 (5) 36 (2.5)
Potato runa (mg/100 g) 1.13 – – 1.66 – 1.00 (66) 37 – 46 (�19)
Chuno (mg/100 g) 0.94 1.45 (�35) 0.30 (213) 2.14 4.88 (�56) 0.99 (116) 120 41 (194) 51 (134)
Fava beans (mg/100 g) 4.64 3.55 (31) 0.70 (563) 4.71 5.27 (�11) 3.20 (47) 115 127 (�9) 115 (0)
Lentils (mg/100 g) 2.49 4.18 (�40) 1.40 (78) 6.43 10.97 (�41) 3.76 (71) 131 63 (109) 74 (78)
Peanuts (mg/100 g) 3.33 3.36 (�1) 2.93 (14) 2.54 3.23 (�21) 2.29 (11) 50 55 (�8) 54 (�6)
Plantain (mg/100 g) 0.75 0.40 (88) 0.20 (275) 1.36 1.77 (�23) 0.90 (51) 46 6 (648) 18 (161)
Data in mg/100 g and percentage of the difference in parenthesis. Calculated as: (value from the analysis � value from the table) � 100/value from the table.a USDA, food composition for cooked food, except cassava that is raw, data extracted from the standard reference from USA (USDA, 2001).b BFCT, food composition for raw food, data extracted from the Bolivian food composition table (INLASA, 2005).
C.E. Lazarte et al. / Journal of Food Composition and Analysis 39 (2015) 111–119 117
Regarding the mineral content in bread, there is a noticeablyhigher content of calcium in bread (187 mg/100 g) compared to thecontent in flour (51 mg/100 g), but we do not know for sure thecalcium content in the wheat flour used in the different bakeriesnor the recipes. As expected, the molar ratios phytate:mineralwere lower in bread compared to wheat flour; thus, Phy:Zn was45% lower, Phy:Fe was 63% lower and Phy:Ca 91% lower in bread,but the ratio of Phy*Ca:Zn was double. The decrease of the molarratios of zinc and calcium in bread suggests that the absorption ofzinc and calcium might not be highly affected by the phytateconcentration, while the Phy:Fe, even though it is lower in bread, itis still on a high enough level to compromise the absorption of iron.A virtually complete degradation of phytate is required tosubstantially improve iron absorption from bread meals (Bruneet al., 1992). The molar ratios for noodles, another derived productfrom wheat flour, are also above the critical levels; Phy:Zn was27.4, and Phy:Fe and Phy:Ca 8.7 and 0.32 respectively. These valuesare similar to those previously reported by Ma et al. (2005): 19.8,7.2 and 0.35 respectively.
The concentration of phytate in maize was high, 1020 mg/100 g; similar results were reported by other authors: 1443 mg/100 g (Abebe et al., 2007) and 744.6 mg/100 g (Chan et al., 2007).Maize had the highest molar ratios: Phy:Zn 41.8, Phy:Fe 44.4 andPhy:Ca 3.01 among the cereals, and high molar ratios were alsoreported in previous studies, Phy:Zn 35.4, Phy:Fe 27.8 and Phy:Ca5.45 (Abebe et al., 2007), indicating that the mineral absorption inmaize is highly inhibited by the level of phytate.
The concentrations of phytate in rice were the lowest foundamong the cereals: 142 mg/100 g, which is within the phytateconcentrations found by Ma et al. (2005) in 3 varieties of rice (92–183 mg/100 g). The Phy:Zn 8.5 was below the critical value, butPhy:Fe 24.9 and Phy:Ca 0.41 were above the critical values; similarratios were reported previously for Phy:Zn (range 8.29–11.27), buthigher values were found for Phy:Fe (range 40.46–69.67) andPhy:Ca (range 1.18–4.32) (Ma et al., 2005).
Quinoa is a potential source of minerals: zinc 3.65, iron 5.40 andcalcium 176 mg/100 g; these values are within the rangespreviously presented for six varieties of quinoa in Chile: for zinc(2.73–5.01 mg/100 g), iron (4.82–7.19 mg/100 g) and calcium(77.10–211.9 mg/100 g) (Miranda et al., 2012). The level ofphytates in quinoa was the highest among the cereals analyzedin the present study (ranged from 1530 to 2280 mg/100 g).Therefore, the molar ratios were high above the critical values:
Phy:Zn 56.5, Phy:Fe 33.3, Phy:Ca 0.72. There is a scarcity of recentdata on the concentration of phytates in quinoa, or on molar ratios,Ruales and Nair (1993) reported phytate concentrations forunpolished quinoa grain (1004 mg/100 g) and polished quinoagrain (780 mg/100 g), it is noticeable that the values obtained inthe present study are 2 times higher than those previouslyreported. Some reasons for these discrepancies are the origin of theplant-food, the different cultivars, variations in the mineralcontent in the soil and others; besides, the quantification methodused in the reference was colorimetric, whereas here we used anHPIC method, well known for its higher sensitivity and accuracy.
Regarding phytates in legumes: peanuts had the highest level(2070 mg/100 g); results are in agreement with earlier reports of2008 mg/100 g, with high Phy:Zn 60 (Harland et al., 2004), buthigher than those reported by Chan et al. (2007) or Mitchikpe et al.(2008) from 483 to 667 mg/100 g. The Phy:Zn in the present studywas also very high (61.5), as well as the values of Phy:Fe (68.8) andPhy:Ca (2.50). Phytate contents in lentils (846 mg/100 g) aresimilar to those reported for four cultivars of lentils (910 mg/100 g)(Wang and Daun, 2006).
Regarding the phytate content in tubers, the highest value wasfound in the tropical tuber new cocoyam (275–528 mg/100 g),followed by cassava (115–312); these ranges show high variabilitybetween the tropical tubers collected from the 5 different villagesof Chapare. It is likely that the soil in these areas also presents highmineral variability. Furthermore, data from the literature showwide discrepancies in the phytate concentration in tropical tubers.Similar species to new cocoyam, are yam and taro (cocoyam) lowerphytate concentrations were reported for these tubers in the rangeof 63–105 mg/100 g (Umeta et al., 2005); on the other hand, highervalues were also reported in the range of 637–855 mg/100 g(Marfo et al., 1990). Phytate content in cassava also varies widelyfrom 95 to 624 mg/100 g (Charles et al., 2005; Marfo et al., 1990);the method of analysis used in these references was colorimetric.However, Mitchikpe et al. (2008) reported no detectable values forcassava and yam (in dried chips) in Nothern Benin by the HPICmethod. Thus, for tubers and roots where the composition will behighly affected by the soil, is not possible to use general values ofphytate content, as the variation is high.
Phytate content was the lowest in potatoes: imilla (77 mg/100 g) and runa (207 mg/100 g). Moreover, here we present thefirst data of phytate content in the traditional freeze sun-driedpotato named chuno, which resulted in a content between 25 and

C.E. Lazarte et al. / Journal of Food Composition and Analysis 39 (2015) 111–119118
72% lower than that found in potatoes. However, it is unknownwhether the same varieties of potato were used to prepare thechuno samples that were analyzed. This calls attention to thetraditional process of obtaining chuno that can be considered as adietary strategy to reduce the phytate content in potatoes andother tubers. Therefore, it is interesting to consider furtherresearch to evaluate the actual phytate reduction during thechuno process. Regarding the mineral content in chuno, it is alsoexpected that some minerals would be lost during the process byleaking with the water, which might be the same via for phytatelosses. The results showed that zinc concentration in chuno(0.94 mg/100 g) was lower than in potatoes (1.03–1.13 mg/100 g),but iron is approximately 2 times higher (increases from 1.50 to2.14 mg/100 g) and calcium 3 times higher (increases from 37 to120 mg/100 g) than the concentration in potatoes. These resultsare in agreement with those found by Burgos et al. (2009),reporting that during chuno processing there was a decrease inzinc concentration (from 2.15 to 0.45 mg/100 g), and an increase iniron concentration (from 2.37 to 2.80 mg/100 g) as well as incalcium (from 32.27 to 121.05 mg/100 g) in dry weight. Theincrease in mineral content may be due to soil contaminationduring the process.
5. Conclusion
It is of great importance to take into account the phytatecontent of foods when conducting dietary evaluations and furtherdietary interventions. As indicated in the present paper, within theBolivian diet there are foods considered good sources of minerals,such as quinoa, wheat, maize and legumes. However, caution mustbe taken with the high concentrations of phytate, which mightsignificantly decrease the bioavailability of zinc, iron and calciumas it is shown by the molar ratios. Phytate may be one of the mainfactors leading to deficiencies of zinc and iron, especially inpopulations where these plant foods are an important part of thediet. Therefore, nutritional strategies including germination,soaking or fermentation are advised as they have been provedto reduce the content of phytate and enhance the mineralbioavailability (Sandberg and Andlid, 2002). These proceduresare important, not only in Chapare, but also in other rural areas indeveloping countries, where animal sources of food are limited.
Acknowledgement
Financial support from the Swedish International DevelopmentAgency (SIDA/SAREC) (SIDA grant number: 7500707702) isgratefully acknowledged.
References
Abebe, Y., Bogale, A., Hambidge, K.M., Stoecker, B.J., Bailey, K., Gibson, R.S., 2007.Phytate, zinc, iron and calcium content of selected raw and prepared foodsconsumed in rural Sidama, Southern Ethiopia, and implications for bioavail-ability. J. Food Compos. Anal. 20 (3–4), 161–168.
AOAC, 1995. Official Methods of Analysis of the Association of Official AnalyticalChemists, 16th ed. Association of Analytical Communities, Arlington, VA, USA.
Bindra, G.S., Gibson, R.S., Thompson, L.U., 1986. [Phytate][calcium]/[zinc] ratios inAsian immigrant lacto-ovo vegetarian diets and their relationship to zincnutriture. Nutr. Res. 6 (5), 475–483.
Brune, M., Rossander-Hulten, L., Hallberg, L., Gleerup, A., Sandberg, A.-S., 1992. Ironabsorption from bread in humans: inhibiting effects of cereal fiber, phytate andinositol phosphates with different numbers of phosphate groups. J. Nutr. 122(3), 442–449.
Burgos, G., de Haan, S., Salas, E., Bonierbale, M., 2009. Protein, iron, zinc and calciumconcentrations of potatoes following traditional processing as chuno. J. FoodCompos. Anal. 22 (6), 617–619.
Carlsson, N.G., Bergman, E.L., Skoglund, E., Hasselblad, K., Sandberg, A.S., 2001. Rapidanalysis of inositol phosphates. J. Agric. Food Chem. 49 (4), 1695–1701.
CIPCA., 2012. Centro de Integracion y Produccion del Campesinato. La Paz, Bolivia.Connie, W., Srimathi, K., 2001. Phytate and Mineral Bioavailability, Food Phytates.
CRC Press.
Chan, S.S.L., Ferguson, E.L., Bailey, K., Fahmida, U., Harper, T.B., Gibson, R.S., 2007.The concentrations of iron, calcium, zinc and phytate in cereals and legumeshabitually consumed by infants living in East Lombok, Indonesia. J. FoodCompos. Anal. 20 (7), 609–617.
Charles, A.L., Sriroth, K., Huang, T., 2005. Proximate composition, mineral contents,hydrogen cyanide and phytic acid of 5 cassava genotypes. Food Chem. 92 (4),615–620.
David, L.J., 2004. Fortificacion de harina de trigo en America Latina y region delCaribe. Revista chilena de nutricion 31, 336–347.
Eagling, T., Wawer, A.A., Shewry, P.R., Zhao, F.-J., Fairweather-Tait, S.J., 2014. Ironbioavailability in two commercial cultivars of wheat: comparison betweenwholegrain and white flour and the effects of nicotianamine and 20-deoxymu-gineic acid on iron uptake into Caco-2 cells. J. Agric. Food Chem. 62 (42), 10320–10325.
Febles, C.I., Arias, A., Hardisson, A., Rodrıguez-Alvarez, C., Sierra, A., 2002. Phytic acidlevel in wheat flours. J. Cereal Sci. 36 (1), 19–23.
Garcıa-Estepa, R.M., Guerra-Hernandez, E., Garcıa-Villanova, B., 1999. Phytic acidcontent in milled cereal products and breads. Food Res. Int. 32 (3), 217–221.
Gibbs, M., Bailey, K.B., Lander, R.D., Fahmida, U., Perlas, L., Hess, S.Y., Loechl, C.U.,Winichagoon, P., Gibson, R.S., 2011. The adequacy of micronutrient concentra-tions in manufactured complementary foods from low-income countries. J.Food Compos. Anal. 24 (3), 418–426.
Gibson, R., 2005. Principles of Nutritional Assessment, 2nd ed. Oxford UniversityPress, New York.
Gibson, R.S., Bailey, K.B., Gibbs, M., Ferguson, E.L., 2010. A review of phytate, iron,zinc, and calcium concentrations in plant-based complementary foods used inlow-income countries and implications for bioavailability. Food Nutr. Bull. 31(Suppl. 2), 134–146.
Gibson, R.S., Hotz, C., 2000. The adequacy of micronutrients in complementaryfoods. Pediatrics 106 (Suppl. 4), 1298–1299.
Harland, B.F., Smikle-Williams, S., Oberleas, D., 2004. High performance liquidchromatography analysis of phytate (IP6) in selected foods. J. Food Compos.Anal. 17 (2), 227–233.
Hotz, C., Brown, K.H., 2004. International Zinc Nutrition Consultative Group(IZiNCG) technical document #1. Assessment of the risk of zinc deficiency inpopulations and options for its control. Food Nutr. Bull. 25 (1 (Suppl. 2)), S94–S203.
Hotz, C., Lowe, N.M., Araya, M., Brown, K.H., 2003. Assessment of the trace elementstatus of individuals and populations: the example of zinc and copper. J. Nutr.133 (5), 1563S–1568S.
Hurrell, R.F., 2004. Phytic acid degradation as a means of improving iron absorption.Int. J. Vitam. Nutr. Res. 74 (6), 445–452.
INLASA, 2005. Tabla de Composicion de Alimentos Bolivianos. Ministerio de Salud yDeportes, La Paz, Bolivia.
Konishi, Y., Hirano, S., Tsuboi, H., Wada, M., 2004. Distribution of minerals in quinoa(Chenopodium quinoa Willd.) seeds. Biosci. Biotechnol. Biochem. 68 (1), 231–234.
Larsson, M., Sandberg, A.S., 1991. Phytate reduction in bread containing oat flour,oat bran or rye bran. J. Cereal Sci. 14 (2), 141–149.
Lazarte, C., Alegre, C., Rojas, E., Granfeldt, Y., 2013. Nutritional status of patients withcutaneous leishmaniasis from a tropical area from Bolivia, and implications forzinc bioavailability. Food Nutr. Sci. 4 (10A), 49–60.
Lazarte, C., Encinas, M.E., Alegre, C., Granfeldt, Y., 2012. Validation of digitalphotographs, as a tool in 24-h recall, for the improvement of dietary assessmentamong rural populations in developing countries. Nutr. J. 11 (1), 61.
Lonnerdal, B., 2000. Dietary factors influencing zinc absorption. J. Nutr. 130 (5),1378S–1383S.
Lonnerdal, B., 2002. Phytic acid-trace element (Zn, Cu, Mn) interactions. Int. J. FoodSci. Technol. 37 (7), 749–758.
Ma, G.S., Jin, Y., Piao, J., Kok, F., Guusje, B., Jacobsen, E., 2005. Phytate, calcium, iron,and zinc contents and their molar ratios in foods commonly consumed in China.J. Agric. Food Chem. 53 (26), 10285–10290.
Majzoobi, M., Pashangeh, S., Farahnaky, A., Eskandari, M.H., Jamalian, J., 2014. Effectof particle size reduction, hydrothermal and fermentation treatments on phyticacid content and some physicochemical properties of wheat bran. J. Food Sci.Technol. 51 (10), 2755–2761.
Marfo, E.K., Simpson, B.K., Idowu, J.S., Oke, O.L., 1990. Effect of local food processingon phytate levels in cassava, cocoyam, yam, maize, sorghum, rice, cowpea, andsoybean. J. Agric. Food Chem. 38 (7), 1580–1585.
Miranda, M., Vega-Galvez, A., Quispe-Fuentes, I., Jose Rodriguez, M., Maureira, H.,Martinez, E.A., 2012. Nutritional aspects of six quinoa (Chenopodium quinoawilld.) ecotypes from three geographical areas of chile. Chil. J. Agric. Res. 72 (2),175–181.
Mitchikpe, E.C.S., Dossa, R.A.M., Ategbo, E.-A.D., van Raaij, J.M.A., Hulshof, P.J.M.,Kok, F.J., 2008. The supply of bioavailable iron and zinc may be affected byphytate in Beninese children. J. Food Compos. Anal. 21 (1), 17–25.
Penarrieta, J.M., Salluca, T., Tejeda, L., Alvarado, J.A., Bergenstahl, B., 2011. Changesin phenolic antioxidants during chuno production (traditional Andean freezeand sun-dried potato). J. Food Compos. Anal. 24 (4–5), 580–587.
Perez-Cueto, F.J.A., Naska, A., Monterrey, J., Almanza-Lopez, M., Trichopoulou, A.,Kolsteren, P., 2006. Monitoring food and nutrient availability in a nationallyrepresentative sample of Bolivian households. Br. J. Nutr. 95 (3), 555–567.
Ruales, J., Nair, B.M., 1993. Content of fat, vitamins and minerals in quinoa(Chenopodium quinoa Willd.) seeds. Food Chem. 48 (2), 131–136.
Salunke, R., Rawat, N., Tiwari, V.K., Neelam, K., Randhawa, G.S., Dhaliwal, H.S., Roy,P., 2012. Determination of bioavailable-zinc from biofortified wheat using a

C.E. Lazarte et al. / Journal of Food Composition and Analysis 39 (2015) 111–119 119
coupled in vitro digestion/Caco-2 reporter-gene based assay. J. Food Compos.Anal. 25 (2), 149–159.
Sandberg, A.-S., 2002. Bioavailability of minerals in legumes. Br. J. Nutr. 88 (Suppl.S3), 281–285.
Sandberg, A.-S., Andlid, T., 2002. Phytogenic and microbial phytases in humannutrition. Int. J. Food Sci. Technol. 37 (7), 823–833.
Sandstrom, B., 1997. Bioavailability of zinc. Eur. J. Clin. Nutr. 51, S17–S19.Scholz-Ahrens, K.E., Ade, P., Marten, B., Weber, P., Timm, W., Acil, Y., Gluer, C.-C.,
Schrezenmeir, J., 2007. Prebiotics, probiotics, and synbiotics affect mineralabsorption, bone mineral content, and bone structure. J. Nutr. 137 (3), 838S–846S.
Turk, M., Sandberg, A.S., 1992. Phytate degradation during breadmaking: effect ofphytase addition. J. Cereal Sci. 15 (3), 281–294.
Umeta, M., West, C.E., Fufa, H., 2005. Content of zinc, iron, calcium and theirabsorption inhibitors in foods commonly consumed in Ethiopia. J. Food Compos.Anal. 18 (8), 803–817.
USDA, 2001. In: 23 R (Eds.), USDA national nutrient database for standard reference.Nutrient Data Laboratory, U.S. Government Printing Office, Washington, DC.
Wang, N., Daun, J.K., 2006. Effects of variety and crude protein content on nutrientsand anti-nutrients in lentils (Lens culinaris). Food Chem. 95 (3), 493–502.
WHO, World Health Organization, 1996. Trace Elements in Human and HealthNutrition. World Health Organization, Geneva.
Related Documents