Phytate and oxalate intakes of young children in Chakaria, Bangladesh Supervisor: Dr. Gail Goldberg Candidate number: 107918 Word count: From Introduction to Conclusion 8753 Submitted in part fulfilment of the requirements for the degree of MSc in Nutrition for Global Health 9 September 2014 MSc Project Report 2013-2014

Welcome message from author
This document is posted to help you gain knowledge. Please leave a comment to let me know what you think about it! Share it to your friends and learn new things together.
Transcript

Phytate and oxalate intakes of young
children in Chakaria, Bangladesh
Supervisor: Dr. Gail Goldberg
Candidate number: 107918
Word count: From Introduction to Conclusion 8753
Submitted in part fulfilment of the requirements for the degree of MSc in
Nutrition for Global Health
9 September 2014
MSc Project Report
2013-2014


i
Table of Contents List of Figures............................................................................................................................. ii
List of Tables .............................................................................................................................. ii
ABSTRACT ................................................................................................................................ v
ACKNOWLEDGEMENTS ......................................................................................................... vi
Acknowledgement of academic support ............................................................................... vi
Acknowledgement of other support ...................................................................................... vi
CONTRIBUTION OF OTHERS ................................................................................................vii
1. INTRODUCTION ................................................................................................................ 8
2. METHODS ........................................................................................................................ 11
2.1 Literature review............................................................................................................. 11
2.1.1 Search strategy ........................................................................................................... 11
2.1.2 Selection criteria.......................................................................................................... 13
2.2 Calculations .................................................................................................................... 14
2.2.1 Converting all data to milligram/100gram (mg/100g).............................................. 14
2.2.2 Converting water values for standardization........................................................... 15
2.2.3 Collection of recipes for calculation of values for composite dishes ...................... 16
2.2.4 Calculation of recipes with assumed changes in weight: ....................................... 16
2.2.5 Calculation of recipes with unknown changes in weight or weight of the cooked
dish:................................................................................................................................... 18
2.2.6 Calculation of mean value for foods with more than one values: ........................... 19
2.3 Dietary Data Analysis..................................................................................................... 19
3. RESULTS ......................................................................................................................... 19
3.1 Literature searching for phytate and oxalate values ..................................................... 19
3.2 Dietary intake in terms of phytate and oxalate .............................................................. 20
3.3 Contribution of different foods to phytate and oxalate................................................... 23
4. DISCUSSION.................................................................................................................... 31
4.1 Findings from literature review....................................................................................... 31

ii
4.2 Findings from dietary analysis ....................................................................................... 33
4.3 Limitations ...................................................................................................................... 35
4.4 Conclusion and Recommendations ............................................................................... 37
REFERENCES......................................................................................................................... 38
List of Figures
Figure 3-1 The main sources of phytate intake among all participants .................................. 24
Figure 3-2 The main sources of oxalate intake among all participants .................................. 25
List of Tables
Table 2-1 List of databases searched for phytate and oxalate values ................................... 12
Table 2-3 Format used literature review for the sources of information on phytate and
oxalate content of foods........................................................................................................... 13
Table 2-4 Example of weight of portion sizes used for recipe calculation .............................. 17
Table 2-5 Calculation of phytate and oxalate content in Brinjal/Aubergine Fry...................... 17
Table 3-1 Summary of availability of information on phytate and oxalate content of foods ... 20
Table 3-2 List of 9 foods with both unavailable phytate and oxalaet values .......................... 20
Table 3-3 Mean daily intake of calcium, phosphorus, zinc, iron phytate and oxalate in the
different study groups .............................................................................................................. 21
Table 3-4 Mean intake of calcium, phosphorus, zinc, iron phytate and oxalate per 1000 kcal
of food energy in the different study groups ............................................................................ 22
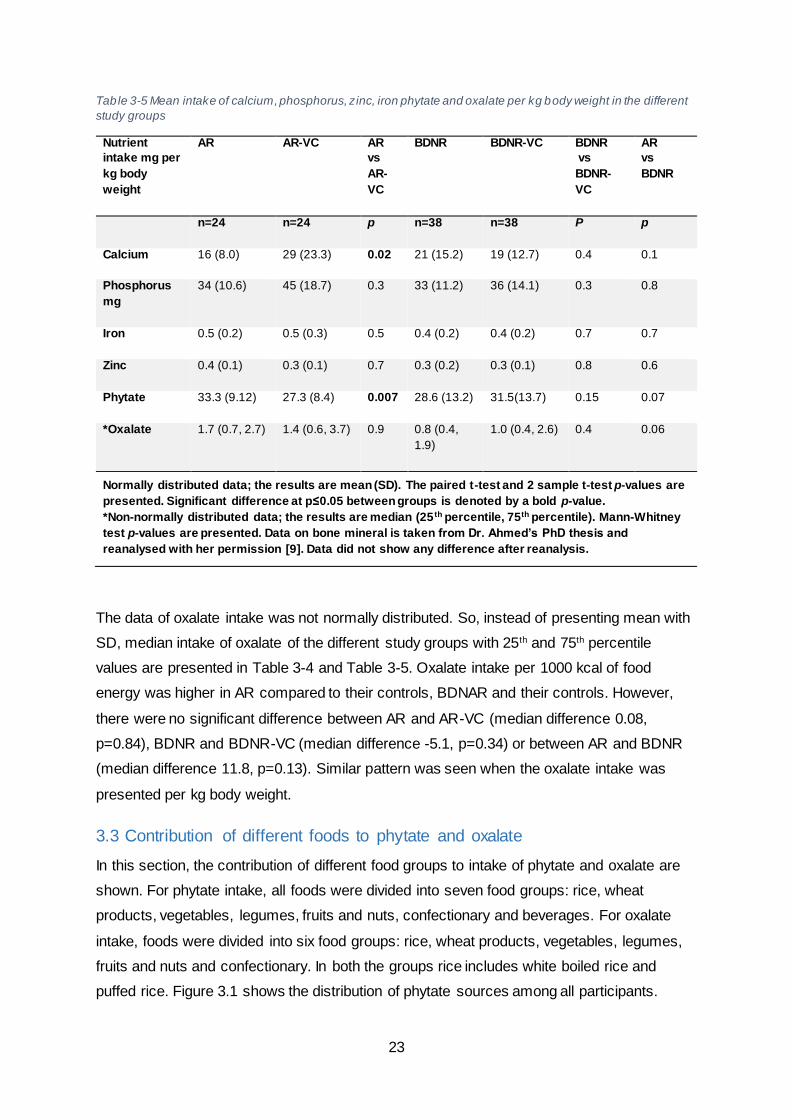
Table 3-5 Mean intake of calcium, phosphorus, zinc, iron phytate and oxalate per kg body
weight in the different study groups ......................................................................................... 23
Table 3-6 List of foods with their phytate and oxalate values (mg/100g) and sources of
information…………………………………………………………………………………………...25
Table 4-1 A few sources of information on phytate and oxalate content of food ................... 32
Table 4-2 Dietary intake in studies of rickets children and controls (adapted from Dr.
Ahmed’s thesis and revised, updated) .................................................................................... 34

iii

iv
GLOSSARY
AR Active Rickets children
AR-VC Village Controls for Active Rickets children
AEC Anion Exchange Chromatography
BDNAR Bone Deformity not Active Rickets children
BDNAR-VC Village Controls for Bone Deformity not Active Rickets
children
DINO Diet In Nutrients Out
DW Dry Weight
FAO Food and Agriculture Organization of the United Nations
FW Fresh Weight
G Gram
HNR Human Nutrition Research
HPLC High-performance liquid chromatography
icddr,b International Centre for Diarrhoeal Disease Research,
Bangladesh
MRC Medical Research Council
Mg milligram
NFPCSP National Food Policy Capacity Strengthening
Programme
OA Oxalic acid/oxalate
PA Phytic acid/phytate
SARPV Social Assistance for Rehabilitation of Vulnerable
People (an NGO in Bangladesh)

v
ABSTRACT
Background: A recent case-control study of the aetiology of rickets in Chakaria, Bangladesh
by MRC Human Nutrition Research (HNR), showed that calcium intakes of children were
very low (~150mg/day in cases and <300mg/day in controls) and mostly came from fish and
cereals. Calcium obtained from cereals and other plant foods is not very bioavailable
because the phytate and oxalate contents are likely to be high. This issue has not been
considered in previous studies of rickets in Bangladesh. The purpose of my project was to
derive phytate and oxalate values for all the foods consumed, and calculate the individual’s
daily intakes. The hypothesis was that phytate and oxalate content of diets of young children
in Chakaria, Bangladesh are high, particularly in children with rickets.
Methods: Data from prospective 24-hour weighed dietary records containing 117 different
foods were used. The project had four stages:1) literature searching; 2) deriving values in
foods as eaten; 3) adding these to the food composition database at HNR and calculating
individual daily total intakes using Diet In Nutrients Out software; 4) analysis of phytate and
oxalate intake in cases and controls.
Results: Phytate and oxalate content of 80 and 76 foods respectively were derived.
Mean±SD intake of phytate was 48.6±13.9 and median (25th, 75th percentile) intake of
oxalate was 1.8 (0.7 and 4.2). Children with rickets had significantly higher mean phytate
intake per 1000 kcal and per kg body weight than controls ([6.5±3.8g, p=0.03]; [6±0.1g,
p=0.007]). There were no significant differences in oxalate intake.
Conclusions: The published data on phytate and oxalate contents of foods, typically
consumed in South Asia are very limited. The diets of young children in Chakaria are very
low in calcium and other minerals and relatively high in phytate and oxalate. The implications
of this warrant further investigation.

vi
ACKNOWLEDGEMENTS
Acknowledgement of academic support
First of all, I would like to thank my supervisor Dr. Gail Goldberg (HNR and LSHTM) for her
remarkable supervision and thorough support. I admire her for her enduring patience,
intellectual freedom and nudging from time to time which have made it possible for me to
complete the study within 3 months. I am also truly grateful to Dr. Sophie Moore (LSHTM) for
her excellent mentoring and support during the proposal development, Dr. Alan Dangour
(LSHTM) for his support and encouragement, Dr. Birdem Amoutzopoulos (HNR) for her
support during literature review and write up stage of this dissertation. I am indebted to Dr.
Sonia Ahmed (HNR) for her valuable insights, sharing data, supporting and encouraging me
throughout my M.Sc. I remember Mr. Darren Cole (HNR), Ms. Nida Ziauddeen (HNR), and
Mrs. Susan Jones (HNR) with immense gratitude. I am truly grateful to Dr. Elaine Ferguson
(LSHTM) for sharing her unpublished literature review to support my dissertation. My
heartfelt thanks go to Dr. Ann Prentice, Director, MRC-HNR, UK for allowing me as a visiting
student and The Commonwealth Scholarship Commission, UK who funded my M.Sc.
studentship and project.
Acknowledgement of other support
I would like to thank my parents, in laws and family for always inspiring me for higher
education and to dream high and for their advice and support throughout the tenure. Thanks
to my aunt Dr. Krishna Datta for her advice, immense support and encouragement. Thanks
to my husband, Subir Kumar Chowdhury and thanks to our son Amiya Gahan Chowdhury for
being with me and supporting in every possible way in the most difficult times. This thesis is
dedicated to my family for their contribution to my M.Sc.

vii
CONTRIBUTION OF OTHERS
I thought of the idea that was refined by my supervisor who also helped me in writing the
protocol. The data I used in the project were collected by Dr. Sonia Ahmed as part of her
PhD thesis and given to me fully cleaned by her. Dr, Elaine Ferguson shared a database of
findings of literature review. I worked with my supervisor to define a data analysis plan,
literature review plan. Ms. Nida Ziauddeen entered the data into the Bangladeshi DINO, at
HNR database, transformed and transferred the data into excel spreadsheet for further
analysis. I conducted the literature review, analysis of dietary data, and reanalysis of mineral
intake data and wrote the report. My supervisor read advanced draft of the report and fed
back comments.
8
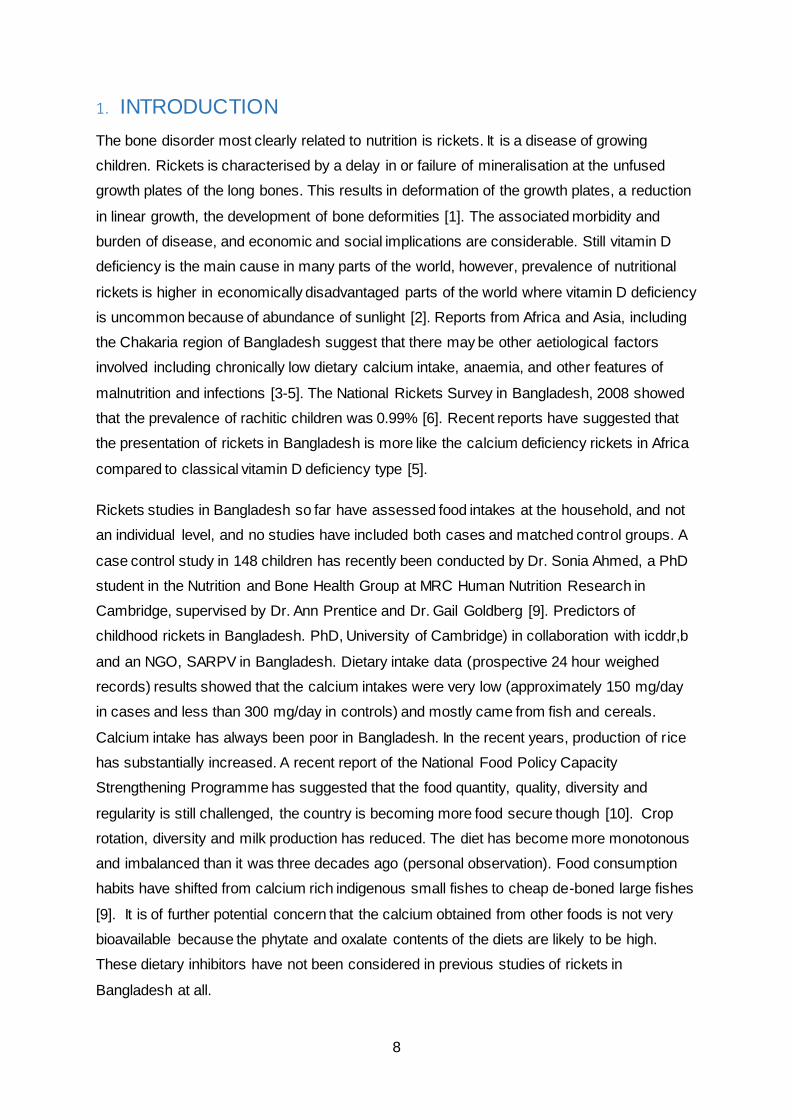
1. INTRODUCTION
The bone disorder most clearly related to nutrition is rickets. It is a disease of growing
children. Rickets is characterised by a delay in or failure of mineralisation at the unfused
growth plates of the long bones. This results in deformation of the growth plates, a reduction
in linear growth, the development of bone deformities [1]. The associated morbidity and
burden of disease, and economic and social implications are considerable. Still vitamin D
deficiency is the main cause in many parts of the world, however, prevalence of nutritional
rickets is higher in economically disadvantaged parts of the world where vitamin D deficiency
is uncommon because of abundance of sunlight [2]. Reports from Africa and Asia, including
the Chakaria region of Bangladesh suggest that there may be other aetiological factors
involved including chronically low dietary calcium intake, anaemia, and other features of
malnutrition and infections [3-5]. The National Rickets Survey in Bangladesh, 2008 showed
that the prevalence of rachitic children was 0.99% [6]. Recent reports have suggested that
the presentation of rickets in Bangladesh is more like the calcium deficiency rickets in Africa
compared to classical vitamin D deficiency type [5].
Rickets studies in Bangladesh so far have assessed food intakes at the household, and not
an individual level, and no studies have included both cases and matched control groups. A
case control study in 148 children has recently been conducted by Dr. Sonia Ahmed, a PhD
student in the Nutrition and Bone Health Group at MRC Human Nutrition Research in
Cambridge, supervised by Dr. Ann Prentice and Dr. Gail Goldberg [9]. Predictors of
childhood rickets in Bangladesh. PhD, University of Cambridge) in collaboration with icddr,b
and an NGO, SARPV in Bangladesh. Dietary intake data (prospective 24 hour weighed
records) results showed that the calcium intakes were very low (approximately 150 mg/day
in cases and less than 300 mg/day in controls) and mostly came from fish and cereals.
Calcium intake has always been poor in Bangladesh. In the recent years, production of rice
has substantially increased. A recent report of the National Food Policy Capacity
Strengthening Programme has suggested that the food quantity, quality, diversity and
regularity is still challenged, the country is becoming more food secure though [10]. Crop
rotation, diversity and milk production has reduced. The diet has become more monotonous
and imbalanced than it was three decades ago (personal observation). Food consumption
habits have shifted from calcium rich indigenous small fishes to cheap de-boned large fishes
[9]. It is of further potential concern that the calcium obtained from other foods is not very
bioavailable because the phytate and oxalate contents of the diets are likely to be high.
These dietary inhibitors have not been considered in previous studies of rickets in
Bangladesh at all.

9
Phytate and oxalate, regarded as ‘antinutrients’, are the two most important diet related
factors which influence bioavailability of minerals, such as – calcium, phosphorus, zinc and
iron which are crucial for bone nutrition . Phytate (or phytic acid) which is also known as
inositol hexaphosphate has a strong negative nutritional impact on absorption of minerals.
Phytate or phytic acid from plant products inhibits calcium absorption by complexing calcium
in the intestine. Foods which are high in fibre, for example, seeds and grains are rich in
phytate, the storage form of phosphate [7]. Another important chelator (ions and molecules
which bind metal ions) is oxalic acid or oxalate that binds which is also one of the most
common ‘anti nutritional’ factors present in abundance in green leafy vegetables. Oxalate
from certain vegetables affects the bioavailability of calcium by forming very stable
complexes in the body [8].
There is very little information from Bangladeshi and Indian food composition tables about
the content of phytate and oxalate in foodstuffs. Most of the data are from individual raw
foods and not foods as eaten or found in composite dishes. For Dr. Ahmed’s project
conducted in Bangladesh, new food codes for the composition of cooked foods and recipes
consumed in the study were created from literature sources and used in a bespoke version
of MRC-HNR’s DINO (Diet In Nutrients Out) programme [9]. Phytate and oxalate values
have not yet been included in the database.
Hypothesis statement:
Phytate and oxalate content of diets of young children in Chakaria, Bangladesh are high,
and may therefore impact on the bioavailability of minerals, and potentially explain some of
the aetiology of rickets in this region.
Overall Aim of the project:
Overall aim of my project was to derive phytate and oxalate values for the foods consumed
and calculate the individual’s daily intakes to inform future analysis.
Specific Aims:
Specific aims of the project were to conduct literature searching, including grey literature and
other sources of information; gain a good understanding of food composition table, individual
foods for example fruits, vegetables, all cereals, legumes, pulses and composite dishes, the
knowledge to convert values from raw to cooked foods and also apply these to composite
dishes and recipes, to enter values per 100g into the bespoke food composition tables held
at HNR, to use the ‘DINO’ programme to calculate daily intakes of phytate and oxalate in

10
children with rickets and matched controls; and consider the potential impact on calcium and
other mineral availability and bone health.

11
2. METHODS
Phytate, phytic acid and phytin mean the same and so do oxalate, oxalic acid. Different
literature have used different names. For consistency, I have used phytate and oxalate
throughout the report. The current project used data from 24 hour weighed dietary records
collected for dietary assessment as a part of the case control study on young children aged
1.0 to 10.9 year old in Chakaria, Bangladesh. Chakaria is a south east coastal sub-district of
Cox’s Bazar, a district of Chittagong, one of the seven division of Bangladesh. The project
was carried out in three stages- in the first stage literature searching for information on
phytate and oxalate content in Bangladeshi foods and information on intake was done. After
that, calculation of individual daily total intake of above study subjects was conducted using
DINO (Diet In Nutrients Out), a software for dietary analysis, developed by Mr. Darren Cole
at MRC-HNR[9]. Finally, preliminary analysis for comparison of intake between different
study groups was carried out.
2.1 Literature review
A literature review was conducted including electronic databases, journal sites, books,
theses. Another source of information on phytate content of foods was an extensive
literature review conducted by Dr. Elaine Ferguson at LSHTM (unpublished). Literature
searching in the present study was done in three parts. Firstly, sources were searched for
studies of rickets in Bangladesh which included dietary assessment to generate phytate and
oxalate intake. Secondly, literature was searched for phytate and oxalate content of different
food items and composite dishes consumed in Bangladesh. Thirdly, databases were
reviewed for information on the effect of food processing (for example: dehulling, soaking,
blanching, boiling, roasting, autoclaving, traditional cooking) on phytate and oxalate present
in foods.
2.1.1 Search strategy
The databases PubMed (http://www.ncbi.nlm.nih.gov/pubmed/), Web of Science
(http://isiwebofknowledge.com/products_tools/multidisciplinery/webofscience/), google
scholar (http://scholar.google.co.uk/), google books (http://books.google.com/) were used
predominantly for abstracts, articles, chapters of books. The terms searched were ‘phytate’,
‘phytic acid’, ‘oxalate’, ‘oxalic acid’, ‘antinutrients’, ‘food composition table’, ‘content’, ‘food
analysis’. Titles of articles and available abstracts were skimmed for relevance. To identify
additional, relevant articles, reference lists of abstracts reviewed in this current study were
searched. For less familiar foods, taxonomic names were used for searching (for example,
Shapla flower- nymphaea nouchali, Pat Shak - corchorus capsularis etc). Google

12
(http://www.google.co.uk/) was very helpful in finding images of foods, indigenous recipes,
and to have a general idea on specific foods.
The following data banks were searched for phytate and oxalate values:
Table 2-1 List of databases searched for phytate and oxalate values
Databank Links PA OA
Australia http://www.foodstandards.gov.au/science/monitoringnutrients/nutrientables/nuttab/Pages/default.aspx
No Yes
Denmark http://www.foodcomp.dk/v7/fcdb_search.asp No No
Canada http://w ebprod3.hc-sc.gc.ca/cnf-fce/index-eng.jsp No Yes
Czech version 4.13 http://www.czfcdb.cz/en/search-food-data/food-name/ No No
Finland http://www.fineli.f i/index.php?lang=en No No
France http://www.afssa.fr/TableCIQUAL/ No No
Germany http://www.bls.nvs2.de/index.php?id=1&L=1 No No
Netherlands http://nevo-online.rivm.nl/ProductenZoeken.aspx No No
New zealand http://www.foodcomposition.co.nz/foodfiles No No
Norw ay http://www.matvaretabellen.no/?language=en No No
Sw eden http://www7.slv.se/Naringssok/SokLivsmedel.aspx No No
Turkey http://www.turkomp.gov.tr/ No No
USDA (USA) http://ndb.nal.usda.gov/ndb/search/list No No
EUROFIR (all UK databases) http://www.eurofir.org/?page_id=96 No No
FAO-INFOODS http://www.fao.org/infoods/infoods
Yes No
*PA=Phytic acid/phytate, *OA=Oxalic acid/oxalate
Besides phytate and oxalate values, sources were searched for effect of food processing on
phytate and oxalate content in foods using the terms ‘food processing’, ‘domestic food
processing’, ‘dehulling’, ‘soaking’, ‘blanching’, ‘boiling’, ‘roasting’, ‘autoclaving’, ‘traditional
cooking’, ‘effect on antinutrients’, ‘phytate’, ‘oxalate’.
Supplements of McCance and Widdowson’s ‘The Composition of Foods’, Nutritive Value of
Indian Foods, Food Phytates, Handbook of Food Toxicology, Essentials of Food and
Nutrition-Volume 1 were some of the books searched for phytate, oxalate values and effect
of food processing [11-20].
13
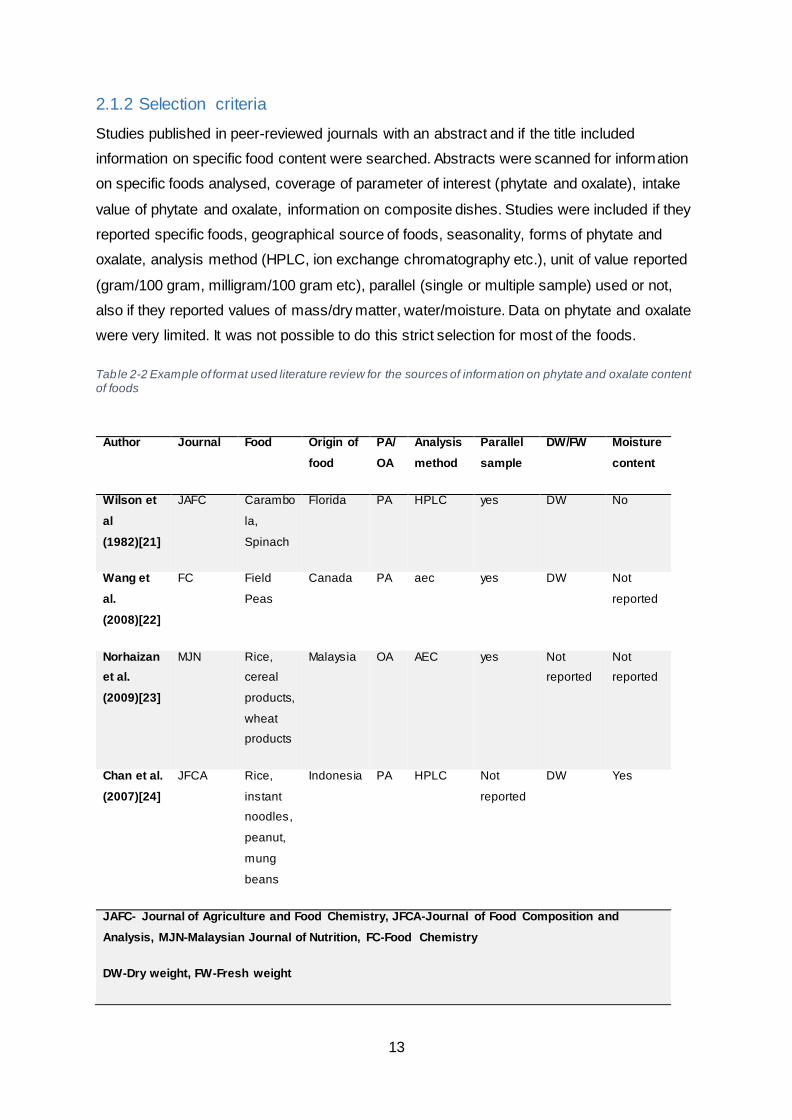
2.1.2 Selection criteria
Studies published in peer-reviewed journals with an abstract and if the title included
information on specific food content were searched. Abstracts were scanned for information
on specific foods analysed, coverage of parameter of interest (phytate and oxalate), intake
value of phytate and oxalate, information on composite dishes. Studies were included if they
reported specific foods, geographical source of foods, seasonality, forms of phytate and
oxalate, analysis method (HPLC, ion exchange chromatography etc.), unit of value reported
(gram/100 gram, milligram/100 gram etc), parallel (single or multiple sample) used or not,
also if they reported values of mass/dry matter, water/moisture. Data on phytate and oxalate
were very limited. It was not possible to do this strict selection for most of the foods.
Table 2-2 Example of format used literature review for the sources of information on phytate and oxalate content of foods
Author Journal Food Origin of
food
PA/
OA
Analysis
method
Parallel
sample
DW/FW Moisture
content
Wilson et
al
(1982)[21]
JAFC Carambo
la,
Spinach
Florida PA HPLC yes DW No
Wang et
al.
(2008)[22]
FC Field
Peas
Canada PA aec yes DW Not
reported
Norhaizan
et al.
(2009)[23]
MJN Rice,
cereal
products,
wheat
products
Malaysia OA AEC yes Not
reported
Not
reported
Chan et al.
(2007)[24]
JFCA Rice,
instant
noodles,
peanut,
mung
beans
Indonesia PA HPLC Not
reported
DW Yes
JAFC- Journal of Agriculture and Food Chemistry, JFCA-Journal of Food Composition and
Analysis, MJN-Malaysian Journal of Nutrition, FC-Food Chemistry
DW-Dry weight, FW-Fresh weight

14
Most of the local/indigenous food items which were usually consumed raw, for example,
fruits, nuts, vegetables (such as cucumber) were collected from the FAO-INFOODS-
Bangladesh database and Nutritive Value of Indian Foods [20, 25]. FAO-INFOODS was the
most recent database of Bangladeshi raw foods published in 2013. Food items consumed in
Bangladesh and India are similar. ‘Nutritive Value of Indian foods’ includes foods which are
common in both Bangladesh and India. A lot of food was included in the review done by
Ferguson et al with a very few from Bangladesh and matching the criteria which had been
set for the present study. Table 2-2 shows some of the literature which had been reviewed
for information:
A major limitation of using these sources of information was that they included values of raw
foods only, not cooked food or composite dishes. In addition, they did not include retention
factors for phytate and oxalate. Retention factor can be described as the percentage
adjustments in the phytate and oxalate that account for the effect of cooking on them.
Retention of phytate and oxalate in the cooked dishes depends on the cooking method and
duration of cooking, moisture content of raw ingredients, type of food etc. This is a vast area
of research in Nutrition and food science which could not be included in the calculation of a
number of foods due to lack of reliable literature on Bangladeshi foods.
For a few raw foods, cooked and composite dishes and ethnic recipes, the most reliable
supplements of McCance and Widdowson’s ‘The Composition of Foods’ were used [11-16]
all food items and dishes, their phytate and oxalate values, sources of information has been
attached in the Appendix section.
2.2 Calculations
For the calculation of phytate and oxalate values, the food item which corresponded most
closely with the food consumed in Dr. Ahmed’s study was chosen from different sources. In
an spreadsheet information on phytate content (mg/100g) with source of information, oxalate
content (mg/100g) with source of information, water content (g/100g) were included. All the
values were per 100 g of edible portion or ‘as eaten’ as usually listed in Food Composition
Tables. Originally, for those foods which were consumed but not in the literature, the best
alternative by considering food type, general characteristics was chosen by Dr. Ahmed. For
example, Tara, which a tuber, listed in the food diary was replaced by Colocasia Stem,
another tuber [20].
2.2.1 Converting all data to milligram/100gram (mg/100g)
It was found that different sources of literature reported values of phytate and oxalate using
different units, for example, g/100g, mg/100g. Conventionally values expressed in food
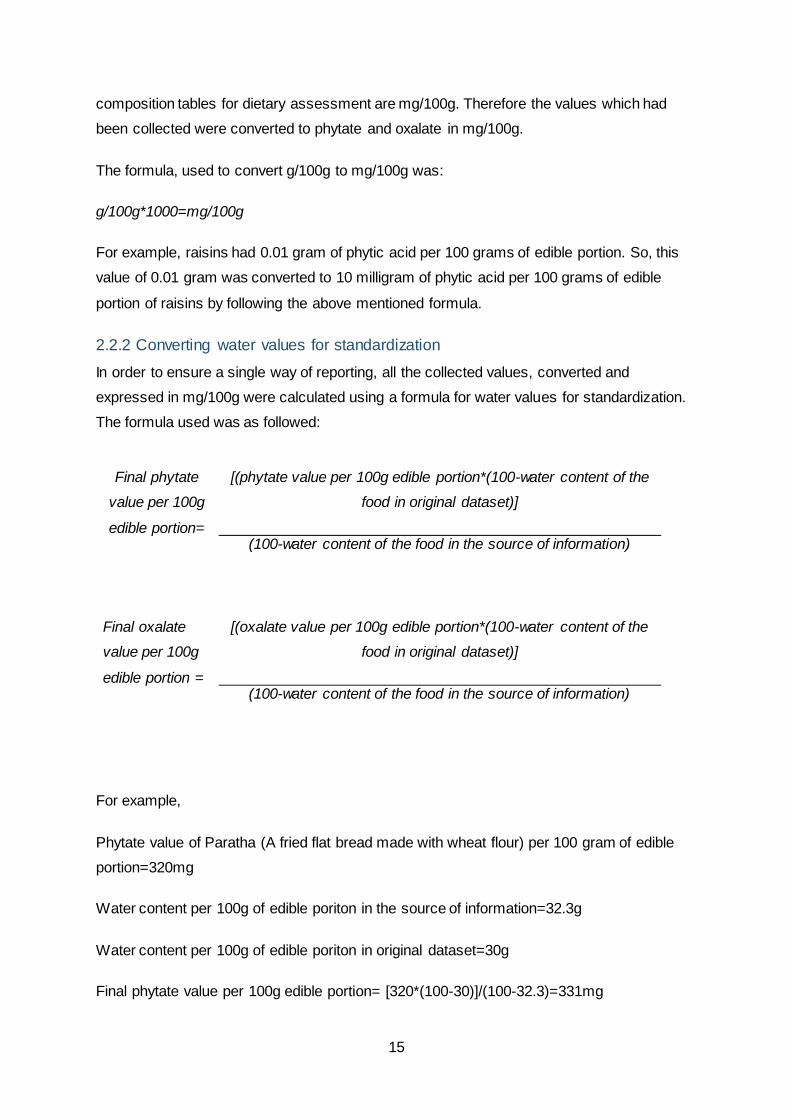
15
composition tables for dietary assessment are mg/100g. Therefore the values which had
been collected were converted to phytate and oxalate in mg/100g.
The formula, used to convert g/100g to mg/100g was:
g/100g*1000=mg/100g
For example, raisins had 0.01 gram of phytic acid per 100 grams of edible portion. So, this
value of 0.01 gram was converted to 10 milligram of phytic acid per 100 grams of edible
portion of raisins by following the above mentioned formula.
2.2.2 Converting water values for standardization
In order to ensure a single way of reporting, all the collected values, converted and
expressed in mg/100g were calculated using a formula for water values for standardization.
The formula used was as followed:
For example,
Phytate value of Paratha (A fried flat bread made with wheat flour) per 100 gram of edible
portion=320mg
Water content per 100g of edible poriton in the source of information=32.3g
Water content per 100g of edible poriton in original dataset=30g
Final phytate value per 100g edible portion= [320*(100-30)]/(100-32.3)=331mg
Final phytate
value per 100g
edible portion=
[(phytate value per 100g edible portion*(100-water content of the
food in original dataset)]
(100-water content of the food in the source of information)
Final oxalate
value per 100g
edible portion =
[(oxalate value per 100g edible portion*(100-water content of the
food in original dataset)]
(100-water content of the food in the source of information)

16
Similarly,
Oxalate value of Kamranga/Carambola/Star fruit per 100g of edible portion=300mg
Water content per 100g of edible poriton in the source of information=92.5g
Water content per 100g of edible poriton in original dataset=92g
Final oxalate value per 100g edible portion=[300*(100-92.5)]/(100-92)=282mg
2.2.3 Collection of recipes for calculation of values for composite dishes
There is a paucity of data on contents of phytate and oxalate in composite dishes. Recipes
for listed composite dishes were collected from supplements of McCance and Widdowson’s
‘The Composition of Foods’, Dr. Ahmed’s records collected during 24 hour weighed dietary
assessment and different websites. All the records were crossmatched with Dr. Ahmed’s
findings of recipes which she filed for future use to ensure a reliable, consistent source of
amount of each ingredient to include in calculation when new values were to be added.
Calculation of values using the same recipes was done to ensure consistency among
nutrients and other values.
2.2.4 Calculation of recipes with assumed changes in weight:
For the composite dishes for which no data was available, ingredients of the dish with the
amount of each ingredient had been listed from recipes. Composition of cooked dishes was
calculated based on the content of phytate and oxalate of the ingredients and the changes in
weight on cooking due to evaporation of water or to its gain by absorption (for example, rice).
Foods like Noodles, pasta, macaroni, vermicelli gain weight by absorption of water by 35 to
50%. Their cooked weight is more than the raw weight. About 757 grams of vermicelli, milk,
sugar, almond yield 1138 grams of cooked vermicelli. On the other hand, mixed vegetables
loose water due to evaporation. About 1409 grams of mixed vegetables turn to 838 grams of
cooked mixed vegetable by losing around 24% of weight. Contribution of each ingredient
towards the total recipe’s phytate and oxalate content was calculated using the formula
documented in McCance and Widdowson’s ‘The Composition of Foods’ - sixth summary
edition [11].
The weights of the raw ingredients were used to calculate the total amounts of phytic acid
and oxalic acid in the raw dish. For weight calculation of individual ingredients in a recipe, I
had to find out portion sizes (e.g. 1 level teaspoon, 1 heaped teaspoon, 1 cup, 1 glass)
which I collected from the book ‘Food Portion Sizes’-2nd edition [26]. A few examples of
portion sizes for recipe calculation have been shown in Table 2-3.

17
Total phytate and oxalate content were then calculated by adding the contribution of each
ingredient together. An example of the calculation of antinutrient contents of the cooked dish
is shown in Table 2-4. The method of calculation was taken from McCance and
Widdowson’s ‘The Composition of Foods’ -sixth summary edition [11].
Table 2-3 Example of weight of portion sizes used for recipe calculation
Items Portion size Weight in gram
Salt 1 level teaspoon 5
Spices Dried, 1 teaspoon 3
Sugar 1 heaped teaspoon 6
Egg, hen’s No shell, size 1 67
Oil 1 tablespoon 11
Oil 1 teaspoon 3
Table 2-4 Calculation of phytate and oxalate content in Brinjal/Aubergine Fry
Ingredients Amounts contributed
Amount in Recipe g
Phytic acid mg Oxalic Acid mg
Oil 22 0 0
Onion 24 0 0.2
Green chillies 8 0.6 5.4
Turmeric powder 1 0 0
Coriander powder 1 0 0
Coriander leaves 5 0 2.4
Brinjal (Aubergine) 114 3.4 20.5
Total in recipe (a) 175 4.0 28.5
Cooked weight (b) 102
Weight loss on cooking (c) =a-b 73
% weight loss on cooking (d) =c/a x 100 41.71
Phytic acid and oxalic acid content of cooked dish (per 100g) (e)
=a/b x100 0.1 0.3

18
Formula used for phytate and oxalate content of cooked dish were as follows. These
formulas were used in the calculation shown in Table 2-4. I need to conduct similar
calculation for atleast 48 composite dishes for either phytate or oxalate values.
Phytate content of cooked dish per 100g
= Total phytate content of raw ingredients/Weight of cooked dish*100
Oxalate content of cooked dish per 100g
= Total oxalate content of raw ingredients/Weight of cooked dish*100
2.2.5 Calculation of recipes with unknown changes in weight or weight of the cooked
dish:
If the weight of the cooked dish was not known, a recipe was calculated from the raw
ingredients and the weight was estimated by using the % weight change from a similar
recipe as follows (provided that all the weight change can be attributed to water). For
example, for beef curry with radish, 30% weight loss was estimated from other recipes of
meat and vegetable. Then the weight of cooked beef curry with radish was calculated using
the following formula:
Weight of
cooked dish =
Weight of raw ingredients x (100 -% weight loss of similar dish)
100
Weight of beef curry= 1730g x (100-30)/100 = 1211g
For recipes which gain weight on cooking, for example vermicelli, a weight gain of 50% was
estimated from other recipes of vermicelli:
Weight of
cooked dish =
Weight of raw ingredients x (100 + % weight loss of similar dish)
100
Weight of vermicelli= 575g x (100+50)/100=862.5g
19
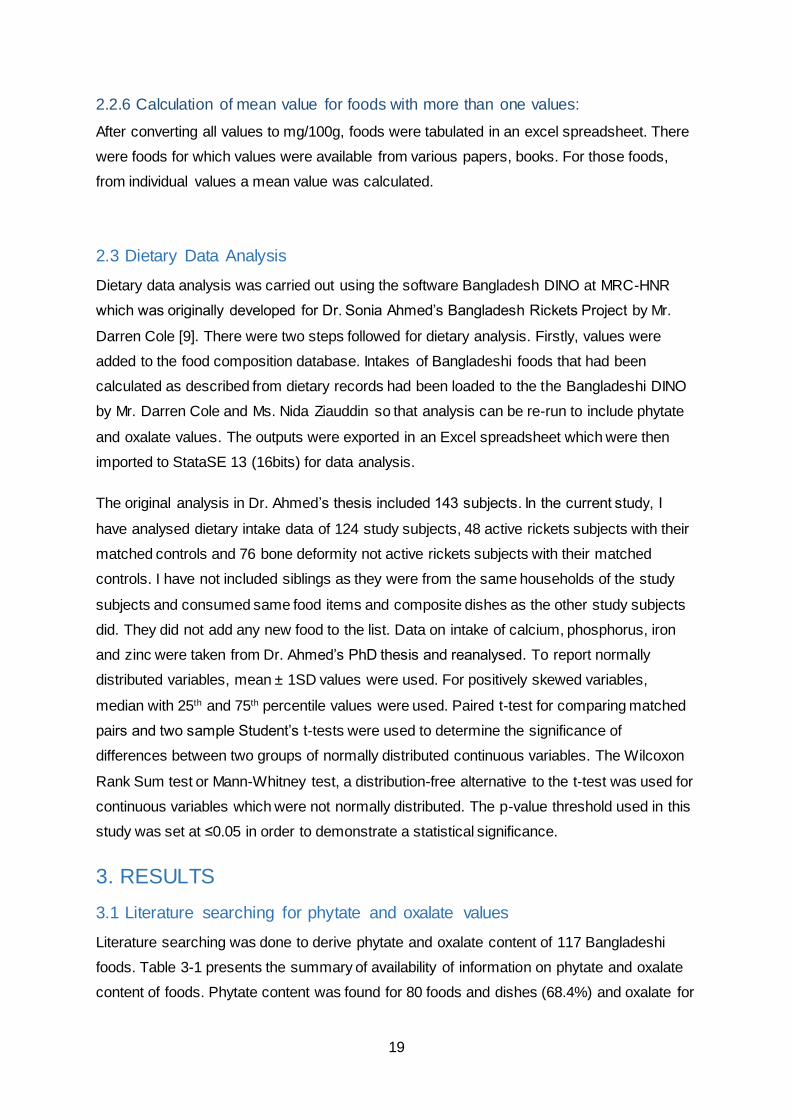
2.2.6 Calculation of mean value for foods with more than one values:
After converting all values to mg/100g, foods were tabulated in an excel spreadsheet. There
were foods for which values were available from various papers, books. For those foods,
from individual values a mean value was calculated.
2.3 Dietary Data Analysis
Dietary data analysis was carried out using the software Bangladesh DINO at MRC-HNR
which was originally developed for Dr. Sonia Ahmed’s Bangladesh Rickets Project by Mr.
Darren Cole [9]. There were two steps followed for dietary analysis. Firstly, values were
added to the food composition database. Intakes of Bangladeshi foods that had been
calculated as described from dietary records had been loaded to the the Bangladeshi DINO
by Mr. Darren Cole and Ms. Nida Ziauddin so that analysis can be re-run to include phytate
and oxalate values. The outputs were exported in an Excel spreadsheet which were then
imported to StataSE 13 (16bits) for data analysis.
The original analysis in Dr. Ahmed’s thesis included 143 subjects. In the current study, I
have analysed dietary intake data of 124 study subjects, 48 active rickets subjects with their
matched controls and 76 bone deformity not active rickets subjects with their matched
controls. I have not included siblings as they were from the same households of the study
subjects and consumed same food items and composite dishes as the other study subjects
did. They did not add any new food to the list. Data on intake of calcium, phosphorus, iron
and zinc were taken from Dr. Ahmed’s PhD thesis and reanalysed. To report normally
distributed variables, mean ± 1SD values were used. For positively skewed variables,
median with 25th and 75th percentile values were used. Paired t-test for comparing matched
pairs and two sample Student’s t-tests were used to determine the significance of
differences between two groups of normally distributed continuous variables. The Wilcoxon
Rank Sum test or Mann-Whitney test, a distribution-free alternative to the t-test was used for
continuous variables which were not normally distributed. The p-value threshold used in this
study was set at ≤0.05 in order to demonstrate a statistical significance.
3. RESULTS
3.1 Literature searching for phytate and oxalate values
Literature searching was done to derive phytate and oxalate content of 117 Bangladeshi
foods. Table 3-1 presents the summary of availability of information on phytate and oxalate
content of foods. Phytate content was found for 80 foods and dishes (68.4%) and oxalate for

20
76 foods and dishes (65%). Information on oxalate and phytate content were not available
for 12 (10.2%) and 16 (13.6%) foods items and composite dishes, respectively. Among
these, for 9 food items neither phytate and nor oxalate values could be found (e.g. Tara,
sweet pumpkin). A list of these 9 foods are presented in table 3-2. There were 25 foods
which did not have phytic acid or oxalic acid in them (Table 3-1).
Table 3-1 Summary of availab ility of information on phytic acid and oxalic acid content of foods
Status of information Information on phytic acid content
Information on oxalic acid content
Values found 80 (68.4%) 76 (65.0%)
Values not found 12 (10.2%) 16 (13.6%)
Not applicable 25 (21.4%) 25 (21.4%)
Total no. of foods 117 117
Table 3-2 List of 9 foods with both unavailable phytic acid and oxalic acid values
Food Items Food groups
Fruits gums/jellies eg lychee (artificial) Sugar confectionery, sweet and savoury snacks
Patti, purchased Sugar confectionery, sweet and savoury snacks
Tara Vegetables
Sweet pumpkin Vegetables
Fruit juice eg orange (artificial, made up from concentrate)
Beverages
Taam Fruit
Sugar cane Sugar confectionery, sweet and savoury snacks
Chicken with sweet pumpkin White meat and dishes
Shapla flower Vegetables
3.2 Dietary intake in terms of phytate and oxalate
In the current study, dietary data from the 24 hour weighed food intake measurements of
124 children aged 1.0 to 10.9 years were analysed for mean daily intake of phytate and
oxalateper 1000 kcal and per kg body weight of study children and compared among
different groups children with Active Rickets (AR), children with Bone Deformity not Active

21
Rickets (BDNR), and their respective village controls. Mean bodyweight (kg) of these
children was 9.65(1.74) for AR, 12.4 (3.51) for AR-VC, 11.4 (2.71) for BDNAR and 12.9
(3.99) BDNAR-VC. In terms of body weight (kg), AR was significantly heavier than the AR-
VC children (p=0.002) and BDNAR children (p=0.0003). Data on weight (kg) of study
children and on intake of minerals important for bones (calcium, phosphorus, iron and zinc)
have been taken from Dr. Ahmed’s PhD thesis [9] and presented along with Phytate and
oxalate values in Table 3-3, Table 3-4, Table 3-5.
Table 3-3 Mean daily intake of calcium, phosphorus, zinc, iron phytate and oxalate in the different study groups
Nutrient intake mg per day
AR AR-VC AR vs AR-VC
BDNAR BDNAR-VC BDNAR
vs BDNAR-VC
AR
vs BDNAR
n=24 n=24 p n=38 n=38 p p
Calcium 156
(80.1)
323
(249.0)
0.005 239
(166.0)
254
(221.8)
0.7 0.3
Phosphorus 322
(112.5)
424
(155.2)
0.009 380
(158.1)
403
(167.6)
0.3 0.1
Iron 4.3
(2.0)
5.8
(3.5)
0.08 5.0
(2.8)
5.4
(3.1)
0.5 0.3
Zinc 3.5
(1.6)
4.1
(1.5)
0.1 4.1
(2.8)
4.4
(1.8)
0.4 0.4
Phytate 318
(90.1)
319.5 (111.5)
0.5 339.5 (206.2)
402.6
(178.3)
0.09 0.68
*Oxalate 15.6 (7.7, 25.1)
18.6 (6.3, 49.5)
0.7 9.0 (4.2, 22.1)
12.4 (4.4, 45.8)
0.3 0.2
Normally distributed data; the results are mean (SD). p-values of the paired t-test for AR vs AR-VC and BDNR vs BDNR-VC and 2 sample t-test for AR vs BDNAR are presented. Significant difference at p≤0.05 between groups is denoted by a bold p-value. *Non-normally distributed data; the results are median (25th percentile, 75th percentile). Mann-Whitney test p-values are presented. Data on bone mineral is adapted from Dr. Ahmed’s PhD thesis and reanalysed with her permission [9]. Data did not show any difference after reanalysis.
AR children had lower mean daily intake of phytate than their controls [-1.5(21.4) g, p=0.5].
A similar pattern was seen in BDNAR children and their controls [-63.1(27.9) g, p=0.09].
None of the mean differences were significant. Mean daily intake of minerals were lower in

22
both AR and BDNR groups compared to their respective controls. Significant differences
were found between calcium and phosphorus intake of AR and their controls.
Table 3-4 and Table 3-5 present phytate intake per 1000 kcal of food energy and per kg
body weight, respectively. AR had significantly higher mean phytate intake per 1000 kcal
than their controls [6.5 (3.8) g, p=0.03]. The difference was more significant when phytate
intake was presented per kg body weight [6 (0.12) g, p=0.007]. On the contrary, intake of
minerals per 1000 kcal were lower in AR compared to the other groups.
Table 3-4 Mean intake of calcium, phosphorus, zinc, iron phytate and oxalate per 1000 kcal of food energy in the
different study groups
Nutrient
intake per
1000 kcal of
food energy
AR AR-VC AR vs
AR-VC
BDNR BDNR-VC BDNR
vs
BDNR-
VC
AR
vs
BDNR
n=24 n=24 P n=38 n=38 p p
Calcium 185 (85.7) 345 (266.0) 0.007 288 (202.8) 249 (160.2) 0.4 0.02
Phosphorus 378 (74.2) 446 (102.5) 0.02 427 (87.8) 405 (76.7) 0.2 0.03
Iron 3.9 (2.7) 6.1 (4.2) 0.04 5.3 (4.6) 6.0 (4.9) 0.4 0.2
Zinc 4.1 (1.1) 4.3 (0.8) 0.4 4.4 (1.3) 4.4 (0.8) 0.9 0.3
Phytate 51.7 (14.8) 45.2 (11.0) 0.03 47 (14.2) 50.4 (13.7) 0.96 0.27
*Oxalate 21.1 (9.3,
28)
20.3 (6.6, 44) 0.84 9.3 (5.4,
22.6)
14.4 (4.8,
37.4)
0.34 0.13
Normally distributed data; the results are mean (SD). The paired t-test and 2 sample t-test p-values
are presented. Significant difference at p≤0.05 between groups is denoted by a bold p-value.
*Non-normally distributed data; the results are median (25 th percentile, 75th percentile). Mann-Whitney
test p-values are presented. Data on bone mineral data is adapted from Dr. Ahmed’s PhD thesis and
reanalysed with her permission [9]. Data did not show any difference after reanalysis.
Significant differences were seen among AR vs AR-VC in their calcium and phosphorus
intake [-160 (180.3) g, p=0.007] and [68 (28.3)g, p=0.02] respectively. Moreover, intake of
these two minerals were found significantly lower in AR when compared with BDNR (p=0.02,
p=0.03 respectively).
23
Table 3-5 Mean intake of calcium, phosphorus, zinc, iron phytate and oxalate per kg body weight in the different
study groups
Nutrient
intake mg per
kg body
weight
AR AR-VC AR
vs
AR-
VC
BDNR BDNR-VC BDNR
vs
BDNR-
VC
AR
vs
BDNR
n=24 n=24 p n=38 n=38 P p
Calcium 16 (8.0) 29 (23.3) 0.02 21 (15.2) 19 (12.7) 0.4 0.1
Phosphorus
mg
34 (10.6) 45 (18.7) 0.3 33 (11.2) 36 (14.1) 0.3 0.8
Iron 0.5 (0.2) 0.5 (0.3) 0.5 0.4 (0.2) 0.4 (0.2) 0.7 0.7
Zinc 0.4 (0.1) 0.3 (0.1) 0.7 0.3 (0.2) 0.3 (0.1) 0.8 0.6
Phytate 33.3 (9.12) 27.3 (8.4) 0.007 28.6 (13.2) 31.5(13.7) 0.15 0.07
*Oxalate 1.7 (0.7, 2.7) 1.4 (0.6, 3.7) 0.9 0.8 (0.4,
1.9)
1.0 (0.4, 2.6) 0.4 0.06
Normally distributed data; the results are mean (SD). The paired t-test and 2 sample t-test p-values are
presented. Significant difference at p≤0.05 between groups is denoted by a bold p-value.
*Non-normally distributed data; the results are median (25 th percentile, 75th percentile). Mann-Whitney
test p-values are presented. Data on bone mineral is taken from Dr. Ahmed’s PhD thesis and
reanalysed with her permission [9]. Data did not show any difference after reanalysis.
The data of oxalate intake was not normally distributed. So, instead of presenting mean with
SD, median intake of oxalate of the different study groups with 25th and 75th percentile
values are presented in Table 3-4 and Table 3-5. Oxalate intake per 1000 kcal of food
energy was higher in AR compared to their controls, BDNAR and their controls. However,
there were no significant difference between AR and AR-VC (median difference 0.08,
p=0.84), BDNR and BDNR-VC (median difference -5.1, p=0.34) or between AR and BDNR
(median difference 11.8, p=0.13). Similar pattern was seen when the oxalate intake was
presented per kg body weight.
3.3 Contribution of different foods to phytate and oxalate
In this section, the contribution of different food groups to intake of phytate and oxalate are
shown. For phytate intake, all foods were divided into seven food groups: rice, wheat
products, vegetables, legumes, fruits and nuts, confectionary and beverages. For oxalate
intake, foods were divided into six food groups: rice, wheat products, vegetables, legumes,
fruits and nuts and confectionary. In both the groups rice includes white boiled rice and
puffed rice. Figure 3.1 shows the distribution of phytate sources among all participants.

24
Vegetables on their own and part of composite dishes were the greatest contributor of phytic
acid (31%) followed by rice (24%). Confectionary was the third contributor [17% of total
confectionary intake was broken down into biscuits (11%), homemade cake (3%), purchased
sponge cake (1%), chanachur/chevra, a popular snacks in Bangladesh which is a mixture of
dried lentil, rice flakes and roasted peanuts (2%)]. It should be noted that most of the
confectionary items were made of wheat flour (e.g. cake, biscuit). Considering rice, wheat
and legumes together it can be shown that 41% phytic acid came from these three sources.
Fruits and nuts contributed only 10% with a very low contribution of beverages for example,
tea (<1%).
Figure 3-1 The main sources of phytate intake among all participants
Figure 3.2 presents the distribution of sources of oxalate among all participants. Vegetables
were again found to be the greatest contributor (52%, about 16% came from mixed
vegetable curry, raw and roasted vegetables, and the rest from leafy vegetables, and other
composite dishes prepared with vegetables, fish, meat or egg) followed by rice (27%). Fruits
and nuts was the third contributor (10%). Results show that almost two third of the oxalic
acid came from vegetables and fruits. Wheat products and confectionary contributed a very
little to the intake of oxalic acid (1% and 4% respectively).
Rice24%
Wheat products10%
Vegetables31%
Legumes7%
Fruits and Nuts10%
Confectionary17%
Beverage1%

25
Figure 3-2 The main sources of oxalate intake among all participants
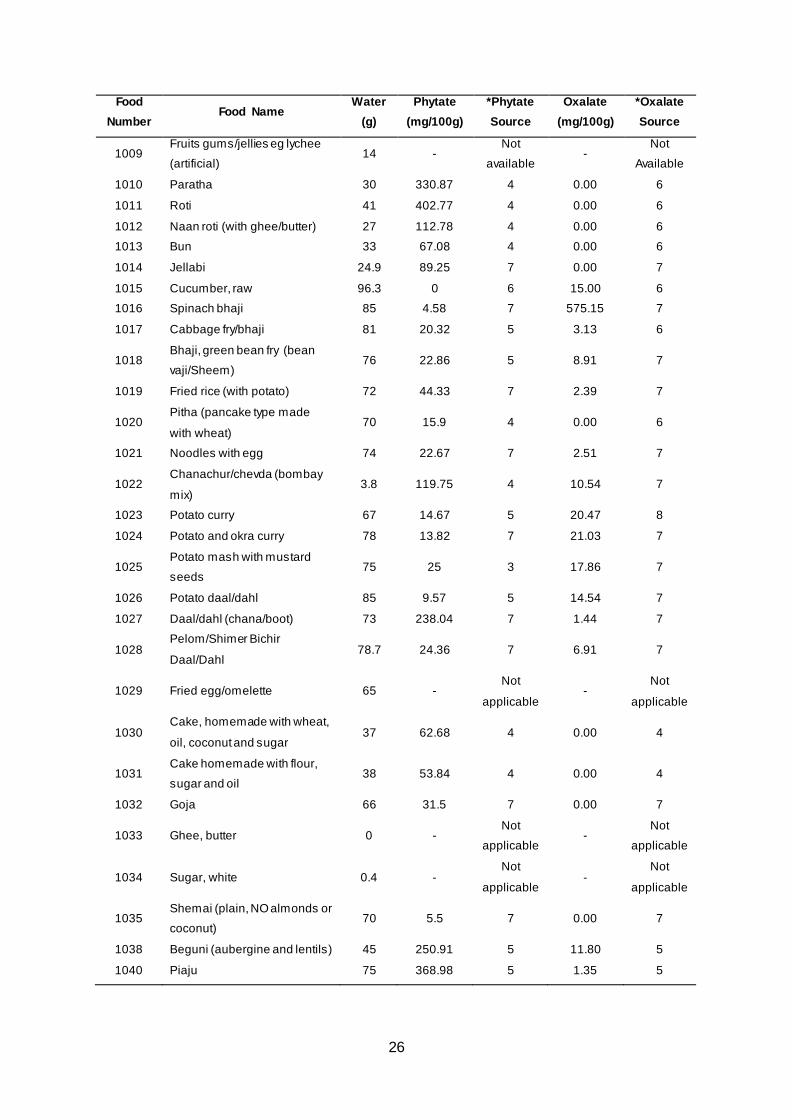
A detail list of 117 foods which I have derived phytate and oxalate values for has been
attached herewith. List of foods with water content (g), phytate content (g/100g) and source
of information, oxalate acid content (g/100g) and source of information have been included
here (Table 3-6):
Table 3-6 List of foods with their phytate and oxalate values (mg/100g) and sources of inform ation
Food
Number Food Name
Water
(g)
Phytate
(mg/100g)
*Phytate
Source
Oxalate
(mg/100g)
*Oxalate
Source
1001 White rice, boiled 69.9 55.54 1 0.34 1
1002 Puffed rice (muri) 14.7 47 6 0.00 6
1003 Biscuits 1 142.15 4 - Not
available
1004 Curry, mung bean dahl,
Bengali 83 225.17 7 0.05 7
1005
Curry, lentil, red/masoor dahl,
with vegetable oil
(mushari/moshuar dal/dahl)
50 46.62 7 1.37 7
1006 Eggs, chicken, boiled 75 - Not
applicable -
Not
applicable
1007 Sponge cake, purchased 14 30 4 - Not
Available
1008 Boiled sweets eg lozenge,
lollypop/lollipop 13 -
Not
applicable -
Not
Available
Rice27%
Wheat products1%
Vegetables52%
Legumes6%
Fruits and Nuts10%
Confectionary4%
26
Food
Number Food Name
Water
(g)
Phytate
(mg/100g)
*Phytate
Source
Oxalate
(mg/100g)
*Oxalate
Source
1009 Fruits gums/jellies eg lychee
(artificial) 14 -
Not
available -
Not
Available
1010 Paratha 30 330.87 4 0.00 6
1011 Roti 41 402.77 4 0.00 6
1012 Naan roti (with ghee/butter) 27 112.78 4 0.00 6
1013 Bun 33 67.08 4 0.00 6
1014 Jellabi 24.9 89.25 7 0.00 7
1015 Cucumber, raw 96.3 0 6 15.00 6
1016 Spinach bhaji 85 4.58 7 575.15 7
1017 Cabbage fry/bhaji 81 20.32 5 3.13 6
1018 Bhaji, green bean fry (bean
vaji/Sheem) 76 22.86 5 8.91 7
1019 Fried rice (with potato) 72 44.33 7 2.39 7
1020 Pitha (pancake type made
with wheat) 70 15.9 4 0.00 6
1021 Noodles with egg 74 22.67 7 2.51 7
1022 Chanachur/chevda (bombay
mix) 3.8 119.75 4 10.54 7
1023 Potato curry 67 14.67 5 20.47 8
1024 Potato and okra curry 78 13.82 7 21.03 7
1025 Potato mash with mustard
seeds 75 25 3 17.86 7
1026 Potato daal/dahl 85 9.57 5 14.54 7
1027 Daal/dahl (chana/boot) 73 238.04 7 1.44 7
1028 Pelom/Shimer Bichir
Daal/Dahl 78.7 24.36 7 6.91 7
1029 Fried egg/omelette 65 - Not
applicable -
Not
applicable
1030 Cake, homemade with wheat,
oil, coconut and sugar 37 62.68 4 0.00 4
1031 Cake homemade with flour,
sugar and oil 38 53.84 4 0.00 4
1032 Goja 66 31.5 7 0.00 7
1033 Ghee, butter 0 - Not
applicable -
Not
applicable
1034 Sugar, white 0.4 - Not
applicable -
Not
applicable
1035 Shemai (plain, NO almonds or
coconut) 70 5.5 7 0.00 7
1038 Beguni (aubergine and lentils) 45 250.91 5 11.80 5
1040 Piaju 75 368.98 5 1.35 5

27
Food
Number
Food Name
Water
(g)
Phytate
(mg/100g)
*Phytate
Source
Oxalate
(mg/100g)
*Oxalate
Source
1041 Chick peas, roasted 10.7 515.25 1 3.00 6
1042 Shimer seed, roasted 11.5 136 6 0.00 6
1043 Patti, purchased 50 - Not
Available -
Not
Available
1044 Vegetables with gravy 91 4.41 7 1.18 7
1045 Prawn curry with vegetables 89.8 2.41 7 11.95 7
1047 Curried vegetables with egg 86 0.63 7 4.49 7
1048 Kul - plum pickle 89 2.45 7 1.10 7
1049 Tea, black, infusion ONLY 100 2 12 - Not
available
1050 Sweetcorn, corn on the cob,
roasted 61.7 54.1 6 9.00 6
1051 Tara 85.6 - Not
available -
Not
Available
1053 Yam with spinach 79 142.88 7 1.39 7
1054 Yam with spinach and shimer
seed 77.7 158.06 7 6.15 7
1055 Yam with spinach and prawn 78 158.06 7 6.01 7
1056 Pat spinach (shak) 67.4 17.06 7 130.44 7
1057 Radish with spinach 87 6.6 7 1.39 7
1058 Brinjal fry/curry 86 3.9 7 27.91 7
1059 Pumpkin (misti kumra) 90 - Not
Available -
Not
Available
1060 Fruit juice eg orange (made up
from concentrate) 94.9 -
Not
Available -
Not
Available
1061 Vegetable curry 88 0.53 7 13.11 7
1062 Banana 70.1 4 6 0.00 6
1063 Kamranga/ Carambola/
Starfruit 91.9 -
Not
available 282.56 2
1064 Amloki/ Amla/ Gooseberry 81.8 8 1 296.00 6
1065 Guava 81.7 16.15 6 15.07 6
1066 Apple 84.6 0 1 9.22 1
1067 Pai namala (betfol) 80.8 13 6 200.00 6
1068 Ugli fruit/ Jambura/ Grapefruit 92 - Not
available 0.00 2
1069 Taam 77.2 - Not
Available -
Not
Available
1070 Coconut flesh ONLY 36.3 69.07 2 - Not
Available
1071 Anar gula/ Pomegranate 80.9 11.52 6 13.37 6

28
Food
Number Food Name
Water
(g)
Phytate
(mg/100g)
*Phytate
Source
Oxalate
(mg/100g)
*Oxalate
Source
1072 Olive 82 - Not
available -
Not
Available
1073 Boroi/ Indian plum/ Jujuba 73.2 6.56 10 8.82 10
1074 Sugar cane 90.2 - Not
Available -
Not
Available
1075 Fish with gravy 71.5 - Not
applicable -
Not
applicable
1076 Fish, fried 65.4 - Not
applicable -
Not
applicable
1077 Fish cooked with vegetables 80.8 0.92 7 6.82 7
1078 Vegetables cooked with small
fish 79.7 2.33 7 4.87 7
1079 Fish curry with potato 67.5 3.05 7 7.21 7
1080 Bata fish 63.3 - Not
applicable -
Not
applicable
1081 Bata fish with shem bichi curry 83.4 0.26 7 2.64 7
1082 Tangra fish 68.8 - Not
applicable -
Not
applicable
1084 Kaski fish 83.5 - Not
applicable -
Not
applicable
1085 Kaski fish with brinjal curry 72.7 2.3 7 4.87 7
1086 Nailotika fish (Tilapia) 68.8 - Not
applicable -
Not
applicable
1089 Loitta/ Lota fish 70.4 - Not
applicable -
Not
applicable
1090 Mango, ripe 81 0 6 26.00 6
1091 Milk powder eg Dano 3 - Not
applicable -
Not
applicable
1095 Bele fish fry 65.4 - Not
applicable -
Not
applicable
1099 Hilsa with potato 59.1 3.05 7 7.21 7
1101 Dried prawn (chingree sutki)
with radish and brinjal curry 76 0.61 7 5.51 7
1102 Dried prawn (chingree sutki)
curry 76 -
Not
applicable -
Not
applicable
1103 Dried fish (Churi shootki) curry 79.5 - Not
applicable -
Not
applicable
1104 Liver curry (Beef Kolija) 73 - Not
applicable -
Not
applicable
1106 Meat curry 76 - Not
applicable -
Not
applicable

29
Food
Number Food Name
Water
(g)
Phytate
(mg/100g)
*Phytate
Source
Oxalate
(mg/100g)
*Oxalate
Source
1107 Beef with radish curry 78 0.31 7 2.01 7
1108 Beef curry 76 - Not
applicable -
Not
applicable
1109 Chicken with pumpkin 79 - Not
Available -
Not
available
1110 Chicken curry with potato 78 4.59 7 3.15 7
1112 Chicken skin with radish and
green banana curry 79 2.81 7 0.64 7
1113 Chicken curry (chicken meat
and gravy) 79 -
Not
applicable -
Not
applicable
1114 Crab bhuna 76 - Not
applicable -
Not
applicable
1115 Chocolate, milk 4 - Not
applicable -
Not
applicable
1116 Vermicilli made with water 68 5.5 7 0.00 7
1117 Vermicilli made with milk and
coconut 61 7.74 7 0.00 7
1118 Milk, cow 87.5 - Not
applicable -
Not
applicable
1119 Yam, boiled (with spices) 74 64.18 7 20.12 7
1120 Tamarind, green 20.9 5.74 10 1.55 10
1121 Lichi/Lychee 84.1 0 6 19.00 6
1122 Puagula 23 74.68 8 0.00 8
1123 Nimki 24 74.68 8 0.00 8
1124 Ice cream (sugar, coconut,
water) 41 -
Not
applicable -
Not
applicable
1125 Samosa/samucha 51.3 31.75 8 4.32 8
1126 Chotpoti 87 238.82 7 3.96 7
1127 Chips/Crisps, ready bought 2 95 11 - Not
Available
1128 Papaya 90.8 4 6 1.00 6
1129 Shapla flower 49.1 - Not
available -
Not
available
1130 Orange 87.6 1 6 10.00 6
1131 Chewing gum 0 - Not
applicable -
Not
applicable
1132 Radish, raw 94.4 0 6 9.00 6
1133 Jackfruit 76.2 17 6 27.00 6
1134 Peanuts 6 747.61 2 160.00 9

30
*Source Denotes
Food Composition Table for Bangladesh-FAO-INFOODS, 2013 1
Fruit and Nuts. 1st supplement to 5th edition of M&W the Composition of foods.UK. 1992 2
Vegetables, herbs and spices. 5th supplement to 4th edition of M&W the Composition of
foods.UK. 1992
3
Cereals and cereal products. 3rd supplement to 4th edition of M&W the Composition of
foods.UK. 1988
4
Vegetable dishes. 2nd supplement to 5th edition of M&W the Composition of foods.UK. 1992 5
Nutritive Value of Indian Foods , 1989 6
Calculated from recipe used in Dr. Sonia Ahmed’s PhD theses, 2014 7
Immigrant Foods, Second supplement to M&W the Composition of foods.UK. 1989 8
Journal of Food Composition and Analysis 19 (2006) 340-347 9
Journal of Food, Agriculture and Environment Vol. 10(1):16-19.2012
10
Journal of Food Composition and Analysis 17 (2004) 217–226 11
World Rev Nutr Diet. 1987;52:235-59. 12

31
4. DISCUSSION
The current study was aimed to provide novel data which can be used in the assessment of
dietary intakes in rural Bangladesh. Prospective weighed 24-hour records of dietary intake of
children collected in Chakaria, Bangladesh was used for this study [9]. An extensive
literature review was done to find phytate and oxalate content of Bangladeshi foods listed
from the dietary assessment of 1.0 to 10.9 month old children. Data were analysed to get
information on intake of phytate and oxalate, main contributory foods. In this section, I have
compared the findings with other available data from Bangladesh and other parts of the
world. I have also included limitations of this study and recommendations for the direction of
future research.
4.1 Findings from literature review
Databases from different parts of the world, papers published in peer reviewed journals,
books, food composition tables of different countries were reviewed in a structured way
which confirmed the paucity of data on phytic acid oxalic acid. There were specific hurdles
which I had to cross in doing this literature searching.
There was a limited number of published data in Bangladesh on food composition.
Most of the food composition tables either did not have information on phytate or
oxalate content, or did not include specific foods which I was looking for. There was
no single food composition table which included all the foods. A recently published
food composition table (FCT) of Bangladesh which is methodically done and
available in FAO-INFOODS website [9]. This FCT included phytate and oxalate
values of only around 70 raw foods which did not cover all foods recorded in my
study, neither cooked items nor composite dishes. As a result I had to look for other
sources from different countries, information on foods grown in a different climate,
soil. ‘Nutritive Value of Indian Foods’ was one of the other source which provided
phytate and oxalate values of raw vegetables which was reported to be eaten raw in
the dietary data and some of the raw vegetables which was used for recipe
calculation and most of the fruits, spices, herbs and condiments [20]. I collected
information of raw foods, put the values in recipe and converted them to cooked
values.
Phytate and oxalate values of foods which was available in other sources either did
not match the search criteria or not analysed using standard method.
At the beginning of searching, I aimed to collect phytate and oxalate values on a
specific food from the source from which Dr. Ahmed collected other nutrient values.
However, it was possible for only a very few number of foods. The other issue was

32
the availability of information on both phytate and oxalate value from a single source.
As mentioned in the methodology, the majority of the phytate values of composite
dishes were collected from supplements of McCance and Widdowson’s ‘The
Composition of Foods’ [11-16]. However, these supplements do not provide oxalate
values of composite dishes or vegetables. They only give oxalate values of certain
fruits most of which are not available or consumed in Bangladesh. For oxalate values
of composite dishes I followed the same recipe which Dr. Ahmed followed in her PhD
thesis, collected oxalate values mostly from other sources, put them in the recipe and
calculated the cooked value of oxalate. Using two different sources of foods which
was analysed separately would definitely leave a chance for variability.
There were a number of foods for which no information was available in any of the
sources aforementioned. For these foods, I had to select sources of foods from other
countries, for example, tamarind and Jujuba was of Nigerian origin, yam leaves were
from Africa, tea was from USA etc, grown under different environment and treatment.
There was no way of comparing values of these foods with same foods grown in
Bangladesh.
Table 4-1 A few sources of information on phytic acid (PA) and oxalic acid (OA) content of food
Author Food items Raw/
cooked
Origin of food PA value OA value Water
content
Shaheen et al.
2013
Rice, maize, wheat,
legumes, vegetables,
fruits
Raw Bangladesh Yes Yes Yes
Holland et al.
1992
Fruits and nuts Raw - Yes Yes Yes
Holland et al.
1992
Vegetable dishes cooked - Yes No Yes
Gopalan et al.
1989
Rice, maize, wheat,
legumes, fruits,
vegetables, condiments
Raw India Yes No Yes
Amoo et al. 2012 Tamarind, jujube Raw Nigeria Yes Yes Yes
Judprasong et al.
2006
Vegetables, cereals,
legumes
Raw,
boiled
Thailand No Yes Yes
Ferguson et al,
2007
Rice, peanut,
mungbean
Raw,
cooked
Indonesia Yes No Yes

33
4.2 Findings from dietary analysis
In this section, findings from dietary analysis are discussed and evaluated in the light of
existing literature on phytate and oxalate. The current study provides novel information on
intake of phytic acid and oxalic acid, two strong dietary factors potentially related to bone
health, from Bangladeshi foods recorded in the prospective weighed 24-hour records of
dietary intake in Dr. Ahmed’s study [9]. Ahmed et al. showed that the quality of the diet of
these study children was poor. The diet was low in calcium with a dominance of cereals,
vegetables and legumes which we know are rich sources of phytate and oxalate from
literature probably making the calcium less bioavailable to the body. Similar dietary intake
had been noted in earlier studies on rickets conducted in Chakaria, Nigeria, The Gambia and
India [27-30]. However, there was a lack of studies which had investigated the phytic acid
and oxalic acid content of various foods in Bangladesh, and specifically in Chakaria region.
Moreover, there was a dearth of information on the contribution of different food groups in
total phytate and oxalate intake in this region. In my study, dietary analysis showed that rice,
wheat products (flat breads, noodles, vermicelli etc), vegetables together were the major
contributors of phytic acid and oxalic acid in the diet. Vegetables included green leaves,
potato, radish etc. Red gram was the mostly reported pulse in the current study. Legumes,
pulses are very important nutrient sources for many population including Bangladeshis.
Chick pea/bengal gram, red gram, mung beans are very commonly consumed in
Bangladesh. However, presence of very high concentrations of antinutrients can decrease
the nutritional quality.
Dietary analysis showed that foods, grouped as the same type, did not provide same amount
of phytate and oxalate. Phytate and oxalate content varied due to a variation in the water or
moisture content. For example, roti (flat bread) and pitha (pancake) both were made of
wheat flour. However, phytate content of roti was higher compared to pitha which is moister
in type than roti. Phytate content of wheat flour is also affected by cooking temperature and
activation of phytase which is why phytate content of some wheat products are different than
raw wheat flour [31]. Composition of a meal was another important factor in determining
phytate and oxalate intake. For example, both fish curry with green bean seeds and only
green bean fried were reported in the dietary assessment. Recipe calculation showed that
phytate and oxalate content of 100 gram green bean fry was much higher than 100 grams of
fish curry with grean bean. As a result, a meal with rice and green bean fry provided more
phytate and oxalate compared to a meal with rice and fish curry with green bean. Another
notable thing was the increase in antinutrient content after adding specific food items. A very
popular wheat product in Bangladesh is vermicelli. Phytate content of wheat made vermicelli

34
was low when prepared with only water. However, the phytate content increased after
adding coconut, a very rich source of phytate.
In this part, I have presented finding of different studies in Table 4-2. There was a very few
studies on rickets from other parts of the world who included dietary assessment (Table 4.2).
None of the earlier studies on rickets conducted in Bangladesh collected any information
intake of phytic acid and oxalic acid.
Table 4-2 Dietary intake in studies of rickets children and controls (adapted from Dr. Ahmed’s thesis and revised,
updated)
Study and method Subjects Age Phytate mg/d Oxalate mg/d
Ahmed S, 2014,
Bangladesh[9]
Method: 24-h
weighed food intake
& FFQ
AR, n=24 1-6 y 318 15.6
AR-VC, n=24 1-6 y 319.5 18.6
BDNAR, n=38 1-10.6 y 339.5 9.0
BDNAR-VC, n=38 1-10.6 y 402.6 12.4
Thacher et al. 2000,
Bangladesh [28]
Method: Two 24-h
dietary recalls
Rickets, n=123 1-14 y - -
Control, n=123 - -
Graff et al.2004,
Nigeria [32]
Method: Two 24-h
dietary recalls
Rickets, n=15 2-8 y - -
Control, n=15 - -
Aggarwal et al,
2012, India [30]
Method: 24-h recall,
FFQ
Rickets, n=67 <1-<2 y 25 6.7
Control, n=68 <1-2 y 13 7.3
Braithwaite et al.
2012, The Gambia
[29] Method: 2 days
weighed food intake
and FFQ
Rickets follow-up,
n=33
6-10 y 720 -
Control, n=30 6-10 y 720 -
Arsenault et al.
2013,
Bangladesh[33]
Rural normal
children
2-4 y - -
35
There is no recommended daily intake or safe limits of intake of phytic acid and oxalic acid.
As a result, findings of my study could not be compared with a standard recommendation. A
recent study conducted in rural Bangladesh could be cited which used USDA food tables
and reported daily intake of phytic acid to be 286 mg in normal (non-rickets) children. In my
study, daily intake of phytic acid was found to be 318 mg in AR children, however, this intake
was less than half of that in less than 6 year old Gambian Children (Table 4.2). Moreover,
oxalate intake was higher in my study compared to an Indian study conducted on rickets and
their controls who included oxalate intake values collected by 24-h recall assessment [30].
Unlike this aforesaid Indian study which showed a significantly higher intake of phytate in
rickets children, differences in daily phytate and oxalate intake between AR and their
controls were not significant in my study. It should be noted that phytate intake was
significantly higher in Active Rickets children when presented intake per 1000 kcal of food
energy and per kg body weight of the subjects. It means, one of the main outcome of interest
phytate showed the higher intakes in AR than their controls. Dr. Ahmed showed a consistent
and noticeable lower intake of calcium in AR than their controls. It means that AR children
were not only having very low calcium intake, their phytate intake was very high at the same
time which was affecting their calcium absorption.
4.3 Limitations
A major limitation of food composition data is the lack of information on foods of Bangladeshi
origin. While working on Bangladeshi foods, I found a very limited number of sources which
were available electronically. Most of the foods were not analysed by following standard
methods. Organizations who had food composition tables did not necessarily carried out
food analysis and derived data. Some of them have taken data from other sources. In my
study, electronic version of a recently published food composition table of Bangladesh did
provide phytate and oxalate values [25]. The other important source was the ‘Nutritive Value
of Indian Foods’ which was not available electronically [20]. Another limitation of working on
the food composition was the non-availability of both phytate and oxalate values from the
same source. If I could have phytate and oxalate content from same source it would have
given more reliability on the origin of food, analysis method etc.
Losses of phytate and oxalate during domestic food processing and cooking could not be
studied in my project. Cooking method, duration of cooking, temperature could not be taken
into account because there was too little data available to attempt this.
No further analysis was done to see the phytate and oxalate intake in different age groups
and sex. Percentage contribution of different food groups in the total intake of phytate and
oxalate among different study groups has not been studied. This area of work with the data

36
which I have derived will be taken forward by Dr. Sonia Ahmed, Dr. Gail Goldberg and me in
the future.

37
4.4 Conclusion and Recommendations
The data suggests that the diet of young children in Chakaria, Bangladesh is cereal and
vegetables based which contributes to the higher phytate and oxalate intake of children
when compared with total food energy consumption. Dietary assessment through a single
prospective 24 hour weighed record is not sufficient to comment about overall quality of the
diet which is low in calcium and high in phytate and oxalate. Future research should focus on
designing intervention to provide nutrition education to the parents and care givers to modify
the dietary pattern of young children.
More research on food composition is required. Emphasis should be given on updating food
composition tables with revised values. There is a lack of studies on effect of domestic food
processing, traditional cooking methods on antinutrients present in Bangladeshi foods.
Research is required on the effect of household food processing to reduce antinutrients
which can influence mineral bioavailability.

38
REFERENCES
1. Pettifor, J.M. Nutritional rickets in developing countries. Forum Nutr, 2003. 56: p.
176-8.
2. Thacher, T.D. Nutritional rickets around the world: causes and future directions. Ann
Trop Paediatr, 2006. 26(1): p. 1-16.
3. Oginni, L.M, Worsfold, M., Oyelami, O.A, Sharp C.A, Powell, D.E, Davie, M.W.
Etiology of rickets in Nigerian children. J Pediatr, 1996. 128(5 Pt 1): p. 692-4.
4. Okonofua, F. Rickets in Nigerian children: a consequence of calcium malnutrition.
Metabolism, 1991. 40(2): p. 209-13.
5. Fischer, P.R., Rahman, A., Cimma, J.P., Kyaw-Myint, T.O., Kabir, A.R., Talukder, K.,
Hassan, N., Manaster, B.K., Staab, D.B., Duxbury, J.M., Welch, R.M., Meisner, C.A.,
Haque, S., Combs, G.F.Jr. Nutritional rickets without vitamin D deficiency in
Bangladesh. J Trop Pediatr, 1999. 45(5): p. 291-3.
6. ICDDR, B., National Rickets Survey In Bangladesh, 2008. Health and Science
Bulletin, 2009. 7(1)2009.
7. Gibson, R.S., Perlas, L., Hotz, C. Improving the bioavailability of nutrients in plant
foods at the household level. Proceedings of the Nutrition Society, 2006. 65(2): p.
160-168.
8. Holloway, W.D., Argall, M.E., Jealous, W.T., Lee, J.A., Bradbury, J.H., Organic acids
and calcium oxalate in tropical root crops. Journal of Agricultural and Food
Chemistry, 1989. 37(2): p. 337-341.
9. Ahmed, S. Predictors of Childhood Rickets in Bangladesh. PhD Thesis, 2014.
10. NFPCSP. National Food Policy Plan of Action and Country Investment Plan.
Monitoring Report. FPMU. Ministry OF Food. Government of the People's Republic
of Bangladesh. June, 2013.
11. Food Standards Agency. McCance and Widdowson's The Composition of Foods,
Sixth summary edition. . 2002.
12. Holland, B., Unwin, I.D., Buss, D.H. Cereals and Cereal Products. 1988. Third
supplement to McCance and Widdowson's The Composition of Foods. .
13. Holland, B., Unwin, I.D., Buss, D.H. Vegetables, Herbs and Spices. Fifth supplement
to the fourth edition of McCance and Widdowson's The Composition of Foods. ,
1991.
14. Holland, B., Unwin, I.D., Buss, D.H. Fruit and Nuts. Fifth supplement to the fifth
edition of McCance and Widdowson's The Composition of Foods, 1992.

39
15. Holland B, Welch, A., Buss, D.H. Vegetable dishes. Second supplement to the fifth
edition of McCance and Widdowson's The Composition of Foods, 1992.
16. Tan, S.P., Wenlock, R.W., Buss, D.H. Second Supplement to McCance and
Widdowson's The Composition Of Foods ' Immigrant Foods'. 1985.
17. Reddy, N.R, Sathe, K.S. Food Phytates. 2001: p. 165.
18. Deshpande, S.S. Handbook of Food Toxicology. 2002: Taylor & Francis.
19. Swaminathan, S. Essentials of Food and Nutrition. 1985: Bangalore Print. and Pub.
20. Gopalan C, Ramasastri, B.V., Balasubramanian, S.C. Nutritive value of Indian foods.
1993: Hyderabad: National Institute of Nutrition, Indian Council of Medical Research.
Reprint 2005.
21. Wilson, III, Charles,W., Philip, E.S., Robert, J.K.Jr. Analysis of oxalic acid in
carambola (Averrhoa carambola L.) and spinach by high-performance liquid
chromatography. Journal of Agricultural and Food Chemistry, 1982. 30(6): p. 1106-
1108.
22. Wang, N., Hatcher, D.W. and Gawalko,E.J. Effect of variety and processing on
nutrients and certain anti-nutrients in field peas (< i> Pisum sativum</i>). Food
Chemistry, 2008. 111(1): p. 132-138.
23. Norhaizan, M.E., Nor.Faizatul, A.A.W. Determination of phytate, iron, zinc, calcium
contents and their molar ratios in commonly consumed raw and prepared food in
Malaysia. Malaysian journal of nutrition, 2009. 15(2): p. 213-222.
24. Chan, S.S.L., Ferguson, E., Bailey, K., Fahmida, U., Harper, T.B., Gibson, R.S., The
concentrations of iron, calcium, zinc and phytate in cereals and legumes habitually
consumed by infants living in East Lombok, Indonesia. Journal of Food Composition
and Analysis, 2007. 20(7): p. 609-617.
25. Shaheen, N., Rahim, A.T.M.A., Mohiduzzaman, Md., Banu, C.P., Bari, L.Md, Basak
AT, Mannan, M.A., Bhattacharjee, L., Stadlmayr, B. Food Composition Table for
Bangladesh. FAO-INFOODS, 2013.
26. Food Standards Agency. Food Portion Sizes. 3rd Edition. 2002.
27. Combs, G.F., Hassan, N. The Chakaria food system study: household-level, case-
control study to identify risk factor for rickets in Bangladesh. Eur J Clin Nutr, 2005.
59(11): p. 1291-301.
28. Thacher, T.D., Fischer, P.R., Pettifor, J.M., Lawson, J.O., Isichei, C.O., Chan, G.M.
Case-control study of factors associated with nutritional rickets in Nigerian children. J
Pediatr, 2000. 137(3): p. 367-73.
29. Braithwaite, V. Jarjou, L.M., Goldberg, G.R., Jones, H., Pettifor, J.M., Prentice, A.
Follow-up study of Gambian children with rickets-like bone deformities and elevated
plasma FGF23: possible aetiological factors. Bone, 2012. 50(1): p. 218-25.

40
30. Aggarwal, V. Role of calcium deficiency in development of nutritional rickets in Indian
children: A case control study. The Journal of Clinical Endocrinology & Metabolism
2012. 97(10): p. 3461-3466.
31. Ma, G., Li,Y., Jin, Y., Zhai, F., Kok, F.J., Yang, X. Phytate intake and molar ratios of
phytate to zinc, iron and calcium in the diets of people in China. European journal of
clinical nutrition, 2006. 61(3): p. 368-374.
32. Graff, M., Thacher, T.D., Fischer, P.R., Stadler, D., Pam, S.D., Pettifor, J.M., Isichei,
C.O., Abrams, S.A. Calcium absorption in Nigerian children with rickets. Am J Clin
Nutr, 2004. 80(5): p. 1415-21.
33. Arsenault, J.E., Yakes, E.A., Islam, M.M., Hossain, B.M., Ahmed, T, Hotz, C., Lewis,
B., Rahman, A.S., Jamil, K.M., Brown, K.H. Very low adequacy of micronutrient
intakes by young children and women in rural Bangladesh is primarily explained by
low food intake and limited diversity. The Journal of nutrition, 2013: p. jn.
112.169524.

41
*Source Denotes
Food Composition Table for Bangladesh-FAO-INFOODS, 2013 1
Fruit and Nuts. 1st supplement to 5th edition of M&W the Composition of
foods.UK. 1992
2
Vegetables, herbs and spices. 5th supplement to 4th edition of M&W the
Composition of foods.UK. 1992
3
Cereals and cereal products. 3rd supplement to 4th edition of M&W the
Composition of foods.UK. 1988
4
Vegetable dishes. 2nd supplement to 5th edition of M&W the
Composition of foods.UK. 1992
5
Nutritive Value of Indian Foods, 1989 6
Calculated from recipe used in Dr. Sonia Ahmed’s PhD theses, 2014 7
Immigrant Foods, Second supplement to M&W the Composition of
foods.UK. 1989
8
Journal of Food Composition and Analysis 19 (2006) 340-347 9
Journal of Food, Agriculture and Environment Vol. 10(1):16-19.2012
10
Journal of Food Composition and Analysis 17 (2004) 217–226 11
World Rev Nutr Diet. 1987;52:235-59. 12
Related Documents


![Reduction of Oxalate Levels in Tomato Fruit and … of Oxalate Levels in Tomato Fruit and Consequent Metabolic Remodeling Following Overexpression of a Fungal Oxalate Decarboxylase1[W]](https://static.cupdf.com/doc/110x72/5af8e5787f8b9aff288c704b/reduction-of-oxalate-levels-in-tomato-fruit-and-of-oxalate-levels-in-tomato.jpg)