Physiology of Colour vision Othman Al-Abbadi, M.D

Welcome message from author
This document is posted to help you gain knowledge. Please leave a comment to let me know what you think about it! Share it to your friends and learn new things together.
Transcript
Physiology of Colour vision
Othman Al-Abbadi, M.D
Definition • The ability to discriminate between colours
excited by light of different wavelengths.

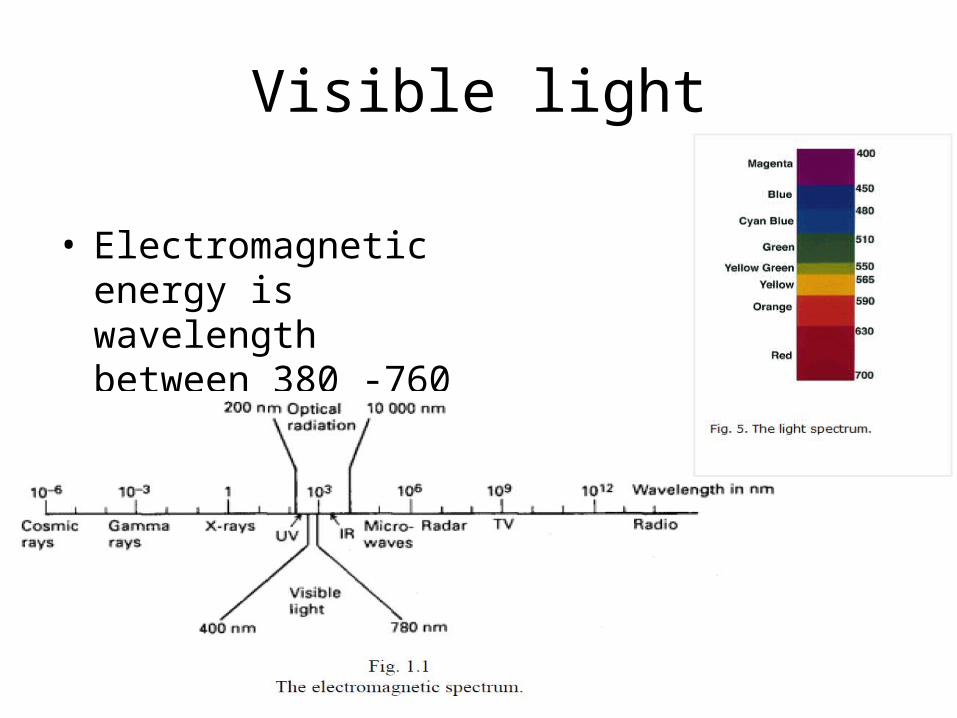
Visible light
• Electromagnetic energy is wavelength between 380 -760 nm
Theories of color vision
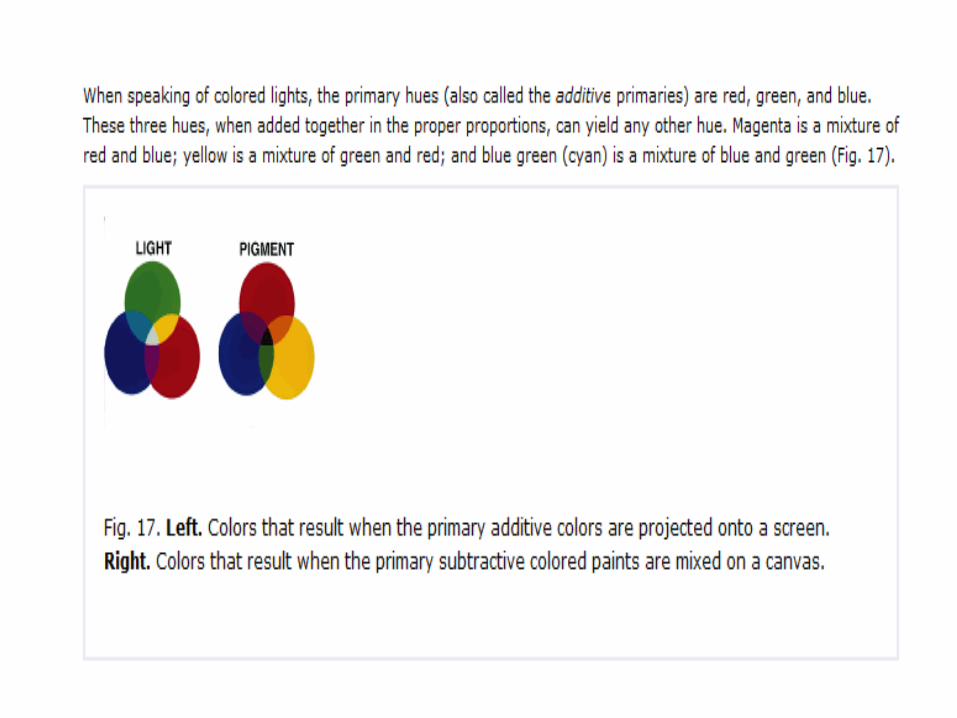
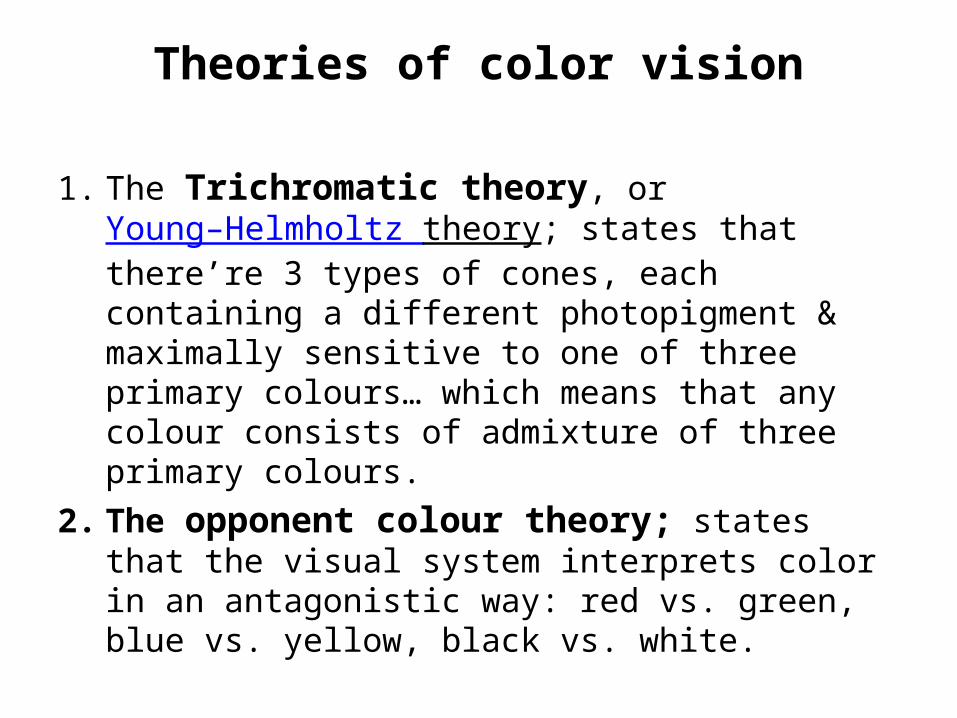
1. The Trichromatic theory, or Young–Helmholtz theory; states that there’re 3 types of cones, each containing a different photopigment & maximally sensitive to one of three primary colours… which means that any colour consists of admixture of three primary colours.
2. The opponent colour theory; states that the visual system interprets color in an antagonistic way: red vs. green, blue vs. yellow, black vs. white.
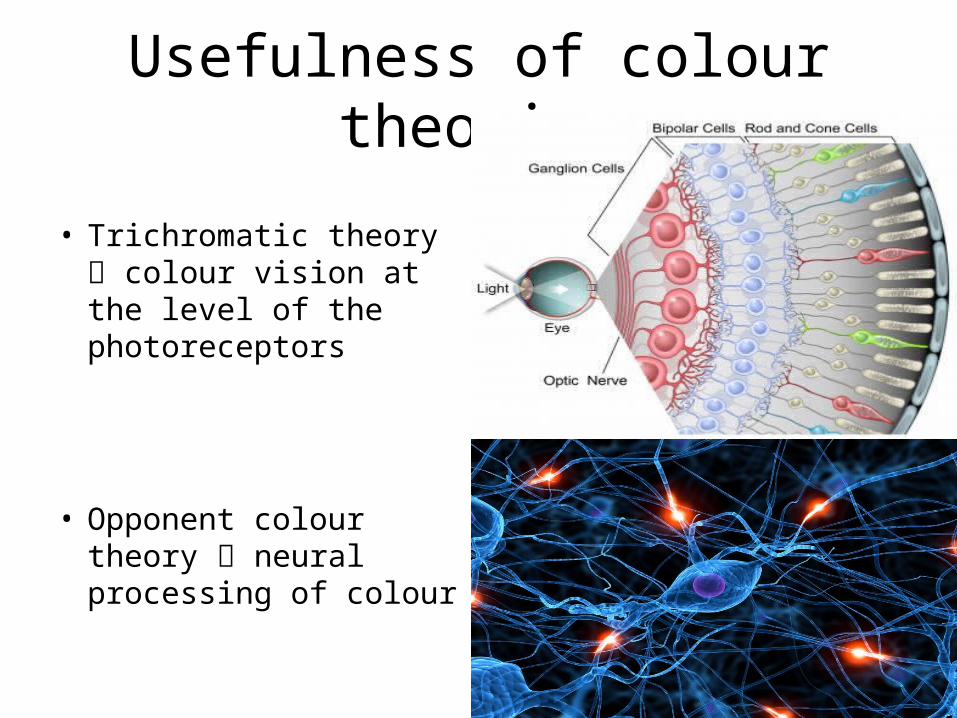
Usefulness of colour theories
• Trichromatic theory colour vision at the level of the photoreceptors
• Opponent colour theory neural processing of colour
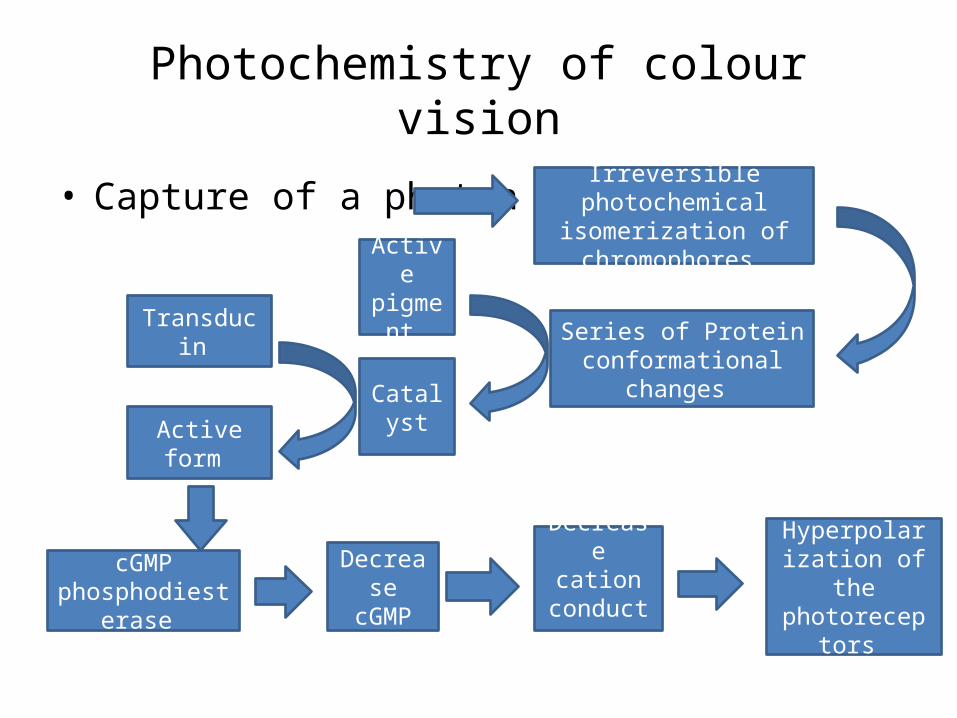
Photochemistry of colour vision
• Capture of a photon Irreversible photochemical isomerization of chromophores
Series of Protein conformational changes
Active pigmen
t
Catalyst
Transducin
Active form
cGMP phosphodiesteras
e
Decrease cGMP
Decrease cation
conductance
Hyperpolarization of the
photoreceptors
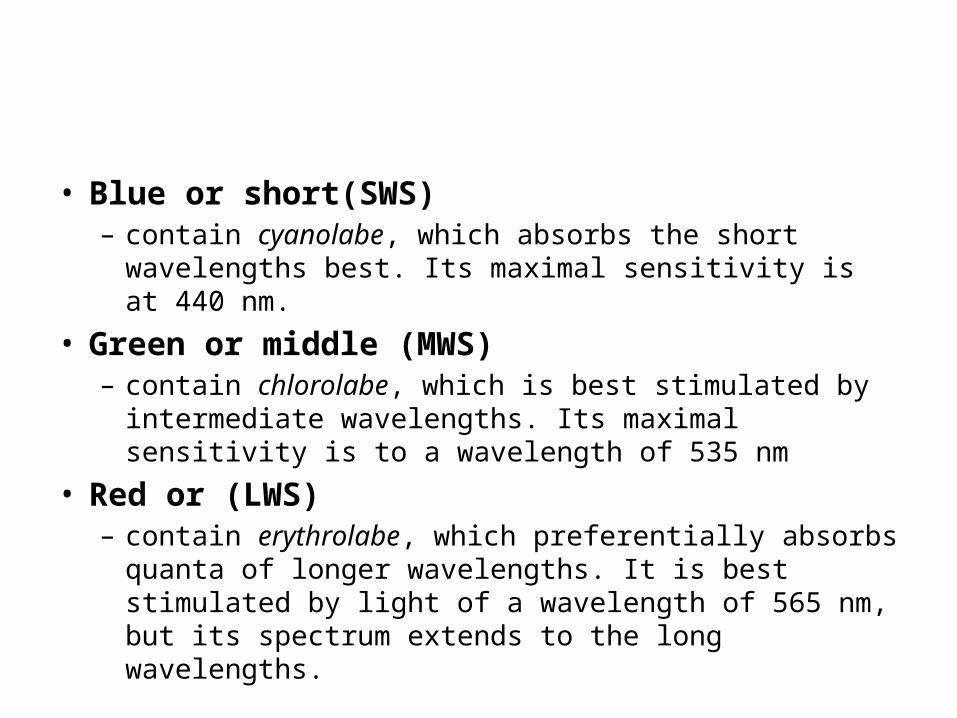
• Blue or short(SWS)– contain cyanolabe, which absorbs the short wavelengths
best. Its maximal sensitivity is at 440 nm.
• Green or middle (MWS)– contain chlorolabe, which is best stimulated by
intermediate wavelengths. Its maximal sensitivity is to a wavelength of 535 nm
• Red or (LWS)– contain erythrolabe, which preferentially absorbs quanta
of longer wavelengths. It is best stimulated by light of a wavelength of 565 nm, but its spectrum extends to the long wavelengths.
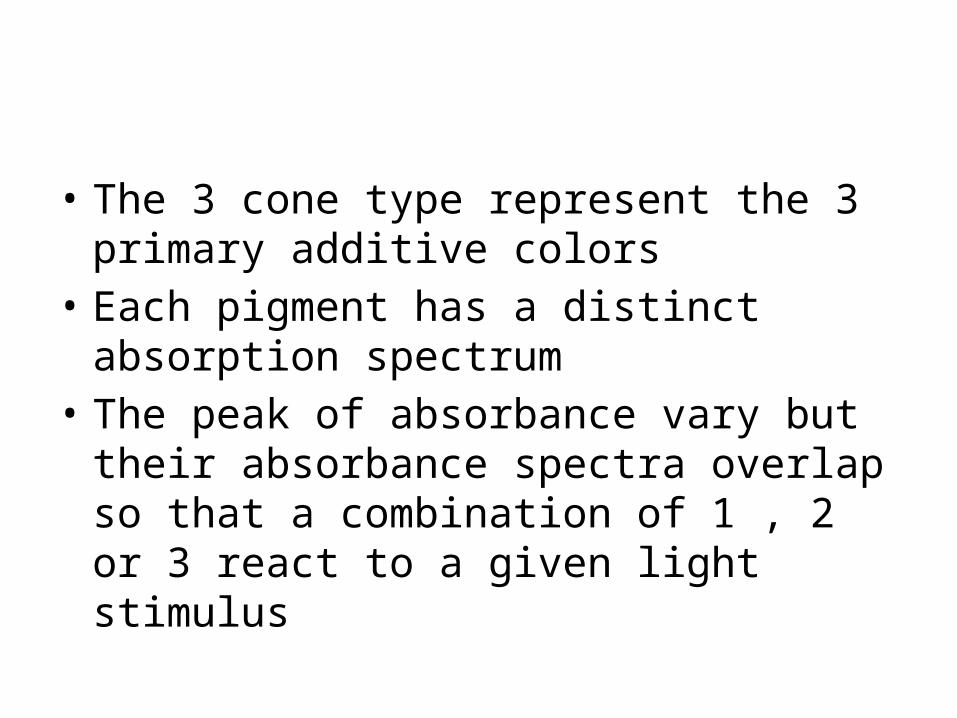
• The 3 cone type represent the 3 primary additive colors
• Each pigment has a distinct absorption spectrum
• The peak of absorbance vary but their absorbance spectra overlap so that a combination of 1 , 2 or 3 react to a given light stimulus
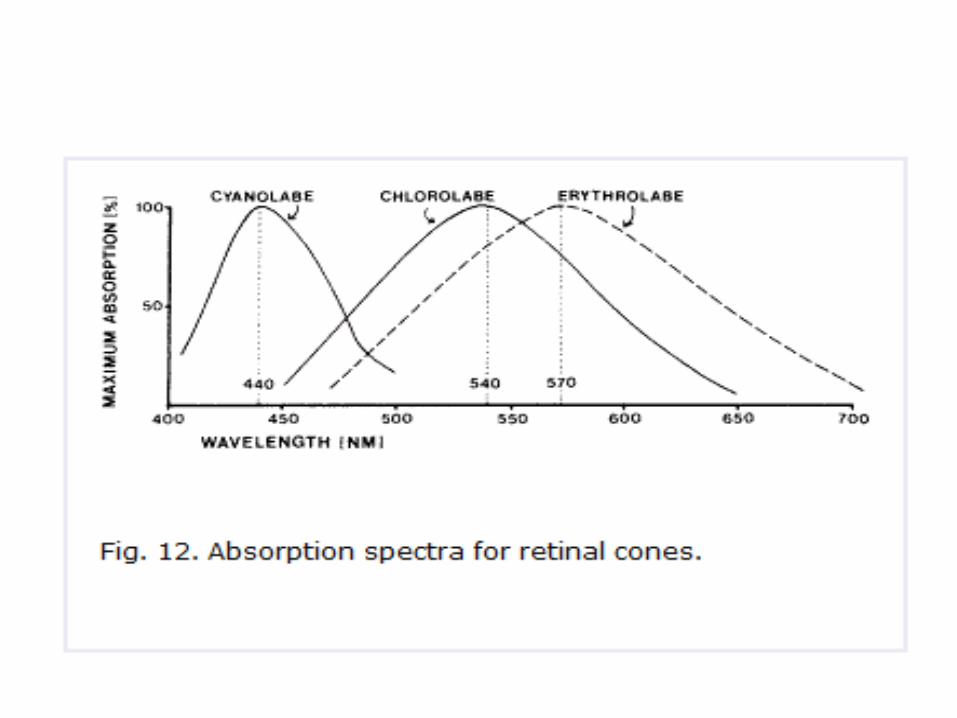

Signal processing in the retina
• Color perception require photon absorption by the 3 classes of receptors with different spectral responses
• The chemical results then transmitted to opponent processes
Signal processing in the retina
• Color perception require photon absorption by the 3 classes of receptors with different spectral responses
• The chemical results then transmitted to opponent processes
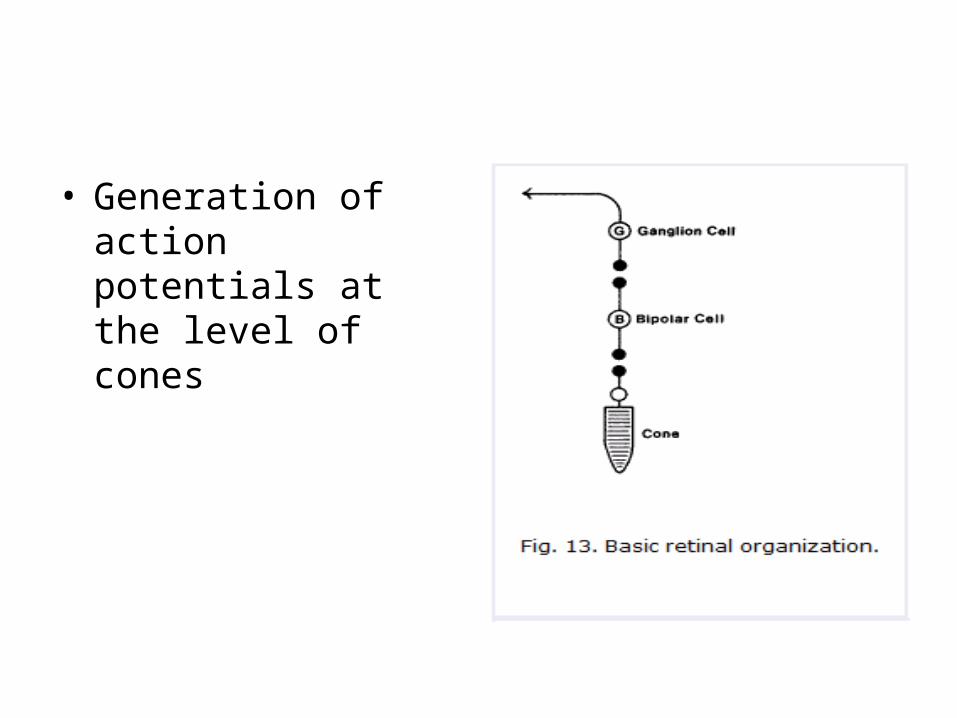
• Generation of action potentials at the level of cones

Horizontal cells
• Two types of responses ;– Luminosity response :
Hyperpolarizing response with broad spectral sensitivity
– Chromatic response :hyperpolarizing for part of the spectrum and depolarizing for the remainder
Evidence for the opponent color coding
• Bipolar cells :• Center surround spatial pattern • Not completely understood.
• Amacrine cells :• Automatic color control
Ganglionic cells
• First Direct evidence for colour coding.• When all 3 types of cones stimulate the same ganglion
the resultant signal is white
• Opponent color cell :– Some cells are stimulated by one color type and inhibited by
the other – Successive colour contrast
• Double opponent color cell :– Opponent for both color and space – Simultaneous colour contrast
Processing of color signals in LGB
• All LGB neurons carry information from more than one cone cell
• Color information carried by the ganglionic cells is relayed to the parvocellular portion of the LGB
• Spectrally non opponent cells constitute about 30% of all LGB neurons
• Spectrally opponent cells make 60% (2 types):– R+/G-– R-/G+– B+/Y-– B-/Y+
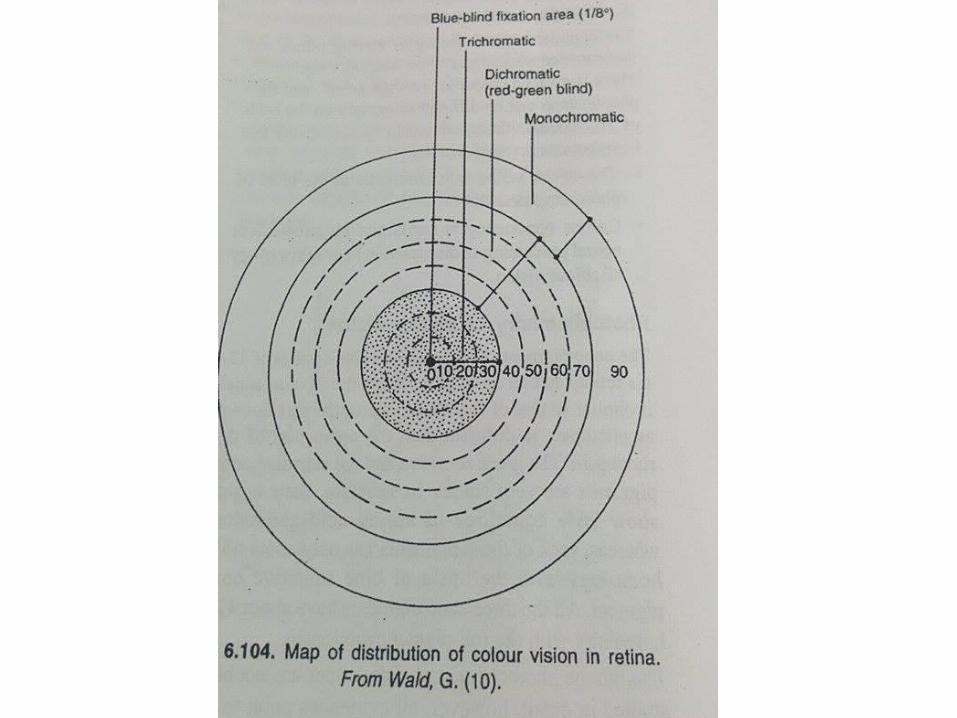
Distribution of color vision in the retina
• Trichromatic color vision mechanisms extend 20 – 30 degrees from the point of fixation
• Peripheral to this red green become indistiguishable
• In the far periphery all color sense is lost • The very center of the fovea (1/8 degree) is blue
blind
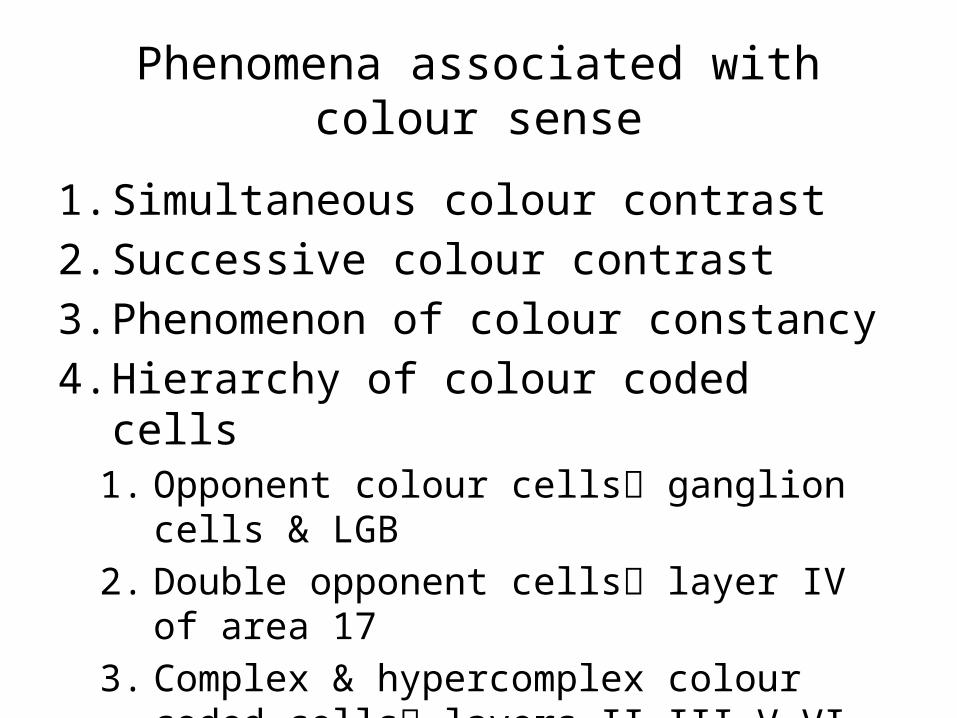
Phenomena associated with colour sense
1. Simultaneous colour contrast2. Successive colour contrast3. Phenomenon of colour constancy4. Hierarchy of colour coded cells
1. Opponent colour cells ganglion cells & LGB2. Double opponent cells layer IV of area 173. Complex & hypercomplex colour coded cells
layers II,III,V,VI of area 17

Colour metric• To overcome the problem of each person have
their name of one single colour.1. CIE system
2. Munsell system
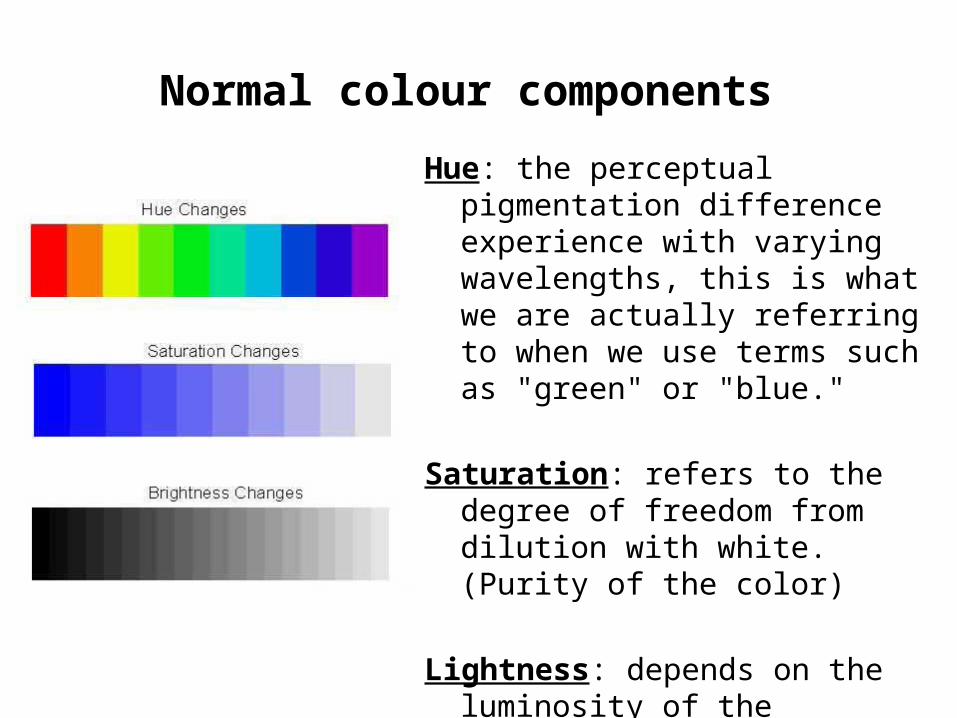
Normal colour components
Hue: the perceptual pigmentation difference experience with varying wavelengths, this is what we are actually referring to when we use terms such as "green" or "blue."
Saturation: refers to the degree of freedom from dilution with white. (Purity of the color)
Lightness: depends on the luminosity of the component wavelength.

490 nm 590 nm
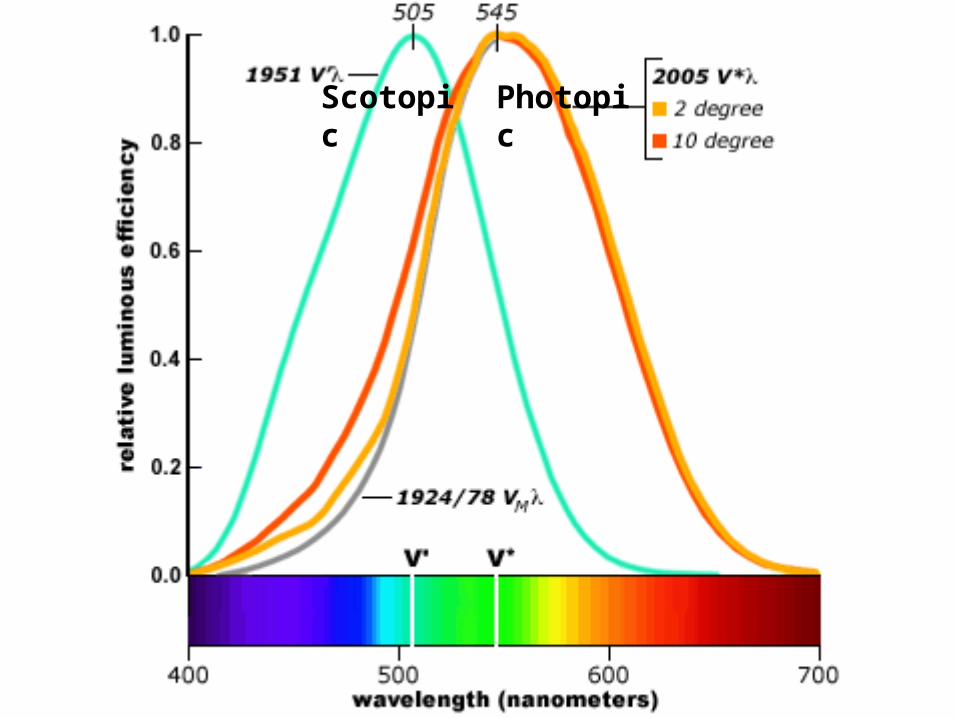
PhotopicScotopic
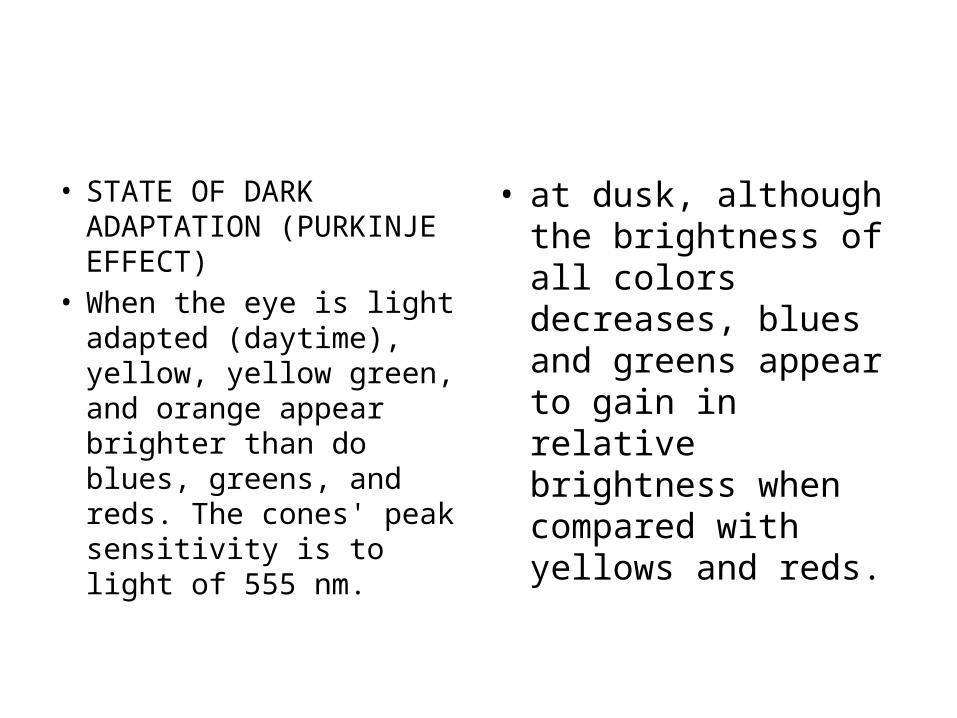
• STATE OF DARK ADAPTATION (PURKINJE EFFECT)
• When the eye is light adapted (daytime), yellow, yellow green, and orange appear brighter than do blues, greens, and reds. The cones' peak sensitivity is to light of 555 nm.
• at dusk, although the brightness of all colors decreases, blues and greens appear to gain in relative brightness when compared with yellows and reds.

Color Blindness
• Normal individual is said to be Trichromate
• Congenital • Acquired

Congenital color blindness • X-linked recessive• Males 3-4% & females 0.4%• Two types:– Dyschromatopsia: colour confusion
• Anomalous trichromatism– Protanomalous – Deuteranomalous – Tritanomalous
• Dichromatism – Protanopia – Deuteranopia – Tritanopia
– Achromatopsia • Cone monochromatism• Rod monochromatism

Deuteranopia
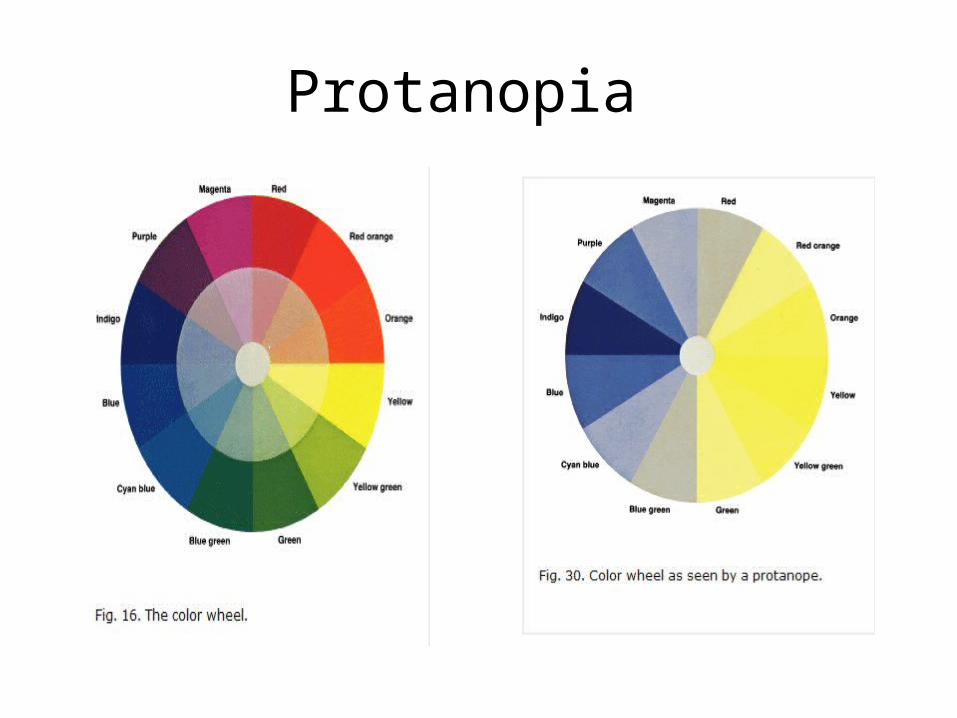
Protanopia
Acquired color blindness
• Damage to the macula or optic nerve • Usually associated with central scotoma or
decreased V.A
• Blue-Yellow deficiency retinal lesions as CSR, macular edema
• Red-Green defieciency optic nerve lesions as optic neuritis, optic nerve compression
• Acquired blue color defects (blue blindness) may occur in old age due to increased sclerosis of crystalline lens.
Color vision testing
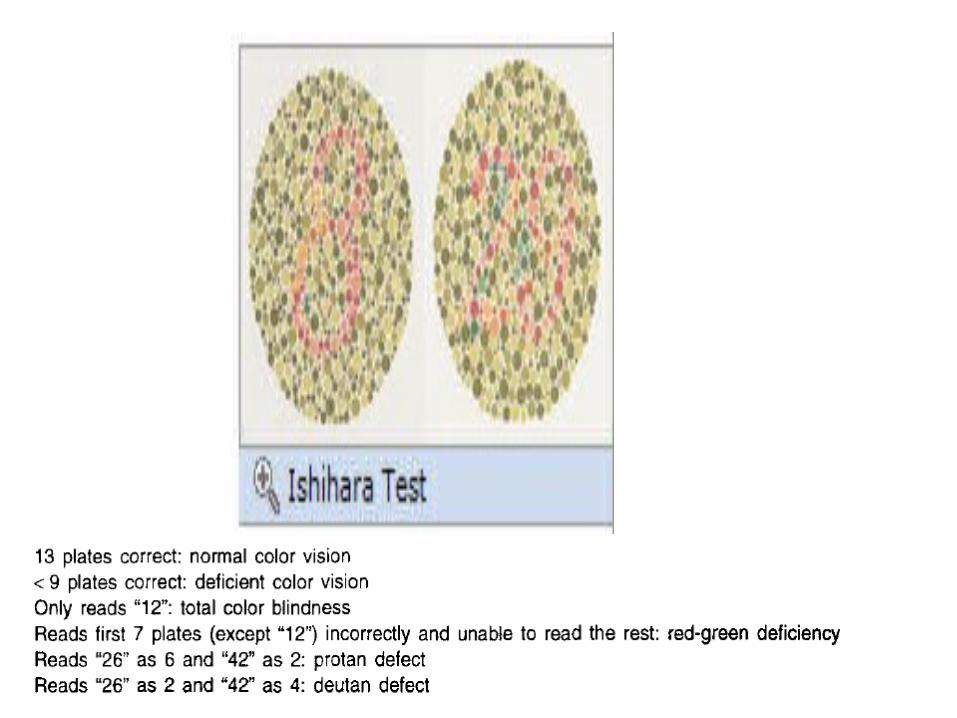
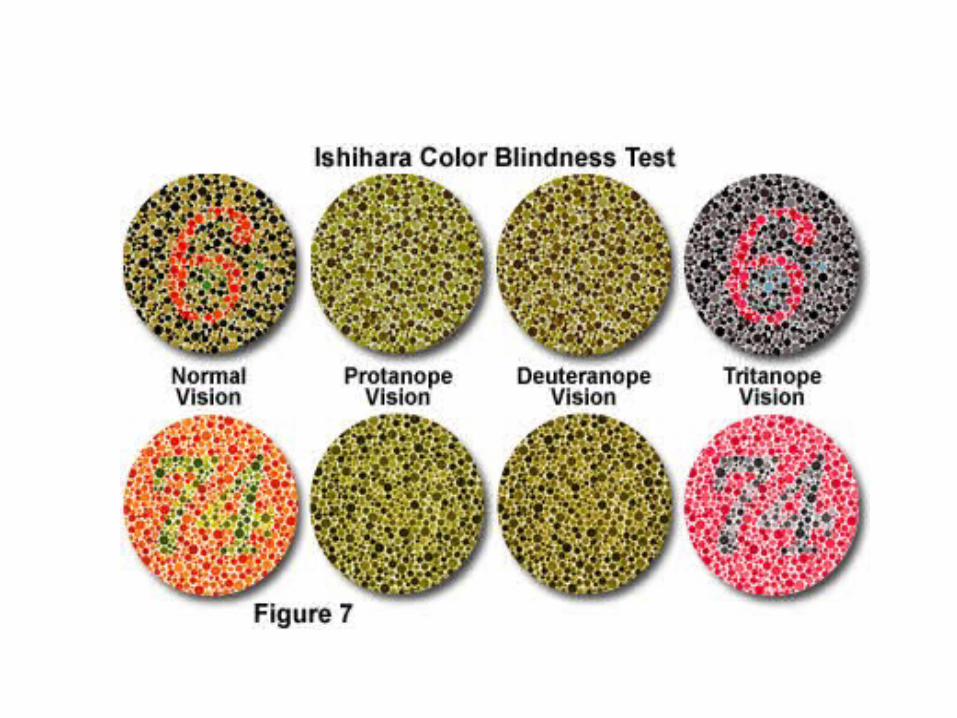
• 1. Pseudoisochromatic color confusion charts
• Most common.• Using Ishihara plates.
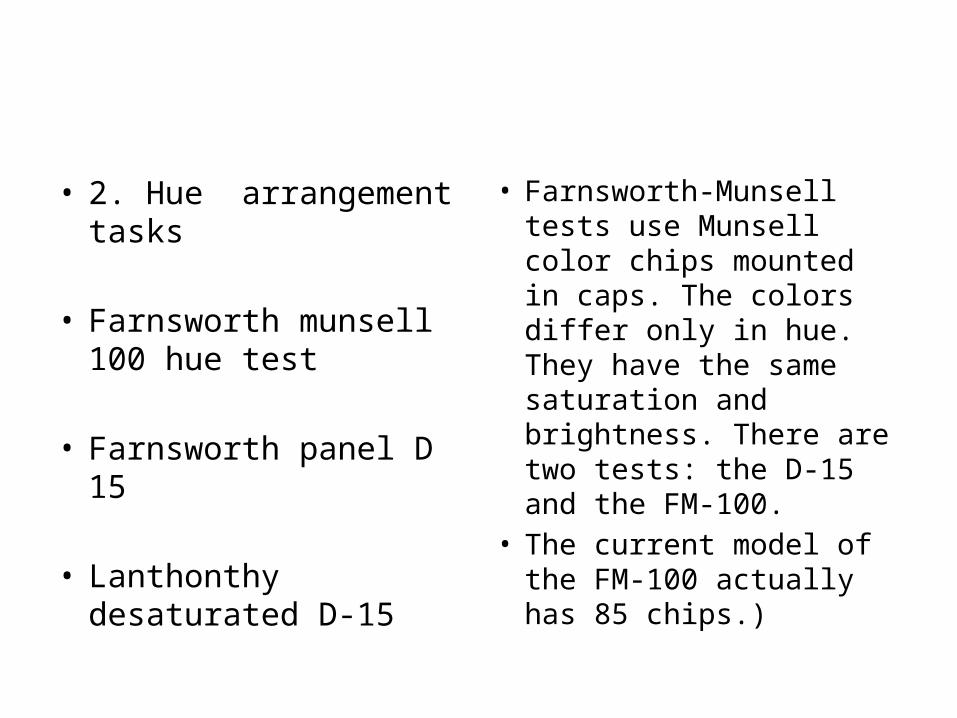
• 2. Hue arrangement tasks
• Farnsworth munsell 100 hue test
• Farnsworth panel D 15
• Lanthonthy desaturated D-15
• Farnsworth-Munsell tests use Munsell color chips mounted in caps. The colors differ only in hue. They have the same saturation and brightness. There are two tests: the D-15 and the FM-100.
• The current model of the FM-100 actually has 85 chips.)
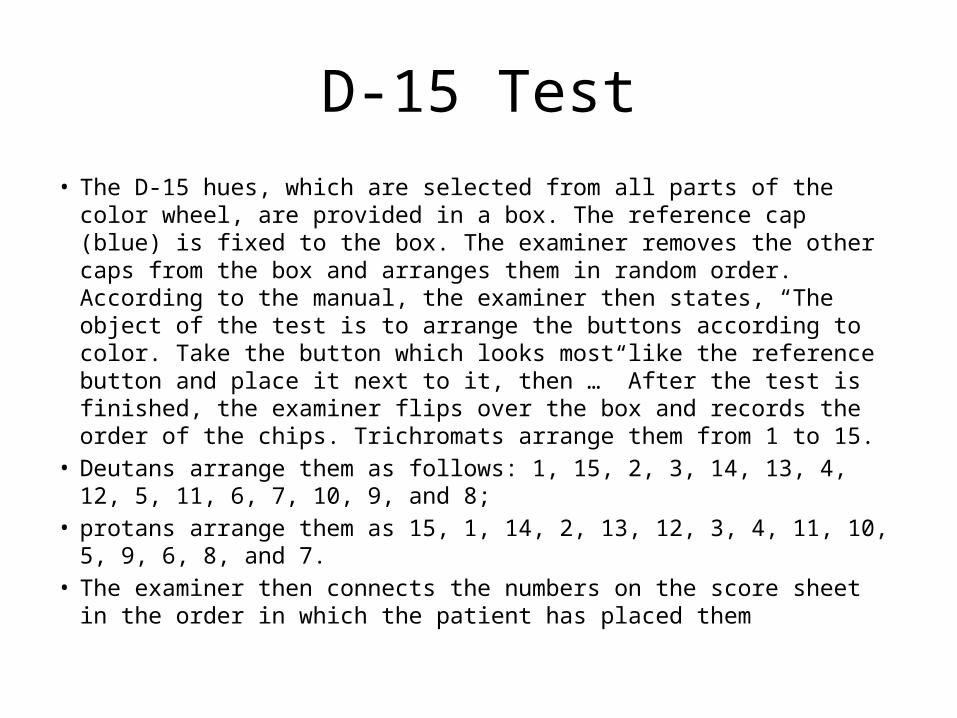
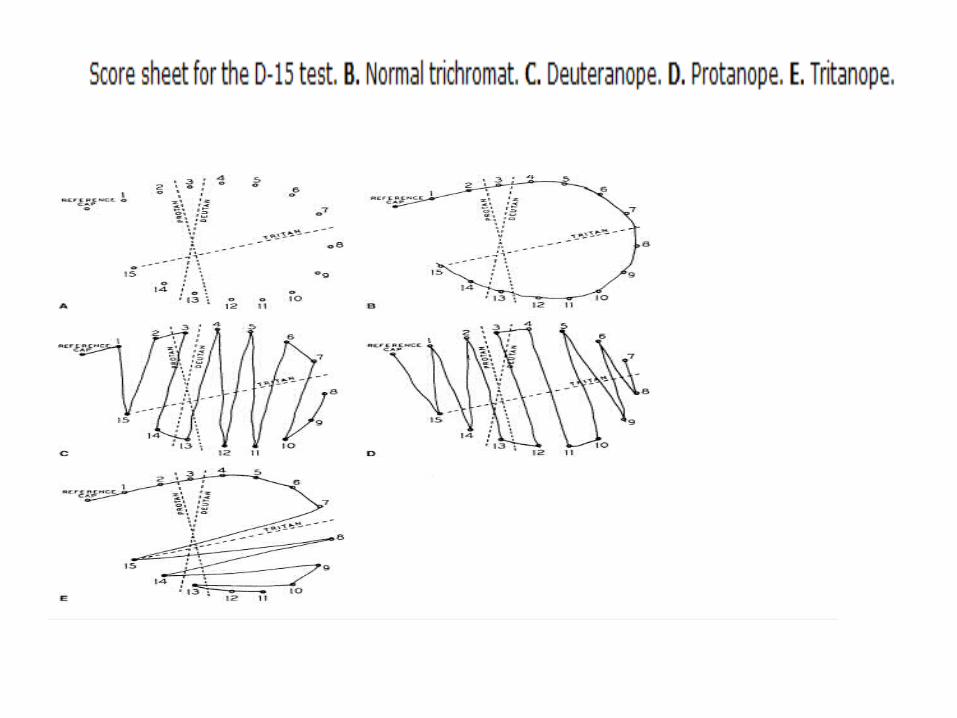
D-15 Test• The D-15 hues, which are selected from all parts of the color wheel, are
provided in a box. The reference cap (blue) is fixed to the box. The examiner removes the other caps from the box and arranges them in random order. According to the manual, the examiner then states, “The object of the test is to arrange the buttons according to color. Take the button which looks most like the reference button and place it next to it, then …” After the test is finished, the examiner flips over the box and records the order of the chips. Trichromats arrange them from 1 to 15.
• Deutans arrange them as follows: 1, 15, 2, 3, 14, 13, 4, 12, 5, 11, 6, 7, 10, 9, and 8;
• protans arrange them as 15, 1, 14, 2, 13, 12, 3, 4, 11, 10, 5, 9, 6, 8, and 7.
• The examiner then connects the numbers on the score sheet in the order in which the patient has placed them

FM-100 Test
• n the FM-100, 85 hues, which, if arranged in a circle, would make a color wheel, are divided into four boxes.
• The dominant wavelengths of box one run from red to yellow; box two, from yellow to blue green; box three, from blue green to purple; and box four, from purple back to red

Related Documents