v\ .5. > IM Su> I /. f /MM m i s c \ Physiological and Biomechanical Responses during High Intensity Upper Body Exercise Submitted for the Degree of Doctor of Philosophy At the University of Northampton 2013 Christopher Talbot © Christopher Talbot 20th March 2013 This thesis is copyright material and no quotation from it may be published without proper acknowledgement.., tfERSITY OF NORTHAMPTON Mo. PARK LIBRARY \ 0 ^ R S U . f r • ;CUASS NO Db P -O M f 17VU

Welcome message from author
This document is posted to help you gain knowledge. Please leave a comment to let me know what you think about it! Share it to your friends and learn new things together.
Transcript
v \.5. >
I M
Su> I
/.
f
/MM
m
i s c \
Physiological and Biomechanical Responses during High Intensity
Upper Body Exercise
Submitted for the Degree of Doctor of Philosophy
At the University of Northampton
2013
Christopher Talbot
© Chris topher Ta lbot 20 th March 2013
This thesis is copyr igh t materia l and no quotation from it may be published w ithout
proper acknowledgement..,tfERSITY OF NORTHAMPTON
Mo.
PARK LIBRARY
\ 0 ^ R S U .f r •
;CUASS NO D b P - O M f 17VU

STATEMENT OF ORIGINALITY
The accompanying thesis subm itted for the degree of Doctor o f Philosophy
entitled 'Physio log ica l and biom echanical responses during high in tensity upper
body exercise ' is based on work conducted by the author in the School of Health
at The University of Northampton m ainly during the period between October
2008 and June 2012
All the work recorded in th is thesis is orig inal unless otherw ise acknow ledged in
the text or by references. If necessary for the deposit o f th is thesis in the
institutional repository, perm ission to d issem inate th ird party m ateria l has been
sought and granted by copyright holders.
None of the work has been subm itted for another degree in th is or any other
University.
Signed Date

Acknowledgements
I would like to thank my superv isor Dr. Mike Price, for his help, guidance and
support during the course of my studies, from our in itial meeting to d iscuss
research ideas to helping shape and support my studies and progress o f th is
thesis. I would also like to thank my second supervisors, Dr. Tony Kay and Dr.
Natalie W alker, for the ir continued help and advice and add itiona lly to Tony Kay
for such unhindered access to the b iom echanics laboratory during my three plus
years of study. To my D irector o f Stud ies Prof. Carol Phillips, thank you for
guiding me through the PhD process, the generous funding for my sabbatica l and
the purchase of all the additional laboratory equipm ent. Thanks you to Dr Tony
Baross for outside support and guidance and to Mark Hobden for assisting with
the final train ing study. I am extrem ely grateful to all the partic ipants for the ir
time and physical efforts.
Finally, I would like to thank my fam ily for the ir support, understanding and
encouragem ent during the past few years.
AbstractFatigue during sport and exercise substantia lly affects the intensity and duration of an activ ity that can be maintained. Upper body exercise (UBE) despite contributing to sport, exercise and health outcom es has received re lative ly little attention particu larly for high intensity exercise. Consequently, the m echanism s of fatigue during UBE are not fully understood. Therefore, the a im s of th is thesis were to investigate a range of high intensity UBE protocols with respect to performance and the developm ent of fatigue. In the first study partic ipants (n = 13) completed four 30-s W ingate anaerobic tests (WAnT) against four d ifferent resistive loadings (2%, 3%, 4% and 5% body mass) thus potentia lly manipulating force production and cadence. Corrected peak power output (PPO) was independent of load (P > 0.05) and uncorrected PPO increased with load (P < 0.05). Results from EMG analysis dem onstrated that all upper body sites increased EMG activ ity at the point of fatigue/m in im um power output (PO). The biceps brachii was predom inately affected by resistive load at corrected and uncorrected PPO. K inem atic analysis revealed sign ificant changes in trunk rotational ve locity which was greater for 3% vs 4% resistive load (P < 0.05). These data suggest that the biceps brachii is an im portant contributor to PPO and that resistive load influences kinem atic responses. In the second study, participants (n = 14) completed four separate high intensity tria ls (80% , 90%, 100% and 110% of peak m inute power; PMP) from an increm ental test for peak oxygen uptake (V 02peak) to volitional exhaustion (TMm) at a fixed cadence and PO. There were sign ificant increases in EMG activation over tim e (s) and in relation to the exercise intensity (P < 0.001). Trunk rotational ve locity increased with load prior to T|im (P < 0.001) although at TMm there were no differences between tria ls (P > 0.05). All partic ipants reached the ir m axim um card ioresp iratory responses (oxygen uptake & heart rate; beats-m in '1) at fatigue. The data suggested that prior to TMm changes in EMG activation and m ovem ent patterns were related to the exercise intensity. In general, all EMG activ ity increased with in tensity and exercise duration, with the kinem atic data indicating that trunk rotational ve locity rather than trunk stab ilisation occurred throughout all tria ls. Overall, untrained participants altered the ir body m ovem ent to maintain PO between 30 & 120 s, however between 120 s & T|im, no further sign ificant changes occurred. In the final study, partic ipants (n = 12) completed a 6-week arm crank train ing programme. Pre lim inary performance tests included a WAnT, V 02peak and 100% PMP test to exhaustion. Each test was repeated follow ing the train ing programme. Corrected and uncorrected PPO and fatigue index (FI) increased in the WAnT test post train ing (P < 0.01, P < 0.05, respective ly). Muscles of the shoulder (anterior deltoid & infraspinatus) dem onstrated reduced activation following tra in ing (P < 0.05) with trunk rotational ve locity increasing at corrected PPO during the WAnT (P < 0.01). Therefore, increases in WAnT PO may be related to changes in technique rather than muscle activation. Following train ing there was a sign ificant increase in PMP (P < 0.01) during the V 02peak test and a significant increase in TMm (P < 0.01) for the repeated 100% PMP test. Following training there was a sign ificant decrease in triceps brachii EMG activation (P < 0.05), changes in external oblique activation (P < 0.001) at 120 s and a significant increase in trunk rotational ve locity at 30 s (P < 0.05). A lthough at Tim, the kinem atic responses were the same. The results of th is train ing study indicated that changes in performance were due to physiological adaptations and changes in technique. The three studies have dem onstrated the im portance of changes in EMG activ ity, trunk rotational velocity, and technique to arm crank PO rather than specific physiological changes alone which has im plications for the use of arm cranking in testing, training and performance outcomes.
IV

C o n ten ts
Acknowledgements in
Abstract............................................................................................................................................................... iv
Contents............................................................................................................................................................... ..
List of Tables and Figures.....................................................................................................................................xi
Research publications generated from the thesis.......................................................................................... xviii
CHAPTER 1 ............................................................................................................................. 1
Introduction
CHAPTER 2 ............................................................................................................................. 6
Literature Review................................................................................................................................................ ...
Introduction............................................................................................................................................ ...
Muscle anatomy and function................................................................................................................ 6
Muscle metabolism....................................................................................................................................
Development of upper body exercise research.................................................................................... 10
Comparison of physiological responses to upper and lower body exercise........................................ 13
2.4.1 Incremental exercise to exhaustion.......................................................................................... 13
2.4.2 Submaximal responses............................................................................................................ 14
2.4.3 Wingate anaerobic test........................................................................................................... 15
2.4.3.i Wingate test considerations............................................................................................18
2.4.4 Continuous high intensity exercise...........................................................................................20
Physiology of fatigue............................................................................................................................ 22
2.5.1 Components of fatigue...........................................................................................................23
2.5.2 Fatigue during high intensity lower body..................................................................................25
2.5.3 Fatigue during high intensity upper body exercise.................................................................... 26
Upper body training studies................................................................................................................. 28
2.6.1 Upper body aerobic training studies........................................................................................28
2.6.2 Upper body strength training studies...................................................................................... 29
V

2.6.3 Comparing the physiological responses between untrained individuals and trained upper body
athletes ..................................................................................................................................... 29
2.7 Motion analysis......................................................................................................................................30
2.7.1 Biomechanical changes and fatigue......................................................................................... 31
2.8 Muscle activation...................................................................................................................................32
2.8.1 Muscle activation during arm crank ergometry........................................................................... 32
2.8.2 Muscle activation and fatigue.................................................................................................. 34
2.9 Summary..................................................................................................................................................
2.10 Hypothesis...............................................................................................................................................
CHAPTER 3 ............................................................................................................................38
General methods..................................................................................................................................................
3.1 Recruitment, ethics and testing considerations.................................................................................... 38
3.2 Arm Crank Ergometer.............................................................................................................................39
3.2.1 Arm crank ergometer calibration..............................................................................................40
3.3 Exercise protocols................................................................................................................................. ..
3.3.1 Wingate Anaerobic test...........................................................................................................41
3.3.1.1 Software comparison........................................................................................................41
3.3.1.11 Software comparison participants......................................................................................42
3.3.1.111 Software and data...........................................................................................................42
3.3.1.iv Results............................................................................................................................ 44
3.3.l.v Familiarisation and reliability of the upper body Wingate anaerobic test................................ 46
3.3.2 Peak oxygen uptake test.........................................................................................................49
3.3.2.1 Protocol........................................................................................................................ ..
3.3.2.11 Reliability and familiarisation to the V02peak test..............................................................51
3.3.2.111 Results............................................................................................................................
3.3.3 Continuous work test............................................................................................................ ..
3.3.3.1 Reliability of the continuous work test to exhaustion..........................................................53
3.3.3.11 Results......................................................................................................................... ..
3.4 Physiological measurements................................................................................................................ ..
D u u y I i i d ^ b d M U ^ I d i u i e ........................................................................................................................................................................... 5 4
3.4.2 Heart Rate....................................................................................................................... 54
3.4.3 Expired gas analysis.................................................................................................................

3.4.4 Ratings of perceived exertion.................................................................................................. 55
3.4.5 Electromyography (EMG)........................................................................................................55
3.4.5.i EMG site preparation....................................................................................................... 58
3.4.5.ii Electromyography processing........................................................................................... 58
3.4.5.iii Earthing and interference.................................................................................................59
3.4.5.iv Signal normalisation.........................................................................................................59
3.4.5.V Electromyography data analysis........................................................................................61
3.5 Motion analysis.....................................................................................................................................61
3.5.1 Motion analysis during normalised percent of peak minute power..............................................65
3.5.2 Data analysis and calculation of joint angles and distance.......................................................... 65
3.6 Synchronisation of signals.................................................................................................................... 67
3.7 General statistics................................................................................................................................... 67
CHAPTER 4 ...........................................................................................................................68
The physiological and biomechanical responses to short duration, maximal intensity arm cranking..............68
4.1 Introduction...........................................................................................................................................68
4.2 Method....................................................................................................................................................
4.2.1 Participants........................................................................................................................... ..
4.2.2 Exercise protocol.................................................................................................................. 70
4.2.3 Electromyography............................................................................................................... 70
4.2.4 Kinematic analysis................................................................................................................. ..
4.2.5 Statistical analysis................................................................................................................. ..
4.3 Results.....................................................................................................................................................
4.3.1 Performance indices...............................................................................................................73
4.3.l.i Peak power output....................................................................................................... 74
4.3.1. M Mean Power Output......................................................................................................74
4.3.1.iii Time to peak power output............................................................................................74
4.3.1.iv Cadence..................................................................................................................... 75
4.3.1. v Fatigue Index....................................................................................................................
4.3.2 Heart rate data..................................................................................................................... ..
4.3.3 Electromyography responses................................................................................................. ..
4.3.4 Kinematic analysis............................................................................................................. 73
4.4 Discussion................................................................................................................................... g l
4.4.1 Peak power output....................................................................................................... 81
4.4.l.i Uncorrected peak power output...................................................................................... 81
4.4.1. H Corrected peak power output........................................................................................ 82
4.4.1.iii Time to peak power output............................................................................................. 82
4.4.1.iv Fatigue index..................................................................................................................83
4.4.1. v Resistive load optimisation..............................................................................................85
4.4.2 Electromyography responses...................................................................................................86
4.4.3 Kinematic analysis..................................................................................................................90
CHAPTER 5 ...........................................................................................................................93
The physiological and biomechanical responses to exhaustive continuous high intensity upper body exercise
......................................................................... ..................................................................................................93
5.1 Introduction.......................................................................................................................................... ..
5.2 Method....................................................................................................................................................
5.2.1 Participants............................................................................................................................96
5.2.2 Exercise protocol....................................................................................................................96
5.2.3 Electromyography.................................................................................................................. 97
5.2.4 Kinematic analysis.................................................................................................................. 97
5.2.5 Statistical analysis...................................................................................................................98
5.3 Results...................................................................................................................................................
5.3.1 Peak physiological responses................................................................................................. 100
5.3.2 Continuous work tests duration..............................................................................................100
5.3.3 Physiological response during the continuous work tests.......................................................... 101
5.3.3.1 Oxygen uptake..............................................................................................................101
5.3.3.11 Respiratory exchange ratio..............................................................................................101
5.3.3.iii Heart rate..................................................................................................................... 102
5.3.4 Rating of perceived exertion.................................................................................................. 102
5.3.4.1 Local fatigue.................................................................................................................102
5.3.4.11 Cardiorespiratory fatigue............................................................................................... 103
5.3.5 Electromyography responses.................................................................................................103
5.3.6 Kinematic analysis................................................................................................... 107
5.4 Discussion.............................................................................................................................................
5.4.1 Peak oxygen uptake tests and peak heart rates........................................................................109
5.4.3 Physiological response during the continuous work tests.........................................................110
5.4.3.i Oxygen uptake.............................................................................................................HO
5.4.3.ii Respiratory exchange ratio............................................................................................ HI
5.4.4 Electromyography responses................................................................................................ 112

5.4.5 Kinematic analysis 114
CHAPTER 6 ......................................................................................................................... 117
The effects of a 6-week arm crank training programme on physiological and biomechanical responses to high
intensity upper body exercise.......................................................................................................................... 117
6.1 Introduction.........................................................................................................................................117
6.2 Method..................................................................................................................................................
6.2.1 Participants.......................................................................................................................... 119
6.2.2 Anthropometry and body composition.................................................................................... 119
6.2.3 Exercise protocol.................................................................................................................. 120
6.2.3.1 Wingate test................................................................................................................. 120
6.2.3.11 Peak oxygen uptake and peak minute power test...............................................................120
6.2.3.111 Training programme......................................................................................................120
6.2.4.iv Repeated sprint sessions................................................................................................ 121
6.2.4. V Exercise at 100% PMP session......................................................................................... 121
6.2.4. vi Submaximal aerobic exercise sessions..............................................................................121
6.2.5 Electromyography................................................................................................................ 122
6.2.6 Kinematic analysis................................................................................................................ 122
6.2.7 Post-training tests................................................................................................................ 123
6.2.8 Statistical analysis................................................................................................................. 123
6.3 Results...................................................................................................................................................
6.3.1 Interval and constant load exercise training sessions................................................................. 124
6.3.2 Anthropometry and body composition....................................................................................126
6.3.3 Incremental exercise test.......................................................................................................126
6.3.4 Wingate anaerobic test......................................................................................................... 131
6.3.4.1 Performance measures..................................................................................................131
6.3.4.11 Electromyography responses..........................................................................................132
6.3.4.111 Kinematic analysis..........................................................................................................
6.3.5 Continuous work tests............................................................................................................
6.3.5.1 Time to exhaustion...................................................................................................... ..
6.3.5.11 Cardiorespiratory response............................................................................................134
6.3.5.iv Ratings of perceived exertion..........................................................................................139
6.3.5. V Electromyography responses...........................................................................................140
6.3.5. vi Kinematic analysis........................................................................................................ ..
6.4 Discussion.......................................................................................................................................... 144
6.4.1 Wingate anaerobic test....................................................................................................... ..

6.4.1.1 Performance variables.................................................................................................... 144
6.4.1.11 Electromyography responses............................................................................................146
6.4.1.111 Kinematic analysis...........................................................................................................146
6.4.2 Incremental tests for peak oxygen uptake..................................................................................147
6.4.3 Continuous work tests duration...............................................................................................149
6.4.3.1 Time to exhaustion....................................................................................................... 149
6.4.3.11 Physiological responses................................................................................................. 149
6.4.3.111 Electromyography responses........................................................................................... 151
6.4.3.iv Kinematic analysis.......................................................................................................... 153
6.4.4 Conclusion........................................................................................................................... 154
CHAPTER 7 ..........................................................................................................................156
General discussion..............................................................................................................................................
7.0 Overview of studies............................................................................................................................ ..
7.1 Limitations.............................................................................................................................................
7.2 Future w ork...........................................................................................................................................
7.3 Practical application............................................................................................................................ ..
APPENDICES.........................................................................................................................
Appendix 1 .........................................................................................................................................................
Appendix 2 ...................................................................................................................................................... i 68
Ethics form.......................................................................................................................................
Consent Form (Example from Chapter 4)...........................................................................................172
Participant information sheet.............................................................................................................
Post trial participant information..................................................................................................... ..
Participant information letter (Example from Chapter 4 ).................................................................... 177
Strategy for dealing with physical problems or injuries that might occur during trials............................. 178
Strategy for dealing with physical problems or injuries that might after the trials...................................179
Recruitment poster (Example from Chapter 4 ) .................................................................................. ISO
Risk assessment.......................................................................................................................... Ig l
Bibliography 186
List o f T a b le s and F igures
Table 2.1 Comparison of peak oxygen uptake and heart rate between arm and
leg ergometry
Table 2.2 Comparison between peak power output from an arm or leg WAnT
Table 2.3 Comparison of fatigue indexes (%) and from arm and leg Wingate
anaerobic tests
Table 3.1 Participants' characteristics
Table 3.2 An overview of the Cranlea and Monark data collections and analysis
systems
Table 3.3 Key performance variables for the WAnT from both the Cranlea (Cr)
and Monark (Mk) systems
Table 3.4 Participants' characteristics
Table 3.5 Corrected mean and peak power outputs (W) combined for male
and female participants
Table 3.6 Intraclass correlation coefficients (ICCs), coefficients of variation
(CVs) and P values for corrected peak power output (W),
uncorrected peak power output (W) and mean power output (24 s;
W)
Table 3.7 Participants' characteristics (n = 21) for the reliability and
familiarisation of the V 0 2peak test
Table 3.8 Cardio-respiratory variables for trial 1 and trial 2 at volitional
exhaustion
Table 3.9 Intraclass correlation coefficient (ICC), limits of agreement (95%;
LoA), bias (mean difference), coefficients of variation (CVs) & P
XI

values (paired t-test) for peak minute power (PMP), peak oxygen
uptake (V 0 2peak), heart rate (HR), respiratory exchange ratio (RER).
Table 3.10 Electromyograph electrode placement sites and rationale for use
Table 3.11 Marker letter and marker
Table 4.1 Performance variables for each upper body WAnT
Table 5.1 Cardio-respiratory variables for peak oxygen uptake at T|im
Table 5.2 Mean oxygen consumption, respiratory exchange ratio and heart
rate during the each continuous work test
Table 6.1 Development of the train programme over the 6-week training
programme
Table 6.2 Uncorrected PPO (W) and end HR response during WAnT interval
training
Table 6.3 Interval and 30 min heart rate response during training
Table 6.4 Anthropometric measures pre and post-training
Table 6.5 Incremental exercise test pre and post-training peak physiological
responses
Table 6.6 Performance variables for WAnT pre and post-training 6 weeks
training
Table 6.7 Cardiorespiratory response at 30 s, 120 s and T„m before and after
training
Figure 2.1 Skeletal muscle structure
Figure 2.2 A muscle fibre
Figure 2.3 Filament arrangements in a sarcomere
Figure 2.4 ATP and PCr during sprinting
Figure 2.5 Example of a 30 s upper body WAnT at 5% body mass load using an
18 Flertz data interval
Figure 2.6 Schematic diagram with hypothetical data showing the relationship
between exercise intensity and time
Figure 2.7 Schematic diagram with hypothetical data showing the relationship
between intensity (force) and time (velocity).
Figure 3.1 The adapted Monarch cycle ergometer
Figure 3.2 Bland and Altman plot with 95% limits of agreement (dashed lines)
for peak power output between the two measurement devices
Figure 3.3 Bland and Altman plot with 95% limits of agreement (dashed lines)
for peak power output between the two measurement devices
Figure 3.4 Bland and Altman plot with 95% limits of agreement (dashed lines)
for mean V02peak (l-min'1) between trial 1 and trial 2
Figure 3.5 Bland and Altman plot with 9 5 % limits of agreement (dashed lines)
for end power (W ) at V 0 2peak (hmin'1) between trial 1 and trial 2
Figure 3.6 Example of EMG signal after filtering but prior to RMS calculation
Figure 3.7 Example of EMG signal after RMS calculation
Figure 3.8 Example of one of three RMS EMG 3-4 s 4% BM load sprints during
warm-up used to calculate normalised RMS EMG
Figure 3.9 Example of method used to calculate average RMS EMG signal
Figure 3.10
Figure 3.11
Figure 3.12
Figure 3.13
Figure 3.14
Figure 4.1
Figure 4.2
Figure 4.3
Figure 4.4
Figure 4.5
Figure 4.6
Figure 4.7
Participant arm cranking, showing motion analysis markers, EMG
electrodes and gas analysis system
Example of AIM model for motion analysis
Example of kinematic analysis showing anatomical and static
markers for analysis
Example of joint angle calculation
Example of change in distance (mm), during a WAnT, between
markers C7 and VBB
Example of kinematic analysis showing anatomical and static
markers for analysis
Biceps brachii normalised EMG (4% BM) against resistive loads (%
BM) for uncorrected and corrected PPO and POmin
Triceps brachii normalised EMG (4% BM) against resistive loads (%
BM) for uncorrected and corrected PPO and POmin
Changes in elbow joint angle (°) against resistive loads
corresponding to corrected and uncorrected PPO and POmin
Changes in elbow joint angle (°) for a typical participant. Data is
shown for a resistive load of 4% body mass with a 2nd order
polynomial trendline
Changes in angular velocity between C7 and inner shoulder and seat
post for a typical participant
Torso distance (mm) relative to the ACE at corrected, uncorrected
and minimum power output for 2%, 3%, 4% and 5% body mass
resistive loads

Figure 4.8
Figure 5.1
Figure 5.2
Figure 5.3
Figure 5.4
Figure 5.5
Figure 5.6
Figure 6.1
Figure 6.2
Figure 6.3
Figure 6.4
Changes in torso distance (mm) relative to the ACE for a typical
participant. Data is shown for a resistive load of 4% body mass
Example of kinematic analysis showing anatomical and static
markers for analysis
Time to exhaustion (TMm) for all four percentages of PMP trials
Normalised EMG (80% PMP) against exercise intensities (% PMP)
and time (s). (a) Biceps brachii. (b) Triceps brachii. (c) Flexor
carpi ulnaris
Normalised EMG (80% PMP) against exercise intensities (% PMP)
and time (s). (d) Anterior deltoid, (e) Infraspinatus, (f) External
oblique
Changes in elbow joint angle (°) at all four exercise intensities (%
PMP) from 30 s
Changes in trunk rotational velocity (0-s_1) at all four exercise
intensities (% PMP) from 30 s
Rating of perceived exertion (RPEL and RPEcr) after each interval
training session
Rating of perceived exertion (RPEL and RPEcr) after each 30 min
training session
Typical response during incremental exercise measured as V02
(l-min1) to exhaustion pre and post training for a typical participant
1 and typical participant 2
Typical response to an incremental exercise measured as breathing
frequency (1/min) pre and post training for typical participant 1 and
typical participant 2.

Figure 6.5
Figure 6.6
Figure 6.7
Figure 6.8
Figure 6.9
Figure 6.10
Figure 6.11
Figure 6.12
Figure 6.13
Figure 6.14
Typical response to an incremental exercise measured as V'E/V'02
(l-min'1) pre and post training for typical participant 1 and typical
participant 2.
Typical response to an incremental exercise measured as V'E/V'C02
(l-min"1) pre and post training for typical participant 1 and typical
participant 2
Changes in trunk rotational velocity (°-s'1) before, and after training
for the WAnT for corrected and uncorrected PPO and POmin
Relationship after training between trunk rotational velocity and
peak cadence (r = .473, P > 0.05)
Time to exhaustion (T|lm) before and after training
Typical response during PMP trails measured as V02 (l-min'1) (pre
and post training) for typical participant 1 and typical participant 2.
Typical response during PMP trails measured as BF (1/min) (pre and
post training) for typical participant 1 and typical participant 2
Typical response during PMP trials measured as V'E/V'02 (l-min'1)
pre and post training for typical participant 1 & typical participant 2.
Typical response during PMP trails measured as V'E/V'C02 (l-min1)
(pre and post training) for typical participant 1 and typical
participant 2.
Rating of perceived exertion (RPEL) during the 100% PMP trials
before and after training
Figure 6.15 Rating of perceived exertion (RPEcr) during the 100% PMP trials
before and after training
Figure 6.16 Normalised EMG (100% PMP) against exercise intensities (% PMP)
before and after training against time (s).
Figure 6.17 Changes in elbow ROM (°) before and after training against time (s)
Figure 6.18 Changes in C7D before and after training against time (s)
Figure 6.19 Changes in trunk rotation velocity (°-s ) before and after training
against time (s)
X V I I

Research publications generated from the thesis
Presentations and publications
Talbot, C. & Price, M. (2009) Familiarisation for upper body Wingate testing. 25th
annual conference of the British Association of Sport & Exercise Sciences, Leeds,
United Kingdom, September 1-3, 2009. Journal of Sports Sciences, 27 (S2):
S126-S127.
Talbot, C & Price, M. Load optimisation for upper body Wingate testing. 26th
annual conference of the British Association of Sport & Exercise Sciences,
Glasgow, United Kingdom, September 6-8, 2010. Journal of Sports Sciences, 28
(SI): S154-S155.
Talbot, C., Kay, T. & Price, M. A comparison of two Wingate Anaerobic Test
software packages. 26th annual conference of the British Association of Sport &
Exercise Sciences, Leeds, United Kingdom, September 6-8, 2010. Journal of
Sports Sciences, 28 (SI): S154-S155.
Talbot, C., Kay, T., Walker. N. & Price, M. Electromyography during upper body
Wingate exercise. 27th annual conference of the British Association of Sport &
Exercise Sciences, Colchester, United Kingdom, September 6-8, 2011. Journal of
Sports Sciences, 29 (SI): S131.
XV I I I
Chapter 1
1.0 Introduction
In sport and exercise fatigue substantially affects the intensity and duration of an
activity that can be maintained and therefore, performance. Lower body
performance factors such as physiology and biomechanics contributing to fatigue
are extensively reported in the literature. Research into fatigue during upper
body exercise has received comparatively little attention despite contributing to a
number of sports, exercise and health outcomes and having substantially
different physiological and biomechanical responses to lower body exercise,
small number of studies have examined upper body exercise in relation to
physiology and biomechanics (Bressel and Heise, 2004; Frauendorf ef al., 1989;
Hopman et a/., 1995; Marais ef at., 2004; Price et a!., 2007; Smith et a/., 2008;
Smith et a!., 2007a; Smith et al., 2006c). Recent physiological research has
examined optimal cadence for peak oxygen consumption (Smith eta/., 2007a,
Smith et al., 2001) and body position in relation to the ergometer (Leicht and
Spinks, 2007, van Drongelen eta/., 2009, Miller eta/., 2004). These studies
indicate cadence and body position have an effect on physiological responses to
arm crank ergometry (ACE). Additionally, ACE testing has received specific
recommendations from the British Association of Sport and Exercise Science
(Smith and Price, 2007) and research interest in this field is increasing.
Physiological markers of performance during upper body exercise are generally
reported at a low intensity (less than 70% of peak oxygen uptake) although the
majority of training for sport and exercise is undertaken at higher intensities
(Bouhlel et al., 2007, Billat et al., 1996, Fernandes et al., 2008b). A number of
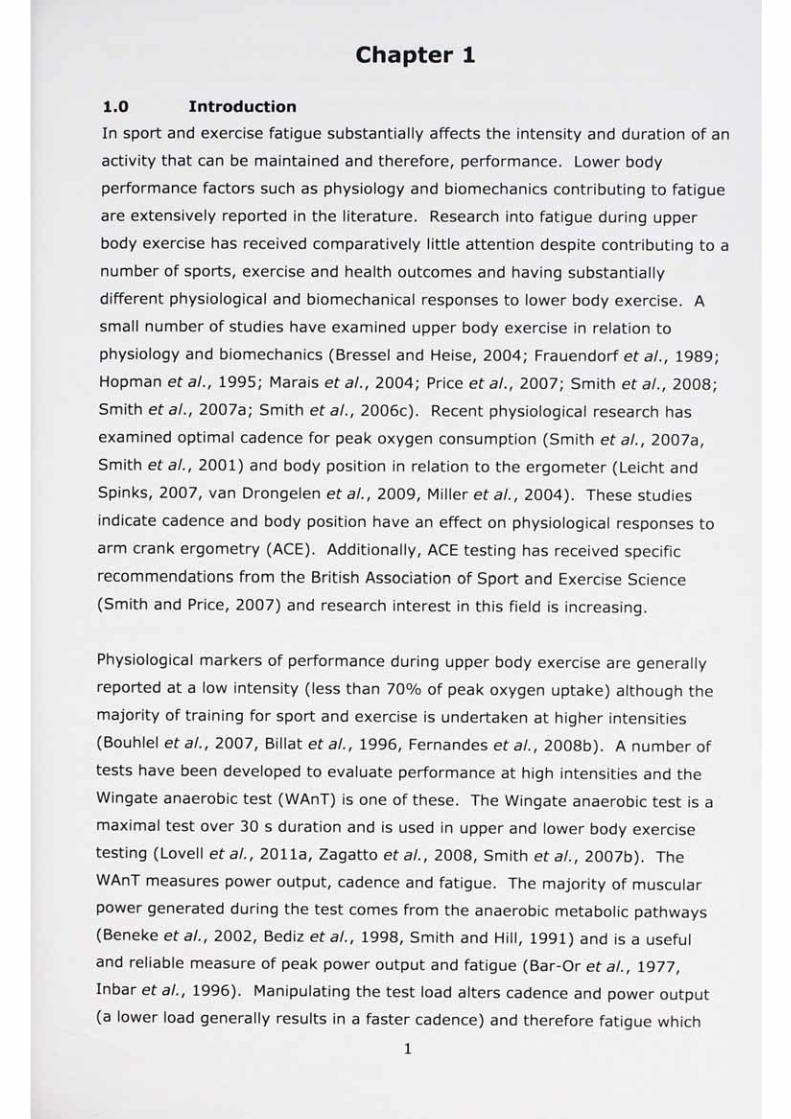
tests have been developed to evaluate performance at high intensities and the
Wingate anaerobic test (WAnT) is one of these. The Wingate anaerobic test is a
maximal test over 30 s duration and is used in upper and lower body exercise
testing (Lovell eta/., 2011a, Zagatto eta/., 2008, Smith eta/., 2007b). The
WAnT measures power output, cadence and fatigue. The majority of muscular
power generated during the test comes from the anaerobic metabolic pathways
(Beneke et al., 2002, Bediz et al., 1998, Smith and Hill, 1991) and is a useful
and reliable measure of peak power output and fatigue (Bar-Or et al., 1977,
Inbar et al., 1996). Manipulating the test load alters cadence and power output
(a lower load generally results in a faster cadence) and therefore fatigue which

will affect the subsequent physiological and biomechanical responses (Inbar et
al., 1996, Patton etal., 1985, Dotan and Bar-Or, 1983). Although a number of
studies have reported arm crank ergometry during WAnT performance
(Kounalakis et at., 2008, Weber et al., 2006, Jemini et a/., 2006) EMG responses
during an upper body WAnT have not been reported in the literature. However,
near-infrared spectroscopy studies have found that changes in muscle
recruitment patterns exist (Kounalakis et al., 2009) and a high intensity exercise
study using EMG analysis indicated changes in shoulder girdle kinematics and
muscle co-ordination in the infraspinatus and deltoid muscles (Ebaugh eta/.,
2006). In addition, the optimal resistive load for an upper body WAnT has not
been thoroughly examined since the original suggestion of 6% body mass
resistive load (Dotan and Bar-Or, 1983). Therefore, the use of motion analysis
and EMG may highlight significant changes in limb kinematics and muscle
recruitment patterns to enhance our understanding and interpretation of power
production and the effects of fatigue across a range of resistive loads.
Arm crank ergometry during exercise at higher intensities (80%-110% of peak
oxygen uptake; V 0 2peak) has generally only been reported through examining
protocols for V 0 2peak. The combined physiology and biomechanics at and around
such high intensities continued to volitional fatigue for ACE has not been
published. Whether responses at these intensities fit within the severe exercise
domain reported for lower body studies requires further investigation, especially
as many sport and exercise endeavours are associated with paced rather than
incremental effort(s) to exhaustion (Atkinson eta/., 2003, Grant eta/., 1997,
Lambert et a/., 1995). High intensity responses such as changes in efficiency
and oxygen uptake have been attributed in part to unmeasured work of the trunk
and lower body (Stamford et a/., 1978, Bar-Or and Zwiren, 1975, Blasio et a/.,
2009) and increases in trunk rotation and shoulder range of motion have been
linked with a decrease in cadence (Price et a/., 2007). Whether these responses
are the same for a fixed cadence but different resistive loads and therefore
exercise intensities and the influence of training has not to the not been reported
in the literature. Ratings of perceived exertion (local and central) have been
used as indicators of physiological response to ACE with a local response
generally greater than central (Pandolf et at., 1984). These responses are
supported by physiological evidence that shows oxygen uptake is restricted by
local rather than central (cardiovascular) fatigue (Magel eta/., 1975). This is
2
probably due to a smaller muscle mass (Sawka, 1986, Washburn and Seals,
1984) in the arms and a reduced stroke volume (Astrand eta/., 1965) and can
be linked to the lesser aerobic capacity of the exercising muscles (Davies and
Sargeant, 1975).
Lower body studies have indicated that training can increase the duration and/or
power output achieved for the WAnT test (Ziemann et a/., 2011, Busko, 2011)
and tests to volitional exhaustion at high intensities (Ziemann et a/., 2011,
Burgomaster et a/., 2005). A number of ACE training studies have shown that
peak oxygen uptake can be increased through aerobic training programmes
(Magel et a/., 1978, Loftin et a/., 1988, Franklin, 1989) or weight training only
(Swensen et a/., 1993). Additionally, comparisons with upper body trained
compared to untrained participants indicates improved performance such as an
increased work capacity (Volianitis et a/., 2004a) and aerobic capacity (Franklin,
1985). Wingate anaerobic test comparisons between different levels of ability in
sports show that a greater ability is reflected in a higher peak and mean power
output in wrestlers (Horswill eta/., 1992, Terbizan and Seljevold, 1996) and
gymnasts (Jemini et a/., 2006). These studies indicate that upper body training
can increase performance, although exact physiological (i.e. changes in
respiratory measures) and biomechanical responses (such as EMG and motion
analysis) have not been fully explored in the literature. Further research is
required to establish the changes in physiological and biomechanical responses
that may result from ACE training.
Exercise duration and/or intensity is frequently restricted by fatigue (Ament and
Verkerke, 2009, Enoka and Duchateau, 2008). There are many different
definitions of fatigue of which the majority confirm that it results in a reduction in
performance/force and can be physical and/or mental (Szygula etal., 2003,
Fitts, 1996, Kay et a!., 2001, Sargeant, 1994). Fatigue during exercise has a
central and/or local source (Sahlin, 1992, Davis, 1995, Bigland-Ritchie, 1981).
During high intensity exercise a number of fatigue mechanisms may reduce
performance, such as an increase of inorganic phosphate interfering with
sarcoplasmic reticulum Ca2+ handling and the cross-bridge cycle (Westerblad et
ai, 2002, McLester, 1997, Bangsbo eta/., 1996). Additionally, as muscular
contraction produces metabolic by-products these may change the feedback from
group III-IV afferents (Taylor et al., 2000, Girard et a!., 2011) and therefore the
responses from central nervous system and effect physiological responses such
as cardiovascular and ventilatory responses (Christine M. Adreani et at., 1997,
Amann, 2012). Whilst it is possible to detect fatigue via reductions in power
output e.g. WAnT reductions from peak power to minimum power output or the
cessation of power output via a constant load and cadence test to volitional
exhaustion this does not provide a complete analysis and biomechanical changes
also need to be considered.
In upper body exercise changes in feedback have been linked to fatigue and may
be associated with changes in electromyographic (EMG) responses such as
increased EMG activity of the biceps and triceps brachii (Martin et at., 2006).
Additionally, upper arm postural muscles such as the infraspinatus may increase
in amplitude in response to fatigue and changes in position (Rudroff et at.,
2007). Current EMG studies specific to ACE emphasise the biceps and triceps
brachii to power production (Bressel and Heise, 2004, Marais et at., 2004,
Bressel et at., 2001, Smith et at., 2008) and the contribution of muscles of the
shoulder (Smith et at., 2008, Frauendorf et at., 1989). Although muscles of the
trunk have been suggested to be important to ACE (Bar-Or and Zwiren, 1975,
Stamford et at., 1978, Shiomi et at., 2000, Smith et at., 2008) only two
published studies have analysed abdominal muscles activation during ACE which
showed greater activity during synchronous rather than asynchronous ACE
(Hopman et at., 1995), and greater activity whilst sitting on a stability ball versus
a chair (Marks et at., 2012). These studies highlight the importance of different
muscles to the power production during ACE, whether similar patterns of
activation exist during maximal and high intensity ACE remains to be reported.
Fatigue can also be detected by changes in motion analysis. Changes in motion
during lower body exercise have been used as markers of fatigue with changes in
movement patterns in runners (Millet et at., 2010, Geiser et at., 2010). With
upper body fatigue, using isokinetic dynamometry, greater limb movement was
required before limb movements can be detected (Taylor eta/., 2000, Lee eta/.,
2003a). During ACE at V02peak changes in shoulder range of motion and trunk
angle were reported to be greater at 50 and 70 rev-min'1 compared to 90
rev-min1 (Price et a/., 2007). At a low intensity of exercise differences have
been observed in wrist flexion and muscle activity (Bressel and Heise, 2004).
Therefore, as fatigue can be detected by motion analysis, it may be possible to
identify such markers of fatigue during maximal and high intensity exercise. To
the author's knowledge no publications have examined the physiological and
biomechanical responses to fatigue during maximal and high intensity upper
body exercise.
The key aim of this thesis is to establish, using physiology and biomechanical
analysis, how fatigue effects performance during maximal and high intensity
upper body exercise. Such an integrated approach is novel in this area of
research as previous studies have only reported analysis independent of the
other factor. Further aims are to establish an optimal protocol for maximal
intensity 30-s arm cranking that elicits maximal performance and also determine
the optimal exercise intensity for the assessment of continuous high intensity
(anaerobic) upper body exercise performance. Finally, a training study could
establish how training effects ACE performance and therefore the physiological
and biomechanical variables associated with fatigue during maximal and high
intensity exercise.

Chapter 2
Literature Review
2.0 Introduction
This chapter aims to draw together the available research and present a
background to upper body exercise, in particular arm crank ergometry (ACE)
with specific reference to maximal and high intensity ACE. The applications of
ACE, protocols employed, factors influencing performance and fatigue in upper
body exercise were examined to set out the main areas of research that this
thesis reviewed. Two review papers on upper body exercise have been
published; Franklin (1985) published a review on arm ergometry training and
testing while Sawka (1986) reviewed the physiology of upper body exercise.
More recently, BASES guidelines have provided recommendations for upper body
exercise testing (Smith and Price, 2007). This chapter aims to present a more
detailed and specifically focussed review since these papers were published, and
critique studies that have examined the physiological and biomechanical
responses to high intensity upper body exercise. Additionally, the role of muscle
anatomy, function and metabolism will be explored with reference to upper body
exercise.
2.1 Muscle anatomy and function
Each muscle group, which contains hundreds to thousands of muscle fibres, and
tapers into a tendon or broad tendinous sheet at each end which connects to
bone (Hijikata et at., 1993). The outside of the muscle is wrapped in a sheath of
collagen fibres the epimysium. Bundles of muscle fibres are wrapped in
perimysium, and each muscle fibre is wrapped in endomysium (Figure 2.1) which
also ties together adjacent muscle fibres. The sheaths support each cell and
protect the muscle.

Fasciculus
Figure 2.1 Skeletal muscle structure (from Wilmore and Costill, 1999).
Each muscle fibre (Figure 2.2) is enveloped in a thin elastic membrane, the
sarcolemma which surrounds the sacroplasm. The sarcoplasmic reticulum
consists of vesicles and channels that wrap around and into the spaces of the
myofibrils; its major function is to regular intracellular levels of ionic calcium.
The transverse tubules are continuous with the sarcolemma and run deep into
the muscle fibre and severe to propagate the nerve-initiated electrical impulse
further into the muscle cells and sarcomere. It is the electrical impulse that acts
a signal to the release of calcium ions into the sarcoplasm which can lead to
muscle fibre contraction (Morgan and Allen, 1999).
Figure 2.2 A muscle fibre (Wilmore and Costill, 1999).
Each muscle fibre is further subdivided into a myofibril (bundles of
myofilaments). Each muscle fibre contains hundreds to thousands of myofibrils.
Within and around the myofibrils are mitochondria and granules of glycogen. A
sarcomere (Figure 2.3) is a section of myofibril and is the contractile unit of the
muscle. Each myofibril consists of about 10,000 sarcomeres (Morgan and Allen,
Transversetuoules
^ ig into e
7
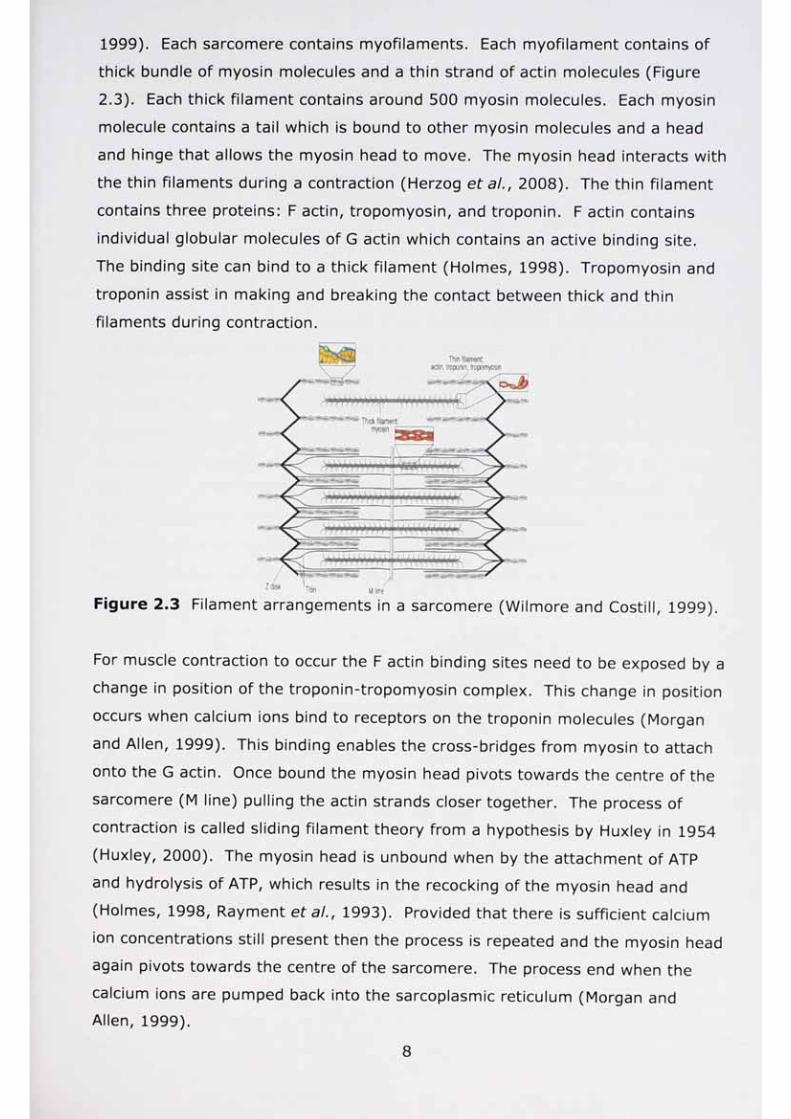
1999). Each sarcomere contains myofilaments. Each myofilament contains of
thick bundle of myosin molecules and a thin strand of actin molecules (Figure
2.3). Each thick filament contains around 500 myosin molecules. Each myosin
molecule contains a tail which is bound to other myosin molecules and a head
and hinge that allows the myosin head to move. The myosin head interacts with
the thin filaments during a contraction (Herzog eta/., 2008). The thin filament
contains three proteins: F actin, tropomyosin, and troponin. F actin contains
individual globular molecules of G actin which contains an active binding site.
The binding site can bind to a thick filament (Holmes, 1998). Tropomyosin and
troponin assist in making and breaking the contact between thick and thin
filaments during contraction.
Thin filament:actin. troponin, tropomyosin
K i n ■ + . * . * . * . d. .. /
Thick filament: mvosm
* * * * *
Zdisk Trdn M line
Figure 2.3 Filament arrangements in a sarcomere (Wilmore and Costill, 1999)
For muscle contraction to occur the F actin binding sites need to be exposed by a
change in position of the troponin-tropomyosin complex. This change in position
occurs when calcium ions bind to receptors on the troponin molecules (Morgan
and Allen, 1999). This binding enables the cross-bridges from myosin to attach
onto the G actin. Once bound the myosin head pivots towards the centre of the
sarcomere (M line) pulling the actin strands closer together. The process of
contraction is called sliding filament theory from a hypothesis by Huxley in 1954
(Huxley, 2000). The myosin head is unbound when by the attachment of ATP
and hydrolysis of ATP, which results in the recocking of the myosin head and
(Holmes, 1998, Rayment et at., 1993). Provided that there is sufficient calcium
ion concentrations still present then the process is repeated and the myosin head
again pivots towards the centre of the sarcomere. The process end when the
calcium ions are pumped back into the sarcoplasmic reticulum (Morgan and Allen, 1999).
8
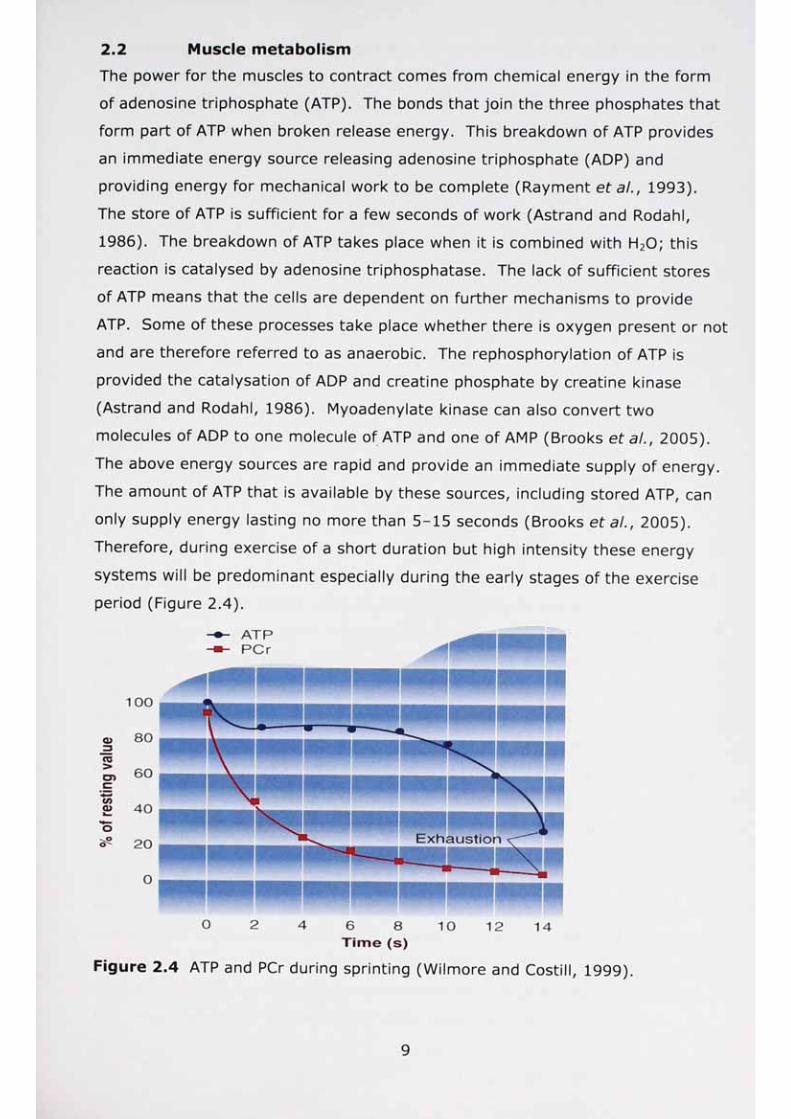
2.2 Muscle metabolism
The power for the muscles to contract comes from chemical energy in the form
of adenosine triphosphate (ATP). The bonds that join the three phosphates that
form part of ATP when broken release energy. This breakdown of ATP provides
an immediate energy source releasing adenosine triphosphate (ADP) and
providing energy for mechanical work to be complete (Rayment et al., 1993).
The store of ATP is sufficient for a few seconds of work (Astrand and Rodahl,
1986). The breakdown of ATP takes place when it is combined with H20; this
reaction is catalysed by adenosine triphosphatase. The lack of sufficient stores
of ATP means that the cells are dependent on further mechanisms to provide
ATP. Some of these processes take place whether there is oxygen present or not
and are therefore referred to as anaerobic. The rephosphorylation of ATP is
provided the catalysation of ADP and creatine phosphate by creatine kinase
(Astrand and Rodahl, 1986). Myoadenylate kinase can also convert two
molecules of ADP to one molecule of ATP and one of AMP (Brooks et al., 2005).
The above energy sources are rapid and provide an immediate supply of energy.
The amount of ATP that is available by these sources, including stored ATP, can
only supply energy lasting no more than 5-15 seconds (Brooks et al., 2005).
Therefore, during exercise of a short duration but high intensity these energy
systems will be predominant especially during the early stages of the exercise
period (Figure 2.4).
o 2 4 6 8 10 12 14Time (s)
Figure 2.4 ATP and PCr during sprinting (Wilmore and Costill, 1999).

If the energy supply is to last longer than a few seconds then additional sources
can be provided by glycolysis and to a lesser extent, during the WAnT, oxidative
energy sources. During glycolysis, glucose or glycogen is broken down by a
series of enzymatic reactions to produces pyruvic acid. This process yields two
molecules of ATP and three when glycogen is used and provides significantly
more ATP than from the immediate energy supply but is still limited to 30 - 90
seconds. When oxygen is absent the pyruvic acid is converted to lactic acid
which can have a fatiguing effect by the acidification of muscle fibres, for further
information see section 2.5.3.
The oxidative energy system can provide considerably more ATP than the
anaerobic energy system. In the presence of oxygen pyruvic acid is converted
into acetyl coenzyme A (acetyl CoA). The compound enters the Krebs cycle in
the mitochondria. The main purpose of the Krebs cycle is to breakdown the
acetyl CoA into carbon dioxide and hydrogen atoms. The hydrogen atoms
produced are carried to the electron transport chain where they are oxidised to
provide energy to phosphorylate ADP and form ATP. At least 38 molecules of
ATP can be produced from this process. Although the supply of ATP is much
greater from the oxidative energy system it is activated more slowly and
produces the energy less rapidly than from the immediate and anaerobic energy
systems. Therefore, during short duration high intensity exercise this energy
system does not predominate. However, as the duration of the exercise
increases this energy system becomes more dominant and Smith and Hill (1991)
suggested that during the later stages of a 30 s WAnT test that the oxidative
system can provide a significant contribution to energy production. Therefore,
during the early stage of short duration high intensity exercise encountered
during a 30 s a WAnT the initial contribution to energy is the via the immediate
and anaerobic energy system and then towards the latter stages of the test the
oxidative energy system contributes substantially to energy production.
2-3 Development of upper body exercise research
Investigation into upper body exercise and different physiological responses
compared to leg ergometry has been reported from as early as 1924 by Collett
and Liljestrand (1924). Since this publication the majority of arm crank
ergometry studies concentrated on comparing physiological responses to lower
body exercise such as cardiovascular performance at a given power output
10
(Secher et al., 1974, Reybrouck eta/., 1975, Astrand eta/., 1965), metabolism
and performance (Karlsson eta/., 1975, Pendergast eta/., 1979), the effects of
cadence on peak physiological responses (Sawka eta/., 1983, Weissland eta/.,
1997) or thermoregulatory responses (Price and Campbell, 1998, Price and
Campbell, 2002, Pimental eta/., 1984). Furthermore, a number of studies have
reported the health benefits of arm crank exercise for cardiac rehabilitation
(Fardy eta/., 1977), wheelchair based populations (Fljeltnes, 1977, Dicarlo,
1988), increasing high-density lipoprotein cholesterol (Mukherjee eta/., 2001,
El-Sayed and Younesian, 2005) and reduced rate-pressure product in men with
previous myocardial infarction (Franklin eta/., 1994).
Since the mid-1980s a number of studies have focused on the physiology of ACE
rather than comparing ACE to leg ergometry. Most studies undertaken have
been at low submaximal workloads (less than 100 W) and examined the
efficiency of arm cranking (Kang et a/., 1997, Marais et a/., 2002b, Powers et a/.,
1984). Relatively few studies, other than those addressing development of peak
oxygen uptake ( V 0 2peak) protocols, have examined the duration of exercise at or
above maximal aerobic capacity (Marais et a/., 1999). The mean power outputs
associated with such maximal aerobic and high intensity anaerobic arm cranking
have been demonstrated through V02peak and WAnT tests. Power output values
for these tests are generally much higher than for the submaximal tests
previously noted (~100 W) and can reach up to 1000 W for upper body Wingate
anaerobic tests (Smith et at., 2007b, Sawka et at., 1983, Kounalakis et a!.,
2008). A number of studies have used the Wingate anaerobic test (WAnT) in
arm cranking to examine high intensity exercise such as in relation to nutritional
interventions for power-based athletes (Aschenbach et al., 2000), comparison
between different levels of ability within a specific sport (Evans eta/., 1993,
Hubner-Wozniak et al., 2006b, Jemini et at., 2006), between sporting and non-
sports populations and younger and older men (Marsh et at., 1999) and
synchronous and asynchronous WAnTs (Lovell eta/., 2011b). Recently standing
arm cranking has been applied to the performance of America's cup sailors to
help understand their physiological characteristics (Neville eta/., 2009, Bernardi
et a/., 2007). Therefore, performance during an upper body WAnT test has
implications for sport, exercise and health although in general, studies have only
reported the performance results rather than the mechanisms that contributed to those results.
11

Recent research using the WAnT has concentrated on assessing the upper body
fitness of athletes participating in sailing (Easton et at., 2007), gymnastics
(Jemini et at., 2006), martial arts (Franchini et al., 2005, Artioli etal., 2008) and
prediction of swimming performance (Invernizzi et al., 2008, Guglielmo and
Denadai, 2000). In addition to submaximal intensity ACE being effective training
for individuals with spinal cord injury (Dicarlo, 1988, El-Sayed and Younesian,
2005), ACE training can improve walking performance and pain tolerance in
patients with symptomatic peripheral arterial disease (Tew et al., 2009, Zwierska
et al., 2005) and in the treatment of patients with hypertension (Westhoff et al.,
2008). Furthermore, motor coordination and speed of movement required
during ACE at submaximal power has been used to predict all-cause mortality in
men (Metter et al., 2004) and can also be used as a predictor of cardiovascular
and all-cause mortality in an older population with lower limb disabilities (Ilias et
al., 2009). Therefore, if arm crank performance is linked to athletic ability and
health outcomes further analysis is needed to explain how these adaptations in
performance may occur.
The peak oxygen uptake and WAnT tests have not extensively examined the
physiological responses associated with arm cranking at high intensities.
Furthermore, few studies have examined the biomechanical responses to ACE at
either high or low exercise intensities (Hopman eta/., 1995, Marais eta/., 2004,
Bressel eta/., 2001, Bressel and Heise, 2004, Mossberg eta/., 1999, Frauendorf
et al., 1989, Frauendorf et al., 1986, Smith et al., 2008, Zehr and Chua, 2000,
Bernasconi et al., 2006). Studies examining muscle activation (EMG) and motion
analysis during ACE have been less well studied. Currently only three studies
(Price eta/., 2007, Bressel and Heise, 2004, Smith eta/., 2008) have examined
the integration of physiological and biomechanical responses during ACE and
these will be discussed later in the chapter. A small number of studies have
examined the physiological and biomechanical mechanisms that contribute to the
fatigue process resulting in the termination of exercise at high intensities
(Hopman et al., 1995, Frauendorf et al., 1989). No studies have reported such
responses during upper body WAnTs and during continuous high intensity upper
body tests to exhaustion. Examining the physiology and biomechanics at
exhaustion will help to develop the understanding of fatigue during upper body
exercise; this could have implications for rehabilitation exercises and upper body
training for athletes and power output.
12
2.4 Comparison of physiological responses to upper and lowerbody exercise
2.4.1 Incremental exercise to exhaustion
When the limit of oxygen uptake is reached during ACE it is normally referred to
as peak oxygen uptake ( V 0 2peak)- Values are referred to as 'peak' rather than
'maximal' for arm exercise as oxygen uptake is limited by peripheral (local
muscular) fatigue rather than central (cardiovascular) fatigue (Magel et al.,
1975). Peak oxygen uptake is lower due to a smaller muscle mass (Sawka,
1986, Washburn and Seals, 1984), reduced stroke volume (Astrand eta/., 1965)
and additional peripheral factors such as, a smaller diffusion area and larger
diffusion distance (Calbet et a/., 2005). Expected V 0 2peak values from
incremental exercise tests to exhaustion are shown in Table 2.1. Although
stroke volume is influenced by the muscle mass recruited and anaerobic
threshold (Lepretre et a/., 2004), the impact of training status or training on
these parameters and upper body exercise, as much as lower body exercise is
not known. It has been suggested that the differences in oxygen uptake and
heart rate for the legs are due to the rate of oxygen delivery, and for the arms, it
is linked to the active muscle mass with the author concluding that there was 'an
unidentified peripheral factor' (Warren et at., 1990). Additionally, peak oxygen
uptake during ACE is 70% to 75% of that achieved during leg ergometry
(Sedlock, 1991, Lyons et a!., 2007, Kang et at., 1997). Therefore, upper body
exercise has different physiological responses (e.g. heart rate, oxygen uptake) to
exercise at the same intensity which suggested that there may be different
mechanisms of fatigue present.
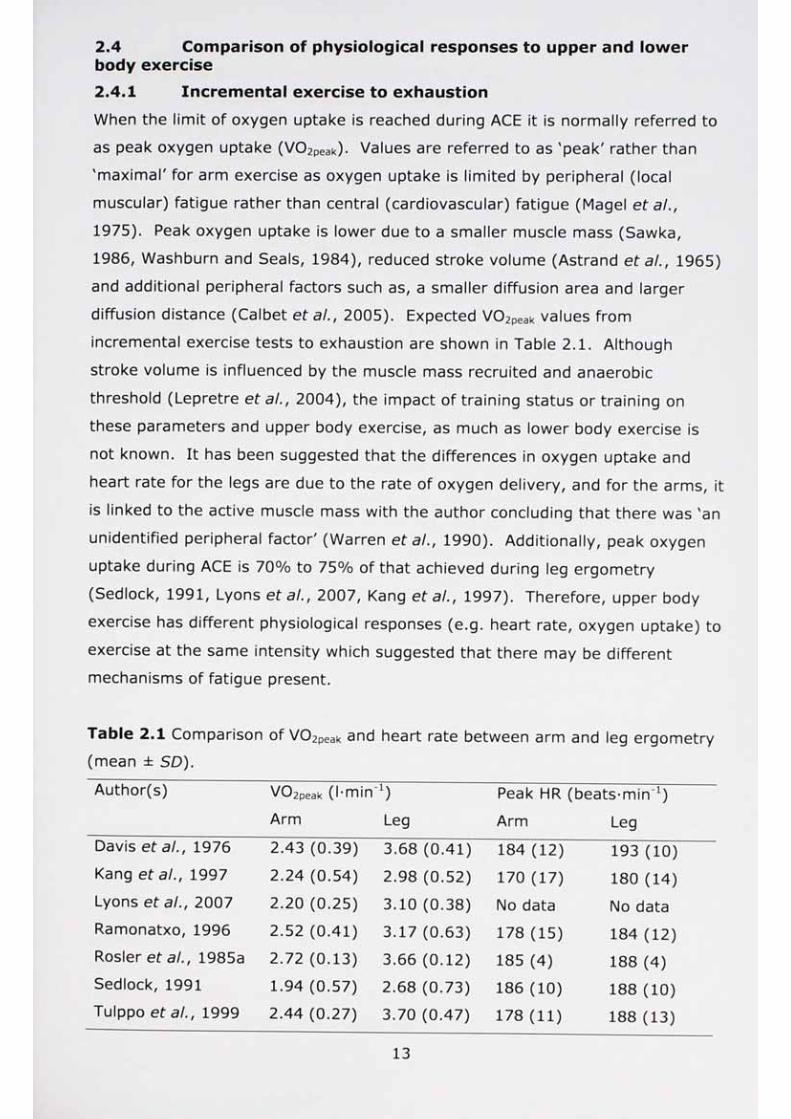
Table 2.1 Comparison of V 0 2peak and heart rate between arm and leg ergometry (mean ± 5D).
Author(s) V02peak (l-min
Arm- 1 )
Leg
Peak HR (beats-min1)
Arm LegDavis et at., 1976 2.43 (0.39) 3.68 (0.41) 184 (12) 193 (10)Kang et at., 1997 2.24 (0.54) 2.98 (0.52) 170 (17) 180 (14)Lyons et al., 2007 2.20 (0.25) 3.10 (0.38) No data No dataRamonatxo, 1996 2.52 (0.41) 3.17 (0.63) 178 (15) 184 (12)Rosier et al., 1985a 2.72 (0.13) 3.66 (0.12) 185 (4) 188 (4)Sedlock, 1991 1.94 (0.57) 2.68 (0.73) 186 (10) 188 (10)Tulppo et al., 1999 2.44 (0.27) 3.70 (0.47) 178 (11) 188 (13)
2.4.2 Submaximal responses
Oxygen uptake kinetics have been found to be slower (Koppo et al., 2002, Smith
eta/., 2006c) and heart rate and ratings of perceived exertion have been found
to greater at the same power output (49 W, 74 W and 98 W) when compared to
leg and both leg and arm exercise combined (Eston and Brodie, 1986). Heart
rate was also greater for ACE at the same relative exercise intensity (50%, 60%
and 70% of V 0 2peak) when compared to cycle ergometry (Kang eta/., 1997).
When the absolute power output is matched between upper and lower body
exercise at 70% of ventilatory threshold no differences in minute ventilation at
low intensities of exercise have been observed if the power output does not
elevate blood lactate. At 90% of mode specific ventilatory threshold relative
carbohydrate oxidation was significantly greater than leg exercise (Casaburi et
al., 1992, Yasuda et al., 2002). At an exercise intensity half way between
anaerobic threshold and V 0 2peak (Schneider et al., 2002) and above ventilatory
threshold the response from the arms indicated a greater recruitment of type II
muscle fibres compared to leg exercise (Bernasconi et al., 2006) and when the
intensity was at 90% of V 0 2peak (Koppo et al., 2002). During incremental ACE
the V02 excess has been observed as the result of an increase in trunk and lower
body stabilisation (Smith eta/., 2006c). However, no specific EMG or
biomechanical data has been reported to support this and further studies are
required to inform this area of research.
If work efficiency, which excludes resting energy expenditure, is considered then
at 50%, 60% and 70% of V02peak compared to leg exercise then ACE is
significantly less efficient (Kang et al., 1997). Compared to leg exercise, arm
exercise at 30%, 50%, and 80% of V02peak utilised more carbohydrate (reflected
in a higher lactate output) due to a greater reliance on the anaerobic system
(Ahlbory and Jensen-Urstad, 1991). Such unmeasured work, e.g. additional limb
movement or limb stabilisation, may be due to the reduction in unmeasured
work during ACE at lower intensities and conversely an increase in unmeasured
work during high intensity ACE (Kang etal., 1997, Shiomi eta/., 2000, Eston and
Brodie, 1986) (Ahlborg and Jensen-Urstad, 1991). The increase in unmeasured
work for higher intensities remains speculative although a number of studies
have suggested it may be due to isometric contraction of arm and trunk muscles
(Shiomi et al., 2000, Washburn and Seals, 1984, Bar-Or and Zwiren, 1975,
Bernasconi et al., 2006) or the trunk muscles contribution to power generation
(van Drongelen et al., 2009, Stamford eta/., 1978). The potential for lower
body and torso contribution may be significant during arm exercise. Therefore,
upper body exercise is not necessarily limited by the power output of the arms as
the torso may contribute to upper body fatigue or aid in power production.
Further research targeting the activity of the muscles noted above (EMG) and
both lower limb and trunk movement (kinematics) could give a clearer
understanding of their contribution to power production and/or unmeasured work
during high intensity exercise.
2.4.3 Wingate anaerobic test
The Wingate anaerobic test is a 30 s maximal test and has been widely used in
both upper and lower body exercise testing (Winter, 1991, Bar-Or, 1987).
Typical values for leg and arm WAnT are shown in Table 2.2 along with a figure
of a typical power profile observed (Figure 2.5). The test itself purports to
measure maximal and mean power output and fatigue over a short duration of
time. However, a standard definition for the variables measured during the
WAnT has not been reported in the literature. An accurate definition is important
for consistency of reporting data and when comparisons are made to previous
literature. From the review of published literature the most frequent term for the
30 s WAnT is to describe it as an 'anaerobic power' test. Tests of a longer
duration (greater than 30 s or repeated sprints) are generally referred to as 'high
intensity’ or 'supramaximal' and those of a short duration (less than 30 s) tend to
be referred to as 'sprint' or 'all-out' (Appendix 1).
15 i
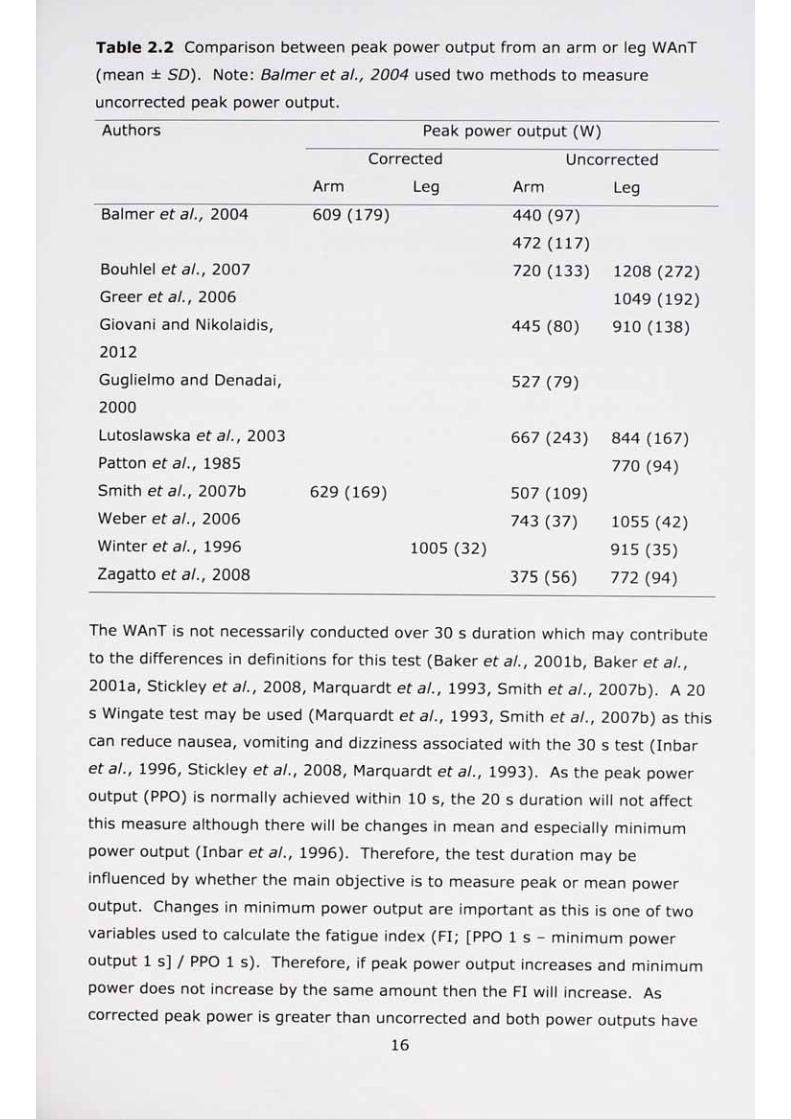
Table 2.2 Comparison between peak power output from an arm or leg WAnT
(mean ± SD). Note: Balmer et al., 2004 used two methods to measure
uncorrected peak power output.
Authors Peak power output (W)
Corrected Uncorrected
Arm Leg Arm Leg
Balmer et al., 2004 609 (179) 440 (97)
472(117)
Bouhlel et al., 2007 720 (133) 1208 (272)Greer et al., 2006 1049 (192)Giovani and Nikolaidis, 445 (80) 910 (138)2012
Guglielmo and Denadai, 527 (79)2000
Lutoslawska et al., 2003 667 (243) 844 (167)Patton et al., 1985
Smith et al., 2007b 629 (169) 507 (109)
770 (94)
Weber et at., 2006 743 (37) 1055 (42)Winter et at., 1996 1005 (32) 915 (35)Zagatto et a!., 2008 375 (56) 772 (94)
The WAnT is not necessarily conducted over 30 s duration which may contribute
to the differences in definitions for this test (Baker et al., 2001b, Baker et al.,
2001a, Stickley et al., 2008, Marquardt et al., 1993, Smith et al., 2007b). A 20
s Wingate test may be used (Marquardt et al., 1993, Smith et al., 2007b) as this
can reduce nausea, vomiting and dizziness associated with the 30 s test (Inbar
et al., 1996, Stickley et al., 2008, Marquardt et al., 1993). As the peak power
output (PPO) is normally achieved within 10 s, the 20 s duration will not affect
this measure although there will be changes in mean and especially minimum
power output (Inbar et al., 1996). Therefore, the test duration may be
influenced by whether the main objective is to measure peak or mean power
output. Changes in minimum power output are important as this is one of two
variables used to calculate the fatigue index (FI; [PPO I s - minimum power
output Is] / PPO 1 s). Therefore, if peak power output increases and minimum
power does not increase by the same amount then the FI will increase. As
corrected peak power is greater than uncorrected and both power outputs have
16
similar minimum power then the FI for corrected peak power output will be
greater (Bogdanis et al., 2008). Therefore, it is important that the FI is analysed
using corrected and uncorrected data as this will affect the analysis and reporting
of the measure of fatigue.
During the WAnT, the energy contribution is predominately anaerobic and
therefore performance is largely governed by this energy system (Minahan et al.,
2007, Smith and Hill, 1991). However, aerobic metabolism provides a significant
contribution to power output with a greater contribution towards the latter half of
the test (Smith and Hill, 1991, Medbo and Tabata, 1989, Gastin, 2001).
Depending on the type of measurement estimates of the aerobic contribution are
between 16% (Smith and Hill, 1991), 19% (Beneke et al., 2002, Bediz eta/.,
1998), 22% (Micklewright et al., 2006), 28% (Serresse eta/., 1988) and 40%
(Medbo and Tabata, 1989) during leg exercise. The aerobic contribution during
an upper body WAnT has not been established. However, it has been established
that there is a greater percentage of type II fibres in the arms and a lower
capillary to fibre ratio (Pendergast, 1989, Sawka, 1986), earlier and/or greater
recruitment of type II muscles fibres (Ahlborg and Jensen-Urstad, 1991, Koppo
et al., 2002, Smith et al., 2006c, Kang et a/., 1997) and a high anaerobic energy
release measured in ACE against leg ergometry at submaximal intensities
(Jensen-Urstad et a/., 1993, Koga et a/., 1996) and incremental exercise
(Schneider et a/., 2002). Muscle oxygenation desaturation during an upper body
WAnT is less than found during a WAnT performed with the legs and indicates
that for the upper body that the aerobic contribution is less than for leg exercise
(Kounalakis et a/., 2009). A greater anaerobic energy contribution to the WAnT
may therefore be assumed for ACE compared to leg ergometry for the same power output.
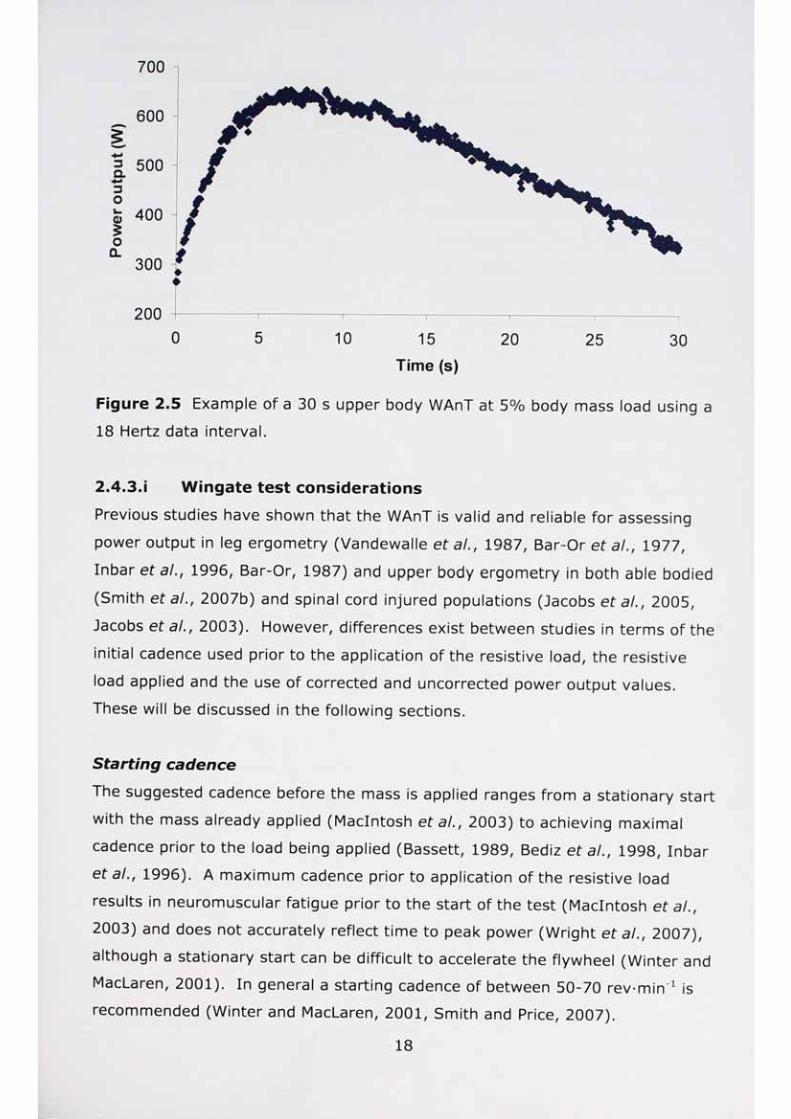
700
0 5 10 15 20 25 30
Time (s)
Figure 2.5 Example of a 30 s upper body WAnT at 5% body mass load using a
18 Hertz data interval.
2.4.3.i Wingate test considerations
Previous studies have shown that the WAnT is valid and reliable for assessing
power output in leg ergometry (Vandewalle et at., 1987, Bar-Or et at., 1977,
Inbar et at., 1996, Bar-Or, 1987) and upper body ergometry in both able bodied
(Smith et at., 2007b) and spinal cord injured populations (Jacobs et at., 2005,
Jacobs et at., 2003). However, differences exist between studies in terms of the
initial cadence used prior to the application of the resistive load, the resistive
load applied and the use of corrected and uncorrected power output values.
These will be discussed in the following sections.
Starting cadence
The suggested cadence before the mass is applied ranges from a stationary start
with the mass already applied (Macintosh et at., 2003) to achieving maximal
cadence prior to the load being applied (Bassett, 1989, Bediz et at., 1998, Inbar
et at., 1996). A maximum cadence prior to application of the resistive load
results in neuromuscular fatigue prior to the start of the test (Macintosh et at.,
2003) and does not accurately reflect time to peak power (Wright et at., 2007),
although a stationary start can be difficult to accelerate the flywheel (Winter and
MacLaren, 2001). In general a starting cadence of between 50-70 rev-min"1 is
recommended (Winter and MacLaren, 2001, Smith and Price, 2007).
18
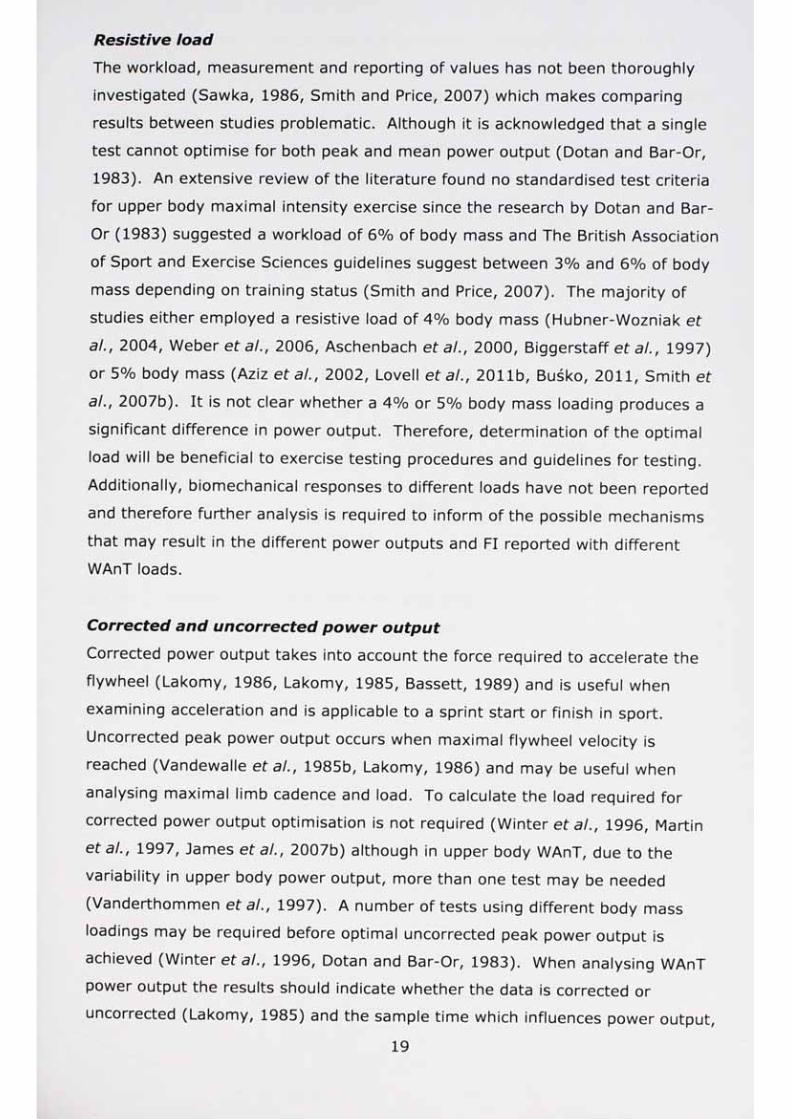
Resistive load
The workload, measurement and reporting of values has not been thoroughly
investigated (Sawka, 1986, Smith and Price, 2007) which makes comparing
results between studies problematic. Although it is acknowledged that a single
test cannot optimise for both peak and mean power output (Dotan and Bar-Or,
1983). An extensive review of the literature found no standardised test criteria
for upper body maximal intensity exercise since the research by Dotan and Bar-
Or (1983) suggested a workload of 6% of body mass and The British Association
of Sport and Exercise Sciences guidelines suggest between 3% and 6% of body
mass depending on training status (Smith and Price, 2007). The majority of
studies either employed a resistive load of 4% body mass (Hubner-Wozniak et
at., 2004, Weber eta/., 2006, Aschenbach eta/., 2000, Biggerstaff et a/., 1997)
or 5% body mass (Aziz et a/., 2002, Lovell et a/., 2011b, Busko, 2011, Smith et
a/., 2007b). It is not clear whether a 4% or 5% body mass loading produces a
significant difference in power output. Therefore, determination of the optimal
load will be beneficial to exercise testing procedures and guidelines for testing.
Additionally, biomechanical responses to different loads have not been reported
and therefore further analysis is required to inform of the possible mechanisms
that may result in the different power outputs and FI reported with different WAnT loads.
Corrected and uncorrected power output
Corrected power output takes into account the force required to accelerate the
flywheel (Lakomy, 1986, Lakomy, 1985, Bassett, 1989) and is useful when
examining acceleration and is applicable to a sprint start or finish in sport.
Uncorrected peak power output occurs when maximal flywheel velocity is
reached (Vandewalle et at., 1985b, Lakomy, 1986) and may be useful when
analysing maximal limb cadence and load. To calculate the load required for
corrected power output optimisation is not required (Winter eta/., 1996, Martin
et a/., 1997, James et a!., 2007b) although in upper body WAnT, due to the
variability in upper body power output, more than one test may be needed
(Vanderthommen et at., 1997). A number of tests using different body mass
loadings may be required before optimal uncorrected peak power output is
achieved (Winter et a/., 1996, Dotan and Bar-Or, 1983). When analysing WAnT
power output the results should indicate whether the data is corrected or
uncorrected (Lakomy, 1985) and the sample time which influences power output,
as the sample time increases peak power output is reduced (Lakomy, 1986,
Winter, 1991). The original WAnT and early studies (Bediz eta/., 1998, Bar-Or
eta/., 1977) used a 5 s averaging period to calculate performance indices. With
more powerful computing methods and further refinement of the test reported
values can now be analysed per second or fractions of a second (typically 0.5 s
and 0.25 s) (Lakomy, 1986). Corrected peak power output is greater and occurs
earlier than uncorrected peak power output (Lakomy, 1986, Lakomy, 1985,
Balmer eta/., 2004, James eta/., 2007b) although corrected and uncorrected
mean power output over 30 s is not significantly different (Balmer et a/., 2004).
The WAnT model allows for manipulation of resistive load in determining
performance (Goosey-Tolfrey eta/., 2006, Jacobs, 2003, Johnson eta/., 2004,
Dotan and Bar-Or, 1983). In general, for lower body WAnT the greater the
resistance results in a slower cadence and less resistance results in faster
cadences and therefore differences in power output. As such manipulation of
resistive load would enable analysis of physiological and biomechanical responses
to fatigue at different cadences and power outputs and help to understand the
requirements to training adding to the current paucity of published information in
this area.
2.4.4 Continuous high intensity exercise
Very few studies have investigated the physiology and biomechanics of ACE at
higher intensities continued to volitional fatigue rather than stopping after a
predefined period of time. Studies have typically investigated transitions in V02
kinetics due to changes in crank rate (Smith et at., 2006c), prior with or without
the legs active (Ogata and Yano, 2005) and the influence of prior arm exercise
(Koppo and Bouckaert, 2005). To date no studies have reported the physiology
or biomechanics during a series of increment high intensity ACE test to volitional exhaustion.
During incremental arm cranking the small amount of muscle mass, compared to
the legs, may be limiting to performance, rather than the oxygen transport
system (Bar-Or and Zwiren, 1975, Muraki eta/., 2004, Bhambhani, 2004).
Muraki et al., (2004) observed that the triceps brachii experienced muscle
deoxygenation at 50% of V02peak despite an adequate oxygen supply, indicating
that the limiting factor for exercise may be the triceps brachii ability to extract

and/or utilise oxygen The lower ability to extract and/or utilise oxygen was
related to a lower ratio of slow twitch muscle fibres, which promoted the use of
the anaerobic energy supply for this muscle group (Muraki et at., 2004). This is
illustrated by the local fatigue mentioned in section 2.2.1. At exercise intensities
at and above V02peak such fatigue may be accentuated. For example, local
fatigue from gripping the crank handles (pseudo-occlusion) may result in
isometric contractions and impair venous return. As exercise intensity increases
muscle grip may increase, which would further impair venous return (Koga et a/.,
1996, Schneider et at., 2009, Davis et at., 1976). Further study of forearm
muscle activation at various intensities may add to the limited knowledge in this
area.
During continuous high intensity exercise for the lower body there is a severe
exercise domain in which maximal oxygen uptake occurs. (Caputo and Denadai,
2008, Xu and Rhodes, 1999). There is an upper limit and lower limit to the
domain in which V02max cannot be achieved (Hill eta/., 2002). With the upper
limit fatigue occurs before V02max can be reached. The relationship of power and
time fits a hyperbola (Figure 2.6) i.e. as intensity increases time to achieve
V02max decreases. Whether, this relationship exists in upper body exercise is not
clear as at present studies have only indicated time to exhaustion at peak
oxygen uptake in swimmers and kayak paddlers (Billat eta/., 1996, Leveque et
a/., 2002, Fernandes et a/., 2008b). Time to exhaustion in the severe exercise
domain has not been reported for ACE. Given the physiological and
biomechanical difference to lower body exercise this warrants further
investigation, and may aid in informing upper body training programmes. As
previously stated V02peak and submaximal oxygen consumption compared to
WAnT and high intensity arm cranking is relatively well investigated. A number
of studies have examined physiological responses at intensities below V02peak
(Jensen-Urstad, 1992, Kang et at., 1999). Very few studies have examined
responses at or above V02peak (170% and 200% of V02peak; Tabata et at., 1997,
110% and 120% of maximal power; Marais eta/., 1999). These are isolated
studies and so far no study has examined responses below, at and above peak
oxygen consumption. A study linking various exercise intensities (e.g. 80%,
90%, 100% and 110% of V02peak) would be useful as it would enable
comparisons of and differences in fatigue at a range of high intensity exercise intensities to be examined.
21
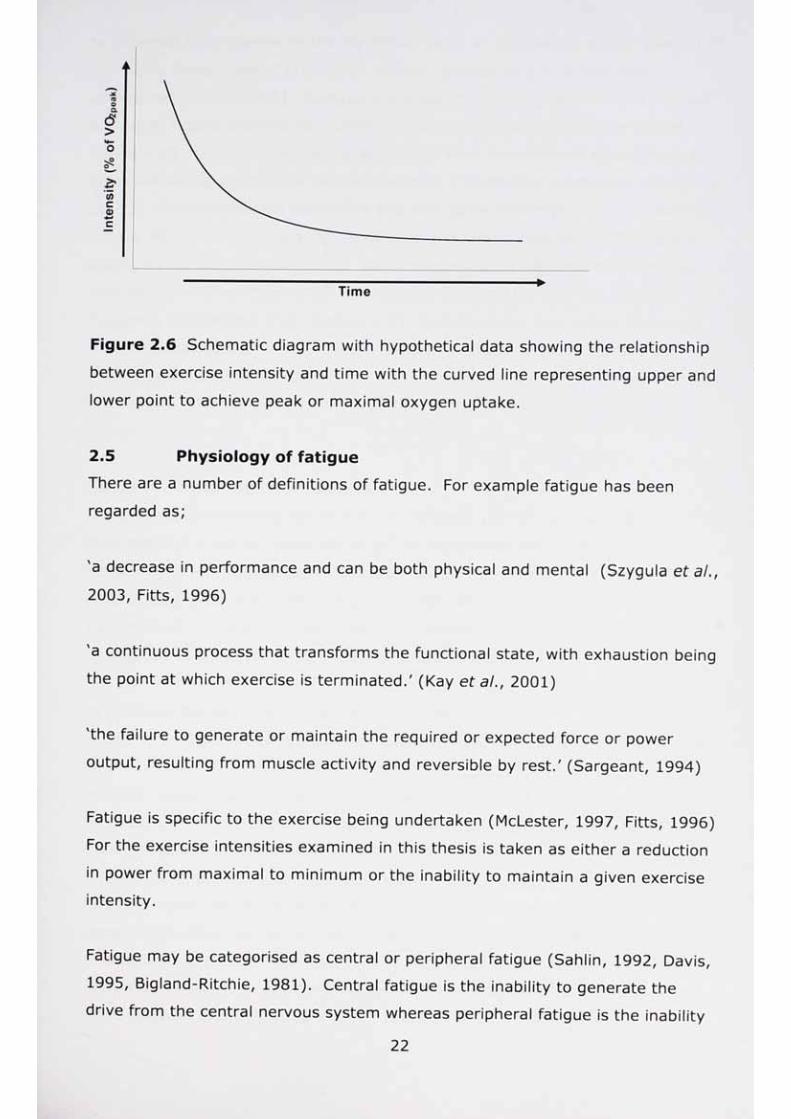
Time
Figure 2.6 Schematic diagram with hypothetical data showing the relationship
between exercise intensity and time with the curved line representing upper and
lower point to achieve peak or maximal oxygen uptake.
2.5 Physiology of fatigue
There are a number of definitions of fatigue. For example fatigue has been
regarded as;
'a decrease in performance and can be both physical and mental (Szygula et al., 2003, Fitts, 1996)
'a continuous process that transforms the functional state, with exhaustion being
the point at which exercise is terminated.' (Kay et al., 2001)
'the failure to generate or maintain the required or expected force or power
output, resulting from muscle activity and reversible by rest.' (Sargeant, 1994)
Fatigue is specific to the exercise being undertaken (McLester, 1997, Fitts, 1996)
For the exercise intensities examined in this thesis is taken as either a reduction
in power from maximal to minimum or the inability to maintain a given exercise intensity.
Fatigue may be categorised as central or peripheral fatigue (Sahlin, 1992, Davis,
1995, Bigland-Ritchie, 1981). Central fatigue is the inability to generate the
drive from the central nervous system whereas peripheral fatigue is the inability
to generate a contraction in the peripheral nerve or contracting muscle (Sahlin et
al., 1998, Davis, 1995, Taylor eta/., 2000). Central fatigue is relatively
unexplored (Davis, 1995). It may have a role in high intensity exercise through
a reduced neural drive (Green, 1997), as suggested during six 1-min sprints
during a 60 min cycle test (Kay eta/., 2001). Here reductions in efferent drive
observed during sprints 2-4 and were seen as a protective mechanism via central
control. Additionally, the discomfort and pain of the exercise may contribute to
fatigue with the longer duration the greater the impact (Sahlin, 1992, Katch and
Henry, 1972, Taylor et a/., 2000). Local fatigue during high intensity exercise
may be the result of number of physiological mechanisms such as, afferent
feedback, interference from metabolic by-products, fibre type rather than one
isolated factor (Green, 1997). Recent molecular data has indicated that the
muscle proteins troponin and tropomyosin are disrupted by the by-productions of
metabolism (Debold, 2012). The potential fatigue mechanisms are explored below.
2.5.1 Components of fatigue
In high intensity exercise the increase of inorganic phosphate from the
breakdown of creatine phosphate interferes with sarcoplasmic reticulum Ca2+
handling e.g. inhibition of Ca2+ uptake or release and also with the cross-bridge
cycle (Westerblad eta/., 2002, McLester, 1997, Bangsbo eta/., 1996).
Furthermore, the metabolic by-products of contractions may affect the feedback
from group III-IV afferents that are sensitive to metabolic products and
ischaemia (Taylor et a/., 2000). This may be important to upper body exercise
as previous research suggested that in response to a sustained 2 min maximal
voluntary contraction there was a reduction in triceps brachii and an increase in
biceps brachii EMG activity (Martin et a/., 2006). Additionally, during static
exercise, upper limb postural muscles (e.g. infraspinatus) may increase EMG
amplitude in relation to postural fatigue and arm position more significantly than
during dynamic force production (Rudroff et a/., 2007). No studies so far have
reported changes in EMG amplitude in these muscles during dynamic upper body
exercise. However, WAnT testing of the lower limb indicated an accumulation of
metabolite and/or reduced afferent command does not alter EMG amplitude due
to a constant electrical input (Rana, 2006, Hunter et a/., 2003).
Muscle performance is influenced by the fibre types recruited, fast twitch (FT)
fibres are able to produce more power resulting in a high concentration of
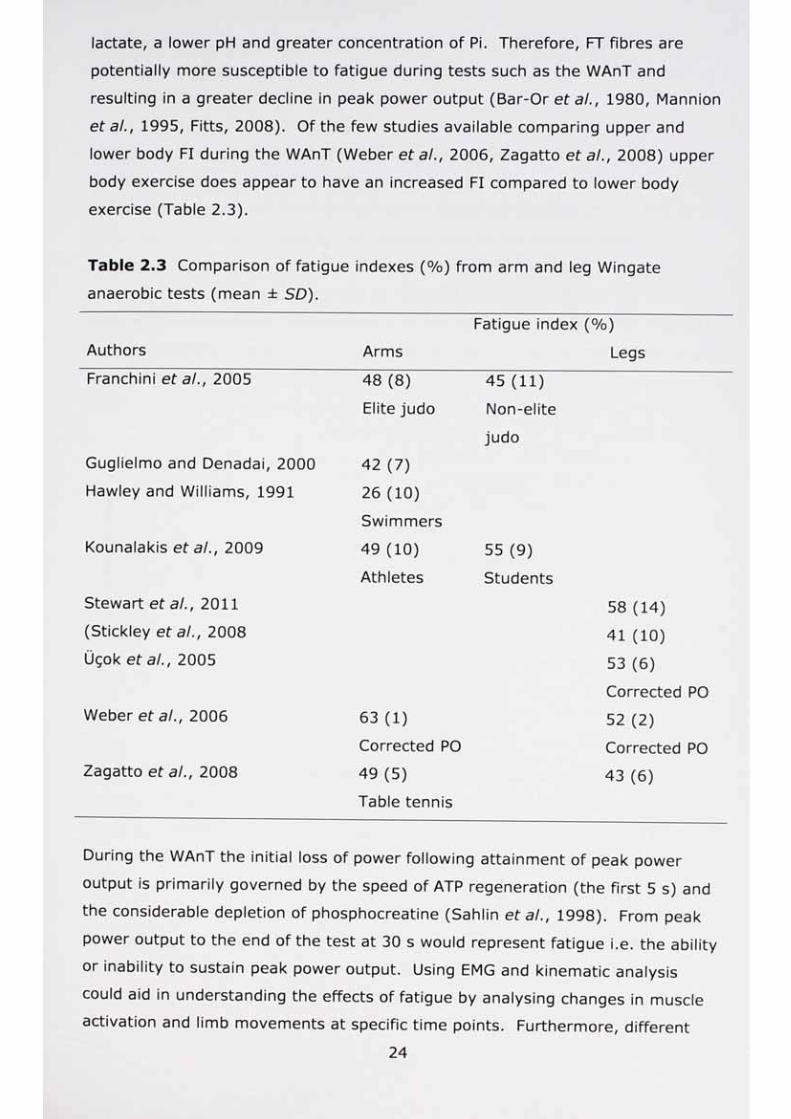
lactate, a lower pH and greater concentration of Pi. Therefore, FT fibres are
potentially more susceptible to fatigue during tests such as the WAnT and
resulting in a greater decline in peak power output (Bar-Or et at., 1980, Mannion
eta/., 1995, Fitts, 2008). Of the few studies available comparing upper and
lower body FI during the WAnT (Weber eta/., 2006, Zagatto eta/., 2008) upper
body exercise does appear to have an increased FI compared to lower body
exercise (Table 2.3).
Table 2.3 Comparison of fatigue indexes (%) from arm and leg Wingate
anaerobic tests (mean ± SD).
Fatigue index (%)Authors Arms Legs
Franchini et a/., 2005 48 (8) 45 (11)
Elite judo Non-elite
judo
Guglielmo and Denadai, 2000 42 (7)
Hawley and Williams, 1991 26 (10)
SwimmersKounalakis et a/., 2009 49 (10) 55 (9)
Athletes StudentsStewart et a/., 2011 58 (14)(Stickley et a/., 2008 41(10)Ugok et a/., 2005 53 (6)
Corrected POWeber et a/., 2006 63 (1) 52 (2)
Corrected PO Corrected POZagatto et a/., 2008 49 (5) 43 (6)
Table tennis
During the WAnT the initial loss of power following attainment of peak power
output is primarily governed by the speed of ATP regeneration (the first 5 s) and
the considerable depletion of phosphocreatine (Sahlin et a/., 1998). From peak
power output to the end of the test at 30 s would represent fatigue i.e. the ability
or inability to sustain peak power output. Using EMG and kinematic analysis
could aid in understanding the effects of fatigue by analysing changes in muscle
activation and limb movements at specific time points. Furthermore, different

resistive loads may evoke different fatiguing effects. Thus, the examination of
responses (EMG and kinematics) at difference intensities is needed have not
been reported in the literature.
2.5.2 Fatigue during high intensity lower body
At intensities above and below V02max there is a curvilinear relationship between
intensity and endurance time (known as the force-velocity time curve; Figure
2.7). The force velocity time curve demonstrates as the exercise intensity
increases (force) the performance duration (velocity) is reduced. With
appropriate training the curve shifts to the right (Sahlin, 1992). If this is due to
a technique change with performance then biomechanical analysis may help to
explain adaptations to training. Assessing how ACE technique changes at fatigue
with training may address this aim.
Figure 2.7 Schematic diagram with hypothetical data showing the relationship
between intensity (force) and time (velocity). The curved line representing
upper and lower point between oxygen uptake and duration (time; s) of exercise.
The dashed line represents a shift to the right in the curve as a response to training.
The contributors to fatigue may change as the exercise intensity decreases, for
example, high intensities, muscle and ATP recruitment and at lower intensities
substrate stores, dehydration and motivation (Davis, 1995, Korge, 1995,
Mannion et a!., 1995, McLester, 1997). To date studies have not examined the

relationship between exercise intensity and fatigue during upper body exercise
using ACE over a range of intensities. An analysis of change in technique may
help to understand the mechanisms of fatigue in a relatively small muscle mass
compared to lower body exercise. Most studies of lower body exercise have that
have linked biomechanics and physiology and have focused on running economy
and therefore this topic is relatively unexplored in the literature for ACE.
Furthermore, performance at different intensities of exercise may evoke different
fatiguing effects, thus the examination of responses at difference intensities is
needed.
2.5.3 Fatigue during high intensity upper body exercise
As previously discussed there are a number of theories regarding fatigue. The
type of fatigue experienced, central or local, is often duration/intensity based and
can be manipulated by speed of limb movement and cadence. As with most
areas of upper body exercise the mechanisms of fatigue remain relatively
unexplored and given the differences in physiology when compared to lower body
exercise, these differences should be examined to determine differences in
fatigue during upper and lower body exercise.
As noted in sections 2.4.1, fatigue in incremental upper body exercise may be
limited by local muscular fatigue over central fatigue (Sawka, 1986, Mossberg et
at., 1999, Franklin, 1985, Enders et a!., 1994). The greater recruitment of type
II muscle fibres during upper body exercise may result in exercise termination
due to neuromuscular fatigue (Bernasconi et al., 2006). Neuromuscular fatigue
in ACE may be due to the build-up of metabolic by-products (e.g. inorganic
phosphate, H+ and lactate) interfering with the process of muscle contraction
(Bernasconi et al., 2006, Taylor et al., 2000). Further specific studies examining
motion analysis and EMG may improve understanding of the mechanisms
contributing to arm fatigue (Section 2.7 & 2.8).
Activation of a smaller muscle mass such as during upper body exercise may
concentrate perceptions of fatigue more so than during leg exercise at 70% of
v02peak (Kang et al., 1998). However, perception of fatigue at higher intensities
of upper body exercise, and the determination of whether at higher intensities
oxygen uptake and ratings of perceived exertion can be associated to the same
extent as lower body fatigue remains to be reported. During maximal
incremental arm there may be an additional afferent feedback from the arms and
torso (Ishida eta/., 1994) which may increase neuromuscular activity and, due
to the increased load on the respiratory system (Ramonatxo, 1996), increase
perceptions of fatigue. These changes in perception, or actual fatigue, appear to
be affected by cadence. For example at 50 rev-min"1 there is greater local RPE
than central RPE and participants fatigued earlier in a V02peak test at this cadence
than when compared to 90 rev-min1, even though ventilation rate increased with
cadence (Smith eta/., 2006b). Therefore, perception of fatigue may be greater
and more limiting than during lower body exercise.
In comparison to lower body exercise the possibly greater anaerobic
contributions associated with upper body exercise such as greater proportion of
fast twitch fibres (Muraki et at., 2004, Kounalakis et at., 2009) would increase
the accumulation of inorganic phosphate and as the duration of exercise
increased the accumulation of ADP would also contribute to the fatigue process
(McLester, 1997). Additionally, late in exercise, and especially in ischaemic
conditions, pain develops which may contribute to sensation of fatigue through
local RPE and the termination of exercise (Taylor et al., 2000). In isometric
conditions it is possible that local muscular fatigue may be accentuated at
greater exercise intensities thus increasing the potential for localised (forearm)
muscle ischaemia. At comparable exercise intensities local and central RPE are
greater in the arms than the legs (Marais et al., 2001). Therefore, studies
reporting this difference may aid in the understanding of the mechanism of
fatigue associated with ACE.
Electroencephalograph (EEG) activity following incremental ACE to exhaustion
has been found to differ when compared to cycle and treadmill ergometry.
These responses suggest the local muscular fatigue experienced and the
inexperience of the participants to this activity contributed to the greater local
fatigue (Schneider eta/., 2009). The change in EEG may indicate differences in
central drive and fatigue that could be reflected in changes in EMG although this
has not been reported in the literature for ACE and requires further studies to
investigate this possible cause of fatigue and possible changes in EMG after habituation to ACE.
27

A number of suggestions for the mechanisms of fatigue have been proposed and
these can be examined through physiological and biomechanical methods as well
as perceptual methods such as RPE which may aid detection of different types of
fatigue. Once the key factors contributing to fatigue, analysed within the scope
of this thesis, have been identified it will be useful to examine how these factors
can be manipulated by exercise intensity and training. Training may result in
reduced fatigue and therefore improve performance such as maximal power
output or time to exhaustion. This could also facilitate/optimise the volume of
work that can be achieved in the context of clinical rehabilitation which could
have implications for exercise adherence.
2.6
2.6.1
Upper body training studies
Upper body aerobic training studies
There are few studies on the effects of arm crank training compared to leg
training especially in non-clinical or healthy populations. However, there are also
cross sectional studies involving upper body athletes and how their trained state
differs from untrained participants. Increased lactate release and greater aerobic
output in trained rowers compared to untrained individuals at volitional fatigue
(Volianitis et at., 2004a) has been shown. Furthermore, arm crank training has
produced significant improvements in central and peripheral circulatory function
and increase in time to exhaustion (Loftin eta/., 1988). In males, with
quadriplegia, eight weeks of arm crank training improved cardiopulmonary
functions and wheelchair propulsion endurance (Dicarlo, 1988) and five weeks
training improved submaximal wheelchair exercise (Sedlock eta/., 1988).
Training programmes often weeks (Magel eta/., 1978) and five weeks (Clausen
et a/., 1973) of arm cranking training resulted in significant improvements in
V02peak(16% and 10% increase respectively) which was reflected in a
significantly enhanced a-v02 difference, a peripheral rather than a central
adaption. There was no significant change in stroke volume, cardiac output or
heart rate (HR). Although, Clausen et a/., (1973) found a reduction in HR at a
submaximal exercise intensity which may indicate a central adaptation at
submaximal loads. This suggested that peripheral adaptations can be adapted
separately and may be more important for upper body exercise than central
adaptations. Helge (2010) reviewed low-intensity arm and leg training studies
below V02peak and suggested that there are specific adaptations to the arm and
leg and that adaptations are peripheral rather than central for the upper body.
28
Adaptations to high intensity ACE using an anaerobic training programme would
be beneficial as lower body high intensity training studies have shown
performance improvements in time to exhaustion (Burgomaster eta/., 2005),
maximal oxygen uptake (Gibala eta/., 2006) and WAnT power output (Ziemann
et a/., 2011). However, there are no reports of training studies that have
incorporated high intensity upper body training.
2.6.2 Upper body strength training studies
Although there is a lack of research reporting the effects of high intensity upper
body exercise training, the effects of conventional resistance training or circuit
training have been reported. A study involving four weeks strength training
(four upper body exercises, three sets of ten repetitions at 60% of one repetition
maximum) observed increases in strength and V02peak in previously sedentary
men (Swensen et at., 1993). Suggested reasons for an increase in performance
were increased recruitment of muscle fibres and/or more efficient coordination.
Although not measured, this training may have improved technique and
therefore biomechanics which could be measurable by motion analysis and EMG
before and after training. The authors recommended a training study of longer
duration but such effects may be cancelled out by muscle hypertrophy reducing
mitochondrial and capillary density (Swensen et at., 1993). Therefore, this study
indicated that strength/power training could improve ACE peak oxygen uptake.
As ACE training can have a positive impact on performance through reducing
local fatigue (Helge, 2010), a training study examining how technique potentially
contributes to a reduction in local fatigue would be informative. Any changes in
fatigue indicated by a reduction in the difference between local and central
ratings of perceived exertion may indicate through local and central RPE any
physiological and/or biomechanical adaptations.
2.6.3 Comparing the physiological responses between untrained
individuals and trained upper body athletes
The differences in leg compared to arm exercise responses may be in part due to
the relatively untrained state of the arms, i.e. lack of use of the arms in everyday
activities when compared to the legs (Yasuda et at., 2002, Koga eta/., 1996,
Clausen et at., 1973, Davis et at., 1976). However, it has been shown that at
submaximal exercise intensities (30%, 50% and 80% of V02peak) lactate release
is similar between untrained and arm-trained athletes (Jensen-Urstad, 1992)
which may be related to similar circulatory adaptations in the arms regardless of
training status. It is likely that lactate accumulation could be changed by
undertaking a period of ACE training and the respiratory exchange ratio (RER)
could be reflective of changes in muscle pH and bicarbonate buffering of lactate
acid (Casaburi et al., 1992). Although not specifically ACE trained, during
maximal arm cranking trained rowers were found to have a threefold increase in
lactate release compared to untrained subjects, additionally the rowers had a
higher arm blood flow and larger oxygen extraction (Volianitis et al., 2004a).
The two studies noted above examined training status in relation to peak oxygen
uptake or during low intensity exercise (30-90 W). These studies were not
concerned with measuring EMG responses to investigate changes in muscle
activation, or motion analysis to analyse changes in ACE techniques and whether
these can reduce fatigue and improve ACE performance. The use of physiology
and biomechanics would aid in analysing how adaptations to training could
improve ACE performance during high intensity anaerobic upper body exercise.
2.7 Motion analysis
Despite being recommend as an area of research by Bar-Or and Zwiren (1975)
and later by Inbar et al., (1996, p.75) motion analysis for ACE is considerably
under reported in the literature. An extensive literature search revealed studies
have examined motion analysis relating to upper body sport or exercise and
these will reviewed. In able-bodied participants undertaking 7 weeks of
wheelchair training improvements in mechanical efficiency and metabolic cost of
the experimental group where likely to be the result of significant increased
stroke angle observed compared to the control group (de Groot et al., 2008).
Similarly, during wheelchair ergometry, wheelchair-dependent participants where
more mechanically efficient than able-bodied participants (Brown et al.,
1990)which suggests that upper body exercise performance can be improved by
specific training. During submaximal one minute handcycling in nondisabled
participants, trunk range of motion was observed to be significantly greater in
asynchronous mode compared to synchronous mode (Faupin et al., 2011). As
asynchronous handcycling is comparable to ACE (Faupin et at., 2011) it is
probable that trunk function is important to ACE performance and requires further study.
Two studies have examined motion analysis during upper body exercise (Price et
al., 2007, Bressel and Heise, 2004). Differences in wrist flexion and muscle
activity at a low exercise intensity (25 W) where observed between forward and
reverse arm cranking (Bressel and Heise, 2004) whereas differences in shoulder
range of motion and trunk angle were observed at V02peak during ACE at different
cadences (Price et at., 2007). Both these studies showed technique difference
with exercise intensity. However, there are no reported studies involving motion
analysis of high intensity anaerobic upper body exercise. Given the extensive
use of this test in a variety of settings it would appear that further research may
be beneficial to examine performance and the effect of technique on fatigue.
This lack of literature may be an indication of the methodological problems
associated with the high speed of movement in high intensity exercise tests such
as the WAnT.
2.7.1 Biomechanical changes and fatigue
Previous studies suggest that fatigue changes movement patterns and can be
detected by motion analysis in runners during a treadmill run to exhaustion
(Millet et at., 2010). Furthermore, inducing hip abductor fatigue prior to
treadmill running increased the changes in knee position (Geiser eta/., 2010).
Changes in joint movement and position due to fatigue may be the result of the
fatiguing process itself through an impaired ability to detect movement i.e. as an
individual fatigues greater limb/torso movements are required before those
movements can be detected (Taylor et a!., 2000). Shoulder external rotation has
been shown to significantly increase due to fatigue desensitising the muscle
mechanoreceptors (Lee et al., 2003a). Changes in kinematics via alterations in
crank length can alter power production at a cadence of 120 rev-min 1 (Barratt et
al., 2011). After a fatiguing WAnT lower body test metabolic fatigue may
weaken dynamic knee joint stability (increase movement), and training may help
control body movement and lessen the chances of injury (Ortiz et al., 2010).
Given the likely extensive contribution of the shoulder muscles in ACE
performance an investigation of the kinematic responses is needed to inform us
of technique changes or limitation to movement patterns or force production
and whether the forms of fatigue differs over a range of resistive loads observed
for lower limb studies is applicable for upper body exercise
A previous study of V02peak during ACE (Price et at., 2007) suggested that the
biomechanics of ACE change due to both cadence and exercise intensity. Further
investigation is needed when cadence is set at the current BASES and literature
recommendation of 70 rev-min'1 (Price et at., 2007, Smith and Price, 2007) and
how different intensities at 70 rev-min'1 affect the motion of the limbs and body
during ACE performed to volitional fatigue. This may help explain how
biomechanical variables (i.e. technique) have an influence on power production
and fatigue, as this represents/describes the muscle movement path which is
affected by muscular activity and fatigue.
At low intensity (50%-60% of V02peak) at 50 rev-min'1 respiratory frequency
synchronized with arm movement more than leg exercise (Vokac eta/., 1975).
Whether this could influence high intensity ACE performance is not clear,
although later studies on optimal cadence for peak incremental ACE testing have
suggested that cadences below 70 rev min 1 were not optimal for performance
(Smith eta/., 2001, Price and Campbell, 1997, Price eta/., 2007, Sawka eta/., 1983).
2.8 Muscle activation
Although power can be recorded by the ergometer being used and
cardiorespiratory and motion analysis add to the picture of how this power is
being produced, muscle activation can provide a more detailed analysis of
individual muscle or muscles activation and time of activation and indicate how
different exercise intensities alter these parameters within the muscle(s) being
studied. As for motion analysis, muscle activation studies during ACE are not
extensively reported in the literature and further examination of this area is
therefore required. The available literature pertaining to ACE will be reviewed below.
2.8.1 Muscle activation during arm crank ergometry
Reflexes of the upper limb have been studied and indicated amplitudes changed
for the first dorsal interosseus, carpi ulnaris (flexor and extensor),
brachioradialis, biceps and triceps brachii and deltoid (anterior and posterior)
throughout the duty cycle (Zehr and Chua, 2000), therefore muscles are
activated at different times during the duty cycle. Due to the method of analysis
there was no statistical analysis performed on the differences in magnitude. In a

later study, during unloaded ACE, the biceps and triceps brachii, deltoid
(anterior, posterior and medial), erector spinae (cervical, thoracic, lumbar) and
carpi radiallis (flexor, extensor) showed significant differences in EMG magnitude
between certain clock positions for each individual muscle (Klimstra et at., 2011).
Therefore, each individual muscle is not activated to the same magnitude during
the whole of the duty cycle. For Klimstra et a!., (2011) not all muscles showed
the same duration of maximal activation, for example the triceps brachii was not
activated for as long a duration as the medial deltoid.
When a resistive load is applied to the ACE at increasing low intensities (15W, 30
W and 45 W) EMG activation was found to increase in four sites including the
external oblique and rectus abdominis regardless of whether participants were
conventionally seat or seat on a stability ball (Marks et at., 2012). Additionally,
using the stability ball significantly increased oxygen uptake and rectus femoris
activation over sitting on a chair. This study indicated that muscle activation
during ACE increased with resistive load and a stable position for the lower limbs
is need to accurately access upper body work measured via oxygen uptake.
Increased EMG activation was observed in males and females during one arm
ACE with power output between 5 W and 35 W (Frauendorf et at., 1986). This
relationship was found at higher intensities by Marais et at., (2004) via muscle
activation in the biceps and triceps brachii at intensities from 20% to 80% of
peak power out, and found that muscle activation increased with work load. The
EMG responses during sub-maximal and asynchronous ACE showed triceps
brachii to be activated for 50% of the duty cycle and the rectus abdominis to act
only as a stabiliser (Hopman et at., 1995). However, Hopman et at., (1995) only
analysed the EMG data descriptively not statistically and a more detailed analysis
of muscle patterns of activation would aid understanding in this area. As part of
an examination of ACE hand grip position Bressel et at., (2004) found that the
triceps brachii at 25 W was activated for 52% of the time which would support
the 50% observation of Hopman et at., 1995.
During constant load exercise between ventilatory threshold and V02peak, for 6-
min, increased muscle activation has observed (biceps, triceps, deltoid and
infraspinatus) which could be linked to changes in oxygen uptake and
recruitment of additional type II muscle fibres (Bernasconi et at., 2006). Further
recommendations were made for the study of EMG, in relation to handgrip and
torso and shoulder stabilisers (Bernasconi et al., 2006). Smith et at., (2007a)
observed that during submaximal ACE engagement of leg, torso and arm
muscles occurred and activation increased with load, especially in the prime
movers (biceps and triceps). The above authors suggested further investigation
into muscle activation at higher exercise intensities than the 50 W and 100 W
studied with recommendations for measurement of a number of additional
muscles including the torso.
During incremental ACE to exhaustion were differences in EMG activation
between upper body trained and non-upper body trained participant (Frauendorf
et al., 1989). Swimmers showed an increasing level of EMG activity in upper
body sites with an increasing load, where as there were no significant changes in
EMG activity for trained runners (Kilen et al., 2012) and untrained males
(Frauendorf et al., 1989). This observation suggests upper body athletes exhibit
a different muscle recruitment response during ACE to lower body athletes and
this is likely to be due to the their upper body training. At present no studies
have investigated EMG and ACE during the WAnT, at high intensity constant load
exercise to volitional exhaustion or following adaptations following ACE training.
Such studies would assist in providing a comprehensive analysis of ACE
continued to volitional fatigue and aid in the understanding of contributory
muscle(s) and changes in technique to performance.
2.8.2 Muscle activation and fatigue
Lower limb EMG studies may give an indication of how fatigue affects muscle
force and recruitment during ACE. For example during cycling to exhaustion at
80% of maximal power output, changes in movement patterns due to fatigue
resulted in compensatory increases and earlier recruitment of additional muscles
(hip extensor) to attenuate the loss of force production of knee extensor muscles
(Dorel et al., 2009). In addition different types of exercise that induce
neuromuscular fatigue (short duration; repeated squats and submaximal cycling)
have been shown to alter the biomechanical response to landing performance
(James et al., 2010). Whilst comparing incremental asynchronous versus
synchronous ACE to volitional exhaustion, Mossberg et al., 1999, suggested that
the triceps brachii fatigue was likely to contribute to fatigue and more so in
synchronous ACE. To provide further information additional muscles contributing
to ACE power output require further study as only the triceps brachii and anterior
deltoid was included in the Mossberg eta/., (1999) study. Therefore, fatigue
induces change in these patterns of muscle recruitment and/or changes in
kinematics. Whether these changes exist in upper body ACE remains to be
investigated.
2.9 Summary
The physiological responses comparing upper and lower body exercise have
observed differences in a number of variables such as oxygen uptake, local
fatigue and ratings of perceived exertion. Although upper body exercise does
exhibit some similar responses in comparison to leg exercise, such as responses
to exercise at 100% of V02peak - although the time to exhaustion is different, less
is known about anaerobic upper body work, especially during constant work
tests. Furthermore, in these scenarios studies examining biomechanics during
lower body activities have indicated that technique is related to fatigue.
Therefore, the following areas of research were undertaken;
The aims of this thesis will be realised through a series of three studies. Study 1
will examine the biomechanical and physiological responses to maximal intensity
30-s arm cranking. The model used will involve the manipulation of cadence and
subsequently power output. The first study will also aim to determine an optimal
protocol for maximal intensity 30-s arm cranking that elicits maximal
performance. Study 2 will examine the biomechanical and physiological
variables associated with fatigue during continuous high intensity upper body
exercise. The model used will enable the examination of fatigue at a constant
cadence but different exercise intensities. The second study will also attempt to
determine the optimal exercise intensity for the assessment of continuous high
intensity upper body exercise performance. Studies 1 and 2 will therefore
examine the limiting factors of different types of high intensity upper body
exercise from physiological and biomechanical perspectives. The final study will
determine the effect of anaerobic training on physiological and biomechanical
responses in order to assess how these limiting factors are affected or potentially
offset by training.
35
2.10 Hypothesis
Null hypothesis (Hoi): There will be no significant difference in performance
measures with changes in resistive load during a 30-s Wingate anaerobic test.
Alternative hypothesis (Hi): There will be a significant difference in performance
measures with changes in resistive load during a 30-s Wingate anaerobic test.
Null hypothesis (Ho2): There will be no significant difference in biomechanical
and physiological responses with changes in load during a 30-s Wingate
anaerobic test.
Alternative hypothesis (H2): There will be no significant difference in
biomechanical and physiological responses with changes in load during a 30-s
Wingate anaerobic test.
Null hypothesis (Ho3): There will be a significant difference in cardiorespiratory
and biomechanical responses with changes in exercise intensity during high
intensity exercises completed to volitional exhaustion.
Alternative hypothesis (H3): There will be no significant difference in
cardiorespiratory and biomechanical responses with changes in exercise intensity
during high intensity exercises completed to volitional exhaustion.
Null hypothesis (Ho4): There will be a significant difference in performance
measures with changes in exercise intensity during high intensity exercises
completed to volitional exhaustion.
Alternative hypothesis (H4): There will be a no significant difference in
performance measures with changes in exercise intensity during high intensity
exercises completed to volitional exhaustion.
Null hypothesis (Ho5): There will be a significant difference in physiological and
biomechanical responses measured via a Wingate anaerobic test and tests of
high intensity exercise completed to volitional exhaustion following a 6-week
training programme.
Alternative hypothesis (H5): There will be no significant difference in
physiological and biomechanical responses measured via a Wingate anaerobic
test and tests of high intensity exercise completed to volitional exhaustion
following a 6-week training programme.

Null hypothesis (Ho6): There will be a significant difference in performance
measures for a Wingate anaerobic test and tests of high intensity exercise
completed to volitional exhaustion following a 6-week training programme.
Alternative hypothesis (H6): There will be a no significant difference in
performance measures for a Wingate anaerobic test and tests of high intensity
exercise completed to volitional exhaustion following a 6-week training
programme.
37
Chapter 3
General methods
3.1 Recruitment, ethics and testing considerations
Participants were recruited via posters, email and face to face meetings. All
participants were provided with a participant information sheet prior to beginning
each study and completed an informed consent form (Appendix 2) along with a
pre-test medical questionnaire prior to each exercise session (Appendix 3). Any
participants known to have high blood pressure (greater than 139/89 mmHg;
Stage 1 hypertension; Pescatello et al., 2004) or taking blood pressure
medication were excluded from participating. Specific participant details will be
given in each chapter. All studies were approved by the University's Post
Graduate Research Ethics Committee (Appendix 2).
All data were held in a locked filing cabinet or stored on a password protected
computer and it was not possible to identify participants from any published
outputs from the research. On completion of the data collection and research all
data collected, apart from pre-test medical questionnaires and informed consent,
were either destroyed or returned to the individual as per the University of
Northampton guidelines. Pre-test medical questionnaires and informed consent
documentation are to be held securely for six years before being destroyed as
confidential waste. On completion of the study a short summary of the results
were sent to each participant.
To control for any possible differences in power output and fatigue between male
and females, only male participants were used in the main studies in accordance
with previous study protocols (Szygula eta/., 2003, Hopkins eta/., 2001, Hicks
et a/., 2001). To minimise possible variation in power output within studies due
to circadian rhythms (Souissi eta/., 2007, Hill and Smith, 1991, Bernard eta/.,
1998), each participant was tested within ± 1 hour of their initial testing session
with a minimum of 48 hours between tests. In addition, participants were
instructed not to conduct new training regimes, or any vigorous training prior to
each test. All tests were conducted in the same laboratory with the temperature
between 18-21°C.
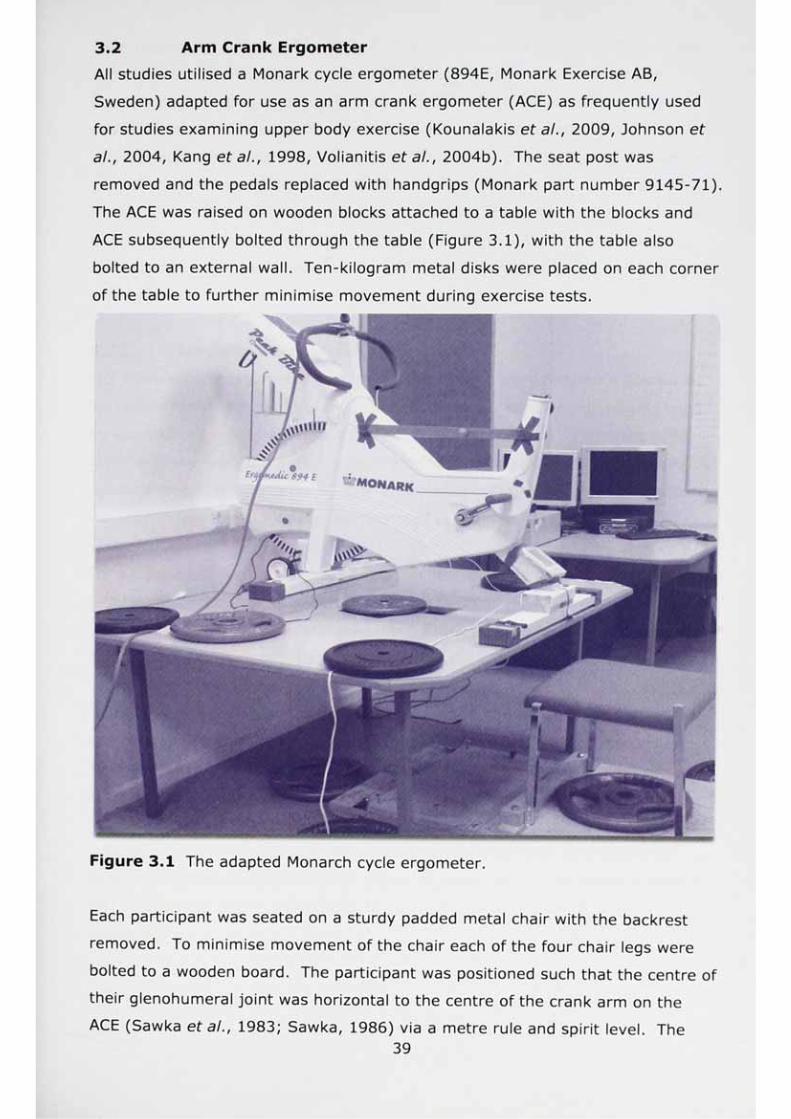
3.2 Arm Crank Ergometer
All studies utilised a Monark cycle ergometer (894E, Monark Exercise AB,
Sweden) adapted for use as an arm crank ergometer (ACE) as frequently used
for studies examining upper body exercise (Kounalakis et at., 2009, Johnson et
at., 2004, Kang et at., 1998, Volianitis eta/., 2004b). The seat post was
removed and the pedals replaced with handgrips (Monark part number 9145-71).
The ACE was raised on wooden blocks attached to a table with the blocks and
ACE subsequently bolted through the table (Figure 3.1), with the table also
bolted to an external wall. Ten-kilogram metal disks were placed on each corner
of the table to further minimise movement during exercise tests.
Figure 3.1 The adapted Monarch cycle ergometer.
Each participant was seated on a sturdy padded metal chair with the backrest
removed. To minimise movement of the chair each of the four chair legs were
bolted to a wooden board. The participant was positioned such that the centre of
their glenohumeral joint was horizontal to the centre of the crank arm on the
ACE (Sawka et al., 1983; Sawka, 1986) via a metre rule and spirit level. The39

chair height was adjusted to within ± 10 mm by a series of wooden boards and
rubber matting. Participants were instructed to find the most comfortable
horizontal distance from the ACE, but not to have their elbows locked at the
point of furthest extension (Sawka etal., 1983, Washburn and Seals, 1984, Price
and Campbell, 1997, Smith etal., 2001, Miller etal., 2004). During the warm-
up, participants were able to adjust their position from the ACE as required. To
increase inter-test reliability the chair position was noted and kept the same for
all tests (Leicht and Spinks, 2007; Miller et at., 2004). Participants were
instructed to keep their feet shoulder width apart with their knees at 90° to the
floor and not to move their feet during each exercise test.
3.2.1 Arm crank ergometer calibration
The Monark cycle ergometer was checked as per the manufacturer's guidelines
for calibration of the height of the weights cradle. In addition, all weights used
for determining resistance were checked. The mass of each weight disc used
and the cradle mass were each weighed three times on an electronic balance
readable to 0.01 g (Sartorius MP 8/8-1, Sartorius AG, Goettinge, Germany) and
the mode mass used to be representative of each disc.
For studies involving the Wingate Anaerobic test (studies 1 and 3), the following
calibration procedure was undertaken. Each morning (9:00 a.m.) and afternoon
(14:00 p.m.) the ACE was calibrated using Cranlea, Wingate software version
4.00 (Cranlea & Company, Birmingham, UK). The calibration involved
accelerating the flywheel against a series of resistances (0.5 to 2.5 kg) in 0.5 kg
increments. At each stage cranking stopped when 135 rev-min'1 was achieved
and flywheel deceleration was measured to provide a value of the moment of
inertia and friction torque for the ACE (Lakomy, 1986). The calibration was
accepted if the calibration regression coefficient was greater than 0.9900, the
moment of inertia (MI; reluctance of an object to rotate) was between 0.96 -
1.06 kg-m2 and friction torque (FT; resistance in the bearings and chainset) was
between was between 0.2-0.4 N.m (Wingate Power Test, Cranlea and Company,
UK). If the ACE did not calibrate to the required standard then it was re-
calibrated.
3.3 Exercise protocols
3.3.1 Wingate Anaerobic test
The Wingate Anaerobic test (WAnT) was used in studies 1 and 3. After resting
heart rate was recorded participants completed a 5 minute warm-up at 60
rev-min"1 (Winter and MacLaren, 2001) on the unloaded ergometer. After 2
minutes and a count of 3, 2, 1 the resistive load (4% of body mass; Smith and
Price, 2007) was released automatically via a manual trigger, with participants
maintaining 60 rev min'1 (Winter and MacLaren, 2001). On the command of "Go"
participants were instructed to crank as hard and as fast as they could. After 3-4
s the ACE was unloaded and the flywheel allowed to decelerate and participants
were instructed to continue arm cranking at 60 rev-min'1. This process was
repeated at the start of the third and fourth minutes. Following the third practice
sprint the ACE was unloaded and participants continued to crank until the 5
minute warm-up was complete. After completing the warm-up participants
continued to crank at 60 rev-min'1 on the unloaded ACE and then advised the
experimenter when they were ready to start the full 30 s duration WAnT. The
same instructions and procedures were given as for the practice sprints. During
the 30 s test, all participants were given strong verbal encouragement and an
indication of time elapsed (every 10 s). After the test the resistive load was
removed and participants was instructed to continue arm cranking at 60 rev-min'
1 on the unloaded ergometer for at least 5 minutes in order to prevent venous
pooling (Weber et al., 2006).
NB: to avoid any conflict between the verbal instruction to stop the test, and to
ensure participants had not reduced their maximal effort in anticipation of the
end of the test, the last second of WAnT data was omitted from the analysis.
3.3.1.1 Software comparison
Two commercially available software programmes were available to record WAnT
data from a Monark ergometer; Cranlea Wingate (v.4.00; Cranlea & Company,
Birmingham, UK) and Monark Wingate (v.2.20; Monark, Varberg, Sweden). Both
the Cranlea software (Baker et al., 2001a, Balmer et al., 2004, Baker et al.,
2001b, Franklin et al., 2008) and the Monark software (Zagatto et al., 2008,
Dupont et al., 2007, Rana, 2006) have been used for a number of published
research studies. As both programmes could be run simultaneously and no
previous comparison of the merits and differences between the two systems
41
have been reported, both systems were trialled during pilot testing to inform the
selection of software for the main studies in the thesis. Therefore, this study is
presented as part of the methods chapter.
3.3.1.ii Software comparison participants
Twenty participants (Table 3.1), completed a total of 58 Wingate ACE tests. As a
compromise between recommended resistive loads for males and females (Smith
and Price, 2007) for all participants, resistance was set at 4% of body mass
(BM). Participants undertook a range of team and individual sports at
competitive or recreational level. None were specifically upper body trained or
involved in predominantly upper body sports. Male and female participants were
recruited to compare as wide a range of power outputs a possible.
Table 3.1 Participants' characteristics (mean ± SD).
Male Female Whole group
n 11 9 20
Age (y) 26.1 (9.2) 22.2 (3.7) 24.4 (7.4)
Mass(kg) 87.0 (18.3) 67.9 (16.8) 78.4 (19.7)
Height (m) 1.78 (0.05) 1.65 (0.05) 1.73 (.09)
3.3.l.iii Software and data
The Monark Wingate programme records from a single sensor located within the
crank of the flywheel whereas the Cranlea Wingate programme records from a
strip, consisting of black and white bars along its length, applied to the perimeter
of the flywheel (Figure 3.1). As the flywheel rotates, the Cranlea data logger
records the interruption in signal between the black and white strips enabling
flywheel velocity to be calculated, with the data logger operating at 18 Hz. When
calibrating for moment of inertia and friction torque the Monark programme
assumes a standard moment of inertia value (0.91), while the Cranlea
programme requires a calibration sequence in order for these figures to be
determined (section 3.2.i). The Monark software records peak power output
based on one revolution of the flywheel and peak power output as a mean of
data recorded per second. Following data collection, in order to provide a
comparison against the Monark software Cranlea peak power output was
averaged per 0.5 s and 1 s. It is possible to extract data from both systems for
further analysis. Raw data from the Monark can be downloaded but the current
42

version (v.2.2) does not provide data for the full duration of the test. Therefore,
only 24 s was available for comparison between software packages. However,
this would not affect analysis of the peak values recorded and as th is is past 20 s
where there is a rapid decrease in power output it is un likely to substantia lly
affect the fatigue index (Chtourou et at., 2011). An overview of the data
collections and analysis system s is shown in Table 3.2.
Table 3.2 An overview of the Cranlea and Monark data collections and analysis
systems.
Monark Cranlea
Single sensor within the flywheel
No calibration required
Assum es MI and friction torque (FT)
Black and white strip on flywheel
Rundown calibration required
MI and FT calculated from calibration
Power recorded per revolution and per 18 Hz sampling
second (Is; mean)
Automatic and manual cage drop Manual cage drop
Both software system s produce values for corrected and uncorrected power
outputs for the WAnT. Uncorrected data does not take into account the energy
required to overcome the inertia of the flywheel and power is calculated as the
load applied multiplied by cadence (rev-m in 1). Corrected power output accounts
for the inertia of the flywheel, including friction, and the necessary power needed
to overcome the inertia. The following performance variab les (all corrected PO) were analysed:
peak power output 1 s
peak power output 0.5 s
peak power output 5 s
mean power output over 24 s
cadence (re v -m in 1) at peak power output (1 s)
mean cadence (rev-m in )
time to peak power output (1 s)
end power (1 s mean at 24 s)
fatigue index (FI; [PPO I s - m inimum power output Is] / PPO 1 s)
43
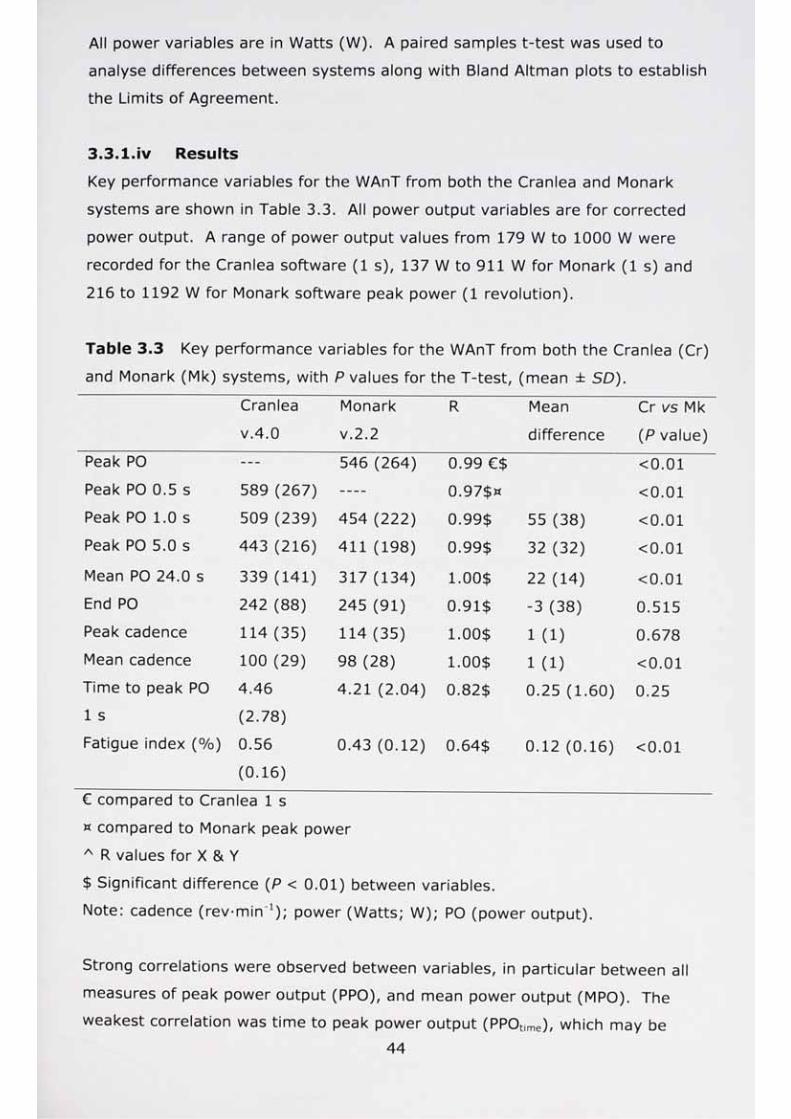
All power variables are in Watts (W). A paired samples t-test was used to
analyse differences between system s along with Bland Altman plots to establish
the Lim its of Agreement.
3.3.1.iv Results
Key performance variables for the WAnT from both the Cranlea and Monark
system s are shown in Table 3.3. All power output variab les are for corrected
power output. A range of power output values from 179 W to 1000 W were
recorded for the Cranlea software (1 s), 137 W to 911 W for Monark (1 s) and
216 to 1192 W for Monark software peak power (1 revolution).
Table 3.3 Key performance variab les for the WAnT from both the Cranlea (Cr)
and Monark (Mk) systems, with P values for the T-test, (mean ± SD).
Cranlea
v.4.0
Monark
M .2.2
R Mean
difference
Cr vs Mk
(P value)Peak PO — 546 (264) 0.99 €$ <0.01Peak PO 0.5 s 589 (267 ) — 0.97$« <0.01Peak PO 1.0 s 509 (239) 454 (222) 0.99$ 5 5 (3 8 ) <0.01Peak PO 5.0 s 443 (216) 411 (198) 0.99$ 32 (32) <0.01
Mean PO 24.0 s 339 (141) 317 (134) 1.00$ 22 (14) <0.01End PO 242 (88) 245 (91) 0.91$ -3 (38) 0.515Peak cadence 114 (35) 114 (35) 1.00$ 1 (1) 0.678Mean cadence 100 (29) 98 (28) 1.00$ 1 (1) <0.01Time to peak PO 4.46 4 .21 (2 .04 ) 0.82$ 0.25 (1.60) 0.251 s (2.78)
Fatigue index (%) 0.56 0.43 (0.12) 0.64$ 0.12 (0.16) <0.01(0.16)
€ compared to Cranlea 1 s
h compared to Monark peak power
A R values for X & Y
$ Significant difference (P < 0.01) between variables.
Note: cadence (rev-min *); power (Watts; W); PO (power output)
Strong correlations were observed between variables, in particu lar between a
measures of peak power output (PPO), and mean power output (MPO). The
weakest correlation was time to peak power output (PPOtime), which may be44

expected given the data recording methods of both system s. However, mean
values were sim ilar. Bland and Altman plots show the closest agreem ent
between Monark (peak) and Cranlea (1 s and 0.5 s) PPO (Figure 3.3 and 3.2,
respectively). As PPO output increased there was a tendency for the d isparity of
measurements to increase (heteroscadasticity). Peak power output values for
Cranlea (1 s) vs Monark (1 s), Cranlea (1 s) vs Monark (peak) and Cranlea (0.5
s) vs Monark (peak), were all sign ificantly different (P < 0.01).400
u300
200
-100
-200200 300 400 500 600 700 800 900 1000 1100 1200
Mean peak power (W) output Monark (peak) and Cranlea (0.5 s)
Figure 3.2 Bland and Altman plot with 95% lim its of agreem ent (dashed lines)
for peak power output between the two m easurem ent devices.
</>100
-100♦ ♦
-150 J
-200
-250200 400 600 800 1000 1200
Mean peak power (W) Cranlea (1 s) and Monark (peak)
Figure 3.3 Bland and Altman plot with 95% lim its of agreement (dashed lines)
for peak power output between the two m easurem ent devices.
45
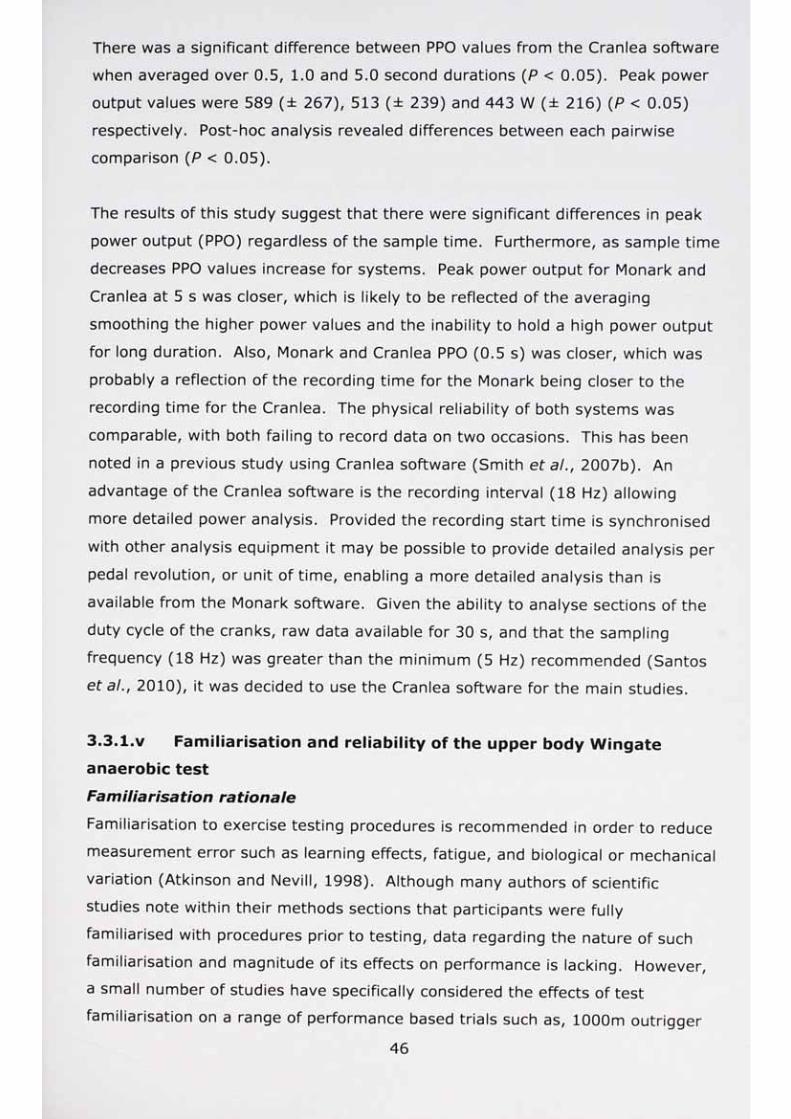
There was a significant difference between PPO values from the Cranlea software
when averaged over 0.5, 1.0 and 5.0 second durations (P < 0.05). Peak power
output values were 589 (± 267), 513 (± 239) and 443 W (± 216) (P < 0.05)
respectively. Post-hoc analysis revealed differences between each pairw ise
comparison (P < 0.05).
The results of this study suggest that there were significant d ifferences in peak
power output (PPO) regardless of the sample time. Furthermore, as sample time
decreases PPO values increase for system s. Peak power output for Monark and
Cranlea at 5 s was closer, which is likely to be reflected of the averaging
smoothing the higher power values and the inability to hold a high power output
for long duration. Also, Monark and Cranlea PPO (0.5 s) was closer, which was
probably a reflection of the recording time for the Monark being closer to the
recording tim e for the Cranlea. The physical re liab ility of both system s was
comparable, with both failing to record data on two occasions. This has been
noted in a previous study using Cranlea software (Sm ith e ta /., 2007b). An
advantage of the Cranlea software is the recording interval (18 Hz) allowing
more detailed power analysis. Provided the recording start tim e is synchronised
with other analysis equipm ent it may be possible to provide detailed ana lysis per
pedal revolution, or unit of time, enabling a more detailed analysis than is
available from the Monark software. G iven the ab ility to analyse sections of the
duty cycle of the cranks, raw data available for 30 s, and that the sampling
frequency (18 Hz) was greater than the m inimum (5 Hz) recommended (Santos
et a/., 2010), it was decided to use the Cranlea software for the main studies.
3.3.l .v Fam iliarisation and reliability of the upper body W ingate
anaerobic test
Familiarisation rationale
Fam iliarisation to exercise testing procedures is recommended in order to reduce
measurement error such as learning effects, fatigue, and biological or mechanical
variation (Atkinson and Nevill, 1998). A lthough many authors of scientific
studies note within the ir methods sections that participants were fully
fam iliarised with procedures prior to testing, data regarding the nature of such
fam iliarisation and magnitude of its effects on performance is lacking. However,
a small number of studies have specifically considered the effects of test
fam iliarisation on a range of performance based tria ls such as, 1000m outrigger

canoeing (Sealey et al., 2010) and 2000m cycling tim e tria ls (Corbett, 2009),
prolonged exercise with a sprint or performance based com ponent (Tyler and
Sunderland, 2008, Marino e f a/., 2002) and repeated sprint tests (McGaw ley and
Bishop, 2006, Spencer et a!., 2006). These studies have generally reported
im provem ents in performance after three (Tyler and Sunderland, 2008, Marino et
at., 2002) or four tria ls (Sealey et al., 2010) with accom panying im provem ents in
the coefficient of variation for each performance trial (Marino et al., 2002,
Spencer et al., 2006). Where studies have exam ined self-paced tim e trial
performance, significant changes in pacing strategy across tria ls have been
observed with fam iliarisation (Tyler and Sunderland, 2008, Corbett, 2009). It is
important to note that changes in pacing strategy were also noted when
im provem ents in performance were not observed but were accompanied by
changes in the pattern of energy expenditure.
Although the above studies have provided useful information regarding
fam iliarisation, these relate predom inantly to se lf paced tria ls (Tyler and
Sunderland, 2008, Corbett, 2009), perform ance follow ing a long duration
exercise pre-load (Marino e ta /., 2002), sprin t performance with one hour of
submaximal exercise (Marino et al., 2002) or sprints protocols (McGaw ley &
Bishop, 2006; Schabort et al., 1999, Hopker e ta /., 2009). A lthough the WAnT
has been demonstrated to be a valid and reliable test for assessing power output
in both leg (Vandewalle et al., 1987, Inbar et al., 1996, Bar-Or, 1987) and arm
ergometry (Jacobs et al., 2003, Jacobs et al., 2005, Sm ith et al., 2007b) no
studies have reported the fam iliarisation effects of conventional laboratory based
tests, such as the WAnT in upper body ergom etry. Furthermore, the m ajority of
cycle ergom etry studies have considered well tra ined partic ipants with only two
considering participants not well accustomed to laboratory procedures by
fam iliarising with repeating two and three sprint tria ls (Marino et al., 2002,
respectively, Barfield et al., 2002). Fam iliarisation may be of specific importance
for upper body exercise testing due to the uniqueness of the testing mode and
where not specifically trained participants are often exam ined (Sm ith et at.,
2007b, Kounalakis et at., 2009, Nindl et at., 1995). Therefore, the aim of this
study was to determ ine the effects of fam iliarisation on performance and
reliability of the WAnT for the upper body.
47

Familiarisation method
Following institutional ethical approval, 17 students with no previous arm crank
ergometry experience volunteered to participate. Participants were either
moderately active (recreational walking, cycling) or were involved in team sports
(e.g. rugby, football) and/or undertook resistance exercise at least 2 days a
week. Participants were instructed not to undertake any new train ing activ ities
and/or high intensity exercise 24 h prior to testing. Participant details are shown
in Table 3.4. This population, male and female, elicited a range of power output
values reported in the literature for WAnT of the upper body (Inbar et at., 1996).
All participants provided written informed consent and completed a health
screening questionnaire prior to each exercise session. The Un iversity 's Post
Graduate Research Ethics Com m ittee approved all studies.
The ergom eter was set-up as reported in section 3.2, with participants receiving
the same test instructions as reported in section 3.3.1. Participants completed
three WAnTs (T l, T2, and T3) with a m inimum of 48 hours rest between each
test. Corrected and uncorrected peak power output (PPO; over 1 s duration) and
mean power output (MPO; over 24 s duration was recorded, as described in
section 3 .3 .1 .iii) were recorded using Cranlea UK W ingate software (version 4.0).
Peak cadence and PPOtime values were also recorded.
Table 3.4 Participants' characteristics (mean ± SD).
Male Female Whole groupn 10 7 17Age (y) 25.0 (9.0) 23.1 (3.7) 24.2 (7.1)M ass(kg ) 87.9 (19.0) 71.7 (17.0) 81.2 (19.5)Height (m) 1.80 (0.04) 1.66 (0.05) 1.74 (0.08)
Group means were compared using a repeated measures analysis of variance
(SPSS v. 17.0) with Bonferroni correction and all other statistics were calculated
using M icrosoft Excel 2003. For re liab ility analysis, the intra-class correlation
(IC), coefficient of variation (CV) and B land-Altman Lim its of agreem ent (LoA)
and bias were calculated from tria ls T2 and T3.
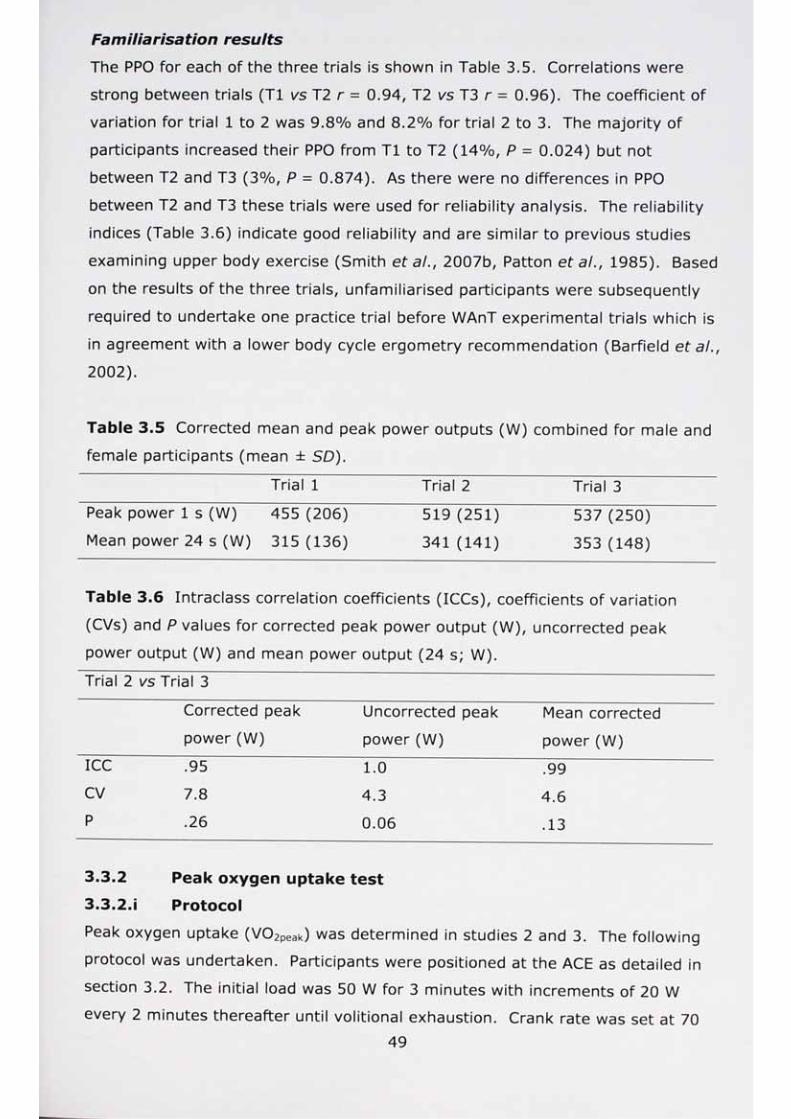
Familiarisation results
The PPO for each of the three tria ls is shown in Table 3.5. Corre lations were
strong between tria ls (T1 vs T2 r - 0.94, T2 vs T3 r - 0.96). The coefficient of
variation for trial 1 to 2 was 9.8% and 8.2% for trial 2 to 3. The m ajority of
participants increased their PPO from T1 to T2 (14%, P = 0.024) but not
between T2 and T3 (3%, P - 0.874). As there were no differences in PPO
between T2 and T3 these tria ls were used for re liab ility analysis. The re liab ility
indices (Table 3.6) indicate good re liab ility and are sim ilar to previous studies
exam ining upper body exercise (Sm ith et al., 2007b, Patton et al., 1985). Based
on the results of the three tria ls, unfam iliarised participants were subsequently
required to undertake one practice trial before WAnT experim ental tria ls which is
in agreem ent with a lower body cycle ergom etry recom m endation (Barfield et al.,
2002 ) .
Table 3.5 Corrected mean and peak power outputs (W) combined for male and
female participants (mean ± SD).
Trial 1 Trial 2 Trial 3
Peak power 1 s (W) 455 (206) 519 (251) 537 (250)Mean power 24 s (W) 315 (136) 341 (141) 353 (148)
Table 3.6 Intraclass correlation coefficients (ICCs), coefficients of variation
(CVs) and P values for corrected peak power output (W), uncorrected peak
power output (W) and mean power output (24 s; W).
Trial 2 vs Trial 3
Corrected peak Uncorrected peak Mean correctedpower (W) power (W) power (W)
ICC 795 T o ^99CV 7.8 4.3 4.6P .26 0.06 .13
3.3.2 Peak oxygen uptake test
3.3.2.i Protocol
Peak oxygen uptake (V 0 2peak) was determ ined in studies 2 and 3. The following
protocol was undertaken. Participants were positioned at the ACE as detailed in
section 3.2. The initial load was 50 W for 3 m inutes with increments of 20 W
every 2 m inutes thereafter until volitional exhaustion. Crank rate was set at 7049

rev-m in '1 (Sm ith etal., 2001, Price and Campbell, 1997, Price e ta /., 2007,
Sawka e ta /., 1983). Volitional exhaustion was judged to have occurred when
the crank rate dropped below 65 rev-m in '1 for 5 s (Sm ith and Price, 2007). Peak
oxygen uptake was taken as the highest recorded oxygen consumption (l-m in '1)
over a 15 s average during the test.
Participants had visual feedback for cadence on the Monark ergom eter display,
and were given verbal feedback when the ir cadence deviated from 70 rev-m in"1.
Participants were instructed to reach 70 rev-m in '1 as qu ickly as possible and
maintain this cadence for as long as possible. Additional pacing from a digital
metronome (DM-11, Seiko UK., Ltd., Berks, UK) provided audio feedback
(Bressel and Heise, 2004; H intzy e ta /., 2008; Kang e ta /., 1998). Participants
indicated the ir rating of perceived exertion (RPE) using the Borg 's 6-20 scale
(Borg, 1998a) in the last 20 s of each incremental stage. Participants firstly
indicated RPE for local fatigue (RPEL; arms) and secondly RPE for
card iorespiratory exertion (R P E c r) (Kang e ta /., 1998; Sm ith e ta /., 2006).
Participants were given verbal encouragem ent throughout all tests (Moffatt et a/.,
1994). After term ination of the test, participants were asked for the ir RPEL and
R PEcr fatigue. Participants then completed a 5 m inutes warm -down on the
unloaded ergom eter at a self-selected cadence, typ ica lly 50 -70 re v -m in 1.
Peak oxygen uptake was considered to have been reached if two of the following
criteria were met: a resp iratory exchange ratio (RER) > 1.1 (Muraki et at., 2004,
Marais et at., 1999), RPEL > 18 (Muraki et at., 2004) and volitional exhaustion
(Warren e ta /., 1990, Yasuda et at., 2006, Yasuda, 2008).
In order to calculate the peak m inute power (PMP) the fraction of tim e spent at
the final two exercise stages was calculated (A lbertus-Kajee et at., 2010). For example:
Test ended 11 min 30 s
Completed all (2 min) of previous stage at 130 W.
Completed 30 s of next stage.
30 s / 120 s = 0.25 x 100 = 25% of next stage completed.
25% of 20 W (the increase in W from completed stage) = 5 W
Peak m inute power is 130 W + 5 W = 135 W
50

3.3.2.H Reliability and familiarisation to the V 0 2peak test
In order to determine the reliability of the V02peak test 21 participants (Table 3.7) volunteered to undertake repeated V02peak tests. All tests were completed as
section 3.4.3.
Table 3.7 Participants' characteristics (n = 21) for the reliability and
familiarisation of the V02peak test (mean ± SD).
Age(y) Mass (kg) Height (m)
23.7 (8.1) 79.6 (15.7) 1.77 (0.07)
3.3.2.iii Results
The cardio-respiratory responses at volitional exhaustion are presented in table
3.3.8.
Table 3.8 Cardio-respiratory variables for trial 1 and trial 2 at volitional
exhaustion (mean ± SD).
Trial 1 Trial 2
PMP (Watts) 136 (25) 141 (28)
V02peak (l-min'1) 2.33 (0.41) 2.40 (0.46)Heart rate (beats-min1) 176 (13) 176 (12)RER 1.28 (0.09) 1.28 (0.09)
Peak physiological responses were representative of those reported in the
literature for the population studied (Enders eta/., 1994, Swaine and Winter,
1999, Tarara, 1995, Schrieks et a/., 2011) and 0.5 l-min1 less than reported in a
non-specifically trained population (Price et al., 2007). Previous studies have
determined the reliability of peak oxygen consumption at 50 rev-min'1 (Bar-Or
and Zwiren, 1975) and 60 rev-min'1 (Price and Campbell, 1997). Reliability of
peak oxygen consumption during ACE has not been reported at 70 rev-min'1
therefore each participant completed two V02peak trials (Table 3.8). Although the
PMP was significantly different from test 1 to 2 (P = 0.006; Table 3.9) the
increase in power (5 W) is well within the error of measurement expected (Leicht
et al., 2009). Furthermore, the limits of agreement and bias for PMP were
observed to be ~10W. The intraclass correlation of .96 for peak minute power
(Watts; PMP) is similar to reported values of .94 (Price and Campbell, 1997) and
indicated that PMP is reliably determined using this protocol.51
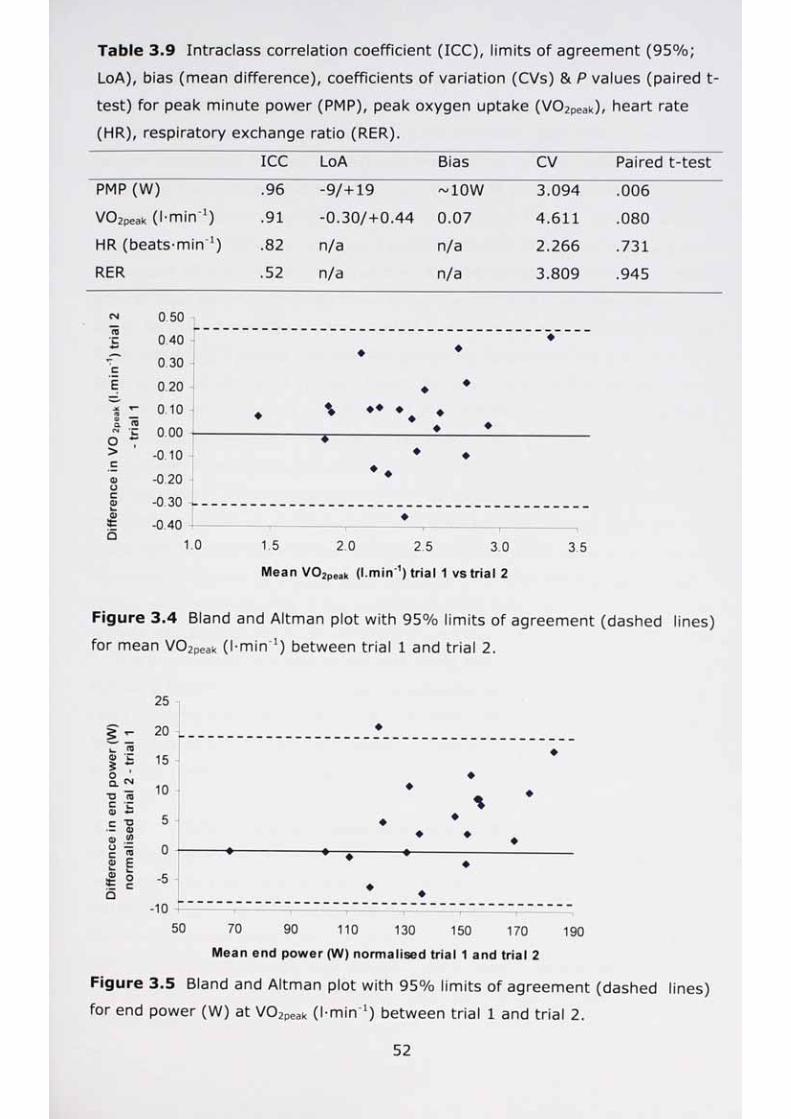
Table 3.9 Intraclass correlation coefficient (ICC), limits of agreement (95%;
LoA), bias (mean difference), coefficients of variation (CVs) & P values (paired t-
test) for peak minute power (PMP), peak oxygen uptake (V02peak), heart rate
(HR), respiratory exchange ratio (RER).
ICC LoA Bias CV Paired t-test
PMP (W) .96 -9 /+ 19 ~10W 3.094 .006V02peak (l-min ) .91 -0 .30 /+ 0 .44 0.07 4.611 .080HR (beats-min'1) .82 n/a n/a 2.266 .731RER .52 n/a n/a 3.809 .945
CN
t o
E
rea)aCNJo
<DOcQ)it■
Q
t o
0.50
0.40
0.30
0.20 -I
0.10
S o.oo --
- -
-0.30 w
-0.401.0 1.5
�� % � �T
2.0 2.5 3.0
Mean V 0 2peak (I.min'1) trial 1 vs trial 2
3 5
Figure 3.4 Bland and Altman plot with 95% limits of agreement (dashed lines)
for mean V02peak (l-min'1) between trial 1 and trial 2.
§ :03
O C
1 1*D OS CQ) ~
0)oca;it • ■■Q
*D0)0) • mmam
" t o
E
25
20
15
0
-5
-10
1---�
��
�\
�— � �
� � �• • � �
�
� �T------- r~------- ---------1-------- -------------------------—-_______________________ _* 1 1 | | f \
50 70 90 110 130 150 170 190
Mean end power (W) normalised trial 1 and trial 2
Figure 3.5 Bland and Altman plot with 95% limits of agreement (dashed lines)
for end power (W) at V02peak (l-min1) between trial 1 and trial 2.52
3.3.3 Continuous work test
Studies 2 and 3 used a range of continuous work tests to exhaustion in order to
measure time to exhaustion (T|im) and difference in physiological and
biomechanics responses at exhaustion. Each participant completed a peak
oxygen uptake test (section 3.3.2.i) with their PMP calculated (section 3.3.2.i).
All subsequent tests were completed after at least 48 hours rests and where
completed at the same time of day as the initial test ± 1 hour. In study 2 the
V02peak test was repeated. In study 3 participants only completed a V 02peak test
before and after the training programme. All subsequent tests were completed
after at least 48 hours rest and at the same time of day as the initial test ± 1
hour. In study 2 participants arm cranked to exhaustion at a work load of 80%,
90%, 100% and 110% of PMP with the workloads balanced using a 4 x 4 x 4
Latin square to allocate the order of each PMP test. In study 3 participants arm
cranked to exhaustion at a work load of 100% of PMP before and after training,
with an additional 100% PMP based on the PMP achieved following their second
V02peak test. Participants were verbally encouraged to continue each trial for as
long as possible. All participants were instructed to completed the trials,
including the warm up, at 70 rev-min-1 and trials were terminated when the
crank rate dropped below 65 rev-min-1 for 5 s (Smith and Price, 2007). The PMP
trials were preceded by a 5 min warm-up, after 2 minutes the ACE was loaded
with a mass corresponding to the participants 80% PMP (100% PMP for study 3)
for 20 s and participants were instructed to continue arm cranking at 70 rev-min
\ This process was repeated at the start of the third and fourth minutes.
Following the third load the ACE was unloaded and participants continued to
crank until the 5 minute warm-up was complete. After completing the test the
trial mass was removed and participants completed a minimum 5 minute cool
down at a freely chosen cadence.
3.3.3.i Reliability of the continuous work test to exhaustion
In order to determine the reliability of the time to exhaustion tests participants
volunteered to undertake repeated PMP resistive loads tests. Two PMP loads
(80% and 110%) were repeated. For the 80% PMP test four participants (age =
29.2 ± 10.3 years, mass = 80.5 ± 18.6 kg, height = 1.74 ± 0.07 m) and 110%
test three participants (age = 32.0 ± 12.1 years, mass = 84.8 ± 24.9 kg, height
= !-76 ± 0.07 m) completed the repeat tests. All tests were completed as section 3.3.3.
3.3.3.H Results
Time to fatigue for the 80% PMP trial was 823 s (151) vs 864 s (165) and for the
110% trial was 221 s (16) vs 233 s (43) between trial 1 and 2. With a mean
variability of 5% for both 80% and 110% is better than those found for cyclists
at 80% (17% variation) and 120% (10% variation) (McLellan et al., 1995,
Graham, 1989). Similar reliability would likely be found for time to exhaustion at
90% and 100% of peak normalised power output.
3.4 Physiological measurements
3.4.1 Body mass and Stature
Body mass (Hanson TFA-05, Hanson, Herts, UK) and stature (Holtain
stadiometer, Holtain, Dyfed, UK) were recorded on each experimental trial. For
studies involving the WAnT body mass recorded on the initial testing session was
used to calculate the resistive loading applied during all subsequent tests.
3.4.2 Heart Rate
In all studies heart rate (HR; beats-min'1) was recorded using a telemetric chest
strap and watch (Polar Accurex Plus, Polar, Electro Oy, Finland). Resting HR was
recorded while participants were seated at the ACE. Further values were
continuously recorded throughout each test and during the recovery period.
3.4.3 Expired gas analysis
Expired gas was collected via a Metalyser 3B (Cortex, Lepzig, Germany) breath-
by-breath automated system and analysed using MetaSoft v.3.9.7 software
(Cortex, Lepzig, Germany). To reduce the 'noise' generated by breath-by-breath
gas analysis outliers were removed prior to processing (Midgley eta/., 2007).
Values were first averaged for 1 s (Koppo et al., 2002) and then further
averaged using a 15 s rolling average (James eta/., 2007a). Before each test
the analyser was calibrated with room air (20.93% oxygen and 0.03% carbon
dioxide) and known reference gas mixtures (17.07% oxygen and 5.03% carbon
dioxide) certified to Beta standard (BOC Gases, Surrey, UK). The turbine flow
meter (Triple V Turbine, Cortex, Lepzig, Germany) was calibrated for volume
with a 3 litre calibration syringe (Hans Rudolph, Inc, Kansas City, MO, USA).
Barometric pressure was recorded (Fortins Barometer, F. Darton & Co. Ltd.,
London, UK) to calibrate pressure within the Metalyser 3B. The gas calibration
values were checked twice a day at 12:00 and 18:00 hours with room air and the
54

known reference gas calibrations as noted previously. After each participant
completed the first test the same size of face mask (Hans Rudolph, Kansas City,
MO) secured with a head-cap (Hans Rudolph, Kansas City, MO) and turbine (see
above) was used for all the remaining trials for that participant.
3.4.4 Ratings of perceived exertion
For studies 2 and 3 ratings of perceived exertion (RPE) using the 6-20 Borg scale
was used. On the initial laboratory visit, each participant was familiarised with
the Borg scale. Participants were instructed to indicated their rating of perceived
exertion (RPE), indicating firstly RPEL and secondly RPECr (Kang et at., 1998;
Smith et al., 2006). To ensure familiarisation was complete these instructions
were repeated on the second laboratory visit prior to testing.
3.4.5 Electromyography (EMG)
For study one, eight electrodes were available for data collection. As EMG data
for the upper limb, torso and lower limb EMG data were required only the right
hand side of the body was used for EMG data collection. Each site used is
described in Table 3.10. After analysis of results from the first study (chapter 4)
electrodes reference number 7 and 8 were omitted from studies two and three.
55

QJCO
03coCD
cn
CD
E0)uru
CD“ao
uQJCD
CLCD
cdo
EoCJ_ajLU
O
roQJ
nro
in
o
=303
T3CDLD
CD* ' E 03c _ o I • -
to
<
uc
qj
uCO
CDCJCO
COorsl03
CD
Eif)
PM
03
u
03
CDN
CO
03
CL
03U
OXCD U
rsj03CD
IdcocoCD
a5
CO
03CD
OUCO03
CDCO
ECD
CD
CDCO
COco
u03
COCDCJCQ
QJ
t03CO
03
CD■a
co
o cnjrsl
CDCOCD
03
"qjCOCOCD
CO
CDaj i=u co
CO
03
T3CDCO
CO
oCD
CO
5CD
O
to-*-» CCO o
u CD03
“O C~o03
03
“OT3 cC 0303 4->CO CO COQJ
• CLXCD
oCD
CDCJ
• «
LL_ < £3
CD
O"OcCD
03
CO00CD
03CD
tO■acCD
03
CDCDCD
LUU<
03CD
Eif)
CDCO03
03
CDCOCD
rsj O rsl03 0?
u
c03
CDN
CO
03 rsl
r 03orsi
03CD
QJCOCOCD
CO
CO
Orsj
03CD
» M M
cooCO03
CDCO
(O03
03
03<UQ -rsi
o
D
CD
CD
OCOcCD
XCD
03
03
CD
03
CJ03
CD
OCDCD
LUi
CO
03
E
CD
CD03 l .
CD « E CO
ou
CO CL CDy co
CD
tO"DCCD
03
CD00CD
03QJrsl
Qj"CO r•q; °
CD
03
|\
03
E
CD
COCD
CD
CD(O
03U
CDCOfD
03
LDCDCD
03CD
C03E
CD00CD
QJCJ(O
ECD
CD
CD
03
CD
03 rsl03
u
03
CDN
OfN
03CD
03
CDCOCOCD
CO rsl 03 rsj
Eif)^ r
03CD
CD
CD
COCOo
oCD
CDCDCD
Orsj
03
coCJCO03
CDCO
Orsi
03CD
Eif)
CDCJ
03
E
CD
CD
Ou
coCD
03
O
03
CDE
03COCDXQJ
a<
CD
CD
<
^ O
LD o
QJCOCD
QJ T3
rsl
03QJ
13COCOCD
CO
03CD
CD
CD
COCOo
03
E
E
03
CD
rsl rsj03
U
T3
03 03
CDCOCOCD
CDN
co o rsj
CDN
03
CD
03CO
CDCDCD
rsj03CD
o3COCOCD
CO>- CDCO CD o
^ i—i o rsj
03
OCJco03
CDCO
03
QJ
O
CD
COO
O
E
03
QJ
COCD
03
O
03
CD
03
L0
co03
I M i
CLCO03
O rslCDCOCD
CD- “O
03
o3COCOCD
£D
CD
CD CD
U03
CD
O
CD
LO
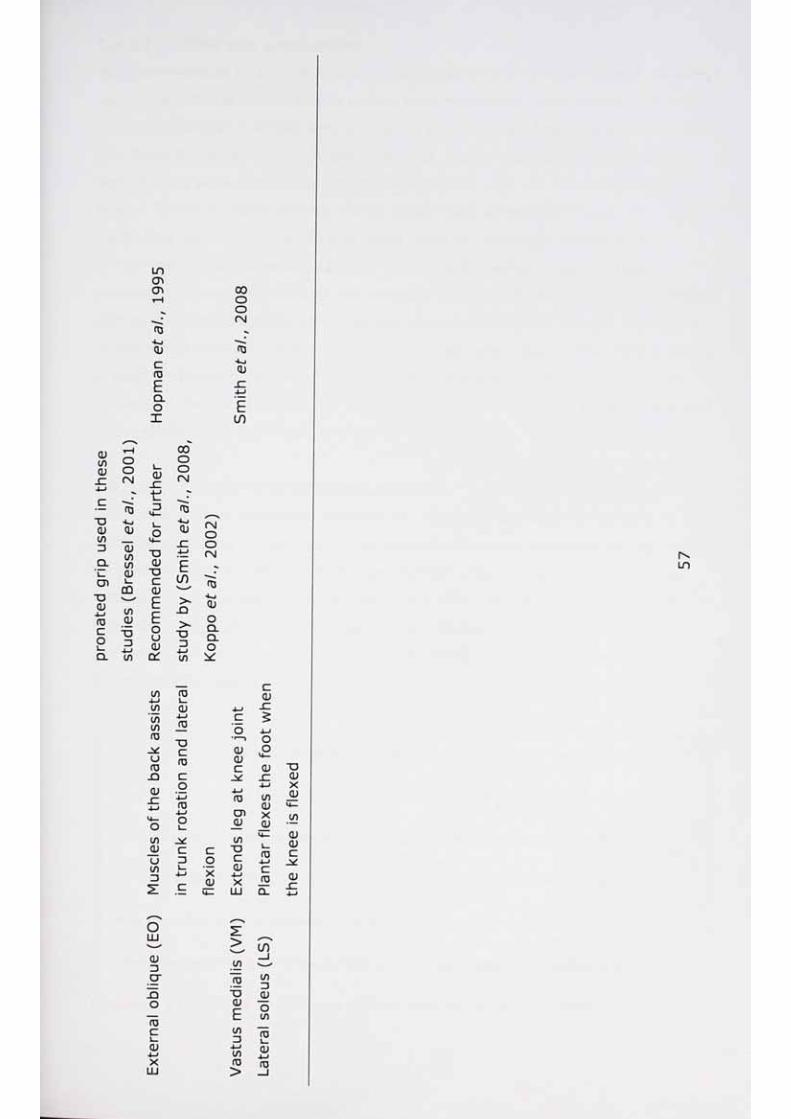
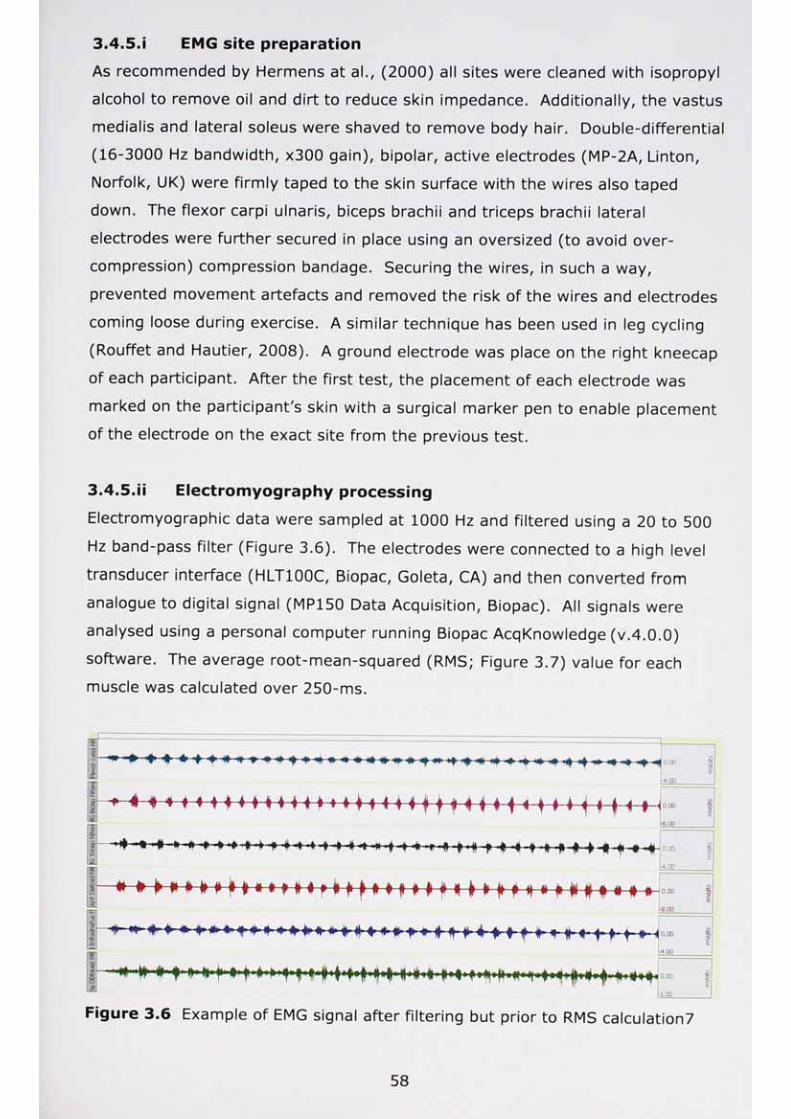
3.4.5.i EMG site preparation
As recommended by Hermens at al., (2000) all sites were cleaned with isopropyl
alcohol to remove oil and dirt to reduce skin impedance. Additionally, the vastus
medialis and lateral soleus were shaved to remove body hair. Double-differential
(16-3000 Hz bandwidth, x300 gain), bipolar, active electrodes (MP-2A, Linton,
Norfolk, UK) were firmly taped to the skin surface with the wires also taped
down. The flexor carpi ulnaris, biceps brachii and triceps brachii lateral
electrodes were further secured in place using an oversized (to avoid over-
compression) compression bandage. Securing the wires, in such a way,
prevented movement artefacts and removed the risk of the wires and electrodes
coming loose during exercise. A similar technique has been used in leg cycling
(Rouffet and Hautier, 2008). A ground electrode was place on the right kneecap
of each participant. After the first test, the placement of each electrode was
marked on the participant's skin with a surgical marker pen to enable placement
of the electrode on the exact site from the previous test.
3.4.5.ii Electromyography processing
Electromyographic data were sampled at 1000 Hz and filtered using a 20 to 500
Hz band-pass filter (Figure 3.6). The electrodes were connected to a high level
transducer interface (HLT100C, Biopac, Goleta, CA) and then converted from
analogue to digital signal (MP150 Data Acquisition, Biopac). All signals were
analysed using a personal computer running Biopac AcqKnowledge (v.4.0.0)
software. The average root-mean-squared (RMS; Figure 3.7) value for each
muscle was calculated over 250-ms.
Figure 3.6 Example of EMG signal after filtering but prior to RMS calculation?

Figure 3.7 Example of EMG signal after RMS calculation
3.4.5.iii Earthing and interference
High noise interference (50 Hz) on the EMG signal on the initial trials of study 1
indicated some interference to the signal. Further investigation suggested that
the flywheel was generating a large amount of static electricity. Two earths were
subsequently connected to the ergometer frame, which successfully removed this
noise.
3.4.5.iv Signal normalisation
Normalisation using isometric maximal voluntary contractions (isometric MVC) is
widely used within EMG studies. However, it has been suggested that isometric
MVC's cannot by applied to dynamic exercise (Clarys, 2000). Recent research on
lower limb EMG activity has indicated that isokinetic MVC's may be more
appropriate with dynamic exercise (Burden and Bartlett, 1999, Anders eta/.,
2005) if not better than isometric MVC's (Rouffet and Hautier, 2008, Albertus-
Kajee et a/., 2010). Isokinetic MVC's take into account the full range of motion
of the joint and muscle length during the activity, can be recorded during the
activity (the warm-up) assessing each muscle at the same time, reduce fatigue
that may be associated with isometric MVC's and are reliable (Hsu eta/., 2006,
Rouffet and Hautier, 2008, Albertus-Kajee et a/., 2010). Normalisation after a
prior full familiarisation may also improve neural drive and therefore reliability
across measures (Burden and Bartlett, 1999). The method of isokinetic MVC
normalisation has been used effectively during a lower limb WAnT (Rana, 2006,
Greer et a/., 2006) and during warm-up procedures during previous ACE studies
(Smith eta/., 2008, Marais eta/., 2004, Balter and Zehr, 2006).
59

Figure 3.8 Example of one of three RMS EMG 3-4 s 4% BM load sprints during
warm-up used to calculate peak normalised RMS EMG.
Signal normalisation for the Wingate anaerobic test
To enable comparison of the EMG signal within the WAnT data of study 1 and
study 3 during the warm up all participants complete three 4-5 s sprints against
a resistive load of 4% BM. The peak RMS EMG amplitude was calculated as the
peak RMS EMG amplitude achieved during the warm-up for each trial (3.8). This
peak value was then used to normalise the RMS EMG from each of the EMG
recordings for each exercise test. A 4% BM load during the warm up was chosen
to provide a sufficient stimulus for EMG normalisation and physiological response
without the fatigue that may occur with a 5% load as a too vigorous warm-up
may impair performance (Hawley et at., 1989, Bishop et a!., 2001). Keeping a
4% BM load throughout all the trials enabled a comparison in normalised RMS
EMG activity at 2%, 3%, 4% and 5% of BM. Additionally, a 4% BM load
provided a more representative range of values for the abilities of the population
being studied.
Signal normalisation for the constant load trials
Prior to the start of the continuous performance trials in studies 2 and 3 a five
minute warm up was completed with the unloaded cage (36 W) to provide a
sufficient physiological stimulus and enable a smooth loading and unloading of
the weight cage. During the warm-up at 1:30, 2:30 and 3:30 minutes a mass,
corresponding to 80% of PMP, was added for 20 s. This procedure was repeated
for all four trials within study 2 (80%, 90%, 100% and 110% PMP to exhaustion)
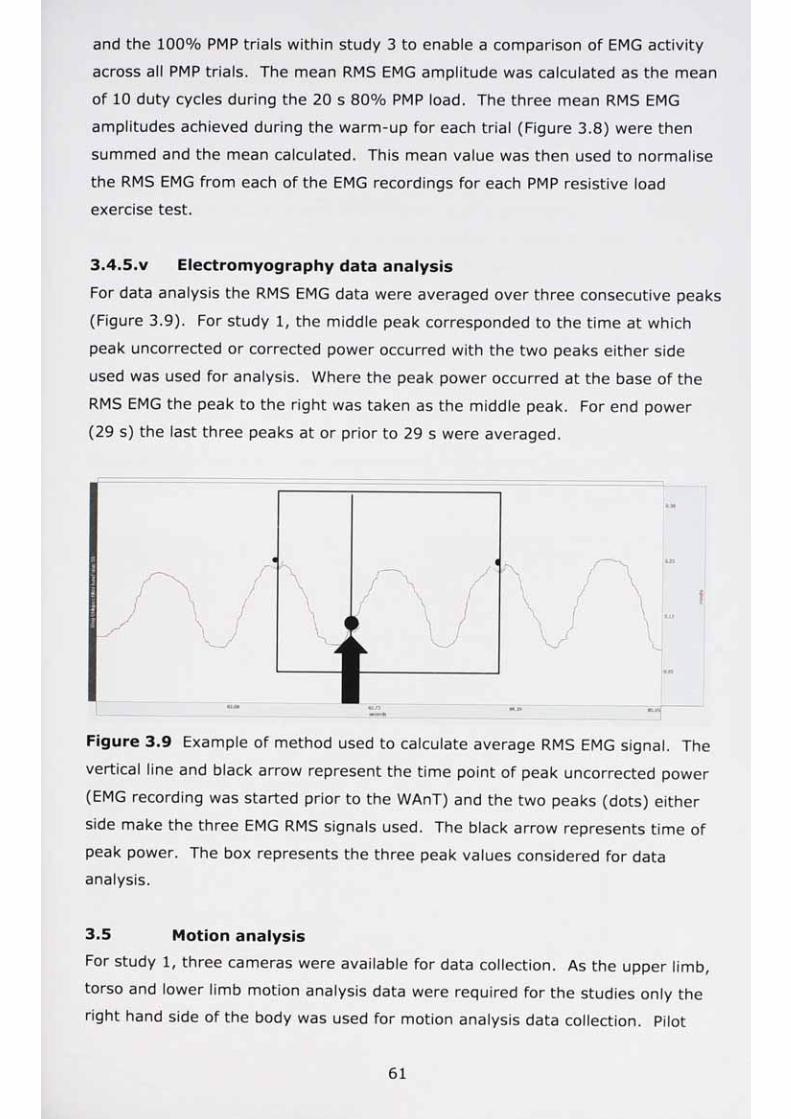
and the 100% PMP trials within study 3 to enable a comparison of EMG activity
across all PMP trials. The mean RMS EMG amplitude was calculated as the mean
of 10 duty cycles during the 20 s 80% PMP load. The three mean RMS EMG
amplitudes achieved during the warm-up for each trial (Figure 3.8) were then
summed and the mean calculated. This mean value was then used to normalise
the RMS EMG from each of the EMG recordings for each PMP resistive load
exercise test.
3.4.5.V Electromyography data analysis
For data analysis the RMS EMG data were averaged over three consecutive peaks
(Figure 3.9). For study 1, the middle peak corresponded to the time at which
peak uncorrected or corrected power occurred with the two peaks either side
used was used for analysis. Where the peak power occurred at the base of the
RMS EMG the peak to the right was taken as the middle peak. For end power
(29 s) the last three peaks at or prior to 29 s were averaged.
//
f
J\
R3.08
0-38
0.25
0.13
•0.00
3
Figure 3.9 Example of method used to calculate average RMS EMG signal. The
vertical line and black arrow represent the time point of peak uncorrected power
(EMG recording was started prior to the WAnT) and the two peaks (dots) either
side make the three EMG RMS signals used. The black arrow represents time of
peak power. The box represents the three peak values considered for data analysis.
3.5 Motion analysis
For study 1, three cameras were available for data collection. As the upper limb,
torso and lower limb motion analysis data were required for the studies only the
right hand side of the body was used for motion analysis data collection. Pilot
61

testing revealed a three camera system was unable to simultaneously record
data from left and right limbs. For studies 2 and 3, four and five cameras were
available, respectively.
For 3D recording and computer analysis (Qualisys Track Manager v.2.0.365.,
Qualisys, Gothenburg, Sweden) fourteen infrared reflective markers were placed
on appropriate anatomical landmarks (Figure 3.10 and Table 3.12) and secured
using double-sided tape. The markers were tracked by three ProReflex Motion
Analysis Cameras (Qualisys, Gothenburg, Sweden) sampled at 100 Hz and
smoothed at 100 ms moving average. After each participant had completed the
first test, the placement of each marker was marked on the participant's skin
with a surgical marker pen as for the EMG measurements. Prior to testing the
cameras were calibrated for 10 s, using a calibration frame and wand (Wandkit
750, Qualisys, Gothenburg, Sweden) enabling calibration of X (depth), Y (width)
and Z (height) axes within the field of view of the cameras. Once the calibration
had passed the calibration test, any markers in the field of view of the cameras
could be determined for relative distance.
Figure 3.10 Participant arm cranking, showing motion analysis markers, EMG
electrodes and gas analysis system.
62
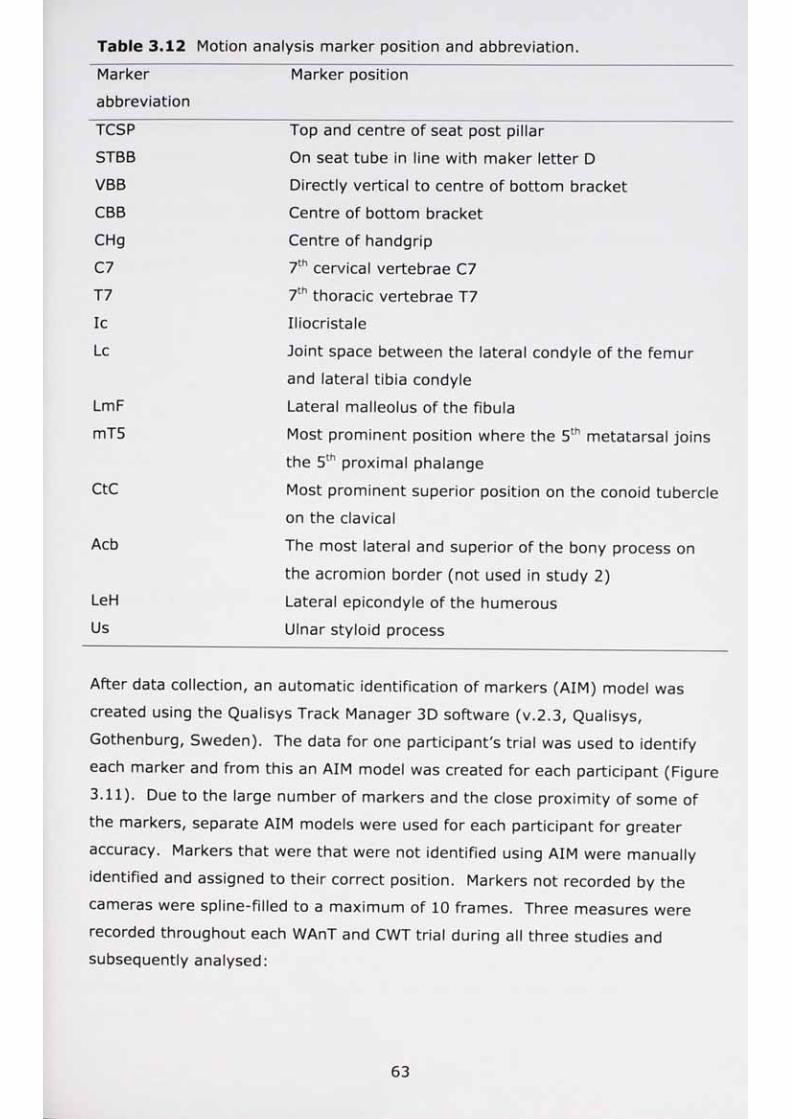
Table 3.12 Motion analysis marker position and abbreviation.
Marker
abbreviation
Marker position
TCSP Top and centre of seat post pillar
STBB On seat tube in line with maker letter D
VBB Directly vertical to centre of bottom bracket
CBB Centre of bottom bracket
CHg Centre of handgrip
C7 7th cervical vertebrae C7
T7 7th thoracic vertebrae T7
Ic Iliocristale
Lc Joint space between the lateral condyle of the femur
and lateral tibia condyle
LmF Lateral malleolus of the fibula
mT5 Most prominent position where the 5th metatarsal joins
the 5th proximal phalange
etc Most prominent superior position on the conoid tubercle
on the clavical
Acb The most lateral and superior of the bony process on
the acromion border (not used in study 2)LeH Lateral epicondyle of the humerous
Us Ulnar styloid process
After data collection, an automatic identification of markers (AIM) model was
created using the Qualisys Track Manager 3D software (v.2.3, Qualisys,
Gothenburg, Sweden). The data for one participant's trial was used to identify
each marker and from this an AIM model was created for each participant (Figure
3.11). Due to the large number of markers and the close proximity of some of
the markers, separate AIM models were used for each participant for greater
accuracy. Markers that were that were not identified using AIM were manually
identified and assigned to their correct position. Markers not recorded by the
cameras were spline-filled to a maximum of 10 frames. Three measures were
recorded throughout each WAnT and CWT trial during all three studies and
subsequently analysed:
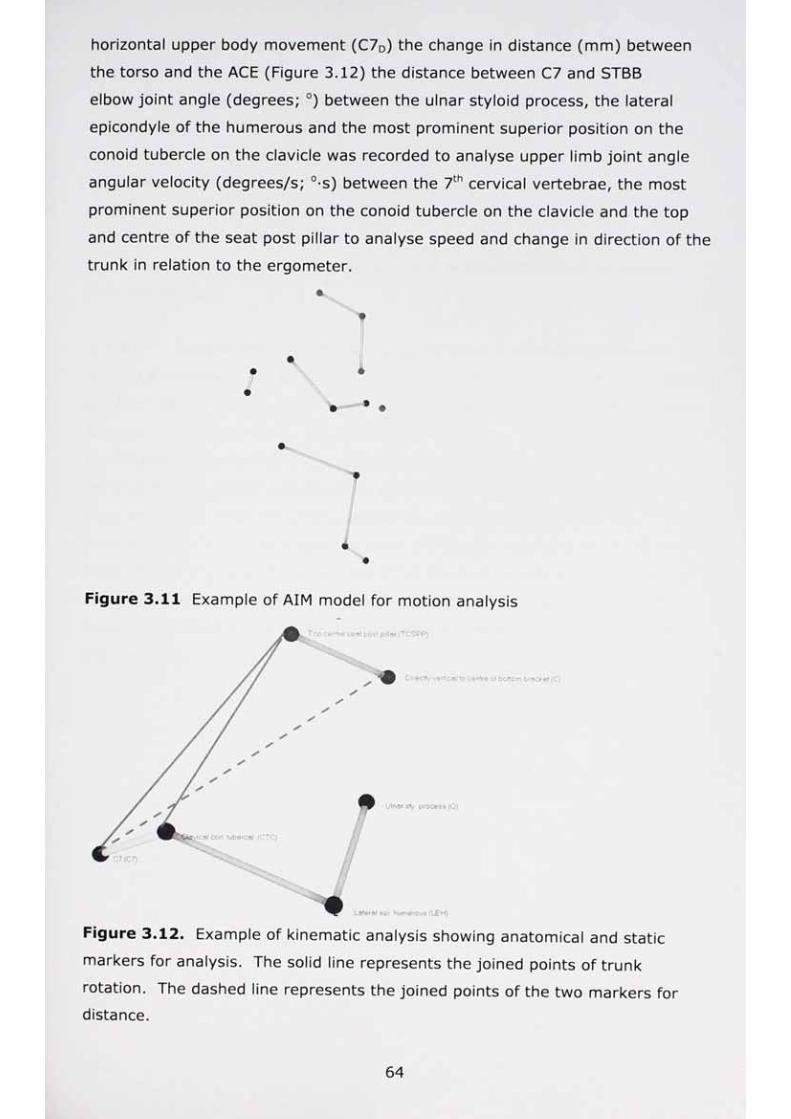
horizontal upper body movement (C7D) the change in distance (mm) between
the torso and the ACE (Figure 3.12) the distance between C7 and STBB
elbow joint angle (degrees; °) between the ulnar styloid process, the lateral
epicondyle of the humerous and the most prominent superior position on the
conoid tubercle on the clavicle was recorded to analyse upper limb joint angle
angular velocity (degrees/s; °-s) between the 7th cervical vertebrae, the most
prominent superior position on the conoid tubercle on the clavicle and the top
and centre of the seat post pillar to analyse speed and change in direction of the
trunk in relation to the ergometer.
*
Figure 3.11 Example of AIM model for motion analysis
pillar (
eitical w c e r ’/e o\ bonom bisci- el (D
* Uln& j f y process (0)
lavrre l opf humerC'Js ( lE K j
Figure 3.12. Example of kinematic analysis showing anatomical and static
markers for analysis. The solid line represents the joined points of trunk
rotation. The dashed line represents the joined points of the two markers for distance.

3.5.1 Motion analysis during normalised percent of peak minute
power
Preparation and post-test marking of anatomical sites was the same as for the
EMG analysis. The most lateral and superior of the bony process on the
acromion border was not used in all three studies as the most prominent
superior position on the conoid tubercle on the clavical was found to be more
reliable for analysis. Although an additional marker was also placed on the
centre of the ergometer to enhance analysis of trunk rotation with the 7th cervical
vertebrae (C7), this marker was too obscured by the participants to provide
accurate analysis.
3.5.2 Data analysis and calculation of joint angles and distance
All data were selected in QTM and filtered before and after calculation (11 frames
per filter window). The results were then exported to Microsoft Excel for further
analysis. For data analysis, the joint angles were averaged over three peaks in a
similar process as for the EMG analysis (Figure 3.14). The middle peak
corresponded to the time peak uncorrected or corrected power occurred and the
peak either side made the three data points. Where the peak occurred at the
base or trough of the data cycle the peak to the right was taken as the middle
peak. At the end of each trial the last three peaks at or prior to end of the test
were averaged. The angle for each of the peaks was calculated in Microsoft
Excel from the difference between the peak and minimum angle for each wave
(Figure 3.13).
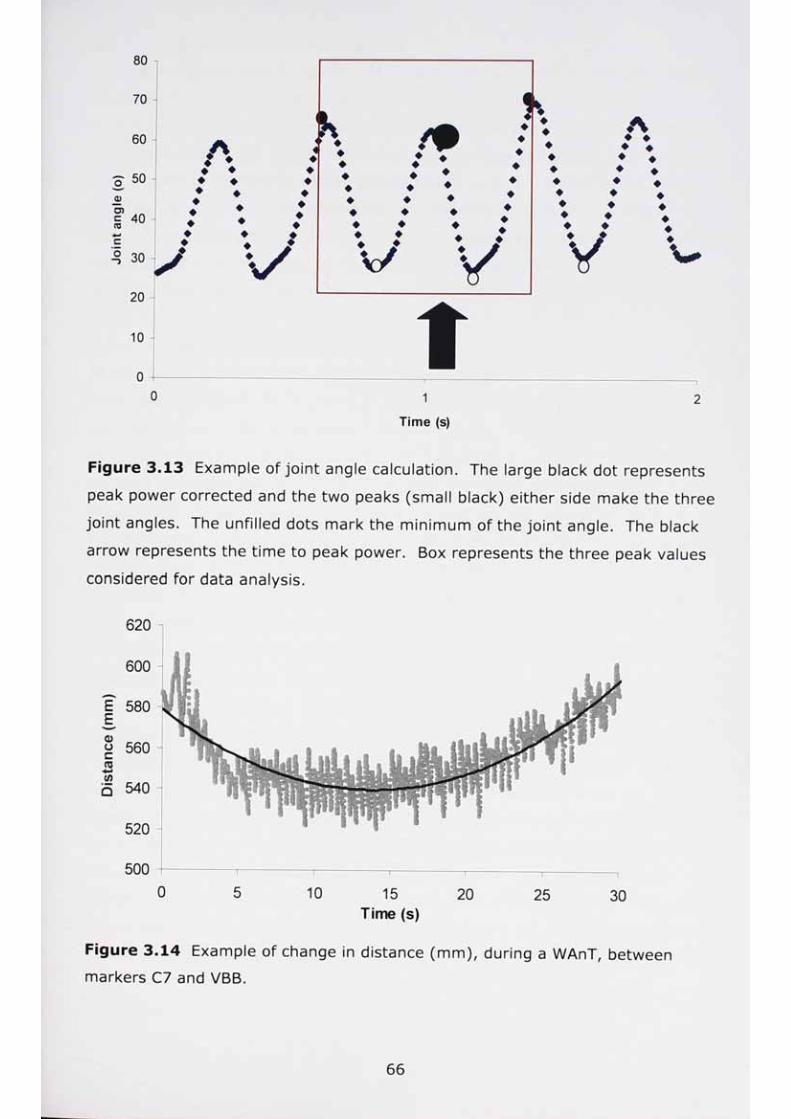
80
70
60
o,0)U)cTO
50
40 -
A�♦
�♦
♦♦�♦
���
30
20
10
00 1
Time (s)
2
Figure 3.13 Example of joint angle calculation. The large black dot represents
peak power corrected and the two peaks (small black) either side make the three
joint angles. The unfilled dots mark the minimum of the joint angle. The black
arrow represents the time to peak power. Box represents the three peak values
considered for data analysis.
0)ucro</>
620
600
E 580 E
560
a 540
520
5000 5 10 15
Time (s)20 25 30
Figure 3.14 Example of change in distance (mm), during a WAnT, between
markers C7 and VBB.
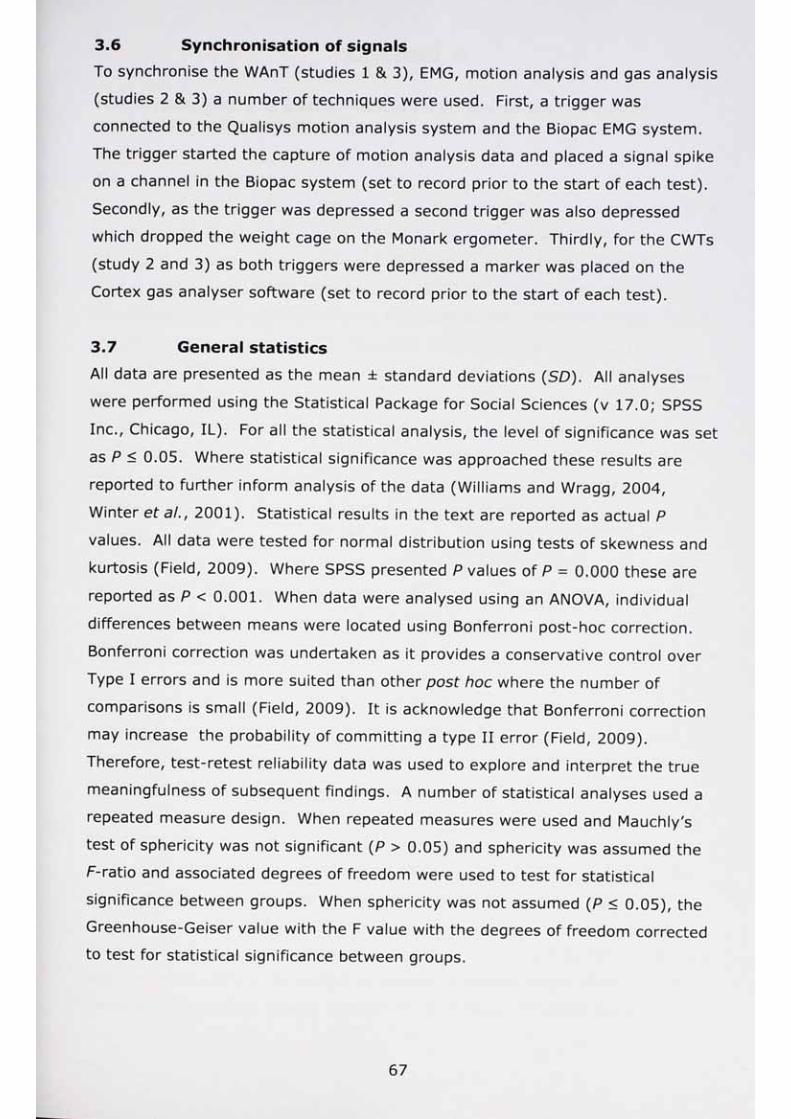
3.6 Synchronisation of signals
To synchronise the WAnT (studies 1 & 3), EMG, motion analysis and gas analysis
(studies 2 & 3) a number of techniques were used. First, a trigger was
connected to the Qualisys motion analysis system and the Biopac EMG system.
The trigger started the capture of motion analysis data and placed a signal spike
on a channel in the Biopac system (set to record prior to the start of each test).
Secondly, as the trigger was depressed a second trigger was also depressed
which dropped the weight cage on the Monark ergometer. Thirdly, for the CWTs
(study 2 and 3) as both triggers were depressed a marker was placed on the
Cortex gas analyser software (set to record prior to the start of each test).
3.7 General statistics
All data are presented as the mean ± standard deviations (SD). All analyses
were performed using the Statistical Package for Social Sciences (v 17.0; SPSS
Inc., Chicago, IL). For all the statistical analysis, the level of significance was set
as P < 0.05. Where statistical significance was approached these results are
reported to further inform analysis of the data (Williams and Wragg, 2004,
Winter et at., 2001). Statistical results in the text are reported as actual P
values. All data were tested for normal distribution using tests of skewness and
kurtosis (Field, 2009). Where SPSS presented P values of P = 0.000 these are
reported as P < 0.001. When data were analysed using an ANOVA, individual
differences between means were located using Bonferroni post-hoc correction.
Bonferroni correction was undertaken as it provides a conservative control over
Type I errors and is more suited than other post hoc where the number of
comparisons is small (Field, 2009). It is acknowledge that Bonferroni correction
may increase the probability of committing a type II error (Field, 2009).
Therefore, test-retest reliability data was used to explore and interpret the true
meaningfulness of subsequent findings. A number of statistical analyses used a
repeated measure design. When repeated measures were used and Mauchly's
test of sphericity was not significant (P > 0.05) and sphericity was assumed the
F-ratio and associated degrees of freedom were used to test for statistical
significance between groups. When sphericity was not assumed (P < 0.05), the
Greenhouse-Geiser value with the F value with the degrees of freedom corrected
to test for statistical significance between groups.
Chapter 4
The physiological and biomechanical responses to short duration, maximal intensity arm cranking
4.1 Introduction
A number of factors affecting aerobic upper body exercise such as cadence (Price
and Campbell, 1997; Sawka eta/., 1983; Smith et al., 2006b; Smith eta!.,
2001) and exercise protocol (Sawka, 1986, Smith etal., 2002b, Smith etal.,
2006a, Castro et al., 2010, Walker et al., 1986) have been thoroughly examined.
Established exercise testing protocols have subsequently been developed (Smith
and Price, 2007, Kenney, 2005). However, despite the use of arm crank
ergometry (ACE) being beneficial to exercise and health scenarios (Metter eta/.,
2004, Zwierska etal., 2005, Rosier etal., 1985a, Westhoff et al., 2008) and a
range of sports including the specific sport of hand cycling (Kounalakis et al.,
2008, Franklin, 1985, Franklin, 1989, Hawley and Williams, 1991, Mermier,
2000), little information has been reported regarding the factors affecting
anaerobic aspects of ACE. Although it is known that during aerobic ACE there is
a peripheral limitation to exercise (Loftin eta/., 1988, Muraki etal., 2004,
Sawka, 1986, Franklin, 1985) resulting in peak rather than maximal responses
(Magel et al., 1975) and localised rather than cardiorespiratory fatigue (Price et
al., 2007), much less is known regarding fatigue for anaerobic upper body
exercise.
A commonly used anaerobic test for both the upper and lower body is the
Wingate anaerobic test (WAnT). Previous studies examining upper body WAnTs
have suggested that during the WAnT, the arms work more anaerobically than
the legs (Kounalakis eta/., 2009, Lutoslawska eta/., 2003). Indeed, muscle
biopsy studies indicate a greater proportion of fast twitch to slow twitch muscle
fibres within the upper than lower body (Mygind, 1995), with data presented by
Inbar et al., (1996), Dotan and Bar-Or (1983) and Marsh (1999) indicating that
fatigue during a 30-s WAnT is greater for the upper than lower body.
Furthermore, upper body joints such as the shoulder demonstrate a greater
range of movement when compared to lower body joints such as the hip (Tortora
and Grabowski, 2003). As a result of potentially greater ranges of movement
patterns, there may be greater changes to upper body movement patterns in
order to maintain power output than expected for lower body exercise.
Although the key reasons for greater fatigue during an upper body WAnT
remains unreported, fatigue may affect movement patterns and the subsequent
biomechanics by decreasing proprioceptive sense, which increases shoulder
movement and impacts performance (Lee et al., 2003b, Taylor et at., 2000,
Carpenter et al., 1998, Voight et al., 1996). Although no studies have reported
electromyographic (EMG) responses during upper body WAnTs, near-infrared
spectroscopy studies suggest changes in muscle recruitment patterns exist
(Kounalakis et al., 2009). Changes in shoulder girdle kinematics and muscle
coordination during high intensity shoulder elevation exercise has shown fatigue,
as measured through EMG activity, in a number of muscles, especially the
infraspinatus and deltoid muscles (Ebaugh etal., 2006). Therefore, the use of
motion analysis and EMG may highlight significant changes in limb kinematics
and muscle recruitment patterns to enhance our understanding and
interpretation of power production and the effects of fatigue during upper body
exercise (Zehr and Chua, 2000).
In order to examine some of the mechanisms underlying fatigue during short
duration high intensity exercise the WAnT was used. The WAnT allows the
manipulation of power output and movement speed by using different resistive
loads. Measuring biomechanical (EMG and motion analysis) and performance
indices (power output; Watts and cadence; rev-min1) over a range of loadings
(2%, 3%, 4% and 5% of body mass; BM) will enable the study of fatigue during
a range of maximal intensity exercise conditions. By manipulating the force
production (resistive load) and potentially the rate of fatigue development, will
enable the relationship between physiology, biomechanics and WAnT
performance to be analysed and may allow a model of fatigue during upper body
WAnTs to be developed. In addition, the optimal resistive load for upper body
WAnTs has not been thoroughly examined since the original suggestion of 6%
body mass resistive load (Dotan and Bar-Or, 1983), other studies have employed
resistive loads of 4% body mass (Hubner-Wozniak et al., 2004, Weber et al.,
2006, Aschenbach etal., 2000, Biggerstaff et al., 1997) and 5% body mass (Aziz
etal., 2002, Lovell et al., 2011b, Busko, 2011, Smith etal., 2007b). Although it
is acknowledged that an optimal load cannot be achieved for all parameters in
the same test (Dotan and Bar-Or, 1983).
Therefore, the aims of this study were to examine the relationship between
upper body WAnT performance and the underlying physiological and
biomechanical factors (power output, cadence, fatigue index, EMG; amplitude,
motion analysis; trunk movement distance, elbow range of motion, trunk
rotational velocity), and to examine the optimal resistive loading for a 30 s upper
body WAnT.
4.2
4.2.1
Method
Participants
Thirteen participants (age = 21.8 ± 5.2 years, mass = 78.3 ± 9.2 kg, height =
1.77 ± 0.07 m) with no previous arm crank ergometry experience volunteered to
take part in this study. Participants did not participate or train in or for upper
body sport or exercise. Each participant was tested within ± 1 hour of the first
test with a minimum of 48 hours between tests. Participants were instructed not
to conduct new training, or any vigorous training prior to each test. All tests
were conducted in the same laboratory with the temperature at 20° ± 1°C.
The study was approved by the University's Post Graduate Research Ethics
Committee (Appendix 2).
4.2.2 Exercise protocol
After a full familiarisation session, participants completed four, seated upper
body WAnT's, conducted as reported in section 3.3.1 using Cranlea Wingate
(v.4.00; Cranlea & Company, Birmingham, UK). Resistive loads were 2%, 3%,
4% and 5% of body mass. The order of testing was balanced using a 4 x 4 x 4
Latin square to allocate the order of tests, with a minimum of 48-h between
trials. Body mass taken at the familiarisation session was used as the reference
mass for all subsequent tests. Corrected and uncorrected peak power output
(PPO; over 1 s duration) and mean power output (MPO; over 29 s duration) and
minimum power output (POmin) were recorded. Mean cadence (rev^min1), final
cadence and time to peak power output (PPOtime; 1 s) values were also recorded,
4.2.3 Electromyography
Electrodes were placed on the following sites: flexor carpi ulnaris (FCU), biceps
brachii (BB), triceps brachii lateral (TB), anterior deltoid (AD), infraspinatus (IS),
external oblique (EO), vastus medialis (VM), lateral soleus (LS). A passive
reference electrode (Blue sensor M-00-S, Ambu Ltd, Cambs, UK) was placed
70

centrally on the right patella (Section 3.4.5.i). Prior to electrode placement, all
sites were cleaned with isopropyl alcohol to remove oil and dirt. Double-
differential (16-3000Hz bandwidth, x300 gain), bipolar, active electrodes (MP-2A,
Linton, Norfolk, UK) were firmly taped to the skin surface with the wires also
taped down to reduce movement noise artefact. Electrode sites were marked on
the participants' skin with a surgical marker pen to enable reliable electrode
placements during subsequent tests, for full processing information e.g.
collection frequency, normalisation etc are described in section 3.4.5.
4.2.4 Kinematic analysis
Infrared reflective markers were attached using double-sided tape on the
following anatomical landmarks; ulnar styloid process; lateral epicondyle of the
humerous; most prominent superior position on the conoid tubercle on the
clavical and 7th cervical vertebrae (C7) (Figure 4.1). The ACE was also marked
with infrared reflective markers at the following static points; directly vertical to
centre of bottom bracket (C), and top centre of seat post pillar (A) (Figure 4.1).
For additional anatomical landmarks and ACE markers are given in Table 3.12.
After each participant's first test the placement of each marker was marked on
the participant's skin with a surgical marker pen as for the EMG measurements.
The joint angle (°) between the wrist, elbow and inner shoulder was used to
determine the elbow range of motion and is analogous to that of the knee joint in
cycling (Zehr and Chua, 2000). The distance (mm) between C7 and the static
point directly vertical to the centre of ergometer bottom bracket gave an analysis
of forwards and backwards upper body movement. Angular velocity (0-s_1)
between C7, shoulder inner and top and centre of seat post pillar, gave an
analysis of the velocity and change in direction of the trunk (trunk rotation) in
relation to the ergometer. The above variables were analysed at points
corresponding to corrected and uncorrected peak power output and at minimum
power output (29 s). A full description of each marker position is presented in
Table 3.12. The motion analysis system and EMG system data where
synchronised at the start of each test, further details are given in section 3.6.

Topcer.ve ie d oosr pillar (7 C3PP)
Oirectfy vertical *o cer^e oi bottom bt«ckei<
Uln«j sty process (0)
Lafora) epi humero-us (LHK
Figure 4.1. Example of kinematic analysis showing anatomical and static
markers for analysis. The solid line represents the joined points of trunk
rotation. The dashed line represents the joined points of the two markers for
distance.
4.2.5 Statistical analysis
The data are presented as the mean ± standard deviations (s). To aid clarity
standard deviations are plotted on line graphs for top and bottom lines as the
standard deviations were fairly equal across data sets. All analyses were
performed using Statistical Package for Social Sciences (v 17.0; SPSS Inc.,
Chicago, IL). Measures of peak power output (corrected and uncorrected), mean
power output, peak and mean cadence were analysed between resistive loadings
using separate single factor analysis of variance. The EMG activity analysed
corresponded to corrected and uncorrected PPO and POmin time points.
Therefore, EMG data was analysed over time (PPOcorrected vs PPOuncorrected
vs POmin) and between resistive loadings (2%, 3%, 4% and 5% body mass)
using a two-factor with repeated measure on both factors (power output x
loading). Each muscle was analysed separately. The kinematic variables were
analysed at the same time points and using the same statistical tests as for the
EMG data time points corresponding to the occurrence of corrected PPO,
uncorrected PPO and POmin. Where SPSS presented P values of P = 0.000 these
are reported as P < 0.001. Bonferroni post-hoc correction was undertaken when
there were multiple comparisons for data sets for, performance indices, heart
72
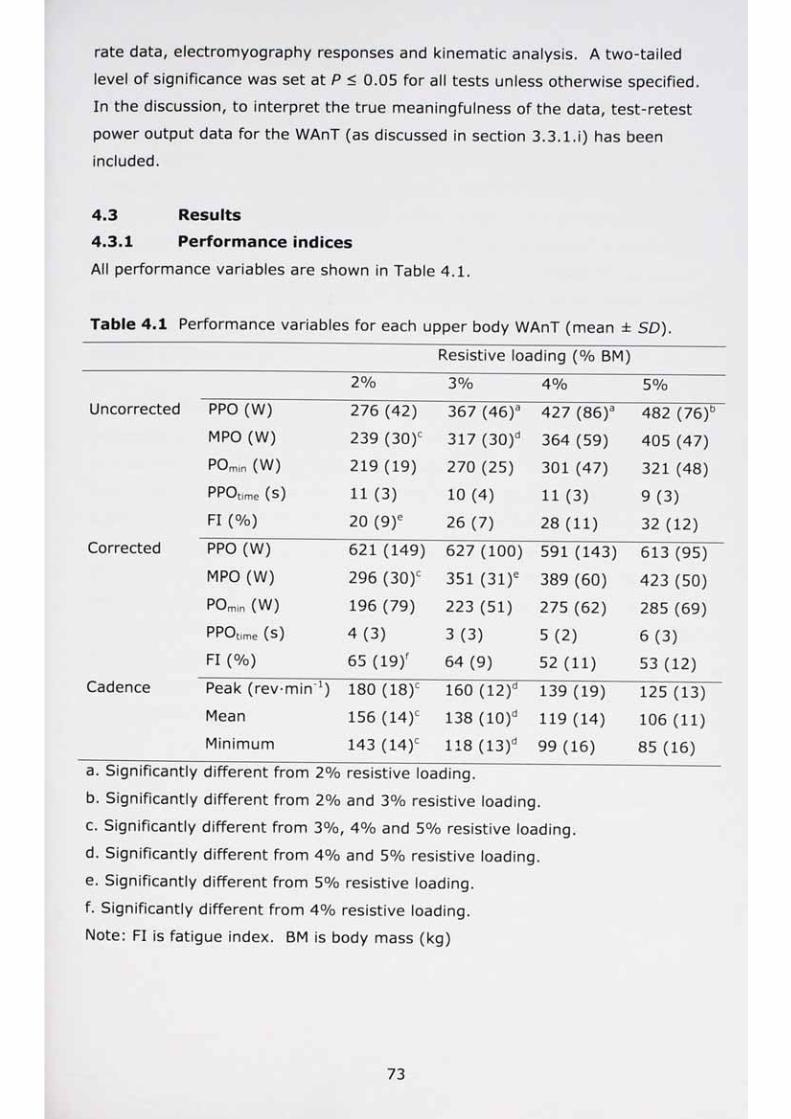
rate data, electromyography responses and kinematic analysis. A two-tailed
level of significance was set at P < 0.05 for all tests unless otherwise specified.
In the discussion, to interpret the true meaningfulness of the data, test-retest
power output data for the WAnT (as discussed in section 3.3.l.i) has been
included.
4.3 Results
4.3.1 Performance indices
All performance variables are shown in Table 4.1.
Table 4.1 Performance variables for each upper body WAnT (mean ± SD).
Resistive loading (% BM)
2% 3% 4% 5%Uncorrected PPO (W) 276 (42) 367 (46)a 427 (86)a 482 (76)
MPO (W) 239 (30)c 317 (30)d 364 (59) 405 (47)POmin (W) 219 (19) 270 (25) 301(47) 321 (48)PPOtime (s) 11 (3) 10 (4) 11 (3) 9 (3)FI (%) 20 (9)e 26 (7) 28 (11) 32 (12)
Corrected PPO (W) 621 (149) 627 (100) 591 (143) 613 (95)MPO (W) 296 (30)c 351 (31)e 389 (60) 423 (50)POmin (W) 196 (79) 223 (51) 275 (62) 285 (69)PPOtjme (s) 4(3) 3 (3) 5(2) 6 (3)FI (%) 65 (19)f 64 (9) 52 (11) 53 (12)
Cadence Peak (rev-min"1) 180 (18)c 160 (12)d 139 (19) 125 (13)Mean 156 (14)c 138 (10)d 119 (14) 106 (11)Minimum 143 (14)c 118 (13)d 99 (16) 85 (16)
a. Significantly different from 2% resistive loading.
b. Significantly different from 2% and 3% resistive loading.
c. Significantly different from 3%, 4% and 5% resistive loading.
d. Significantly different from 4% and 5% resistive loading.
e. Significantly different from 5% resistive loading.
f. Significantly different from 4% resistive loading.
Note: FI is fatigue index. BM is body mass (kg)

4.3.l.i Peak power output
Significant differences were observed between resistive loads for uncorrected
PPO (F = 23.578, P < 0.001) with mean values increasing with resistive load
(Table 4.1). Post-hoc analysis revealed that uncorrected PPO using the 5%
resistive loading was greater than for both the 2% and 3% resistive loads (P <
0.001, ES = 1.70, 1.35). Differences were also noted between the 2% and 3%
resistive loads (P = 0.005, ES =1.43) and the 2% and 4% resistive loads (P <
0.001, ES = 1.48). No differences were observed for corrected PPO although
there were variations across all four resistive loads. Mean values for corrected
PPO were 591-627 W. Therefore, this reflects the method of calculation which
accounts for the power required to accelerate the flywheel and the data
suggested that corrected peak power is independent of resistive load.
4.3.1.ii Mean Power Output
Uncorrected MPO demonstrated a significant difference between resistive loads
{F = 35.490, P < 0.001; Table 4.1) with values increasing with each resistive
load. There was a significant difference between 2% vs 3%, 4% and 5% (P = <
0.001) and 3% vs both 4% and 5% (P = 0.048 and P < 0.001, respectively).
Significant differences between resistive loads were also observed for corrected
MPO (F = 19.607, P < 0.001; Table 4.1) with values increasing with each
resistive load (P < 0.05). Significant differences were observed between 2% and
3%, 4% and 5% (P = 0.017, P < 0.001, P < 0.001, respectively) and between
3% vs 5% (P = 0.001). Therefore, this reflects the method of calculation for
corrected power whereby deceleration from corrected PPO results in a greater
loss of power for a lighter than heavier resistive load.
4.3.1.iii Time to peak power output
Although time to peak power output for uncorrected and corrected data were
different (F = 81.378, P < 0.001, ES = 1.32) values were not significantly
different between resistive loads (P > 0.05). Mean values for corrected and
uncorrected time to PPO were approximately 4-5 s and 10 s, respectively (P <
0.001). Therefore, time to peak power is not dependent on load but time to PPO
is dependent on whether corrected or uncorrected power data is used.
74

4.3.1.iv Cadence
There was a significant difference in the peak cadence achieved between
resistive loads (F = 29.927, P < 0.001; Table 4.1). As resistance increased,
peak cadence decreased with significant differences observed between the 2% vs
3%, 4% and 5% (P = 0.011, P < 0.001, P < 0.001, respectively) and 3% vs
both 4% and 5% resistive loadings (P = 0.009, P < 0.001, respectively).
Similarly to peak cadence, there was a significant difference in mean cadence
across resistive loads (F = 41.124, P < 0.001). As resistive load increased mean
cadence decreased (Table 4.1) with significant differences observed between 2%
vs 3%, 4% and 5% (P = 0.004, P < 0.001, P < 0.001, respectively) and 3% vs
both 4% and 5% (P = 0.001, P < 0.001, respectively). There was a significant
difference in minimum cadence across resistive loads (F = 38.966, P < 0.001).
As resistive loads increased minimum cadence decreased (Table 4.1) with
significant differences between 2% and 3%, 4% and 5% (P < 0.001) and 3% vs
4% and 5% (P = 0.008, P < 0.001, respectively). The absolute decrease in
cadence (~40 rev-min'1) was similar for each resistive load (Table 4.1).
Therefore, as resistive load increases all measures of cadence at that load
decrease.
4.3.l.v Fatigue Index
There was a significant difference in the fatigue index for uncorrected PPO (F =
4.068, P < 0.022; Table 4.1). As resistance increased fatigue index increased
with significant differences observed between 2% vs 5% (P = 0.016). There was
a significant difference in fatigue index for corrected PPO (F = 4.068, P = 0.012;
Table 4.1). As resistance increased fatigue index decreased with significant
differences observed between 2% vs 4% (P = 0.05).
4.3.2 Heart rate data
There were no significant differences for peak heart rates (HR; beats-min'1) at 29
s between resistive loads of 2%, 3%, 4% and 5% (166, 167, 166, 169,
respectively). Therefore, peak heart rate can be achieved regardless of resistive
load.
4.3.3 Electromyography responses
Electromyographic activation was measured for each muscle at corrected PPO,
uncorrected PPO and minimum power output. For bicep brachii there were
75t r . >
6 u n i v e r s i t y o f n g r t k a lLIBRARY
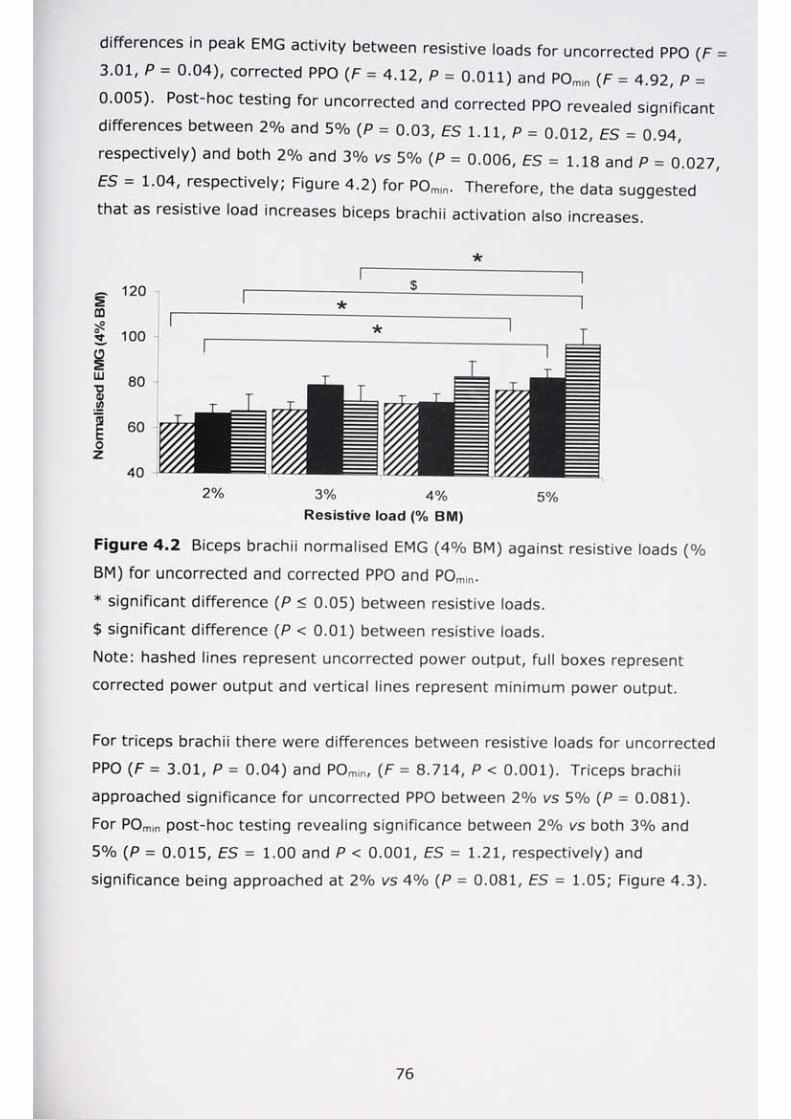
differences in peak EMG activity between resistive loads for uncorrected PPO (F =
ES 1.04, respectively; Figure 4.2) for POmin. Therefore, the data suggested
that as resistive load increases biceps brachii activation also increases.
Figure 4.2 Biceps brachii normalised EMG (4% BM) against resistive loads (%
BM) for uncorrected and corrected PPO and POmin.
* significant difference (P < 0.05) between resistive loads.
$ significant difference (P < 0.01) between resistive loads.
Note: hashed lines represent uncorrected power output, full boxes represent
corrected power output and vertical lines represent minimum power output.
For triceps brachii there were differences between resistive loads for uncorrected
PPO (F = 3.01, P = 0.04) and POmln, (F = 8.714, P < 0.001). Triceps brachii
approached significance for uncorrected PPO between 2% vs 5% (P = 0.081).
For POmin post-hoc testing revealing significance between 2% vs both 3% and
5% (P = 0.015, ES = 1.00 and P < 0.001, ES = 1.21, respectively) and
significance being approached at 2% vs 4% (P = 0.081, ES = 1.05; Figure 4.3).
0.005). Post-hoc testing for uncorrected and corrected PPO revealed significant
differences between 2% and 5% (P = 0.03, ES 1.11, P = 0.012, ES = 0.94,
respectively) and both 2% and 3% vs 5% (P = 0.006, ES = 1.18 and P = 0.027,
If 100
00o
120
I
2% 3% 4% 5%Resistive load (% BM)
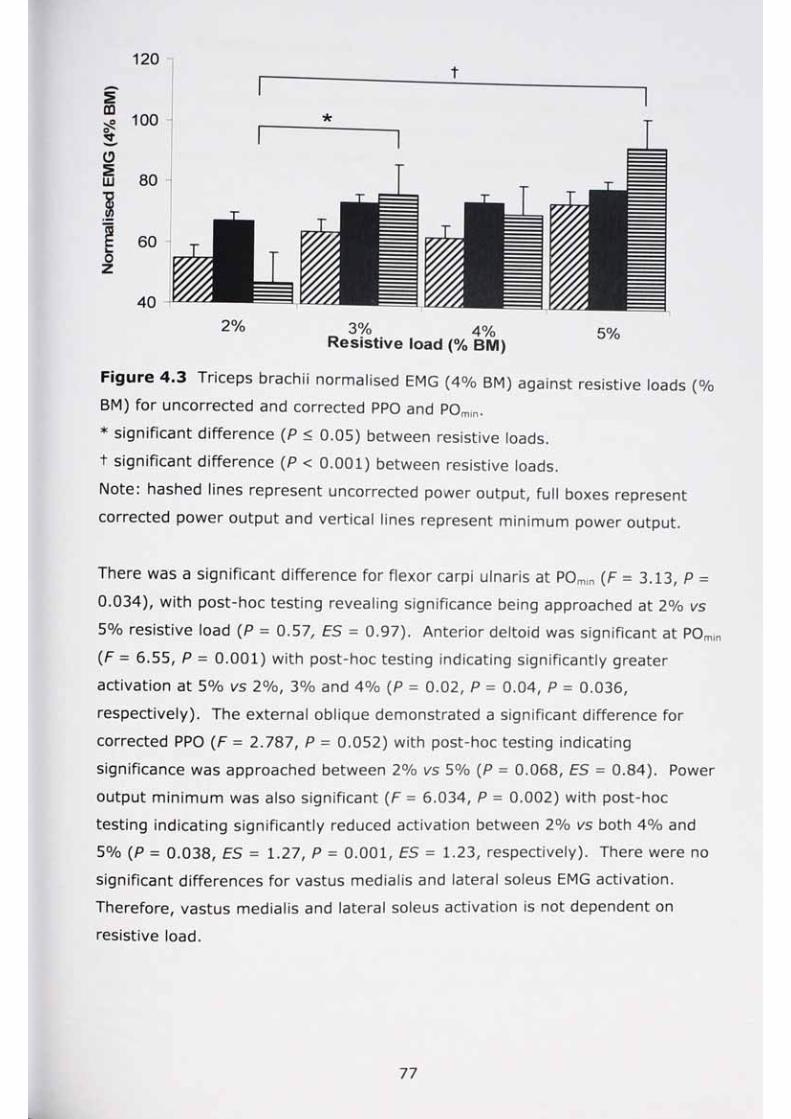
120
2% 3% 4%Resistive load (% BM)
Figure 4.3 Triceps brachii normalised EMG (4% BM) against resistive loads (%
BM) for uncorrected and corrected PPO and POmin.
* significant difference (P < 0.05) between resistive loads.
+ significant difference (P < 0.001) between resistive loads.
Note, hashed lines represent uncorrected power output, full boxes represent
corrected power output and vertical lines represent minimum power output.
There was a significant difference for flexor carpi ulnaris at POmin (F = 3.13, p =
0.034), with post-hoc testing revealing significance being approached at 2% vs
5% resistive load (P = 0.57, ES = 0.97). Anterior deltoid was significant at POmin
(F = 6.55, P = 0.001) with post-hoc testing indicating significantly greater
activation at 5% vs 2%, 3% and 4% (P = 0.02, P = 0.04, P = 0.036,
respectively). The external oblique demonstrated a significant difference for
corrected PPO (F = 2.787, P = 0.052) with post-hoc testing indicating
significance was approached between 2% vs 5% (P = 0.068, ES = 0.84). Power
output minimum was also significant (F = 6.034, P = 0.002) with post-hoc
testing indicating significantly reduced activation between 2% vs both 4% and
5% (P = 0.038, ES - 1.27, P = 0.001, ES = 1.23, respectively). There were no
significant differences for vastus medialis and lateral soleus EMG activation.
Therefore, vastus medialis and lateral soleus activation is not dependent on
resistive load.
77
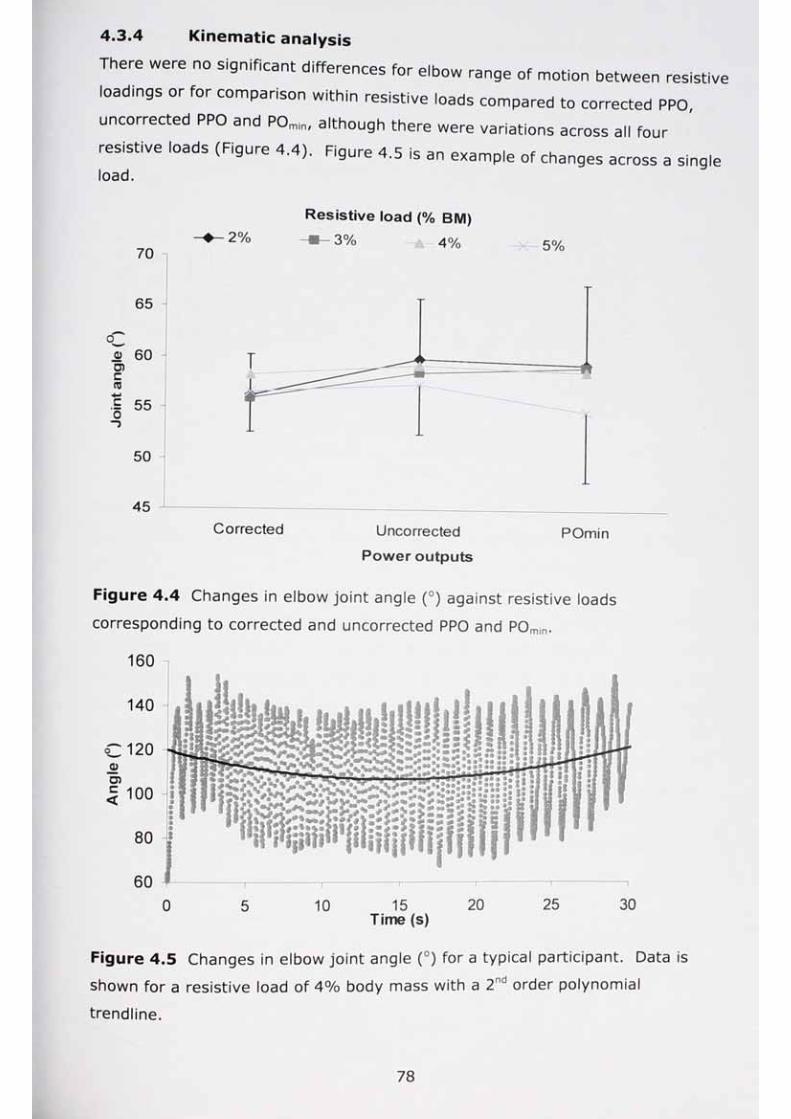
4.3.4 Kinematic analysis
There were no significant differences for elbow range of motion between resistive
loadings or for comparison within resistive loads compared to corrected PPO,
uncorrected PPO and POmin, although there were variations across all four
resistive loads (Figure 4.4). Figure 4.5 is an example of changes across a single load.
Resistive load (% BM)
Figure 4.4 Changes in elbow joint angle (°) against resistive loads
corresponding to corrected and uncorrected PPO and POmjn.
160
600 5 10 15 20 25 30
Time (s)
Figure 4.5 Changes in elbow joint angle (°) for a typical participant. Data is
shown for a resistive load of 4% body mass with a 2nd order polynomial
trendline.
78

There was a significant difference observed for trunk rotation measured asangular velocity (“ -s'1) between resistive loadings (F = 2.856, P = 0.040). Post-
hoc testing revealed a significant difference between 3% and 4% resistive loads
(P = 0.029) with angular velocity being greater for 3% than 4% (282 vs 234 0
). Figure 4.6 is an example of changes across a single load.
250
200 150
100= 50oo<1)>
O)
0
-50
-100< -150
-200-250
0 5 10 15Time (s)
20 25 30
Figure 4.6 Changes in angular velocity between C7 and inner shoulder and seat
post for a typical participant. Data is shown for a resistive load of 4% body
mass.
There was a significant difference in changes in torso distance (C7; mm) relative
to the ACE between resistive loads (F = 5.135, P = 0.002; Figure 4.7 and 4.8).
Post-hoc testing revealed a significant difference between 2% and 4% resistive
loads (P = 0.001). Additionally, distance at corrected, uncorrected and minimum
PO was significantly different (F = 3.124, P = 0.047). Post-hoc testing revealed
a significant difference between minimum PO and uncorrected PPO (P = 0.047)
with distance (mm) being greater at minimum power output than uncorrected
PPO. Therefore, resistive load effects torso distance to the ACE, in general a
greater load results in participants moving their torso closer to the ACE.
79

EEQJOcr o
650
600
.<2 550O
500
2%
Corrected
Resistive load (% BM)
3% 4%
Uncorrected
Power outputs
5%
POmin
Figure 4.7 Torso distance (mm) relative to the ACE at corrected, uncorrected
and minimum power output for 2%, 3%, 4% and 5% body mass resistive loads
a. Significantly different from 4% resistive loading.
EEQJOcT O
(/)•
Q
620
600
580
560
540 -
520
5000 5 10 15
Time (s)20 25 30
Figure 4.8 Changes in torso distance (mm) relative to the ACE for a typical
participant. Data is shown for a resistive load of 4% body mass.
80
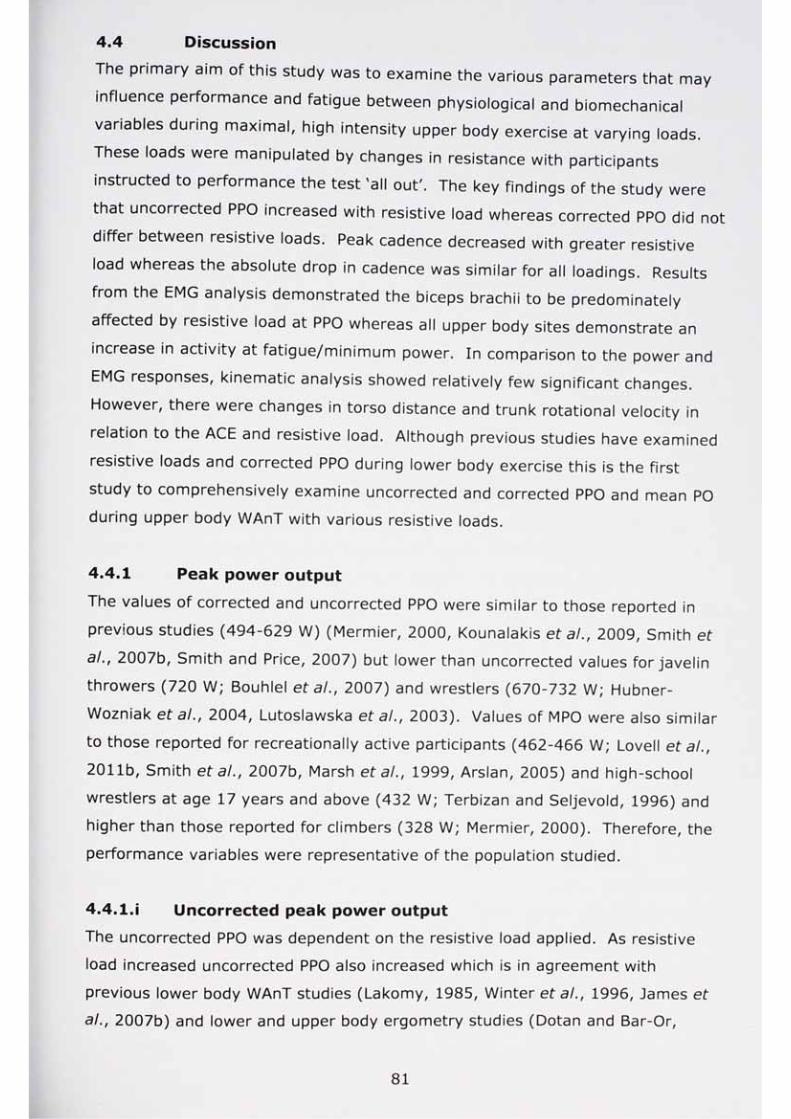
4.4 Discussion
The primary aim of this study was to examine the various parameters that may
influence performance and fatigue between physiological and biomechanical
variables during maximal, high intensity upper body exercise at varying loads.
These loads were manipulated by changes in resistance with participants
instructed to performance the test 'all out'. The key findings of the study were
that uncorrected PPO increased with resistive load whereas corrected PPO did not
differ between resistive loads. Peak cadence decreased with greater resistive
load whereas the absolute drop in cadence was similar for all loadings. Results
from the EMG analysis demonstrated the biceps brachii to be predominately
affected by resistive load at PPO whereas all upper body sites demonstrate an
increase in activity at fatigue/minimum power. In comparison to the power and
EMG responses, kinematic analysis showed relatively few significant changes.
However, there were changes in torso distance and trunk rotational velocity in
relation to the ACE and resistive load. Although previous studies have examined
resistive loads and corrected PPO during lower body exercise this is the first
study to comprehensively examine uncorrected and corrected PPO and mean PO
during upper body WAnT with various resistive loads.
4.4.1 Peak power output
The values of corrected and uncorrected PPO were similar to those reported in
previous studies (494-629 W) (Mermier, 2000, Kounalakis eta!., 2009, Smith et
a!., 2007b, Smith and Price, 2007) but lower than uncorrected values for javelin
throwers (720 W; Bouhlel eta/., 2007) and wrestlers (670-732 W; Hubner-
Wozniak et a/., 2004, Lutoslawska et a/., 2003). Values of MPO were also similar
to those reported for recreationally active participants (462-466 W; Lovell eta/.,
2011b, Smith eta/., 2007b, Marsh eta/., 1999, Arslan, 2005) and high-school
wrestlers at age 17 years and above (432 W; Terbizan and Seljevold, 1996) and
higher than those reported for climbers (328 W; Mermier, 2000). Therefore, the
performance variables were representative of the population studied.
4.4.1.1 Uncorrected peak power output
The uncorrected PPO was dependent on the resistive load applied. As resistive
load increased uncorrected PPO also increased which is in agreement with
previous lower body WAnT studies (Lakomy, 1985, Winter et a!., 1996, James et
a/., 2007b) and lower and upper body ergometry studies (Dotan and Bar-Or,
1983). In the current study the main differences in uncorrected PPO were
between the lowest and highest resistive loads (2% vs 5%), as well as between
the two lowest loads (2% vs 3%). Although the uncorrected PPO increased with
resistive load, the peak cadence decreased with resistive load. However, the
relationship between PPO and cadence (i.e. ratio of peak cadence to peak power)
was not linear. This response is in accordance with the force velocity relationship
where greater concentric movement speeds elicit lower force (Brooks et at.,
2005). Cadence at PPO for the 5% resistive load was 125 rev-min1, this is the
optimal cadence recommended by Neville (2009) for America cup sailors
undertaking grinding. Additionally, this cadence is approaching optimal
power/velocity relationship of 120 rev-min'1 for an even distribution of type I/II
muscle fibres in lower body ergometry (Sargeant, 1994). Given the greater
proportion of type II fibre in the upper limbs (Mygind, 1995, Savard et at., 1987,
Sawka, 1986) it is likely that a 5% resistive load satisfies the optimal
force/velocity relationship for uncorrected PPO.
4.4.1.N Corrected peak power output
Corrected PPO was independent of resistive load, as observed in previous lower
body studies (James et a/., 2007b, Linossier et a/., 1996, Bogdanis et at., 2008).
However, a previous study of lower body WAnT's by Lakomy (1985) concluded
that lower restive loads produced greater corrected PPO. Although not
statistically significant, the results from this study suggest that the 2% and 3%
body mass resistive loads produce a slightly greater PPO than the 4% loading of
~32 W, which is greater than the day-to-day variation observed earlier in the
thesis (~18 W). Therefore, it is possible that the optimal cadence is faster with
the arms (Vanderthommen et at., 1997) and each individual resistive loading
may produce an optimal acceleration up until the time where corrected PPO is
reached.
4.4.1.iii Time to peak power output
Time to PPO for uncorrected and corrected measures was significantly different.
Time to PPO was faster for corrected measures. Furthermore, time to PPO was
independent of resistive load applied for both corrected and uncorrected PPO.
Studies examining lower body WAnTs have demonstrated comparable results for
uncorrected time to PPO but not corrected time to PPO which increased with
resistive load (James et a/., 2007b). The present study demonstrated that the
time to corrected PPO was reached more quickly than time to uncorrected PPO
and corresponds to that reported for lower body WAnTs (James et al., 2007b
Lakomy, 1985, Lakomy, 1986, Vanderthommen eta,., 1997). As corrected PO
takes into account the inertia of the flywheel and the force required to change
the momentum of the flywheel (Bassett, 1989), the initial power phase produces
the highest peak values and does not, unlike uncorrected PPO, necessarily occur
at peak cadence (Vanderthommen eta!., 1997). Uncorrected PPO occurred at
the same time (s) across loads, but resulted in lower absolute peak cadences,
reflects the greater resistive load applied, which limits peak cadence.
At lower cadences muscle contraction speed is also lower resulting in the
generation of large forces and more rapid acceleration of the flywheel (Sargeant
eta/., 1981). With little difference in time to corrected PPO across resistive
loads, it possible that there is a similar pattern and time course of muscle fibre
recruitment up to the point of corrected PPO. However, from this point power
then decreases at different rates - it becomes more reflective of the resistive
load. This could reflect a decrease/shift in optimal energy usage pattern, from
PCr degradation. Uncorrected time to PPO is only reached when velocity slows
down between 9-11 s (Macintosh et al., 2003). The reduction in cadence, and
therefore power output, for the remainder of the test could be reflective of the
point where the maximal rate of glycolysis and ATP turnover begins to decline
(Beneke et al., 2002, Bogdanis et al., 2008, Gastin, 2001) and therefore the
start of metabolic fatigue.
4.4.1.iv Fatigue index
Fatigue index calculated from uncorrected performance indices increased with
resistive load, which has been observed in both arm and leg studies (Dotan and
Bar-Or, 1983, James et al., 2007b). In the present study, each resistive load
demonstrated a similar absolute decrease in cadence (~40 rev-min'1).
Therefore, as a lower resistive load initially enables a greater peak cadence to be
produced, the absolute drop in cadence is relatively less than for 5% resistive
load where peak cadence is initially less. For uncorrected data the absolute drop
in power is therefore greater as the resistive load increases. The significant
increase in fatigue index (uncorrected power) from 20% to 32% with the 2%
versus 5% resistive loadings, is an indication that the 2% resistive load is in the
extreme end of the force-velocity curve to reach a sufficiently high power output;
i.e. it is likely that cadence is approaching a maximal rate of -180 rev-min1
(optimal speed being 25-30% of maximal speed of contraction; Astrand and
Rodahl, 1986). A fatigue index of 20% for a 2% resistive load still indicates that
the resistive load is sufficient to elicit fatigue and a drop in power output.
Whether there were biomechanical differences as a result of this will be discussed in sections 4.4.2 and 4.4.3.
For corrected performance indices, the PPO was similar across loads; as such,
the FI became a function of the minimum power. In the current study minimum
PO increased at greater resistive loads presumably as the flywheel slowed down
towards end of test due to greater resistance on the flywheel. Therefore,
participants were credited with a greater amount of work being done as they are
more able to resist the deceleration of the flywheel at greater loads (Bogdanis
eta/., 2008). With lighter resistive loads, the flywheel presumably'spins' more
and participants are then not credited with as much work being done, i.e. the
participants were less able to 'resist' the deceleration of the flywheel. Therefore,
corrected FI is almost exclusively dependent on minimum power output. For
corrected FI a significant difference was observed between the 2% and 4%
resistive loads, although the mean figures indicate a division between 2% and
3% and 4% and 5% body mass loadings. Therefore, although it may be
expected that a greater load would result in greater fatigue, the measurement of
correct power indicates that when using the standard measurement of FI that
fatigue is greater with a lighter load, which has also been observed in leg
ergometry (Bogdanis et al., 2008).
Practically the results suggest that application to sports settings may be of
benefit in upper body sports. Rowers vary their speed during a race by rapidly
increasing boat velocity after the start of the race, decreasing and then increase
speed again toward the end of the race (Astrand and Rodahl, 1986). Corrected
PPO would be of practical significance to rowers at the start of the race, where
the ability to rapidly increase the speed of the boat is required. This may be
especially important to 200-m sprint kayaking where the race lasts less than 40-
s (van Someren and Palmer, 2003) and the ability to accelerate the kayak rapidly
is necessary before the race is finished.
84
4.4. l.v Resistive load optimisation
The resistive loads eliciting the greatest PPO (i.e. the optimal resistive load) are
dependent on whether corrected or uncorrected PO is required. Corrected PPO is
independent of resistive load and a lower resistive load (2% or 3%) could then
be used. Participants in this study, using a lower resistive load, reported fewer
side-effects associated with the WAnT (e.g. nausea and vomiting and dizziness;
Inbar eta/., 1996, Stickley eta/., 2008, Marquardt eta/., 1993) which can affect
test validity or repeatability and alleviate the need for abbreviating the test
duration to 20-s (Smith eta/., 2007b, Laurent eta/., 2007). Therefore, for
uncorrected PPO the greater the resistive load the greater the PPO and MPO.
For uncorrected power, the restive load of 5% produced 12 of the 13 highest
PPOs with the remaining highest uncorrected PPO being achieved with the 4%
body mass load. Corrected PPO produced some variation in individual PPO
between loads of 2%, 3%, 4% and 5% with 23%, 46%, 15%, 15% of highest
PPO achieved at each loading, respectively. With uncorrected power, the
difference between 4% and 5% BM is 55 W, which is greater than the variation
demonstrated earlier in the thesis. Therefore, it is suggested that a 5% BM
resistive load is used to elicit maximal power. The variation between corrected
power outputs, excluding the 4% BM, is relatively small suggesting (10-15 W)
either load may be applied.
Participants were familiarised at 4% BM resistive load as it formed a compromise
between the lower loads (2% and 3%) and the higher load of 5%. It would not
be practical to familiarise participants at all resistive loads, and the results
suggest that participants' performance variables were not preferential over the
other BM loads. Despite the order of loading being randomised, there is a slight
decrease in corrected PO achieved at 4% resistive loading. Although not
investigated in the literature, one consideration could be that as the three warm-
up sprints for all resistive loads were completed at 4% BM, and this may have
'over-familiarised' participants with the load. Therefore, it is the 'warm-up'
sprints, not the load that over-familiarised participants to a 4% BM resistive load.
Another consideration is that although the 4% resistive load was a compromise
between resistive loads of 2%, 3% and 5% BM, this may not be beneficial to
performance at a 4% resistive load. In future, further consideration may need to
be given to the warm-up load, e.g. whether a 3% load could provide

improvement in performance for a 30-s 4% BM load. Finally, it may be that a
4% load produces different responses in biomechanics that result in the resistive
load not being optimal for corrected power output and thus may warrant further study.
4,4,2 Electromyography responses
Analysis of normalised surface EMG amplitude can help in performance analysis
as it reflects the level of recruitment and general levels of muscle excitation
within the area detected by the electrode (Hug and Dorel, 2009). Wingate
anaerobic test performance and EMG activity has been examined using lower
body tests (Greer et at., 2006, Hunter et at., 2003, Rana, 2006, Stewart et a/.,
2011, Chtourou et a/., 2011). The hamstrings and quadriceps provide the pull
and push forces within a lower body WAnT during cycling (Vanderthommen et
a/., 1997, Marais et a/., 2004, Hopman eta/., 1995, Zehr and Chua, 2000) the
biceps and triceps brachii provide the equivalent pull and push forces
respectively for primary power during upper body WAnT performance. This was
the first study to examine EMG responses during an upper body WAnT. The
power output and FI results discussed above provide an indication of
performance in relation to resistive load. However, more detail is required to
develop an accurate model of muscle activation and how it may influence
performance.
Whether considering corrected or uncorrected power variables the biceps brachii
muscle demonstrated an increased activity proportional to resistive load. Biceps
brachii activation have been demonstrated to increase with constant load at high
intensity ACE (Bernasconi et at., 2006). Therefore, the mean activation levels
suggest that biceps brachii activation distinguishes between resistive loads with
the level of activation being greater as resistive load increases. The results
further suggest that there is greater biceps brachii activation at corrected PPO
rather than uncorrected PPO across all four resistive loads. It appears that for
both corrected and uncorrected PO that a 2% resistive load for biceps brachii
activation is considerably 'easier' than a 5% resistive load. At the end of the
WAnT for all resistive loads, with the exception of 3% loading, biceps brachii
activity was greater than at PPO either indicating fatigue had occurred and
muscle activation was not effective in generating force (Greer et a!., 2006,
Walker et a!., 2012) or that the flywheel had slowed sufficiently to allow greater

force to be applied. As the absolute decrease in cadence was equal across loads
it is most likely that the former explanation is more probable. With the exception
of the 3% loading, biceps brachii activity was greater at minimum power than at
PRO' Th6Se data Suggest that the biceps brachii are, for the population tested, an important muscle during an upper body WAnT. Whether this applies to a specifically trained population remains unreported.
The triceps brachii demonstrated lower EMG activation at minimum power output
with 2% resistive load compared to 3%, 4% and 5%. This response may
indicate that biceps brachii may be more important than the triceps brachii to
rotate the cranks/flywheel at this point of the test. Lower limb studies indicate
that there are changes in EMG amplitude during the WAnT and that some muscle
may be more reflective of changes in power output than others (Greer et at.,
2006, Rana, 2006). Individual analyses of EMG responses indicate that at peak
cadence the EMG activity was lower than at the end of the test. Participants'
post-test comments indicated that they were unable to maintain the cadence as
the flywheel was moving too fast and the hand grips were being 'pulled away
from them . With a 2% resistive load, at the end of the test participants
exhibited a significant reduction in triceps brachii activation which may be an
indication that the triceps brachii cannot contract fast enough and the cranks
were spinning away from the participant whereas the biceps brachii activation
was almost constant. However, as with the biceps brachii a 5% resistive load
resulted in a significant increase in activation to limit power loss.
The EMG activation for flexor carpi ulnaris only showed significance differences at
the 2% vs 5% resistive loads at the minimum PO. The lack of significance
between other resistive loads and power outputs, despite a significant level of
EMG activity, is suggestive of the need to maintain grip throughout the crank
cycles for each test. Flexor carpi ulnaris activation could be linked to the EMG
activity of the biceps brachii, as activity of biceps brachii increases so does flexor
carpi ulnaris with the increase in pull requiring a stronger flexion of the hand.
Greater muscle activity within flexor carpi ulnaris at the 5% resistive load is a
new finding. Whether this level of activation is required during more prolonged
high intensity upper body exercise (e.g. 100% max to exhaustion) and how it
contributes to fatigue remains to be established.
87

The anterior deltoid indicated significantly greater activity for the 5% resistive
load at the end of the test when compared to the other resistive loads. Resistive
loads of 2%, 3% and 4% may therefore not be sufficient to require greatermuscle activation at this site A hnH,, i j-
• a b /o body mass loading appears to be sufficientto increase activation as either a stabiliser or in assisting power production.
Such a response has been suggested for infraspinatus during exercise at
submaximal resistive loads (Bernasconi et at., 2006) and serves to increase
compression for the glenohumeral joint (Ackland and Pandy, 2009).
Furthermore, a comparable level of activation across resistive loads and power
outputs indicates this muscle acts as a stabiliser throughout all the resistive
loads and does not fatigue. The resistive loads examined or the time points may
not be sufficient to stimulate the muscle or alter the movement pattern, or it is
not an important contributor to the movement pattern.
Similarly to the other EMG sites recorded, the external oblique showed greater
activation at corrected PPO for the 5% compared to 2% load. It therefore
appears that a 5% resistive load requires greater assistance from the trunk
muscles than a 2% resistive load. Furthermore, at minimum PO the external
oblique activation was greater at the 4% and 5% resistive loads when compared
to 2% resistive load. This pattern of activity has only previously been suggested
to occur during sub-maximal arm crank exercise (Mercier et at., 1993, Stamford
eta/., 1978, Bar-Or and Zwiren, 1975, Bernasconi eta/., 2006). Flowever,
where rectus abdominis activity has been specifically measured this muscle
group has also been demonstrated to contribute to torso stabilisation (Hopman
et a/., 1995) although this may be due to their greater contribution to trunk
stabilisation than the external oblique. The current study is the first
investigation to examine torso stabilisation via trunk rotational velocity at a
range of WAnT resistive loads and the results show that trunk rotational velocity
is important for resistive loads of 5%. For resistive loads of 2% body mass the
'spinning' affect at the end of the test could reduce the need for trunk
stabilisation. Whether this activation is similar at submaximal or continuous
exercise to exhaustion remains to be examined.
Previous studies have suggested that the lower limbs, in addition to the trunk
muscles, aid power production as stabilisers during ACE possibly resulting in
disproportionate metabolic cost of exercise (i.e. V02 excess) (Smith et a!.,
88
2007a, Bar-Or and Zwiren, 1975). However, results of the present study showed
no differences in EMG activity at these sites between resistive loads or over the
test duration thus indicating that the lower limbs could be activated prior to PPO
and were either outside of the time scale analysed, or not activated at all. At the
end of the test this suggests that neither muscle stabilised the lower body
significantly and that fatigue is unlikely to be a factor in these muscles. With
participants 'firmly seated' and correctly positioned the external oblique, rather
than the lower limbs, may be assisting trunk positioning and therefore aiding in power production for the upper body.
The increase in EMG seen in a number of muscles, but not all, at the end of the
exercise, despite a reduction in power output, suggested this is the result of local
muscle fatigue (Greer ef a/., 2006, Walker et a!., 2012). With local muscle
fatigue reducing contractile force this may be a result of increased muscle pH
(Lovell eta/., 2011b, Smith et a/., 2002a, Weber eta/., 2006), an accumulation
of Ca2+ (Green, 1997), or increase in inorganic phosphate due to the breakdown
of creatine phosphate (Westerblad et a/., 2002). However, not all muscles
showed changes in EMG which supports the notion of peripheral muscle fatigue -
if all muscle showed an increase then fatigue may be central (Greer et a/., 2006,
Walker et a/., 2012) but this is unlikely over a 30-s sprint test. In addition,
muscles not showing increases or minimal changes in resistive loading probably
indicate their role as stabilisers rather than power producers.
Dependent on the resistive load applied minimum PO resulted in greater EMG
activation for a number of muscles. This response contributes to knowledge of
submaximal muscle activation where EMG activation increased at two loads (50
and 100 W) (Smith et a!., 2008), although interesting for a 30-s WAnT the linear
increase the resistive load is only significant at the end of the test. The lack of
significant differences in EMG during the various resistive loads, with the
exception of biceps brachii, could indicate that these muscles were fully utilised
regardless of resistive load. Previous research has shown that during
incremental ACE, swim trained leg disabled men showed greater change in
muscle activation for the biceps brachii over the triceps brachii (Frauendorf et at.,
1989). Whatever the nature of fatigue this study demonstrated a decrease in PO
over time with an increase in EMG activity. Such a drop in PO indicates fatigue
in terms of reduced power production within the muscles, where there is
89
increased electrical, but less contraction, indicating a reduction in neuromuscular
transmission and/or impaired excitation-contraction coupling (Hautier eta!.,
2000). The EMG responses may be more easily detected in uncorrected FI
compared with corrected FI. The significant difference observed in 2% vs 5%
resistive load, reflected in the significant changes in EMG response. Uncorrected
FI was only significant at 2% vs 4%, which was not reflective in EMG responses.
It may be that EMG responses were not sampled at the correct time point(s) to reflect corrected FI with the muscles studied.
The above muscle recruitment patterns are the first to be reported for upper
body WAnTs. Whether these activation patterns are typical for trained
participants is not clear (Smith eta/., 2008, Marais eta/., 2004, Bernasconi et
a/., 2006). A further study examining pre and post training changes in EMG
could provide information as to whether training changes recruitment patternsand to what extent.
4.4.3 Kinematic analysis
Trunk rotation measured as angular velocity (°-s1) between C7, shoulder inner
and top, and centre of seat post pillar was only significant between 3% and 4%
resistive loads. The 3% resistive load producing the greatest trunk rotational
velocity at corrected, uncorrected and minimum PO. This resistive load could
represent a point between the lighter 'spinning' resistive load of 2% and the
heavier resistive loads of 4% and 5% that require greater stabilisation. Mean
time to corrected PPO was fastest at this resistive loading and it may be that
muscles used in creating the trunk rotational velocity are strong enough to
overcome the resistive load at 3% but not at 4% and 5% where greater
isometric activation is required for stabilisation. With a 2% resistive load
requiring less body movement the arms can 'spin' the resistive load and not
require any additional assistance from the trunk. The typical participant case
study presented (Figure 4.6) indicated that angular velocity increases from about
20-s and trunk rotational velocity may be assisting in power production (EMG
data indicating significantly greater activation at minimum PO for both 4% and
5% vs 2% resistive loads).
The distance (mm) between C7 and the static point directly vertical to the centre
of ergometer bottom bracket was measured in order to determine changes in
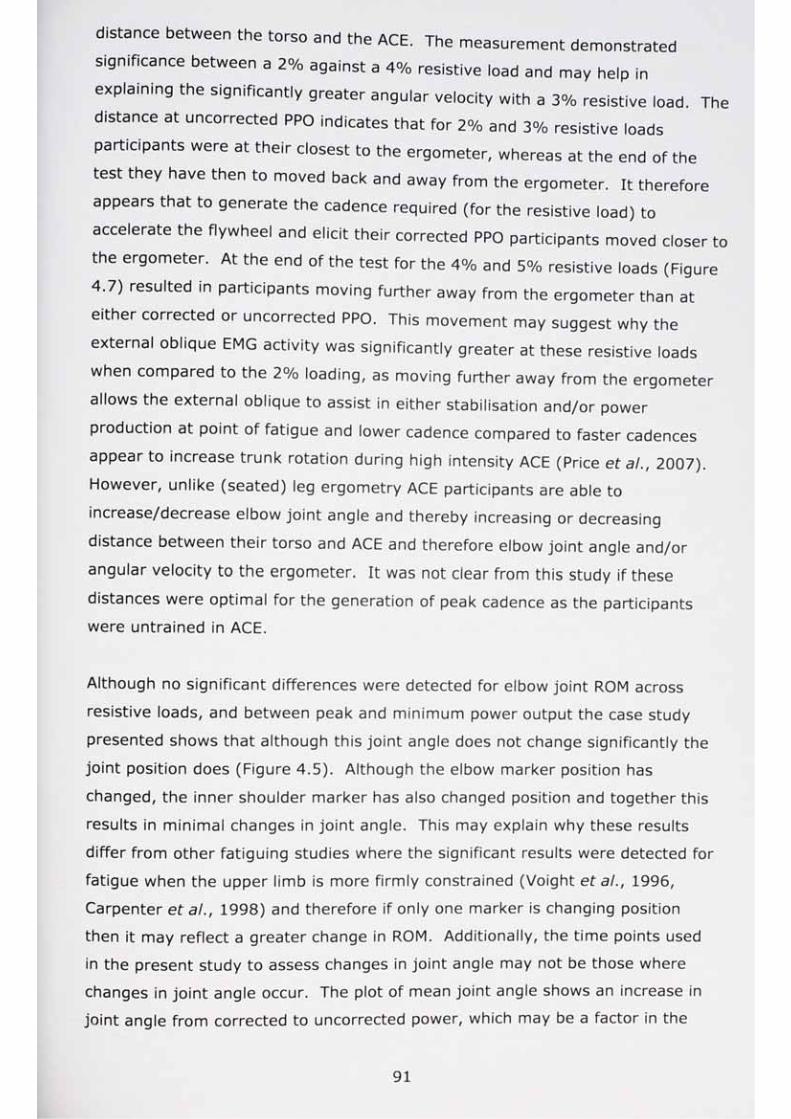
distance between the torso and the ACE. The measurement demonstrated
significance between a 2% against a 4% resistive load and may help in
explaining the significantly greater angular velocity with a 3% resistive load. The
distance at uncorrected PPO indicates that for 2% and 3% resistive loads
participants were at their closest to the ergometer, whereas at the end of the
test they have then to moved back and away from the ergometer. It therefore
appears that to generate the cadence required (for the resistive load) to
accelerate the flywheel and elicit their corrected PPO participants moved closer to
the ergometer. At the end of the test for the 4% and 5% resistive loads (Figure
4.7) resulted in participants moving further away from the ergometer than at
either corrected or uncorrected PPO. This movement may suggest why the
external oblique EMG activity was significantly greater at these resistive loads
when compared to the 2% loading, as moving further away from the ergometer
allows the external oblique to assist in either stabilisation and/or power
production at point of fatigue and lower cadence compared to faster cadences
appear to increase trunk rotation during high intensity ACE (Price et al., 2007).
However, unlike (seated) leg ergometry ACE participants are able to
increase/decrease elbow joint angle and thereby increasing or decreasing
distance between their torso and ACE and therefore elbow joint angle and/or
angular velocity to the ergometer. It was not clear from this study if these
distances were optimal for the generation of peak cadence as the participants
were untrained in ACE.
Although no significant differences were detected for elbow joint ROM across
resistive loads, and between peak and minimum power output the case study
presented shows that although this joint angle does not change significantly the
joint position does (Figure 4.5). Although the elbow marker position has
changed, the inner shoulder marker has also changed position and together this
results in minimal changes in joint angle. This may explain why these results
differ from other fatiguing studies where the significant results were detected for
fatigue when the upper limb is more firmly constrained (Voight eta/., 1996,
Carpenter et al., 1998) and therefore if only one marker is changing position
then it may reflect a greater change in ROM. Additionally, the time points used
in the present study to assess changes in joint angle may not be those where
changes in joint angle occur. The plot of mean joint angle shows an increase in
joint angle from corrected to uncorrected power, which may be a factor in the
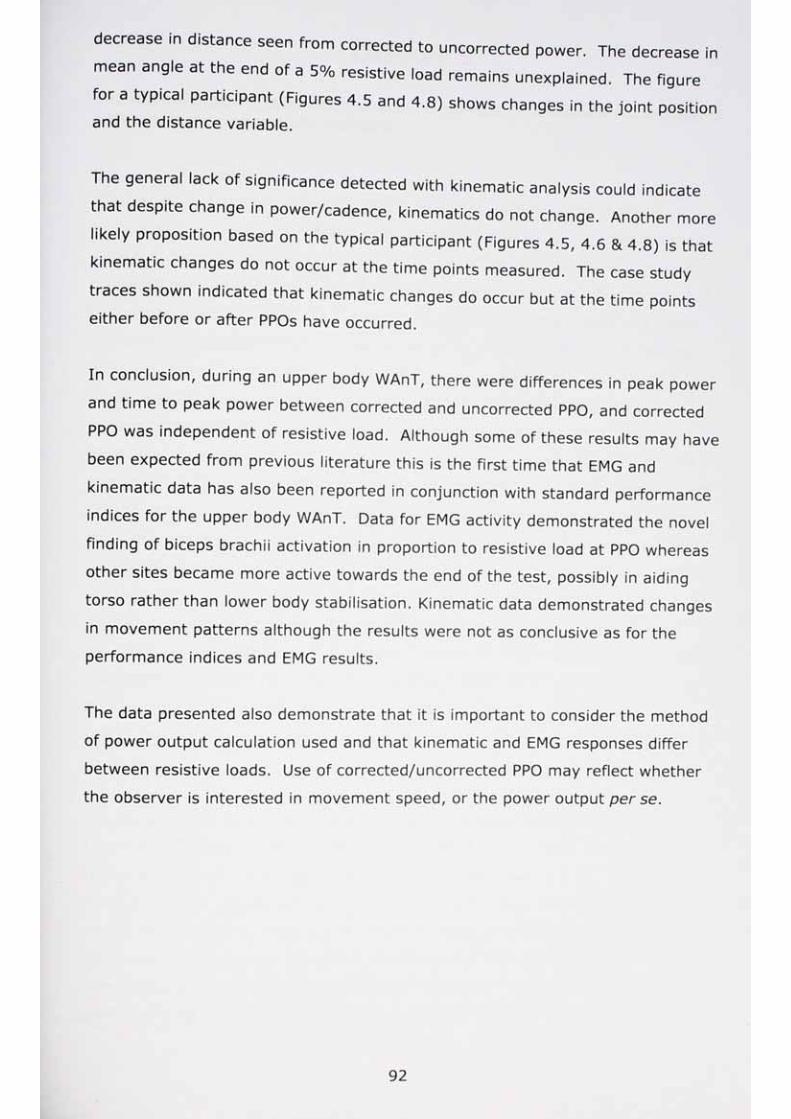
decrease in distance seen from corrected to uncorrected power. The decrease in
mean angle at the end of a 5% resistive load remains unexplained. The figure
for a typical participant (Figures 4.5 and 4.8) shows changes in the joint position and the distance variable.
The general lack of significance detected with kinematic analysis could indicate
that despite change in power/cadence, kinematics do not change. Another more
likely proposition based on the typical participant (Figures 4.5, 4.6 & 4.8) is that
kinematic changes do not occur at the time points measured. The case study
traces shown indicated that kinematic changes do occur but at the time points either before or after PPOs have occurred.
In conclusion, during an upper body WAnT, there were differences in peak power
and time to peak power between corrected and uncorrected PPO, and corrected
PPO was independent of resistive load. Although some of these results may have
been expected from previous literature this is the first time that EMG and
kinematic data has also been reported in conjunction with standard performance
indices for the upper body WAnT. Data for EMG activity demonstrated the novel
finding of biceps brachii activation in proportion to resistive load at PPO whereas
other sites became more active towards the end of the test, possibly in aiding
torso rather than lower body stabilisation. Kinematic data demonstrated changes
in movement patterns although the results were not as conclusive as for the
performance indices and EMG results.
The data presented also demonstrate that it is important to consider the method
of power output calculation used and that kinematic and EMG responses differ
between resistive loads. Use of corrected/uncorrected PPO may reflect whether
the observer is interested in movement speed, or the power output per se.
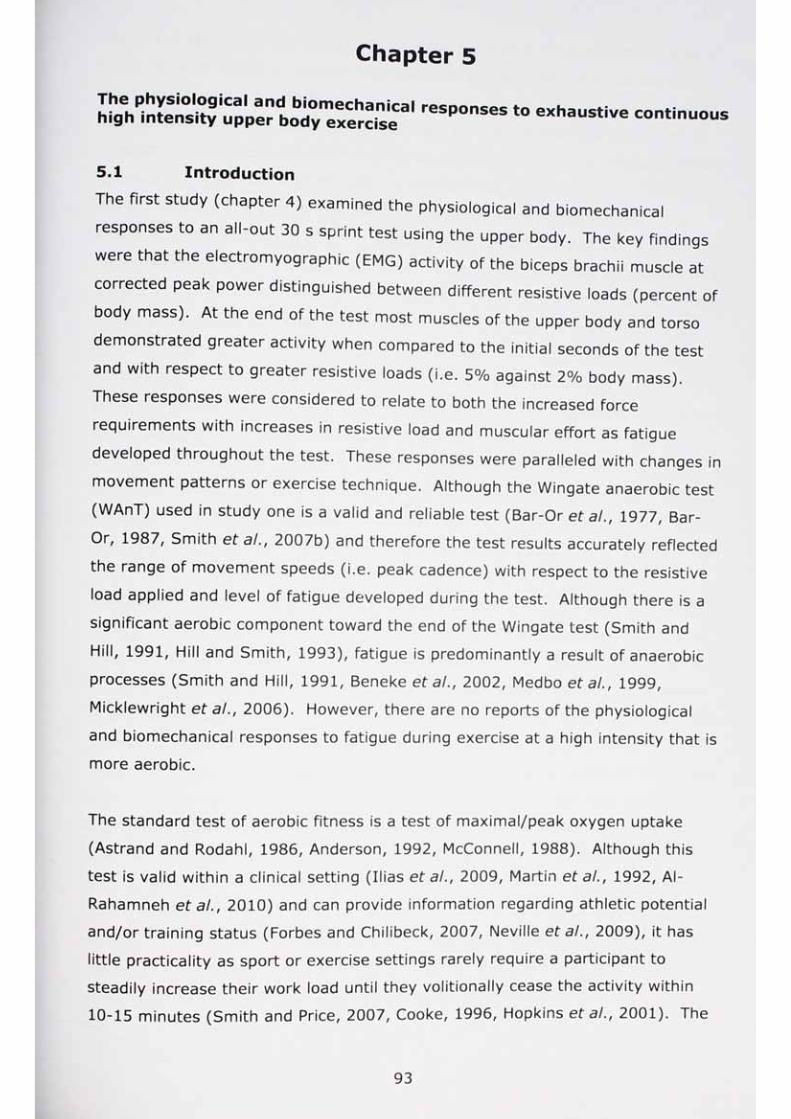
Chapter 5
hig^ntens'ity'upper body^xercise3' reSP° nSeS *° exhausti're continuous
5.1 Introduction
The first study (chapter 4) examined the physiological and biomechanical
responses to an all-out 30 s sprint test using the upper body. The key findings
were that the electromyographic (EMG) activity of the biceps brachii muscle at
corrected peak power distinguished between different resistive loads (percent of
body mass). At the end of the test most muscles of the upper body and torso
demonstrated greater activity when compared to the initial seconds of the test
and with respect to greater resistive loads (i.e. 5% against 2% body mass).
These responses were considered to relate to both the increased force
requirements with increases in resistive load and muscular effort as fatigue
developed throughout the test. These responses were paralleled with changes in
movement patterns or exercise technique. Although the Wingate anaerobic test
(WAnT) used in study one is a valid and reliable test (Bar-Or et at., 1977, Bar-
Or, 1987, Smith et a/., 2007b) and therefore the test results accurately reflected
the range of movement speeds (i.e. peak cadence) with respect to the resistive
load applied and level of fatigue developed during the test. Although there is a
significant aerobic component toward the end of the Wingate test (Smith and
Hill, 1991, Hill and Smith, 1993), fatigue is predominantly a result of anaerobic
processes (Smith and Hill, 1991, Beneke eta/., 2002, Medbo et a/., 1999,
Micklewright et a/., 2006). However, there are no reports of the physiological
and biomechanical responses to fatigue during exercise at a high intensity that is
more aerobic.
The standard test of aerobic fitness is a test of maximal/peak oxygen uptake
(Astrand and Rodahl, 1986, Anderson, 1992, McConnell, 1988). Although this
test is valid within a clinical setting (Ilias et a/., 2009, Martin et a/., 1992, Al-
Rahamneh et a/., 2010) and can provide information regarding athletic potential
and/or training status (Forbes and Chilibeck, 2007, Neville et a/., 2009), it has
little practicality as sport or exercise settings rarely require a participant to
steadily increase their work load until they volitionally cease the activity within
10-15 minutes (Smith and Price, 2007, Cooke, 1996, Hopkins et a/., 2001). The
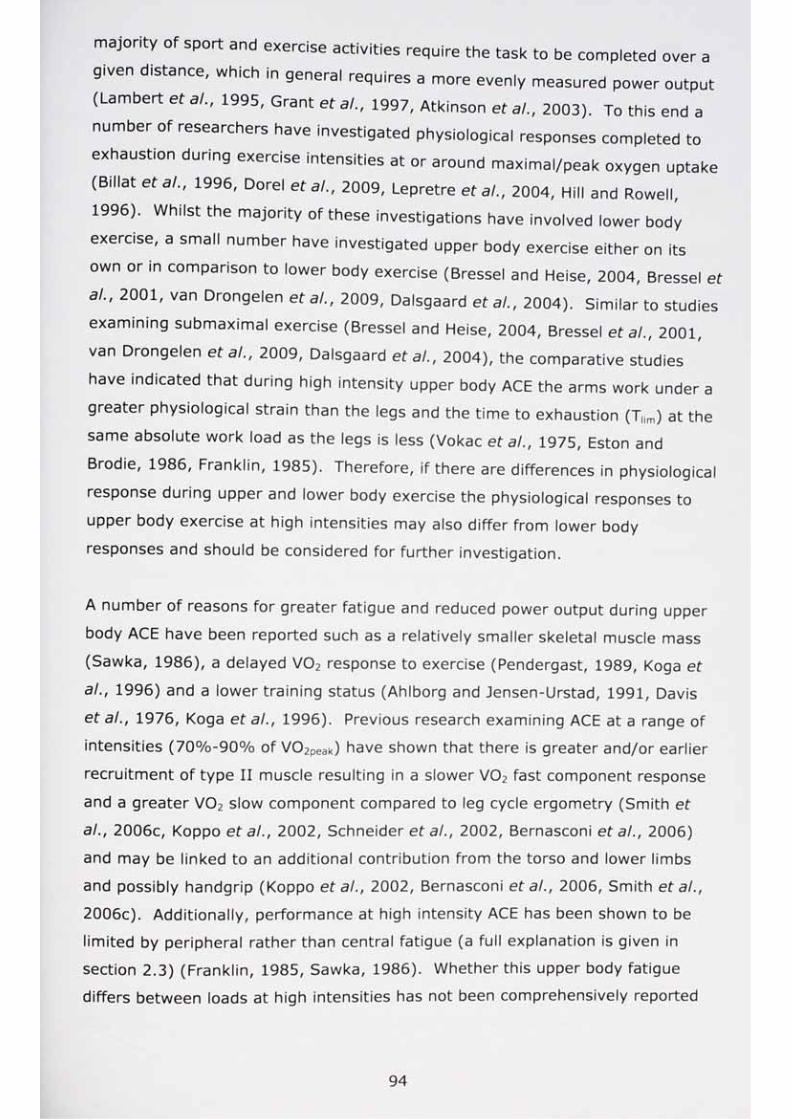
majority of sport and exercise activities require the task to be completed over a
given distance, which in general requires a more evenly measured power output
(Lambert et a!., 1995, Grant et a/., 1997, Atkinson et a/., 2003). To this end a
number of researchers have investigated physiological responses completed to
exhaustion during exercise intensities at or around maximal/peak oxygen uptake
(Billat et al., 1996, Dorel et al., 2009, Lepretre et al., 2004, Hill and Rowell,
1996). Whilst the majority of these investigations have involved lower body
exercise, a small number have investigated upper body exercise either on its
own or in comparison to lower body exercise (Bressel and Heise, 2004, Bressel et
al., 2001, van Drongelen et al., 2009, Dalsgaard et al., 2004). Similar to studies
examining submaximal exercise (Bressel and Heise, 2004, Bressel eta/., 2001,
van Drongelen eta/., 2009, Dalsgaard eta/., 2004), the comparative studies
have indicated that during high intensity upper body ACE the arms work under a
greater physiological strain than the legs and the time to exhaustion (T,lm) at the
same absolute work load as the legs is less (Vokac eta/., 1975, Eston and
Brodie, 1986, Franklin, 1985). Therefore, if there are differences in physiological
response during upper and lower body exercise the physiological responses to
upper body exercise at high intensities may also differ from lower body
responses and should be considered for further investigation.
A number of reasons for greater fatigue and reduced power output during upper
body ACE have been reported such as a relatively smaller skeletal muscle mass
(Sawka, 1986), a delayed V02 response to exercise (Pendergast, 1989, Koga et
al., 1996) and a lower training status (Ahlborg and Jensen-Urstad, 1991, Davis
et a/., 1976, Koga et al., 1996). Previous research examining ACE at a range of
intensities (70%-90% of V02peak) have shown that there is greater and/or earlier
recruitment of type II muscle resulting in a slower V02 fast component response
and a greater V02 slow component compared to leg cycle ergometry (Smith et
al., 2006c, Koppo et al., 2002, Schneider et a/., 2002, Bernasconi eta/., 2006)
and may be linked to an additional contribution from the torso and lower limbs
and possibly handgrip (Koppo et al., 2002, Bernasconi eta/., 2006, Smith et al.,
2006c). Additionally, performance at high intensity ACE has been shown to be
limited by peripheral rather than central fatigue (a full explanation is given in
section 2.3) (Franklin, 1985, Sawka, 1986). Whether this upper body fatigue
differs between loads at high intensities has not been comprehensively reported

in the literature and further rpQP rrher research is required to establish if there are differentphysiological responses between exercise intensities.
Biomechanical analysis of incremental ACE via kinematics, indicates that the
optimal cadence was 70 (rev-min ') for movement speed and power output, and
that at 50 (revmm J) greater force required greater range of motion (Price eta/.,
2007); whether manipulating power by load rather than cadence has a similar
relationship has not been reported. Incremental ACE studies examining muscle
deoxygenation indicate that the biceps brachii had the greatest decrease in
muscle oxygenation (Lusina eta/., 2008). With EMG studies indicating at sub-
maximal loads that the biceps and triceps brachii show increased activation at
greater loads (Smith eta/., 2008, Frauendorf et a/., 1989, Mossberg eta/.,
1999). A number of such studies have made recommendations for further
research regarding contributions/limitations to exercise/fatigue due to torso,
back and forearm grip (Bernasconi et a/., 2006, Smith et a/., 2008, Schneider et
a/., 2002, Koppo et a/., 2002, Stamford eta/., 1978, Shiomi eta/., 2000, Koga et
a/., 1996). However, these recommendations remain unreported in the literature
and along with the biceps and triceps brachii require further research to establish
biomechanical responses at high intensity exercise, as this may have implications
for training and testing in sport, exercise and health.
Examining the physiological and biomechanical responses to continuous upper
body exercise at fixed exercise intensities and cadence would allow the
examination of fatigue from a different perspective than the WAnT. In contrast
to the WAnT, where cadence and peak power change during a 30 s period, such
continuous exercise tests are open ended with cadence controlled so that power
output is maintained, this may help reduce the effect of a pre performance
pacing strategy where the participant can control the power output and energy
expenditure (Baron eta/., 2011, Mauger eta/., 2010). The relationships
between performance from physiological and biomechanical perspectives might
subsequently differ between the WAnT and continuous work test. Therefore, the
aim of this study was to examine the relationship between physiological and
biomechanical variables in relation to performance during exercise at a range of
exercise intensities. To enable direct comparison across exercise intensities,
time points of 30 s, 120 s and the time point at exhaustion (T,im) were chosen.
The 30 s time point provides data about early responses to the intensities and
the 120 s time point providing data prior to Tlim without, hopefully, T„m being
achieved. The time point at exhaustion (Tllm) provides data at the cessation of the exercise.
5.2
5.2.1Method
Participants
Fourteen participants (age 21.1 ± 6.1 years, mass = 74.3 ± 12.0 kg, height =
1.77 ± 0.12 m) volunteered to take part in this study. Participants had no
previous arm crank ergometry experience and did not regularly participate or
train in, or for, upper body sport or exercise. A minimum of 48-h separated
experimental tests, which were performed within ± l-h of the time of day of the
initial test. Furthermore, participants were instructed not to conduct new
training, or any vigorous training at least 48-h prior to each test. All tests were
conducted in the same laboratory with the temperature between 20 ± 1°C. The
University s Post Graduate Research Ethics Committee approved all experimental procedures (Appendix 1).
5.2.2 Exercise protocol
2peak
Participants completed a V02peai< test to volitional exhaustion (Section 3.3.2)
Prior to this test all participants undertook the same exercise protocol for
familiarisation (Section 3.3.2). Therefore, all participants completed two VO
tests prior to the continuous work tests (CWT). Each participant's peak minute
power (PMP) was calculated as described in section 3.2.2.i. Subsequent to the
main V02peak test, participants completed four high intensity continuous work
tests to volitional exhaustion on an arm crank ergometer. The four CWTs were
conducted at 80%, 90%, 100% and 110% of PMP. To avoid selection bias in
testing each test was allocated using a 4 x 4 x 4 Latin square design. Oxygen
uptake (V02), respiratory exchange ratio (RER), and heart rate (beats-min-1; HR)
were continuously recorded for each test (Section 3.4.2). Rating of perceived
exertion, local (RPEL; arms) and cardiorespiratory (RPEcr) were recorded in the
last 20 s of the first minute of exercise and the last 20 s thereafter of each
incremental stage. Time to exhaustion (T!im) was recorded as the performance
outcome measure.
96
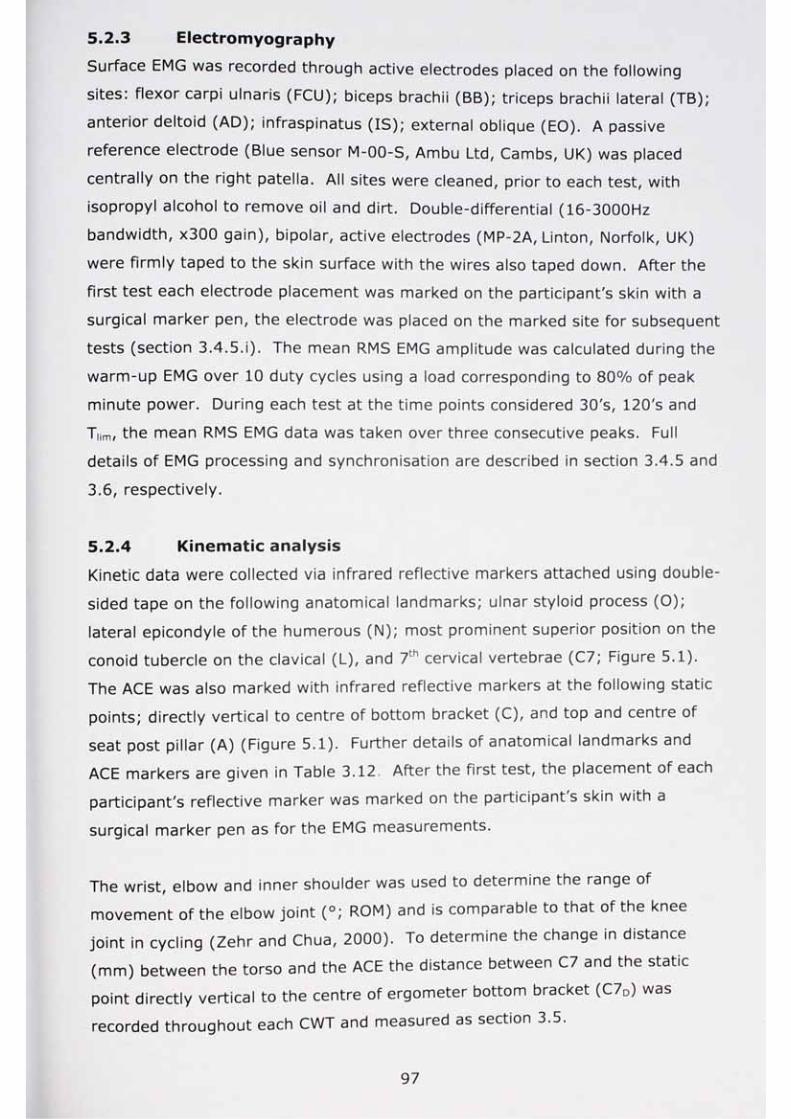
5.2.3 Electromyography
Surface EMG was recorded through active electrodes placed on the following
sites: flexor carpi ulnaris (FCU); biceps brachii (BB); triceps brachii lateral (TB);
anterior deltoid (AD); infraspinatus (IS); external oblique (EO). A passive
reference electrode (Blue sensor M-OO-S, Ambu Ltd, Cambs, UK) was placed
centrally on the right patella. All sites were cleaned, prior to each test, with
isopropyl alcohol to remove oil and dirt. Double-differential (16-3000Hz
bandwidth, x300 gain), bipolar, active electrodes (MP-2A, Linton, Norfolk, UK)
were firmly taped to the skin surface with the wires also taped down. After the
first test each electrode placement was marked on the participant's skin with a
surgical marker pen, the electrode was placed on the marked site for subsequent
tests (section 3.4.5.i). The mean RMS EMG amplitude was calculated during the
warm-up EMG over 10 duty cycles using a load corresponding to 80% of peak
minute power. During each test at the time points considered 30's, 120's and
Thm, the mean RMS EMG data was taken over three consecutive peaks. Full
details of EMG processing and synchronisation are described in section 3.4.5 and
3.6, respectively.
5.2.4 Kinematic analysis
Kinetic data were collected via infrared reflective markers attached using double-
sided tape on the following anatomical landmarks; ulnar styloid process (O);
lateral epicondyle of the humerous (N); most prominent superior position on the
conoid tubercle on the clavical (L), and 7th cervical vertebrae (C7; Figure 5.1).
The ACE was also marked with infrared reflective markers at the following static
points; directly vertical to centre of bottom bracket (C), and top and centre of
seat post pillar (A) (Figure 5.1). Further details of anatomical landmarks and
ACE markers are given in Table 3.12 After the first test, the placement of each
participant's reflective marker was marked on the participant s skin with a
surgical marker pen as for the EMG measurements.
The wrist, elbow and inner shoulder was used to determine the range of
movement of the elbow joint (°; ROM) and is comparable to that of the knee
joint in cycling (Zehr and Chua, 2000). To determine the change in distance
(mm) between the torso and the ACE the distance between C7 and the static
point directly vertical to the centre of ergometer bottom bracket (C70) was
recorded throughout each CWT and measured as section 3.5.
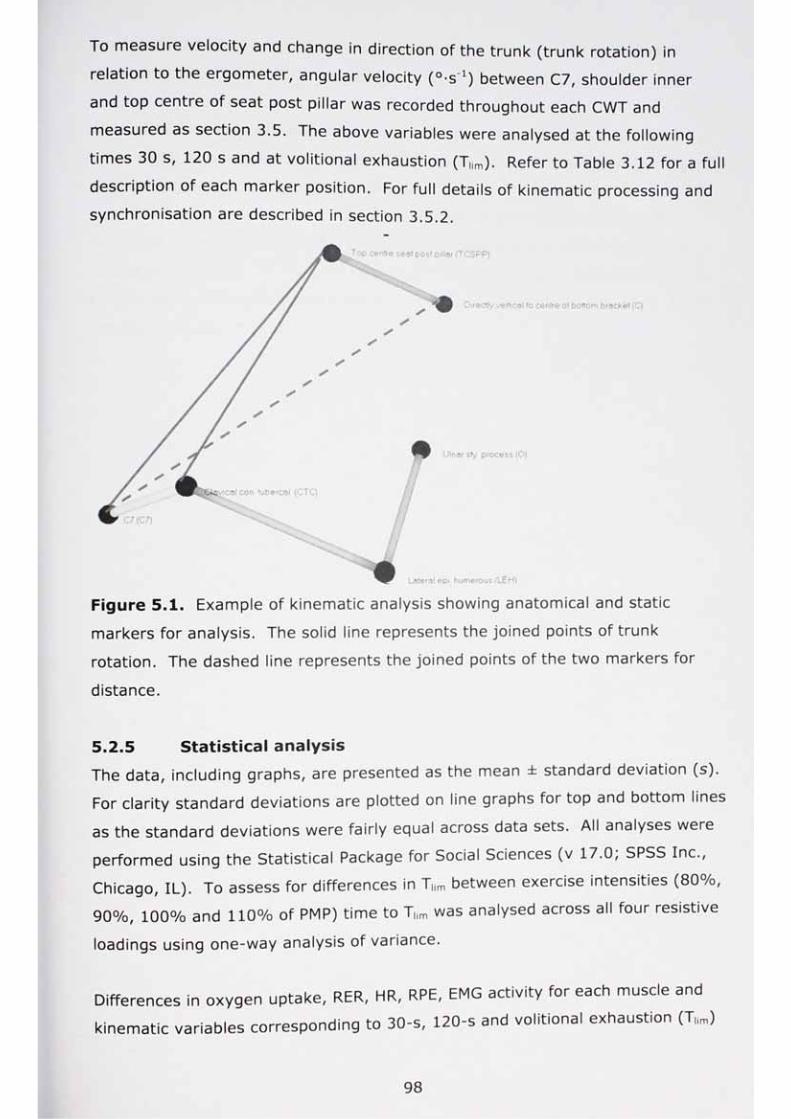
To measure velocity and change in direction of the trunk (trunk rotation) in
relation to the ergometer, angular velocity (°-s_1) between C7, shoulder inner
and top centre of seat post pillar was recorded throughout each CWT and
measured as section 3.5. The above variables were analysed at the following
times 30 s, 120 s and at volitional exhaustion (T|jm). Refer to Table 3.12 for a full
description of each marker position. For full details of kinematic processing and
synchronisation are described in section 3.5.2.
Figure 5.1. Example of kinematic analysis showing anatomical and static
markers for analysis. The solid line represents the joined points of trunk
rotation. The dashed line represents the joined points of the two markers for
distance.
5.2.5 Statistical analysisThe data, including graphs, are presented as the mean ± standard deviation (s).
For clarity standard deviations are plotted on line graphs for top and bottom lines
as the standard deviations were fairly equal across data sets. All analyses were
performed using the Statistical Package for Social Sciences (v 17.0, SPSS Inc.,
Chicago, IL). To assess for differences in Tnm between exercise intensities (80%,
90%, 100% and 110% of PMP) time to TMm was analysed across all four resistive
loadings using one-way analysis of variance.
Differences in oxygen uptake, RER, HR, RPE, EMG activity for each muscle and
kinematic variables corresponding to 30-s, 120-s and volitional exhaustion <Tlim)
were analysed using separate two-way analysis of variance with repeated measures on both factors (trial x time).
Where SPSS presented P values of P = 0.000 these are reported as P < 0.001.
When there were multiple comparisons for performance indices for physiological
responses (section 5.3.3), rating of perceived exertion (section 5.3.4),
e lectrom yography responses (5.3.5) and kinematic analysis (section 5.3.5)
individual differences between means were located using Bonferroni post-hoc
correction. To interpret the true meaningfulness of the data, test-retest time to
exhaustion for the continuous work test duration (as discussed in section 3.3.3)
has been included in the discussion.
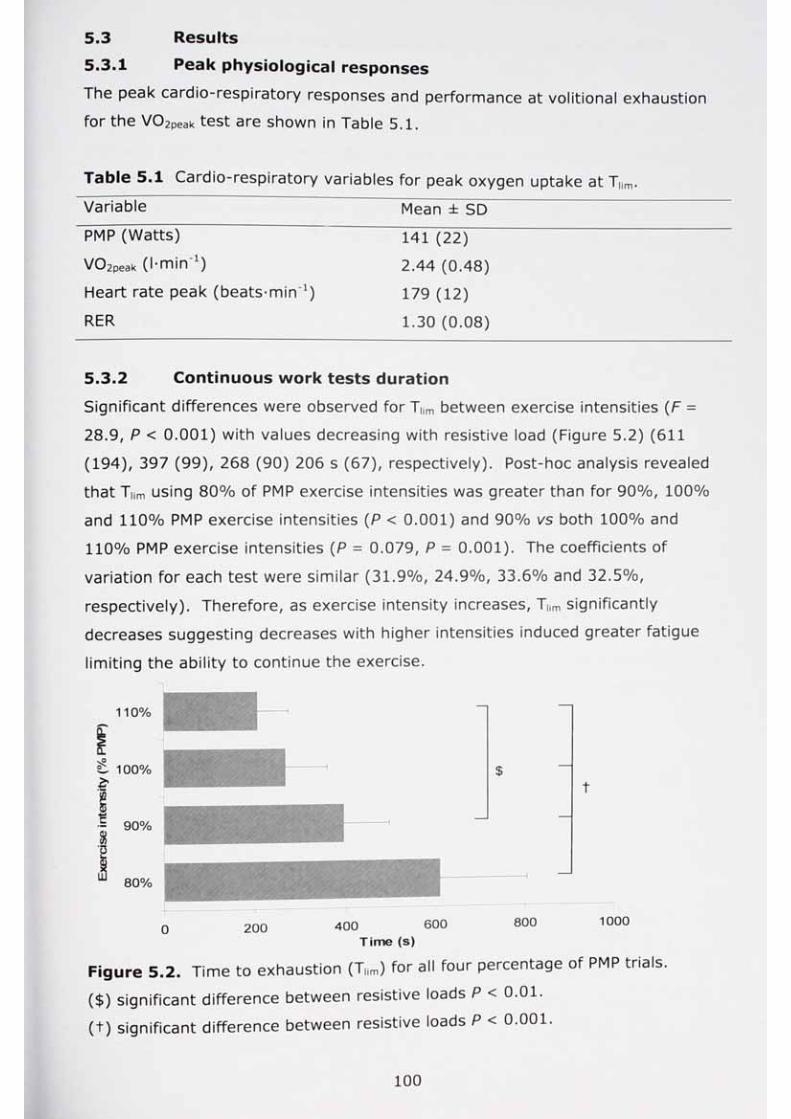
5.3 Results
5.3.1 Peak physiological responses
The peak card io-respiratory responses and performance at volitional exhaustion for the V 0 2peak test are shown in Table 5.1.
Table 5.1 Card io-resp iratory variables for peak oxygen uptake at T|jm.Variable Mean ± SDPMP (Watts) 141 (22)V 0 2peak (l-m in '1) 2.44 (0.48)Heart rate peak (beats^min-1) 179 (12)
R E R 1.30 (0.08)
5.3.2 Continuous work tests duration
Significant differences were observed for TMm between exercise intensities (F =
28.9, P < 0.001) with values decreasing with resistive load (Figure 5.2) (611
(194), 397 (99), 268 (90) 206 s (67), respectively). Post-hoc analysis revealed
that Turn using 80% of PMP exercise intensities was greater than for 90%, 100%
and 110% PMP exercise intensities (P < 0.001) and 90% vs both 100% and
110% PMP exercise intensities (P = 0.079, P = 0.001). The coefficients of
variation for each test were sim ilar (31.9%, 24.9%, 33.6% and 32.5%,
respectively). Therefore, as exercise intensity increases, T|im significantly
decreases suggesting decreases with higher intensities induced greater fatigue
lim iting the ability to continue the exercise.
T im e (s)
Figure 5.2. Time to exhaustion (T|irn) for all four percentage of PMP trials.
($) significant difference between resistive loads P < 0.01.
( t) significant difference between resistive loads P < 0.001.
100
5.3.3 Physiological response during the continuous work tests5.3.3.i Oxygen uptake
There was a significant difference observed for oxygen uptake (F = 7.524, P <
0.001). Post-hoc analysis revealed that values at 120 s increased with exercise
intensity (Table 5.2). Post-hoc analysis revealed that oxygen uptake using 80%
of PMP was less than for both the 100% and 110% PMP at 120 s (P = 0.001).
No differences for oxygen uptake were observed for PMP exercise intensities at
30 s and T|im. There was a significant difference for oxygen uptake and peak
oxygen uptake (F = 4.832, P = 0.002). Post-hoc analysis revealed that oxygen
uptake using 80% of PMP was significantly different from peak oxygen uptake (P
= 0.013).
5.3.3.M Respiratory exchange ratio
Significant differences were observed between RERs at 120 s (F = 11.099, P <
0.001) with values increasing with exercise intensities (Table 5.2). Post-hoc
analysis revealed that RER using 80% of PMP exercise intensities was less than
for both, 100% and 110% PMP (P = 0.02, P < 0.001) and 90% vs 110% PMP (P
= 0.002). S ign ificant differences between exercise intensities were also
observed for TMm (F = 25.286, P < 0.001) with values increasing with exercise
intensities. S ign ificant difference were observed between the exercise intensities
at 80% vs 90%, 100% and 110% of PMP (P = 0.007, P < 0.001, P < 0.001,
respectively) and 90% vs both 100% and 110% (P = 0.013, P < 0.001,
respectively). No differences for RER were observed for exercise intensities at 30
s. Therefore, as exercise intensity increases RER also increases suggesting that
greater exercise intensities induce a greater RER.
101

Table 5 2 Mean oxygen consumption, respiratory exchange ratio and heart rate during the each continuous work test (mean ± SD).X/^ri^hlp niv/ir»
i — ^ y •
v u i ia uic p[Vj u 30 s 120 s Exhaustionv u 2 (l-min ) 80% 1.04 (0.33) 1.66 (0.23)a 2.10 (0.32)
90% 1.14 (0.17) 1.85 (0.22) 2.29 (0.37)100% 1.25 (0.23) 2.07 (0.33) 2.33 (0.49)110% 1.28 (0.20) 2.06 (0.28) 2.26 (0.34)
RER 80% 1.07 (0.10) 1.21 (0.07)a 1.15 (0.07)c90% 1.05 (0.10) 1.26 (0.08)b 1.26 (0.07)a100% 0.98 (0.11) 1.33 (0.09) 1.36 (0.10)110%
i m • - 1 \
1.03 (0.11) 1.38 (0.09) 1.40 (0.09)HR (beats-m in *) 80% 119 (13) 139 (13)a 174 (11)
90% 115(14) 142 (16)b 171 (17)100% 118 (11) 152 (12) 174 (11)110% 127 (14) 164 (9) 175 (10)
. S ign ificantly d ifferent from
b. significantly d ifferent from100% and 110% peak minute power.
110% peak minute power.c. S ign ificantly d ifferent from 90%, 100% and 110% peak minute power.
5.3.3.iii Heart rate
A significant difference was observed for heart rate (F = 10.650, P < 0.001).
Post-hoc analysis revealed that HR rate increased with exercise intensities at
120 s (Table 5.2). Post-hoc analysis revealed that heart rate using 80% of PMP
was less than for both the 100% and 110% exercise intensities (P = 0.055, P <
0.001 respectively) and 90% vs 110% PMP (P < 0.001). No differences for HR
were observed for exercise intensities at 30 s and T,im. Therefore, the HR
response to exercise intensity is the same at 30 s and fatigue at TMm, however
the results suggested that exercise intensity affects HR at 120 s with a lower HR
at lower intensities which suggested a different HR response to fatigue prior to
T | in v
5.3.4 Rating of perceived exertion
5.3.4.i Local fatigue
A significant interaction was observed for RPEL (F = 7.767, P < 0.001). Post-hoc
analysis revealed that RPEL increased with exercise intensities at 120 s. Post-hoc
analysis revealed that RPEL using 80% of PMP was less than for both 100% and
102
110% PMP (P 0-75, P < 0.001 respectively) and 90% vs 110% PMP (P = 0.010). No differences for RPE l were observed for exercise intensities at 30and Tlim
5.3.4.ii Cardiorespiratory fatigue
A significant interaction was observed for RPE,, (F = 5.682, P = 0.002). Post-
hoc analysis revealed that PPE„„ increased with exercise intensities at 120 s.
Post-hoc analysis revealed that R P E „ at 80% of PMP was less than for 110%
PMP (P - 0.002) and 90% vs 110% PMP (P = 0.025). No differences for r p e cr
were observed for PMP exercise intensities at 30 s and T,lm. Therefore, RPEt and
RPEcr reflect the different exercise intensities at 120 s but not at 30 s and T„m,
this suggested that greater exercise intensities induced greater RPEs at 120 s.
5.3.5 Electrom yography responses
Electromyographic activation was measured for each muscle at 30 s, 120 s and
Thm. For biceps brachii there were differences in peak EMG activity between PMP
exercise intensities (F = 8.276, P < 0.001) and time (F = 20.808, P < 0.001).
Post-hoc testing for PMP exercise intensities revealed significantly less activation
between 80% vs both 100% and 110% (P = 0.015, P < 0.001, respectively) and
90% vs 110% (P = 0.027) (Figure 5.3a). Differences in time were observed between 30 s and both 120 s and T,im (P < 0.001).
For triceps brachii there were differences between PMP exercise intensities (F =
10.135, P < 0.001) and time (F = 23.205, P < 0.001). Post-hoc testing for PMP
exercise intensities revealed significant differences between 80% and both 100%
and 110% (P = 0.001, P < 0.001, respectively) and 90% vs 110% (P = 0.006)
(Figure 5.3b). D ifferences in time were observed between time at 30 s vs both
120 s and T,im (P < 0.001 all) and 120 s vs Tlim (P = 0.019).
There was a significant difference for flexor carpi ulnaris between PMP exercise
intensities (F - 6.099, P = 0.001) and time (F = 15.273, P < 0.001), with post-
hoc testing revealing a significance between PMP exercise intensities of 80% vs
both 100% and 110% (P = 0.004, P = 0.0053, respectively), 90% vs 100% (P =
0.008) and approaching significance for 90% vs 110% (P = 0.092) (Figure 5.3c)
Time was significant at 30 s vs both 120 s and T|im (P = 0.002, P < 0.001,
respectively).
103
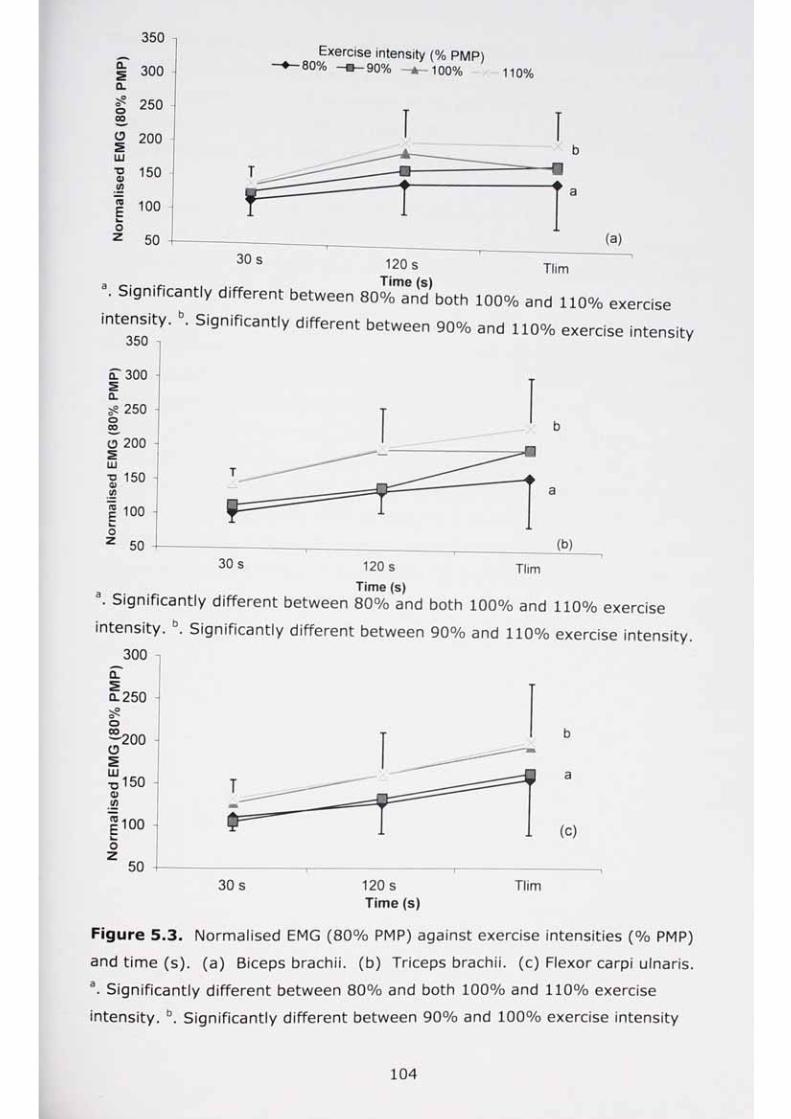
■O0in
• tmm
nE
a <-• ... Time (s). S ign ificantly d ifferent between 80% and both 100% and 110% exercise
intensity. b. S ign ificantly different between 90% and 110% exercise intensity350 -> 7
ST 300Q.5 250o
C CO
0 200L U"O0in•
T O
E
150
100
5030 s 120 s
Time (s)Him
a. S ign ificantly different between 80% and both 100% and 110% exercise
intensity. b. S ign ificantly different between 90% and 110% exercise intensity.
30 s 120 s Time (s)
Tlim
Figure 5.3. Normalised EMG (80% PMP) against exercise intensities (% PMP)
and time (s). (a) Biceps brachii. (b) Triceps brachii. (c) Flexor carpi ulnaris.
a. S ignificantly different between 80% and both 100% and 110% exercise
intensity. b. S ignificantly different between 90% and 100% exercise intensity
104

'° r de 't0ld Was s '9nificantly different between PMP exercise intensities ( - ■ 10, P < 0.001) and time (F = 20.892, P < 0.001) with post-hoc testing
in ica mg significance at 80% us both 100% and 110% (P = 0.011, P = 0.022
respectively), and tim e at 30 s vs both 120 s and Tllm (P = 0 .012 and P < 0 001 respectively) and 120 s vs Tlim (P = 0 .002) (Figure 5.4d).
There was a significant difference for infraspinatus for PMP exercise intensities (F
= 5 A 3 7 ' P = °-001) a "d time (F = 24.144, P < 0.001), with post-hoc testing indicating significance at 80% vs both 100% and 110% (P = 0.007, P = 0.004,
respectively). Time was significant at 30 s vs both 120 s and Tlim (P < 0.001)
and approaching significance at 120 s vs Tlim (P = 0.078) (Figure 5.4e).
The external oblique demonstrated a significant difference for PMP exercise
intensities (F = 14.871, P < 0.001) and time (F = 20.508, P < 0.001). Post-hoc
testing indicated significance at 80% vs 90%, 100% and 110% (P = 0.005, P =
0.017, P < 0.001 respectively), 90% vs 110% (P = 0.009) and 100% vs 110%
(P = 0.002). Time was also was also significant at 30 s vs both 120 s and Tlim (P
< 0.001) (Figure 5.4f). Therefore, regardless of the exercise intensity as the
exercise duration increased EMG activation also increases suggesting that
duration increases fatigue. In addition, differences observed at 80% and 90%
against 100% and 110% exercise intensity demonstrated that greater exercise intensities induce greater EMG activity.
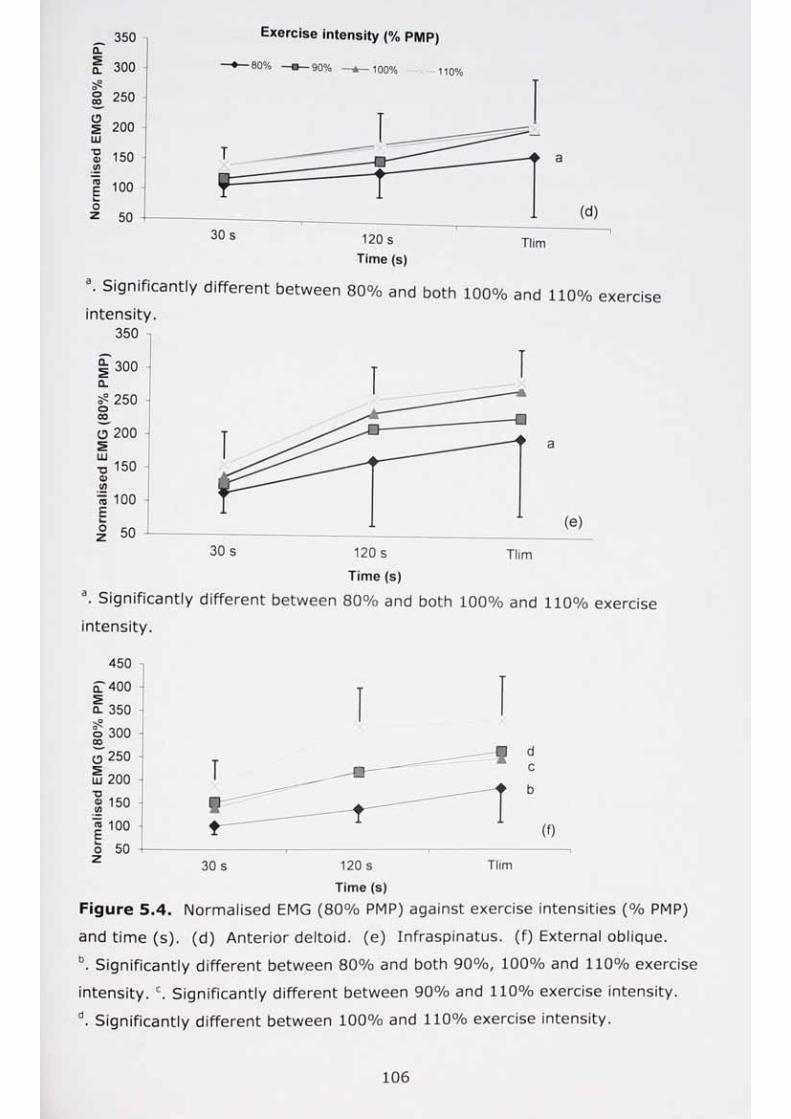
. S ign ificantly d ifferent between 80% and both 100% and 110% exerciseintensity.
350
300Q.Q.^ 250o00o 200L U■o 1 5 0 -|o (/) 100
E50
30 s 120 s Time (s)
Tlim
a. S ign ificantly different between 80% and both 100% and 110% exercise intensity.
Time (s)
Figure 5.4. Normalised EMG (80% PMP) against exercise intensities (% PMP)
and time (s). (d) Anterior deltoid, (e) Infraspinatus, (f) External oblique.
b. S ignificantly different between 80% and both 90%, 100% and 110% exercise
intensity. c. S ignificantly different between 90% and 110% exercise intensity.
d. S ignificantly different between 100% and 110% exercise intensity.
106

5.3.6 Kinematic analysisNo interactions between timp anH hrirai » * uLwKen time and trial were observed for any of the kinematicvariables measured. Main efforts fnr h t-h � , , . ,
c l s tor both time and trial were observed for timeand resistive load.
There were significant differences for elbow joint ROM (°) between time (F =
6.149, P = 0.003) with values decreasing over time. Post-hoc testing indicating
significance at 30 s vs both 120 s and T,im (P = 0.032, P = 0.003, respectively)
(Figure 5.5). There were no significant differences for elbow ROM (°) between
PM? exercise intensities. Therefore, the results suggest that exercise duration
affects elbow ROM at 120 s. However, at Tlim elbow ROM is similarity affects by
fatigue regardless of the duration or intensity.
30 sTime (s)
120 s Tlim0
o -2
U)c -4CO
-6cO
t-8
5o - 1 0
n
0) - 1 2
c• H i -14CDU) -16cCO
-18O
- 2 0Exercise intensity (% PMP)
80% 90% 100% -X -110%
Figure 5.5. Changes in elbow joint angle (°) at all four exercise intensities (%
PMP) from 30 s.
a. Significantly different between 30 s and both 120 s and T|im 110% exercise
intensity.
There was a significant difference observed for trunk rotation measured as
angular velocity (°-s1) between PMP exercise intensities (F = 5.217, P < 0.001)
Post-hoc testing revealed significance was approached between 80% vs 90%,
100% and 110% PMP exercise intensities (P = 0.054, P = 0.055, P = 0.010,
respectively). Time was significant between 30 s vs both 120 s and TMrn (P <
0.001 all) and approaching significance for 120 s vs T„m (P = 0.070) with trunk
107
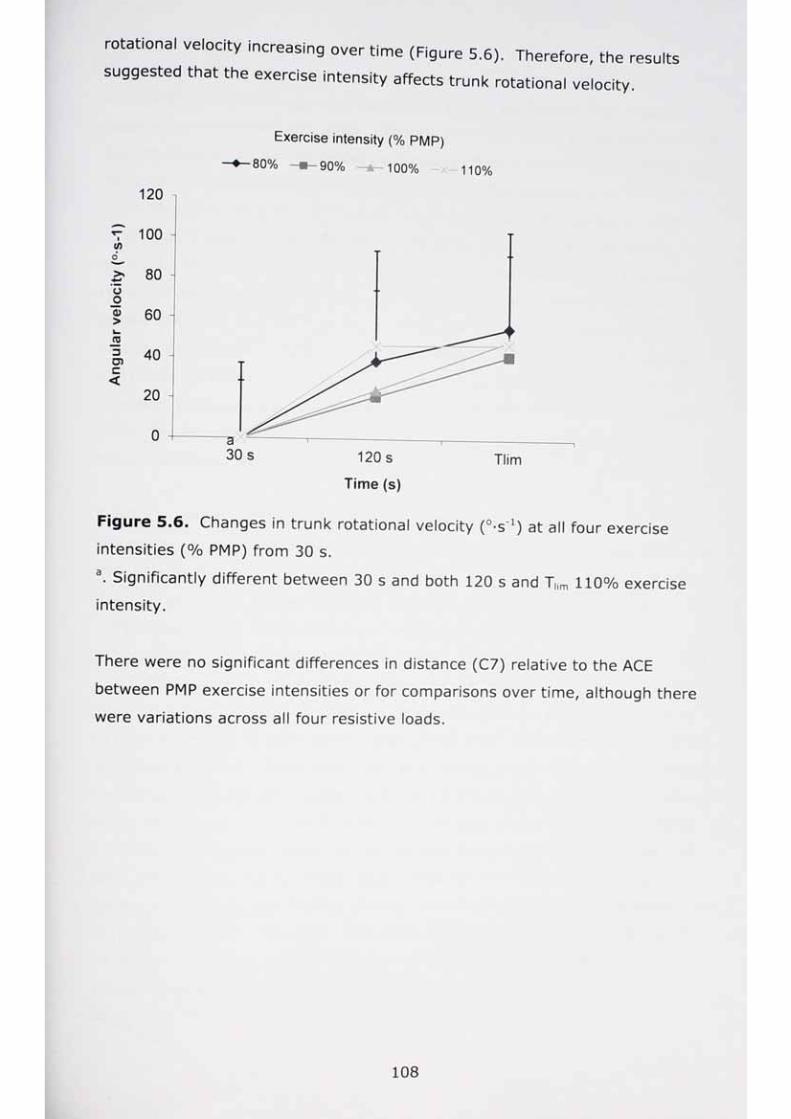
rotational velocity increasing overtime (Figure 5.6). Therefore, the results
suggested that the exercise intensity affects trunk rotational velocity.
■w
oo0)>
3U)c<
120
100
80
60
40
20
0
Exercise intensity (% PMP)
80% 90% 100% 11 o%
30 s 120 s
Time (s)
Tlim
Figure 5.6. Changes in trunk rotational velocity (0-s_1) at all four exercise
intensities (% PMP) from 30 s.
a. Significantly different between 30 s and both 120 s and T„m 110% exercise
intensity.
There were no significant differences in distance (C7) relative to the ACE
between PMP exercise intensities or for comparisons over time, although there
were variations across all four resistive loads.
108
Discussion
The primary aim of this study was to examine the interaction between
physiological and biomechanical parameters during continuous high intensity
upper body exercise to exhaustion. The study aimed to add to the findings from
the first study by exploring similar parameters (EMG and kinematics) along with
the addition of respiratory measure to provide further analysis of ACE over a
longer duration. As participants were required to maintain a constant cadence of70 rev-min ' power outPut (w ) was manipulated by load which was kept
constant. Therefore, unlike the Wingate anaerobic test participants are only in
control of the duration of the exercise. The main findings were that oxygen
uptake and heart rate were similar at exhaustion whereas the respiratory
exchange ratio data suggested different contributions of anaerobic metabolism
and therefore different underlying physiological responses. The EMG activity
increased over time and was greater for the 100% and 110% V02peak intensity
trials. The kinematic data suggested that trunk rotation velocity rather than
trunk stabilisation occurred throughout each exercise test.
5.4.1 Peak oxygen uptake tests and peak heart rates
Values of peak oxygen uptake (l-min1) were similar to the range reported in the
literature for non-active or recreationally active participants (1.58-2.89 l-min"
(Davis et al., 1976; Jensen-Urstad et al., 1993; Kang et at., 2004; Magel et al.,
1978; Sawka et al., 1983; Washburn and Seals, 1984; Yasuda et al., 2006)
(Ahlborg and Jensen-Urstad, 1991; Kang et al., 1997; Koga eta/., 1996; Lusina
etal., 2008; Swensen eta/., 1993; Warren eta/., 1990). However, values were
lower than for peak oxygen uptake for physically active or trained participants
(2.92-3.36 l-min1) (Jensen-Urstad, 1992; Price eta/., 2007; Smith eta/., 2006;
Warren eta/., 1990). Peak heart rates were within the median range reported in
the literature HR 166-184 (Castro eta/., 2010; Davis eta/., 1976; Jensen-Urstad
et al., 1993; Kang et al., 1997; Price and Campbell, 1997; Smith et al., 2001).
Interestingly it appears that HRmax for the peak oxygen uptake test equals 200 -
age. It is possible that a criteria maker of the achievement of peak oxygen
uptake, in untrained participants, during incremental ACE to volitional exhaustion
is 200 (beats-min1) minus age. The mean HR reported at peak oxygen uptake
for ACE in Table 2.1 is 180 (6) which also indicated that 200 - age is
appropriate, although for lower limb ergometry the mean values reported are
187 (4).
109
5.4.2 Continuous work tests duration
The Ti,m at 100 /o PMP is within the values found for kayakers (239-289 s- Billat
eta!., 1996, Leveque eta,., 2002) and swimmers (243-286 s; Billat eta,., 1996,
Fernandes et a/., 2008a) at 100% of PMP. The Tllm at 110% PMP was greater
than values found for arm cranking at this intensity (114 (SD 12); (Weissland et
a,., 1999), however participant were not fully rested prior to this test. There was
a decreased in Tlim across exercise intensities with particular differences between
80% and 90% and both 100% and 110% V02peak intensities. The Tlim for the
different intensities are all much greater than the daily biological variation of 12 s
for 110% PMP and 41 s for 80% PMP (section 3.3.3) and therefore are a good
indication of performance duration. There was a clear response of duration and
intensity as to be expected in lower body exercise (Morton and Hodgson, 1996,
Hill et a,., 2002). In addition, the selection of the load (kg) applied needs to be
accurate as the difference between each load is only 14 W which could easy
affect the duration of the exercise. Despite the significant difference in Thm
across loads, from 611.2 ± 194.6 s for 80% to 206.4 ± 66.6 s for 110% PMP,
oxygen uptake across all four PMP exercise intensities was not significant.
5.4.3
5.4.3.iPhysiological response during the continuous work tests
Oxygen uptake
Although there was no significant difference between oxygen uptake at PMP
when compared to V02peak, the significant difference between 80% PMP and
V02peak (90% of V02peak) indicates that this exercise intensity is not sufficient to
achieve V02peak before fatigue results in the cessation of exercise and likewise the
110% PMP intensity (94% of V02peak) was too intense to achieve V02peak.
Additionally, test-retest reliability data from section 3.3.2.iii indicated that
oxygen uptake at 80% and 110% PMP was lower than the expected variation
(0.07 l-min'1) between tests. Further analysis of percentage of PMP compared to
V02peak indicates that 90% and 100% PMP (both 97% of V02peak) was within the
3% variance in V02 to indicate that V02peak was achieved (Bird and Davison,
1997). The exercise intensities used were within the severe exercise domain
seen in leg cycling (Caputo and Denadai, 2008) and for 110% PMP it is likely that
the intensity resulted in cessation of exercise (TMm; 206 s) before there could be
a sufficient increase in V02 and may be too short for the slow component of V02
to have a maximal effect (Hill and Rowell, 1996, Gastin, 2001, Xu and Rhodes,
1999). The 80% PMP intensity may be sufficient for the attainment of V02peak
110
but before this can be achieved fatigue factors such as perceptions of fatigue
(Kang et at., 1998, Taylor et at., 2000) stop the exercise. Research indicates
that 92% PMP below 100% takes longer to achieve V02peakthan exercise at 100%
PMP (491 against 299 s) (Hill et a/., 1997). These results suggest that the
optimal exercise intensity for continuous high intensity exercise to volitional
exhaustion was between 90% and 100% of peak minute power.
The significant difference detected at 80% PMP compared with 100% and 110%
PMP at 120 s is also in agreement with previous research indicating that phase 2
V02 kinetics occur at around 120 s (Jensen-Urstad eta/., 1993; Koga eta/.,
1996). This is the first time that this has been reported for a continuous high
intensity exercise study i.e. that phase 2 V02 kinetics occurred at the time point
of 120 s. Although 120 s still indicated that this was the point of phase 2 oxygen
kinetics, additionally this may represent faster and slower kinetics for each
exercise intensity as the exponential increase is meant to be the same in each
person regardless of the intensity. The kinetic response therefore is dependent
on exercise intensity. However, lower intensities simply take longer to get to V02peak via the slow component.
5.4.3.N Respiratory exchange ratio
The RER values at V02peak were similar to those previously reported at 1.31-1.35
(Castro et at., 2010) although they were slightly higher than reported by other
authors (1.12-1.23) who have examined prolonged aerobic exercise (Kang eta/.,
1997; Price and Campbell, 1997; Price eta/., 2007; Smith eta/., 2001;
Washburn and Seals, 1983; Yasuda et a/., 2006). Values of RER differed
significantly between trials at 120 s and TMm between lower exercise intensities
(80% and 90% PMP) and higher exercise intensities (100% and 110% PMP).
The higher RER values would indicate that participants were working more
anaerobically and utilising a greater proportion of carbohydrate metabolism
(Jensen-Urstad et at., 1993; Jensen-Urstad, 1992) than at lower exercise
intensities. The RER can reflect changes in muscle pH and greater bicarbonate
buffering of lactate acid (Casaburi et at., 1992), and the greater recruitment of
type II muscle fibres (Schneider et at., 2002) which would also be consistent with
a greater reliance on carbohydrate metabolism (Ahlborg and Jensen-Urstad,
1991). During the 80% trial there was a decrease in RER from 120 s to T„m (1.21
to 1.15 respectively). The reduction in RER could be linked to muscle
reoxygenation (following deoxygenation) seen during the later stage ACE
exercise of 15 mm total duration (Jensen-Urstad eta/., 1995) although the
mechanism for this change remains unexplained (Bhambhani, 2004). Whatever
the mechanism the final RER value was still indicative of anaerobic metabolism.
Therefore, although at Tlim all the exercise intensities, indicated by the RER, have
an increased activation of the anaerobic metabolism, the greater exercise
intensities (100% and 110% PMP) appear to have a greater anaerobic
component. This could be due to the greater resistance which results in an
increased activation of type II fibres types (Koppo etal., 2002, Bernasconi eta/.,
2006), which would work more anaerobically than type I fibres and may be less
efficient (Coyle eta/., 1992). The type II anaerobic glycolysis could utilise more
carbohydrate through greater use of muscle glycogen resulting in a higher lactate
acid release (Ahlborg and Jensen-Urstad, 1991) and the buffering of the by-
product (C02) results in an increased RER and as oxygen uptake was relatively
similar at TNm it may be that the anaerobic metabolism was limiting the exercise
duration and not oxygen uptake.
5.4.4 Electromyography responses
The measurements of EMG activation indicated that there were significant
increases in EMG amplitude for all muscles from 30 s to both 120 s and volitional
exhaustion. The load corresponding to 110% PMP distinguished between the
other loads, with the greatest amount of activation for all sites. The EMG values
increased over time for all exercise intensities, given that power output was
constant, then the greater muscular activity/effort for the same workload is likely
the result of fatigue (Kamen and Gabriel, 2010). This is in contrast to the EMG
response found in study one where the EMG values increased with a decrease in
power output. Therefore, changes in movement patterns might change activity
to maintain power, with changes in joint angle additionally affecting EMG activity
(Kamen and Gabriel, 2010).
A constant increase in EMG activity for the biceps brachii, triceps brachii, anterior
deltoid and infraspinatus during constant but high intensity exercise (40%
between ventilatory threshold and V02peak) has previously been shown to
increase with duration of the exercise (Bernasconi et al., 2006). This response
suggested that an increase in muscle fibre recruitment is required to maintain
power output. Previously unreported is the finding that this recruitment is
dependent on load, and that activation at 100% and 110% of PMP was
significantly greater than activation at 80% and 90% of PMP. This increase in
EMG activation was seen in the significant increases in RER at 120 s and T
exercise intensities at 100% and 110%. Whether this recruitment pattern
changes with training or is typical for all types of participants needs further
investigation (Bernasconi et a/., 2006). Data from study one were indicative that
for the Wingate anaerobic test (WAnT) the bicep brachii muscle is an important
contributor to power out reflect an increase in EMG activating as resistive load
(% BM) increased while other muscles indicated limited increases in activity
across resistive loads. For the exercise intensities examined in the present study
the biceps and triceps brachii showed an equal amount of activation. These
results supported previous research at a variety of exercise intensities: 50 W and
100 W (Smith eta/., 2008) and 30 W, 60 W, 90 W and maximal exercise
(Hopman eta/., 1995). Therefore, the current results add to previous work in
that this pattern of activation is similar across a range of submaximal to maximal
exercise intensities which have not been previously reported.
Flexor carpi ulnaris demonstrated significant differences in activation between
exercise intensities of 80% and 90% when compared to 100% and 110% of PMP,
with no significance between 100% and 110% of PMP this could indicate that the
limitation of forearm muscle activity and grip endurance has been reached.
Previous research has suggested flexor carpi ulnaris muscle activation increased
with load at submaximal intensities (Frauendorf et at., 1986) and that handgrip
was an important component during heavy-intensity ACE (Smith et at., 2006c).
It has been suggested that increased forearm grip contributes to fatigue during
ACE by reducing skeletal muscle pump activity and venous return (Koga et al.,
1996, Sawka, 1986) although it does not appear to affect performance during
incremental ACE to exhaustion (Hooker and Wells, 1991). The RPEL values being
higher than RPEcr suggest that exercise duration is limited by peripheral rather
than cardiorespiratory fatigue, with EMG analysis substantiating anecdotal
evidence from a number of participants that fatigue of forearms was one of the
reasons for stopping the exercise. A number of studies have suggested that local
rather than peripheral fatigue limits ACE performance (Sawka, 1986, Franklin,
1985) and gripping during ACE may increase perceptions of fatigue (Hooker and
Wells, 1991).
113
Study
One of the key findings was that the external oblique muscle had significant
increases ,n activation across all loads. Whether the increase in activation was
linked to the reduction in efficiency associated with using the trunk muscles at
higher loads (Shiomi et a/., 2000) is not clear. The greater power output
required for the higher loads could result in a greater trunk rotational velocity
and activation of the trunk muscle which has been associated with power
production required with a low cadence (50 rev-min1) (Price etal., 2007).
one results also indicated that the external oblique contribute to power
production and also may fatigue at the end of the exercise, although the level of
activation was not the same across all loads as found in this study. Additionally,
increased torso activation may affect breathing frequency, with incremental ACE
studies suggesting that breathing frequency increases with load (Eston and
Brodie, 1986) and is greater for 90 compared to 50 rev-min1 for the same load
(Price eta/., 2007); whether there are changes in breathing frequency from a
constant cadence but variable load and its possible effect on RER would require further investigation.
5.4.5 Kinematic analysis
Elbow ROM decreased across time for all trials suggesting that time rather than
exercise intensity has an effect on elbow ROM. At T|jm there were no differences
in elbow ROM which indicates that fatigue, regardless of intensity, is the main
factor in changes in elbow joint angle. This is the opposite of study 1 where
elbow range of motion for the three greatest loads was greater at the end of
exercise than the start and that elbow ROM may increase, decrease and increase
again at the end of exercise (Figure 4.4). The reduction in elbow joint angle
might still be within the limit found for maximal power production for the bicep
brachii as isometric studies indicate that the joint angle was within the limit of
maximal power production (Doheny et at., 2008). Interestingly this study also
showed that the elbow joint angle is outside the ideal ROM for maximal power
production for triceps brachii, and it may be that similar to study one as T,m
approaches the biceps brachii contributed more to power production. Changes in
joint angle (Figure 5.7) occurred at 120 s, with a distinction between the two
lower (-4° both) and higher loads (-7° both). At 120 s the two higher loads were
50% of T|im, and might indicate that the changes in elbow ROM of motion occur
at a time percentage of T,im between 50% and 30% (the T,im percentage for 120 s
for the 90% PMP). This was the first study to examine changes in elbow ROM
across a variety of high intensity exercise loads, with previous studies only
examining fixed joint angles (participants were restricted in their body
movement) (van Drongelen et a/., 2009, Miller et a/., 2004). This showed that a
fixed elbow joint angle may not be optimal for power production through the full
duration of the exercise i.e. that fatigue changes joint angle. Therefore, for
upper body ACE testing participants could improve performance by changing
their elbow ROM during the exercise rather than adopting a 'fixed' position which
would be more like leg ergometry. Whether elbow ROM differs between trained and untrained participants is unreported.
Similar to study one there were no significant differences detected for torso
distance C7D relative to the ACE. This may be due to a prior familiarisation
session and being correctly positioned relative to the ergometer as indicated by
the literature (Sawka et at., 1983, Sawka, 1986, Washburn and Seals, 1984,
Miller et at., 2004). A further consideration is that changes in C7D had a
significant effect on another parameter in the kinematic chain, such as angular
velocity (discussed below). The angular velocity (“-s'1) measured as trunk
rotation between C7, shoulder inner and top and centre of seat post pillar was
significantly lower between 80% and 90%, 100% and 110% of PMP (114 vs 137,
137, 143 °-sec'1, respectively). The 80% PMP exercise intensity may be a
threshold between this and the higher exercise intensities. The greater loads
representing greater trunk rotational velocity to compensate for fatigue and
therefore activating the external oblique as seen in EMG analysis (section 5.4.3).
This is a novel finding as the general research consensus is that torso
stabilisation contributes to the V02 excess found during high intensity ACE and
not trunk rotational velocity (Casaburi et al., 1992; Franklin, 1985; Miles eta/.,
1989; Stenberg eta/., 1967; Vok acetal., 1975). Overall, in order to maintain
the required power as the time to TMrn approaches, elbow joint angle is reduced
by increasing trunk rotational velocity and torso distance from the ACE.
Therefore, trunk rotational velocity may be an important component in extending
exercise duration in ACE at the intensities studied.
In conclusion, this study found a number of novel findings not previously
reported in the literature. The cardiorespiratory measures indicate that oxygen
uptake at exhaustion was the same/similar regardless of the exercise intensity.
However, test-retest data considering biological variation indicated that 90% and
100% PMP were optima, for oxygen uptake. However significant differences in
RER demonstrated that there were changes in metabolic responses, probably
linked to power output requirements which effects local muscle recruitment and
metabolism, indicating that as power output increases there is a greater reliance
on anaerobic metabolism. The EMG responses showed that the biceps and
triceps brachn provide a similar but increasing level of activation with increases
in load, unlike during the WAnT where the biceps brachii was an important
muscle in power production. Flexor carpi ulnaris distinguished between the two
lower and two upper exercise intensities, and could represent changes in grip
required for the high loads. The role of the external oblique coupled with
changes in angular velocity indicated that they contribute to trunk rotation,
rather than stabilisation that previous studies have suggested. Kinematic data
has, as described, above aided in movement and EMG analysis, especially for thetrunk.
All participants reached their functional cardio respiratory maximum (V02 and
HR). Prior to this, maximum changes in movement pattern and EMG activation
occurred. The results suggested that participants were changing their body
movement to maintain power output and after a certain time point no further
body movement can be made or muscle recruitment achieved (e.g. increase
elbow ROM, external oblique activation). The changes in body movement may
by driven by the increase in RPEL which in untrained participants is limiting
exercise capacity compared to RPEcr (RPEl is greater than RPEcr). A further
study to analyse these fatigue parameters in trained participants would help to
answer a number of outstanding questions.

Chapter 6
and biomechanicaiTesponses to’1!!ia l-T! n t” ^ °9ramme on Physiological.ci responses to high intensity upper body exercise
6.1 Introduction
A number of studies have described the physiological attributes of elite athletes
performing upper body sports (Mygind, 1995, Kounalakis eta!., 2008,
Lutoslawska et a!., 2003, Aziz et a/., 2002) or sports with a significant upper
body component (Neville eta/., 2009). These reports have identified a number
of factors consistent with a higher level of performance, such as a high
peak/maximal oxygen uptake (Neville eta/., 2009), peak anaerobic power output
(Horswill et a/., 1992, Neville et a/., 2009, Kounalakis et a/., 2008) and lactate
threshold (Holmberg et a/., 2007, Jemini eta/., 2006, Volianitis eta/., 2004a).
In addition, studies examining lower body based sports performance have
indicated differences in kinematic responses and EMG recruitment patterns
(Chapman et a/., 2007, Chapman et a/., 2008) in elite athletes when compared
to less well trained participants (Stoggl and Muller, 2009, Sandbakk eta/.,
2010). As these studies have examined populations that were already well
trained it is not clear whether it is the training or the individuals 'inherent' ability
to perform at a higher level that is of key importance (Timmons et a/., 2005).
Few studies have sought to examine the relationship between physiological and
biomechanical responses during upper body exercise. Lower body exercise is
generally reported to be limited centrally by maximal cardiac output (Savard et
a/., 1987, Warren et a/., 1990). In contrast upper body exercise by more local
factors such as regional muscle blood flow (Sawka, 1986), greater use of fast
twitch muscle fibres (Sawka, 1986, Ahlborg and Jensen-Urstad, 1991), greater
isometric component (Stenberg et a/., 1967, Marais et a/., 2002a), lower work
efficiency (Marais eta/., 2002a, Eston and Brodie, 1986, Blasio eta/., 2009) and
a compromised respiratory response (Ramonatxo, 1996, Martin eta/., 1991,
Romagnoli et a/., 2006) differences in the relationship between physiology and
biomechanics might be expected. Despite a number of recommendations from
previous studies (Bernasconi et a/., 2006, Smith et a/., 2008, Yasuda et a/.,
2002), the effects of upper body exercise (arm crank) training on both
117

physiological and biomechanical resDon<;PQ t-n hioh •resPonses to high intensity upper body exercisehave not been reported.
The first two studies of this thesis examined the physiological and biomechanical
responses to upper body exercise across a range of exercise intensities (i.e.
Wingate tests at a variety of resistive loads and constant load exercise to
volitional exhaustion in the severe exercise domain (80%-110% V02peak). The
main findings were that during the Wingate anaerobic test (WAnT) the
electromyographic (EMG) activity at peak power output and at the end of the
test increased with load. Most of the muscles demonstrated greater EMG activity
at the end of the test which could be linked to the fatigue observed during each
test (Hautier et at., 2000). Additionally, for the performance trials in study 2
(Chapter 5) EMG activity was greatest for the 100% and 110% PMP exercise
intensity tests across all time points. The EMG responses were also reflected in
alterations in kinematic responses suggesting that trunk rotational velocity
increased with fatigue and was not activated to aid stabilisation. Therefore, if
training can offset fatigue and improve performance, as would be expected, such
improvements may also be reflected in biomechanical responses.
Arm crank ergometry training has shown increased peak oxygen uptake
suggesting that performance increases were related to both local and central
adaptations (Loftin eta/., 1988, Magel eta/., 1978, Clausen eta/., 1973, Tordi et
a/., 2001) or specific local adaptations (Stamford eta/., 1978, Magel eta/., 1978,
Bhambhani et a/., 1991). Additionally, 4-weeks (12 sessions) of upper body
weight training also increased peak oxygen uptake (Swensen eta/., 1993) with
the authors suggesting that the mechanism, other than improvements in muscle
strength, was important but not clear. However, these studies did not examine
whether biomechanical responses were related to improvements in performance.
Sports that require a high level of upper body involvement such as handball have
suggested that training may change maximal angular velocity as measured by
internal shoulder rotation during a throwing action (Roland van den and Mario,
2011). Furthermore, changes in kinematics and EMG (biceps and triceps brachii)
have been linked to improvements in an elbow flexion task (Gabriel, 2002). For
studies examining the lower body, elite cyclists showed a more consistent
pattern of muscle recruitment and a smaller variation in kinematics which
accounted for a higher level of performance in comparison to novice cyclists
(Chapman eta!., 2009). Additionally, coactivation of the antagonistic muscles
has been shown to be reduced following training (Carolan and Cafarelli, 1992
Aagaard, 2003, Duchateau eta,., 2006) resulting in improved performance. '
However, a number of studies involving runners have indicated that despite
improvements in running performance there were no changes in kinematics after
training (Collins eta,., 2000, Lake and Cavanagh, 1996). Despite evidence for
improvements in upper body exercise performance through biomechanical
changes, these have not been specifically examined during high intensity ACE.
Investigating the physiological and biomechanical responses to a Wingate test
and a continuous work test to exhaustion before and after training would provide
a unique investigation as to how the relationship between physiology and
biomechanics may change in a previously untrained population. Therefore, the
aim of this study was to examine the changes in physiological and biomechanical
variables in relation to performance and fatigue after a 6-week upper body exercise-training programme.
6.2
6.2.1
Method
Participants
Twelve participants with no previous arm crank ergometry experience
volunteered to take part in this study (age = 20.7 ±4.1 years, mass = 72.0 ±
11.9 kg, height = 1.80 ± 0.07 m). Participants did not regularly participate or
train for upper body sport or exercise. Each participant undertook three
preliminary performance tests (30-s Wingate, V02peak and T,im) prior to
undertaking a 6 week arm crank training programme. The performance tests
were then repeated. A minimum of 48-h separated each experimental test, with
participants reporting to the laboratory for testing within one hour of the initial
test. Participants were instructed not to conduct new training, or any vigorous
training prior to each test. All training and tests were conducted in the same
laboratory with the temperature between 20 ± 1°C. All experimental procedures
were approved by the University's Post Graduate Research Ethics Committee
(Appendix 1).
6.2.2 Anthropometry and body composition
Each participant's body mass (kg), left and right hand grip strength (kg-N), girth
(right upper arm flexed and tensed and forearm relaxed; mm); skinfold (right
arm biceps and triceps brachii* mm iAIAI_' ) ere measured prior to the beginning of the
training programme and after completing the training programme.
6.2.3
6.2.3.iExercise protocol
Wingate test
After a fell fam,l,arisatlon session for the WAnT and the V C W test participants
completed a seated upper body WAnT, as outlined in section 3.3.1 using Cranlea
Wingate software (v.4.00; Cranlea & Company, Birmingham, UK). A resistive
load of 4% body mass was used as in study 1 (Chapter 4) and as used by
previous researchers (Aschenbach eta/., 2000, Biggerstaff eta/., 1997, Hubner-
Wozniak et a/., 2004, Weber et a/., 2006). Body mass recorded at the
familiarisation session was used as the subsequent reference mass for all
WAnT's. Peak power output (PRO; over 1 s duration) corrected and uncorrected,
mean power output (MPO; over 29 s duration) and minimum power output
(POmin), peak, mean and final cadence (rev-min1) were recorded. Time to peak
power output (PPOtime; 1 s) for corrected and uncorrected peak power were also recorded.
6.2.3.ii Peak oxygen uptake and peak minute power test
After completing the WAnT familiarisation test, participants completed a V02peak
test to volitional exhaustion (Section 3.2.2) with each participant's peak minute
power (PMP) calculated (Section 3.2.2.i). A Thm continuous work test (CWT) at
100% of PMP exercise intensity (Prei00%) was the undertaken. During each test
oxygen uptake (V02), respiratory exchange ratio (RER), and heart rate
(beats-min-1; HR) were continuously recorded as described in section 3.4.2. In
the last 20 s of the first minute of exercise, the last 20 s of each subsequent 2
min and at exercise cessation a ratings of perceived exertion, local (RPEL; arms)
and cardiorespiratory (RPEcr) were recorded. Time to exhaustion (T|im) was
recorded as the performance outcome measure.
6.2.3.iii Training programme
After completing the pre-training tests each participant completed the same
number of training sessions (18 in total) over 6 weeks. Participants were
required to complete a minimum of three and a maximum of four training
sessions each week (Table 6.1) with no constraint on the time of day for training
and were free to continue with, but not increase, any regular training during the
training programme. A training diary was completed for each participant during
the period of study. The 50% and 100% PMP exercise intensity sessions
undertaken were specifically prescribed to each participant based on their
preliminary tests. Each week participants completed three training sessions
including; repeated 10 s sprints, exercise at 100% PMP and a submaximal aerobic sessions for 30 minutes at 50% PMP.
6.2.4.iv Repeated sprint sessions
The sprint-training resistive load was 4% body mass for each participant with all
the 10 s sprints completed with maximal effort. The recovery load between
repetitions was 30 W for 1 min. Prior to the start of each sprint session a warm-
up was conducted at 60 rev-min'1 (30 W) for 3 min. The number of 10-s sprints
increased every other week, starting at six, then eight and finally ten sprints in the last two week of training (Table 6.1).
6.2.4. V Exercise at 100% PMP session
The 100% PMP exercise sessions were completed for a duration equal to 50% of
the duration of the CWT achieved in the preliminary tests (section 3.3.3). The
recovery load between repetitions was 35 W for twice the duration of the
interval. Prior to the start of the 100% PMP session a warm-up was conducted at
70 rev-min1 (35 W) for 3 min. The number of 100% PMP tests increased every
other week, starting at three, then four and finally five in the final two weeks of training (Table 6.1).
6.2.4. vi Submaximal aerobic exercise sessions
The aerobic training was completed at 50% PMP for the first 3-weeks and then
60% of PMP exercise intensity for the remaining 3-weeks (Table 6.1). The
duration of all sessions was 30 min. Each aerobic session was completed at a
cadence of 70 rev-min'1. Heart rate was continuously recorded during each
session using a telemetric chest strap and watch (Polar, Electro Oy, Finland).
121
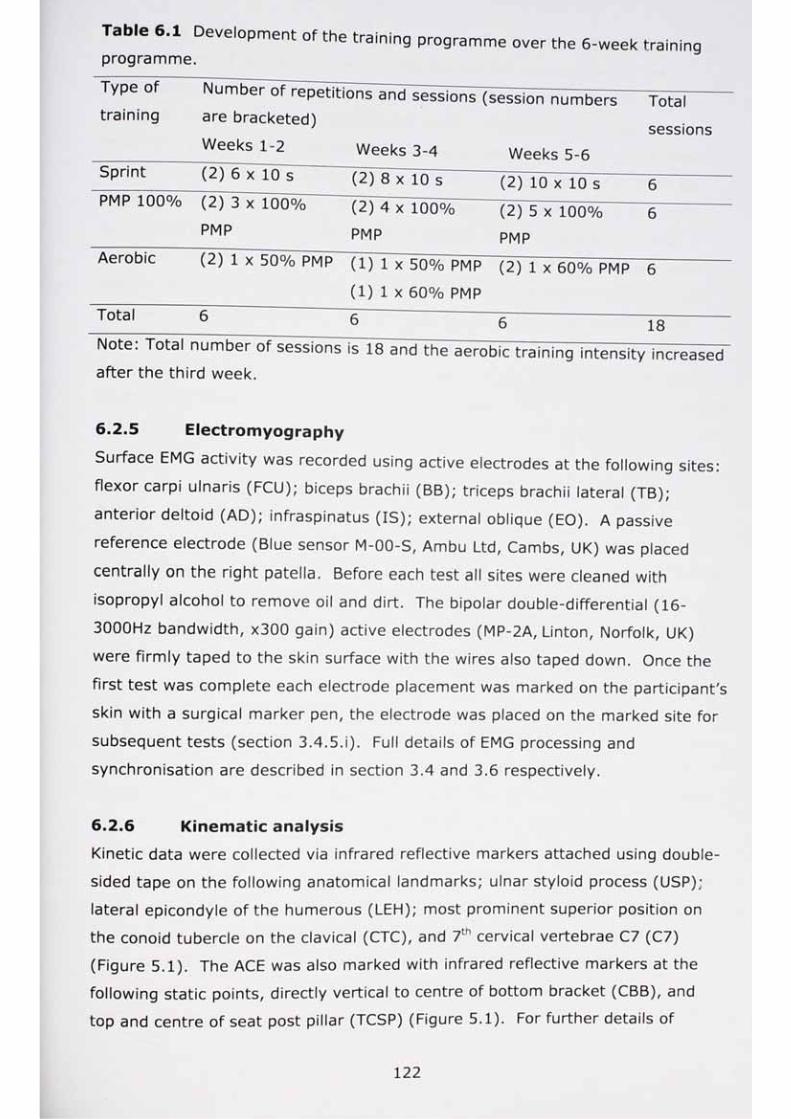
Table 6.1 Development of the training programme over the 6-week training programme.
Type of Number of repetitions and sessions (session numbers Totaltraining are bracketed)
sessionsWeeks 1-2 Weeks 3-4 Weeks 5-6
Sprint (2) 6 x 10 s (2) 8 x 10 s (2) 10 x 10 s 6PMP 100% (2) 3 x 100% (2) 4 x 100% (2) 5 x 100% 6
PMP pmp PMPAerobic (2) 1 x 50% PMP (1) 1 x 50% PMP (2) 1 x 60% PMP 6
(1) 1 x 60% PMPTotal 6 6 6 18Note. Total number of sessions is 18 and the aerobic training intensity increasedafter the third week.
6.2.5 Electromyography
Surface EMG activity was recorded using active electrodes at the following sites:
flexor carpi ulnaris (FCU); biceps brachii (BB); triceps brachii lateral (TB);
anterior deltoid (AD); infraspinatus (IS); external oblique (EO). A passive
reference electrode (Blue sensor M-OO-S, Ambu Ltd, Cambs, UK) was placed
centrally on the right patella. Before each test all sites were cleaned with
isopropyl alcohol to remove oil and dirt. The bipolar double-differential (16-
3000Hz bandwidth, x300 gain) active electrodes (MP-2A, Linton, Norfolk, UK)
were firmly taped to the skin surface with the wires also taped down. Once the
first test was complete each electrode placement was marked on the participant's
skin with a surgical marker pen, the electrode was placed on the marked site for
subsequent tests (section 3.4.5.i). Full details of EMG processing and
synchronisation are described in section 3.4 and 3.6 respectively.
6.2.6 Kinematic analysis
Kinetic data were collected via infrared reflective markers attached using double-
sided tape on the following anatomical landmarks; ulnar styloid process (USP);
lateral epicondyle of the humerous (LEH); most prominent superior position on
the conoid tubercle on the clavical (CTC), and 7th cervical vertebrae C7 (C7)
(Figure 5.1). The ACE was also marked with infrared reflective markers at the
following static points, directly vertical to centre of bottom bracket (CBB), and
top and centre of seat post pillar (TCSP) (Figure 5.1). For further details of
122

anatomical landmarks and ACE markers refer to Table 3.11. After the first test,
the placement of each participant's reflective marker was marked on the
participant s skin with a surgical marker pen as for the EMG measurements
The wrist, elbow and inner shoulder was used to determine the range of
movement of the elbow joint (°; ROM) and is comparable to that of the knee
joint in cycling (Zehr and Chua, 2000). To determine the change in distance
(mm) between the torso and the ACE the distance between C7 and the static
point directly vertical to the centre of ergometer bottom bracket (C7D) was
recorded throughout each CWT and measured as section 3.5.1. To measure
velocity and change in direction of the trunk rotation velocity in relation to the
ergometer, angular velocity (°-s1) between C7, CTC and TCSP was recorded
throughout each CWT and measured as section 3.3.3. The above variables were
analysed at the following times 30 s, 120 s and at Tlim. Each marker position is
presented in Table 3.11 for a full description of each marker position. Full details
of kinematic processing and synchronisation are described in section 3.5 and 3.6 respectively.
6.2.7 Post-training tests
The tests in section 6.2.3 were replicated at the end of the training programme
in the following order, WAnT, a CWT to exhaustion at the pre-training 100% PMP
exercise intensity (PostABs), V02peak test and a further CWT test at 100% PMP
based on the post-training PMP (Posti0o%). Recovery between tests, the time of
testing and laboratory conditions were as section 6.2.1.
6.2.8 Statistical analysis
All data are presented as the mean ± standard deviations (s). All analyses were
performed using the Statistical Package for Social Sciences (v 17.0; SPSS Inc.,
Chicago, IL). Differences in V02, RER, HR, PMP, Tlim, RPE, EMG activity for each
muscle and kinematic variables corresponding to 30-s, 120-s and volitional
exhaustion (T|irn) were analysed using separate two-way analysis of variance with
repeated measures on training. For the WAnT and V02peak test variables analysis
was undertaken using a paired t-test. Where SPSS presented P values of P =
0.000 these are reported as P < 0.001. Individual differences between means
were located using Bonferroni post-hoc correction when there were multiple
comparisons for data sets for, metabolic responses, T im, peak minute power,
EMG, and kinematics. A two-tailed level of significance was set at P < 0.05 for
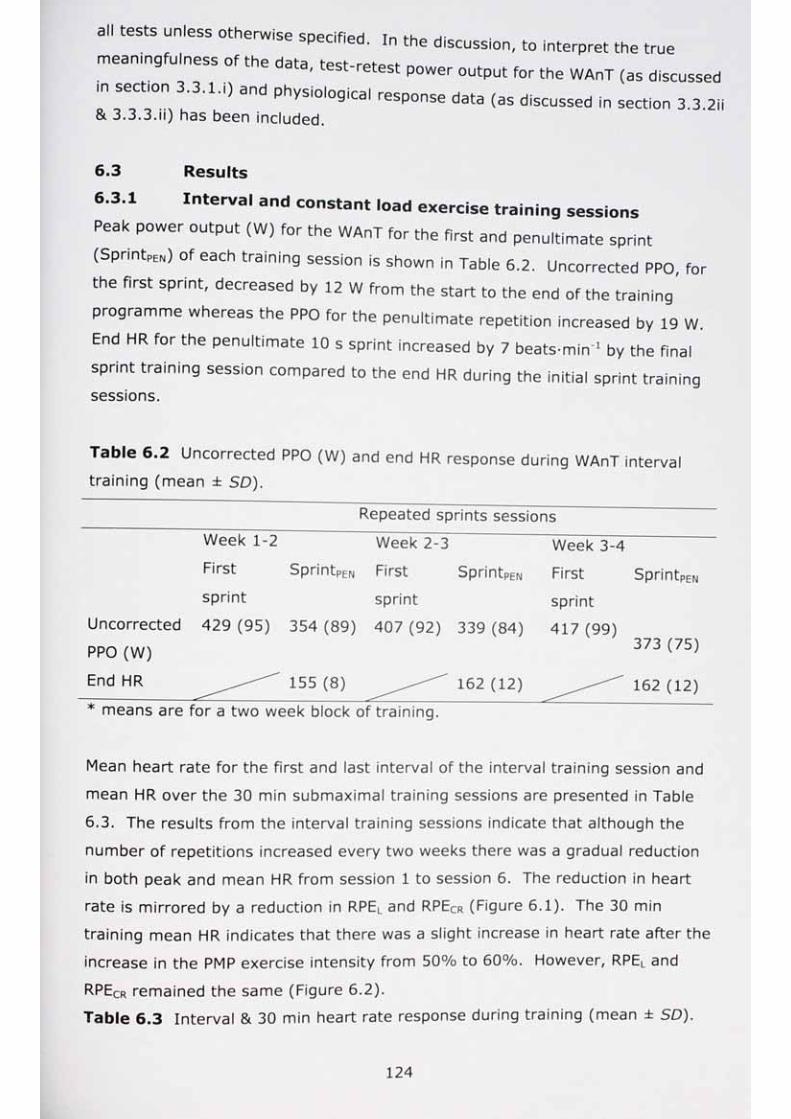
3ll t6sts unless otherwise soecifipH Tn fho a ’be specified. In the discussion, to interpret the truemeaning u ness of the data, test-retest power output for the WAnT (as discussed
m sector, 3.3.1.,) and physiological response data (as discussed in section 3.3.2i & 3.3.3.H) has been included.
6.3
6.3.1Results
interval and constant load exercise training sessions
Peak power output (W) for the WAnT for the first and penultimate sprint
(SprintpErO of each training session is shown in Table 6.2. Uncorrected PPO, for
the first sprint, decreased by 12 W from the start to the end of the training
programme whereas the PPO for the penultimate repetition increased by 19 W.
End HR for the penultimate 10 s sprint increased by 7 beats-min’ by the final
sprint training session compared to the end HR during the initial sprint trainingsessions.
Table 6.2 Uncorrected PPO (W) and end HR response during WAnT intervaltraining (mean ± SD).
Repeated sprints sessionsWeek 1-2
First
sprint
Uncorrected 429 (95)
PPO (W)
End HR
Week 2-3 Week 3-4
* means are for a two week block of training.
SprintpEN First
sprint
SprintpEN First
sprintSprintpEN
354 (89) 407 (92) 339 (84) 417 (99)373 (75)
155 (8) 162 (12) 162 (12)
Mean heart rate for the first and last interval of the interval training session and
mean HR over the 30 min submaximal training sessions are presented in Table
6.3. The results from the interval training sessions indicate that although the
number of repetitions increased every two weeks there was a gradual reduction
in both peak and mean HR from session 1 to session 6. The reduction in heart
rate is mirrored by a reduction in RPEL and RPECr (Figure 6.1). The 30 min
training mean HR indicates that there was a slight increase in heart rate after the
increase in the PMP exercise intensity from 50% to 60%. However, RPEL and
RPECr remained the same (Figure 6.2).
Table 6.3 Interval & 30 min heart rate response during training (mean ± SD).
124
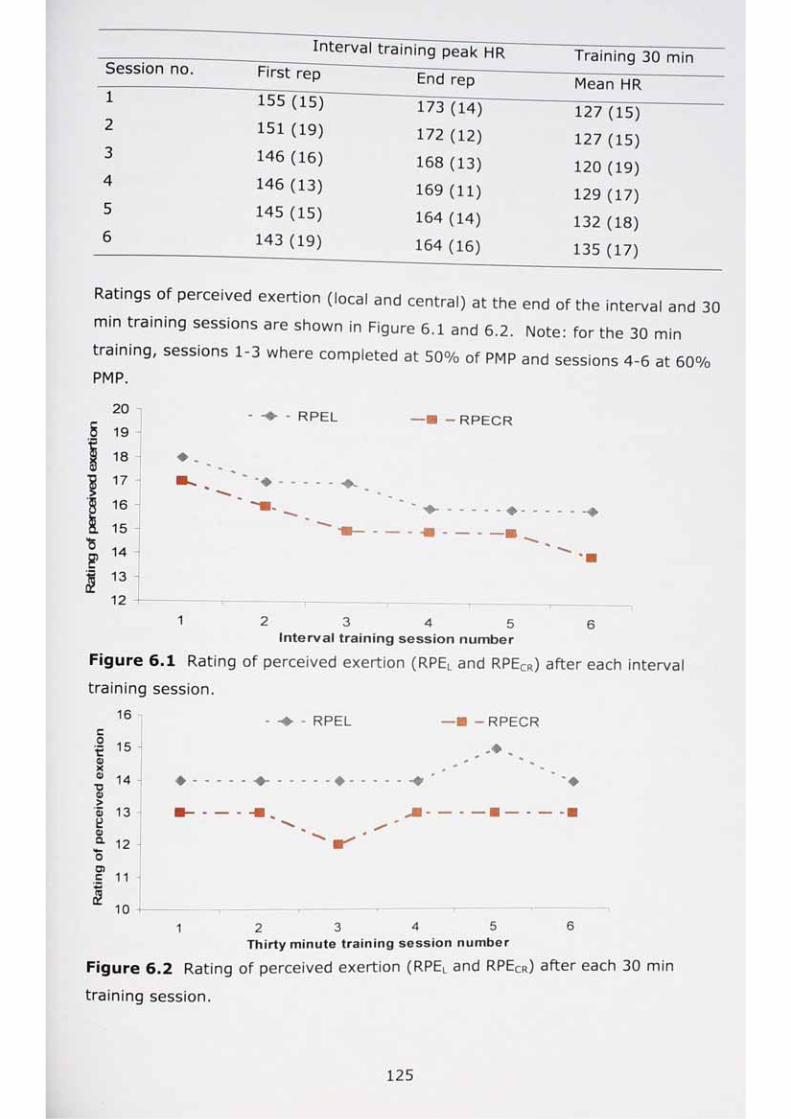
Session noInterval training peak HR
2
3
4
5
6
First rep
155 (15)
151 (19)
146 (16)
146 (13)
145 (15)
143 (19)
End rep
173(14)
172(12)
168 (13)
169 (11)
164 (14)
164 (16)
Training 30 min
Mean HR
127 (15)
127 (15)
120 (19)
129 (17)
132 (18)
135 (17)
Ratings of perceived exertion (local and central) at the end of the interval and 30
min training sessions are shown in Figure 6.1 and 6.2. Note: for the 30 min
training, sessions 1-3 where completed at 50% of PMP and sessions 4-6 at 60%PMP.
s
!1
I
?
20
19
18
17
16
15 -
14
13
- RPEL RPECR
121 2 3 4 5
Interval training session number6
Figure 6.1 Rating of perceived exertion (RPEL and RPEcr) after each interval
training session.
16
s 15co
0 O B
t:0X0T30>0£0a
14
13
u . 1 2
o>c1
11
10
- RPEL RPECR
�
♦ � �
1 2 3 4 5Thirty minute training session number
6
Figure 6.2 Rating of perceived exertion (RPEL and RPEcr) after each 30 min
training session.
125
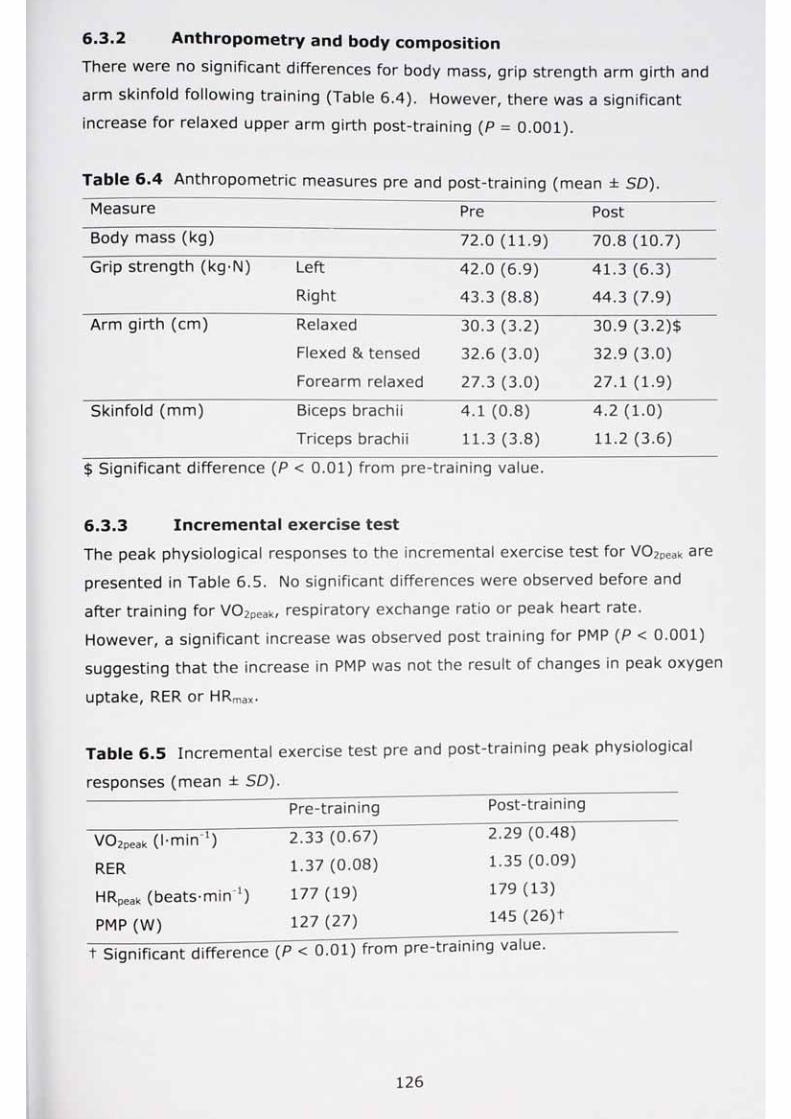
6.3.2 Anthropometry and body composition
There were no significant differences for body mass, grip strength arm girth and
arm skinfold following training (Table 6.4). However, there was a significant
increase for relaxed upper arm girth post-training (P = 0.001).
Table 6.4 Anthropometric measures pre and post-training (mean ± SD)
Measure Pre Post
Body mass (kg) 72.0 (11.9) 70.8 (10.7)
Grip strength (kg-N) Left
Right
42.0 (6.9)
43.3 (8.8)
41.3 (6.3)
44.3 (7.9)
Arm girth (cm) Relaxed
Flexed & tensed
Forearm relaxed
30.3 (3.2)
32.6 (3.0)
27.3 (3.0)
30.9 (3.2)$
32.9 (3.0)
27.1 (1.9)
Skinfold (mm) Biceps brachii
Triceps brachii
4.1 (0.8)
11.3 (3.8)
4.2 (1.0)
11.2 (3.6)
$ Significant difference (P < 0.01) from pre-training value.
6.3.3 Incremental exercise test
The peak physiological responses to the incremental exercise test for V02peak are
presented in Table 6.5. No significant differences were observed before and
after training for V02peak, respiratory exchange ratio or peak heart rate.
However, a significant increase was observed post training for PMP (P < 0.001)
suggesting that the increase in PMP was not the result of changes in peak oxygen
uptake, RER or HR max*
Table 6.5 Incremental exercise test pre and post-training peak physiologica
responses (mean ± SD).
Pre-training Post-training
V02peak (l-min1) 2.33 (0.67) 2.29 (0.48)
RER 1.37 (0.08) 1.35 (0.09)
HRPeak (beats-min x) 177 (19) 179 (13)
PMP (W) 127(27) 145 (26)+
t Significant difference (P < 0.01) from pre-training value.
126
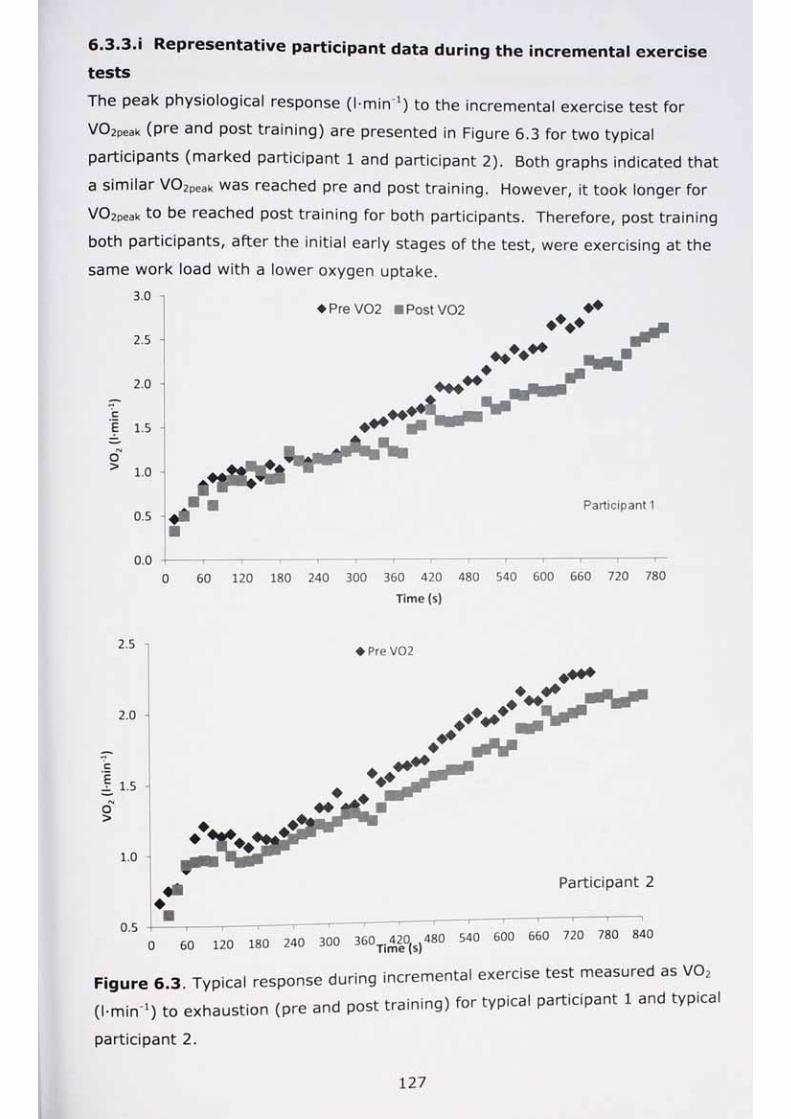
6-3-3-i Representative participant data during the incremental exercise
The peak physiological response (l-min1) to the incremental exercise test for
V02peak (pre and post training) are presented in Figure 6.3 for two typical
participants (marked participant 1 and participant 2). Both graphs indicated that
a similar V02Peak was reached pre and post training. However, it took longer for
V02Peak to be reached post training for both participants. Therefore, post training
both participants, after the initial early stages of the test, were exercising at the
same work load with a lower oxygen uptake.3.0
2.5
2.0
I 1.5
O1.0
0.5
0.0
� Pre V02 BPostV02
Participant 1
0~ ~ r~
60
— i 1 1 1 1 1 1 1 i i120 180 240 300 360 420 480 540 600 660
—i---- 1—720 780
Time (s)
2.5
2.0
Epgo
1.5
1.0
0.5
♦
0
♦ Pre V02
Participant 2
T
60 120 180 240 300 360^420^480 540 600 660 720 780 840
Figure 6.3. Typical response during incremental exercise test measured as V02
(l-min'1) to exhaustion (pre and post training) for typical participant 1 and typical
participant 2.
127
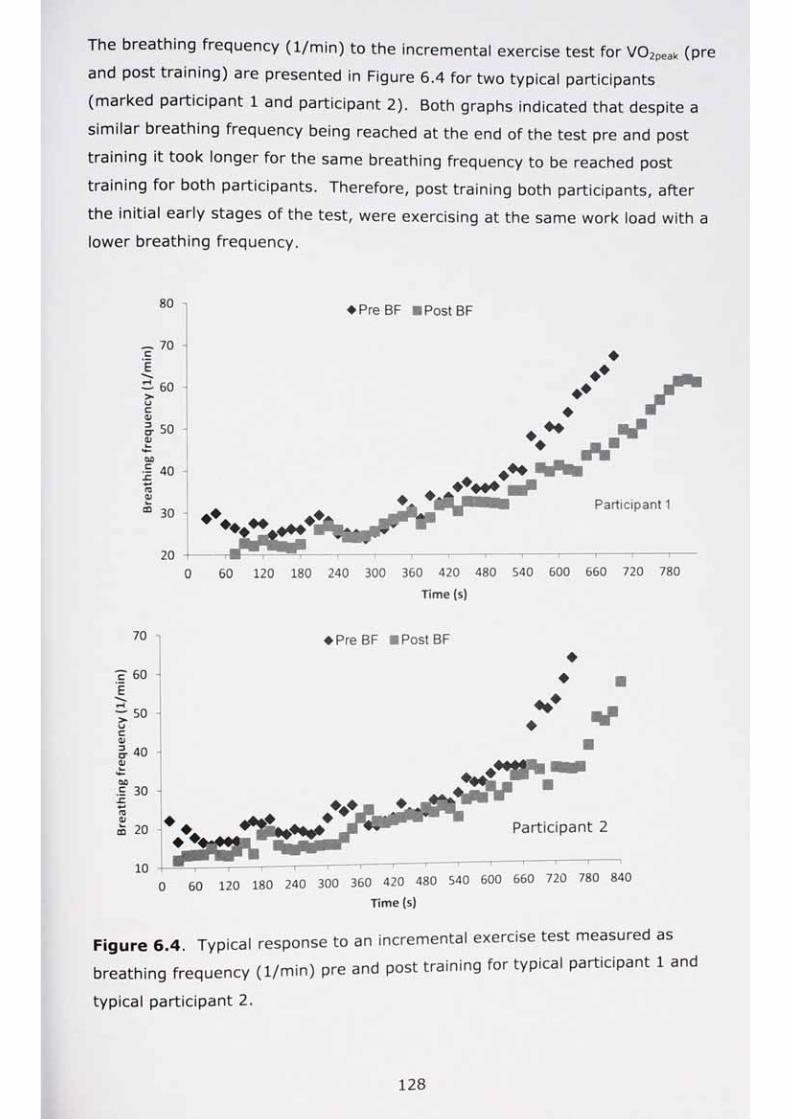
The breathing frequency (1/min) to the incremental exercise test for V02peak (pre
and post training) are presented in Figure 6.4 for two typical participants
(marked participant 1 and participant 2). Both graphs indicated that despite a
similar breathing frequency being reached at the end of the test pre and post
training it took longer for the same breathing frequency to be reached post
training for both participants. Therefore, post training both participants, after
the initial early stages of the test, were exercising at the same work load with a
lower breathing frequency.
80
70
E60
uCCD3O ’CD
50
00•i 40TO
CD
£ 30
20
♦ Pre BF BPostBF
���
�♦�
�����Participant 1
0 60 120 180 240 300 360 420 480 540 600 660 720 780
Time (s)
70
c 60' w
E50
CCD
40CD
00.E 30
ruCD
m 20
10
♦ PreBF BPostBF♦
�♦
♦
Participant 2
0 60 120 180 240 300 360 420 480 540 600 660 720 780 840
Time (s)
Figure 6.4. Typical response to an incremental exercise test measured as
breathing frequency (1/min) pre and post training for typical participant 1 and
typical participant 2.
128
The ventilatory equivalent for oxygen, measured as V'E/V'O2 (l-min *), response
to the incremental exercise test for V O „„( (pre and post training) are presented
,n Figure 6.5 for two typical participants (marked participant 1 and participant 2)Both g ra p h s indicated that a sliohtlv orp^fpr \/'p/\/'o .a diiynuy greater V E/V 02 was reach post training.Initially towards the later half of the test the V'E/V'02 response was lower post
training for both participants. Therefore, post training both participants, after
the initial early stages of the test, were exercising at the same work load with alower V'E/V'02.
55� Pre V'E/V'02 Post V'E/V'02
50
45
E 40
rsiOLU
35
30
25
20
Participant 1
T T 1 1 1 i 1 1 j 1 r0 60 120 180 240 300 360 420 480 540 600 660 720 780
Time (s)
60
55
50
i 45<n 40
O£LU 35
20
30
25
0
♦ Pre VE/V'02 Post V’E/V'02
��
♦��
�
Participant 2
60 120 180 240 300 360 420 480 540 600 660 720 780 840
Time (s)
Figure 6.5. Typical response to an incremental exercise test measured as
V'E/V'02 (l-min'1) pre and post training for typical participant 1 and typical
participant 2.
129
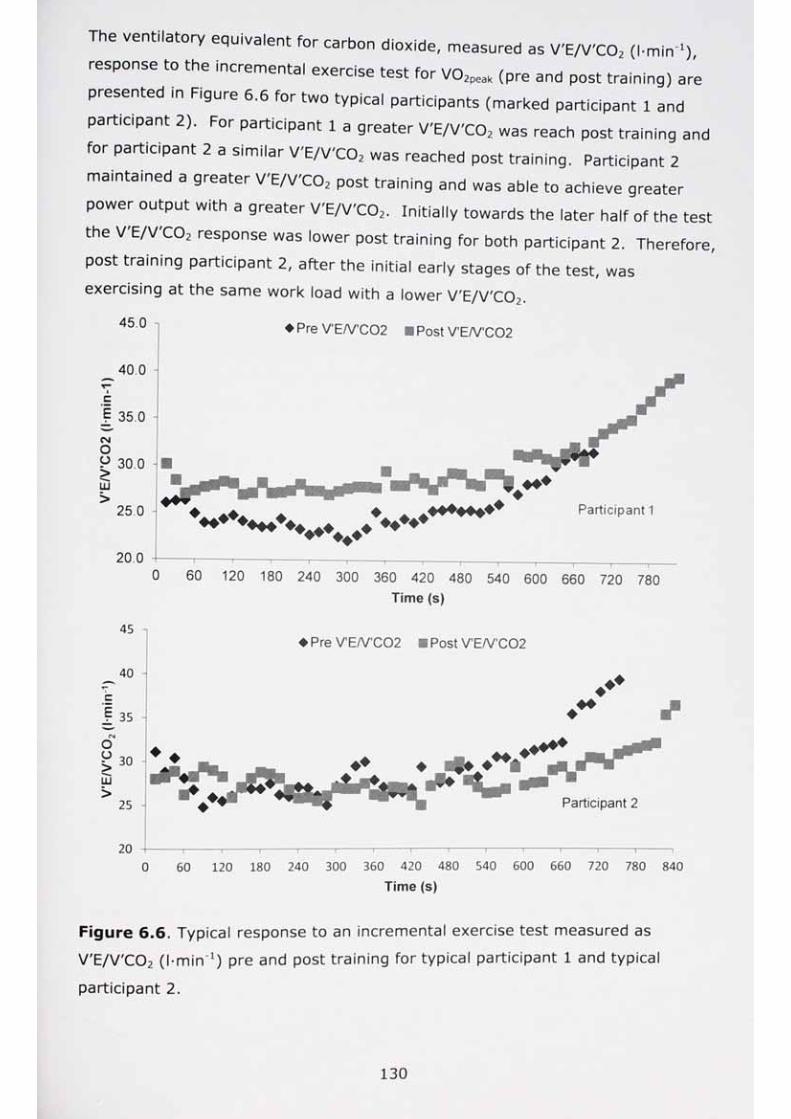
The ventilatory equivalent for carbon dioxide, measured as V'E/V'C02 (l-min1),
response to the incremental exercise test for V02peak (pre and post training) are
presented in Figure 6.6 for two typical participants (marked participant 1 and
participant 2). For participant 1 a greater V'E/V'C02 was reach post training and
for participant 2 a similar V'E/V'C02 was reached post training. Participant 2
maintained a greater V'E/V'C02 post training and was able to achieve greater
power output with a greater V'E/V'C02. Initially towards the later half of the test
the V E/V'C02 response was lower post training for both participant 2. Therefore,
post training participant 2, after the initial early stages of the test, was
exercising at the same work load with a lower V'E/V'C02.
45.0
40.0
c• MM
f 35.0CMoP 30.0 -ILU
25.0
20.00
♦ Pre V'EA/'C02 Post V'EA/'C02
*�������������
Participant 1
60 120 180 240 300 360 420 480 540 600 660 720 780Time (s)
45
40 -i
P 35C*4
O(J 30LU
25
20
♦ Pre V'E/V'C02 Post V'EA/'C02
♦�♦
♦
Participant 2
0 60 120 180 240 300 360 420 480 540 600 660 720 780 840
Time (s)
Figure 6.6. Typical response to an incremental exercise test measured as
V'E/V'C02 (l-min"1) pre and post training for typical participant 1 and typica
participant 2.
130
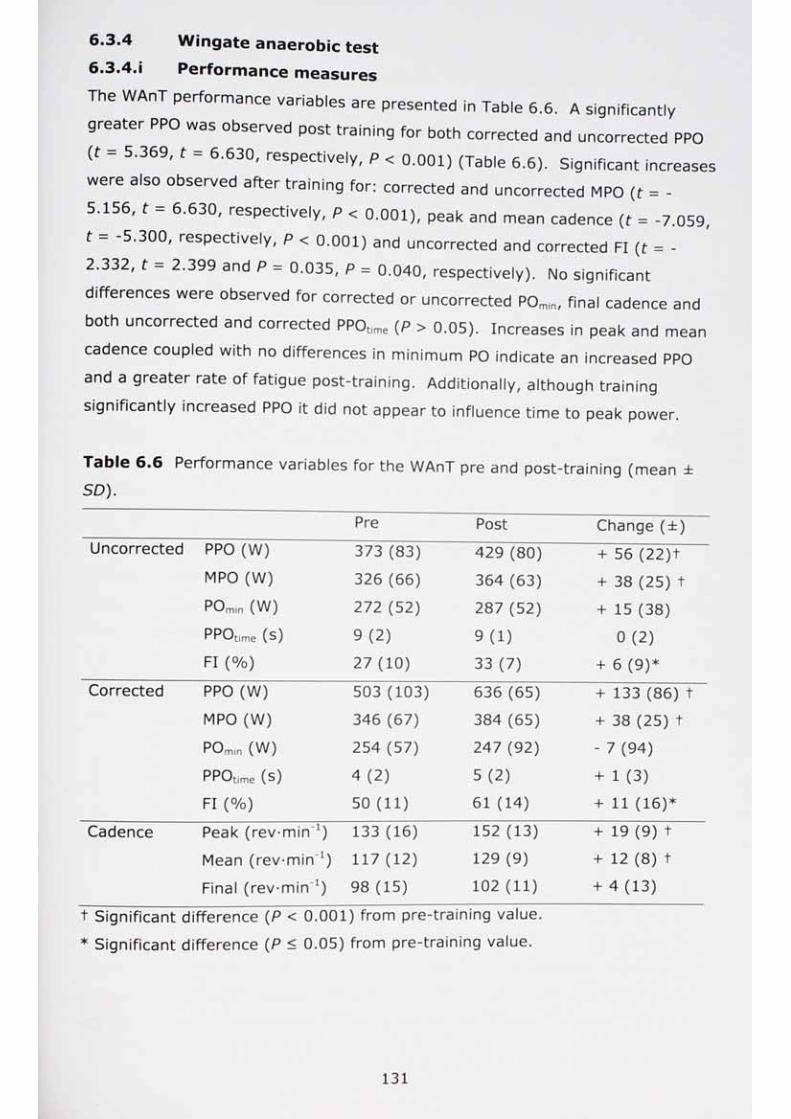
6.3.4
6.3 .4 .iW ingate anaerobic test
Perform ance m easures
A significantly
5.156, t
The WAnT perform ance variab les are presented in Table 6.6.
g reater PRO was observed post train ing for both corrected and uncorrected'pPO
(t - 5.369, t = 6.630, respectively, P < 0.001) (Table 6.6). S ign ificant increases
were also observed after tra in ing for: corrected and uncorrected MPO (t = -
- 6 .630, respective ly, P < 0.001), peak and mean cadence (t = -7.059,
t = -5 .300, respective ly, P < 0.001) and uncorrected and corrected FI (t = -
2.332, t = 2.399 and P = 0.035, P = 0.040, respectively). No significant
d ifferences were observed for corrected or uncorrected POmin, final cadence and
both uncorrected and corrected PPOtime (P > 0.05). Increases in peak and mean
cadence coupled with no differences in m inimum PO indicate an increased PPO
and a g reater rate of fatigue post-train ing. Additionally, although training
s ign ificantly increased PPO it did not appear to influence time to peak power.
Table 6.6
5D).Perform ance variab les for the WAnT pre and post-train ing (mean ±
Pre Post Change (±)Uncorrected PPO (W) 373 (83) 429 (80) + 56 (22) +
MPO (W) 326 (66) 364 (63) + 38 (25) +POmin (W) 272 (52) 287 (52) + 15 (38 )
P P O t im e (S ) 9 (2 ) 9 (1 ) 0 (2)FI (%) 2 7 (1 0 ) 33 (7) + 6 (9)*
Corrected PPO (W) 503 (103) 636 (65) + 133 (86) +
MPO (W) 346 (67 ) 384 (65) + 38 (25) +
P O m in (W) 254 (57) 247 (92) - 7 (94)
P P O t im e ( s ) 4 (2 ) 5 (2) + 1 (3)FI (%) 50 (11) 61 (14) + 11 (16 )*
Cadence Peak (rev-m in '1) 133 (16) 152 (13) + 19 (9) +
Mean (rev-m in '1) 117 (12 ) 129 (9) + 12 (8) +
Final (rev-m in '1) 98 (15) 102 (11) + 4 (13)
* S ign ificant d ifference (P < 0.05) from pre-training value.
131
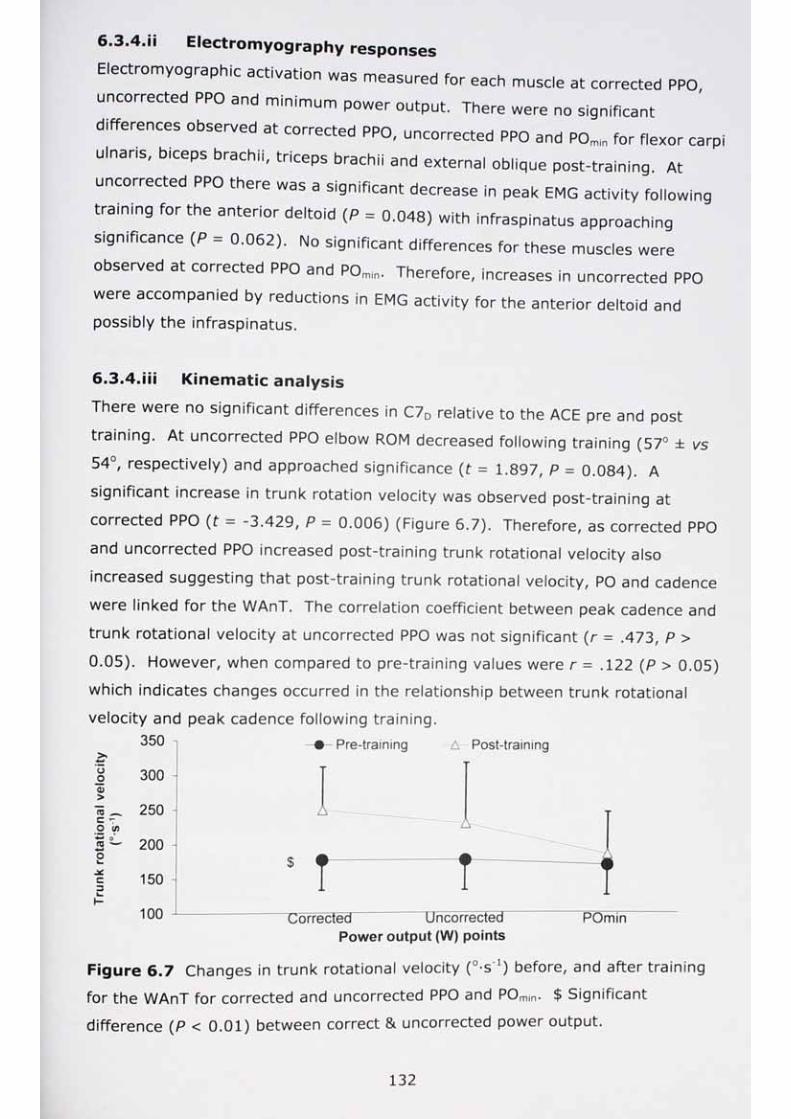
6.3.4.M Electrom yography responses
for flexor carpi
E lectrom yograph ic activation was measured for each muscle at corrected PPO
u n co -e c ted PPO and m inim um power output. There were no significant
d ifferences observed at corrected PPO, uncorrected PPO and POmj,
u lnans, b iceps brachii, triceps brachii and external oblique post-train ing At
uncorrected PPO there was a sign ificant decrease in peak EMG activ ity following
tra in ing for the anterio r deltoid (P = 0.048) with infraspinatus approaching
sign ificance (P = 0.062). No sign ificant differences for these muscles were
observed at corrected PPO and POmin. Therefore, increases in uncorrected PPO
were accom panied by reductions in EMG activ ity for the anterior deltoid and possib ly the in frasp inatus.
6.3.4. iii K inem atic analysis
There were no sign ificant d ifferences in C7D relative to the ACE pre and post
train ing. At uncorrected PPO elbow ROM decreased following training (57° ± vs
54°, respective ly) and approached significance (f = 1.897, P = 0.084). A
sign ificant increase in trunk rotation velocity was observed post-train ing at
corrected PPO (t = -3 .429, P = 0.006) (Figure 6.7). Therefore, as corrected PPO
and uncorrected PPO increased post-train ing trunk rotational velocity also
increased suggesting that post-tra in ing trunk rotational velocity, PO and cadence
were linked for the WAnT. The correlation coefficient between peak cadence and
trunk rotational ve locity at uncorrected PPO was not significant (r = .473, P >
0.05). However, when compared to pre-train ing values were r = .122 (P > 0.05)
which ind icates changes occurred in the relationship between trunk rotational
ve locity and peak cadence follow ing training.350
Oo<DTO _ C Vo </)
o
300
250
T O
o 200 -
150
100
Pre-training Post-training
AA
$
Corrected Uncorrected POminPower output (W) points
Figure 6.7 Changes in trunk rotational velocity (°-s_1) before, and after training
for the WAnT for corrected and uncorrected PPO and POmin. $ S ignificant
d ifference (P < 0.01) between correct & uncorrected power output.
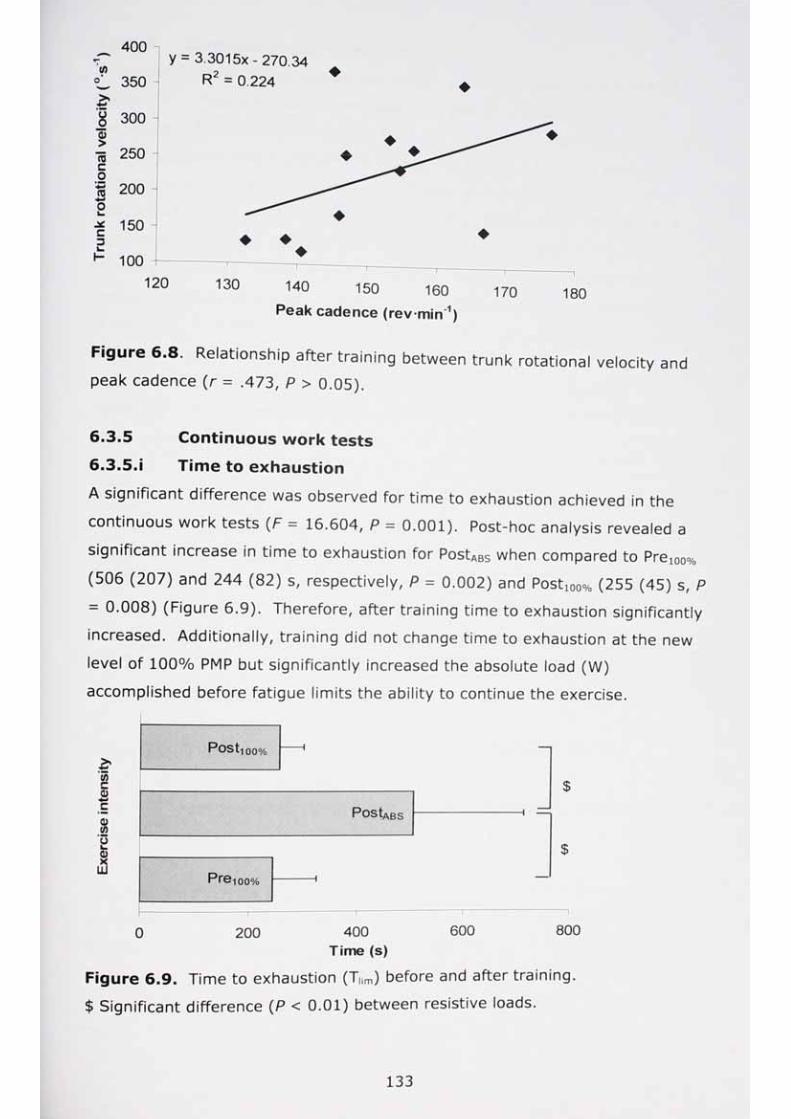
</>400
•0>
• m mm
350
8o>
300
c01 w m m
250
s0200
c3150
H 100
y = 3.3015X - 270.34 R 2 = 0.224
120
♦♦
130 140 150 160 170 180Peak cadence (rev-min'1)
Figure 6.8. Relationsh ip after train ing between trunk rotational velocity andpeak cadence (r = .473, P > 0.05).
6.3.5
6.3.5.IContinuous work tests
Tim e to exhaustion
A sign ificant d ifference was observed for time to exhaustion achieved in the
continuous work tests (F = 16.604, P = 0.001). Post-hoc analysis revealed a
sign ificant increase in tim e to exhaustion for PostABs when compared to Pre100%
(506 (207) and 244 (82) s, respectively, P = 0.002) and Post100% (255 (45) s, P= 0.008) (F igure 6.9). Therefore, after train ing time to exhaustion significantly
increased. Add itiona lly , tra in ing did not change time to exhaustion at the new
level of 100% PMP but sign ificantly increased the absolute load (W)
accom plished before fatigue lim its the ability to continue the exercise.
S'80C
■ mmm
0wO
iS
$
$
0 200 400Tim e (s)
600 800
Figure 6.9. Time to exhaustion (T|im) before and after training
$ S ign ificant d ifference (P < 0.01) between resistive loads.
133

6.3.5. ii Cardiorespiratory response
There was a S ignificant d ifference for oxygen uptake between time and trial
(Table 6 .7). Post-hoc ana lysis reyealed a greater V 0 2 for both Pre10o% and
P o s t , „ „ at 120 s when com pared to Post„Bs. There was a sign ificant Interaction
for RER between tim e and tria l (F = 7.253, P = 0.003). Post-hoc analysis
revealed a g reater RER at 120 s for the Pre10„ „ vs PostAK tria ls and a lower
PostAQs vs both P re i00% and Postt00% at exhaustion (Table 6.7). There was a
sign ificant interaction between tim e and trial for HR (F = 5.117, p = 0.002).
Post-hoc ana lysis revealed a greater HR at 30 s PostABS when compared to
Post100=/o and a greater heart rate PostABS compared to Pre100% at exhaustion
(Table 6.7). The resu lts suggest that the significant changes in oxygen uptake, RER and HR increased T,im for PostABS.
Table 6.7 Card io resp ira to ry response at 30 s, 120 s and T„m before and after tra in ing (m ean ± SD).
Variab le PMP 30 s 120 s ExhaustionV 0 2 Pre ioo% 1.21 (0.22) 1.95 (0.42) 2.31 (0.59)
POStABS 1.13 (0.21) 1.75 (0 .42)c 2.33 (0.49)Post ioo% 1.14 (0.21) 1.94 (0.37) 2.20 (0.43)
RER Pre ioo% 0.97 (0.09) 1.39 (0.11) 1.39 (0.15)PostABS 0.97 (0.12) 1.30 (0 .07)a 1.27 (0.10)c
Postioo% 0.91 (0.07) 1.33 (0.07) 1.38 (0.08)HR Preioo% 126 (15) 155 (15) 172 (13)
PostABs 129 ( 18)b 150 (17) 179 (12)a
3Post 100%
1 * ^ f* A ^
123 (13)b __
155 (11)A 1 A • ^ ^
174 (14)
c S ign ifican tly d ifferent from P re i0o%and Posti0o%.
Note: V 0 2 = oxygen consum ption ( l-m in 1), RER = respiratory exchange ratio, HR
= heart rate (b ea ts -m in 1), PMP = peak m inute power.
The peak physio log ica l responses (l-m in '1) to the PMP (pre and post train ing) are
presented in Figure 6.10 for two typical participants (marked participant 1 and
partic ipant 2). Partic ipant 1 was able to the same power output (PostABS) with a
lower V 0 2 and the Post100% PMP was able to maintain a greater power output with
a lower V 0 2. Partic ipant 2 was able to maintain the same power output (PostABs)
134
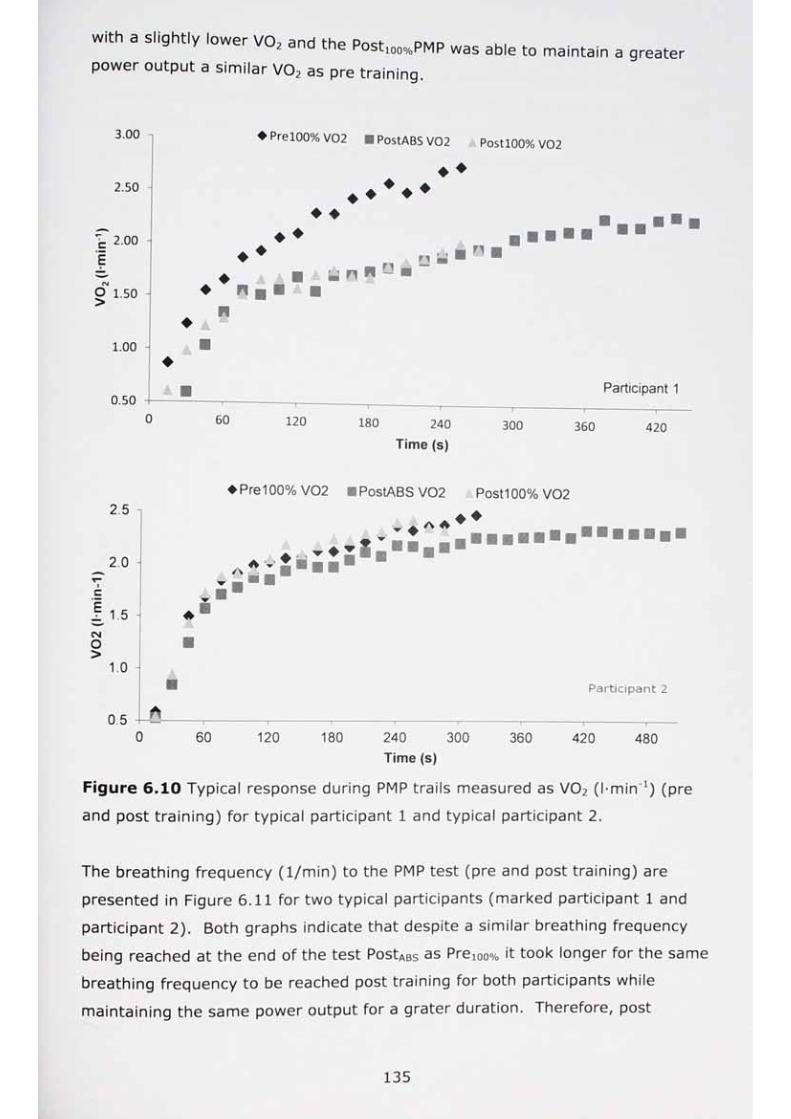
with a slightly lower VO ; and the Post,00%PMP was able to maintain a greater power output a sim ilar V 0 2 as pre training.
3.00 ♦ Prel00% V02 PostABS V02 Postl00% V02
2.50
2.00
CM
P 1.50
♦ ♦
r m nu n h
1.00
0.50120 180 240
Time (s)
Participant 1
300 360 420
2.5
2.0
1.0
♦ Pre100% V02 PostABS V02 Post100% V02
A A A
/ \
t %
120 180 240Time (s)
300 360
P a r t ic ip a n t 2
420 480
Figure 6.10 Typical response during PMP tra ils measured as V 0 2 (l-min"1) (pre
and post tra in ing) for typical participant 1 and typical participant 2.
The breathing frequency (1/m in) to the PMP test (pre and post training) are
presented in Figure 6.11 for two typical participants (marked participant 1 and
partic ipant 2). Both graphs indicate that despite a sim ilar breathing frequency
being reached at the end of the test PostABs as Pre100% it took longer for the same
breathing frequency to be reached post training for both participants while
m aintain ing the sam e power output for a grater duration. Therefore, post
135
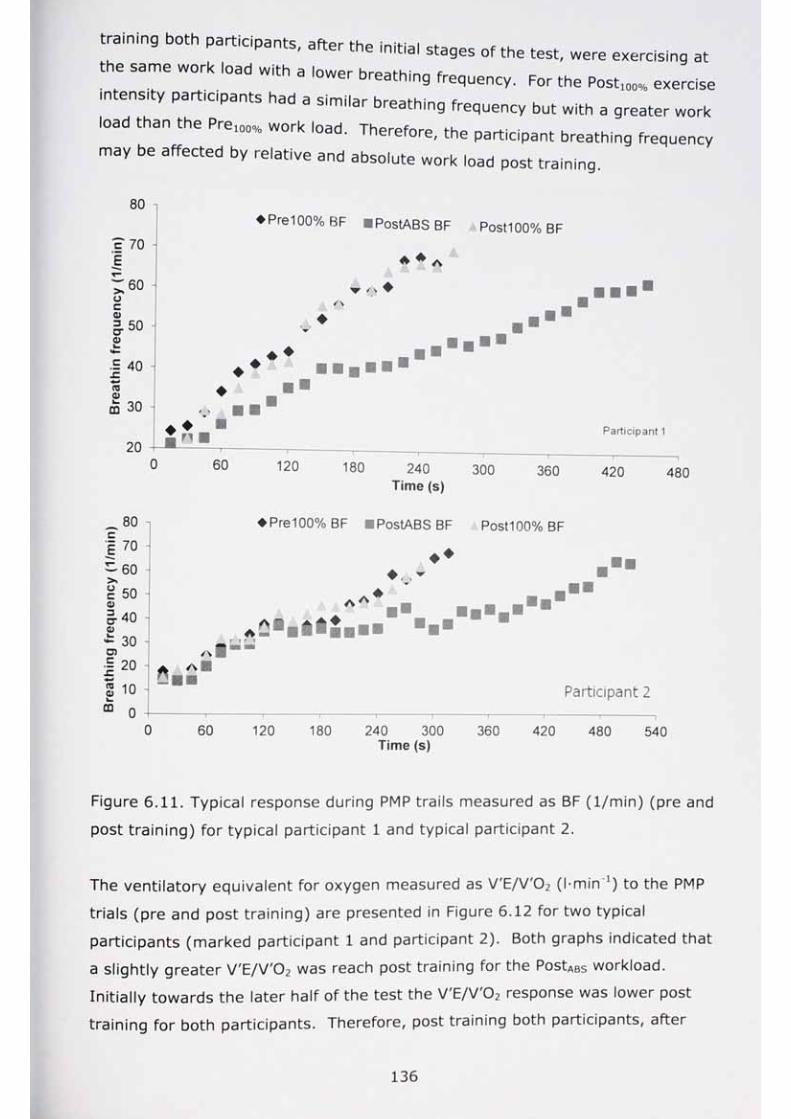
rammg both partic ipants, after the initial stages of the test, were exercising at
t e sam e work load w ith a lower breathing frequency. For the Post1M% exercise
in ensity partic ipants had a s im ila r breathing frequency but with a greater work
load than the Pre l00% work load. Therefore, the participant breathing frequency
may be affected by re lative and absolute work load post training.
80
c* 70i w
E60
oc03O’0
50
E 40r e
0m 30
20
♦ Pre100% BF PostABS BF Post 100% BF
A * A
/ \ ♦/\
♦
♦ ♦ A ♦
♦/ \
0 60
Partic ipant 1
120 180 240Time (s)
300 360 420 480
_ 80 -
| ™- 6 0
c 50 0o- 40 -I 0- 30U)£ 20
S 10A
CD 0
/\A
♦ Pre100% BF PostABS BF Post 100% BF
♦ ♦
A A ♦
* Ar i r j
A i * ♦
Participant 2
0 60 120 180 240 300Time (s)
360 420 480 540
Figure 6.11. Typical response during PMP tra ils measured as BF (1/m in) (pre and
post tra in ing) for typ ica l participant 1 and typical participant 2.
The ventila to ry equ iva lent for oxygen measured as V 'E /V '02 (l-min ) to the PMP
tria ls (pre and post tra in ing) are presented in Figure 6.12 for two typical
partic ipants (m arked participant 1 and participant 2). Both graphs indicated that
a slightly greater V 'E /V '0 2 was reach post training for the PostABs workload.
In itia lly towards the later half of the test the V 'E /V '02 response was lower post
train ing for both participants. Therefore, post training both participants, after
136
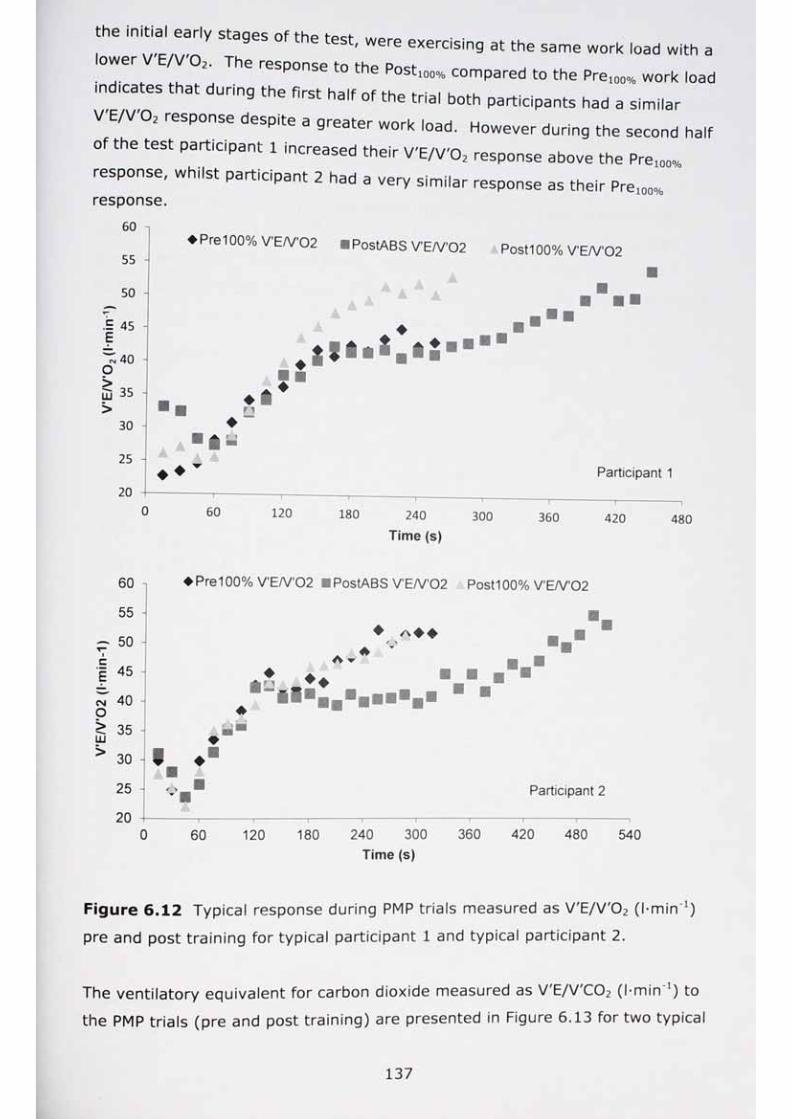
the in itia l early staqes of thp t-pcr IAIA_ . .' were exerc|sing at the same work load with u
lower V V O , The response to the Post,0„ . compared to the Pre,„„% work load
md,cates tha t during the first ha lf of the trial both participants had a sim ilar
V E/V 0 2 response despite a greater work load. However during the second half
of the test partic ipant 1 increased the ir V 'E / V 0 2 response above the Pre100%
response, w hilst partic ipant 2 had a very s im ila r response as the ir Pre.™ .response.
60♦ Pre100% V'E/V'02
55PostABS V'E/V'02 Post100% V'EA/'02
50
•E 45E■
~ 40 O
35
♦LU ♦ i♦
M30
i♦f l
25♦ ♦ Participant 1
20
0~ r~
60 120 180 240Time (s)
300 360 420 480
60
55
p 50icE 45
^ 40o
35LU
30 #
25
20
♦ Pre100% V'E/V'02 ■ PostABS VE /V02 Post100% V'EA/'02
♦ /\/ \
A ▼A♦r i
f >Af I
i l
A/ \ Participant 2
0 60 120 180 240 300 360 420 480 540Time (s)
Figure 6.12 Typical response during PMP tria ls measured as V 'E /V '02 ( l-m in 1)
pre and post tra in ing for typical participant 1 and typical participant 2.
The ventila to ry equ iva lent for carbon dioxide measured as V 'E /V 'C 02 (l-min ) to
the PMP tria ls (pre and post train ing) are presented in Figure 6.13 for two typical
137

pa ic ipants (m arked partic ipant 1 and participant 2). Both graphs indicated that
a s ,g t,y g reater V E /V C O , was reach post train ing for the P o s t„ s workload.
InitiaNy towards the la ter ha lf of the test the V E /V 'C O , response was lower post
tra in ing for both participants. Therefore, post training both participants, after
the in itia l early stages of the test, were exercising at the same work load with a
lower V E / V C O , The response to the P o s t ,™ compared to the Pre100% work load
indicates that during the first ha lf of the trial participant 1 had a slightly greater
V 'E /V 'CO ; response and partic ipant 2 had a slightly lower V 'E /V 'C 02 to the
greater work load. However during the second half of the test participant 1increased the ir V'E/V'Oo resDonse ahnup d ™2 ebponse aoove the Pre100% response, whilst participant2 had a very s im ila r response as the ir Pre100°/o response.
45♦ Pre100% V'E/V'C02 MPostABS V'E/V'C02 Post100% V ’E/V’C02
40
cE 35
CNOO>LU
30
25
20
♦ I♦ t l
♦ * ♦ 1
n♦
♦ ♦ 44
o
Participant 1
60 120 180 240Time (s)
300 360 420 480
45
40
I 35CNop 30 >LU
25
20
♦ Pre100% V ’E/V’C02 PostABS V'EA/’C02 Postl 00% V'EA/’C02
♦ ♦♦ ♦ ♦ ♦
♦ ♦
-M ± M iParticipant 2
0 60 120 180 240 300 360 420 480 540Time (s)
Figure 6.13. Typical response during PMP trails measured as V ,E/V,C 0 2 (l-min ')
pre and post tra in ing for typical participant 1 and typical participant 2.
138

6.3.5.iv Ratings of perceived exertionLocal rating of perceived exertion
There was a significant interaction for RPEL between time and trial (F = 22.444,
< 0.001). Post-hoc analysis revealed differences between Pre100% and Post,**’
vs PostABS at 30 s and 120 s with a significant reduction Post„s. Additionally
Pre100% was significantly lower than both Post„s and Post,„ „ at T,m (Fig. 6.14).
P
Pre100% O PostABS □ P o s t l 00% T
20
18
16
14
12
10
it t
t t l------ 1 l----
i
30 s 120 s Time (s)
Tlim
Figure 6.14 Rating of perceived exertion (RPEL) during the 100% PMP trials
before and after training.
+ Significant difference (P < 0.001) between variables.
Cardiorespiratory rating of perceived exertion
There was a significant interaction for RPEcr between time and trial (F = 2.784, P
= 0.050). Post-hoc analysis revealed differences at 30 s and 120 s with a
significant reduction PostABs vs both Pre100% and Posti00% and additionally PostABs
being significantly greater than both Prei00% and Post100% (Figure 6.15).
P re 100% □ PostABS □ Postl 00%
£lifCLQT
20
18
16
14
12
10
8
If
i r
30 s 120 s Time (s)
Tlim
Figure 6.15 Rating of perceived exertion (RPEcr) during the 100% PMP trials
before and after training. * Significant difference (P < 0.05) between variables
139
6.3.5.V Electromyography responses
32.146, P
Electromyographic activation was measured for each muscle at 30 s, 120 s and
T|im Th6re W6re n° Si9nifica" t interactions for flexor carpi ulnaris, biceps brachii tcceps brach„, anterior deltoid and infraspinatus EMG. However, there was a
significant mam effect for time for all muscles (F = 10.944, P = 0.001; F =
13.426, P < 0.001; F = 8.223, P = 0.008; F = 21.57, P < 0.001- F =
< 0.001, respectively) with EMG activity increasing over time. Post-hoc analysis
for time showed significant differences for all muscles between Pre100% vs both
PostABS and Post100o/o and between PostABS and Post100°/o for all muscles except
triceps brachii. There was a significant main effect for trial for triceps brachii (F
= 5.283, P < 0.013). Post-hoc analysis revealed differences approached
significance between Pre100% and PostABS (P = 0.060; Figure 6.16 (a)) and Pre100o/o
and Post100o/o (P = 0.057). There was a significant interaction for the external
oblique (F = 39.805, P < 0.001). Post-hoc analysis revealed a significant
reduction in EMG activity at 120 s between PostABS vs both Pre10oo/o and Post100%
(P < 0.001; Figure 6.16 (b)). Therefore, the results suggest that training has
reduced triceps brachii activation at both exercise intensities, and reduced
activation for the external oblique at 120 s for both exercise intensities following
training. Additionally, external oblique activation could be related (R2 = 0.239;
figure not shown) to RPEcr as both were reduced following training for PostABS.
Training does not appear to influence activation of the flexor carpi ulnaris, biceps
brachii, anterior deltoid and infraspinatus.
140
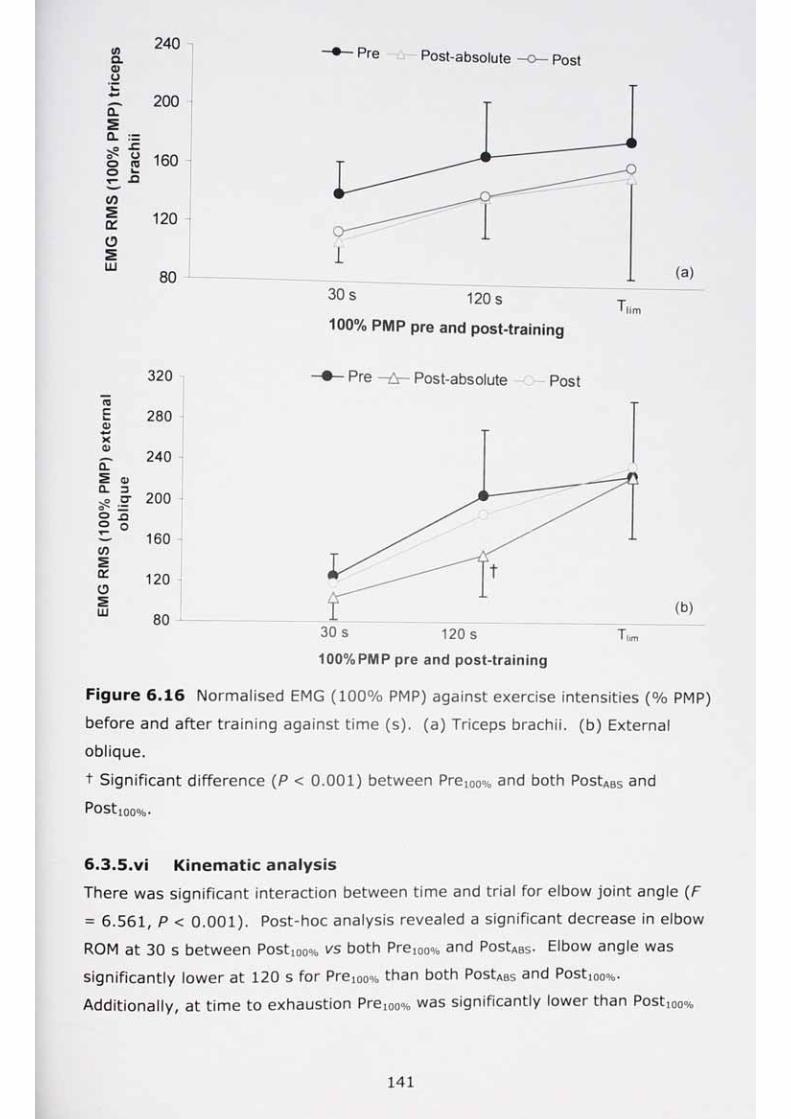
Figure 6.16 Normalised EMG (100% PMP) against exercise intensities (% PMP)
before and after training against time (s). (a) Triceps brachii. (b) External
oblique.
t Significant difference (P < 0.001) between Prei0o% and both PostABs and
Postioo%.
6.3.5.vi Kinematic analysis
There was significant interaction between time and trial for elbow joint angle (F
= 6.561, P < 0.001). Post-hoc analysis revealed a significant decrease in elbow
ROM at 30 s between Postioo% vs both Prei0o% and PostABs- Elbow angle was
significantly lower at 120 s for Preioo% than both PostABs and Posti0o%-
Additionally, at time to exhaustion Preioo% was significantly lower than Postioo%
141
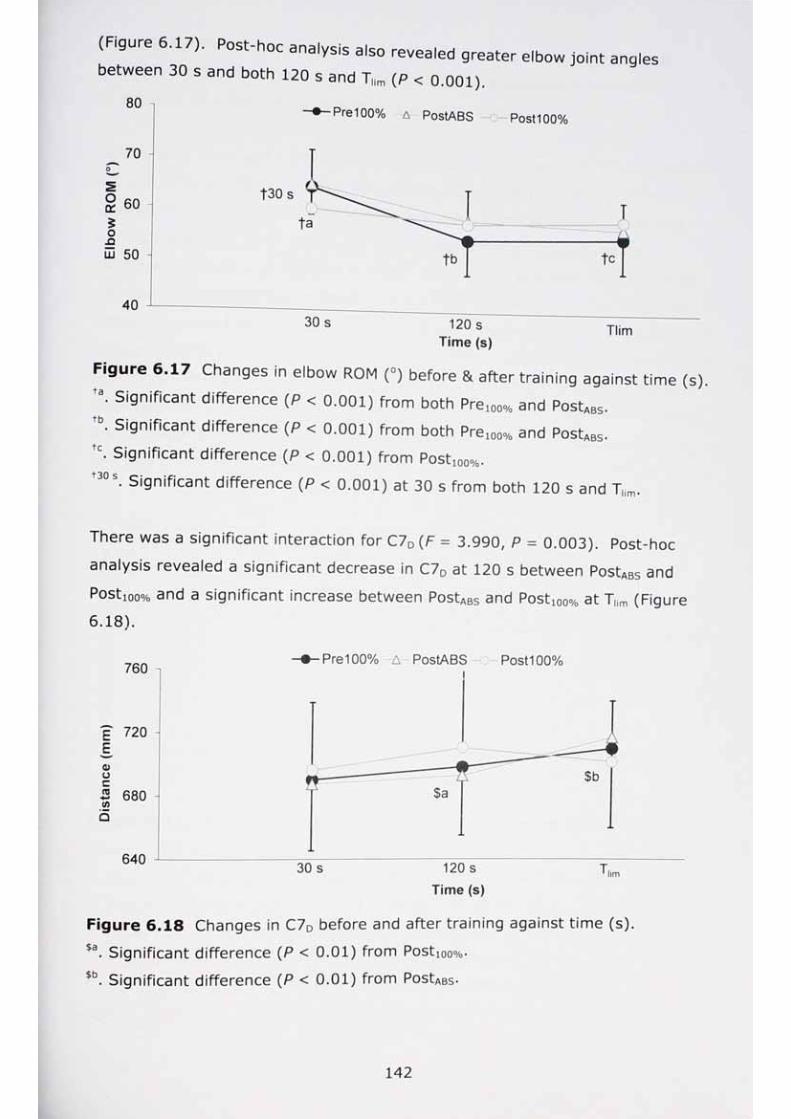
(Figure 6.17). Post-hoc analysis also revealed greater elbow joint angles
between 30 s and both 120 s and T„„ (P < 0.001).
80 -iPre100% a PostABS Post100%
70
S 60 H$ o nl u 50
40120 s
Time (s)Tlim
Figure 6.17 Changes in elbow ROM (°) before & after training against time
ta. Significant difference (P < 0.001) from both Pre100o/o and PostABS.
tb. Significant difference (P < 0.001) from both Pre100% and PostABS.
tc. Significant difference (P < 0.001) from Posti00o/o.
+30s. Significant difference (P < 0.001) at 30 s from both 120 s and Tlim.
(s)
There was a significant interaction for C7D (F = 3.990, P = 0.003). Post-hoc
analysis revealed a significant decrease in C7D at 120 s between PostARc and
Postioo% and a significant increase between PostABS and Posti00% at TMm (Figure6.181.
760
E" 720 Eo o c3 680 H</)
• 9mm
Q
640
Pre100% A PostABSi
Post100%
30 s 120 s
Time (s)
Tlim
Figure 6.18 Changes in C70 before and after training against time (s)
$a. Significant difference (P < 0.01) from Post10o%-$b. Significant difference (P < 0.01) from PostABS.
142
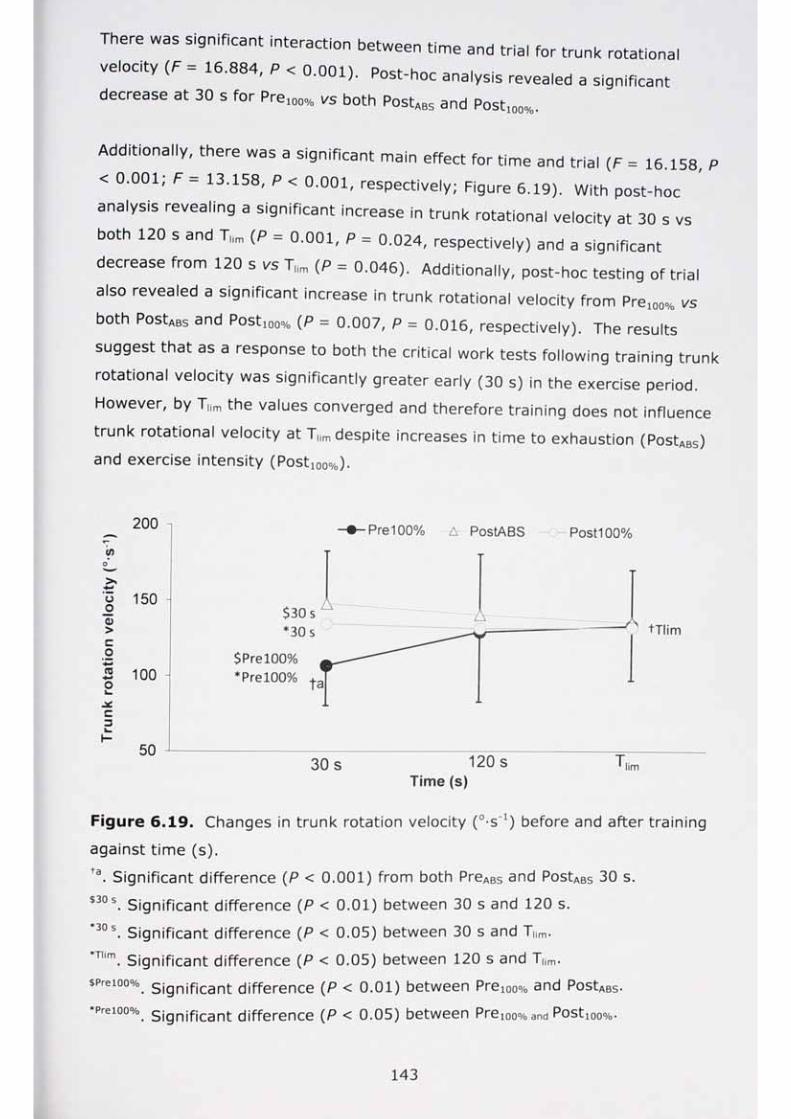
There was significant interaction between time and trial for trunk rotational
velocity (F = 16.884, P < 0.001). Post-hoc analysis revealed a significant
decrease at 30 s for Pre100o/o vs both PostABS and Post100o/o.
Additionally, there was a significant main effect for time and trial (F = 16.158, P
< 0.001; F = 13.158, P < 0.001, respectively; Figure 6.19). With post-hoc
analysis revealing a significant increase in trunk rotational velocity at 30 s vs
both 120 s and Tlim (P = 0.001, P = 0.024, respectively) and a significant
decrease from 120 s vs Tlim (P = 0.046). Additionally, post-hoc testing of trial
also revealed a significant increase in trunk rotational velocity from Prei00% vs
both PostABS and Post100o/o (P = 0.007, P = 0.016, respectively). The results
suggest that as a response to both the critical work tests following training trunk
rotational velocity was significantly greater early (30 s) in the exercise period.
However, by Tlim the values converged and therefore training does not influence
trunk rotational velocity at T,im despite increases in time to exhaustion (PostABs)
and exercise intensity (Post100o/o).
t/>
Oo0>co
2 100 o
cD
200 n
150
50
Pre100% PostABS
$30 s / A
30 s 120 sTime (s)
Post100%
A tTlim
Tlim
Figure 6.19. Changes in trunk rotation velocity (°*s !) before and after training
against time (s).
ta. Significant difference (P < 0.001) from both PreABs and PostABs 30 s.
. Significant difference (P < 0.01) between 30 s and 120 s.$30 s
30 s
�Tlim
. Significant difference (P < 0.05) between 30 s and T|im.
. Significant difference (P < 0.05) between 120 s and T|im.$Prel00%
♦Prel00%
. Significant difference (P < 0.01) between Preioo% and PostABs
. Significant difference (P < 0.05) between Pre 100% and POStioo%-
143

6.4 Discussion
Changes in
The primary aim of this study was to examine the effects of 6 weeks arm crank
training on the physiological and biomechanical responses during high intensity
upper body exercise. The main findings were that the training programme
increased Wingate PPO, mean PO and cadence but not minimum PO.
EMG dUrin9 the WAnT Were on|y ^served for infraspinatus and anterior deltoid with a reduction in activation following training suggesting this may result in a
concomitant increases in trunk rotational velocity at both corrected and
uncorrected PPO. Therefore, peak power output improvements may be the
result of changes in technique rather than muscle recruitment as there were few
changes in EMG after training. Furthermore, peak aerobic power (PMP) improved
despite no change in peak oxygen consumption. After training, time to
exhaustion during the CWT increased and there was a reduced activation for
triceps brachii at Postabs and Post100o/o. Additionally, there was a reduction in
external oblique activation for the PostABS intensity. Kinematic analysis indicated
that during Posti00o/o the elbow joint angle, trunk distance to the ACE and trunk
rotational velocity was held constant for the duration of the test compared to
Pr6ioo% and PostABs-
6.4.1
6.4.1.1
Wingate anaerobic test
Performance variables
The significant increases in peak power output (15% uncorrected PPO and 11.5%
mean PO) were greater than reported for lower limb studies, which have
reported increases of 7.0-12.0% post training involving purely sprint interval
training (Burgomaster et at., 2005, Barnett et a/., 2004, Hazell et a/., 2010).
The performance training increases were greater than the daily variation
observed in power output data (3%) for the WAnT as discussed in Section
3.3.l.i. Therefore, the results represented a meaningful increase in power
output. The greater improvements observed in the present study suggest that
the arms may be susceptible to greater training improvements than the legs
possibly due to the relative inactivity of the upper body compared to the lower
body in a young population (Marsh et at., 1999, Casaburi et at., 1992). In
addition, training for this study was more varied than in the above studies.
Subsequently, a cross-over effect from the interval and endurance training could
have improved the aerobic component during the WAnT. Improvements in WAnT
performance in previous studies have been partly attributed to increases in the
aerobe contribution to ATP resynthesis (Burgomaster et a/., 2008, Barnett et a/.,
04). For example, high intensity interua, training has been shown to increase
n mean power output and time to peak power output (Ziemann et at., 2011)
by increasing the aerobic contribution to PO, and repeated sprints haye been
shown to increase mechanical efficiency by stimulating slow-twitch muscle fibres
(Bangsbo, 1996). This response may also be enhanced in the upper body due to lower initial aerobic capacity.
Despite improvements in peak PO there were no increases in minimum PO
resulting in the significant increases in the FI for uncorrected and corrected
power. Previous lower body studies have shown either no change in FI (Hazell et
at., 2010, Ziemann et a/., 2011) ora reduced FI (Burgomaster eta/., 2006).
This may be due to the training in these two studies utilising a short work effort
of 10-30 s work with longer recoveries (2-4 min) (Burgomaster eta/., 2006,
Hazell et a/., 2010) and the third 90 s work with 180 s recovery (Ziemann et a/.,
2011). The training in the present study utilised shorter recovery periods for the
interval training which may have enhanced PPO output but not the ability to
sustain a sufficiently high power output for 30 s. Therefore, durations longer
than 10 s and/or recovery for WAnT training may be required to significantly
decrease the fatigue index.
The increase in uncorrected PPO is also reflected in an increase in peak cadence
which was achieved in the same time as the pre training value. No increases in
muscle girth (hypertrophy) were observed in the present study and the increase
may be due to changes in neural function (section 6.4.1.M). Although it is
acknowledged that there is a link between contraction time and percentage of
type II fibres (Mannion et a/., 1995) the training is unlikely, due to the 6-week
duration, to have induced a change in fibre type distribution (Barnett et al.,
2004) or the activity of fast twitch (FT) fibre metabolism in enhancing
performance (Ziemann et al., 2011, Burgomaster et al., 2005, Hazell etal.,
2010). However, the high intensity intervals may have increased glycogen
depletion and enhanced FT recruitment (Krustrup et al., 2004) seen as an
increase in peak cadence within the same time as the pre training value; time to
peak cadence was not reported by Burgomaster et at., (2005), Hazell et at.,
(2010) and Ziemann et a!., (2011) .
145
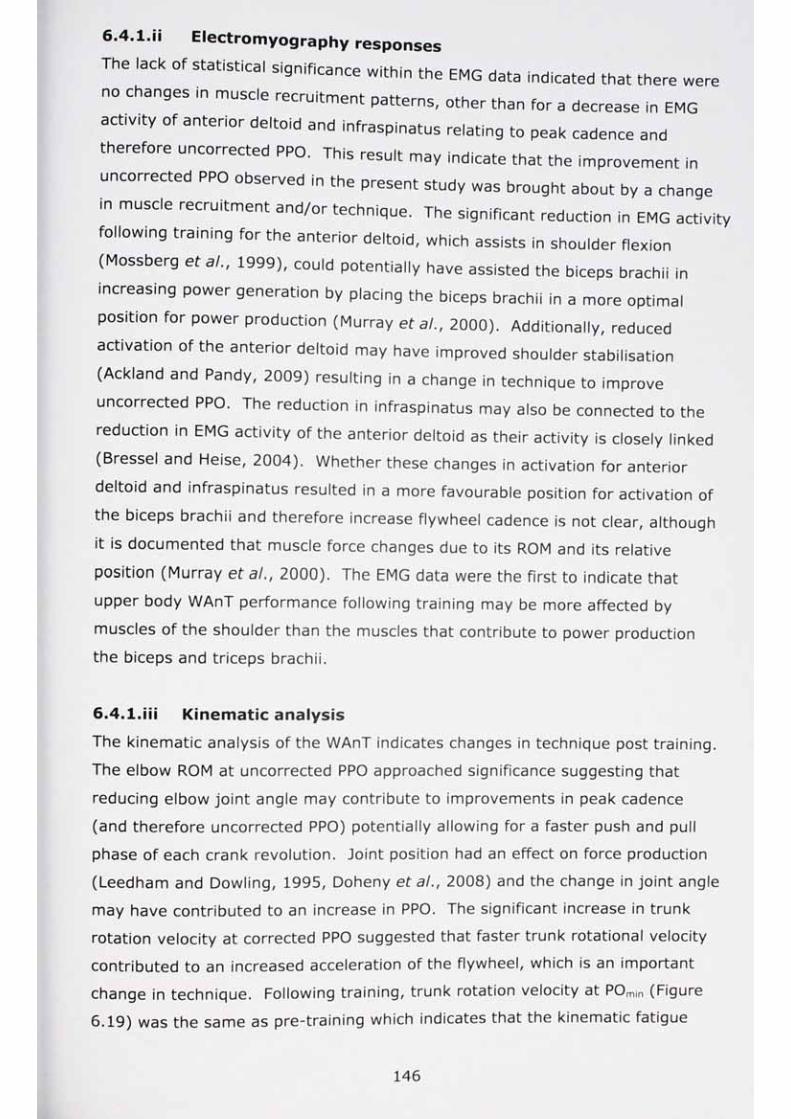
6.4.1.M Electromyography responses
wereThe lack of statistical significance within the EMG data indicated that there ...
no changes in muscle recruitment patterns, other than for a decrease in EMG
act,v,ty of anterior deltoid and infraspinatus relating to peak cadence and
therefore uncorrected PPO. This result may indicate that the improvement in
uncorrected PPO observed in the present study was brought about by a change
in muscle recruitment and/or technique. The significant reduction in EMG activity
following training for the anterior deltoid, which assists in shoulder flexion
(Mossberg eta!., 1999), could potentially have assisted the biceps brachii in
increasing power generation by placing the biceps brachii in a more optimal
position for power production (Murray etal., 2000). Additionally, reduced
activation of the anterior deltoid may have improved shoulder stabilisation
(Ackland and Pandy, 2009) resulting in a change in technique to improve
uncorrected PPO. The reduction in infraspinatus may also be connected to the
reduction in EMG activity of the anterior deltoid as their activity is closely linked
(Bressel and Heise, 2004). Whether these changes in activation for anterior
deltoid and infraspinatus resulted in a more favourable position for activation of
the biceps brachii and therefore increase flywheel cadence is not clear, although
it is documented that muscle force changes due to its ROM and its relative
position (Murray et at., 2000). The EMG data were the first to indicate that
upper body WAnT performance following training may be more affected by
muscles of the shoulder than the muscles that contribute to power production
the biceps and triceps brachii.
6.4.1.iii Kinematic analysis
The kinematic analysis of the WAnT indicates changes in technique post training.
The elbow ROM at uncorrected PPO approached significance suggesting that
reducing elbow joint angle may contribute to improvements in peak cadence
(and therefore uncorrected PPO) potentially allowing for a faster push and pull
phase of each crank revolution. Joint position had an effect on force production
(Leedham and Dowling, 1995, Doheny et at., 2008) and the change in joint angle
may have contributed to an increase in PPO. The significant increase in trunk
rotation velocity at corrected PPO suggested that faster trunk rotational velocity
contributed to an increased acceleration of the flywheel, which is an important
change in technique. Following training, trunk rotation velocity at POmin (Figure
6.19) was the same as pre-training which indicates that the kinematic fatigue
146
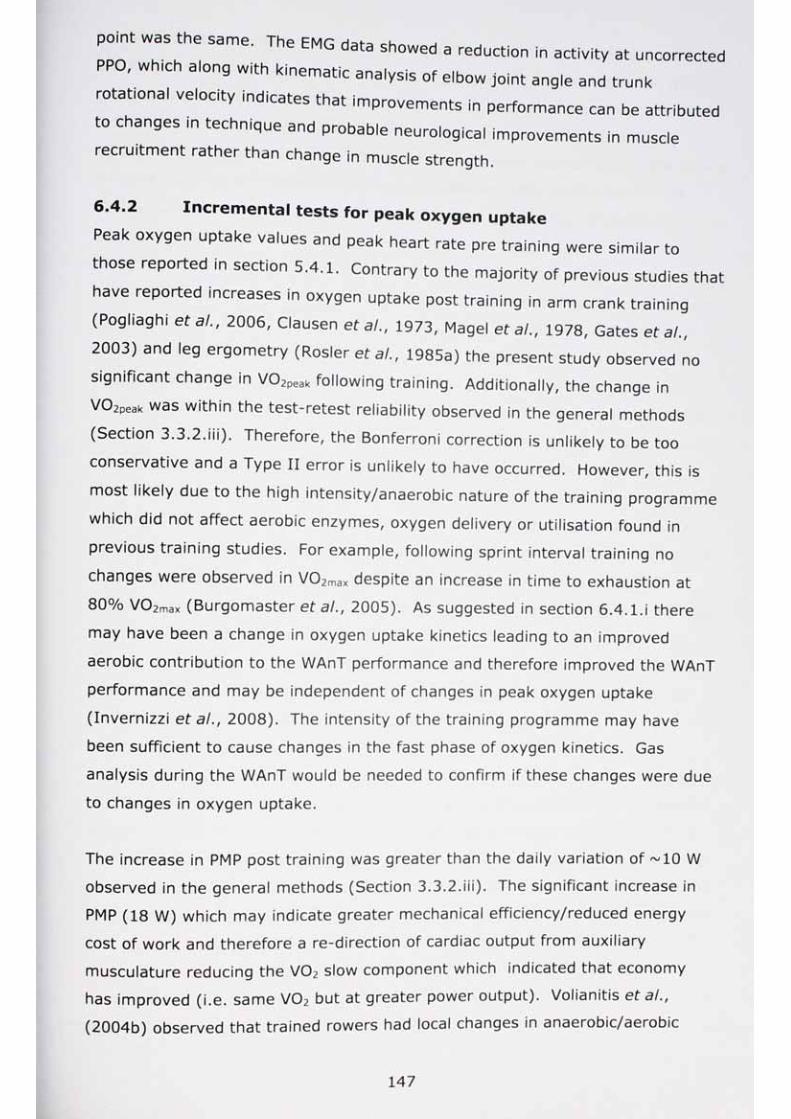
p p rT 7 ^ Same The EMG data Sh0Wed 3 reduction in activity at uncorrected PRO, which along with kinematic analysis of elbow Joint angle and trunk
rotational velocity indicates that improvements in performance can be attributed
to changes in technique and probable neurological improvements in muscle recruitment rather than change in muscle strength.
6.4.2 Incremental tests for peak oxygen uptake
Peak oxygen uptake values and peak heart rate pre training were similar to
those reported in section 5.4.1. Contrary to the majority of previous studies that
have reported increases in oxygen uptake post training in arm crank training
(Pogliaghi et a!., 2006, Clausen et a/., 1973, Magel et a!., 1978, Gates et a/.,
2003) and leg ergometry (Rosier et a!., 1985a) the present study observed no
significant change in V02peak following training. Additionally, the change in
V02peak was within the test-retest reliability observed in the general methods
(Section 3 .3 .2 .iii). Therefore, the Bonferroni correction is unlikely to be too
conservative and a Type II error is unlikely to have occurred. However, this is
most likely due to the high intensity/anaerobic nature of the training programme
which did not affect aerobic enzymes, oxygen delivery or utilisation found in
previous training studies. For example, following sprint interval training no
changes were observed in V02max despite an increase in time to exhaustion at
80% V02max (Burgomaster eta/., 2005). As suggested in section 6.4.l.i there
may have been a change in oxygen uptake kinetics leading to an improved
aerobic contribution to the WAnT performance and therefore improved the WAnT
performance and may be independent of changes in peak oxygen uptake
(Invernizzi et al., 2008). The intensity of the training programme may have
been sufficient to cause changes in the fast phase of oxygen kinetics. Gas
analysis during the WAnT would be needed to confirm if these changes were due
to changes in oxygen uptake.
The increase in PMP post training was greater than the daily variation of ~10 W
observed in the general methods (Section 3.3.2.iii). The significant increase in
PMP (18 W) which may indicate greater mechanical efficiency/reduced energy
cost of work and therefore a re-direction of cardiac output from auxiliary
musculature reducing the V02 slow component which indicated that economy
has improved (i.e. same V02 but at greater power output). Volianitis eta/.,
(2004b) observed that trained rowers had local changes in anaerobic/aerobic
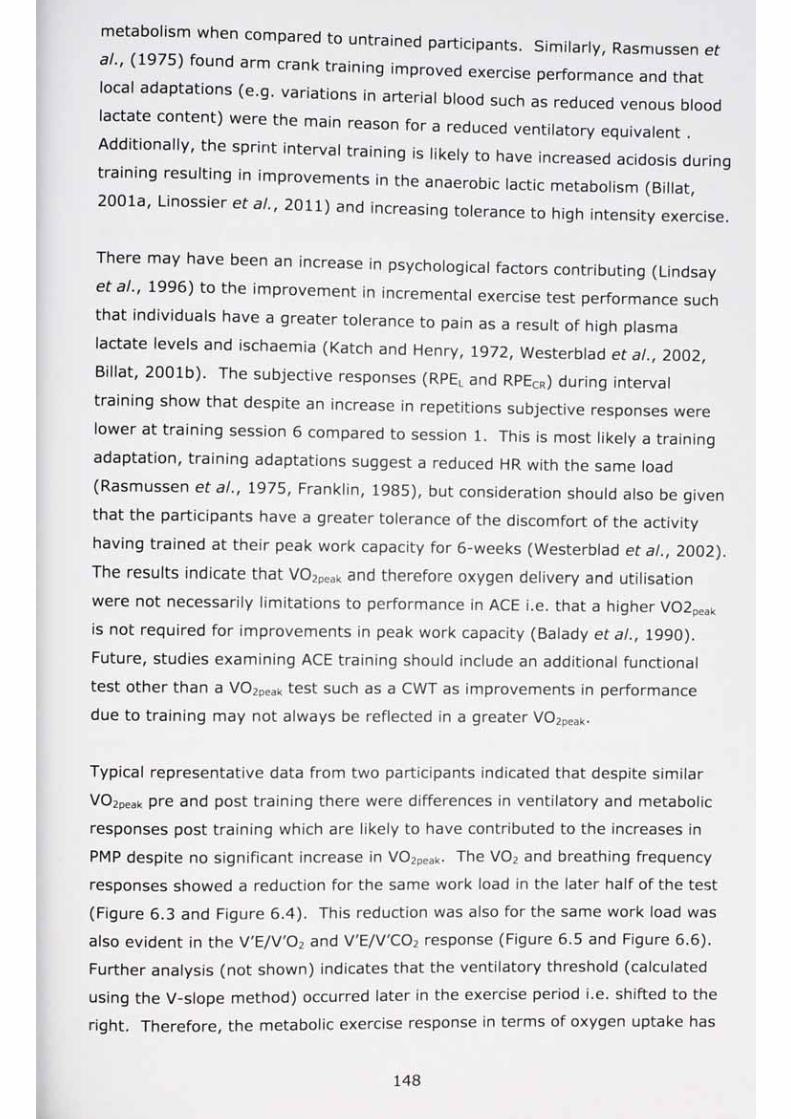
ismw en compared to untrained participants. Similarly, Rasmussen et
a ) found arm crank training improved exercise performance and that
local adaptations (e.g. variations in arterial blood such as reduced venous blood
lactate content) were the main reason for a reduced ventilatory equivalent .
Additionally, the sprint interval training is likely to have increased acidosis during
training resulting in improvements in the anaerobic lactic metabolism (Billat,
2001a, Linossier et a!., 2011) and increasing tolerance to high intensity exercise.
There may have been an increase in psychological factors contributing (Lindsay
etal., 1996) to the improvement in incremental exercise test performance such
that individuals have a greater tolerance to pain as a result of high plasma
lactate levels and ischaemia (Katch and Henry, 1972, Westerblad etal., 2002,
Billat, 2001b). The subjective responses (RPEL and RPEcr) during interval
training show that despite an increase in repetitions subjective responses were
lower at training session 6 compared to session 1. This is most likely a training
adaptation, training adaptations suggest a reduced HR with the same load
(Rasmussen et a!., 1975, Franklin, 1985), but consideration should also be given
that the participants have a greater tolerance of the discomfort of the activity
having trained at their peak work capacity for 6-weeks (Westerblad et at., 2002).
The results indicate that V02Peak 2nd therefore oxygen delivery and utilisation
were not necessarily limitations to performance in ACE i.e. that a higher V02peak
is not required for improvements in peak work capacity (Balady et al., 1990).
Future, studies examining ACE training should include an additional functional
test other than a V02peak test such as a CWT as improvements in performance
due to training may not always be reflected in a greater V02peak-
Typical representative data from two participants indicated that despite similar
V02peak pre and post training there were differences in ventilatory and metabolic
responses post training which are likely to have contributed to the increases in
PMP despite no significant increase in V02peak- The V02 and breathing frequency
responses showed a reduction for the same work load in the later half of the test
(Figure 6.3 and Figure 6.4). This reduction was also for the same work load was
also evident in the V'E/V'02 and V'E/V'C02 response (Figure 6.5 and Figure 6.6).
Further analysis (not shown) indicates that the ventilatory threshold (calculated
using the V-slope method) occurred later in the exercise period i.e. shifted to the
right. Therefore, the metabolic exercise response in terms of oxygen uptake has
148
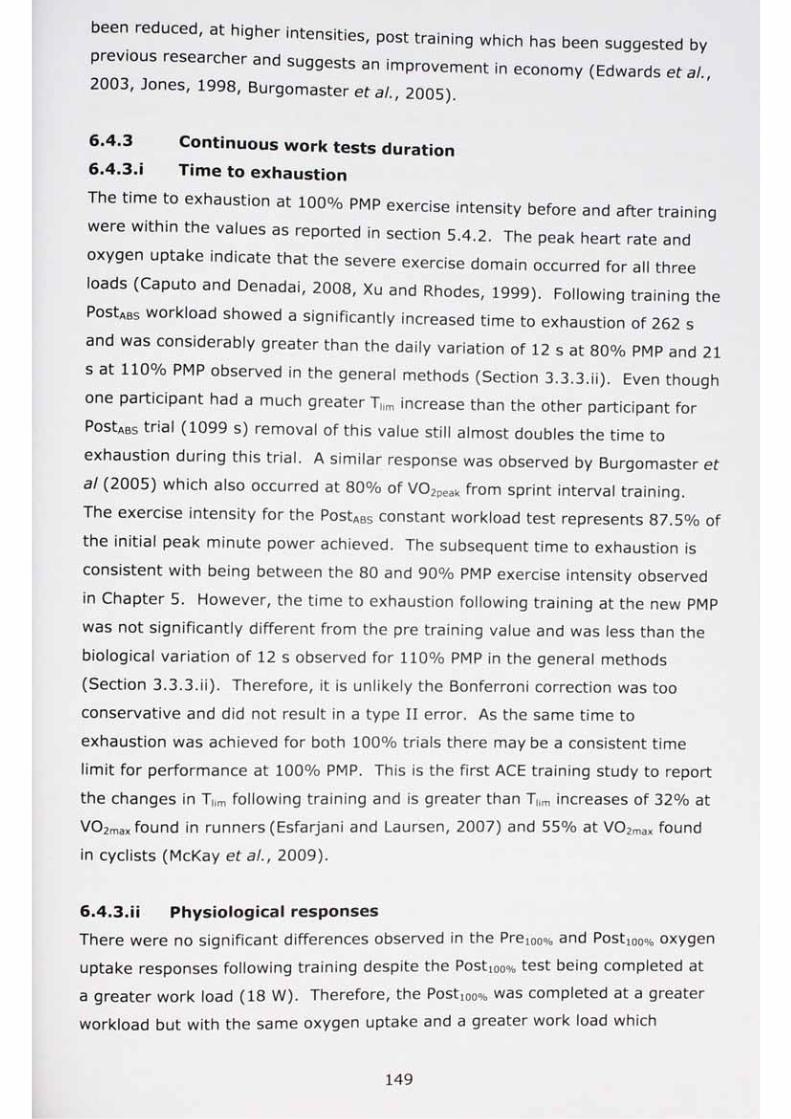
been reduced, at higher intensities, post training which has been suggested by
previous researcher and suggests an improvement in economy (Edwards eta/., 2003, Jones, 1998, Burgomaster et at., 2005).
6.4.3
6.4.3.iContinuous work tests duration Time to exhaustion
The time to exhaustion at 100% PMP exercise intensity before and after training
were within the values as reported in section 5.4.2. The peak heart rate and
oxygen uptake indicate that the severe exercise domain occurred for all three
loads (Caputo and Denadai, 2008, Xu and Rhodes, 1999). Following training the
PostABS workload showed a significantly increased time to exhaustion of 262 s
and was considerably greater than the daily variation of 12 s at 80% PMP and 21
s at 110% PMP observed in the general methods (Section 3.3.3.M). Even though
one participant had a much greater Tlim increase than the other participant for
PostABS trial (1099 s) removal of this value still almost doubles the time to
exhaustion during this trial. A similar response was observed by Burgomaster et
al (2005) which also occurred at 80% of V02peak from sprint interval training.
The exercise intensity for the PostABs constant workload test represents 87.5% of
the initial peak minute power achieved. The subsequent time to exhaustion is
consistent with being between the 80 and 90% PMP exercise intensity observed
in Chapter 5. However, the time to exhaustion following training at the new PMP
was not significantly different from the pre training value and was less than the
biological variation of 12 s observed for 110% PMP in the general methods
(Section 3.3.3.ii). Therefore, it is unlikely the Bonferroni correction was too
conservative and did not result in a type II error. As the same time to
exhaustion was achieved for both 100% trials there may be a consistent time
limit for performance at 100% PMP. This is the first ACE training study to report
the changes in T|im following training and is greater than T|im increases of 32% at
V02max found in runners (Esfarjani and Laursen, 2007) and 55% at V02rnax found
in cyclists (McKay et at., 2009).
6.4.3.ji Physiological responses
There were no significant differences observed in the Prei00% and Posti00% oxygen
uptake responses following training despite the Post!oo% test being completed at
a greater work load (18 W). Therefore, the Post100% was completed at a greater
workload but with the same oxygen uptake and a greater work load which
suggested an improved functional capacity (Figure 6.11). However, the lower
V02 at 120 s for the PostABS trial indicates a reduced cardiovascular load as HR
was lower, as represented by the 87.5o/0 PMP exercise intensity. There was a
significant reduction in RER at 120 s during the PostABS trial (now 87.5% of PMP)
This response indicated that despite a high anaerobic component to exercise at
this intensity there was a possible decrease in lactate acid production requiring
less buffering and therefore reduced C02 production which was reflected in the
reduced RER. Furthermore, RER was also lower during PostABS at exhaustion in
comparison to both Pre100o/o and Post100%. This result confirmed a previous study
observing a reduction in RER post-training following sprint cycle training
(Burgomaster et al., 2005) and indicated that training adaptations can improve
submaximal and maximal PMP but not time to exhaustion at maximal PMP although PMP was greater.
Representative data from two typical participants indicated that despite a similar
V02peak pre and post training for the PMP exercise intensities there were
differences in ventilatory and metabolic responses post training. During the
PostABs test both participants exhibited a reduced V02 for the same absolute
workload (Figure 6.10). There was also a marked reduction in breathing
frequency during the early stages of exercise at this intensity. Together with
V E/V'02 (Figure 6.12) and V'E/V'C02 (Figure 6.13) data there was a marked
shifted to the right the metabolic and ventilatory threshold (not shown). As
previously noted this is a classic training response despite no increase in V02peak
which is likely to have contributed to an increase the economy of exercise
(Burgomaster et al., 2005, Jones, 1998, Edwards et al., 2003). In comparison,
comparing Prei00o/o and Posti0o% (Figure 6.10) indicates that for participant 1
there was a reduction in V02 for a greater workload and for participant 2 there
was a similar V02 response for the greater workload, and breathing frequency
responses showed a similar response in both participants (Figure 6.11). The
V'E/V'02 (Figure 6.12) and V'E/V'C02 (Figure 6.13) appear similar pre and post
training for the Prei00% and Posti00% exercise intensity. Therefore, ventilatory
threshold (not shown) occurred at a similar time point but at a greater exercise
intensity post training. The responses shown could be a function of the type of
training undertaken by the participants as two-thirds of the training was
completed at higher workloads which require a greater ATP turnover. The
'aerobic' training was completed more as a recover sessions than an aerobic
training session. Thereforp t-ho .' wer 0LJtput response could be greater as a
response to the nature of the training programme.
The significant increase in PostABS heart rate at exhaustion suggested that 6-
weeks training may allow for sufficient time for HR to increase before a fatiguing
end point is reached. As noted earlier, following training the original 100% PMP
now represents 87.5% of PMP and elicited a similar time to exhaustion to the
90% PMP exercise intensity reported in section 5.3.2. This demonstrates the
improved functional capacity and improved high intensity exercise performance
following high intensity ACE training. The significant reduction in oxygen uptake
at 120 s during the PostABS test linked with a reduced RER would therefore
indicate an increased aerobic component at this intensity. With no increased
V02peak and changes in RER suggested an improvement in the economy of
movement. Arm crank ergometry training can increase performance
independent of an increased V02peak. Following training changes in PostABS
oxygen uptake, RER and HR reflect an improved functional capacity. Whilst
oo% can be achieved with the same cardiorespiratory responses as before
training but with a greater power output. Therefore, improved functional
capacity and increased economy following training have improved ACE
performance.
Post
6.4.3.iii Electromyography responses
The EMG data presented here were the first to be reported in relation to
performance tests before and after a period of ACE training In general muscular
activity during the 100% PMP test to exhaustion did not change before and after
training suggesting that training had a minimal effect on flexor carpi ulnaris,
biceps brachii, infraspinatus and anterior deltoid activity patterns. In the present
study local muscular fatigue was detected at TMm for all muscles apart from the
significant reduction following training for triceps brachii. Research by Hautier
(2000) comparing trained to untrained cyclists completing a series of short (5-s)
fatiguing sprints indicated that the trained cyclists reduced activation of their
antagonist muscles to improve effective transfer of power, and cycle training was
also found to decrease biceps femoris activity with no change in the rectus
femoris (prime mover) (Ziemba eta/., 2003). The present study suggested that
the biceps brachii has become more important in power production in this type of
ACE, as suggested by (Smith et a/., 2008) with greater torque produced from

iceps brach,, rather than triceps brachii. This is the first report of this pattern of
ac -v, y ollowing ACE training and although torque production was not measured
,t may answer questions raised by Smith et a/., (2008) ahd Bernasconi (2006) in
that trained participants change their pattern of muscle activation and therefore torque production following training.
The significant difference for the external oblique at 120-s post training of the
absolute load trial indicated the importance of this muscle to ACE performance
The longer exercise duration for Post„s trial suggested reduced muscle activity
and was an expected training adaptation. Support for this training effect is that
there was almost identical EMG activation at 90% and 100% of PMP as shown in
Chapter 5. The 90% PMP exercise intensity being close to the 87.5% of PMP
exercise intensity that the PostABS trial represents. Reduced activation of the
external oblique at 120-s PostABs may allow for a reduction in respiratory stress
as indicated by a lower RPEcr at this time point. There was a weak correlation
between these two variables (R2 = 0.239). A number of studies have shown that
upper body exercise may impede respiratory function compared to lower body
exercise due to differences in muscle afferents and the greater need to stabilise
the trunk (Blasio et at., 2009, Romagnoli et at., 2006, Martin et at., 1991,
Ramonatxo, 1996). Reducing the external oblique activation may assist in
reducing the impedance to respiratory function. Anecdotally a number of
participants suggested that they felt 'more out-of-breath' during PostABS following
the training period indicating changes in breathing patterns might have taken
place allowing a less restrictive effect. In addition, abdominal fatigue, which has
been reported in cyclists completing a 90% PMP test to exhaustion (Taylor et at.,
2006) and the reduced activation shown in this thesis may be an adaptation to
the training. A further study could evaluate changes in breathing frequency and
tidal volume following training, as faster/slow cadences are known to
increase/decrease respiratory drive (Price eta/., 2007), and the data suggested
that respiratory drive could be influenced by relative load at the same cadence.
With no significant differences in EMG activity at exhaustion in the continuous
work tests, muscle activation may have reached maximal levels or a fatiguing
end point. The data generated using EMG responses is by its nature more
variable (Murley et at., 2010, Bigland-Ritchie, 1981). Analysis of mean* <-41 l u u i t ^ n u i i c y l • r ^ ~ — ------------ ------- ' ' '
amplitudes indicated there was not a great variability pre and post training. The
methods for the recording the pre and post test EMG signal were as robust as
possible and w,th,n the scope of current EMG knowledge and analysis techniques
available. Therefore, greater power output was achieved with little change in
EMG activity. As there was a greater power output and no true meaningful
change ,n EMG this indicates a shift in the muscle function resulting in an
improvement m power output. Thus, indicating that the Bonferroni post-hoc
correction was not too conservative. Future studies are recommend to
investigate the contributioh of the external oblique and other muscles of the
trunk to ACE performance in relation to factors such as the strength of these
muscles and their relative contribution to ACE performance. Previous research,
not related to ACE, has concentrated on their contribution to general power and
stability (Willardson, 2007, Akuthota, 2004) and whether reducing the activation
of these muscles reduces respiratory load and improves performance and this is recommended to be investigated during ACE.
6.4.3.iv Kinematic analysis
This is the first study to report kinematic data before and after high intensity ACE
training. Following training there were significant changes in kinematics when
compared to pre training. The post training results for all three kinematic
variables (C7D, elbow joint angle ROM and trunk rotational velocity) showed that
participants alter their movement pattern relatively little from 30 s to TMm and
therefore participants, pre training, alter their body position at 30 s to 120 s.
The significantly lower HR at 30 s for Posti0o% against both Prei00% and PostABs
trials may be an indication that this movement pattern is the most efficient i.e.
there is a greater power output for the same 02 consumption. A previous study
has shown that as cadence increases, trunk rotation decreases (Price eta/.,
2007). This is in contrast to studies examining, upper and lower body exercise
(So eta/., 2004) and lower body exercise suggesting that untrained participants
increase their range of movement after the induction of fatigue (Strang et a/.,
2009, James et a/., 2010). For the continuous work tests the post training
kinematics differ significantly from the pre training responses at 30 and 120 s.
The response pre training indicates that participants alter their body movement
patterns during exercise more than when trained. Therefore, trained participants
adopted a relatively unchanged position and technique until exhaustion. In
Chapter 5 the four exercise intensities examined all demonstrated the same
trunk rotation velocity at exhaustion. This shows that the same trunk rotation
153

ve,octy occurs in trained and untrained participants at the point of fatigue
regar ess of exercise intensity. Therefore, the current data indicated that once
a given trunk rotational velocity has been achieved fatigue is likely to occur i.e. a
,omec an,cal end point has been reached. Trunk rotation velocity may be one
of a number of limiting factors to exercise or a determinant of fatigue in the
population studied. This may be related to the same end-point being reached for
EMG external oblique (Figure 6.16, at T „ regardless of resistive load. Contrary
to this, while some participants reported they were aware of using their
abdominal muscles, no participants reported that they ceased the Tllm trials due
to abdominal fatigue. Further studies on the interaction between trunk rotational velocity and muscles of the trunk are recommended.
6.4.4 Conclusion
The results of this study have shown that a 6-week arm crank training
programme can improve performance measures during a 30-s WAnT, and during
high intensity constant work load performance. The uniqueness of the study is
that it draws on physiological and biomechanical measurement to suggest how
these improvement in performance occurred. The representative participants'
data indicated improvements in economy at higher exercise intensities. Future,
research is required to examine closely the aerobic response and metabolic and
ventilatory adaptations. Additional information provided by EMG and kinematics
suggest that the improvements in performance were not necessarily solely
connected to changes in metabolic factors. Unlike a number of previous ACE
studies (Marais et al., 2004, Smith eta/., 2008, Smith eta/., 2006c, Ahlborg and
Jensen-Urstad, 1991, Koppo et a/., 2002) all CWT studies were continued to T|jrn
allowing for a full comparison of the time course of fatigue i.e. from start to
fatigue end point (T|im). For the Wingate anaerobic test there were
improvements in PPO and MPO, EMG activity in the anterior deltoid and
infraspinatus was reduced and there was an increase in trunk rotational velocity.
In general, at Thm for the continuous work test physiological, EMG and kinematic
responses were the same at the point of T|im. However, with PostABs it takes
greater time to get to the same point and with Postioo% a greater power output
can be maintained. Regardless of load the same kinematic end point before and
after training is reached. However, physiology, EMG activation and kinematics
may change prior to reaching T|,m. Further research is required to analyse the
physiological and kinematic responses across the time course of the activity and
154

within each duty cycle and anv int-ra ,y tra-individual responses i.e. is a greater ACE
power output related to qreater or |p « P ry or lesser bocJy movement and are there bilateral
erences ln responses- The results also suggest that training the bicepsbrach,, and external obliques may improve ACE performance independent of
specific ACE training - a further training study would be needed to confirm this.

Chapter 7
General discussion
7.0 Overview of studies
While arm crank ergometry (ACE) is not an area new to research, in comparison
to leg ergometry it is still relatively underexplored. This is despite a large
number of sports that require a majority or a significant component of
performance from the upper body such as, sailing (Easton eta/., 2007, Neville et
aL' 2009)' kayaking (Bil|at eta/., 1996, Forbes and Chilibeck, 2007), swimming
(Hawley et a/., 1992) and gymnastics (Jemini et a/., 2006) or the specific sport of
hand cycling (Hopman eta/., 1995, Lovell eta/., 2011b, Verellen eta/., 2011).
Additionally, the benefits of upper body exercise have been applied to health
scenarios (Bulthuis et a/., 2010, Schrieks et a/., 2011, Westhoff et a/., 2008,
Pogliaghi et a/., 2006, Tew et a/., 2009, Ilias et a/., 2009). Despite these
benefits and applications, the majority of early research concentrated on
comparisons of cycling ergometry to ACE (Reybrouck et a/., 1975, Vokac et a/.,
1975). However, recent research has been more specific in analysing
physiological responses to various exercise intensities and durations (Lovell et
a/., 2011a, Castro et a/., 2010, van Drongelen eta/., 2009, Smith eta/., 2008,
Lusina eta/., 2008, Smith eta/., 2007a).
Despite an increase in ACE research, a number of key areas have remained
relatively unexplored. One such area is that of the fatigue responses to different
resistive loads and load optimisation in maximal and high intensity exercise. If
the mechanisms of fatigue at different intensities were better understood then
there is scope to improve the performance outcomes of ACE whether it is for
sport, exercise or health benefits. Therefore, this thesis sought to answer a
number of important research questions in these areas. These questions
regarding fatigue and optimal loads at maximal and high intensity exercise were
investigated using a combination of physiological, electromyographical and
kinematic analysis. The combination of which has only been considered in three
previous studies (Smith eta/., 2008, Bressel and Heise, 2004, Price eta/., 2007).
Study 1 was the first study to report fatigue and the physiological and
biomechanical response during a maximal upper body test using the Wingate
156
anaerobic test (WAnT). This study involved a variety of resistive loads to
examine fatigue and sought to re-examine the optimal resistive load
(uncorrected and corrected) in relation to fatigue for upper body WAnT
performance. In this study, uncorrected peak power output increased with
resistive load whereas corrected peak power output did not. The analysis of the
EMG activity found that the biceps brachii distinguished between loads for peak
power output. This indicated that the contribution of the biceps brachii to power
production during the WAnT and its increased activation when required to
accelerate the flywheel rapidly. Additionally, all the EMG sites, apart from the
vastus mediahs and lateral soleus, demonstrated increased activation at
fatigue/mimmum power, which indicated that as resistive load increased EMG
activation also increased. Kinematic results were less conclusive although there
were changes in torso distance in relation to the ergometer and changes in trunk
rotational velocity which may assist in power production. This study was unique
in that it combined the analysis of EMG and kinematic data in conjunction with
performance across a range of resistive loads. Participants are advised to
concentrate on flexion of the upper arm and use muscles of the trunk to aid
power production and trunk rotational velocity. A 4% body mass resistive load
represents a combination of power and cadence. Although, if individuals want to
train for power then as the EMG activation was the greatest at the 5% resistive
loading and therefore is suggested to result in the greatest recruitment of muscle
fibres then this may be a more appropriate resistive load.
For consistency, in study 2, the same EMG and kinematic parameters were
examined as for study 1. The addition of respiratory measures provided a
further layer of analysis to examine fatigue during high intensity upper body
exercise. Additionally, this study examined the optimal load for continuous high
intensity exercise performance and suggested that an exercise intensity between
90% and 100% of peak minute power (PMP) is sufficient to achieve V02peai<- The
main findings were that at exhaustion oxygen uptake and heart rate were similar
across exercise intensities and that not all the exercise intensities were in the
severe exercise domain as V02peak was not always achieved. However, there
may be differences in the degree of anaerobic metabolism as the respiratory
exchange ratio data indicated that RER increased with exercise intensity at
fatigue. Contrary to study 1, there was no distinguishing muscle in terms of EMG
activity. Electromyographic activity increased over time, indicative of peripheral
157

fatigue, m all trials and was greater at the 100% and 110% V02peak intensity
trials especially for the flexor carpi ulnaris, biceps and triceps brachii. The data
for trunk rotational velocity indicated that rotational velocity rather than trunk
stabilisation occurs as fatigue increases which was also found with increasing
fatigue for the WAnT in study 1. Therefore, trunk rotational velocity may
respond more to the effects of fatigue than to the resistive load or the exercise intensity.
The results from study 1 and 2 emphasised the important contribution of a
combined analysis (physiology and biomechanics) in understanding fatigue
during maximal and high intensity ACE. Fatigue was not just physiological but
accompanied by changes in muscle activation and kinematics, and therefore
technique. This combination of analysis enabled possible links between the
measured variables to be suggested such as increases in EMG activation at
greater exercise intensities which may result in recruiting greater type II muscle
fibres (detected through an increase in RER). Highlighted throughout both
studies, and in the previous literature (Bernasconi et al., 2006, Smith eta/.,
2008, Yasuda et a/., 2002), was the absence of data concerning the influence of
training on the multi-faceted nature of fatigue. For example, physiological and
metabolic improvement may be demonstrated after training but this may not
account for all the improvement in performance (Loftin eta/., 1988, Magel eta/.,
1978). Performance improvements could be a result of a change in technique
reflected in changes in EMG activation and/or kinematic changes (Gabriel, 2002,
Chapman et a/., 2009). The previous two studies indicated the importance of the
biceps brachii to WAnT performance and the influence of trunk rotational
velocity. Therefore, the aim of study 3 was to examine changes in performance,
physiology and biomechanics before and after an upper body exercise training
programme.
To date, links between training responses specific to arm crank ergometry and
changes in fatigue responses to maximal and high intensity ACE to exhaustion
have not been reported. Study 3 therefore involved a combination of ACE
training methods utilising maximal sprints with no restrictions on cadence and
constant load efforts with a constant cadence. The results showed significant
increases in PPO, mean PO and cadence for the WAnT. Therefore, the training
study was successful in improving maximal intensity ACE. Despite study 1
indicating the significance of the biceps brachii to WAnT performance the only
significant changes in EMG were a reduction following training for the anterior
deltoid and infraspinatus muscles. Changes in trunk rotational velocity at
corrected and uncorrected PRO indicated technique improved and resulted in
performance improvements over changes in EMG activation. Although there was
no change in V02peak, there was an increase in peak minute power (PMP)
following training. For the high intensity exercise test to exhaustion (at 100% of
PMP) following training there was a significant increase in time to exhaustion
(T,im). For the second high intensity exercise test to exhaustion at the new and
greater PMP time to exhaustion was close to the pre training time to exhaustion.
The EMG results for the triceps brachii activation indicated this was reduced for
post absolute and post 100% PMP and there was also a reduction in activation
for the external oblique at 120 s after training. Kinematic analysis indicated that
at post 100% PMP that elbow joint angle, trunk distance to the ACE and trunk
rotational velocity changes minimally during the test and indicates an
improvement in performance through a more consistent movement pattern.
The first two studies highlighted the importance of biomechanical analysis in
understanding the physiology of performance and fatigue. Study 3 confirmed
that changes in technique (a combination of EMG and kinematics) following
training contributed to improvements in performance. Interestingly at point of
exhaustion during the high intensity exercise test to exhaustion, the kinematics
were the same before and after training i.e. training has improved technique and
performance prior to Tnm but not at the end of the test i.e. regardless of training
status kinematic fatigue is the same at the end of the test.
7.1 Limitations
Despite a well developed method, during the course of investing a number of
further methodological issues were raised and future studies should consider
accounting for the following observations. The EMG data was a robust as
possible for the systems and processes used. Flowever, further development of
the method to normalise EMG activity may assist the interpretation of the EMG
signal, a suggestion would be to analyse the signal against a variety of loads
rather than just 80% of peak minute power. Although due to the variability in
EMG activity (Murley eta/., 2010) the normalisation method should be
consistent across trials and in the studies in this thesis this was the best current
practical method available (Rouffet and Hautier, 2008, Albertus-Kajee eta/.,
2010). The results for the vastus medialis and soleus (refer to section 4.3.3.)
suggested that there were no differences in muscle activation between PRO and
end PO during the WAnT. However, the high standard deviations may have
contributed to the statistically non-significant results and biological variations
may have contributed to this. This may have been due to the normalisation
technique that was deemed reliable for the upper body but potentially not for
lower body. Future studies could examine a different technique to normalise the
lower body such as that from the peak EMG activity during the WAnT test (Rana,
2006). An analysis at set time points or crank duty cycles may establish changes
in EMG with changes in power output and kinematics. The ability to establish
specific duty cycles was not available with the Monark ergometer. This may have
resulted in missing data in the first second(s) of the WAnT that could corroborate
the results that the greater biceps EMG was a result of an increase in load to overcome the inertia of flywheel.
The training study used a combination of training sessions to provide a sufficient
stimulus for a training response based on the previous body of published work
(Ziemann et al., 2011, Magel et a!., 1978, Loftin et at., 1988, Billat et at., 1999).
As the training programme was focussed around high intensity exercise future
training studies could concentrate on comparing aerobic and anaerobic
programmes such as a 30 min aerobic effort against one of the interval training
or short maximal sprints to analyse if there are differences in the training
response. A longer training programme (greater than six weeks) would allow for
monitoring of training responses during the training period and may give an
indicating of when these responses occurred. Therefore, it may be possible to
establish specific time points where performance improvements occur e.g. when
changes in the WAnT occur and if this is before/after or at the same time as the
changes in the high intensity exercise test to exhaustion and peak minute power
and V 0 2 p e a k -
7.2 Future workAlthough positive correlations have been found between Wingate ACE
performance for a number of sports such as swimming (Hawley et al., 1992),
handball (Kounalakis et al., 2008) and gymnastic (Jemini et al., 2006), there
may not be a link for swimming (Guglielmo and Denadai, 2000). Further
160
research could investigate ACE training as a means to improve specific sports
performance e.g. whether improvements in Wingate power output translate to
improvements in swimming performance. As a relationships between ACE
performance and performance sport have been shown a future training study
could use upper body exercise to investigate if ACE training can improve training
in specific sports, e.g. it may help to offset the effects of fatigue in judo, or
improve the power output in swimming. Also, where the role requires a
significant contribution from the upper body ACE training my assist in this e.g.
fire service (Gentzler and Stader, 2010, Eglin and Tipton, 2005), forestry
(Kurumatani et at., 1992) and rescue using a stretcher (Knapik et a!., 2000).
Although the aerobic contribution to lower body WAnT performance has been
examined (Smith and Hill, 1991, Hill and Smith, 1993) this has not been
investigated across a variety of loads for the upper body and future studies could
examine whether the aerobic contribution differs between loads. If this could be
established then it would also help to explain changes in Wingate power output
found in this thesis following training. Additional studies could examine in closer
detail the aerobic responses during the continuous work test.
Further studies examining fatigue could consider additional analysis of the EMG
signal for changes in frequency and muscle fibre conduction velocity which would
add to EMG changes observed in this thesis (Rainoldi et at., 1999, Taylor et a!.,
2000, Cifrek et a/., 2009, Stewart et at., 2011) and changes to these parameters
following training (Aagaard, 2003). This was not possible for the current study
the crank arm position could not be recorded with a Monark ergometer and such
a detailed study would require crank arm position to be aligned with the EMG
signal and torque (Smith et at., 2008). Torque production could be analysed
using SRM power cranks (SRM, Julich, Welldorf, Germany), or using a Lode
ergometer (Groningen, Netherlands).
Training studies could examine the influence of cadence on performance
outcome, e.g. does training with a greater resistive load and low cadence
compare to training with a greater cadence and lower resistive load for WAnT
performance. As there was an important contribution of the trunk to
performance (EMG and kinematic), it would be useful to investigate if core
stability training alone and/or in combination with standard ACE training could
161

improve ACE performance. Also, specific weight training may be investigated for
improvement in ACE performance as a previous study observed greater oxygen
uptake post weight training (Swensen eta/., 1993). This would inform the
results of this thesis reporting whether cadence training affects performance or
whether it is just the 'maximal' effort regardless of the cadence or type of muscle
contraction. Weight training programmes would confirm whether the adaptations
were cardiorespiratory based or restricted to muscle recruitment or hypertrophy.
In all three studies the population were male students and not upper body
trained, this provided continuity in the data collection and in study 3 provided an
opportunity to train these participants to become upper body trained. Future
research should examine a broad range of participants such as females and
trained upper body athletes (male and female, general and specific (hand
cycling) upper body sports) thereby adding to the data for the optimal load and
physiological and biomechanical response for a specifically trained population.
7.3 Practical application
The results of this thesis indicate the importance of combining power output,
EMG and kinematic analysis in research studies to provide a comprehensive
study of the effects of fatigue and alterations in fatigue and exercise performance
following training. Previous studies have demonstrated that in persons with
tetraplegia (Johnson eta/., 2004, Jacobs, 2003) the appropriate WAnT load is
dependent on the level of spinal cord lesion. The results of this thesis continue
to emphasise the importance of technique, trunk rotational velocity and
activation of the external oblique to fatigue and greater exercise performance
and where possible training and testing should include this when absolute power
output (peak or sustained) is required. The effects of training in this study
demonstrated how effective 6 weeks of ACE training can be, therefore, given that
arm crank training can improve wheelchair propulsion (Dicarlo, 1988, Sedlock et
a!., 1988), this type of training could successfully improve short and long
duration wheelchair propulsion. The training may also help where short bursts of
speed are required e.g. wheelchair basketball, tennis, rugby (Goosey-Tolfrey et
at., 2006). Although individuals without trunk rotation ability (i.e. high level
spinal cord injury) may not be able to benefit as much or, more likely, improve
through other mechanisms a combination of training intensities may further
improve beneficial adaptations to their lipid profile that have been found in
previous studies and can increase V02peak and reduce fat mass (Dolbow et al.,
2010). Study 2 suggested that at 80% of PMP would be beneficial to training in
these individuals as this intensity is high enough to enable physiological
responses similar to higher intensities but with a lower RPE and heart rate prior
to exhaustion. Additionally, a training study could use only anaerobic training of
short duration and high intensities that has been demonstrated to be beneficial
for time to exhaustion and maximal uptake following body training (Burgomaster et al., 2005, Gibala et at., 2006).
Participants that are not wheelchair users can improve their cardiac function
(Billman, 2002, Zwierska et at., 2005) through ACE training. However, these
participants may have contraindications to maximal exercise testing (Yosefy et
al., 2006) and submaximal estimates can be reliably used (Birkett and Edwards,
1998, Abadie and Schuler, 1999) to predict V02Peai<- Therefore, the results of this
thesis indicate that, with some modification, training used in study 3 could be
appropriate to participants to produce rapid improvements in strength or power
output which should translate into improved functional ability such as, walking
(Zwierska et at., 2005) and mobility in elderly patients after total hip
arthroplasty (Grange et al., 2004).
Previous studies have shown a relationship between ACE performance and sports
performance (Hubner-Wozniak et at., 2006a, Evans et al., 1993, Jemini et al.,
2006, Hawley et al., 1992, Volianitis et al., 2004a) and has been used as a
battery test criteria in volleyball (Driss ef al., 1998), climbers (Mermier, 2000),
javelin throwers (Bouhlel et al., 2007) and surfers (Mendez-Villanueva and
Bishop, 2005). Therefore, for athletes in a number of sports where time,
location, practically or injury does not permit specific training then ACE training
is likely to be beneficial to performance in these sports. The training study has
shown that a short period of ACE training can result in large increases in ACE
performance which is likely to provide beneficial outcomes for performance in
these sports and should be incorporated into training programmes.
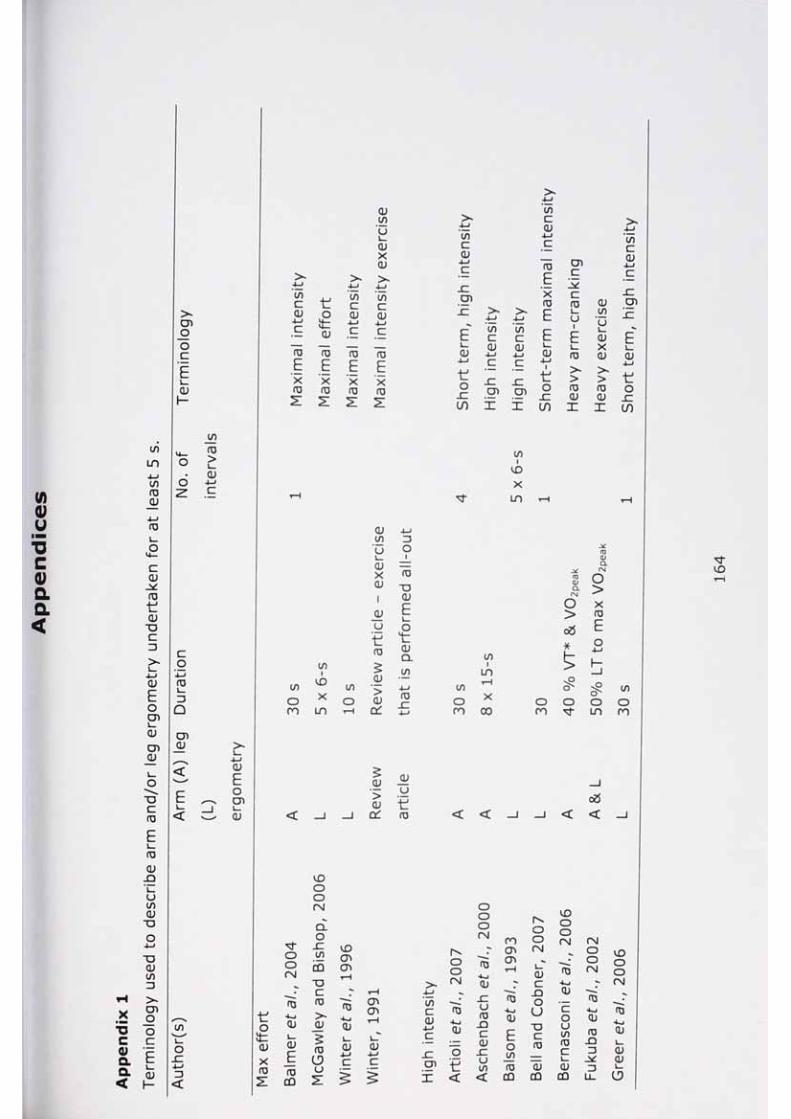
CDO0c
1
ECD
tocCD
ruE
) M M
Xru
itCD
"ruE
•
XCD
CD
CDE
1
XCD
CDCO ) «—■uCDXCD
CO CO
CD4—*c
roEXfO
CO
CD
CD
ECD
tO
t/)
co coCD CD
CD CD
COCCD
ruE
» —
XruE
CDitO
if)
CD
ruui
E Eru
>ruCD
CDcou
CDXCD
>ruCD
cocCD
CD
ECD
to
CO
(AVuIB
T3C
aa<
X�
T3C<uaa<
COLO
COruCD
ru
O
CD
ru
CD"D
CDEoCDCDCDCD
O
U
ru
EruCD
cjcoCD■a
CDco
CDoo
o
6
ru
O
CDCD
<
E
<
CO
1 lo CD , -
<
inru>CD
CDEoCDCD
tOitCDXru
coOro
<
rsi
fU
CD
CDEruCO
coi
COXLO
CO
OCM
COCO
ru
QJ
£ru
Ou
CDCO
• mmmm
CJCDXCDI
_CD<J
• a w
ru
£CD
CO >CD C6
COCDCD
ru
£CD>CDor
cr>CD
CD
CD CD
01
"ruT3CDE
CDCLCO
ru
QJutru
(OcCD
CD
CO
ro
r\ooCM
ru
CD
coi
LD
X00
< <
oocn
<U
CD
uruJO
- — CDO SZZ3 ut: co< <
COI
COXlh
cnCDCD
ru
CD
Eo_coruco
oro
r\
ocnj
CD
_QOuTDcru
CDCO
(TJ<DClrg
o>66*
£v O
O
CO
<U CL r\i
o
CDCO
XruE
in
66< <
fN
_ roOuCOru
CDru
coOro
Or\i _co
- . . ofU r o
- CM
ruCD
CDCD
C9
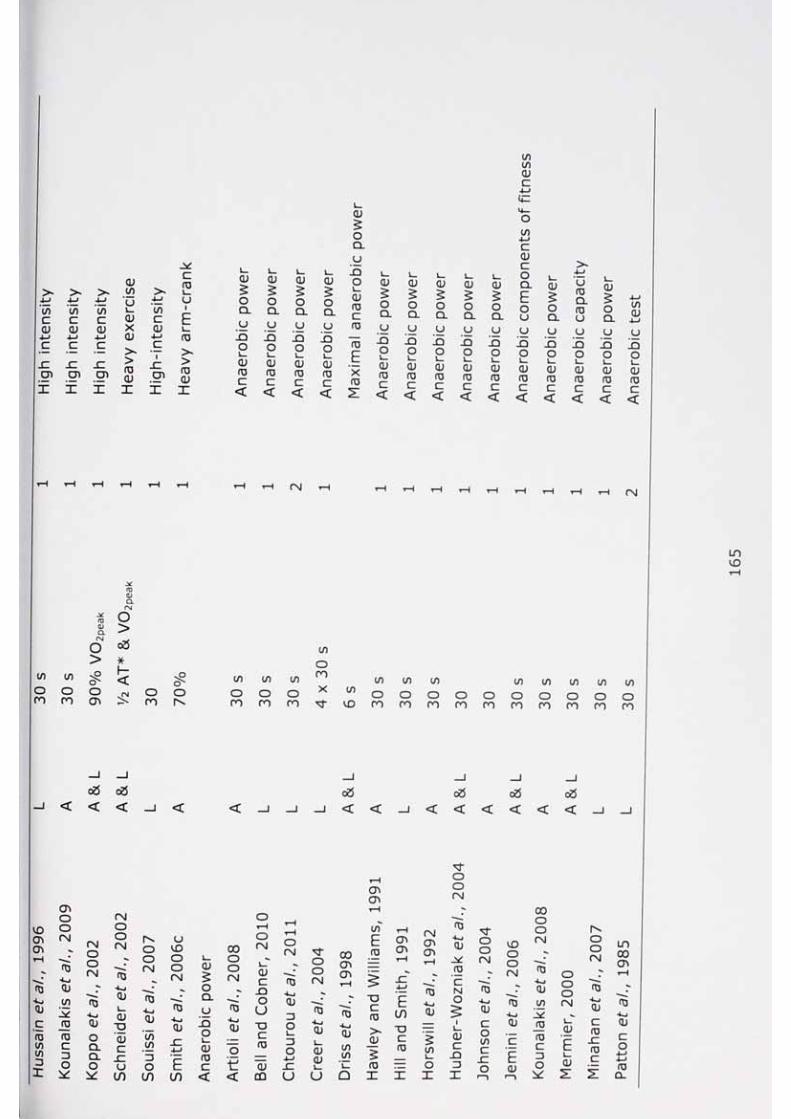
(/)toCD
CD
CDto
• • iHi uCD to C/) 1— l/)C c c CD cCD CD CD X CD4—> QJ 4-JC •- c c1
cn 03 03 C7>• • • —»
ruu 03 — .y .y .y u u u u
rsl fNJ
if)
to l/)
ro
"9O' to if) roif)
to to to to to if) (/) toO o o o X o o o o o O o o o oro c n ro to ro ro ro ro ro ro ro ro ro ro
03
rsl
03
0)
Qj
rsl
03
Qj
rsl <N
_ 03CD -o _ CD
U
rsj
CDCD
CD
r\j
ro rsl
CD03�U-lCD
c3 o3 66 c3< < -J < < < < < <
t-H OCT\(J)
orsl• 00
03
QJ
= 03
QJ
03
03
QJ.x rsl 5 - rsl
03-U->QJ 03
QJ
rsl
03rsl
03
QJ
CD
03
QJ
03 r= QJ _
Ana
erob
ic t
est
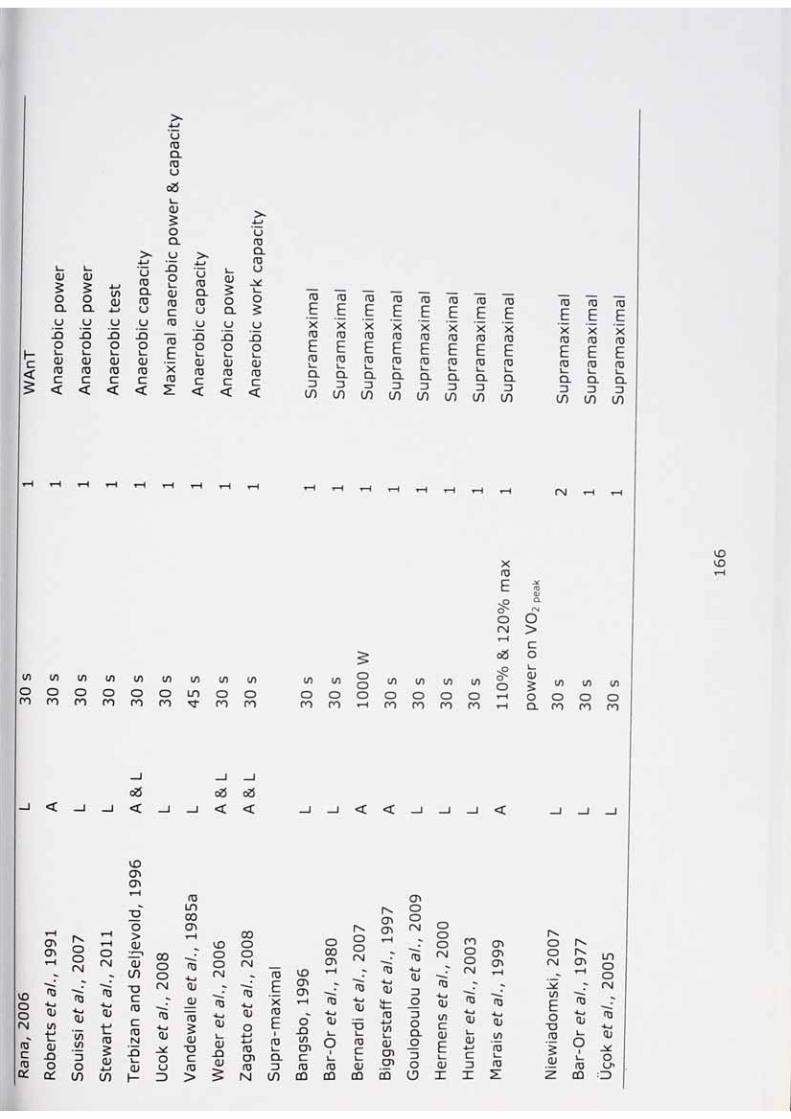
<
CD£O
c j•
_QOCDCDC<
CD£OQ_CJ_QOCDruc<
COCD
CJ
CDruc<
c jru
CDCJ
o &
CD
o
CJCJru
• mmmmJOO
4-JCJru CD
£CL CD Clru ru ru Ou c cj CLCJ ru c j <J_Q "ru
E
•JQ _Q
O O OL.CD CD CDru X ru ruc ru c< Z < <
<J03CLfUCJ
O£u-QOCDruC<
CD
EIXfUEru
ruE»XruEru
C l CL 13 D(/) tn
ruE
• > H a
XruEruCL3(/)
ruEIXruEru
ruEiXruEru
ruEXruEru
ruE)XruEru
ruE
> w
XruEru
Q- Q_ Q_ Q_ Q_=3 3 D D Dl/) ( / ) ( / ) ( / ) (/)
XruEO
O
rsj
a)(D
rsj
O
ru ru ruE E EX X Xru ru ruE E Eru ru ruC L CL o . 3 D =>cn to co
r\i
CO CO co co co co CO CO co co co5oo CO CO CO co
o3
O'O
O
CD£o
CO co coo o o o o o LT) o o o o o o o o o o o oro ro ro ro ro ro ro ro ro ro 1—1 ro ro ro ro i-H CL ro ro ro
< 1 1 <
COOOtM
rucrucx:
0303
fU
Q)(OtCD-QOq :
f\
opm
fU
CDinto3OCO
fN
ru
CDtru£CDCO
03cn
CD
CDcn
ru
ruN
CD
CO
rsj
fU
CD
OCJ
ruLDCO03
ru
CDQJ
"ru£CDX3
ru
ru
(D
CD
CD
00O
O rsj rsl - ru
% . iXruEiruCL3cn
CDO
ruCT>ruN
tD0303
co03cruCO
O0003
ru
r\orsl
ru
01ru
CDCD :=
ru
CD
r\0303
ru
(Di trucoCD0303CO
03
Orsj
fU
CD
001_o
OLD
oorsl
ruCDco
CDECD
roorsj
ruCD
CDc
03 o rs03 o03 rsl 031-1
_X 2*—* CO ~ruru EQJ o
T3 QJco ruru
• » £
01ru CD ruZ z: CQ :
LT3
r rsi
fU
CD
O<~n
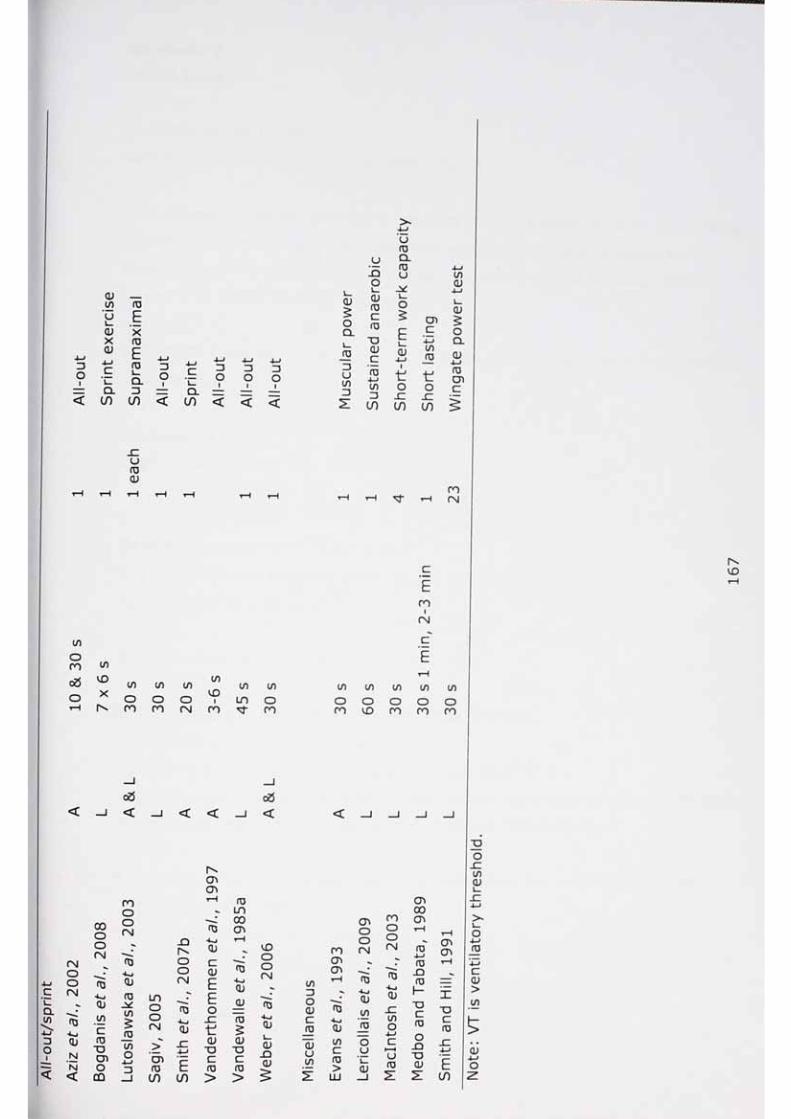
01
<
inOro66
<
CDNN<
CDinI
UCDXCD
Q lCO
inCDX
COE
P
XCDECOCL
00orsi
fD
CMOOPMr cd
Tg
co"DCDOCD
UCOCD
66<
roorsl
fD
CDCO
01
CO <
in£coino
o_CO
01 0
1 01
< < <
< <66
<
f \ChCT>
f0
COLO00CX>
f\
rsl
lof0
CDcCDEEo
„ &
CO rsi
uCOCLCOu
CD£o
o<: CD
CO
uin
u-QoCDCOcco"OCDcJOin
CO CO CO
inCD
E .5QJI
o
in_ro
to
EroI
rsi
E
<
rocr\ooo>
CD<ioCL
CDCOCD
rocr>cr>
rsi cn ro
rsi
>CDCOCO
CD t:CD
CDQJ
To£CD
CO
CD
CD
ECO
co co CD
in=3OCDCCO
q3u1/3
f0 f0co_QCO
CO
CDincCO>LU
CDinco
Ou
CD
CD
rorsl
in in in inIDi
in in in in in in ino O O uo O o o O o oro ro rsl ro ro ro ID ro ro ro
o>cr>
inO co
o_Q
“D
co
uCO (D E
CO
inCD
OCO
CD>in
• mmamm
$• m
QJ
O

Appendix 2
Ethics form
Graduate School Ethics
SCHOOL OF HEALTH RESEARCH ETHICS FORM
This document is to be used by all School of Health students or staff undertaking
research. Students must submit this form with their research proposal as
instructed by their lecturers. Staff needing approval for staff research need to submit it to Sheryl Munday, Thornby 2.
1" Project tltle: Physiological and biomechanical responses during high intensity upper body exercise
2. Course of study:
Staff - sport and exercise Graduate School study
3. Student number
Or if staff, name: Christopher Talbot
V I have read and agree to adhere to the School of Health guidelines for conducting ethical research
4. Supervisors' names: N/A
5. Use of human participants: Tick one of the following:
V I am using human participants.
I am using archival data where individuals are identifiable
I am not using human participants or data where individuals are identifiable and
therefore do not need to complete the remainder of this form.
6. Participants: Tick the box which most accurately describes your sample:
Children under 16 years
16-18 year olds
Adults over 65 years old
NHS Patients
Social Care Clients
168

Health or Social Care Professionals
Members of the public (general)
V Members of the public (specific such as professional athletes, teachers, -
describe here: Adult students (aged 18 -40) at The University of Northampton
Members of vulnerable groups (frail elderly, disabled athletes, recently bereaved,
members of support groups - describe here :....................)
Other. If other, describe your sample here:
7. Issues for concern: Tick below any issue that relates to this research.
Involves the use of human organs
Will be carried out on NHS or Social Services site
Will be conducted using NHS equipment
Involves invasive techniques (e.g. Taking of blood)
V Involves participants undertaking tasks they would not normally undertake
Involves any activity that might be described as an 'invasion of privacy'
Involves deception
Involves a topic that would be considered 'sensitive'
Involves the collection of data that is not anonymised (contains identifying
information such as name and address)
Requires participants to have a certain level of fitness.
V Requires participants to be screened (e.g., a medical questionnaire) before
acceptance into study
Other. If other, describe here:
8. Methodology: Tick the appropriate box. Full details of what you will do and
where it will happen, should be provided in the accompanying Proposal.
Questionnaires
Interviews
V Experiments
Observations
Archival
Other. If other, state here:
169

9. Recruitment Process. Tick the process that best describes how you plan to
recruit participants. Full details of how you will recruit and where it will happen,
should be provided in the accompanying Proposal.
V Via poster in a public place such as a library or community centre
Packs will be provided to named person in an organisation/group to be distributed on my behalf
Asking personal contacts to pass my information packs to their contacts
Will be asking friends/family
Cold calling
Other. If other, state here:
10. Recruitment material. Tick all the recruitment material you will be using.
You must use the School of Health templates to produce those. In addition, they
must not be used until seen and approved by your supervisor.
V Recruitment poster
Recruitment letter to named person in an organisation/group who will be
distributing 'Packs' on your behalf
Recruitment letter to potential participants
\/Participant Information Sheet
V Consent form
NHS ethics application form
Other. If other, state here:
11. Risk assessment: Some projects will require risk assessment for
participants and/or researchers. In other words, there is a possibility that
participants and/or researchers will get hurt collecting data. If so, a risk
assessment must be conducted. Tick the appropriate box below concerning your
need for risk assessment.
There is no risk of injury to participants and/or researchers, so no risk
assessment will be conducted.

V There is a potential of injury to participants and/or researchers, so risk assessm ent has been (or will be) conducted.
A copy of the risk assessm ent has been seen and approved by the Supervisor
Part B To be completed by staff:
Com m ents:
Accepted with no am endm ents □ Accepted with m inor amendm ents
Accepted with m ajor am endm ents □ Not accepted □
Proposal to be returned to Ethics Com m ittee Yes [ ] No [ ]
S igned on behalf of Ethics Advisory Group
Date.
Resubm ission:
Date to be subm itted by:
S ignature on behalf o f Ethics com m ittee Date.
T ick which of the follow ing needs to be developed. Supervisor to sign off once
satisfied
Is needed Final copy seen and approved by supervisor
Recru itm ent poster V
Recru itm ent letter to ind iv iduals
V
Recru itm ent letter to organisation
V
Partic ipant Inform ation Sheet
V
Consent form V
External application V
Other:
171

Consent Form (Exam ple from Chapter 4)
For Participating in the Study of:
Load optim isation for arm crank ergom etry during a 30-s W ingate test and
ana lysis of b iom echanics and physiological factors affecting performance
(Deta ils of project can be found in attached letter and information sheet)
I have read the study information sheet & understand
what is involved.
I understand that the inform ation I d isclose will
remain confidentia l and that my data will be destroyed
or returned to me after being collated.
I understand that I can w ithdraw my participation at
any tim e.
I am w illing for my blood pressure to be recorded
I am w illing for my upper arm muscle volume
& circum ference to be measured.
I am w illing for my muscle activ ity to be recorded
I am w illing for my upper body strength to be
recorded during a m axim al effort.
I am w illing for my body m ovem ent to be tracked
during arm cranking.
I would like to receive a sum m arised report of the study
I am w illing to partic ipate in this project
Please tick the t
Yes No
□ [□
□ [□
□
□ □□ □□ □□ □□
□ □□ □
Signed: Date:
172
Participant inform ation sheet
(Exam ple from Chapter 4)
PARTICIPANT INFORMATION SHEET
About The Researcher:
I am a PhD student at the University of Northampton. I am researching maximal
and high intensity upper body exercise. This research will form part of my PhD
thesis. Professor Carol Phillips, at the University of Northampton, is supervising th is study.
S tudy Title:
Load optim isation for arm crank ergom etry during a 30-s W ingate test and
ana lysis of b iom echanics and physio logical factors affecting performance
Aim of Study:
The aim of the study is to understand how fatigue affects maximal intensity 30-s duration arm cranking.
W hat the study involves:
You will need to v is it the laboratory 5 tim es and complete 4 tria ls, with a
m in im um of 3 days between each visit. Each v is it will last for no more than 1
hour and you will need to be in the laboratory w ithin 1 hour of the time of your
first v is it (e.g. first v is it at 11:00 o'clock, second and subsequent v is it between
10:00 and 12:00 o'clock). The first v is it will give you the chance to practice
stationary arm cranking* and for non-cycling data to be collected. On visits 2, 3,
4 and 5 (1 tria l each visit) you will be asked to arm crank as hard and as fast as
you can for 30-seconds against 4 d ifferent resistances (1 resistance on each
visit).
* arm cranking is pedalling a stationary bicycle using your arms
The information required:
173

On the first v isit, resting blood pressure, maximal arm strength and girth will be
m easured. On v is its 2, 3, 4 and 5, blood pressure (before and after exercise),
e lectrica l activ ity of muscle, and body m ovem ent using infra-red motion analysis
will be recorded. All m easurem ents are non-invasive. Please note, you will need
to be aged between 18-40, have normal blood pressure and no card iovascu lar conditions to take part in the study.
You may feel sick and d izzy after the test. However, with an active cool down
these sym ptom s we soon pass. You may feel some muscle soreness, as would norm ally be expected after exercise.
Please be assured that you can decline participating at any time. In addition you
are free to ask me any questions about the test procedure.
W hat will happen to the inform ation?
The consent form and pre-test medical questionnaire completed prior to your
visit, will be stored in a secure location and destroyed after 6 years. The identity
of each partic ipant (you) will remain anonym ous throughout the research process and in the PhD thesis.
On com pletion of the data collection and dissertation, all data will e ither be
destroyed or returned to the individual (you).
The inform ation you disclose will be for my PhD research purposes only. It will
not be given to any other party (e.g. your employer).
I will assign a num ber for your data and keep your data stored on a password
protected PC. From then on you will be known only by your number. This will
prevent anyone else from knowing your results.
Not sure about participating?
If you do not want to participate, that is okay, you have the right not to
participate. You can also stop at any time if you do not want to finish the study;
ju s t let me know when you are ready to stop.

Your valued input:
I can make my resu lts availab le to you when I have finished my study by
sending you a short sum m ary. Please let me know if you would like me to do this.
Contact the Researcher:
I hope the above information is helpful to you and gives you a better
understanding and insight into my study. Please feel free to contact me at any tim e if you have any questions. Chris Talbot, email
chris.talbot@ northam pton.ac.uk
Who has checked th is research?
The Research Ethics Com m ittee has approved this study.
The Un iversity o f Northam pton 's Combined Liability Insurance Policy provides
indem nity for students of the institution carrying out research work as part of the ir PhD.
Thank You
Thank you for your in terest and support. If you would like to participate in the
research please com plete and return the consent form in the envelope provided.
175
Post trial participant information
Post tria l partic ipant information
Thank you for taking part in this trial. Your next trial will take place:
on ............................
t im e .........................
Som e th ings you should know after the trial:
You may feel som e muscle soreness, as would norm ally be expected after
exercise, in your upper body up to 72 hrs after the trial th is is normal and to be expected.
If you have any health concerns please speak to your general practitioner (GP).
If you are unable to continue with the tria ls for whatever reason please let me know.
If you have any queries or require any further information please contact me on
01604 892479 or email chris.ta lbot@ northam pton.ac.uk.
Thanks
Chris Talbot
PhD student
The Know ledge Exchange
176

Participant inform ation letter (Example from Chapter 4)
Everdon Building
Park Campus
Boughton Green Road
Northampton
N N 27A L
Tel: 01604 892479
Dear
Research into maximal intensity upper body exercise
I am a PhD student at the University o f Northampton. I am researching maximal
intensity upper body exercise. This research will form part of my PhD thesis.
Professor Carol Phillips, at the University of Northampton, is supervising this study.
This study invo lves arm cranking* for 30 seconds against a specific resistance.
If you are interested in taking part in th is study, and aged between 18 and 40
with no card iovascu lar conditions, please see the attached participant
in form ation sheet, informed consent and pre-test medical questionnaire, which
need to be completed at least 24 hours prior to your first visit. All testing will
take place at The University of Northampton, Park Campus.
If you have any queries regarding the content of this letter or require any further
inform ation please contact me on 01604 892479 or email
ch ris.ta lbo t@ northam pton .ac.uk.
Thank you for your interest.
Chris Talbot
PhD student
The Know ledge Exchange
* arm cranking is pedalling a stationary bicycle using your arms
Strategy for dealing with physical problem s or injuries that might occur during trials
Initial se lection via information on the letter to possible participants, participant
o mation sheet, pre-test medical questionnaire, blood pressure measurement
and fam iliarisation tria l should provide detailed screening. In the event of
physical prob lem s or in juries that m ight occur during a trial please see below.
The researcher is St John first aid (4 day first aid at work course) trained and
always present when a participant is in the laboratory.
The m ost like ly physical problem is d izziness. In the event of d izziness the follow ing strateg ies will apply:
During the warm -up
The activ ity will stop and the participant will remain seated. If they continue to
feel d izzy then they will be asked and/or assisted to lie on the ir back on a mat
with the ir feet raised on a chair. When the d izziness has passed they will be
asked to sit down and if feeling better to walk slow ly around the laboratory.
Assum ing they feel well enough and the ir heart rate is back to a resting level they will be asked if they wish to leave.
During the tria l
The tria l will stop and the participant will remain seated. If able they will be
asked to warm -down. If they continue to feel d izzy they will be asked and/or
assisted to lie on the ir back on a mat with the ir feet raised on a chair. When the
d izziness has passed they will be asked to sit down and of feeling better to walk
slow ly around the laboratory. Assum ing they feel well enough and the ir heart
rate is back to a resting level they will be asked if they wish to leave.
During the warm -down
If able they will be asked to continue the warm-down. If they continue to feel
d izzy they will be asked and/or assisted to lie on their back on a mat with their
feet raised on a chair. When the d izziness has passed they will be asked to sit
down and if feeling better to walk slowly around the laboratory. Assuming they
feel well enough and their heart rate is back to a resting level they will be asked if they wish to leave.
Injuries
Due to the nature of the activity and pre-test screening it is unlikely that injuries
will occur. If a participant is injured then the injury will be managed following
the University of Northampton and St John first aider procedure.
If the injury occurs during the warm-up then warm-up will stop.
If the injury occurs during a trial or warm-down, if possible an alternative warm-
down, to avoid dizziness, will be used, e.g. walking around the lab or cycling using the legs.
If a participant is unable to continue with the trial due to injury or illness etc then an incident form will be completed.
Strategy for dealing with physical problems or injuries that might afterthe trials
Injuries
Due to the nature of the activity and pre-test screening it is unlikely that injuries
will occur. The participant may feel some soreness in the upper body especially
the shoulders up to 72 hours after the trial.
A post-trail information sheet has been provided giving details of what to expect
and what to do, this will be given out on completion of each trial.
If a participant is unable to continue with the study due to injury etc then an
incident form will be completed.
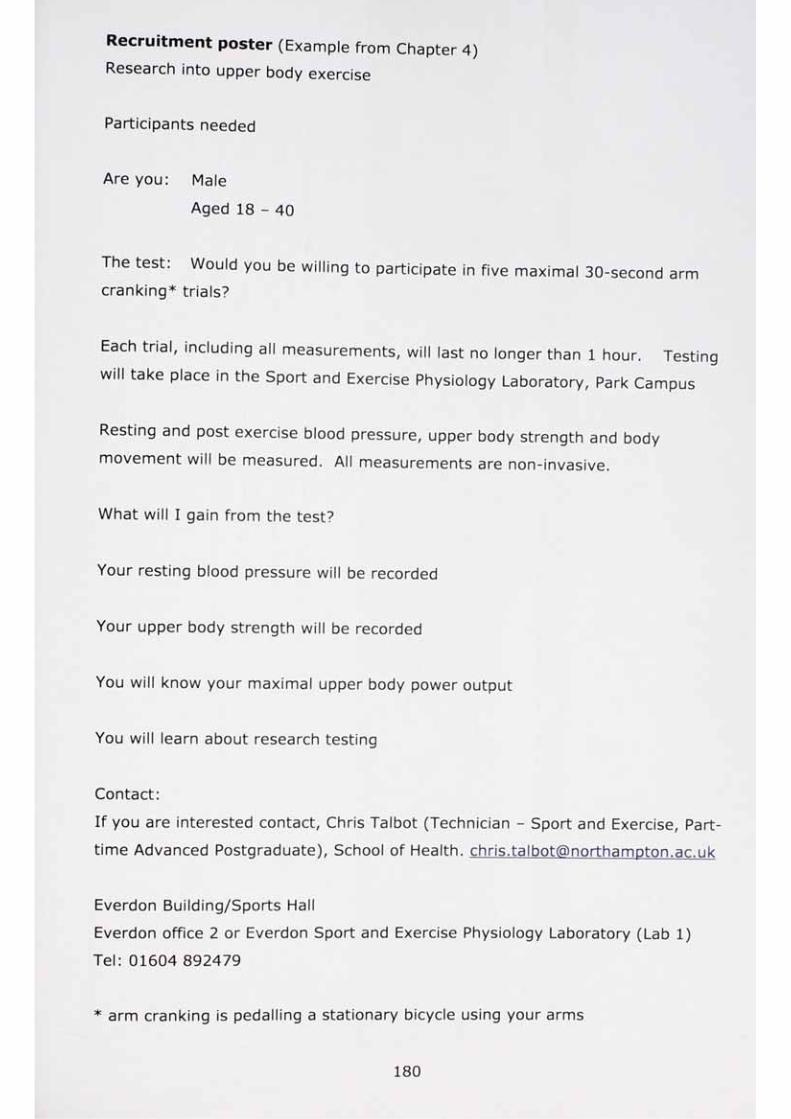
Recruitment poster (Example from Chapter 4)Research into upper body exercise
Participants needed
Are you: Male
Aged 18 - 40
The test: Would you be willing to participate in five maximal 30-second arm cranking* trials?
Each trial, including all measurements, will last no longer than 1 hour. Testing
will take place in the Sport and Exercise Physiology Laboratory, Park Campus
Resting and post exercise blood pressure, upper body strength and body
movement will be measured. All measurements are non-invasive.
What will I gain from the test?
Your resting blood pressure will be recorded
Your upper body strength will be recorded
You will know your maximal upper body power output
You will learn about research testing
Contact:
If you are interested contact, Chris Talbot (Technician - Sport and Exercise, Part-
time Advanced Postgraduate), School of Health. [email protected]
Everdon Building/Sports Hall
Everdon office 2 or Everdon Sport and Exercise Physiology Laboratory (Lab 1)
Tel: 01604 892479
* arm cranking is pedalling a stationary bicycle using your arms
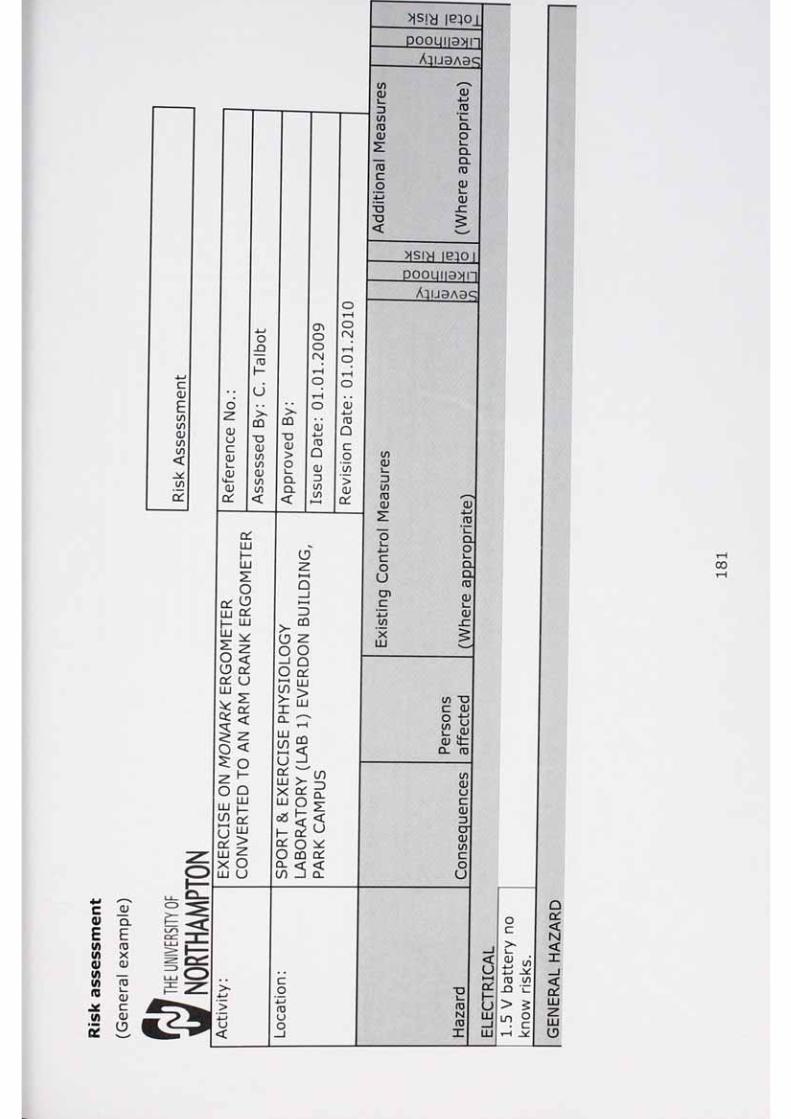
Ris
k as
sess
men
t
(Gen
eral
exa
mpl
e)
o
c
c
0 ) LDi i J
f D IS )_ Q
> £
L Do
• c
oOL<N<
<CLLU
LUCD

£ ” § f -.H ( U p S
* O Q. °CD ^ v -q e != CD =3 O5 g £ ~c C LLI cy CULU fD EU .
o CDCD CD
LU U
_QJ“O
CD-QT3
C =5O
_ cCD
to
£4—’ ocn -Qc CDCL CDCL
■£CD 4_r
1 cn • —»fU*—
“D COC
uJ5CD
jy_Q
_C
£ "D• iH ^ H H
§
CCD
C r — O £• amUCDCL
CDE
§CD
T )
=3C
CL • ■■■» o 3 "Dru d I -Q O CD
CDh= CD LU CO _ c
o"DCCD
L_'_ c _CDcn I dc £o
1
CD, r n

Staf
f,st
uden
ts,
agen
cyst
aff,
Buc
ket
with
di
183
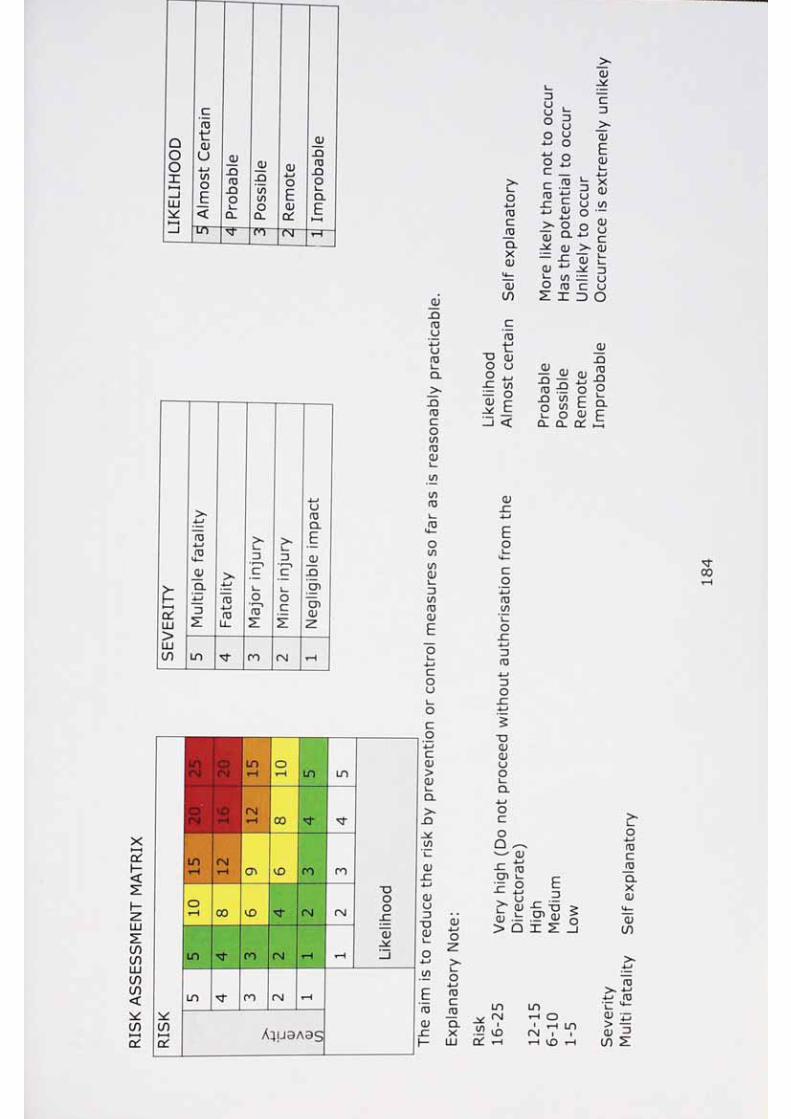
RISK
ASSES
SM
ENT
MAT
RIX
CD
CfU
D tcuO U CD _0)
_QO too ruCD4-JO
LLJ E -QO COCO Eo CD<
~ur~CL CL or
(*T~TnJ ru
i_ -X13CJu l _
"Eo uo u "aj4—J o ECD4—1o occru
"ru • •» 13UXCD
(~ c u CO4->CD oq3
OCL o CDUcJ=
>*CD• —
q3CD 13CO• — CJO ru "c UX 3 o
LO CO r\j
co
rU
CD
CD
fU
_CD QJru :9 O_Q COo toh: o cu
CL CL
LD oC CM
o CDCsJ
—
LO
ro
rsiCD
A;U9A0S
COCL)
CO
rU
CU
LO LO•
r\ i tH o CDi ' LO >
CD CM . . CDr-H i—l CD H l/)

185
Bibliography
Aagaard, P. (2003) Training-induced changes in neural function. Exercise and Sport Science Reviews, 31, 61-67.
Abadie, B. R. & Schuler, P. B. (1999) Estimation of arm maximal oxygen
uptake (V02max) from submaximal arm ergometer exercise in young
male subjects. Research in Sports Medicine: An International Journal, 9,15-23.
Ackland, D., C. & Pandy, M., G. (2009) Lines of action and stabilizing
potential of the shoulder musculature. Journal of Anatomy, 215, 184-197.
Ahlborg, G. & Jensen-Urstad, M. (1991) Metabolism in exercising arm vs.
leg muscle. Clinical Physiology (Oxford, England), 11, 459-468.
Akuthota, V. (2004) Core Strengthening. Archives of Physical Medicine and Rehabilitation, 85, S86-S92.
Al-Rahamneh, H. Q., Faulkner, J. A., Byrne, C. & Eston, R. G. (2010)
Relationship Between Perceived Exertion and Physiologic Markers During
Arm Exercise With Able-Bodied Participants and Participants With
Poliomyelitis. Archives of Physical Medicine & Rehabilitation, 91, 273-277.
Albertus-Kajee, Y., Tucker, R., Derman, W. & Lambert, M. (2010)
Alternative methods of normalising EMG during cycling. Journal of
Electromyography and Kinesiology, 20, 1036-1043.
Amann, M. (2012) Significance of group III and IV muscle afferents for
the endurance exercising human. Clinical and Experimental Pharmacology
and Physiology. Ament, W. & Verkerke, G. J. (2009) Exercise and Fatigue.
Sports Medicine, 39, 389-422.
Anders, C., Bretschneider, S., Bernsdorf, A. & Schneider, w. (2005)
Activation characteristics of shoulder muscles during maximal and
submaximal efforts. European Journal Of Applied Physiology, 93, 540-546
Anderson, G. S. (1992) A Comparison of Predictive Tests of Aerobic
Capacity. Canadian Journal of Sport Science, 17, 304-308.
Arslan, C. (2005) Relationship between the 30-second Wingate test and
characteristics of isometric and explosive leg strength in young subjects.
Journal of Strength and Conditioning Research, 19, 658-666.
Artioli, G. G., Gualano, B., Coelho, D. F., Benatti, F. B., Gailey, A. W. &
Lancha Jr, A. H. (2007) Does Sodium-Bicarbonate Ingestion Improve
Simulated Judo Performance? International Journal of Sport Nutrition &
Exercise Metabolism, 17, 206-217.
Artioli, G. G., Gualano, B., Franchini, E., Bastista, R. I\l., Polacow, V. O. &
Lancha Jr, A. H. L. (2008) Physiological, performance, and nutritional
profile of the Brazilian Olympic wushu (king-fu) team. Journal of Strength
& Conditioning Research, 23.
Aschenbach, W., Ocel, J., Craft, L., Ward, C., Spangenburg, E. & Williams,
J. (2000) Effect of oral sodium loading on high-intensity arm ergometry in
college wrestlers. Medicine & Science in Sports & Exercise, 32, 669-675.
Astrand, P. O., Ekblom, B., Messin, R., Saltin, B. & Stenberg, J. (1965)
Intra-arterial blood pressure during exercise with different muscle groups
Journal of Applied Physiology, 20, 253-256.
Astrand, P. O. & Rodahl, K. (1986) Textbook of Work Physiology, 3rd Ed.
New York: McGraw Hill International Editions.
Atkinson, G., Davison, R., Jeukendrup, A. & Passfield, L. (2003) Science
and cycling, current knowledge and future directions for research. Journal of Sports Sciences, 21, 767-787.
Aziz, A. R„ Lee, H. C. & Teh, K. C. (2002) Physiological characteristics of
Singapore national water polo team players. Journal of Sports Medicine & Physical Fitness, 42, 315-319.
Baker, J., Gal, J., Davies, B., Bailey, D. & Morgan, R. (2001a) Power
output of legs during high intensity cycle ergometry: Influence of hand
grip. Journal of Science and Medicine in Sport, 4, 10-18.
Baker, J. S., Bailey, D. M. & Davies, B. (2001b) The relationship between
total-body mass, fat-free mass and cycle ergometry power components
during 20 seconds of maximal exercise. Journal of Science and Medicine in Sport, 4, 1-9.
Balady, G. J., Weiner, D. A., Rose, L. & Ryan, T. J. (1990) Physiological-
responses to arm ergometry exercise relative to age and gender. Journal
of the American College of Cardiology, 16, 130-135.
Balmer, J., Bird, S. R., Richard Davison, R. C., Doherty, M. & Smith, P. M
(2004) Mechanically braked Wingate powers: agreement between SRM,
corrected and conventional methods of measurement. Journal of Sports
Sciences, 22, 661-667.
Balsom, P. D., Soderlund, K., Sjodin, B. & Ekblom, B. (1993) Skeletal
muscle metabolism during short duration high-intensity exercise influence
of creatine supplementation Acta Physioiogica Scandinavica, 154, 303-
310.
Balter, J., E. & Zehr, E. P. (2006) Neural Coupling Between the Arms and
Legs During Rhythmic Locomotor-Like Cycling Movement. Journal of
Neurophysiology, 97, 1809-1818.
188
Bangsbo, J. (1996) Physiological factors associated with efficiency in high intensity exercise. Sports Medicine, 22, 299-305.
Bangsbo, }., Madsen, K„ Kiens, B. & Richter, E. A. (1996) Effect of muscle
acidity on muscle metabolism and fatigue during intense exercise in man. Journal of Physiology, 495, 587-596.
Bar-or, O. (1987) The Wingate Anaerobic Test. An update on
methodology, reliability and validity. Sports Medicine, 4, 381-394.
Bar-or, 0., Dotan, R. & Inbar, O. (1977) A 30-sec all-out ergometric test:
its reliability and validity for anaerobic capacity. Israel Journal of Medical Sciences, 13, 326-327.
Bar-or, O., Dotan, R., Inbar, O., Rothstein, A. & Karlsson, J. (1980)
Anaerobic capacity and muscle fiber type distribution in man. International
Journal of Sports Medicine, 1, 82-85.
Bar-or, O. & Zwiren, L. D. (1975) Maximal oxygen consumption test
during arm exercise reliability and validity. Journal of Applied Physiology, 38, 424-426.
Barfield, J.-P., Sells, P. D., Rowe, D. A. & Hannigan-Down, K. (2002)
Practice Effect of the Wingate Anaerobic Test. Journal of Strength and
Conditioning Research, 16, 472-473
Barnett, C., Carey, M., Proietto, J., Cerin, E., Febbraio, M. A. & Jenkins, D.
(2004) Muscle metabolism during sprint exercise in man: influence of
sprint training. Journal of Science & Medicine in Sport, 7, 314-322.
Baron, B., Moullan, F., Deruelle, F. & Noakes, T. D. (2011) The role of
emotions on pacing strategies and performance in middle and long
duration sport events. British Journal of Sports Medicine, 45, 511-517.
189
Barratt, P. R., Korff, T., Elmer, S. J. & Martin, J. C. (2011) The Effect of
Crank Length on Joint-Specific Power during Maximal Cycling. Medicine
and Science in Sports and Exercise, 43, 1689-1697.
Bassett, D. R. (1989) Correcting the Wingate test for changes in kinetic
energy of the ergometer flywheel International Journal of Sports Medicine, 10, 446-449.
Bbc (2012) Sport Canoeing [online]. London: BBC. Available fromhttp://www.bbc
2012], First ed. BBC.canoeinq/16432893 [Accessed 17th April
Bediz, C. S., Goekbel, H., Kara, M., Uecok, K., Cikrikci, E. & Ergene, N.
(1998) Comparison of the aerobic contributions to Wingate anaerobic tests
performed with two different loads. Journal of Sports Medicine & Physical Fitness, 38, 30-34.
Bell, W. & Cobner, D. (2010) The Dynamics of Distance, Velocity and
Acceleration of Power Output in the 30-s Wingate Anaerobic Test.
International Journal of Sports Medicine, 32, 137-141.
Bell, W. & Cobner, D. M. (2007) Effect of individual time to peak power
output on the expression of peak power output in the 30-s Wingate
Anaerobic Test. International Journal of Sports Medicine, 28, 135-139.
Beneke, R., Pollmann, C., Bleif, I., Leithauser, M. & Hutler, M. (2002) How
anaerobic is the Wingate Anaerobic Test for humans? European Journal of
Applied Physiology, 87, 388.
Bernardi, M., Quattrini, F. M., Rodio, A., Fontana, G., Madaffari, A.,
Brugnoli, M. & Marchetti, M. (2007) Physiological characteristics of
America's Cup sailors. Journal of Sports Sciences, 25, 1141-1152.

asconi, S., Tordi, INI., Perrey, S., Parratte, B. & Monnier, G. (2006) Is
the V02 slow component in heavy arm-cranking exercise associated with
recruitment of type H muscle fibers as assessed by an increase in surface
EMG? Applied Physiology, Nutrition & Metabolism, 31, 414-422.
Bhambham, Y. N. (2004) Muscle Oxygenation Trends During Dynamic
Exercise Measured by Near Infrared Spectroscopy. Canadian Journal of Applied Physiology, 29, 504-523.
Bhambham, Y. N., Eriksson, P. & Gomes, P. S. (1991) Transfer effects of
endurance training with the arms and legs. . Medicine & Science in Sports & Exercise, 23, 1035-1041.
Biggerstaff, K. D., Mcdonough, P., Moffatt, R. J. & Stamford, B. A. (1997)
Effect of prior exercise on subsequent supramaximal arm ergometry:
influence of maximal aerobic capacity (poster). Medicine & Science in Sports & Exercise, 29, S59.
Bigland-Ritchie, B. (1981) EMG/force relations and fatigue of human
voluntary contractions. Exercise And Sport Sciences Reviews, 9, 75-117.
BiHat, L. V. (2001a) Interval training for performance: a scientific and
empirical practice: special recommendations for middle- and long-distance
running. Part I: aerobic interval training. Sports Medicine, 31, 13-31.
Billat, L. V. (2001b) Interval training for performance: a scientific and
empirical practice: special recommendations for middle- and long-distance
running. Part II: anaerobic interval training. Sports Medicine, 31, 75-90.
Billat, V., Faina, M., Sardella, F., Marini, C., Fanton, F., Lupo, S., Faccini,
P., De Angelis, M., Koralsztein, J. P. & Dalmonte, A. (1996) A comparison
of time to exhaustion at V02max in elite cyclists, kayak paddlers, swimmers
and runners. Ergonomics, 39, 267-277.
191

L., Flechet, B., Petit, B., Muriaux, G. & Koralsztein, J. P. (1999)
Interval training at VOw effects on aerobic performance and
overtraining markers. Medicine and Science in Sports and Exercise, 31, 156-163.
Billman, G. E. (2002) Aerobic exercise conditioning: a nonpharmacological
antiarrhythmic intervention. Journal of Applied Physiology, 92, 446-454.
Bird, S. & Davison, R. (1997) British Association of Sport and Exercise.
Bird, S. & Davidon, R. (eds) Physiological Testing Guidelines, 3rd Ed.
Leeds, UK: The British Association of Sport and Exercise Sciences.
Birkett, W. & Edwards, D. (1998) The use of one-arm crank ergometry in
the prediction of upper body aerobic capacity. Clinical Rehabilitation, 12, 319-327.
Bishop, D., Bonetti, D. D. & Dawson, B. (2001) The effect of three
different warm-up intensities on kayak ergometer performance. Medicine
& Science in Sports & Exercise, 33, 1026-1032.
Blasio, A. D., Sablone, A., Civino, P., D'angelo, E., Gallina, S. & Ripari, P.
(2009) Arm vs. combined leg and arm exercise: Blood pressure responses
and ratings of perceived exertion at the same indirectly determined heart
rate. Journal of Sports Science & Medicine, 8, 401-409.
Bogdanis, G., Papaspyrou, A., Lakomy, H. & Nevill, M. (2008) Effects of
inertia correction and resistive load on fatigue during repeated sprints on
a friction-loaded cycle ergometer. Journal of Sports Sciences, 26, 1437-
1445.
Borg, G. (1998a) Borg's Perceived Exertion and Pain Sales. 1st Ed. ed.
Champaign, IL Human Kinetics, Champaign, IL.
Borg, G. (1998b) Borg's perceived exertion and pain scales Human
Kinetics: Champaign, III. Leeds: Human Kinetics.

Bouhlel, E., Chelly, M. S., Tabka, Z. & Shephard, R. (2007) Relationships
between maximal anaerobic power of the arms and legs and javelin
performance. Journal of Sports Medicine & Physical Fitness, 47, 141-146.
Bressel, E„ Bressel, M„ Marquez, M. & Heise, G. D. (2001) The effect of
handgrip position on upper extremity neuromusuclar responses to arm
cranking exercise. Journal of Electromyography & Kinesiology, 11, 291- 298.
Bressel, E. & Heise, G. D. (2004) Effect of Arm Cranking Direction on
EMG, Kinematic, and Oxygen Consumption Responses. Journal of Applied Biomechanics, 20, 129-143.
Brink-Elfegoun, T., Holmberg, H.-C., Ekblom, M. I\l. & Ekblom, B. (2007)
Neuromuscular and circulatory adaptation during combined arm and leg
exercise with different maximal work loads. European Journal of Applied Physiology, 101, 603-611.
Brooks, G. A., Fahey, T. D. & Baldwin, K. M. (2005) Exercise physiology:
human bioenergetics and its applications, 4th Ed. Boston, MA: McGraw-Hill.
Brown, D., Knowlton, R., Hamill, J., Schneider, T. & Hetzler, R. (1990)
Physiological and biomechanical differences between wheelchair-
dependent and able-bodied subjects during wheelchair ergometry.
European Journal of Applied Physiology and Occupational Physiology, 60,
179-182.
Bulthuis, Y., Drossaers-Bakker, W., Oosterveld, F., Van Der Palen, J. O. B.
& Van De Laar, M. (2010) Arm crank ergometer is reliable and valid for
measuring aerobic capacity during submaximal exercise. Journal of
Strength & Conditioning Research (Lippincott Williams & Wilkins), 24,
2809-2815.
Burden, A. & Bartlett, R. (1999) Normalisation of EMG amplitude: an
evaluation and comparison of old and new methods. Medical Engineering
& Physics, 21, 247-257.
Burgomaster, K. A., Heigenhauser, G. J. F. & Gibala, M. J. (2006) Effect of
short-term sprint interval training on human skeletal muscle carbohydrate
metabolism during exercise and time-trial performance. Journal of Applied Physiology, 100, 2041-2047.
Burgomaster, K. A., Howarth, K. R„ Phillips, S. M„ Rakobowchuk, M.,
Macdonald, M. J., Mcgee, S. L. & Gibala, M. J. (2008) Similar metabolic
adaptations during exercise after low volume sprint interval and traditional
endurance training in humans. The Journal of Physiology, 586, 151-160.
Burgomaster, K. A., Hughes, S. C., Heigenhauser, G. J. F., Bradwell, S
& Gibala, M. J. (2005) Six sessions of sprint interval training increases
muscle oxidative potential and cycle endurance capacity in humans.
Journal of Applied Physiology, 98, 1985-1990.
N
Busko, K. (2011) Influence of two high-intensity intermittent training
programmes on anaerobic capacity in humans. Biology of Sport, 28.
Calbet, J. A., Holmberg, H. C., Rosdahl, H., Van Hall, G., Jensen-Urstad,
M. & Saltin, B. (2005) Why do arms extract less oxygen than legs during
exercise? American Journal Of Physiology. Regulatory, Integrative And
Comparative Physiology, 289, R1448-58.
Caputo, F. & Denadai, B. S. (2008) The highest intensity and the shortest
duration permitting attainment of maximal oxygen uptake during cycling:
effects of different methods and aerobic fitness level. European Journal of
Applied Physiology, 103, 47-57.
Carolan, B. & Cafarelli, E. (1992) Adaptations in coactivation after
isometric resistance training. Journal of Applied Physiology, 73, 911-917
Carpenter, J. E., Blasier, R. B. & Pellizzon, G. G. (1998) The effects of
muscle fatigue on shoulder joint position sense. American Journal of
Sports Medicine, 26, 262-265.
194

Casaburi, R., Barstow, T. J., Robinson, T. & Wasserman, K. (1992)
Dynamic and steady-state ventilatory and gas exchange responses to
exercise. Medicine & Science in Sports & Exercise, 24, 1365-1374.arm
Castro, R. R. T., Pedrosa, S„ Chabalgoity, F., Sousa, E. B. & Nobrega, A.
C. L. (2010) The influence of a fast ramp rate on peak cardiopulmonary
parameters during arm crank ergometry. Clinical Physiology and Functional Imaging, 30, 420-425.
Chapman, A., Vicenzino, B., Blanch, P. & Hodges, P. (2007) Leg muscle
recruitment during cycling is less developed in triathletes than cyclists
despite matched cycling training loads. Experimental Brain Research, If 503-518.
Chapman, A., Vicenzino, B., Blanch, P. & Hodges, P. (2009) Do differences
in muscle recruitment between novice and elite cyclists reflect different
movement patterns or less skilled muscle recruitment? Journal of Science
and Medicine in Sport, 12, 31-34.
Chapman, A. R., Vicenzino, B., Blanch, P. & Hodges, P. W. (2008) Patterns
of leg muscle recruitment vary between novice and highly trained cyclists.
Journal of Electromyography and Kinesiology 18, 359-371.
Chapman, A. R., Vicenzino, B., Blanch, P., Knox, J. J. & Hodges, P. W.
(2010) Intramuscular fine-wire electromyography during cycling:
Repeatability, normalisation and a comparison to surface
electromyography. Journal of Electromyography and Kinesiology, 20, 108-
117.
Christine M. Adreani, Janeen M. Hill, A. & Kaufman, M. P. (1997)
Responses of group III and IV muscle afferents to dynamic exercise
Journal of Aplied Pysiologiy, 82, 1811-1817.
195

Chtourou, H., Zarrouk, N., Chaouachi, A., Dogui, M., Behm, D. G.,
Chamari, K., Hug, F. O. & Souissi, INI. (2011) Diurnal Variation in Wingate-
Test Performance and Associated Electromyographic Parameters.
Chronobiology International: The Journal of Biological & Medical Rhythm Research, 28, 706-713.
Cifrek, M., Medved, V., Tonkovic, S. & Ostojic, S. (2009) Surface EMG
based muscle fatigue evaluation in biomechanics. Clinical Biomechanics, 24, 327-340.
Clarys, J. P. (2000) Electromyography in sports and occupational settings:
an update of its limits and possibilities. Ergonomics, 43, 1750-1762.
Clausen, J. P., Klausen, K., Rasmussen, B. & Trap-Jensen, J. (1973)
Central and peripheral circulatory changes after training of the arms or
legs. The American Journal of Physiology, 225, 675-682.
Collins, M. H., Pearsall, D. J., Zavorsky, G. S., Bateni, H., Turcotte, R. A. &
Montgomery, D. L. (2000) Acute effects of intense interval training on
running mechanics Journal of sports Sciences, 18, 83-90.
Cooke, C. B. (1996) Maximal Oxygen Uptake, Economy and Efficiency. In
Eston, R. & Reilly, T. (eds). Kinathropometry and Exercise Physiologiy
Laboratory Manual: Test, Procedures and Data. pp. 161-191, Second
London: Routledge.
Corbett, J. (2009) Effect of task familiarisation on distribution of energy
during a 2000 m cycling time trial. British Journal of Sports Medicine, 43,
770-774.
Coyle, E. F., Sidossis, L. S., Horowitz, J. F. & Beltz, J. D. (1992) Cycling
efficiency is related to the percentage of Type I muscle fibers. Medicine &
Science in Sports & Exercise, 24, 782-788.
196
Creer, A. R., Ricard, M. D., Conlee, R. K., Hoyt, G. L. & Parcel!, A. C.
(2004) Neural, Metabolic, and Performance Adaptations to Four Weeks of
High Intensity Sprint-Interval Training in Trained Cyclists. International Journal of Sports Medicine, 25.
Dalsgaard, M. K„ Volianitis, S„ Yoshiga, C. C„ Dawson, E, A. 8. Secher, N.
H. (2004) Cerebral metabolism during upper and lower body exercise. J Appl Physiol, 97, 1733-1739.
Davies, C. J. & Sargeant, A. j. (1975) Effects of training on the
physiological response to one- and two-leg work. Journal of Applied Physiology, 38, 377-381.
Davis, J. A., Vodak, P., Wilmore, J. H., Vodak, J. & Kurtz, P. (1976)
Anaerobic threshold and maximal aerobic power for three modes of
exercise. Journal of Applied Physiology, 41, 544-550.
Davis, J. M. (1995) Central and peripheral factors in fatigue Journal of
Sports Sciences, 13, S49-S53.
De Groot, S., De Bruin, M., Noomen, S. P. & Van Der Woude, L. H. (2008)
Mechanical efficiency and propulsion technique after 7 weeks of low-
intensity wheelchair training. Clinical Biomechanics (Bristol, Avon), 23,
434-441.
Dicarlo, S. E. (1988) Effect of arm ergometry training on wheelchair
propulsion endurance of individuals with quadriplegia. Physical Therapy,
68, 40-44.
Doheny, E. P., Lowery, M. M., Fitzpatrick, D. P. & O'malley, M. J. (2008)
Effect of elbow joint angle on force-EMG relationships in human elbow
flexor and extensor muscles. Journal of Electromyography & Kinesiology,
18, 760-770.
197

Dolbow, D. R., Miller, J., Harnish, C.( Hunter, P., Ashrafa, G. & Gater, D.
R. (2010) Arm Crank Exercise Increases V02peak and Reduces Body Fat
Mass in Older Adult With Chronic Paraplegia. Clinical Kinesiology (Online Edition).
Dorel, S„ Drouet, J.-M., Couturier, A., Champoux, Y. & Hug, F. 0. (2009)
Changes of Pedalling Technique and Muscle Coordination during an
Exhaustive Exercise. Medicine & Science in Sports & Exercise, 41, 1277-1286.
Dotan, R. & Bar-or, O. (1983) Load optimization for the Wingate
Anaerobic Test. European Journal of Applied Physiology & Occupational Physiology, 51, 409-417.
Driss, T., Vandewalle, H. & Monod, H. (1998) Maximal power and force-
velocity relationships during cycling and cranking exercises in volleyball
players: correlation with the vertical jump test. Journal of Sports Medicine
& Physical Fitness, 38, 286-293.
Duchateau, J., Semmler, J. G. & Enoka, R. M. (2006) Training adaptations
in the behaviour of human motor units. Journal of Applied Physiology,
101, 1766-1775.
Easton, C., Findlay, C., Morrison, G. & Spurway, N. C. (2007) Effects of
dynamic upper-body exercise on lower-limb isometric endurance. Journal
of Sports Sciences, 25, 1101-1107.
Ebaugh, D. D., Mcclure, P. W. & Karduna, A. R. (2006) Effects of shoulder
muscle fatigue caused by repetitive overhead activities on scapulothoracic
and glenohumeral kinematics. Journal of Electromyography and
Kinesiology, 16, 224-235.
Edwards, A. M., Clark, N. & Macfadyen, A. M. (2003) Lactate and
ventilatory thresholds reflect the training status of professional soccer

players where maximum aerobic power is unchanged. Journal of Sports Science & Medicine, 2, 23-29.
Eg'in, C. M. & Tipton, M. J. (2005) Can firefighter instructors perform a
simulated rescue after a live fire training exercise? European Journal of Applied Physiology, 95, 327-334.
El-Sayed, M. S. & Younesian, A. (2005) Lipid profiles are influenced by
arm cranking exercise and training in individuals with spinal cord injury.
Spinal Cord: The Official Journal Of The International Medical Society Of Paraplegia, 43, 299-305.
Enders, A. J., Hopman, M. & Binkhorst, R. A. (1994) The relation between
upper arm dimensions and maximal oxygen uptake during arm exercise.
International Journal of Sports Medicine, 15, 279-282.
Enoka, R. M. & Duchateau, J. (2008) Muscle fatigue: what, why and how it
influences muscle function. The Journal Of Physiology, 586, 11-23.
Esfarjani, F. & Laursen, P. B. (2007) Manipulating high-intensity interval
training: effects on V02max, the lactate threshold and 3000 m running
performance in moderately trained males. Journal of Science & Medicine in
Sport, 10, 27-35.
Eston, R. G. & Brodie, D. A. (1986) Responses to arm and leg ergometry.
British Journal of Sports Medicine, 20, 4-6.
Evans, S. A., Eckerson, J. M., Housh, T. J. & Johnson, G. O. (1993)
Muscular Power of the Arms in High School Wrestlers. Pediatric Exercise
Science, 5, 72-77.
Fardy, P. S., Webb, D. & Hellerstein, H. K. (1977) Benefits of arm exercise
in cardiac rehabilitation. Physician & Sportsmedicine, 5, 30-32.
199

Faupin, A., Gorce, P. & Meyer, C. (2011) Effects of type and mode of
propulsion on hand-cycling biomechanics in nondisabled subjects. Journal
of Rehabilitation Research & Development, 48, 1049-1059.
Fernandes, R. J„ Keskinen, K. L„ Colaa§0, P„ Querido, A. J„ Machado, L.
J., Morais, P. A., Novais, D. Q., Marinho, D. A. & Vilas Boas, J. P. (2008a)
Time limit at \I02max velocity in elite crawl swimmers. International Journal of Sports Medicine, 29, 145-150.
Fernandes, R. J., Keskinen, K. L., Colaco, P„ Querido, A. J., Machado, L.
J., Morais, P. A., Novais, D. Q., Marinho, D. A. & Vilas Boas, J. P. (2008b)
Time limit at V02max velocity in elite crawl swimmers. International Journal
of Sports Medicine, 29, 145-150.
Field, A. (2009) Discovering Statistics using SPSS, 3rd Ed. London: Sage.
Fitts, R. H. (1996) Muscle fatigue: the cellular aspects. American Journal
of Sports Medicine, 24, S9-S13.
Fitts, R. H. (2008) The cross-bridge cycle and skeletal muscle fatigue
Journal of Applied Physiology, 104, 551-558.
Forbes, S. C. & Chilibeck, P. D. (2007) Comparison of a kayaking
ergometer protocol with and arm crank protocol for evaluating peak
oxygen consumption. Journal of Strength & Conditioning Research, 21,
1282-1285.
Franchini, E., Takito, M. Y., Kiss, M. A. P. D. M. & Sterkowicz, S. (2005)
Physcial Fitness and Anthropomtrical Differences between Elite and Non-
Elite Judo Player. Biology of Sport, 22, 315-328.
Franklin, B. A. (1985) Exercise testing, training and arm ergometry
Sports Medicine, 2, 100-119.
200
Franklin, B. A. (1989) Aerobic exercise training programs for the upper
body. Medicine & Science in Sports & Exercise, 21, S141-S148.
Franklin, B. A., Vander, L., Wrisley, D. & Rubenfire, M. (1994) Trainability
of arms versus legs in men previous myocardial infarction. Chest, 105, 262-264.
Franklin, K. L., Gordon, R. S., Davies, B. & Baker, J. S. (2008) Assessing
accuracy of measurements for a Wingate Test using the Taguchi method. Research In Sports Medicine 16, 1-14.
Frauendorf, H., Kobryn, U., Gelbrich, W. & Lange, T. (1989) Changes of
the EMG and its relationship to the cardiopulmonary parameters during
two-arm cranking of disabled men. Biomedica Biochimica Acta, 48, S521-
Frauendorf, H., Kobryn, U., Hoffmann, B., Gelbrich, W., Ransch, E. &
Erdmann, U. (1986) Sex and age-related behaviour of the integrated EMG
during one-arm cranking. Biomedica Biochimica Acta, 45, S85-S87.
Fukuba, Y., Hayashi, N., Koga, S. & Yoshida, T. (2002) V02 kinetics in
heavy exercise is not altered by prior exercise with a different muscle
group. J Appl Physiol, 92, 2467-2474.
Gabriel, D. A. (2002) Changes in kinematic and EMG variability while
practicing a maximal performance task. Journal of Electromyography and
Kinesiology, 12, 407-412.
Gastin, P. B. (2001) Energy system interaction and relative contribution
during maximal exercise. Sports Medicine, 31, 725-741.
Gates, P. E., George, K. P. & Campbell, I. G. (2003) Concentric adaptation
of the left ventricle in response to controlled upper body exercise training.
Journal of Applied Physiology, 94, 549-554.

Geiser, C. F., O'connor, K. M. & Earl, j. E. (2010) Effects of Isolated Hip
Abductor Fatigue on Frontal Plane Knee Mechanics. Medicine & Science in Sports & Exercise, 42, 535-545.
Gentzler, M. & Stader, S. (2010) Posture stress on firefighters and
emergency medical technicians (EMTs) associated with repetitive
reaching, bending, lifting, and pulling tasks. Work, 37, 227-239.
Gibala, M. J., Little, J. P., Van Essen, M., Wilkin, G. P„ Burgomaster, K. A.,
Safdar, A., Raha, S. & Tarnopolsky, M. A. (2006) Short-term sprint
interval versus traditional endurance training: similar initial adaptations in
human skeletal muscle and exercise performance. The Journal Of Physiology, 575, 901-911.
Giovani, D. & Nikolaidis, P. T. (2012) Differences in Force-velocity
Characteristics of Upper and Lower Limbs of Non-competitive Male Boxers.
International Journal of Exercise Science, 5, 106-113.
Girard, O., Mendez-Villanueva, A. & Bishop, D. (2011) Repeated-Sprint
Ability - Part I: Factors Contributing to Fatigue. Sports Medicine, 41, 673-
694.
Goosey-Tolfrey, V., Castle, P. & Webborn, N. (2006) Aerobic capacity and
peak power output of elite quadriplegic games players. British Journal of
Sports Medicine, 40, 684-687.
Goulopoulou, S., Fernhall, B. & Kanaley, J. A. (2009) Hemodynamic
responses and linear and non-linear dynamics of cardiovascular autonomic
regulation following supramaximal exercise. European Journal of Applied
Physiology, 105, 525-531.
Graham, K. S. A. M. (1989) Variability of time to exhaustion and oxygen
deficit in supramaximal exercise. Australian Journal of Science and
Medicine in Sport 24, 11-4.
Grange, C. C„ Maine, J., Groslambert, A., Tordi, N„ Dugue, B„ Pernin, J.
N. & Rouillon, J. D. (2004) Perceived exertion and rehabilitation with arm
crank in elderly patients after total hip arthroplasty: a preliminary study.
Journal of Rehabilitation Research & Development, 41, 611-619.
Grant, S., Craig, I., Wilson, J. & Aitchison, T. (1997) The relationship
between 3 km running performance and selected physiological variables Journal of Sports Sciences, 15, 403-410.
Green, H. J. (1997) Mechanisms of muscle fatigue in intense exercise
Journal of Sports Sciences, 15, 247-256.
Greer, F., Morales, J. & Coles, M. (2006) Wingate performance and
surface EMG frequency variables are not affected by caffeine ingestion.
Applied Physiology, Nutrition & Metabolism, 31, 597-603.
Guglielmo, L. G. A. & Denadai, B. S. (2000) Assessment of anaerobic
power of swimmers: the correlation of laboratory tests on an arm
ergometer with field tests in a swimming pool Journal of Strength &
Conditioning Research, 14, 395-398.
Hautier, C. A., Arsac, L. M., Deghdegh, K., Souquet, J., Belli, A. & Lacour,
J. R. (2000) Influence of fatigue on EMG/force ratio and cocontraction in
cycling. Medicine & Science in Sports & Exercise, 32, 839-843.
Hawley, J. A. & Williams, M. M. (1991) Relationship between upper body
anaerobic power and freestyle swimming performance. International
Journal of Sports Medicine, 12, 1-5.
Hawley, J. A., Williams, M. M., Hamling, G. C. & Walsh, R. M. (1989)
Effects of a task-specific warm-up on anaerobic power. British Journal of
Sports Medicine, 23, 233-236.
203
Hawley, j. A., Williams, M. M„ Vickovic, M. M. & Handcock, P. j. (1992)
Muscle power predicts freestyle swimming performance. British Journal ofSports Medicine, 26, 151-155.
Hazell, T. J., Macpherson, R. E. «., Gravelle, B. M. R. & Lemon, P. W. R.
(2010) 10 or 30-s sprint interval training bouts enhance both aerobic and
anaerobic performance. European Journal of Applied Physiology, 110, 153- 160.
Helge, J. W. (2010) Arm and leg substrate utilization and muscle
adaptation after prolonged low-intensity training. Acta Physiologica, 199, 519-528.
Hermens, H. J., Freriks, B., Disselhorst-Klug, C. & Rau, G. (2000)
Development of recommendations for SEMG sensors and sensor
placement procedures. Journal of Electromyography and Kinesiology, 10, 361-374.
Herzog, W., Leonard, T. R., Joumaa, V. & Mehta, A. (2008) Mysteries of
Muscle Contraction. Journal of Applied Biomechanics, 24, 1-13.
Hicks, A. L., Kent-Braun, J. & Ditor, D. S. (2001) Sex differences in
human skeletal muscle fatigue. Exercise & Sport Sciences Reviews, 29,
109-112.
Hijikata, T., Wakisaka, H. & Niida, S. (1993) Functional combination of
tapering profiles and overlapping arrangements in nonspanning skeletal
muscle fibers terminating intrafascicularly. The Anatomical Record, 236,
602-610.
Hill, D. W., Poole, D. C. & Smith, J. C. (2002) The relationship between
power and the time to achieve ,VO(2max). Medicine and Science in Sports
and Exercise, 34, 709-714.
204
Hill, D. W. & Rowell, A. L. (1996) Running velocity at &
Science in Sports and Exercise, 28, 114-119.
Hill, D. W. & Smith, J. c. (1993) Gender differences in anaerobic capacity:
role of aerobic contribution. British Journal of Sports Medi
Hi", D- w " Wiliams. S. E. & Burt, S. E. (1997) Repsonse to Exercise at
92% and 100% of the Velocity Associated with VO,,.,,. International Journal of Sports Medicine, 18, 325-329.
Hill, S. W. & Smith, J. C. (1991) Circadian rhythm in anaerobic power and
capacity. Canadian Journal of Sport Sciences, 16, 30-32.
Hjeltnes, N. (1977) Oxygen uptake and cardiac output in graded arm
exercise in paraplegics with low level spinal lesions. Scandinavian Journal
of Rehabilitation Medicine, 9, 107-113.
Holmberg, H. C., Rosdahl, H. & Svedenhag, J. (2007) Lung function,
arterial saturation and oxygen uptake in elite cross country skiers:
influence of exercise mode. Scandinavian Journal of Medicine & Science in
Sports, 17, 437-444.
Holmes, K. C. (1998) A Molecular Model for Muscle Contraction. Acta
crys tallographica.
Hooker, S. P. & Wells, C. L. (1991) Physiologic responses to arm crank
exercise with and without hand grasping. Clinical Kinesiology (Online
Edition), 45, 3-8.
Hopker, J. G., Coleman, D. A., Wiles, J. D. & Galbraith, A. (2009)
Familiarisation and reliability of sprint test indices during laboratory and
field assessment. Journal of Sports Science and Medicine, 8, 528-532.
205
Hopkins, W. G., Schabort, E. J. & Hawley, J. A. (2001) Reliability of power
in physical performance tests. Sports Medicine, 31, 211-234.
Hopman, M. T. E„ Van Teeffelen, W. M„ Brouwer, J., Houtman, S. &
Bmkhorst, R. A. (1995) Physiological responses to asynchronous and
synchronous arm-cranking exercise. European Journal of Applied
Physiology & Occupational Physiology, 72, 111-114.
Horswill, C. A., Miller, J. E., Scott, J. R., Smith, C. M., Welk, G. & Van
Handel, P. (1992) Anaerobic and aerobic power in arms and legs of elite
senior wrestlers. International Journal of Sports Medicine, 13, 558-561.
Hsu, W.-L., Krishnamoorthy, V. & Scholz, J. P. (2006) An alternative test
of electromyographic normalization in patients. Muscle & Nerve, 33, 232- 241.
Hubner-Wozniak, E., Kosmol, A., Gtaz, A. & Kusior, A. (2006a) The
Evaluation of Upper Limb Muscles Anaerobic Performance of Elite
Wrestlers and Boxers. Research Yearbook, 12, 218-221.
Hubner-Wozniak, E., Kosmol, A., Lucoslawska, G. & Bern, E. Z. (2004)
Anaerobic performance of arms and legs in male and female free style
wrestlers. Journal of Science & Medicine in Sport, 7, 473-480.
Hubner-Wozniak, E., Lutoslawska, G., Kosmol, A. & Zuziak, S. (2006b)
The effect of training experience on arm muscle anaerobic performance in
wrestlers. Human Movement, 7, 147-152.
Hug, F. & Dorel, S. (2009) Electromyographic analysis of pedaling: A
review. Journal of Electromyography and Kinesiology, 19, 182-198.
Hunter, A. M., Lambert, M. I., Nobbs, L. & Noakes, T. D. (2003) Effects of
supramaximal exercise on the electromyographic signal. British Journal of
Sports Medicine, 37, 296-299.
206
Hussain, S. T., Smith, R. E., Medbak, S., Wood, R. F. & Whipp, B. J.
(1996) Haemodynamic and metabolic responses of the lower limb after
high intensity exercise in humans. Experimental Physiology, 81, 173-187.
Huxley, A. F. (2000) Cross-bridge action: present views, prospects, and
unknowns. Journal Of Biomechanics, 33, 1189-1195.
Ilias, INI. A., Xian, H., Inman, C. & Martin Iii, W. H. (2009) Arm exercise
testing predicts clinical outcome. American Heart Journal, 157, 69-76.
Inbar, O., Bar-or, O. & Skinner, J. (1996) The Wingate Anaerobic Test., 1st
Ed. Champaign, IL: Human Kinetics.
Invernizzi, P., Caporaso, G., Longo, S., Scurati, R. & Alberti, G. (2008)
Correlations between upper limb oxygen kinetics and performance in elite
swimmers. Sport Sciences for Health, 3, 19-25.
Ishida, K., Takaishi, T. & Miyamura, M. (1994) Ventilatory responses at
the onset of passive movement and voluntary exercise with arms and
legs. Acta Physiologica Scandinavica, 151, 343-352.
Jacobs, P. L., Johnson, B., Somarriba, G. A. & Carter, A. B. (2005)
Reliability of upper extremity anaerobic power assessment in persons with
tetraplegia. The Journal Of Spinal Cord Medicine, 28, 109-113.
Jacobs, P. L., Mahoney, E. T. & Johnson, B. (2003) Reliability of arm
Wingate Anaerobic Testing in persons with complete paraplegia. The
Journal Of Spinal Cord Medicine, 26, 141-144.
Jacobs, P. L. M., E. T. Johnson, B. M. (2003) Load determination for arm
Wingate anaerobic testing in persons with tetraplegia. Medicine & Science
in Sports & Exercise, 35.
James, C. R„ Scheuermann, B. W. & Smith, M. P. (2010) Effects of two
neuromuscular fatigue protocols on landing performance. Journal of
Electromyography & Kinesiology, 20, 667-675.
James, D. V. B., Sandals, L. E., Wood, D. M. & Jones, A. M. (2007a)
Pulmonary Gas Exchange. In: E. M. Winter., A. M. Jones., R. C. R.
Davison., P. D. Bromley. &T. H. Mercer, (eds). BASES Sport and Exercise
Physiology Testing Guidelines, pp. 101 - 111. 1st Ed. ed.
James, D. V. B., Wood, D. M., Maberly, T. C. B. & Croix, M. D. S. (2007b)
Optimized versus corrected peak power during friction-braked cycle
ergometry in males and females. Journal of Sports Sciences, 25, 859-867.
Jemini, M. M., Sands, W. A., Friemel, F. O., Stone, M. H. & Cooke, C. B.
(2006) Any effect of gymnastics training on upper-body and lower-body
aerobic and power components in national and international males
gymnasts? Journal of Strength & Conditioning Research, 20, 899-907.
Jensen-Urstad, M., Hallback, I. & Sahlin, K. (1993) High anaerobic energy
release during submaximal arm exercise. Clinical Physiology (Oxford,
England), 13, 81-87.
Jensen-Urstad, M., Hallback, I. & Sahlin, K. (1995) Effect of hypoxia on
muscle oxygenation and metabolism during arm exercise in humans.
Clinical Physiology, 15, 27-37.
Jensen-Urstad, M. A. A., G. (1992) Is the high lactate release during arm
exercise due to a low training status? Clinical Physiology (Oxford,
England), 12, 487-496.
Johnson, B. M., Mahoney, E. T., Jacobs, P. L., Carter, A. B. & Somarriba,
G. A. (2004) Effect of variable loading in the determination of upper-limb
anaerobic power in persons with tetraplegia. Journal of Rehabilitation
Research & Development, 41, 9-14.
208

Jones, A. M. (1998) A five year physiological case study of an Olympic
runner. British Journal of Sports Medicine, 32, 39-43.
Kamen, G. & Gabriel, D. A. (2010) Essentials of Electromyography, 1 Champaign, III: Human Kinetics.
St Ed.
Kang, J., Chaloupka, E. C., Mastrangelo, M. A. & Angelucci, J. (1999)
Physiological responses to upper body exercise on an arm and a modified
leg ergometer. Medicine & Science in Sports & Exercise, 31, 1453-1459.
Kang, J., Chaloupka, E. C., Mastrangelo, M. A., Donnelly, M. S., Martz, W.
P. & Robertson, R. J. (1998) Regulating exercise intensity using ratings of
perceived exertion during arm and leg ergometry. European Journal of
Applied Physiology & Occupational Physiology, 78, 241-246.
Kang, J., Robertson, R. J., Goss, F. L., Dasilva, S. G., Suminski, R. R.,
Utter, A. C., Zoeller, R. F. & Metz, K. F. (1997) Metabolic efficiency during
arm and leg exercise at the same relative intensities. Medicine & Science
in Sports & Exercise, 29, 377-382.
Karlsson, J., Bonde-Petersen, F., Henriksson, J. & Knuttgen, H. G. (1975)
Effects of previous exercise with arms or legs on metabolism and
performance in exhaustive exercise. Journal of Applied Physiology, 38,
763-767.
Katch, V. & Henry, F. M. (1972) Prediction of running performance from
maximal oxygen debt and intake. Medicine & Science in Sports, 4, 187-
191.
Kay, D., Frank, E. M., Cannon, J., St Clair-Gibson, A., Lambert, M. I. &
Noakes, T. D. (2001) Evidence for neuromuscular fatigue during high-
intensity cycling in warm, humid conditions. European Journal of Applied
Physiology, 84, 115-121.
Kenney, L. W. (1995) ACSM's Guidline for Exercise Testing andPrescription, iams & Wilkin.
Kenney, L. W. (2005) ACSM's Guidline for Exercise Testing and
Prescription, 7th Ed. Philadelphia: Willliams & Wilkin.
Kilen, A., Gizzi, L., Jensen, B. R., Farina, D. & Nordsborg, N. B. (2012)
Changes in human muscle oxygen saturation and mean fiber conduction
velocity during intense dynamic exercise-effect of muscular training status. Muscle & Nerve, 46, 746-754.
Klimstra, M. D„ Thomas, E. & Paul Zehr, E. (2011) Biomechanical
outcomes and neural correlates of cutaneous reflexes evoked during
rhythmic arm cycling. Journal Of Biomechanics, 44, 802-809.
Knapik, J. J., Harper, W., Crowell, H. P., Leiter, K. & Mull, B. (2000)
Standard and alternative methods of stretcher carriage: performance,
human factors, and cardiorespiratory responses. Ergonomics, 43, 639- 652.
Koga, S., Shiojiri, T., Shibasaki, M., Fukuba, Y., Fukuoka, Y. & Kondo, N
(1996) Kinetics of oxygen uptake and cardiac output at onset of arm
exercise. Respiration Physiology, 103, 195-202.
Koppo, K. & Bouckaert, J. (2005) Prior Arm Exercise Speeds the V02
Kinetics during Arm Exercise above the Heart Level. Medicine & Science in
Sports & Exercise, 37, 613-619.
Koppo, K., Bouckaert, J. & Jones, A. M. (2002) Oxygen uptake kinetics
during high-intensity arm and leg exercise. Respiratory Physiology &
Neurobiology, 133, 241-250.
210
Korge, P. (1995) Factors limiting adenosine triphosphatase function during
high intensity exercise. Thermodynamic and regulatory considerations. Sports Medicine, 20, 215-225.
Kounalakis, S. N., Bayios, I. A., Koskolou, M. D. & Geladas, N. D. (2008)
Anaerobic capacity of the upper arms in top-level team handball players.
International Journal of Sports Physiology and Performance, 3, 251-261.
Kounalakis, S. N., Koskolou, M. D. & Geladas, N. D. (2009) Oxygen
Saturation in the Triceps Brachii Muscle during an Arm Wingate Test: The
Role of Training and Power Output. Research in Sports Medicine, 17, 171- 181.
Krustrup, P., Soderlund, K., Mohr, M. & Bangsbo, J. (2004) Slow-twitch
fiber glycogen depletion elevates moderate-exercise fast-twitch fiber
activity and 0 2 uptake. Medicine & Science in Sports & Exercise, 36, 973- 982.
Kurumatani, N., Yamaguchi, B., Dejima, M., Enomoto, Y. & Moriyama, T.
(1992) Aerobic capacity of forestry workers and physical demands of
forestry operations. European Journal of Applied Physiology and
Occupational Physiology, 64, 546-551.
Lake, M. J. & Cavanagh, P. R. (1996) Six weeks of training does not
change running mechanics or improve running economy. Medicine &
Science in Sports & Exercise, 28, 860-869.
Lakomy, H. K. (1985) Effect of load on corrected peak power output
generated on friction loaded ergometers. Journal of Sports Sciences, 3,
240.
Lakomy, H. K. (1986) Measurement of work and power output using
friction-loaded cycle ergometers. Ergonomics, 29, 509-517.
211
Lambert, M. I., Kolbe, T., Selley, E. A. & Dennis, S. C. (1995) The
relationship between critical power and running performance. Journal ofSports Sciences, 13, 34-15.
Laurent, M. C., Meyers, M. C., Robinson, C. A. & Green, M. G. (2007)
Cross-validation of the 20- versus 30-s Wingate anaerobic test European Journal of Aplied Physiology, 100, 645-651.
Lee, H.-M., Liau, J.-J., Cheng, C.-K., Tan, C.-M. & Shih, J.-T. (2003a)
Evaluation of shoulder proprioception following muscle fatigue. Clinical
Biomechanics (Bristol, Avon), 18, 843-847.
Lee, H.-M., Liau, J.-J., Cheng, C.-K., Tan, C.-M. & Shih, J.-T. (2003b)
Evaluation of shoulder proprioception following muscle fatigue. Clinical
Biomechanics, 18, 843-847.
Leedham, J. S. & Dowling, J. J. (1995) Force-length, torque-angle and
EMG-joint angle relationships of the human in vivo biceps brachii.
European Journal of Applied Physiology and Occupational Physiology, 70,
421-426.
Leicht, A. S., Sealey, R. M. & Sinclair, W. H. (2009) The Reliability of
V O (2peak) Determination in Healthy Females during an Incremental Arm
Ergometry Test. International Journal of Sports Medicine, 30, 509-515.
Leicht, A. S. & Spinks, W. L. (2007) Effect of shoulder angle on
physiological responses during incremental peak arm crank ergometry.
V02peak criteria. Journal of Sports Sciences, 25, 443-452.
Lepretre, P. M., Koralsztein, J. P. & Billat, V. L. (2004) Effect of exercise
intensity on relationship between V 0 2max and cardiac output. Medicine &
Science in Sports & Exercise, 36, 1357-1363.
Lericollais, R., Gauthier, A., Bessot, N., Sesbastian, B. & Davenne, D.
(2009) TIME-OF-DAY EFFECTS ON FATIGUE DURING A SUSTAINED
ANAEROBIC TEST IN WELL-TRAINED CYCLISTS. Chronobiology
International: The Journal of Biological & Medical Rhythm Research, 261622-1635.
Leveque, J. M., Brisswalter, J.( Bernard, O. & Goubault, C. (2002) Effect of
paddling cadence on time to exhaustion and V02 kinetics at the intensity
associated with V02max in elite white-water kayakers. Canadian Journal of Applied Physiology, 27, 602-611.
Lindsay, F. H„ Hawley, J. A., Myburgh, K. H„ Schomer, H. H„ Noakes, T.
D. & Dennis, S. C. (1996) Improved athletic performance in highly trained
cyclists after interval training. Medicine and Science in Sports and
Exercise, 28, 1427-1434.
Linossier, M. T., Denis, C., Dormois, D., Geyssant, A. & Lacour, J. R.
(2011) Ergometric and metabolic adaptation to a 5-s sprint training
programme. . European Journal of Applied Physiology and Occupational
Physiology 67, 408-14.
Linossier, M. T., Dormois, D., Fouquet, R., Geyssant, A. & Denis, C.
(1996) Use of the force-velocity test to determine the optimal braking
force for a sprint exercise on a friction-loaded cycle ergometer. European
Journal of Applied Physiology and Occupational Physiology, 74, 420-427.
Loftin, M., Boileau, R. A., Massey, B. H. & Lohman, T. G. (1988) Effect of
arm training on central and peripheral circulatory function. Medicine &
Science in Sports & Exercise, 20, 136-141.
Lovell, D., Mason, D., Delphinus, E., Eagles, A., Shewring, S. & Mclellan,
C. (2011a) Does Upper Body Strength and Power Influence Upper Body
Wingate Performance in Men and Women? International Journal of Sports
Medicine, 32, 771-775.
213
Lovell, D. I., Mason, D., Delphinus, E. & Mclellan, C. (2011b) A
Comparison of Asynchronous and Synchronous Arm Cranking During the
Wingate Test. International Journal of Sports Physiology & Performance 6, 419-426.
Lusina, S. J., Warburton, D. E., Hatfield, N. G. & Sheel, A. W. (2008)
Muscle deoxygenation of upper-limb muscles during progressive arm-
cranking exercise. Applied Physiology, Nutrition, and Metabolism 33, 231- 238.
Lutoslawska, G., Hubner-Wozniak, E. & Kosmol, A. (2003) Blood lactate
response to 30 s arm cranking and leg cycling in elite wrestlers. Medicina Sportiva, 7, E69-E76.
Lyons, S„ Richardson, M„ Bishop, P., Smith, J„ Heath, H. & Giesen, J.
(2007) Excess post-exercise oxygen consumption in untrained men
following exercise of equal energy expenditure: comparisons of upper and
lower body exercise. Diabetes, Obesity and Metabolism 9, 889-894.
Macintosh, B. R., Rishaug, P. & Svedahl, K. (2003) Assessment of peak
power and short-term work capacity. European Journal of Applied
Physiology, 88, 572-579.
Magel, J. R., Foglia, G. F., Mcardle, W. D., Gutin, B. & Pechar, G. S.
(1975) Specificity of swim training on maximum oxygen uptake. Journal of
Applied Physiology, 38, 151-155.
Magel, J. R., Mcardle, W. D., Toner, M. & Delio, D. J. (1978) Metabolic and
cardiovascular adjustment to arm training. Journal of Applied Physiology:
Respiratory, Environmental And Exercise Physiology, 45, 75-79.
Mannion, A. F., Jakeman, P. M. & Willan, P. L. (1995) Skeletal muscle
buffer value, fibre type distribution and high intensity exercise
performance in man. Experimental Physiology, 80, 89-101.
214
Marais, G., Dupont, L„ Garcin, M„ Vanvelcenaher, J. & Pelayo, P. (2001)
RPE resP°nses during arm and leg exercises: effect of variations in
spontaneously chosen crank rate. Perceptual And Motor Skills 2001 92,253-62.
Marais, G„ Dupont, L„ Maillet, M„ Weissland, T„ Vanvelcenaher, J. &
Pelayo, P. (2002a) Cardiorespiratory and efficiency responses during arm
and leg exercises with spontaneously chosen crank and pedal rates. Ergonomics, 45, 631-639.
Marais, G„ Dupont, L., Maillet, M„ Weissland, T., Vanvelcenaher, J. &
Pelayo, P. (2002b) Spontaneously chosen crank rate variations in
submaximal arm exercise with inexperienced subjects. Effects on
cardiorespiratory and efficiency parameters. International Journal of
Sports Medicine, 23, 120-124.
Marais, G., Dupont, L., Vanvelcenaher, J., Clarys, J. P. & Pelayo, P. (2004)
Effects of spontaneously chosen crank rate variations on
electromyographic responses in sub-maximal arm exercise in
inexperienced subjects. European Journal of Applied Physiology, 92, 598- 601.
Marais, G., Weissland, T., Robin, H., Vanvelcenaher, J. M., Lavoie, J. M. &
Pelayo, P. (1999) Physiological effects of variations in spontaneously
chosen crank rate during sub-maximal and supra-maximal upper body
exercise. International Journal of Sports Medicine, 20, 239-245.
Marino, F. E., Kay, D., Cannon, J., Serwach, N. & Hilder, M. (2002) A
reproducible and variable intensity cycling performance protocol for warm
conditions. Journal of Science & Medicine in Sport, 5, 95-107.
Marks, C. R. C., Hylland, K. E. & Terrell, J. (2012) Stability Ball Sitting
versus Chair Sitting During Sub-maximal Arm Ergometry. International
Journal of Exercise Science, 5, 16-25.

Marquardt, J„ Bacharach, D. & Kelly, J. (1993) Predicting 30 second
m,n,mum power from 20 second Wingate test. Medicine & Science in Sports & Exercise, 25 (Sup), S109.
Marsh, G. D.f Paterson, D. H., Govindasamy, D. & Cunningham, D. A.
(1999) Anaerobic Power of the Arms and Legs of Young and Older Men Experimental Physiology, 84, 589-597.
Martin, J. C., Wagner, B. M. & Coyle, E. F. (1997) Inertial-load method
determines maximal cycling power in a single exercise bout. Medicine &
Science in Sports & Exercise, 29, 1505-1512.
Martin, P. G„ Smith, J. L., Butler, j. E., Gandevia, S. C. & Taylor, J. L
(2006) Fatigue-sensitive afferents inhibit extensor but not flexor
motorneurons in humans. Journal of Neuroscience, 28, 4796-4802.
Martin, T. W., Zeballos, R. J. & M, W. I. (1992) Use of arm crank exercise
in the detection of abnormal pulmonary gas exchange in patients at low
altitude. Chest, 102 169-175
Martin, T. W., Zeballos, R. J. & Weisman, I. M. (1991) Gas exchange
during maximal upper extremity exercise. Chest, 99, 420-425.
Mauger, A. R., Jones, A. M. & Williams, C. A. (2010) Influence of exercise
variation on the retention of a pacing strategy. European Journal Of
Applied Physiology.
Mcconnell, T. R. (1988) Practical Considerations in the Testing of V02max in
Runners. Sports Medicine, 5, 57-68.
Mcgawley, K. & Bishop, D. (2006) Reliability of a 5 x 6-s maximal cycling
repeated-sprint test in trained female team-sport athletes. European
Journal of Applied Physiology, 98, 383-393.
216

Mckay, B. R., Paterson, D. H. & Kowalchuk, J. M. (2009) Effect of short-
term high-intensity interval training vs. continuous training on 02 uptake
kinetics, muscle deoxygenation, and exercise performance. Journal of Applied Physiology, 107, 128-138.
Mclellan, T. M., Cheung, S. S. & Jacobs, I. (1995) Variability of Time to
Exhaustion During Submaximal Exercise. Canadian Journal of Applied
Physiology-Revue Canadienne De Physiologie Appliquee, 20, 39-51.
Mclester, J. R. (1997) Muscle contraction and fatigue: the role of
adenosine 5'-diphosphate and inorganic phosphate. Sports Medicine, 23, 287-305.
Medbo, J. I., Gramvik, P. & Jebens, E. (1999) Aerobic and anaerobic
energy release during 10 and 30 s bicycle sprints. Acta Kinesiologiae
Universitatis Tartuensis, 4, 122-146.
Medbo, J. I. & Tabata, I. (1989) Relative importance of aerobic and
anaerobic energy release during short-lasting exhausting bicycle exercise.
Journal of Applied Physiology, 67, 1881-1886.
Mendez-Villanueva, A. & Bishop, D. (2005) Physiological Aspects of
Surfboard Riding Performance. Sports Medicine, 35, 55-70.
Mercier, B., Granier, P., Mercier, J., Trouquet, J. & Prefaut, C. H. (1993)
Anaerobic and aerobic components during arm-crank exercise in sprint
and middle-distance swimmers. European Journal of Applied Physiology &
Occupational Physiology, 66, 461-466.
Mermier, C. M. J., Jeffrey M; Parker, Daryl L; Swan, Jacob G (2000)
Physiological and anthropometric determinants of sport climbing
performance. British Journal of Sports Medicine, 34, 359-366.
Metter, E. J., Talbot, L. A., Schrager, M. & Conwit, R. A. (2004) Arm-
cranking muscle power and arm isometric muscle strength are
217

independent predictors of all-cause mortality in men. (Abstract).
Scandinavian Journal of Medicine & Science in Sports, 14, 203-203.
Micklewright, D., Alkhatib, A. & Beneke, R. (2006) Mechanically versus
electro-magnetically braked cycle ergometer: performance and energy
cost of the Wingate Anaerobic Test. Eur J Appl Physiol, 96, 748-751.
Midgley, A. W., Mcnaughton, L. R. & Carroll, S. (2007) Effect of the V02
time-averaging interval on the reproducibility of V02max in healthy athletic
subjects. Clinical Physiology & Functional Imaging, 27, 122-125.
Miller, T. L., Mattacola, C. G. & Santiago, M. C. (2004) Influence of varied,
controlled distances from the crank axis on peak physiological responses
during arm crank ergometry. Journal of Exercise Physiology Online, 7, 61- 67.
Millet, G. Y., Divert, C., Banizette, M. & Morin, J.-B. (2010) Changes in
running pattern due to fatigue and cognitive load in orienteering. Journal
of Sports Sciences, 28, 153-160.
Minahan, C., Chia, M. & Inbar, O. (2007) Does power indicate capacity?
30-s Wingate anaerobic test vs. maximal accumulated 02 deficit.
International Journal of Sports Medicine, 28, 836-843.
Moffatt, R. J., Chitwood, L. F. & Biggerstaff, K. D. (1994) The influence of
verbal encouragement during assessment of maximal oxygen uptake.
Journal of Sports Medicine & Physical Fitness, 34, 45-49.
Morgan, D. L. & Allen, D. G. (1999) Early events in stretch-induced muscle
damage. Journal of Applied Physiology, 87, 2007-2015.
Morton, R. H. & Hodgson, D. J. (1996) The relationship between power
output and endurance: a brief review. . European Journal of Applied
Physiology & Occupational Physiology, 73, 491-502.

Mossberg, K„ Willman, C„ Topor, M. A., Crook, H. 8, Patak, S. (1999)
Comparison of asynchronous versus synchronous arm crank ergometry. SpinaI Cord, 37, 569.
Mukherjee, G., Bhowmik, P. & Samanta, A. (2001) Physical fitness
training for wheelchair ambulation by the arm crank propulsion technique Clinical Rehabilitation, 15, 125-132.
Muraki, S., Tsunawake, N. & Yamasaki, M. (2004) Limitation of muscle
deoxygenation in the triceps during incremental arm cranking in women
European Journal of Applied Physiology, 91, 246-252.
Murley, G. S., Menz, H. B., Landorf, K. B. & Bird, A. R. (2010) Reliability
of lower limb electromyography during overground walking: A comparison
of maximal- and sub-maximal normalisation techniques. Journal of Biomechanics, 43, 749-756.
Murray, W. M., Buchanan, T. S. & Delp, S. L. (2000) The isometric
functional capacity of muscles that cross the elbow. Journal of
Biomechanics, 33, 943-952.
Mygind, E. (1995) Fibre characteristics and enzyme levels of arm and leg
muscles in elite cross-country skiers. Scandinavian Journal of Medicine &
Science in Sports, 5, 76-80.
Neville, V., Pain, M. T. G. & Folland, J. P. (2009) Aerobic power and peak
power of elite America's Cup sailors. European Journal of Applied
Physiology, 106, 149-157.
Niewiadomski, W., Gqsiorowska, A., Krauss, B., Mroz, a and Cybulski, G
(2007) Suppression of heart rate variability after supramaximal exertion
Clinical Physiology and Functional Imaging, 27, 309 - 319.
219

in , B. C., Mahar, M. T., Harman, E. A. & Patton, J. F. (1995) Lower and
upper body anaerobic performance in male and female adolescent
athletes. Medicine and Science in Sports and Exercise, 27, 235-241.
Ogata, H. & Yano, T. (2005) Kinetics of oxygen uptake during arm
cranking with the legs inactive or exercising at moderate intensities. European Journal of Applied Physiology, 94, 17-24.
Ortiz, A., Olson, S. L., Etnyre, B., Trudelle-Jackson, E. E., Bartlett, W. &
Venegas-Rios, H. L. (2010) Fatigue efffects on knee joint stability during
two jump taks in women. Journal of Strength & Conditioning Research 24, 1019-1027.
Pandolf, K. B., Billings, D. S., Drolet, L. L., Pimental, N. A. & Sawka, M. N
(1984) Differentiated ratings of perceived exertion and various
physiological responses during prolonged upper and lower body exercise
European Journal of Applied Physiology and Occupational Physiology 53, 5-11.
Patton, J. F., Murphy, M. M. & Frederick, F. A. (1985) Maximal power
outputs during the Wingate Anaerobic Test. International Journal of Sports
Medicine, 6, 82-85.
Pendergast, D., Cerretelli, P. & Rennie, D. W. (1979) Aerobic and
glycolytic metabolism in arm exercise. Journal Of Applied Physiology:
Respiratory, Environmental And Exercise Physiology, 47, 754-760.
Pendergast, D. R. (1989) Cardiovascular, respiratory, and metabolic
responses to upper body exercise. Medicine & Science in Sports &
Exercise, 21, S121-S125.
Pimental, N. A., Sawka, M. N., Billings, D. S. &Trad, L. A. (1984)
Physiological responses to prolonged upperbody exercise. Medicine &
Science in Sports & Exercise, 16, 360-365.
220
Pogliaghi, S., Terziotti, P., Cevese, A., Balestreri, F. & Schena, F. (2006)
Adaptations to endurance training in the healthy elderly: arm cranking
versus leg cycling. European Journal of Applied Physiology, 97, 723-731.
Powers, S. K., Beadle, R. E. & Mangum, M. (1984) Exercise efficiency
during arm ergometry: effects of speed and work rate. Journal of Applied Physiology, 56, 495-499.
Price, M. j. & Campbell, I. G. (1997) Determination of peak oxygen uptake
during upper body exercise. Ergonomics, 40, 491-499,
Price, M. J. & Campbell, I. G. (2002) Thermoregulatory responses during
prolonged upper body exercise cool and warm conditions. Journal of Sports Sciences, 20, 519-527.
Price, M. J. & Campbell, J. G. (1998) Thermoregulatory and physiological
responses of wheelchair athletes to prolonged arm crank ergometry and
wheelchair ergometry. . Journal of Sports Sciences, 16, 57-57.
Price, M. J., Collins, L., Smith, P. M. & Goss-Sampson, M. (2007) The
effects of cadence and power output upon physiological and biomechanical
responses to incremental arm-crank ergometry. Applied Physiology,
Nutrition & Metabolism, 32, 686-692.
Rainoldi, A., Galardi, G., Maderna, L., Comi, G., Lo Conte, L. & Merletti, R.
(1999) Repeatability of surface EMG variables during voluntary isometric
contractions of the biceps brachii muscle. Journal of Electromyography
and Kinesiology, 9, 105-119.
Ramonatxo, M. P., J. Prefaut, C. (1996) Differences in mouth occlusion
pressure and breathing pattern between arm and leg incremental
exercise. Acta Physiotogica Scandinavica, 158, 333-341.
221
' S. R. (2006) Effect of the Wingate test on mechanomyography and
electromyography. Journal of Strength & Conditioning Research, 292- 297.
Rasmussen, B., Klausen, K., Clausen, J. P. & Trap-Jensen, J. (1975)
Pulmonary ventilation, blood gases, and blood pH after training of the
arms or the legs. Journal of Applied Physiology, 38, 250-256.
Rayment, I., Holden, H. M„ Whittaker, M„ Yohn, C. B„ Lorenz, M„
Holmes, K. C. & Milligan, R. A. (1993) Structure of the actin-myosin
complex and its implications for muscle contraction. Science (New York, N.Y.), 261, 58-65.
Reybrouck, T„ Heigenhauser, G. F. & Faulkner, J. A. (1975) Limitations to
maximum oxygen uptake in arm and leg, and combined arm-leg
ergometry. Journal of Applied Physiology, 38, 774-779.
Roberts, A. J., Termin, B., Reilly, M. F. & Pendergast, D. R. (1991)
Effectiveness of Biokinetic Training on Swimming Peformance in Collegiate
Swimmers. Journal of Swimming Research, 7, 5-11.
Roland Van Den, T. & Mario, M. (2011) Effect of training on the kinematics
and performance in overarm throwing in experienced female handball
players. Portuguese Journal of Sport Sciences, 11, 125-128.
Romagnoli, I., Gorini, M., Gigliotti, F., Bianchi, R., Lanini, B., Grazzini, M.,
Stendardi, L. & Scano, G. (2006) Chest wall kinematics, respiratory
muscle action and dyspnoea during arm vs. leg exercise in humans. Acta
Physiologica (Oxford, England), 188, 63-73.
Rosier, K., Hoppeler, H., Conley, K. E., Claassen, H., Gehr, P. & Howald,
H. (1985a) Transfer effects in endurance exercise. Adaptations in trained
and untrained muscles. European Journal of Applied Physiology and
Occupational Physiology, 54, 355-362.
Rosier, K„ Hoppeler, H„ Conley, K. E„ Claassen, H„ Gehr, P. & Howald,
H. (1985b) Transfer effects in endurance exercise. Adaptations in trained
and untrained muscles. European Journal of Applied Physiology, 54, 355-
Rouffet, D. M. & Hautier, C. A. (2008) EMG normalization to study muscle
activation in cycling. Journal of Electromyography & Kinesiology, 18, 866-
Rudroff, T., Barry, B. K., Stone, A. L., Barry, C. J. & Enoka, R. M. (2007)
Accessory muscle activity contributes to the variation in time to task
failure for different arm posture and loads. Journal of Applied Physiologiy, 102, 1000-1006.
Sagiv, M. B.-S., D, Sagiv, M. And Goldhammer, E. (2005) Left Ventricular
Function at Peak All-Out Anaerobic Exercise in Older Men. Gerontology 51.
Sahlin, K. (1992) Metabolic factors in fatigue. Sports Medicine, 13, 99-107.
Sahlin, K., Tonkonogi, M. & Soderlund, K. (1998) Energy supply and
muscle fatigue in humans. Acta Physiologica Scandinavica, 162, 261-266.
Sandbakk, 0., Holmberg, H.-C., Leirdal, S. & Ettema, G. (2010) Metabolic
rate and gross efficiency at high work rates in world class and national
level sprint skiers. European Journal of Applied Physiology 109, 473-81.
Santos, E. L., Novaes, J. S., Reis, V. M. & Giannella-Neto, A. (2010) Low
sampling rates bias outcomes from the Wingate test. International Journal
of Sports Medicine, 31, 784-789.
Sergeant, A. J. (1994) Human power output and muscle fatigue.
International Journal of Sports Medicine, 15, 116-121.
Sargeant, A. j., Hoinville, E. & Young, A. (1981) Maximum leg force and
power output during short-term dynamic exercise. Journal of Applied Physiology, 51, 1175-1182.
Savard, G„ Kiens, B. & Saltin, B. (1987) Central cardiovascular factors as
limits to endurance; with a note on the distinction between maximal
oxygen uptake and endurance fitness. IN MACLEOD, D., MAUGHAN, R.,
NIMMO, M., REILLY, T. & WILLIAMS, J. (Eds.) Exercise, Benefits, Limits and Adaptations. E. & F. N. Spon Ltd.
Sawka, M. N. (1986) Physiology of upper body exercise. Exercise & Sport Sciences Reviews, 14, 175-211.
Sawka, M. N., Foley, M. E., Pimental, N. A., Toner, M. M. & Pandolf, K. B.
(1983) Determination of maximal aerobic power during upper-body
exercise. Journal Of Applied Physiology: Respiratory, Environmental and
Exercise Physiology, 54, 113-117.
Schabort, E. J., Hawley, J. A., Hopkins, W. G. & Blum, H. (1999) High
reliability of performance of well-trained rowers on a rowing ergometer.
Journal of Sports Sciences, 17, 627-632.
Schneider, D. A., Wing, A. N. & Morris, N. R. (2002) Oxygen uptake and
heart rate kinetics during heavy exercise: a comparison between arm
cranking and leg cycling. European Journal of Applied Physiology, 88, 100-
106.
Schneider, S., Brummer, V., Abel, T., Askew, C. D. & Striider, H. K.
(2009) Changes in brain cortical activity measured by EEG are related to
individual exercise preferences. Physiology & Behavior, 98, 447-452.
Schneks, I. C„ Barnes, M. J. 8, Hodges, L. D. (2011) Comparison study of
treadm.il versus arm ergometry. Clinical Physiology & Functional Imaging, 31, 326-331. y y
Sealey, R. M., Spinks, W. L., Leicht, A. S. & Sinclair, W. H. (2010)
Identification and reliability of pacing strategies in outrigger canoeing
ergometry. Journal of Science and Medicine in Sport, 13.
Secher, N. H., Ruberg-Larsen, N., Binkhorst, R. A. & Bonde-Petersen, F.
(1974) Maximal oxygen uptake during arm cranking and combined arm
plus leg exercise. Journal of Applied Physiology, 36, 515-518,
Sedlock, D., Knowlton, R. & Fitzgerald, P. (1988) The effects of arm crank
training on the physiological responses to silbmaximal wheelchair
ergometry. European Journal of Applied Physiology and Occupational Physiology, 57, 55-59.
Sedlock, D. A. (1991) Postexercise energy expenditure following upper
body exercise. Research Quarterly for Exercise & Sport, 62, 213-216.
Serresse, 0., Lortie, G., Bouchard, C. & Boulay, M. R. (1988) Estimation
of the contribution of the various energy systems during maximal work of
short duration. International Journal of Sports Medicine, 9, 456-460.
Shephard, R. J. (1984) Tests of maximal oxygen uptake: a critical review
Sports Medicine, 1, 99-124.
Shiomi, T., Maruyama, H., Saito, A. & Umemura, M. (2000) Physiological
Responses and Mechanical Efficiency during Different Types of Ergometric
Exercise. Journal of Physical Therapy Science, 12, 67-73.
Smith, J. C. & Hill, D. W. (1991) Contribution of energy systems during a
Wingate power test. British Journal of Sports Medicine, 25, 196-199.

Smith, P. M., Amaral, I., Doherty, M.; Price, M. J. & Jones, A. M. (2006a)
The Influence of Ramp Rate on V02peak and "Excess" V02 during Arm
Crank Ergometry. International Journal of Sports Medicine, 27, 610-616.
Smith, P. M., Chapman, M. L., Hazlehurst, K. E. & Goss-Sampson, M. A.
(2008) The influence of crank configuration on muscle activity and torque
production during arm crank ergometry. Journal of Electromyography & Kinesiology, 18, 598-605.
Smith, P. M., Davison, R. C. R. & Price, M. J. (2002a) Blood lactate profile
after two different arm crank ergometry tests. (Abstract). Journal of Sports Sciences, 20, 58-59.
Smith, P. M., Doherty, M. & Price, M. J. (2002b) The influence of protocol
design on peak physiological responses to arm crank ergometry.
(Abstract) Journal of Sports Sciences, 20, 27-28.
Smith, P. M., Doherty, M. & Price, M. J. (2006b) The Effect of Crank Rate
on Physiological Responses and Exercise Efficiency Using a Range of
Submaximal Workloads During Arm Crank Ergometry. International
Journal of Sports Medicine, 27, 199-204.
Smith, P. M., Doherty, M. & Price, M. J. (2007a) The effect of crank rate
strategy on peak aerobic power and peak physiological responses during
arm crank ergometry. Journal of Sports Sciences, 25, 711-718.
Smith, P. M., Mccrindle, E., Doherty, M., Price, M. J. & Jones, A. M.
(2006c) Influence of crank rate on the slow component of pulmonary 02
uptake during heavy arm-crank exercise. Applied Physiology, Nutrition &
Metabolism, 31, 292-301.
Smith, P. M. & Price, M. J. (2007) Upper-body exercise. In: E. M. Winter.,
A. M. Jones., R. C. R. Davison., P. D. Bromley. & T. H. Mercer, (eds).
BASES Sport and Exercise Physiology Testing Guidelines, pp, 138 - 144 1 Ed. ed.
Smith, P. M., Price, M. J„ Davison, R. C. R„ Scott, D. & Balmer, J.
(2007b) Reproducibility of power production during sprint arm ergometry
Journal of Strength & Conditioning Research, 21, 1315-1319.
Smith, P. M., Price, M. J. & Doherty, M. (2001) The influence of crank rate
on peak oxygen consumption during arm crank ergometry. Journal of Sports Sciences, 19, 955-960.
So, R., Chan, K. M., Appel, R. & Yuan, Y. (2004) Changes in the multi-join
kinematics and co-ordination after repetitive windsurfing pumping task.
Journal of Sports Medicine and Physical Fitness, 44, 249-257.
Souissi, N., Bessot, N., Chamari, K., Gauthier, A., Sesboue, B. & Davenne,
D. (2007) Effect of Time of Day on Aerobic Contribution to the 30-s
Wingate Test Performance. Chronobiology International: The Journal of
Biological & Medical Rhythm Research, 24, 739-748.
Spencer, M., Fitzsimons, M., Dawson, B., Bishop, D. & Goodman, C.
(2006) Reliability of a repeated-sprint test for field-hockey. Journal of
Science and Medicine in Sport, 9, 181-184.
Stamford, B. A., Cuddihee, R. W., Moffatt, R. J. & Rowland, R. (1978)
Task specific changes in maximal oxygen uptake resulting from arm
versus leg training. Ergonomics, 21, 1-9.
Stenberg, J., Astrand, P. O., Ekblom, B., Royce, J. & Saltin, B. (1967)
Hemodynamic response to work with different muscle groups, sitting and
supine. Journal of Applied Physiology, 22, 61-70.
Stewart, D„ Farina, D„ Shen, C. & Macaluso, A. (2011) Muscle fibre
conduction velocity during a 30-s Wingate anaerobic test. Journal of
Electromyography and Kinesiology, 21, 418-422
Stickley, C. D., Hetzler, R. K. & Kimura, I. F. (2008) Prediction of
anaerobic power values from an abbreviated WAnT protocol. Journal of
Strength & Conditioning Research (Lippincott Williams & Wilkins), 22, 958 965.
Stoggl, T. L. & Muller, E. (2009) Kinematic Determinants and Physiologica
Response of Cross-Country Skiing at Maximal Speed. Medicine & Science in Sports & Exercise, 41, 1476-1487.
Strang, A. J., Berg, W. P. & Hieronymus, M. (2009) Fatigue-induced early
onset of anticipatory postural adjustments in non-fatigued muscles:
support for a centrally mediated adaptation. Experimental Brain Research. , 197, 245-254.
Swaine, I. L. & Winter, E. M. (1999) Comparison of cardiopulmonary
responses to two types of dry-land upper-body exercise testing modes in
competitive swimmers. European Journal of Applied Physiology &
Occupational Physiology, 80, 588-590.
Swensen, T., Mancuso, P. & Howley, E. T. (1993) The effect of moderate
resistance weight training on peak arm aerobic power. International
Journal of Sports Medicine, 14, 43-47.
Szygula, Z., Gawronski, W. & Kalinski, M. I. (2003) Fatigue during
exercise. Medicina Sportiva, 7, 57-67.
Tabata, I., Irisawa, K., Kouzaki, M., Nishimura, K., Ogita, F. & Miyachi, M.
(1997) Metabolic profile of high intensity intermittent exercises. Medicine
and Science in Sports and Exercise, 29, 390-395.
Tarara. 0. (1995) A comparison of peak VO, and HR responses during arm
ergometry versus upper-body pedalling. Eugene, Ore.; United
States Microform Publications, lnt'1 Inst for Sport & Human Performance University of Oregon.
Taylor, B. J., How, S. C. & Romer, L. M. (2006) Exercise-induced
abdominal fatigue in healthy humans. Journal of Aplied Pysiologiy 100 1554-1562.
Taylor, J. L„ Butler, J. E. & Gandevia, S. C. (2000) Changes in muscle
afferents, motorneurons and motor drive during muscle fatigue. .
European Journal of Aplied Physiology, 83 106-115.
Terbizan, D. J. & Seljevold, P. J. (1996) Physiological profile of age-group
wrestlers. Journal of Sports Medicine & Physical Fitness, 36, 178-185.
Tew, G., Shah, N., Irena, Z. & John, M. S. (2009) Limb-specific and cross-
transfer effects of arm-crank exercise training in patients with
symptomatic peripheral arterial disease. Clinical Science 117, 405-413.
Timmons, J. A., Jansson, E., Fischer, H., Gustafsson, T., Greenstaff, P. L.,
Ridden, J., Rachman, J. & Sundverg, C. J. (2005) Modulation of
extracellular matrix genes reflects the magnitude of physiological
adaptations to aerobic exercise training in humans. BMC Biology. BioMed
Central.
Tordi, N., Belli, A., Mougin, F., Rouillon, J. R. & Gimenez, M. (2001)
Specific and transfer effects induced by arm or leg training. International
Journal of Sports Medicine, 22, 517-524.
Tortora, G. J. & Grabowski, S. R. (2003) Principles of Anatomy &
Physiology, 10th Ed. New York, USA: John Wiley & Sons, Inc.
Tulppo, M. P„ Makikallio, T. H„ Laukkanen, R. T. & Huikuri, H. V. (1999)
Differences in autonomic modulation of heart rate during arm and leg exercise. Clinical Physiology, 19, 294-299
Tyler, C. & Sunderland, C. (2008) The Effect of Ambient Temperature on
the Reliability of a Preloaded Treadmill Time-Trial. International Journal of Sports Medicine, 29, 812-816.
Ugok, K., Gokbel, H. & Okudan, N. (2005) The load for the Wingate test:
according to the body weight or lean body mass. European Journal ofGeneral Medicine, 2 10-13.
Ucok, K., Mollaoglu, H., Akgun, L. & Gene, A. (2008) Anaerobic
performance in patients with chronic low back pain. Journal of Back &
Musculoskeletal Rehabilitation, 21, 99-104.
Van Drongelen, S., Maas, J. C., Scheel-Sailer, A. & Van Der Woude, L. H.
(2009) Submaximal arm crank ergometry: Effects of crank axis
positioning on mechanical efficiency, physiological strain and perceived
discomfort. Journal of Medical Engineering & Technology, 33, 151-157.
Van Someren, K. A. & Palmer, G. S. (2003) Prediction of 200-m sprint
kayaking performance. Canadian Journal of Applied Physiology, 28, 505-
517.
Vanderthommen, M., Francaux, M., Johnson, D., Dewan, M., Lewyckyj, Y
& Sturbois, X. (1997) Measurement of the power output during the
acceleration phase of all-out arm cranking exercise. International Journal
of Sports Medicine, 18, 600-606.
Vandewalle, H., Peres, G., Heller, J. & Monod, H. (1985a) All out
anaerobic capacity tests on cycle ergometers. European Journal of Applied
Physiology and Occupational Physiology, 54, 222-229.
230
Vandewalle, H., Peres, G., Heller, J. & Monod, H. (1985b) All out
anaerobic capacity tests on cycle ergometers. A comparative study on
men and women. European Journal Of Applied Physiology And Occupational Physiology, 54, 222-229
Vandewalle, H., Peres, G. & Monod, H. (1987) Standard anaerobic exercise tests. Sports Medicine, 4, 268-289.
Verellen, J., Meyer, C., Janssens, L. & Vanlandewijck, Y. (2011) Peak and
submaximal steady-state metabolic and cardiorespiratory responses
during arm-powered and arm-trunk-powered handbike ergometry in able- bodied participants 2012, 11.
Voight, M. L., Hardin, J. A., Blackburn, T. A., Tippett, S. & Canner, G. C.
(1996) The effects of muscle fatigue on the relationship of arm dominance
to shoulder proprioception. Journal of Orthopaedic & Sports Physical Therapy, 23, 348-352.
Vokac, Z., Bell, H., Bautz-Holter, E. & Rodahl, K. (1975) Oxygen
uptake/heart rate relationship in leg and arm exercise, sitting and
standing. Journal of Applied Physiology, 39, 54-59.
Volianitis, S., Yoshiga, C. C., Nissen, P. & Secher, IN. H. (2004a) Effect of
fitness on arm vascular and metabolic responses to upper body exercise.
American Journal of Physiology. Heart and Circulatory Physiology, 286,
1736-1741.
Volianitis, S., Yoshiga, C. C., Vogelsang, T. & Secher, N. H. (2004b)
Arterial blood pressure and carotid baroreflex function during arm and
combined arm and leg exercise in humans. Acta Physiologica
Scandinavica, 181, 289-295.
Walker, R., Powers, S. & Stuart, M. K. (1986) Peak oxygen uptake in arm
ergometry: effects of testing protocol. British Journal of Sports Medicine,
20, 25-26.
a ter, S „ Dauis, L„ Avela, J. & Hakkinen, K. (2012) Neuromuscular
at'9Ue dUnn9 dVnamic maximal strength and hypertrophic resistance loadings. Journal of Electromyography Kinesiology,3, 356-362.
Warren, G. L„ Cureton, K. J„ Dengel, D. R„ Graham, R. E. & Ray, c. A.
(1990) is the gender difference in peak VO, greater for arm than leg
exercise? European Journal of Applied Physiology & Occupational Physiology, 60, 149-154.
Washburn, R. A. & Seals, D. R. (1984) Peak oxygen uptake during arm
cranking for men and women. Journal of Applied Physiology, 56, 954-957.
Weber, C. L., Chia, M. & Inbar, O. (2006) Gender Differences in Anaerobic
Power of the Arms and Legs-A Scaling Issue. Medicine & Science in Sports & Exercise, 38, 129-137.
Weissland, T., Marais, G., Robin, H., Vanvelcenaher, J. & Pelayo, P. (1999)
Relationship in humans between spontaneously chosen crank rate and
power output during upper body exercise at different levels of intensity
European Journal of Applied Physiology, 79, 230-236.
Weissland, T., Pelayo, P., Vanvelcnaher, J., Marais, G., Lavoie, J. M. &
Robin, H. (1997) Physiological effects of variations in spontaneously
chosen crank rate during incremental upper-body exercise. European
Journal of Applied Physiology & Occupational Physiology, 76, 428-433.
Westerblad, H., Allen, D. G. & Lannergren, J. (2002) Muscle fatigue: lactic
acid or inorganic phosphate the major cause? News in Physiological
Sciences, 17, 17-21.
Westhoff, T. H., Schmidt, S., Gross, V., Joppke, M., Zidek, W. & Dimeo, F.
(2008) The cardiovascular effects of upper-limb aerobic exercise in
hypertensive patients. Journal of Hypertension, 26, 1336-1342.

W i ls o n , J. M. (2007) Core Stability Training: Applications t0 Sports
°n ' '0n'^ Pr0grams- Jou™ ' of Strength and Conditioning Research,j-/ y/y~yo5.
Williams, C. 8, Wragg, C. (2004) Data Analysis and Research for Sport and Exercise Science, 1st Ed. London: Routledge.
Wilmore, J. H. & Costill, D. L. (1999) of Sport and
Ed. Champagne, III: Human Kinetics.!se, 2nd
Winter, E. M. (1991) Cycle ergometry and maximal intensity exercise.Sports Medicine, 11, 351-357.
Winter, E. M., Brown, D., Roberts, N. K. A., Brookes, F. B. C. & Swaine, I
L. (1996) Optimized and corrected peak power output during friction-
braked cycle ergometry. Journal of Sports Sciences, 14, 513-521.
Winter, E. M., Eston, R. G. & Lamb, K. L. (2001) Statistical analyses in the
physiology of exercise and kinanthropometry. Journal of Sports Sciences,
19, 761-775.
Winter, E. M. & Maclaren, D. P. (2001) Assessment of maximal-intensity
exercise. In: Eston, R & Reilly, T. (eds). Kinanthropometry and exercise
physiology laboratory manual: tests, procedures and data. pp. 263-288,
2nd Ed. London; United Kingdom: Routledge.
Wright, R. L., Wood, D. M. & James, D. V. B. (2007) Effect of Starting
Cadence on Sprint-Performance Indices in Friction-Loaded Cycle
Ergometry. International Journal of Sports Physiology & Performance, 2,
22-33.
Xu, F. & Rhodes, E. C. (1999) Oxygen Uptake Kinetics During Exercise.
Sports Medicine, 27, 313-327.
Yasuda, N„ Ruby, B. c. 8, Gaskill, S. E. (2002) Substrate
arm and leg exercise relative to the ventilatory threshold
of Sports Medicine & Physical Fitness, 42, 403-408
utilization during
in men. Journal
Yasuda, N., Ruby, B.
incremental arm and
ventilatory threshold
C. & Gaskill, S. E. (2006) Substrate oxidation
leg exercise in men and women matched for
Journal of Sports Sciences, 24, 1281-1289.
during
Yasuda, INI., S. E. Gaskill, B. C. Ruby (2008) No gender-specific differences
in mechanical efficiency during arm or leg exercise relative to ventilatory
threshold. Scandinavian Journal of Medicine & Science in Sports 18, 205-
Yosefy, C., Jafari, J., Klainman, E., Brodkin, B., Handschumacher, M. D
Vaturi, M. (2006) The prognostic value of post-exercise blood pressure
reduction in patients with hypertensive response during exercise
test. International Journal of Cardiology, 111, 352-357.
&
Zagatto, A. M., Papoti, M. & Gobatto, C. A. (2008) Anaerobic capacity may
not be determined by critical power model in elite table tennis players.
Journal of Sports Science & Medicine, 7, 54-59.
Zehr, E. P. & Chua, R. (2000) Modulation of human cutaneous reflexes
during rhythmic cyclical arm movement. Experimental Brain Research,
135, 241-250.
Ziemann, E., Grzywacz, T., Luszczyk, M., Laskowski, R., Olek, R. A. &
Gibson, A. L. (2011) Aerobic and anaerobic changes with high-intensity
interval training in active college-aged men. Journal of Strength &
Conditioning Research 25, 1104-1112.
Ziemba, A. W., Chwalbinska-Moneta, J., Kaciuba-Uscilko, H., Kruk, B.,
Krzeminski, K., Cybulski, G. & Nazar, K. (2003) Early effects of short-term
training. Journal of Sports Medicine and Physical Fitness, 43, 57-63.

Zwierska, I., Waiker, R. D , Choksy, s. A., Male, j. s „ Rockiey, A. G. *
Saxton, J. M. (2005) Upper- vs lower-limb aerobic exercise rehabilitation
.n patients with symptomatic peripheral arterial disease: a randomized
controlled trial. Journal of Vascular Surgery., 42, 1122-1130.
Related Documents


