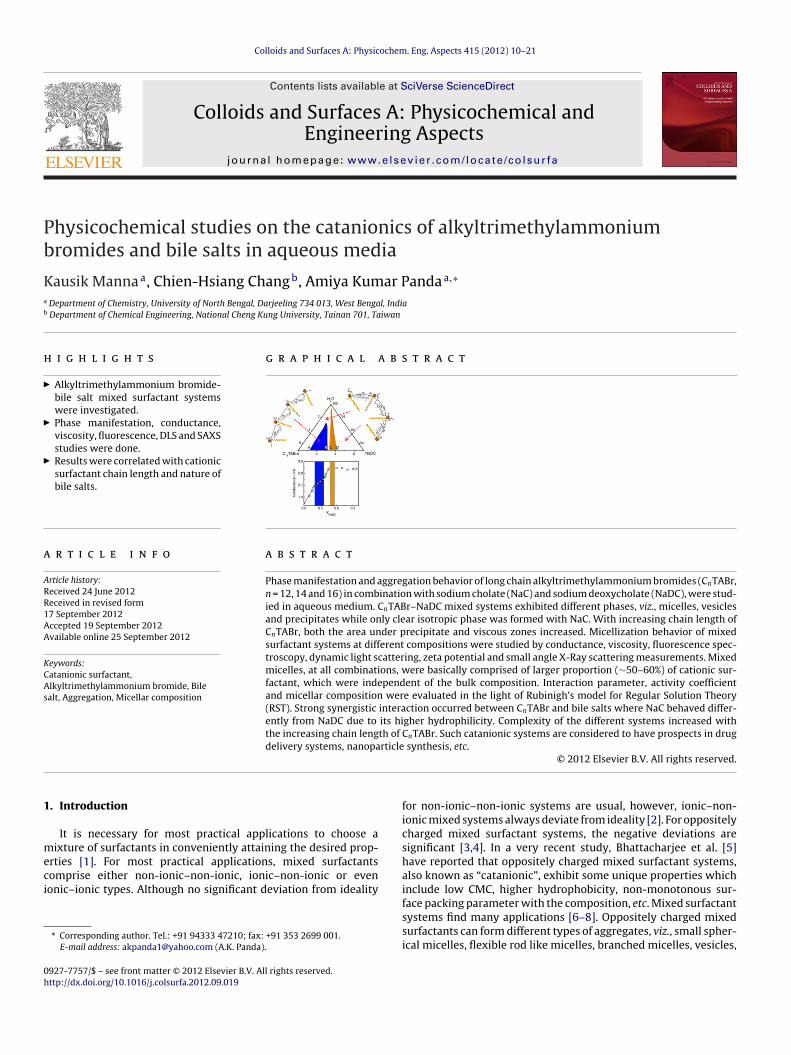
Colloids and Surfaces A: Physicochem. Eng. Aspects 415 (2012) 10–21 Contents lists available at SciVerse ScienceDirect Colloids and Surfaces A: Physicochemical and Engineering Aspects jo ur n al hom ep age: www.elsevier.com/locate/colsurfa Physicochemical studies on the catanionics of alkyltrimethylammonium bromides and bile salts in aqueous media Kausik Manna a , Chien-Hsiang Chang b , Amiya Kumar Panda a,∗ a Department of Chemistry, University of North Bengal, Darjeeling 734 013, West Bengal, India b Department of Chemical Engineering, National Cheng Kung University, Tainan 701, Taiwan h i g h l i g h t s Alkyltrimethylammonium bromide- bile salt mixed surfactant systems were investigated. Phase manifestation, conductance, viscosity, fluorescence, DLS and SAXS studies were done. Results were correlated with cationic surfactant chain length and nature of bile salts. g r a p h i c a l a b s t r a c t a r t i c l e i n f o Article history: Received 24 June 2012 Received in revised form 17 September 2012 Accepted 19 September 2012 Available online 25 September 2012 Keywords: Catanionic surfactant, Alkyltrimethylammonium bromide, Bile salt, Aggregation, Micellar composition a b s t r a c t Phase manifestation and aggregation behavior of long chain alkyltrimethylammonium bromides (C n TABr, n = 12, 14 and 16) in combination with sodium cholate (NaC) and sodium deoxycholate (NaDC), were stud- ied in aqueous medium. C n TABr–NaDC mixed systems exhibited different phases, viz., micelles, vesicles and precipitates while only clear isotropic phase was formed with NaC. With increasing chain length of C n TABr, both the area under precipitate and viscous zones increased. Micellization behavior of mixed surfactant systems at different compositions were studied by conductance, viscosity, fluorescence spec- troscopy, dynamic light scattering, zeta potential and small angle X-Ray scattering measurements. Mixed micelles, at all combinations, were basically comprised of larger proportion (∼50–60%) of cationic sur- factant, which were independent of the bulk composition. Interaction parameter, activity coefficient and micellar composition were evaluated in the light of Rubinigh’s model for Regular Solution Theory (RST). Strong synergistic interaction occurred between C n TABr and bile salts where NaC behaved differ- ently from NaDC due to its higher hydrophilicity. Complexity of the different systems increased with the increasing chain length of C n TABr. Such catanionic systems are considered to have prospects in drug delivery systems, nanoparticle synthesis, etc. © 2012 Elsevier B.V. All rights reserved. 1. Introduction It is necessary for most practical applications to choose a mixture of surfactants in conveniently attaining the desired prop- erties [1]. For most practical applications, mixed surfactants comprise either non-ionic–non-ionic, ionic–non-ionic or even ionic–ionic types. Although no significant deviation from ideality ∗ Corresponding author. Tel.: +91 94333 47210; fax: +91 353 2699 001. E-mail address: [email protected] (A.K. Panda). for non-ionic–non-ionic systems are usual, however, ionic–non- ionic mixed systems always deviate from ideality [2]. For oppositely charged mixed surfactant systems, the negative deviations are significant [3,4]. In a very recent study, Bhattacharjee et al. [5] have reported that oppositely charged mixed surfactant systems, also known as “catanionic”, exhibit some unique properties which include low CMC, higher hydrophobicity, non-monotonous sur- face packing parameter with the composition, etc. Mixed surfactant systems find many applications [6–8]. Oppositely charged mixed surfactants can form different types of aggregates, viz., small spher- ical micelles, flexible rod like micelles, branched micelles, vesicles, 0927-7757/$ – see front matter © 2012 Elsevier B.V. All rights reserved. http://dx.doi.org/10.1016/j.colsurfa.2012.09.019

Welcome message from author
This document is posted to help you gain knowledge. Please leave a comment to let me know what you think about it! Share it to your friends and learn new things together.
Transcript
Pb
Ka
b
h
�
�
�
a
ARR1AA
KCAs
1
meci
0h
Colloids and Surfaces A: Physicochem. Eng. Aspects 415 (2012) 10– 21
Contents lists available at SciVerse ScienceDirect
Colloids and Surfaces A: Physicochemical andEngineering Aspects
jo ur n al hom ep age: www.elsev ier .com/ locate /co lsur fa
hysicochemical studies on the catanionics of alkyltrimethylammoniumromides and bile salts in aqueous media
ausik Mannaa, Chien-Hsiang Changb, Amiya Kumar Pandaa,∗
Department of Chemistry, University of North Bengal, Darjeeling 734 013, West Bengal, IndiaDepartment of Chemical Engineering, National Cheng Kung University, Tainan 701, Taiwan
i g h l i g h t s
Alkyltrimethylammonium bromide-bile salt mixed surfactant systemswere investigated.Phase manifestation, conductance,viscosity, fluorescence, DLS and SAXSstudies were done.Results were correlated with cationicsurfactant chain length and nature ofbile salts.
g r a p h i c a l a b s t r a c t
r t i c l e i n f o
rticle history:eceived 24 June 2012eceived in revised form7 September 2012ccepted 19 September 2012vailable online 25 September 2012
eywords:atanionic surfactant,
a b s t r a c t
Phase manifestation and aggregation behavior of long chain alkyltrimethylammonium bromides (CnTABr,n = 12, 14 and 16) in combination with sodium cholate (NaC) and sodium deoxycholate (NaDC), were stud-ied in aqueous medium. CnTABr–NaDC mixed systems exhibited different phases, viz., micelles, vesiclesand precipitates while only clear isotropic phase was formed with NaC. With increasing chain length ofCnTABr, both the area under precipitate and viscous zones increased. Micellization behavior of mixedsurfactant systems at different compositions were studied by conductance, viscosity, fluorescence spec-troscopy, dynamic light scattering, zeta potential and small angle X-Ray scattering measurements. Mixedmicelles, at all combinations, were basically comprised of larger proportion (∼50–60%) of cationic sur-
lkyltrimethylammonium bromide, Bilealt, Aggregation, Micellar composition
factant, which were independent of the bulk composition. Interaction parameter, activity coefficientand micellar composition were evaluated in the light of Rubinigh’s model for Regular Solution Theory(RST). Strong synergistic interaction occurred between CnTABr and bile salts where NaC behaved differ-ently from NaDC due to its higher hydrophilicity. Complexity of the different systems increased withthe increasing chain length of CnTABr. Such catanionic systems are considered to have prospects in drug
rticle
delivery systems, nanopa. Introduction
It is necessary for most practical applications to choose aixture of surfactants in conveniently attaining the desired prop-
rties [1]. For most practical applications, mixed surfactantsomprise either non-ionic–non-ionic, ionic–non-ionic or evenonic–ionic types. Although no significant deviation from ideality
∗ Corresponding author. Tel.: +91 94333 47210; fax: +91 353 2699 001.E-mail address: [email protected] (A.K. Panda).
927-7757/$ – see front matter © 2012 Elsevier B.V. All rights reserved.ttp://dx.doi.org/10.1016/j.colsurfa.2012.09.019
synthesis, etc.© 2012 Elsevier B.V. All rights reserved.
for non-ionic–non-ionic systems are usual, however, ionic–non-ionic mixed systems always deviate from ideality [2]. For oppositelycharged mixed surfactant systems, the negative deviations aresignificant [3,4]. In a very recent study, Bhattacharjee et al. [5]have reported that oppositely charged mixed surfactant systems,also known as “catanionic”, exhibit some unique properties whichinclude low CMC, higher hydrophobicity, non-monotonous sur-
face packing parameter with the composition, etc. Mixed surfactantsystems find many applications [6–8]. Oppositely charged mixedsurfactants can form different types of aggregates, viz., small spher-ical micelles, flexible rod like micelles, branched micelles, vesicles,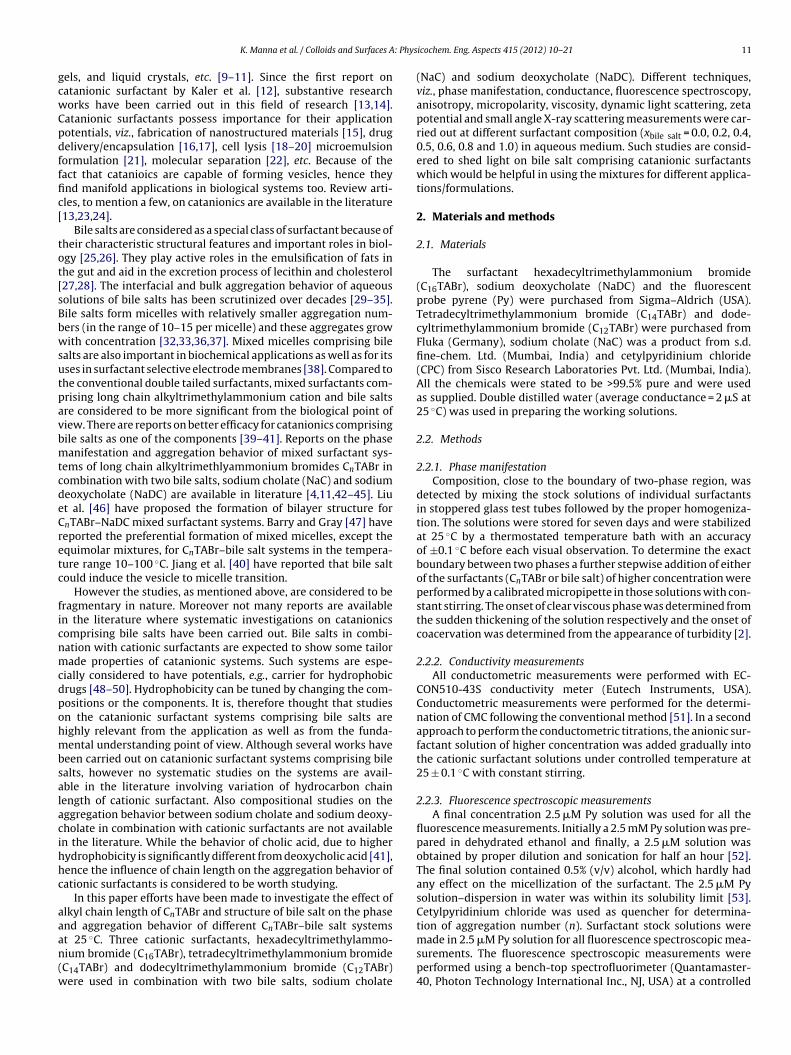
: Phys
gcwCpdfffic[
tot[sBbwsutpavbmtcdeCretc
ficnmcdpohmbsalacihhc
aaan(w
K. Manna et al. / Colloids and Surfaces A
els, and liquid crystals, etc. [9–11]. Since the first report onatanionic surfactant by Kaler et al. [12], substantive researchorks have been carried out in this field of research [13,14].atanionic surfactants possess importance for their applicationotentials, viz., fabrication of nanostructured materials [15], drugelivery/encapsulation [16,17], cell lysis [18–20] microemulsionormulation [21], molecular separation [22], etc. Because of theact that catanioics are capable of forming vesicles, hence theynd manifold applications in biological systems too. Review arti-les, to mention a few, on catanionics are available in the literature13,23,24].
Bile salts are considered as a special class of surfactant because ofheir characteristic structural features and important roles in biol-gy [25,26]. They play active roles in the emulsification of fats inhe gut and aid in the excretion process of lecithin and cholesterol27,28]. The interfacial and bulk aggregation behavior of aqueousolutions of bile salts has been scrutinized over decades [29–35].ile salts form micelles with relatively smaller aggregation num-ers (in the range of 10–15 per micelle) and these aggregates growith concentration [32,33,36,37]. Mixed micelles comprising bile
alts are also important in biochemical applications as well as for itsses in surfactant selective electrode membranes [38]. Compared tohe conventional double tailed surfactants, mixed surfactants com-rising long chain alkyltrimethylammonium cation and bile saltsre considered to be more significant from the biological point ofiew. There are reports on better efficacy for catanionics comprisingile salts as one of the components [39–41]. Reports on the phaseanifestation and aggregation behavior of mixed surfactant sys-
ems of long chain alkyltrimethlyammonium bromides CnTABr inombination with two bile salts, sodium cholate (NaC) and sodiumeoxycholate (NaDC) are available in literature [4,11,42–45]. Liut al. [46] have proposed the formation of bilayer structure fornTABr–NaDC mixed surfactant systems. Barry and Gray [47] haveeported the preferential formation of mixed micelles, except thequimolar mixtures, for CnTABr–bile salt systems in the tempera-ure range 10–100 ◦C. Jiang et al. [40] have reported that bile saltould induce the vesicle to micelle transition.
However the studies, as mentioned above, are considered to beragmentary in nature. Moreover not many reports are availablen the literature where systematic investigations on catanionicsomprising bile salts have been carried out. Bile salts in combi-ation with cationic surfactants are expected to show some tailorade properties of catanionic systems. Such systems are espe-
ially considered to have potentials, e.g., carrier for hydrophobicrugs [48–50]. Hydrophobicity can be tuned by changing the com-ositions or the components. It is, therefore thought that studiesn the catanionic surfactant systems comprising bile salts areighly relevant from the application as well as from the funda-ental understanding point of view. Although several works have
een carried out on catanionic surfactant systems comprising bilealts, however no systematic studies on the systems are avail-ble in the literature involving variation of hydrocarbon chainength of cationic surfactant. Also compositional studies on theggregation behavior between sodium cholate and sodium deoxy-holate in combination with cationic surfactants are not availablen the literature. While the behavior of cholic acid, due to higherydrophobicity is significantly different from deoxycholic acid [41],ence the influence of chain length on the aggregation behavior ofationic surfactants is considered to be worth studying.
In this paper efforts have been made to investigate the effect oflkyl chain length of CnTABr and structure of bile salt on the phasend aggregation behavior of different CnTABr–bile salt systems
t 25 ◦C. Three cationic surfactants, hexadecyltrimethylammo-ium bromide (C16TABr), tetradecyltrimethylammonium bromideC14TABr) and dodecyltrimethylammonium bromide (C12TABr)ere used in combination with two bile salts, sodium cholateicochem. Eng. Aspects 415 (2012) 10– 21 11
(NaC) and sodium deoxycholate (NaDC). Different techniques,viz., phase manifestation, conductance, fluorescence spectroscopy,anisotropy, micropolarity, viscosity, dynamic light scattering, zetapotential and small angle X-ray scattering measurements were car-ried out at different surfactant composition (xbile salt = 0.0, 0.2, 0.4,0.5, 0.6, 0.8 and 1.0) in aqueous medium. Such studies are consid-ered to shed light on bile salt comprising catanionic surfactantswhich would be helpful in using the mixtures for different applica-tions/formulations.
2. Materials and methods
2.1. Materials
The surfactant hexadecyltrimethylammonium bromide(C16TABr), sodium deoxycholate (NaDC) and the fluorescentprobe pyrene (Py) were purchased from Sigma–Aldrich (USA).Tetradecyltrimethylammonium bromide (C14TABr) and dode-cyltrimethylammonium bromide (C12TABr) were purchased fromFluka (Germany), sodium cholate (NaC) was a product from s.d.fine-chem. Ltd. (Mumbai, India) and cetylpyridinium chloride(CPC) from Sisco Research Laboratories Pvt. Ltd. (Mumbai, India).All the chemicals were stated to be >99.5% pure and were usedas supplied. Double distilled water (average conductance = 2 �S at25 ◦C) was used in preparing the working solutions.
2.2. Methods
2.2.1. Phase manifestationComposition, close to the boundary of two-phase region, was
detected by mixing the stock solutions of individual surfactantsin stoppered glass test tubes followed by the proper homogeniza-tion. The solutions were stored for seven days and were stabilizedat 25 ◦C by a thermostated temperature bath with an accuracyof ±0.1 ◦C before each visual observation. To determine the exactboundary between two phases a further stepwise addition of eitherof the surfactants (CnTABr or bile salt) of higher concentration wereperformed by a calibrated micropipette in those solutions with con-stant stirring. The onset of clear viscous phase was determined fromthe sudden thickening of the solution respectively and the onset ofcoacervation was determined from the appearance of turbidity [2].
2.2.2. Conductivity measurementsAll conductometric measurements were performed with EC-
CON510-43S conductivity meter (Eutech Instruments, USA).Conductometric measurements were performed for the determi-nation of CMC following the conventional method [51]. In a secondapproach to perform the conductometric titrations, the anionic sur-factant solution of higher concentration was added gradually intothe cationic surfactant solutions under controlled temperature at25 ± 0.1 ◦C with constant stirring.
2.2.3. Fluorescence spectroscopic measurementsA final concentration 2.5 �M Py solution was used for all the
fluorescence measurements. Initially a 2.5 mM Py solution was pre-pared in dehydrated ethanol and finally, a 2.5 �M solution wasobtained by proper dilution and sonication for half an hour [52].The final solution contained 0.5% (v/v) alcohol, which hardly hadany effect on the micellization of the surfactant. The 2.5 �M Pysolution–dispersion in water was within its solubility limit [53].Cetylpyridinium chloride was used as quencher for determina-tion of aggregation number (n). Surfactant stock solutions were
made in 2.5 �M Py solution for all fluorescence spectroscopic mea-surements. The fluorescence spectroscopic measurements wereperformed using a bench-top spectrofluorimeter (Quantamaster-40, Photon Technology International Inc., NJ, USA) at a controlled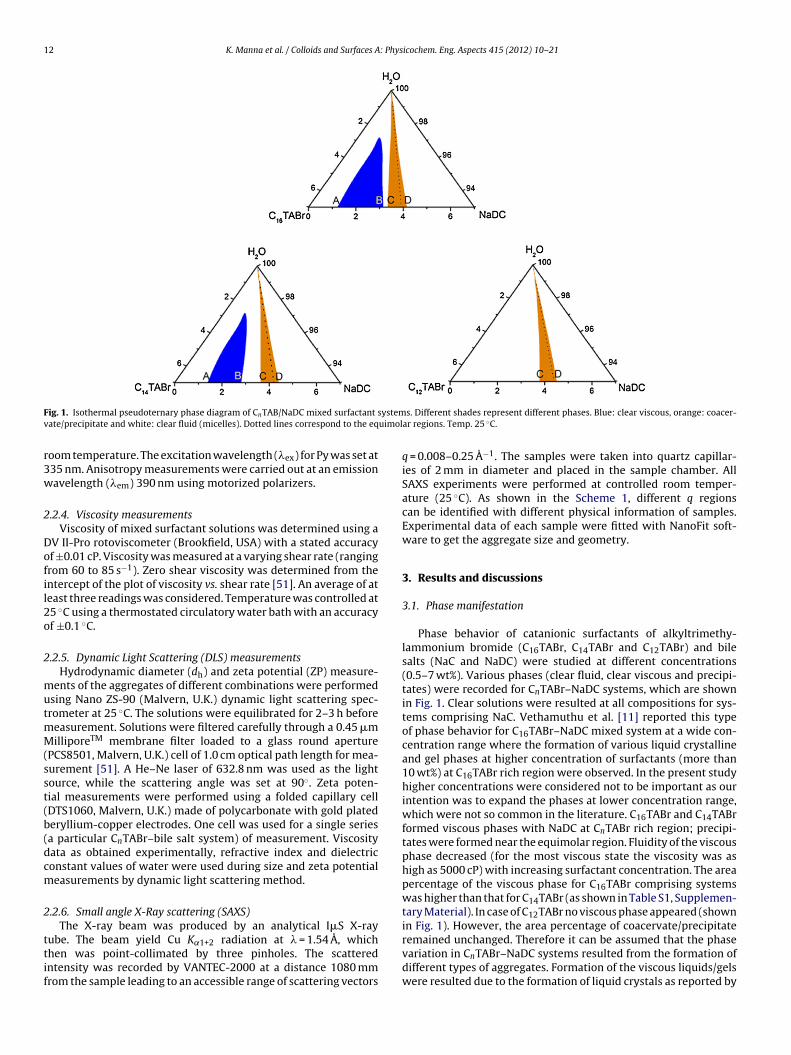
12 K. Manna et al. / Colloids and Surfaces A: Physicochem. Eng. Aspects 415 (2012) 10– 21
F ystemv uimol
r3w
2
Dofil2o
2
mutmM(sst(b(dcm
2
ttif
ig. 1. Isothermal pseudoternary phase diagram of CnTAB/NaDC mixed surfactant sate/precipitate and white: clear fluid (micelles). Dotted lines correspond to the eq
oom temperature. The excitation wavelength (�ex) for Py was set at35 nm. Anisotropy measurements were carried out at an emissionavelength (�em) 390 nm using motorized polarizers.
.2.4. Viscosity measurementsViscosity of mixed surfactant solutions was determined using a
V II-Pro rotoviscometer (Brookfield, USA) with a stated accuracyf ±0.01 cP. Viscosity was measured at a varying shear rate (rangingrom 60 to 85 s−1). Zero shear viscosity was determined from thentercept of the plot of viscosity vs. shear rate [51]. An average of ateast three readings was considered. Temperature was controlled at5 ◦C using a thermostated circulatory water bath with an accuracyf ±0.1 ◦C.
.2.5. Dynamic Light Scattering (DLS) measurementsHydrodynamic diameter (dh) and zeta potential (ZP) measure-
ents of the aggregates of different combinations were performedsing Nano ZS-90 (Malvern, U.K.) dynamic light scattering spec-rometer at 25 ◦C. The solutions were equilibrated for 2–3 h before
easurement. Solutions were filtered carefully through a 0.45 �milliporeTM membrane filter loaded to a glass round aperture
PCS8501, Malvern, U.K.) cell of 1.0 cm optical path length for mea-urement [51]. A He–Ne laser of 632.8 nm was used as the lightource, while the scattering angle was set at 90◦. Zeta poten-ial measurements were performed using a folded capillary cellDTS1060, Malvern, U.K.) made of polycarbonate with gold platederyllium-copper electrodes. One cell was used for a single seriesa particular CnTABr–bile salt system) of measurement. Viscosityata as obtained experimentally, refractive index and dielectriconstant values of water were used during size and zeta potentialeasurements by dynamic light scattering method.
.2.6. Small angle X-Ray scattering (SAXS)The X-ray beam was produced by an analytical I�S X-ray
ube. The beam yield Cu K˛1+2 radiation at � = 1.54 A, whichhen was point-collimated by three pinholes. The scatteredntensity was recorded by VANTEC-2000 at a distance 1080 mmrom the sample leading to an accessible range of scattering vectors
s. Different shades represent different phases. Blue: clear viscous, orange: coacer-ar regions. Temp. 25 ◦C.
q = 0.008–0.25 A−1. The samples were taken into quartz capillar-ies of 2 mm in diameter and placed in the sample chamber. AllSAXS experiments were performed at controlled room temper-ature (25 ◦C). As shown in the Scheme 1, different q regionscan be identified with different physical information of samples.Experimental data of each sample were fitted with NanoFit soft-ware to get the aggregate size and geometry.
3. Results and discussions
3.1. Phase manifestation
Phase behavior of catanionic surfactants of alkyltrimethy-lammonium bromide (C16TABr, C14TABr and C12TABr) and bilesalts (NaC and NaDC) were studied at different concentrations(0.5–7 wt%). Various phases (clear fluid, clear viscous and precipi-tates) were recorded for CnTABr–NaDC systems, which are shownin Fig. 1. Clear solutions were resulted at all compositions for sys-tems comprising NaC. Vethamuthu et al. [11] reported this typeof phase behavior for C16TABr–NaDC mixed system at a wide con-centration range where the formation of various liquid crystallineand gel phases at higher concentration of surfactants (more than10 wt%) at C16TABr rich region were observed. In the present studyhigher concentrations were considered not to be important as ourintention was to expand the phases at lower concentration range,which were not so common in the literature. C16TABr and C14TABrformed viscous phases with NaDC at CnTABr rich region; precipi-tates were formed near the equimolar region. Fluidity of the viscousphase decreased (for the most viscous state the viscosity was ashigh as 5000 cP) with increasing surfactant concentration. The areapercentage of the viscous phase for C16TABr comprising systemswas higher than that for C14TABr (as shown in Table S1, Supplemen-tary Material). In case of C12TABr no viscous phase appeared (shownin Fig. 1). However, the area percentage of coacervate/precipitate
remained unchanged. Therefore it can be assumed that the phasevariation in CnTABr–NaDC systems resulted from the formation ofdifferent types of aggregates. Formation of the viscous liquids/gelswere resulted due to the formation of liquid crystals as reported by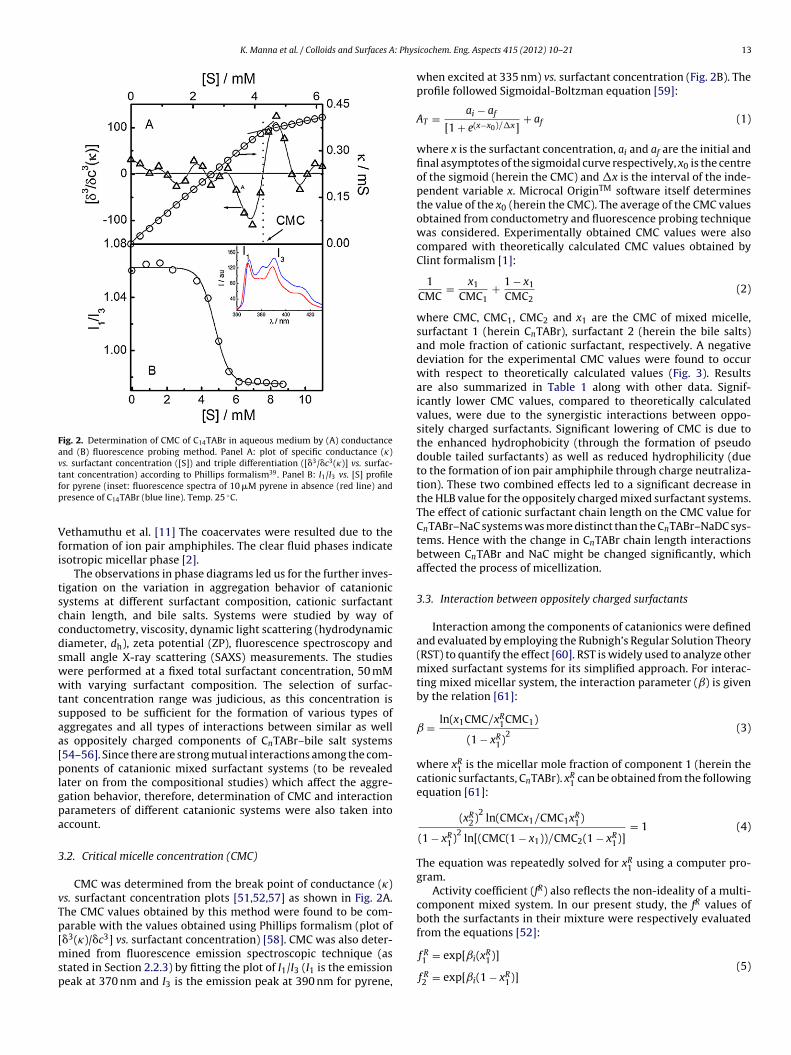
K. Manna et al. / Colloids and Surfaces A: Phys
Fig. 2. Determination of CMC of C14TABr in aqueous medium by (A) conductanceand (B) fluorescence probing method. Panel A: plot of specific conductance (�)vs. surfactant concentration ([S]) and triple differentiation ([�3/�c3(�)] vs. surfac-t 39
fp
Vfi
tsccdswwtsaa[plgpa
3
vTp[msp
from the equations [52]:
ant concentration) according to Phillips formalism . Panel B: I1/I3 vs. [S] profileor pyrene (inset: fluorescence spectra of 10 �M pyrene in absence (red line) andresence of C14TABr (blue line). Temp. 25 ◦C.
ethamuthu et al. [11] The coacervates were resulted due to theormation of ion pair amphiphiles. The clear fluid phases indicatesotropic micellar phase [2].
The observations in phase diagrams led us for the further inves-igation on the variation in aggregation behavior of catanionicystems at different surfactant composition, cationic surfactanthain length, and bile salts. Systems were studied by way ofonductometry, viscosity, dynamic light scattering (hydrodynamiciameter, dh), zeta potential (ZP), fluorescence spectroscopy andmall angle X-ray scattering (SAXS) measurements. The studiesere performed at a fixed total surfactant concentration, 50 mMith varying surfactant composition. The selection of surfac-
ant concentration range was judicious, as this concentration isupposed to be sufficient for the formation of various types ofggregates and all types of interactions between similar as wells oppositely charged components of CnTABr–bile salt systems54–56]. Since there are strong mutual interactions among the com-onents of catanionic mixed surfactant systems (to be revealed
ater on from the compositional studies) which affect the aggre-ation behavior, therefore, determination of CMC and interactionarameters of different catanionic systems were also taken intoccount.
.2. Critical micelle concentration (CMC)
CMC was determined from the break point of conductance (�)s. surfactant concentration plots [51,52,57] as shown in Fig. 2A.he CMC values obtained by this method were found to be com-arable with the values obtained using Phillips formalism (plot of3 3
� (�)/�c ] vs. surfactant concentration) [58]. CMC was also deter-ined from fluorescence emission spectroscopic technique (astated in Section 2.2.3) by fitting the plot of I1/I3 (I1 is the emissioneak at 370 nm and I3 is the emission peak at 390 nm for pyrene,
icochem. Eng. Aspects 415 (2012) 10– 21 13
when excited at 335 nm) vs. surfactant concentration (Fig. 2B). Theprofile followed Sigmoidal-Boltzman equation [59]:
AT = ai − af
[1 + e(x−x0)/�x]+ af (1)
where x is the surfactant concentration, ai and af are the initial andfinal asymptotes of the sigmoidal curve respectively, x0 is the centreof the sigmoid (herein the CMC) and �x is the interval of the inde-pendent variable x. Microcal OriginTM software itself determinesthe value of the x0 (herein the CMC). The average of the CMC valuesobtained from conductometry and fluorescence probing techniquewas considered. Experimentally obtained CMC values were alsocompared with theoretically calculated CMC values obtained byClint formalism [1]:
1CMC
= x1
CMC1+ 1 − x1
CMC2(2)
where CMC, CMC1, CMC2 and x1 are the CMC of mixed micelle,surfactant 1 (herein CnTABr), surfactant 2 (herein the bile salts)and mole fraction of cationic surfactant, respectively. A negativedeviation for the experimental CMC values were found to occurwith respect to theoretically calculated values (Fig. 3). Resultsare also summarized in Table 1 along with other data. Signif-icantly lower CMC values, compared to theoretically calculatedvalues, were due to the synergistic interactions between oppo-sitely charged surfactants. Significant lowering of CMC is due tothe enhanced hydrophobicity (through the formation of pseudodouble tailed surfactants) as well as reduced hydrophilicity (dueto the formation of ion pair amphiphile through charge neutraliza-tion). These two combined effects led to a significant decrease inthe HLB value for the oppositely charged mixed surfactant systems.The effect of cationic surfactant chain length on the CMC value forCnTABr–NaC systems was more distinct than the CnTABr–NaDC sys-tems. Hence with the change in CnTABr chain length interactionsbetween CnTABr and NaC might be changed significantly, whichaffected the process of micellization.
3.3. Interaction between oppositely charged surfactants
Interaction among the components of catanionics were definedand evaluated by employing the Rubnigh’s Regular Solution Theory(RST) to quantify the effect [60]. RST is widely used to analyze othermixed surfactant systems for its simplified approach. For interac-ting mixed micellar system, the interaction parameter (ˇ) is givenby the relation [61]:
ˇ = ln(x1CMC/xR1CMC1)
(1 − xR1)
2(3)
where xR1 is the micellar mole fraction of component 1 (herein the
cationic surfactants, CnTABr). xR1 can be obtained from the following
equation [61]:
(xR2)
2ln(CMCx1/CMC1xR
1)
(1 − xR1)
2ln[(CMC(1 − x1))/CMC2(1 − xR
1)]= 1 (4)
The equation was repeatedly solved for xR1 using a computer pro-
gram.Activity coefficient (fR) also reflects the non-ideality of a multi-
component mixed system. In our present study, the fR values ofboth the surfactants in their mixture were respectively evaluated
f R1 = exp[ˇi(xR
1)]
f R2 = exp[ˇi(1 − xR
1)](5)
14 K. Manna et al. / Colloids and Surfaces A: Physicochem. Eng. Aspects 415 (2012) 10– 21
Fig. 3. Variation of CMC for CnTABr–NaC (panel A) and CnTABr–NaDC (panel B) mixed surfactant systems with the mole fraction of bile salt (xbile salt). Systems: –�–, C16TABr,–©–, C14TABr and –�–, C12TABr. Open symbols correspond to the experimental values and solid symbols correspond to the theoretically calculated values obtained by Clintformalism1. Temp. 25 ◦C.
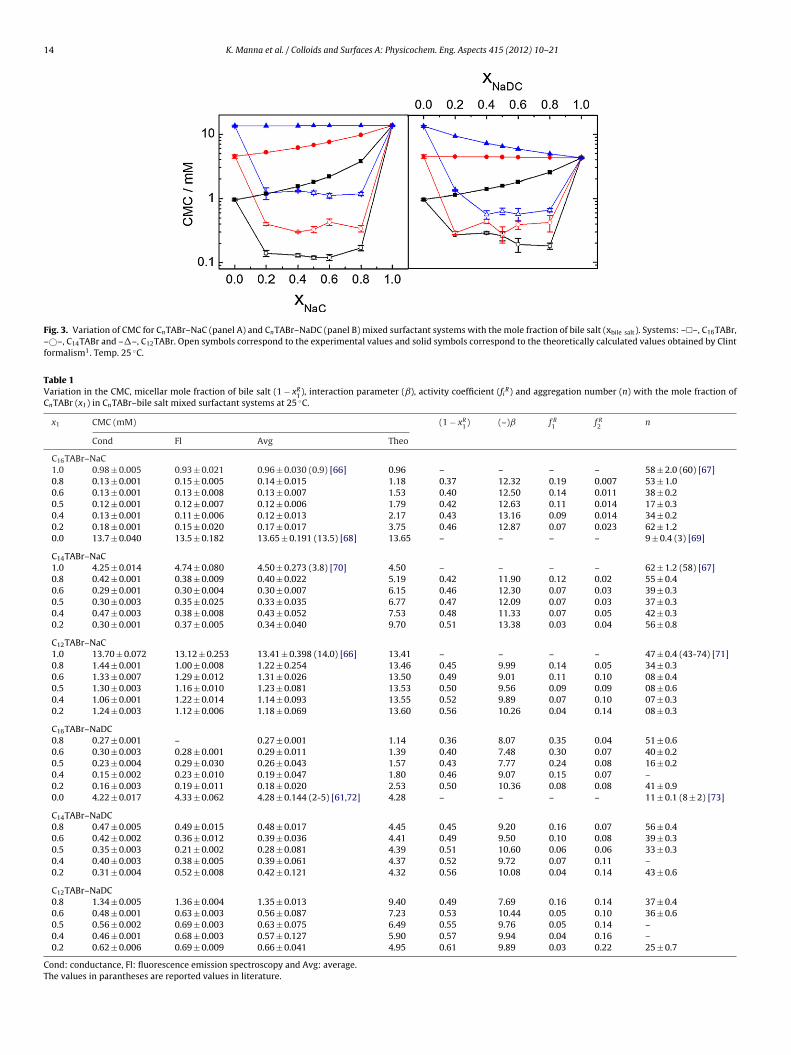
Table 1Variation in the CMC, micellar mole fraction of bile salt (1 − xR
1), interaction parameter (ˇ), activity coefficient (fiR) and aggregation number (n) with the mole fraction ofCnTABr (x1) in CnTABr–bile salt mixed surfactant systems at 25 ◦C.
x1 CMC (mM) (1 − xR1) (–)ˇ f R
1 f R2 n
Cond Fl Avg Theo
C16TABr–NaC1.0 0.98 ± 0.005 0.93 ± 0.021 0.96 ± 0.030 (0.9) [66] 0.96 – – – – 58 ± 2.0 (60) [67]0.8 0.13 ± 0.001 0.15 ± 0.005 0.14 ± 0.015 1.18 0.37 12.32 0.19 0.007 53 ± 1.00.6 0.13 ± 0.001 0.13 ± 0.008 0.13 ± 0.007 1.53 0.40 12.50 0.14 0.011 38 ± 0.20.5 0.12 ± 0.001 0.12 ± 0.007 0.12 ± 0.006 1.79 0.42 12.63 0.11 0.014 17 ± 0.30.4 0.13 ± 0.001 0.11 ± 0.006 0.12 ± 0.013 2.17 0.43 13.16 0.09 0.014 34 ± 0.20.2 0.18 ± 0.001 0.15 ± 0.020 0.17 ± 0.017 3.75 0.46 12.87 0.07 0.023 62 ± 1.20.0 13.7 ± 0.040 13.5 ± 0.182 13.65 ± 0.191 (13.5) [68] 13.65 – – – – 9 ± 0.4 (3) [69]
C14TABr–NaC1.0 4.25 ± 0.014 4.74 ± 0.080 4.50 ± 0.273 (3.8) [70] 4.50 – – – – 62 ± 1.2 (58) [67]0.8 0.42 ± 0.001 0.38 ± 0.009 0.40 ± 0.022 5.19 0.42 11.90 0.12 0.02 55 ± 0.40.6 0.29 ± 0.001 0.30 ± 0.004 0.30 ± 0.007 6.15 0.46 12.30 0.07 0.03 39 ± 0.30.5 0.30 ± 0.003 0.35 ± 0.025 0.33 ± 0.035 6.77 0.47 12.09 0.07 0.03 37 ± 0.30.4 0.47 ± 0.003 0.38 ± 0.008 0.43 ± 0.052 7.53 0.48 11.33 0.07 0.05 42 ± 0.30.2 0.30 ± 0.001 0.37 ± 0.005 0.34 ± 0.040 9.70 0.51 13.38 0.03 0.04 56 ± 0.8
C12TABr–NaC1.0 13.70 ± 0.072 13.12 ± 0.253 13.41 ± 0.398 (14.0) [66] 13.41 – – – – 47 ± 0.4 (43-74) [71]0.8 1.44 ± 0.001 1.00 ± 0.008 1.22 ± 0.254 13.46 0.45 9.99 0.14 0.05 34 ± 0.30.6 1.33 ± 0.007 1.29 ± 0.012 1.31 ± 0.026 13.50 0.49 9.01 0.11 0.10 08 ± 0.40.5 1.30 ± 0.003 1.16 ± 0.010 1.23 ± 0.081 13.53 0.50 9.56 0.09 0.09 08 ± 0.60.4 1.06 ± 0.001 1.22 ± 0.014 1.14 ± 0.093 13.55 0.52 9.89 0.07 0.10 07 ± 0.30.2 1.24 ± 0.003 1.12 ± 0.006 1.18 ± 0.069 13.60 0.56 10.26 0.04 0.14 08 ± 0.3
C16TABr–NaDC0.8 0.27 ± 0.001 – 0.27 ± 0.001 1.14 0.36 8.07 0.35 0.04 51 ± 0.60.6 0.30 ± 0.003 0.28 ± 0.001 0.29 ± 0.011 1.39 0.40 7.48 0.30 0.07 40 ± 0.20.5 0.23 ± 0.004 0.29 ± 0.030 0.26 ± 0.043 1.57 0.43 7.77 0.24 0.08 16 ± 0.20.4 0.15 ± 0.002 0.23 ± 0.010 0.19 ± 0.047 1.80 0.46 9.07 0.15 0.07 –0.2 0.16 ± 0.003 0.19 ± 0.011 0.18 ± 0.020 2.53 0.50 10.36 0.08 0.08 41 ± 0.90.0 4.22 ± 0.017 4.33 ± 0.062 4.28 ± 0.144 (2-5) [61,72] 4.28 – – – – 11 ± 0.1 (8 ± 2) [73]
C14TABr–NaDC0.8 0.47 ± 0.005 0.49 ± 0.015 0.48 ± 0.017 4.45 0.45 9.20 0.16 0.07 56 ± 0.40.6 0.42 ± 0.002 0.36 ± 0.012 0.39 ± 0.036 4.41 0.49 9.50 0.10 0.08 39 ± 0.30.5 0.35 ± 0.003 0.21 ± 0.002 0.28 ± 0.081 4.39 0.51 10.60 0.06 0.06 33 ± 0.30.4 0.40 ± 0.003 0.38 ± 0.005 0.39 ± 0.061 4.37 0.52 9.72 0.07 0.11 –0.2 0.31 ± 0.004 0.52 ± 0.008 0.42 ± 0.121 4.32 0.56 10.08 0.04 0.14 43 ± 0.6
C12TABr–NaDC0.8 1.34 ± 0.005 1.36 ± 0.004 1.35 ± 0.013 9.40 0.49 7.69 0.16 0.14 37 ± 0.40.6 0.48 ± 0.001 0.63 ± 0.003 0.56 ± 0.087 7.23 0.53 10.44 0.05 0.10 36 ± 0.60.5 0.56 ± 0.002 0.69 ± 0.003 0.63 ± 0.075 6.49 0.55 9.76 0.05 0.14 –0.4 0.46 ± 0.001 0.68 ± 0.003 0.57 ± 0.127 5.90 0.57 9.94 0.04 0.16 –0.2 0.62 ± 0.006 0.69 ± 0.009 0.66 ± 0.041 4.95 0.61 9.89 0.03 0.22 25 ± 0.7
Cond: conductance, Fl: fluorescence emission spectroscopy and Avg: average.The values in parantheses are reported values in literature.
K. Manna et al. / Colloids and Surfaces A: Physicochem. Eng. Aspects 415 (2012) 10– 21 15
F e profiI anel I( ized i
wi
sptttcpwbiopai
Ft2c
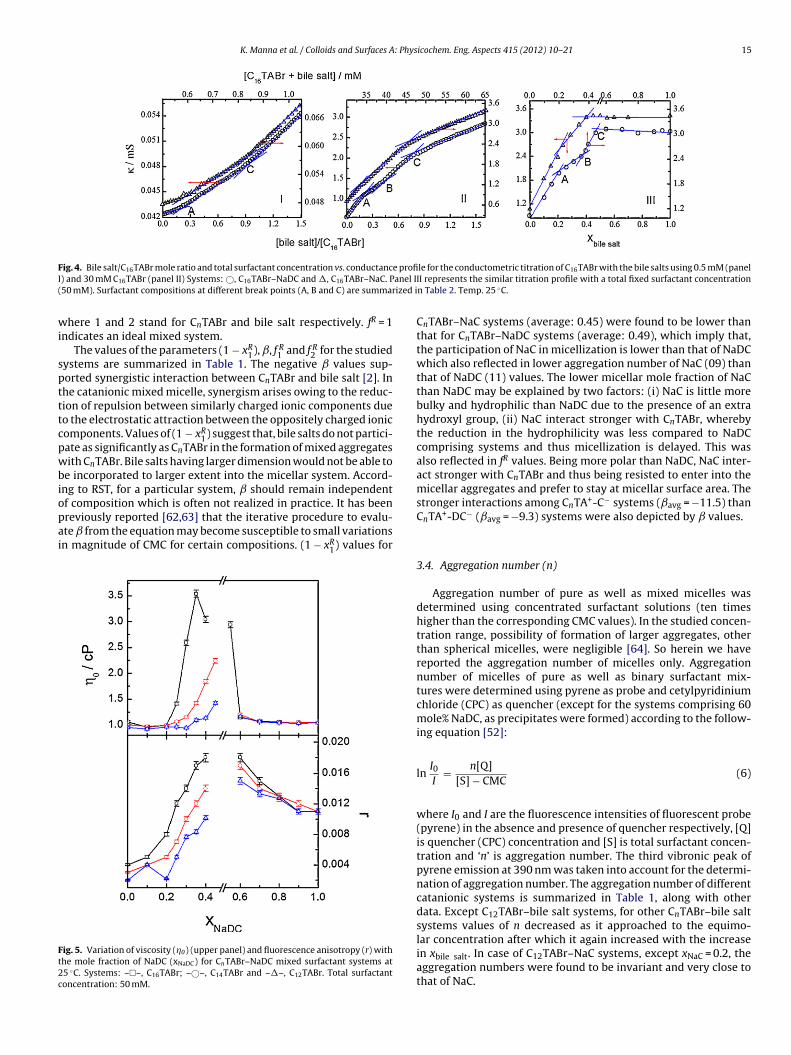
ig. 4. Bile salt/C16TABr mole ratio and total surfactant concentration vs. conductanc) and 30 mM C16TABr (panel II) Systems: ©, C16TABr–NaDC and �, C16TABr–NaC. P50 mM). Surfactant compositions at different break points (A, B and C) are summar
here 1 and 2 stand for CnTABr and bile salt respectively. fR = 1ndicates an ideal mixed system.
The values of the parameters (1 − xR1), ˇ, f R
1 and f R2 for the studied
ystems are summarized in Table 1. The negative values sup-orted synergistic interaction between CnTABr and bile salt [2]. Inhe catanionic mixed micelle, synergism arises owing to the reduc-ion of repulsion between similarly charged ionic components dueo the electrostatic attraction between the oppositely charged ionicomponents. Values of (1 − xR
1) suggest that, bile salts do not partici-ate as significantly as CnTABr in the formation of mixed aggregatesith CnTABr. Bile salts having larger dimension would not be able to
e incorporated to larger extent into the micellar system. Accord-ng to RST, for a particular system, should remain independent
f composition which is often not realized in practice. It has beenreviously reported [62,63] that the iterative procedure to evalu-te from the equation may become susceptible to small variationsn magnitude of CMC for certain compositions. (1 − xR1) values for
ig. 5. Variation of viscosity (�0) (upper panel) and fluorescence anisotropy (r) withhe mole fraction of NaDC (xNaDC) for CnTABr–NaDC mixed surfactant systems at5 ◦C. Systems: –�–, C16TABr; –©–, C14TABr and –�–, C12TABr. Total surfactantoncentration: 50 mM.
le for the conductometric titration of C16TABr with the bile salts using 0.5 mM (panelII represents the similar titration profile with a total fixed surfactant concentrationn Table 2. Temp. 25 ◦C.
CnTABr–NaC systems (average: 0.45) were found to be lower thanthat for CnTABr–NaDC systems (average: 0.49), which imply that,the participation of NaC in micellization is lower than that of NaDCwhich also reflected in lower aggregation number of NaC (09) thanthat of NaDC (11) values. The lower micellar mole fraction of NaCthan NaDC may be explained by two factors: (i) NaC is little morebulky and hydrophilic than NaDC due to the presence of an extrahydroxyl group, (ii) NaC interact stronger with CnTABr, wherebythe reduction in the hydrophilicity was less compared to NaDCcomprising systems and thus micellization is delayed. This wasalso reflected in fR values. Being more polar than NaDC, NaC inter-act stronger with CnTABr and thus being resisted to enter into themicellar aggregates and prefer to stay at micellar surface area. Thestronger interactions among CnTA+-C− systems (ˇavg = −11.5) thanCnTA+-DC− (ˇavg = −9.3) systems were also depicted by values.
3.4. Aggregation number (n)
Aggregation number of pure as well as mixed micelles wasdetermined using concentrated surfactant solutions (ten timeshigher than the corresponding CMC values). In the studied concen-tration range, possibility of formation of larger aggregates, otherthan spherical micelles, were negligible [64]. So herein we havereported the aggregation number of micelles only. Aggregationnumber of micelles of pure as well as binary surfactant mix-tures were determined using pyrene as probe and cetylpyridiniumchloride (CPC) as quencher (except for the systems comprising 60mole% NaDC, as precipitates were formed) according to the follow-ing equation [52]:
lnI0I
= n[Q][S] − CMC
(6)
where I0 and I are the fluorescence intensities of fluorescent probe(pyrene) in the absence and presence of quencher respectively, [Q]is quencher (CPC) concentration and [S] is total surfactant concen-tration and ‘n’ is aggregation number. The third vibronic peak ofpyrene emission at 390 nm was taken into account for the determi-nation of aggregation number. The aggregation number of differentcatanionic systems is summarized in Table 1, along with otherdata. Except C12TABr–bile salt systems, for other CnTABr–bile saltsystems values of n decreased as it approached to the equimo-
lar concentration after which it again increased with the increasein xbile salt. In case of C12TABr–NaC systems, except xNaC = 0.2, theaggregation numbers were found to be invariant and very close tothat of NaC.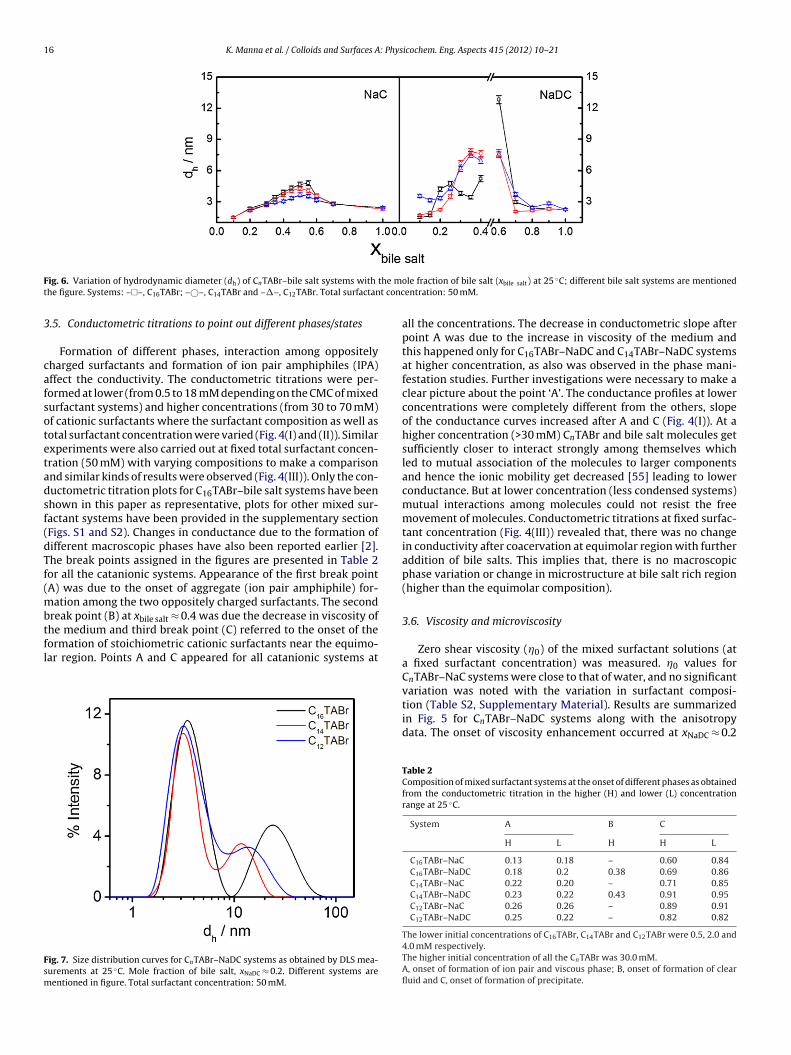
16 K. Manna et al. / Colloids and Surfaces A: Physicochem. Eng. Aspects 415 (2012) 10– 21
F the mt t conc
3
cafsotetadsf(dTf(mbtfl
Fsm
ig. 6. Variation of hydrodynamic diameter (dh) of CnTABr–bile salt systems with
he figure. Systems: –�–, C16TABr; –©–, C14TABr and –�–, C12TABr. Total surfactan
.5. Conductometric titrations to point out different phases/states
Formation of different phases, interaction among oppositelyharged surfactants and formation of ion pair amphiphiles (IPA)ffect the conductivity. The conductometric titrations were per-ormed at lower (from 0.5 to 18 mM depending on the CMC of mixedurfactant systems) and higher concentrations (from 30 to 70 mM)f cationic surfactants where the surfactant composition as well asotal surfactant concentration were varied (Fig. 4(I) and (II)). Similarxperiments were also carried out at fixed total surfactant concen-ration (50 mM) with varying compositions to make a comparisonnd similar kinds of results were observed (Fig. 4(III)). Only the con-uctometric titration plots for C16TABr–bile salt systems have beenhown in this paper as representative, plots for other mixed sur-actant systems have been provided in the supplementary sectionFigs. S1 and S2). Changes in conductance due to the formation ofifferent macroscopic phases have also been reported earlier [2].he break points assigned in the figures are presented in Table 2or all the catanionic systems. Appearance of the first break pointA) was due to the onset of aggregate (ion pair amphiphile) for-
ation among the two oppositely charged surfactants. The secondreak point (B) at xbile salt ≈ 0.4 was due the decrease in viscosity of
he medium and third break point (C) referred to the onset of theormation of stoichiometric cationic surfactants near the equimo-ar region. Points A and C appeared for all catanionic systems atig. 7. Size distribution curves for CnTABr–NaDC systems as obtained by DLS mea-urements at 25 ◦C. Mole fraction of bile salt, xNaDC ≈ 0.2. Different systems areentioned in figure. Total surfactant concentration: 50 mM.
ole fraction of bile salt (xbile salt) at 25 ◦C; different bile salt systems are mentionedentration: 50 mM.
all the concentrations. The decrease in conductometric slope afterpoint A was due to the increase in viscosity of the medium andthis happened only for C16TABr–NaDC and C14TABr–NaDC systemsat higher concentration, as also was observed in the phase mani-festation studies. Further investigations were necessary to make aclear picture about the point ‘A’. The conductance profiles at lowerconcentrations were completely different from the others, slopeof the conductance curves increased after A and C (Fig. 4(I)). At ahigher concentration (>30 mM) CnTABr and bile salt molecules getsufficiently closer to interact strongly among themselves whichled to mutual association of the molecules to larger componentsand hence the ionic mobility get decreased [55] leading to lowerconductance. But at lower concentration (less condensed systems)mutual interactions among molecules could not resist the freemovement of molecules. Conductometric titrations at fixed surfac-tant concentration (Fig. 4(III)) revealed that, there was no changein conductivity after coacervation at equimolar region with furtheraddition of bile salts. This implies that, there is no macroscopicphase variation or change in microstructure at bile salt rich region(higher than the equimolar composition).
3.6. Viscosity and microviscosity
Zero shear viscosity (�0) of the mixed surfactant solutions (ata fixed surfactant concentration) was measured. �0 values forCnTABr–NaC systems were close to that of water, and no significantvariation was noted with the variation in surfactant composi-
tion (Table S2, Supplementary Material). Results are summarizedin Fig. 5 for CnTABr–NaDC systems along with the anisotropydata. The onset of viscosity enhancement occurred at xNaDC ≈ 0.2Table 2Composition of mixed surfactant systems at the onset of different phases as obtainedfrom the conductometric titration in the higher (H) and lower (L) concentrationrange at 25 ◦C.
System A B C
H L H H L
C16TABr–NaC 0.13 0.18 – 0.60 0.84C16TABr–NaDC 0.18 0.2 0.38 0.69 0.86C14TABr–NaC 0.22 0.20 – 0.71 0.85C14TABr–NaDC 0.23 0.22 0.43 0.91 0.95C12TABr–NaC 0.26 0.26 – 0.89 0.91C12TABr–NaDC 0.25 0.22 – 0.82 0.82
The lower initial concentrations of C16TABr, C14TABr and C12TABr were 0.5, 2.0 and4.0 mM respectively.The higher initial concentration of all the CnTABr was 30.0 mM.A, onset of formation of ion pair and viscous phase; B, onset of formation of clearfluid and C, onset of formation of precipitate.
K. Manna et al. / Colloids and Surfaces A: Physicochem. Eng. Aspects 415 (2012) 10– 21 17
F . BileT probe
f(pattr
Si
FC
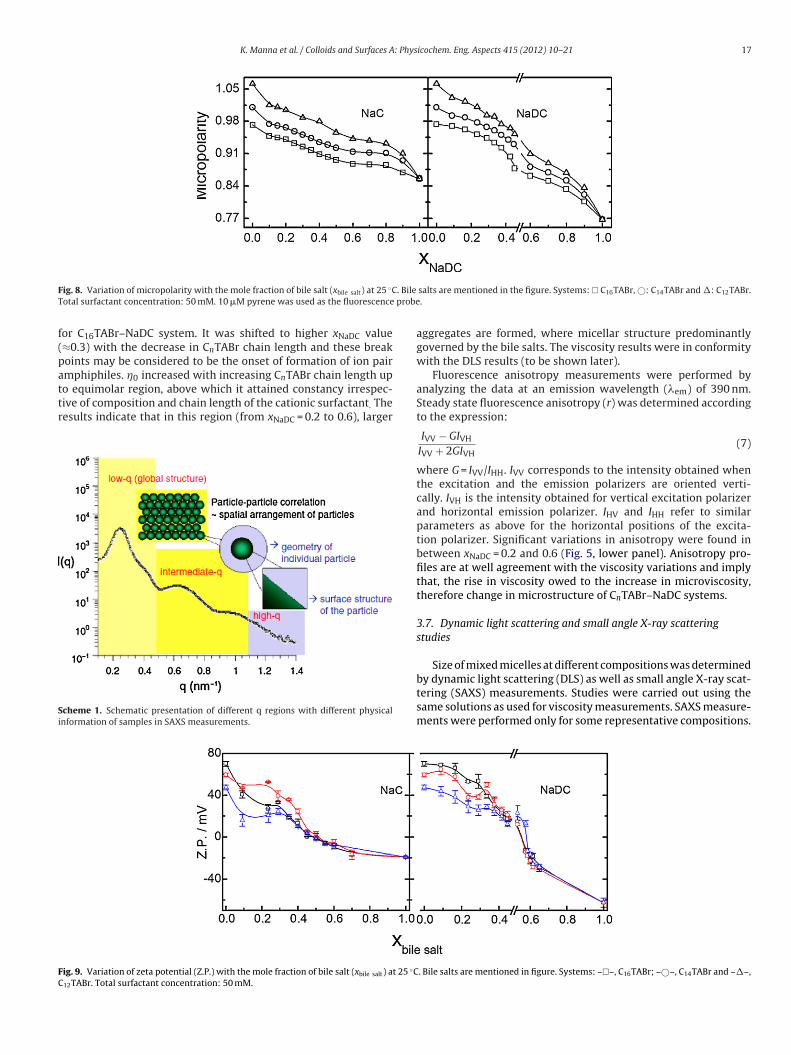
ig. 8. Variation of micropolarity with the mole fraction of bile salt (xbile salt) at 25 ◦Cotal surfactant concentration: 50 mM. 10 �M pyrene was used as the fluorescence
or C16TABr–NaDC system. It was shifted to higher xNaDC value≈0.3) with the decrease in CnTABr chain length and these breakoints may be considered to be the onset of formation of ion pairmphiphiles. �0 increased with increasing CnTABr chain length up
o equimolar region, above which it attained constancy irrespec-ive of composition and chain length of the cationic surfactant. Theesults indicate that in this region (from xNaDC = 0.2 to 0.6), largercheme 1. Schematic presentation of different q regions with different physicalnformation of samples in SAXS measurements.
ig. 9. Variation of zeta potential (Z.P.) with the mole fraction of bile salt (xbile salt) at 25 ◦C12TABr. Total surfactant concentration: 50 mM.
salts are mentioned in the figure. Systems: � C16TABr, ©: C14TABr and �: C12TABr..
aggregates are formed, where micellar structure predominantlygoverned by the bile salts. The viscosity results were in conformitywith the DLS results (to be shown later).
Fluorescence anisotropy measurements were performed byanalyzing the data at an emission wavelength (�em) of 390 nm.Steady state fluorescence anisotropy (r) was determined accordingto the expression:
IVV − GIVH
IVV + 2GIVH(7)
where G = IVV/IHH. IVV corresponds to the intensity obtained whenthe excitation and the emission polarizers are oriented verti-cally. IVH is the intensity obtained for vertical excitation polarizerand horizontal emission polarizer. IHV and IHH refer to similarparameters as above for the horizontal positions of the excita-tion polarizer. Significant variations in anisotropy were found inbetween xNaDC = 0.2 and 0.6 (Fig. 5, lower panel). Anisotropy pro-files are at well agreement with the viscosity variations and implythat, the rise in viscosity owed to the increase in microviscosity,therefore change in microstructure of CnTABr–NaDC systems.
3.7. Dynamic light scattering and small angle X-ray scatteringstudies
Size of mixed micelles at different compositions was determined
by dynamic light scattering (DLS) as well as small angle X-ray scat-tering (SAXS) measurements. Studies were carried out using thesame solutions as used for viscosity measurements. SAXS measure-ments were performed only for some representative compositions.. Bile salts are mentioned in figure. Systems: –�–, C16TABr; –©–, C14TABr and –�–,
18 K. Manna et al. / Colloids and Surfaces A: Physicochem. Eng. Aspects 415 (2012) 10– 21
olar f
R(pvsfioFillcRmsvtoog
TV
FS
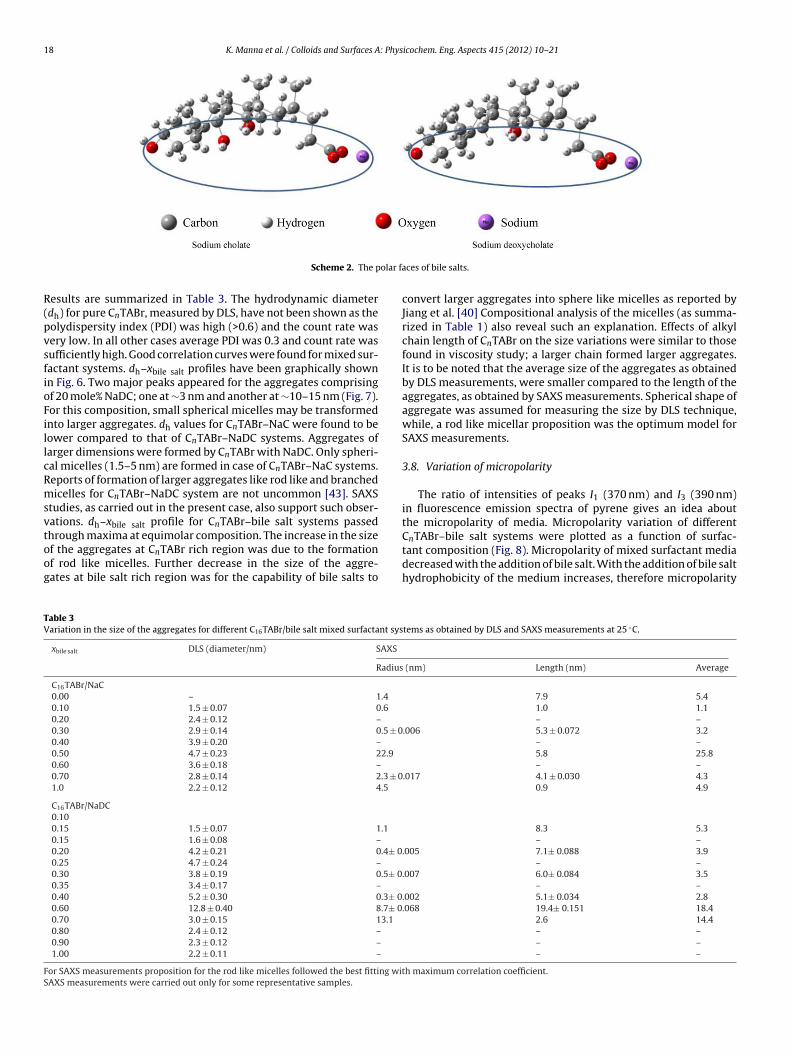
Scheme 2. The p
esults are summarized in Table 3. The hydrodynamic diameterdh) for pure CnTABr, measured by DLS, have not been shown as theolydispersity index (PDI) was high (>0.6) and the count rate wasery low. In all other cases average PDI was 0.3 and count rate wasufficiently high. Good correlation curves were found for mixed sur-actant systems. dh–xbile salt profiles have been graphically shownn Fig. 6. Two major peaks appeared for the aggregates comprisingf 20 mole% NaDC; one at ∼3 nm and another at ∼10–15 nm (Fig. 7).or this composition, small spherical micelles may be transformednto larger aggregates. dh values for CnTABr–NaC were found to beower compared to that of CnTABr–NaDC systems. Aggregates ofarger dimensions were formed by CnTABr with NaDC. Only spheri-al micelles (1.5–5 nm) are formed in case of CnTABr–NaC systems.eports of formation of larger aggregates like rod like and branchedicelles for CnTABr–NaDC system are not uncommon [43]. SAXS
tudies, as carried out in the present case, also support such obser-ations. dh–xbile salt profile for CnTABr–bile salt systems passed
hrough maxima at equimolar composition. The increase in the sizef the aggregates at CnTABr rich region was due to the formationf rod like micelles. Further decrease in the size of the aggre-ates at bile salt rich region was for the capability of bile salts toable 3ariation in the size of the aggregates for different C16TABr/bile salt mixed surfactant sys
xbile salt DLS (diameter/nm) SAXS
Radius
C16TABr/NaC0.00 – 1.4
0.10 1.5 ± 0.07 0.6
0.20 2.4 ± 0.12 –
0.30 2.9 ± 0.14 0.5 ± 00.40 3.9 ± 0.20 –
0.50 4.7 ± 0.23 22.9
0.60 3.6 ± 0.18 –
0.70 2.8 ± 0.14 2.3 ± 01.0 2.2 ± 0.12 4.5
C16TABr/NaDC0.100.15 1.5 ± 0.07 1.1
0.15 1.6 ± 0.08 –
0.20 4.2 ± 0.21 0.4± 00.25 4.7 ± 0.24 –
0.30 3.8 ± 0.19 0.5± 00.35 3.4 ± 0.17 –0.40 5.2 ± 0.30 0.3± 00.60 12.8 ± 0.40 8.7± 00.70 3.0 ± 0.15 13.1
0.80 2.4 ± 0.12 –
0.90 2.3 ± 0.12 –
1.00 2.2 ± 0.11 –
or SAXS measurements proposition for the rod like micelles followed the best fitting wiAXS measurements were carried out only for some representative samples.
aces of bile salts.
convert larger aggregates into sphere like micelles as reported byJiang et al. [40] Compositional analysis of the micelles (as summa-rized in Table 1) also reveal such an explanation. Effects of alkylchain length of CnTABr on the size variations were similar to thosefound in viscosity study; a larger chain formed larger aggregates.It is to be noted that the average size of the aggregates as obtainedby DLS measurements, were smaller compared to the length of theaggregates, as obtained by SAXS measurements. Spherical shape ofaggregate was assumed for measuring the size by DLS technique,while, a rod like micellar proposition was the optimum model forSAXS measurements.
3.8. Variation of micropolarity
The ratio of intensities of peaks I1 (370 nm) and I3 (390 nm)in fluorescence emission spectra of pyrene gives an idea aboutthe micropolarity of media. Micropolarity variation of different
CnTABr–bile salt systems were plotted as a function of surfac-tant composition (Fig. 8). Micropolarity of mixed surfactant mediadecreased with the addition of bile salt. With the addition of bile salthydrophobicity of the medium increases, therefore micropolaritytems as obtained by DLS and SAXS measurements at 25 ◦C.
(nm) Length (nm) Average
7.9 5.41.0 1.1– –
.006 5.3 ± 0.072 3.2– –5.8 25.8– –
.017 4.1 ± 0.030 4.30.9 4.9
8.3 5.3– –
.005 7.1± 0.088 3.9– –
.007 6.0± 0.084 3.5– –
.002 5.1± 0.034 2.8
.068 19.4± 0.151 18.42.6 14.4– –– –– –
th maximum correlation coefficient.
K. Manna et al. / Colloids and Surfaces A: Physicochem. Eng. Aspects 415 (2012) 10– 21 19
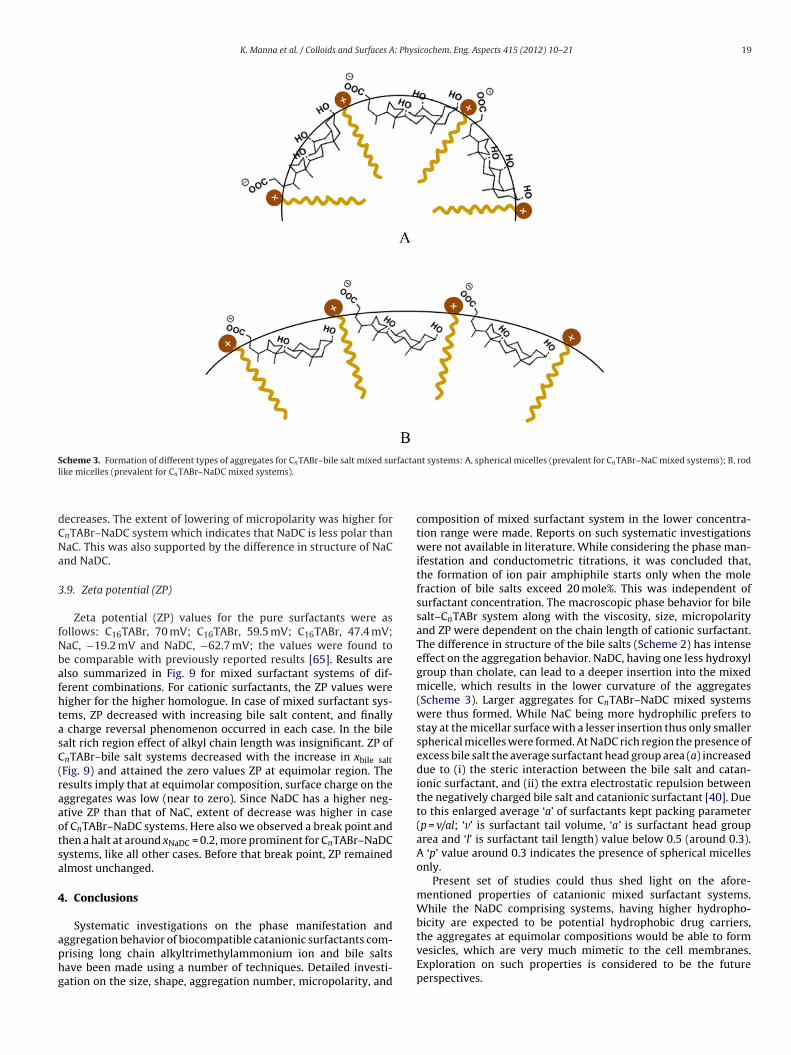
Scheme 3. Formation of different types of aggregates for C TABr–bile salt mixed surfactant systems: A, spherical micelles (prevalent for C TABr–NaC mixed systems); B, rodl
dCNa
3
fNbafhtasC(raaotsa
4
aphg
n
ike micelles (prevalent for CnTABr–NaDC mixed systems).
ecreases. The extent of lowering of micropolarity was higher fornTABr–NaDC system which indicates that NaDC is less polar thanaC. This was also supported by the difference in structure of NaCnd NaDC.
.9. Zeta potential (ZP)
Zeta potential (ZP) values for the pure surfactants were asollows: C16TABr, 70 mV; C16TABr, 59.5 mV; C16TABr, 47.4 mV;aC, −19.2 mV and NaDC, −62.7 mV; the values were found toe comparable with previously reported results [65]. Results arelso summarized in Fig. 9 for mixed surfactant systems of dif-erent combinations. For cationic surfactants, the ZP values wereigher for the higher homologue. In case of mixed surfactant sys-ems, ZP decreased with increasing bile salt content, and finally
charge reversal phenomenon occurred in each case. In the bilealt rich region effect of alkyl chain length was insignificant. ZP ofnTABr–bile salt systems decreased with the increase in xbile saltFig. 9) and attained the zero values ZP at equimolar region. Theesults imply that at equimolar composition, surface charge on theggregates was low (near to zero). Since NaDC has a higher neg-tive ZP than that of NaC, extent of decrease was higher in casef CnTABr–NaDC systems. Here also we observed a break point andhen a halt at around xNaDC = 0.2, more prominent for CnTABr–NaDCystems, like all other cases. Before that break point, ZP remainedlmost unchanged.
. Conclusions
Systematic investigations on the phase manifestation and
ggregation behavior of biocompatible catanionic surfactants com-rising long chain alkyltrimethylammonium ion and bile saltsave been made using a number of techniques. Detailed investi-ation on the size, shape, aggregation number, micropolarity, andn
composition of mixed surfactant system in the lower concentra-tion range were made. Reports on such systematic investigationswere not available in literature. While considering the phase man-ifestation and conductometric titrations, it was concluded that,the formation of ion pair amphiphile starts only when the molefraction of bile salts exceed 20 mole%. This was independent ofsurfactant concentration. The macroscopic phase behavior for bilesalt–CnTABr system along with the viscosity, size, micropolarityand ZP were dependent on the chain length of cationic surfactant.The difference in structure of the bile salts (Scheme 2) has intenseeffect on the aggregation behavior. NaDC, having one less hydroxylgroup than cholate, can lead to a deeper insertion into the mixedmicelle, which results in the lower curvature of the aggregates(Scheme 3). Larger aggregates for CnTABr–NaDC mixed systemswere thus formed. While NaC being more hydrophilic prefers tostay at the micellar surface with a lesser insertion thus only smallerspherical micelles were formed. At NaDC rich region the presence ofexcess bile salt the average surfactant head group area (a) increaseddue to (i) the steric interaction between the bile salt and catan-ionic surfactant, and (ii) the extra electrostatic repulsion betweenthe negatively charged bile salt and catanionic surfactant [40]. Dueto this enlarged average ‘a’ of surfactants kept packing parameter(p = v/al; ‘v’ is surfactant tail volume, ‘a’ is surfactant head grouparea and ‘l’ is surfactant tail length) value below 0.5 (around 0.3).A ‘p’ value around 0.3 indicates the presence of spherical micellesonly.
Present set of studies could thus shed light on the afore-mentioned properties of catanionic mixed surfactant systems.While the NaDC comprising systems, having higher hydropho-bicity are expected to be potential hydrophobic drug carriers,
the aggregates at equimolar compositions would be able to formvesicles, which are very much mimetic to the cell membranes.Exploration on such properties is considered to be the futureperspectives.
2 : Phys
A
rGttAdtN2I
A
fj
R
[
[
[
[
[
[
[
[
[
[
[
[
[
[
[
[
[
[
[
[
[
[
[
[
[
[
[
[
[
[
[
[
[
[
[
[
[
[
[[
[
0 K. Manna et al. / Colloids and Surfaces A
cknowledgements
The work has been financially supported in the form of aesearch grant as well as special assistance from the Universityrants Commission (UGC), New Delhi, India. KM acknowledges
he receipt of fellowship from the UGC. The authors would likeo thank Prof. R.K. Samanta, Department of Computer Science andpplication, University of North Bengal for his generous help in theetermination of (1 − xR
1) and values of binary surfactant mix-ures. Financial assistance from Confederation of Indian Industries,ew Delhi, India and National Science Council of Taiwan (NSC 100-923-E003-003-MY3) Taiwan is acknowledged in the form of an
ndo-Taiwan Collaborative research program.
ppendix A. Supplementary data
Supplementary data associated with this article can beound, in the online version, at http://dx.doi.org/10.1016/.colsurfa.2012.09.019.
eferences
[1] J.H. Clint, Micellization of mixed non-ionic surface active agents, J. Chem. Soc.Faraday Trans. 1 (71) (1975) 1327–1334.
[2] K. Maiti, S. Bhattacharya, S. Moulik, A. Panda, Physicochemical studies on ion-pair amphiphiles: Solution and interfacial behaviour of systems derived fromsodium dodecylsulfate and n-alkyltrimethylammonium bromide homologues,J. Chem. Sci. 122 (2010) 867–879.
[3] M.S. Bakshi, Cetylpyridinium chloride + tetradecyltrimethylammonium bro-mide mixed micelles in polyethylene glycol 1000 + water mixtures, J.Macromol. Sci. Pure Appl. Chem. 36 (1999) 149–162.
[4] P.A. Hassan, T.K. Hodgdon, M. Sagasaki, G. Fritz-Popovski, E.W. Kaler, Phasebehavior and microstructure evolution in aqueous mixtures of cetyltrimethy-lammonium bromide and sodium dodecyl tri-oxyethylene sulfate, ComptesRendus Chimie 12 (2009) 18–29.
[5] J. Bhattacharjee, V.K. Aswal, P.A. Hassan, R. Pamu, J. Narayanan, J. Bellare, Struc-tural evolution in catanionic mixtures of cetylpyridinium chloride and sodiumdeoxycholate, Soft Matter (2012), http://dx.doi.org/10.1039/c2sm25460c.
[6] S.P. Moulik, M.E. Haque, P.K. Jana, A.R. Das, Micellar properties of cationic sur-factants in pure and mixed states, J. Phys. Chem. 100 (1996) 701–708.
[7] M. Abe, J.F. Scamehorn, Mixed Surfactant Systems, second ed., Marcel Dekker,New York, 2005.
[8] P. Boglioni, Surfactants in Solutions, Plenum Press, New York, 1987.[9] H. Edlund, A. Sadaghiani, A. Khan, Phase behavior and phase structure for
catanionic surfactant mixtures: Dodecyltrimethylammonium chloride-sodiumnonanoate-water system, Langmuir 13 (1997) 4953–4962.
10] C. Oelschlaeger, M. Schopferer, F. Scheffold, N. Willenbacher, Linear-to-branched micelles transition: a rheometry and diffusing wave spectroscopy(DWS) study, Langmuir 25 (2008) 716–723.
11] M.S. Vethamuthu, M. Almgren, W. Brown, E. Mukhtar, Aggregate structuregelling, and coacervation within the L phase of the quasi-ternary systemalkyltrimethylammonium bromide-sodium desoxycholate-water1, J. ColloidInterface Sci. 174 (1995) 461–479.
12] E.W. Kaler, A.K. Murthy, B.E. Rodriguez, J.A. Zasadzinski, Spontaneous vesicleformation in aqueous mixtures of single-tailed surfactants, Science 245 (1989)1371–1374.
13] J. Hao, H. Hoffmann, Self-assembled structures in excess and salt-free catan-ionic surfactant solutions, Curr. Opin. Colloid Interface Sci. 9 (2004) 279–293.
14] S. Segota, D.u.i. Tezak, Spontaneous formation of vesicles, Adv. Colloid InterfaceSci. 121 (2006) 51–75.
15] Y. Fan, Z. Li, L. Wang, J. Zhan, Catanionic-surfactant-controlled morphosynthe-sis and gas-sensing properties of corundum-type In2O3, Nanotechnology 20(2009) 285501–285506.
16] A. Boudier, P. Castagnos, E. Soussan, G. Beaune, H. Belkhelfa, C. Ménager, V.Cabuil, L. Haddioui, C. Roques, I. Rico-Lattes, M. Blanzat, Polyvalent catanionicvesicles: Exploring the drug delivery mechanisms, Int. J. Pharm. 403 (2011)230–236.
17] Y. Jiang, F. Li, Y. Luan, W. Cao, X. Ji, L. Zhao, L. Zhang, Z. Li, Formation ofdrug/surfactant catanionic vesicles and their application in sustained drugrelease, Int. J. Pharm. 436 (2012) 806–814.
18] B. Babbit, L. Burtis, P. Dentinger, P. Constantinides, L. Hillis, B. McGirl, L. Huang,Contact-dependent, immune complex-mediated lysis of hapten-sensitizedliposomes, Bioconjugate Chem. 4 (1993) 199–205.
19] L. Chen, N. Patrone, J.F. Liang, Peptide Self-Assembly on Cell Membranes to
Induce Cell Lysis, Biomacromolecules, 2012.20] P.L. Luisi, T.P.d. Souza, P. Stano, Vesicle behavior in search of explanations, J.Phys. Chem. B 112 (2008) 14655–14664.
21] X. Li, H. Kunieda, Catanionic surfactants: microemulsion formation and solubi-lization, Curr. Opin. Colloid Interface Sci. 8 (2003) 327–336.
[
icochem. Eng. Aspects 415 (2012) 10– 21
22] S.B. Lioi, X. Wang, M.R. Islam, E.J. Danoff, D.S. English, Catanionic surfactantvesicles for electrostatic molecular sequestration and separation, Phys. Chem.Chem. Phys. 11 (2009) 9315–9325.
23] H.-C. Yan, Q.-X. Li, T. Geng, Y. Jiang, Y. Luo, Preparation and performance ofcatanionic surfactants, Tenside Surfact. Deterg. 3 (2012) 211–215.
24] Y. Yan, T. Lu, J. Huang, Recent advances in the mixed systems of bolaamphiphilesand oppositely charged conventional surfactants, J. Colloid Interface Sci. 337(2009) 1–10.
25] V. Sankaran, C.C. Cummins, R.R. Schrock, R.E. Cohen, R.J. Silbey, Small leadsulfide (PbS) clusters prepared via ROMP block copolymer technology, J. Am.Chem. Soc. 112 (1990) 6858–6859.
26] D.M. Small, Size and structure of bile salt micelles. Influence of structure con-centration, counterion concentration, pH, and temperature, Adv. Chem. Ser. 84(1968) 31–52.
27] M.C. Carey, D.M. Small, The characteristics of mixed micellar solutions withparticular reference to bile, Am. J. Med. 49 (1970) 590–608.
28] P.P. Nair, The Bile Acids: Chemistry, Physiology and Metabolism, Plenum Press,New York, 1971.
29] D.M. Blow, A. Rich, Studies on the formation of helical deoxycholate com-plexes1,2, J. Am. Chem. Soc. 82 (1960) 3566–3571.
30] M.C. Carey, D.M. Small, Micelle formation by bile salts. Physical-chemical andthermodynamic considerations, Arch. Int. Med. 130 (1972) 506–527.
31] E. Giglio, S. Loreti, N.V. Pavel, EXAFS: a new approach to the structure of micellaraggregates, J. Phys. Chem. 92 (1988) 2858–2862.
32] J.P. Kratohvil, W.P. Hsu, D.I. Kwok, How large are the micelles of di-�-hydroxybile salts at the critical micellization concentrations in aqueous electrolytesolutions? Results for sodium taurodeoxycholate and sodium deoxycholate,Langmuir 2 (1986) 256–258.
33] N.A. Mazer, M.C. Carey, R.F. Kwasnick, G.B. Benedek, Quasielastic light scatter-ing studies of aqueous biliary lipid systems. Size, shape, and thermodynamicsof bile salt micelles, Biochemistry 18 (1979) 3064–3075.
34] Y. Murata, G. Sugihara, K. Fukushima, M. Tanaka, K. Matsushita, Study ofthe micelle formation of sodium deoxycholate. Concentration dependence ofcarbon-13 nuclear magnetic resonance chemical shift, J. Phys. Chem. 86 (1982)4690–4694.
35] E. Per, Concentration limits in association colloid solutions, J. Colloid Sci. 9(Suppl. 1) (1954) 66–80.
36] G. Li, L.B. McGown, Model for bile salt micellization and solubilization fromstudies of a polydisperse array of fluorescent probes and molecular modeling,J. Phys. Chem. 98 (1994) 13711–13719.
37] K.J. Mysels, Surface tension studies of bile salt association, Hepatology 4 (1984)80S–84S.
38] A.K. Panda, F. Possmayer, N.O. Petersen, K. Nag, S.P. Moulik, Physico-chemicalstudies on mixed oppositely charged surfactants: Their uses in the preparationof surfactant ion selective membrane and monolayer behavior at the air waterinterface, Colloids Surf. A 264 (2005) 106–113.
39] M. Fernández-Leyes, P. Messina, P. Schulz, Bile salt structural effect on thethermodynamic properties of a catanionic mixed adsorbed monolayer, ColloidPolym. Sci. 289 (2011) 179–191.
40] L. Jiang, K. Wang, M. Deng, Y. Wang, J. Huang, Bile salt-induced vesicle-to-micelle transition in catanionic surfactant systems: steric and electrostaticinteractions, Langmuir 24 (2008) 4600–4606.
41] C. Liu, J. Hao, Z. Wu, Phase behavior and rheological properties of salt-freecatanionic surfactant mixtures in the presence of bile acids, J. Phys. Chem. B114 (2010) 9795–9804.
42] E.F. Marques, O. Regev, H. Edlund, A. Khan, Micelles, dispersions, and liquidcrystals in the catanionic mixture bile salt-double-chained surfactant. The bilesalt-rich area, Langmuir 16 (2000) 8255–8262.
43] M.S. Vethamuthu, M. Almgren, B. Bergenståhl, E. Mukhtar, The hexag-onal phase and cylindrical micelles in the system alkyltrimethylammo-nium bromide–Sodium desoxycholate–Water as studied by X-ray diffrac-tion and fluorescence quenching, J. Colloid Interface Sci. 178 (1996)538–548.
44] M.S. Vethamuthu, M. Almgren, E. Mukhtar, P. Bahadur, Fluorescence quench-ing studies of the aggregation behavior of the mixed micelles of bile salts andcetyltrimethylammonium halides, Langmuir 8 (1992) 2396–2404.
45] D. Varade, V. Patel, A. Bahadur, P. Bahadur, M.S. Vethamuthu, Mixed micellesof cationic surfactants and sodium cholate in water, Ind. J. Biochem. Biophys.41 (2004) 107–112.
46] A.-H. Liu, S.-Z. Mao, M.-L. Liu, Y.-R. Du, Aggregation behavior of sodiumdeoxycholate and its interaction with cetyltrimethylammonium bromide inaqueous solution studied by NMR spectroscopy, Colloid Polym. Sci. 286 (2008)1629–1636.
47] B.W. Barry, G.M.T. Gray, Micelle formation and coacervation in mixtures ofalkyltrimethylammonium bromides with di and trihydroxy bile salts, J. ColloidInterface Sci. 52 (1975) 327–339.
48] S. Svenson, Carrier-based drug delivery, Am. Chem. Soc. (2004) 2–23.49] X.R. Teng, D.G. Shchukin, H. Mohwald, A novel drug carrier: lipophilic drug-
loaded polyglutamate/polyelectrolyte nanocontainers, Langmuir 24 (1994)383–389.
50] M. Yokoyama, G.S. Kwon, T. Okano, Y. Sakurai, K. Kataoka, Development of
micelle-forming polymeric drug with superior anticancer activity, polymericdrugs and drug administration, Am. Chem. Soc. (1994) 126–134.51] K. Manna, A. Panda, Physicochemical studies on the interfacial and micellizationbehavior of CTAB in aqueous polyethylene glycol media, J. Surfact. Deterg. 14(2011) 563–576.
: Phys
[
[
[
[
[
[
[
[
[
[
[
[
[
[
[
[
[
[
[
[
[
K. Manna et al. / Colloids and Surfaces A
52] G. Basu Ray, I. Chakraborty, S.P. Moulik, Pyrene absorption can be a convenientmethod for probing critical micellar concentration (cmc) and indexing micellarpolarity, J. Colloid Interface Sci. 294 (2006) 248–254.
53] T.W. Davey, W.A. Ducker, A.R. Hayman, Aggregation of?-hydroxy quaternaryammonium bolaform surfactants, Langmuir 16 (2000) 2430–2435.
54] M. Bakshi, I. Kaur, R. Sood, Head-group-influenced mixed micellization ofsodium deoxycholate with conventional hydrocarbon surfactants of identicalhydrocarbon tails, Colloid Polym Sci. 281 (2003) 928–934.
55] L.B. Pártay, P. Jedlovszky, M. Sega, Molecular aggregates in aqueous solutionsof bile acid salts. Molecular dynamics simulation study, J. Phys. Chem. B 111(2007) 9886–9896.
56] L.V.B. Paırtay, M. Sega, P.L. Jedlovszky, Counterion binding in the aqueous solu-tions of bile acid salts, as studied by computer simulation methods, Langmuir24 (2008) 10729–10736.
57] S.B. Sulthana, S.G.T. Bhat, A.K. Rakshit, Studies of the effect of additives on thesurface and thermodynamic properties of poly(oxyethylene(10))lauryl ether inaqueous solution, Langmuir 13 (1997) 4562–4568.
58] J.N. Phillips, Energetics of micelle formation, J. Chem. Soc. Faraday Trans. 51(1955) 561–569.
59] E.D. Goddard, N.J. Turro, P.L. Kuo, K.P. Ananthapadmanabhan, Fluorescenceprobes for critical micelle concentration determination, Langmuir 1 (1985)352–355.
60] D.N. Rubingh, Mixed micelle solutions, Sol. Chem. Surfact. 1 (1979)337–354.
61] T. Chakraborty, S. Ghosh, S.P. Moulik, Micellization and related behavior ofbinary and ternary surfactant mixtures in aqueous medium: Cetyl pyridinium
chloride (CPC), Cetyl trimethyl ammonium bromide (CTAB), and polyoxyethy-lene (10) cetyl ether (Brij-56) derived system, J. Phys. Chem. B 109 (2005)14813–14823.62] M.E. Haque, A.R. Das, A.K. Rakshit, S.P. Moulik, Properties of mixed micelles ofbinary surfactant combinations, Langmuir 12 (1996) 4084–4089.
[
icochem. Eng. Aspects 415 (2012) 10– 21 21
63] M. Prasad, S.P. Moulik, R. Palepu, Self-aggregation of binary mixtures of alkyl-triphenylphosphonium bromides: A critical assessment in favor of more thanone kind of micelle formation, J. Colloid Interface Sci. 284 (2005) 658–666.
64] K. Manna, A.K. Panda, Spectral studies on the interaction of pinacyanol chloridewith binary surfactants in aqueous medium, Spectrochim. Acta A 74 (2009)1268–1274.
65] Z. Sun, V. Nicolosi, D. Rickard, S.D. Bergin, D. Aherne, J.N. Coleman, Quantitativeevaluation of surfactant-stabilized single-walled carbon nanotubes: dispersionquality and its correlation with zeta potential, J. Phys. Chem. C 112 (2008)10692–10699.
66] M. Schick, D. Manning, Micelle formation in mixtures of nonionic and anionicdetergents, J. Am. Oil Chem. Soc. 43 (1966) 133–136.
67] J.M. Hierrezuelo, J. Aguiar, C. Carnero Ruiz, Interactions in binary mixed systemsinvolving a sugar-based surfactant and different n-alkyltrimethylammoniumbromides, J. Colloid Interface Sci. 294 (2006) 449–457.
68] S. Gouin, X.X. Zhu, Fluorescence and NMR studies of the effect of a bile aciddimer on the micellization of Bile Salts, Langmuir 14 (1998) 4025–4029.
69] A. Coello, F. Meijide, E. Rodriguez Nunez, J. Vazquez Tato, Aggregation behaviorof sodium cholate in aqueous solution, J. Phys. Chem. 97 (1993) 10186–10191.
70] I. Garcia-Mateos, M. Mercedes Velazquez, L.J. Rodriguez, Critical micelleconcentration determination in binary mixtures of ionic surfactants by decon-volution of conductivity/concentration curves, Langmuir 6 (1990) 1078–1083.
71] K.K. Karukstis, S.W. Suljak, P.J. Waller, J.A. Whiles, E.H.Z. Thompson, Fluores-cence analysis of single and mixed micelle systems of SDS and DTAB, J. Phys.Chem. 100 (1996) 11125–11132.
72] S. Das, J. Dey, T. Mukhim, K. Ismail, Effect of sodium salicylate, sodium oxalate,
and sodium chloride on the micellization and adsorption of sodium deoxy-cholate in aqueous solutions, J. Colloid Interface Sci. 357 (2011) 434–439.73] A. Jover, F. Meijide, E. Rodriguez Nunez, J. Vazquez Tato, M. Mosquera, Aggre-gation number for sodium deoxycholate from steady-state and time-resolvedfluorescence, Langmuir 13 (1997) 161–164.
Related Documents