Physicochemical Measurements by Gas Chromatography A Thesis presented to the University of Surrey for the degree of Doctor of Philosophy in the Faculty of Science By Robert Andrew McGill Chromatography Laboratory Department of Chemistry University of Surrey Guildford Surrey GU25XH England March 1988

Welcome message from author
This document is posted to help you gain knowledge. Please leave a comment to let me know what you think about it! Share it to your friends and learn new things together.
Transcript
Physicochemical Measurements by Gas Chromatography
A Thesis presented to the University of Surrey
for the degree of Doctor of Philosophy in the
Faculty of Science
By
Robert Andrew McGill
Chromatography Laboratory Department of Chemistry University of Surrey Guildford Surrey GU25XHEngland March 1988
ProQuest Number: 10804253
All rights reserved
INFORMATION TO ALL USERS The quality of this reproduction is dependent upon the quality of the copy submitted.
In the unlikely event that the author did not send a com p le te manuscript and there are missing pages, these will be noted. Also, if material had to be removed,
a note will indicate the deletion.
uestProQuest 10804253
Published by ProQuest LLC(2018). Copyright of the Dissertation is held by the Author.
All rights reserved.This work is protected against unauthorized copying under Title 17, United States C ode
Microform Edition © ProQuest LLC.
ProQuest LLC.789 East Eisenhower Parkway
P.O. Box 1346 Ann Arbor, Ml 48106- 1346

To Mum & Dad
\

Acknow1edgements
I would first like to express my thanks to Mike Abraham for
giving me the opportunity to do this work and for his
constant guidance throughout the last three years. When
problems arose I did not have to go far for helpful advice.
My other major acknowledgement is to Gabriel Buist who over
over a period of about twelve months wrote all the software
for the adsorption work, and who, on many occasions took
the programming work and interface design home with him to
speed its conclusion.
In addition I would like to thank all those in the
Chemistry and other departments of the University who have
helped in any way with ray work or in making my time spent
at the University a happy one. In particular Dr _K, who
helped me in the early stages of the project even though
she had retired. Thanks also to Pnina Sasson, Priscilla
Grellier and the final year project students Ian
Hammerton and Mike Bodkin who carried out some of the
chromatographic measurements.
I also would like to thank ray American co-workers , in
particular the late Mort Kamlet who was a major inspiration
to all those working in his wide field of work and who will
be sadly missed. Thanks to Steve Maroldo at Rohm & Haas,
I

Jay Grate at NRL and Ruth Doherty. Thanks also to Wendel
Schuely, who I know sent off speculative applications on ray
b e h a l f .
Finally but not least I thank and wish all the best to Gary
Whiting, who is following on from me in this work.
The two contracts from the US Navy enabling this work to be
carried out are gratefully acknowledged.
US Navy contract No. N68171-86-R-9649
US Navy contract No. N60921-84-C-0069
II
CONTENTS
Abstract.............................................. VI
1.1. Introduction to chromatography.................................... 1
1.1.1. Gas chromatography......................................... 2
2.1. Gas-liquid chromatography....... ................................. 5
2.1.1. Measurement of partition coefficients by the static method
of head-space analysis........ 6
2.1.2. Measurement of partition coefficients by the dynamic method
of GLC....... 9
2.1.3. GLC column & packing preparation......................... 12
2.1.4. Optimum GLC working conditions.................. ........ 18
2.1.5. Gas chromatography theory.................................23
2.1.6. Practical considerations for measurements of partition
coef f icients................... '........................... 30
2.1.7. Comparison of static head-space analysis & the dynamic gas-
liquid chromatography method for the determination of
physicochemical measurements.............................. 33
2.1.8. Previous work in stationary phase characterisation...... 35
2.2. Surface acoustic wave chemical sensors........................... 40
2.2’. 1. Introduction to piezoelectric crystal chemical sensors...40
2.2.2. Sensor arrays.................................... ........ 47
2.2.3. Comparison of KQI,G & k saw methodology.................... 49
3.1. Introduction to adsorption....................................... 53
III
3.2. Previous work in adsorption characterisation.................... 54
3.3. Aims of the adsorption work..................... ............. ...60
3.4. The adsorption isotherm & its calculation....................... 62
3.4.1. The adsorption isotherm............ 62
3.4.2. Correction of elution peak for diffusion and calculation of
the isotherm by EGP....... 65
3.4.3. Langmuir adsorption isotherm.............................. 68
3.5. Humidity measurements . . 75
3.5.1. Derivation of the water vapour correction factor for GC
measurements made at different relative humidities.......79
3.6. Practical considerations for adsorption measurements............83
3.6.1. Flow rate...................................... 83
3.6.2. Effect of sample size......................................84
3.6.3. Thermodynamics and kinetics of adsorption................ 85
3.7. Analysis of adsorption parameters................................ 86
4.1. Linear solvation energy relationships (LSER) & their use in
multiple regression analysis (MRA)......... 88
4.1.1. The role of dispersion forces & the solute size parameter
in the solution of liquid and gaseous solutes in
solvents....................................................93
4.1.2. The solvent & solute parameters. Their meaning and method
of determination............. 98
4.1.3. Interpretation of multiple linear regression equations &
linear solvation energy relationships.................... 112
5.1. Results and Discussions... ..................................... 118
IV
5.1.1. General Aims of the present work........................ 118
5.1.2. Regression analysis of polymeric liquids and olive oil..120
5.1.3. Measurements made above ambient temperature for the
polymeric liquids........................................ 147
5.1.4. Comparison of K01,0 and KSAW measurements................153
5.1.5. Adsorption results & discussions........................ 163
6.1. Summary discussion, conclusions & future work................... 209
6.1.1. Future work.................................... 211
7.1. Experimental................................ 218
7.1.1. Dynamic gas-liquid chromatography experimental......... 218
7.1.2. Adsorption experimental..................................239
7.1.3. Static head-space experimental.......................... 250
7.1.4. Determination of density of fluoropolyol................253
8.1. References...................................................... . 256
Appendixl, GCAD computer program................................ 264
Appendix2, published work....................................... 269
V
ABSTRACT
The present work can be conveniently divided into two
separate sections.
First the method of gas-liquid chromatography (GLC) has
been used to obtain partition coefficients, K, at infinite
dilution on polymeric and non-polymeric phases. About 30-40
solutes were studied per stationary phase.
Secondly the method of gas-solid chromatography has been
used to obtain adsorption isotherms for a series of
adsorbents by the technique of elution by characteristic
point (E C P ). A single injection of a gas or vapour suffices
to obtain the isotherm, and then the limiting H e n r y ’s law
constant, K H , for adsorption at low surface coverage. About
20-30 solutes were studied per adsorbent. Experiments were
carried out at several levels of relative humidity (RH) 0%,
31% and 53%.
The solute compounds used were chosen so as to have a wide
range of properties such as polarity (711* 2 ), hydrogen-bond
acidity (aH 2 ), and hydrogen-bond basicity (15H 2 ) .
The results as log partition coefficients or -log H e n r y ’s
constants were analysed by multiple linear regression
analysis using equations such as:
-LogKH or LogK = SPo + s. 71;* 2 + a . a H 2 + b. 0 H 2 + l . L o g L 18
VI
where L 10 is the solute Ostwald absorption coefficient on
n - h e x a d e c a n e . In this way, the selectivity of the liquid
polymeric phase or solid adsorbent towards classes of
compound was investigated and equations for the prediction
of further values of LogK or L o g K H formulated.
In parallel with the measurement of partition coefficients
on liquid polymeric phases by GLC in this work, partition
coefficients for the polymers have been determined using
surface acoustic wave (SAW) devices by coworkers at the
Naval Research Laboratory, Washington. The results for a
series of 8-9 solutes in six polymeric phases show that
partition coefficients and patterns of responses predicted
through GLC experiments are the same as those found
experimentally using coated SAW devices. Hence GLC can be
used to evaluate possible coating materials, and by the
technique of multiple linear regression analysis, to
predict SAW responses for a multitude of vapours.
VII
1 .1 . INTRODUCTION TO CHROMATOGRAPHY
Chromatography was described by K e u i e m a n s 1 as a physical
method of separation, in which the components to be
separated are distributed between two phases, one of these
phases constituting a stationary bed of large surface area,
the other being a mobile phase (either gas or liquid) that
percolates through or along the stationary bed.
Fundamentally the separation of the components in a mixture
depends upon the differences in the partition coefficients
of the compounds between the stationary and mobile phases.
The compound with the larger partition coefficient is more
strongly retained and spends a longer time in the
stationary phase, while the compound with the lower
partition coefficient relatively spends more time in the
mobile phase and is transported through the stationary bed
quicker and hence the components are separated.
The word ’’chromatography was introduced by T s w e t t 2 in 1906
to describe the process of separation he carried out on
coloured plant pigments on a column of calcium carbonate as
the stationary phase and petroleum as the mobile liquid
phase. Literally the word chromatography means colour
writing and is derived from two Greek words, khroma
(colour) and grafein (written). Although very few
separations are now performed on coloured compounds, the
1
name has been retained for all systems relating to this
technique. The first scientific reports of what now is
considered to be chromatography were actually of
separations carried out on paper by R u n g e 3 11 in the 1 8 5 0 ’s.
The work carried out by Tswett was an example of liquid-
solid chromatography (L S C ) in which the stationary phase is
a solid and the mobile phase is a liquid. Since then three
other basic forms of chromatography have been developed,
the various forms being classified according to the nature
of the stationary and mobile phases. The stationary phase
may be a liquid or solid and the mobile phase may be a
liquid or a gas. Liquid liquid chromatography (LLC) was
introduced by Martin and S y n g e 5 in 1941, in which both the
stationary and mobile phases are liquids. In the same paper
by Martin and Synge it was pointed out that the mobile
phase need not be a liquid but could be a gas. Later that
year gas solid chromatography (GSC) was introduced by Hesse
et a l 8 and by Tiselius 7 and Claesson 8 in 1943 and 1946. The
fourth chromatographic technique, gas liquid chromatography
(GLC), was not introduced until 1952 by James and M a r t i n 9 .
1.1.1. GAS CHROMATOGRAPHY
To study the solubility of gaseous solutes and vapours in
liquids and to study the adsorption on solids, it is very
convenient to use the method of gas chromatography.
2
Physicochemical measurements of solute/solvent or
adsorbate/adsorbent interactions can be obtained by some
retention measurement under measured conditions. Gas
chromatography offers many possibilities for
physicochemical measurements and some of these methods lead
to quick, very precise, and accurate results with
relatively cheap instrumentation . They are widely used
today, a fact which is emphasised by several b o o k s 1 0 ’ 11
published to deal with physicochemical measurements only.
In GLC the liquid stationary phase (solvent phase) is
coated onto an ’’inert” porous solid support, such as
diatomite (kieselguhr), which is packed into a long narrow
column. The liquid stationary phase is located on the
surface and in the pores of the porous support and the
mobile carrier gas phase flows through the column in and
around the coated support.
In GSC the solid adsorbent is packed into the column in a
suitably fine mesh size, to obtain a large surface area of
contact. The carrier gas flows in and or around the
adsorbent depending on the porous state of the solid.
There are two main ways of operating a gas chromatograph,
depending on how the solute is fed into the column. When a
discrete sample of solute is injected into the column
batchwise, this is known as elution chromatography. The
3
other mode of operation is called frontal analysis
chromatography. In this technique the column is first fed
with a continuous stream of mixed carrier gas and solute
vapour at a steady concentration. The solute concentration
is changed instantaneously to a new steady value, this
concentration change introduces a frontal boundary, with a
step shaped concentration profile, into the column. The
concentration change may be either positive or negative.
Alternatively a continuous stream of a mixture of carrier
gas and solute vapour can be switched into a column
previously fed with pure carrier gas as the mobile phase,
forming a frontal boundary. This latter method of frontal
chromatography is little used now and elution is by far -the
most popular technique.
There are three ways gas chromatography can be used
experimentally, and they are for:
1. Analysis of a mixture of compounds.
2. Physicochemical measurement e.g. partition coefficients,
activity coefficients, vapour pressures, gas solid
adsorption coefficients and many more.
3. Preparative work, which is normal gas chromatography
scaled up to produce quantities of pure compound in
sufficient quantities to be collected at the exit of a
non-destructive detector.
4
In this thesis the work presented is primarily concerned
with the physicochemical measurement by elution
chromatography of parameters which describe the solubility
or adsorption of solutes or adsorbates in solvents such as
liquid polymers, or adsorbents respectively.
The study of vapour-liquid equilibria by GLC will be dealt
with now and the study of solid adsorbents by GSC later
(Sec3.1.P53h
2.1. GAS-LIQUID CHROMATOGRAPHY
There are two quite different methods of using GLC to
obtain physicochemical data through studies of vapour-
liquid equilibria. These two methods are:
1. Static head-space analysis, in which GLC is used just as
an analytical method of determining concentrations of
s o l u t e s , and
2. Dynamic gas-liquid chromatography in which the solvent
acts as the stationary phase.
The physicochemical parameter chosen here to measure
solute/solvent interactions for vapour-liquid equilibrium
is the partition coefficient (K), which describes the ratio
of the concentrations of solute distributed between the
vapour phase and the liquid at equilibrium, and can be
5
defined a s :
c o n c e n t r a t i o n of s o l u t e in the l i q u i d C lK = ---------------------------------------------------- = ( 1 )
concentration of solute in the gas Co
Note that K is the same as the Ostwald absorption
coefficient, L, and that in GLC work, K is effectively K",
the value at zero concentration.
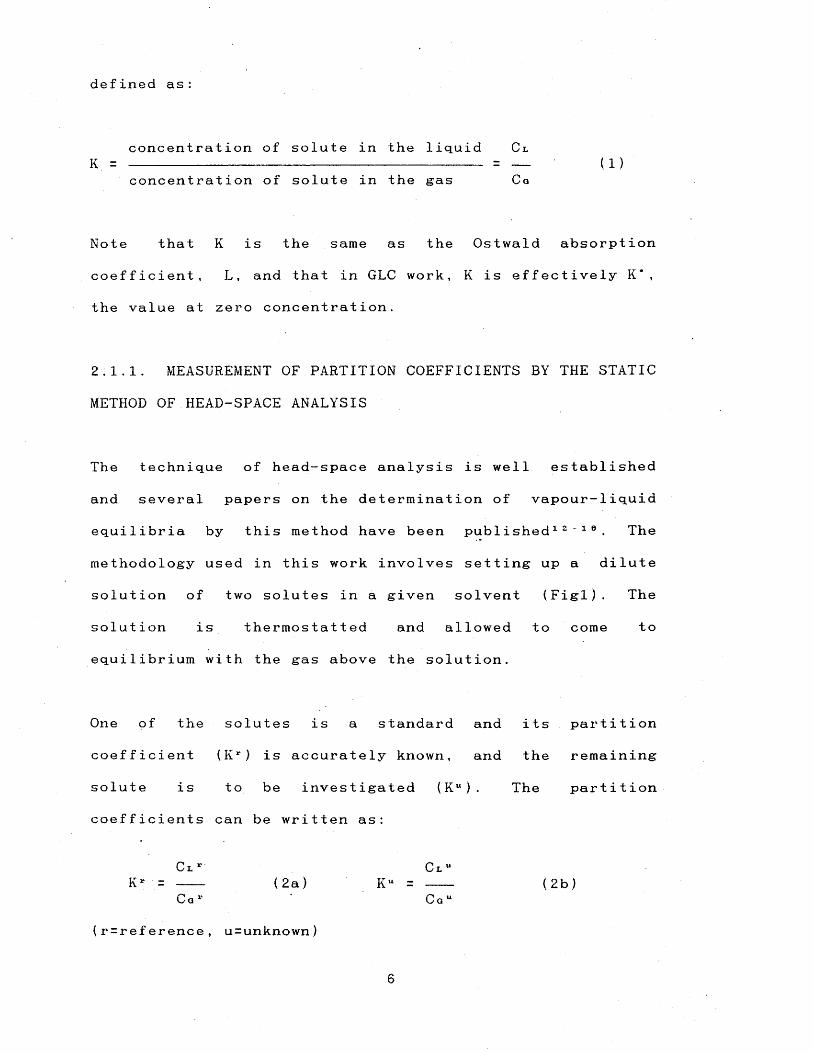
2.1.1. MEASUREMENT OF PARTITION COEFFICIENTS BY THE STATIC
METHOD OF HEAD-SPACE ANALYSIS
The technique of head-space analysis is well established
and several papers on the determination of vapour-liquid
equilibria by this method have been published 12 1 8 . The
methodology used in this work involves setting up a dilute
solution of two solutes in a given solvent (Figl). The
solution is thermostatted and allowed to come to
equilibrium with the gas above the solution.
One of the solutes is a standard and its partition
coefficient (Kr ) is accurately known, and the remaining
solute is to be investigated (Ku ). The partition
coefficients can be written as:
C l 1' C l uK r = --- (2a) K u = (2b)
C g r Ca u
(r=reference, u=unknown)
Figl. HEAD-SPACE APPARATUS
head space
therm ostatedbath
gas syringe
rubberseptum
head-spaceflask
solution
Samples of the vapour phase and the liquid are withdrawn
separately and analysed by analytical GLC as described by
Abraham et a l 1 7 >1 3 . The areas (A)'of the resulting peaks
from vapour phase analysis A a r and A a u and from the liquid
phase analysis At' and A t u are measured and used in e q n 4 ,
(eqn3 rewritten with peak areas instead of concentrations).
Note this does not imply that A l u =C l u , or that
A t u/Aau=C i u/Cau as the areas A l u and A g u depend on the
amount of liquid and gas analysed respectively (and
similarly for the reference solute). The only quantity now
not known in eqn4 is K u , the partition coefficient of the
solute being investigated, and this can be simply computed.
This method of head-space analysis relies on the knowledge
of a standard K value for a reference solute (note that if
this standard value has been corrected for vapour phase
non-ideality, then the calculated values can be taken as
being corrected also) and also that the liquid phase can be
withdrawn into a microlitre syringe. If the solvent is very
viscous as for some polymers or if it is a solid then it
becomes impossible to withdraw liquid samples. To use the
method of head-space analysis in these instances requires a
more complicated procedure to determine partition
coefficients as suggested by Rohrschneider 18 who reported K
values for six solutes in eighty solvents. The
concentration of solute in the liquid phase was eliminated
from the calculation procedure and hence the need to sample
the liquid or solid phase. This requires an accurate
knowledge of the total amount of solute introduced into the
head-space flask (m), the volume of liquid phase V l i 9 , and
the volume of the gaseous phase V q a s . The partition
coefficient is given by e q n 5 , where the concentration of
solute in the gas phase Co is calculated as the product of
8
K = [m/(Ca - V a a s ) J . V i -i 9 (5)
the measured peak height (h) and a proportionality factor
(r), which is specific for each substance.
Other problems can be incurred with head-space analysis, if
the partition coefficients are very large, as for rather
involatile solutes the value of Cg will be very small and
difficult to measure accurately and for very small K
values. Experimentally there can be problems when flasks
sealed with rubber septum caps are used, which can
significantly affect the reproducibility and accuracy of
the me t h o d 1 9 . Adsorption onto rubber septum caps has been
shown by D a v i s 20 to decrease the concentration of vapours
in thirty minutes by 7.6% for n - h e x a n e , 21.9% for n-
h e p t a n e , 4.6% for propionaldehyde, 26.3% for p e n t a l d e h y d e ,
and 64.5% for h e p t a n a l . Attempts to heat the septum or
covering it with aluminium foil or teflon film have been
attempted by M a i e r 21 with partial success, but results were
still found to be unsatisfactory.
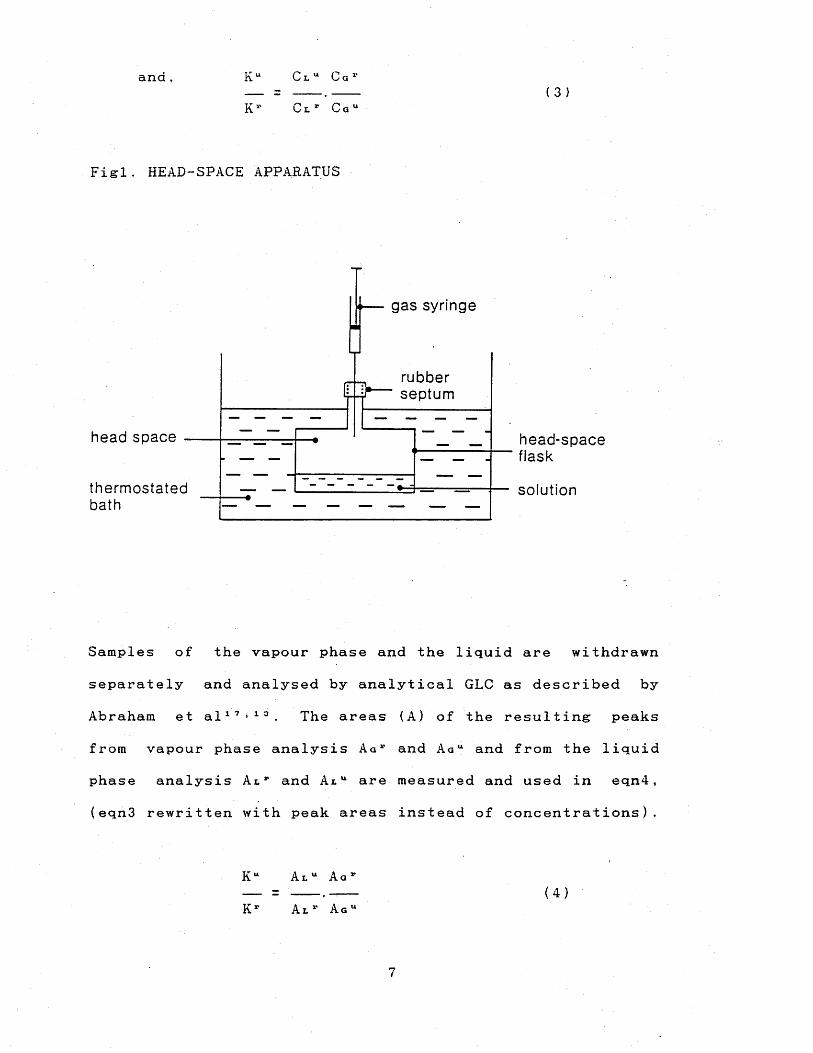
2.1.2. MEASUREMENT-OF PARTITION COEFFICIENTS BY THE DYNAMIC
METHOD OF GLC
The basic gas chromatographic apparatus (Fig2) consists of
a column packed with the liquid stationary phase coated
onto an ’’inert” support. The column is thermos tat ted at the
9
required temperature with an air thermostat and sometimes
with a . liquid thermostat if more accurate temperature
control is required. The carrier gas is normally an inert
gas such as helium or nitrogen and supplied at high
pressure which is regulated down to a lower more suitable
operating pressure via pressure reducing valves. To control
the flow of carrier gas through the GC column, and to keep
it constant, a flow regulator is positioned prior to the
carrier gas entering the column (normal carrier gas flow
rates are ca 20-60cm~3/min depending on the optimum
conditions). The injection of a liquid sample is made with
a microsyringe and the sample is normally volatilised by a
heated injector, and is then carried by the carrier gas
onto the head of the packing where it interacts with the
stationary phase. Alternatively the technique of on-column
injection is used where the sample is injected directly
onto the top of the GC packing. For physicochemical
measurements of vapour- 1 iquid equilibria this latter method
of injection is undesirable as it can introduce an
injection profile which can affect retention measurements
depending upon the volatility of the sample at column
temperature or the speed of absorption of the liquid solute
at the head of the packing. At the other end of the column
is the detector, of which there are several types, the most
common is the flame ionisation detector (FID). Other
popular detectors include the katharometer and the electron
capture detector (ECD). The response signal from the
10
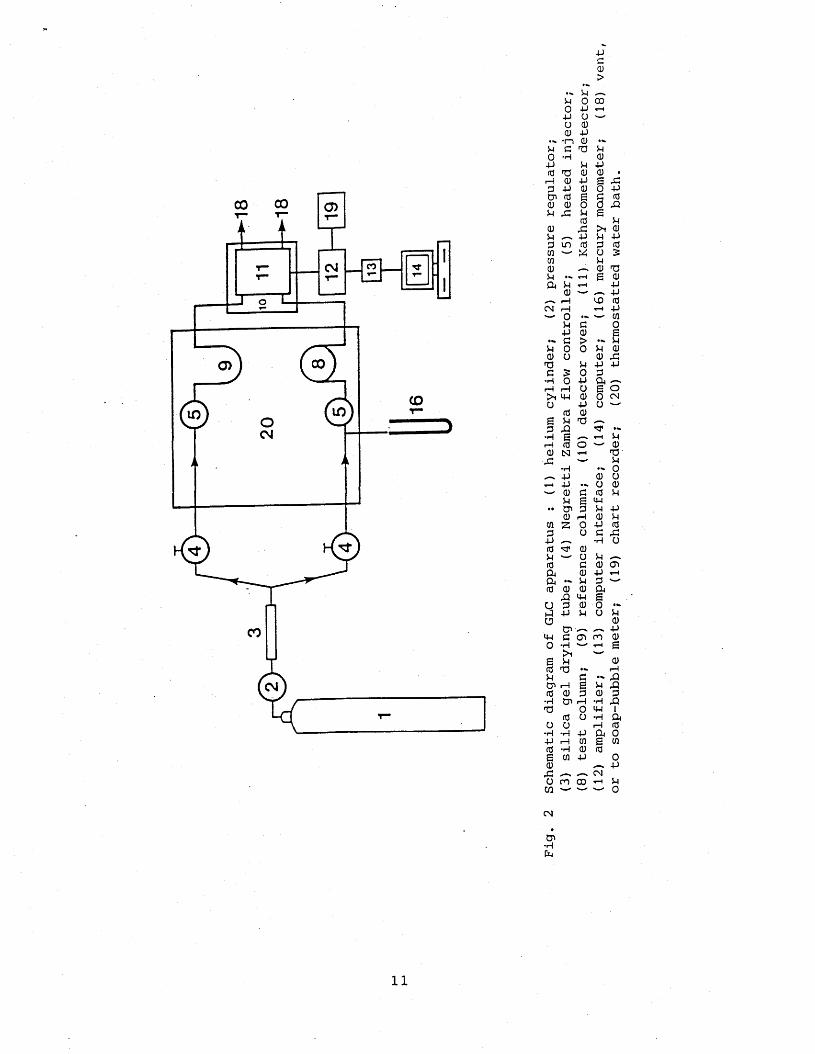
P G O -H +J0 73 rH 0 G 440> 00 0 P 43
un
CM r-4Op44- cP O 0 o73C 5 •H O
44C0)>p —o co+J H O 0 44 0 —73 P 0P 44 0 0 • 4J g 43 0 O 44
G 0 <3 ,0 S p >1 0 P 44 G 0 ^ O S P
— « 0 73 ^ g 0r-4 +J
— . 4-» CO 0 •rH 4-1 — 01
G O
>i 4-1 O 0£ U G 43 •H £rH 00 N ■43 •H — s 4-1 •rH 4-1 — 0
P.. O'001 Z G4-1 — 0 ^ p — 0 04a - 0 0
43 U G 1-3 44 C3 CG 44 G O -H>iS H0 'apCG *-4 0 0 H 0173O U •H *H 44 rH 0 *HS 03 043 — >a mCO
i-i 00 43P 44 44
O G 44 04 -a g o 0 o cm 4 0 - 073 —
*-h M0 ^ 0 •rH 73— P
- o0 O- a 0 G 0 P £ 4-1G p 44 H 0 P O 44 0 O G 43 •H O0 O G
P —0 ai0 44 P G0 0444 g 0 0 - P O P 0— . 4403 ro 0 w g
0 p—4G **43 g P .Q G 0 G r-l *H 43 O 44 I O -H44 03 g 0 0 44
CN CO <-•
04 0 04 O
CN
CG•H
11
detector is amplified up to suitable levels using an
amplifier and displayed on a chart recorder or a video
display monitor (VDM) for chromatographic peak analysis by
hand or compu t e r .
2.1.3. GLC COLUMN & PACKING PREPARATION
CHOICE OF SUPPORT
To ensure that meaningful physicochemical data is obtained,
the "inert" support upon which the liquid stationary phase
is coated must be chosen carefully. The aim is to provide a
thin liquid film with as large an interface as possible
between the gas and liquid phases, to ensure intimacy
between the solute and solvent stationary phase. The
support thus, should have a high specific area and possess
a chemical inertness suitable for the application.
If the support was totally inert, then the stationary phase
would not coat the support and could simply form globules
on the support surface. This would be an unsatisfactory
situation, reducing the surface area of the stationary
phase markedly. So the support must be active enough to
provide a surface for the stationary phase to "wet" the
solid properly, resulting in the desired uniform coating.
Problems can arise when using active supports, because if
they are not fully coated with stationary phase, solutes
12
can partition themselves between bare support and the
carrier gas, affecting any physicochemical measurements
made on the vapour-liquid equilibrium.
Various types of support are commercially available but by
far the most commonly used supports are based on diatomite,
also called kieselguhr. It originates from the
fossi 1 isation of one-celled algae and consists mainly of
amorphous silica with minor impurities. Chromosorb G is
such a diatomite support and has been used extensively in
this work, with much success. The success being based on
the agreement of physicochemical measurements made on the
GLC stationary phase coated on the support with, other GLC
work carried out in other laboratories, static
physicochemical measurements carried out in this work and
by other laboratories, and the good peak symmetry observed.
The correctness of the physicochemical parameters measured
depends on whether the measurements made, refer only to the
process described. In the GLC column, when partition
coefficients are measured, the process can be described as
the solubility of the gaseous solute in the liquid
stationary phase. However in GLC there are several other
interactions possible, such as adsorption of the isolute on
the support, at the support- 1 iquid interface, and on the
liquid surface. If for example, values of partition
coefficients obtained by static measurements are in accord
13
with those determined by GLC, then it can be assumed that
the effects other than solution in the stationary phase are
negligible, within the accuracy of the measurements. If the
partition coefficients are in disagreement, then this
points to other interactions of the solute, which have
contributed to the retention of the compound. The retention
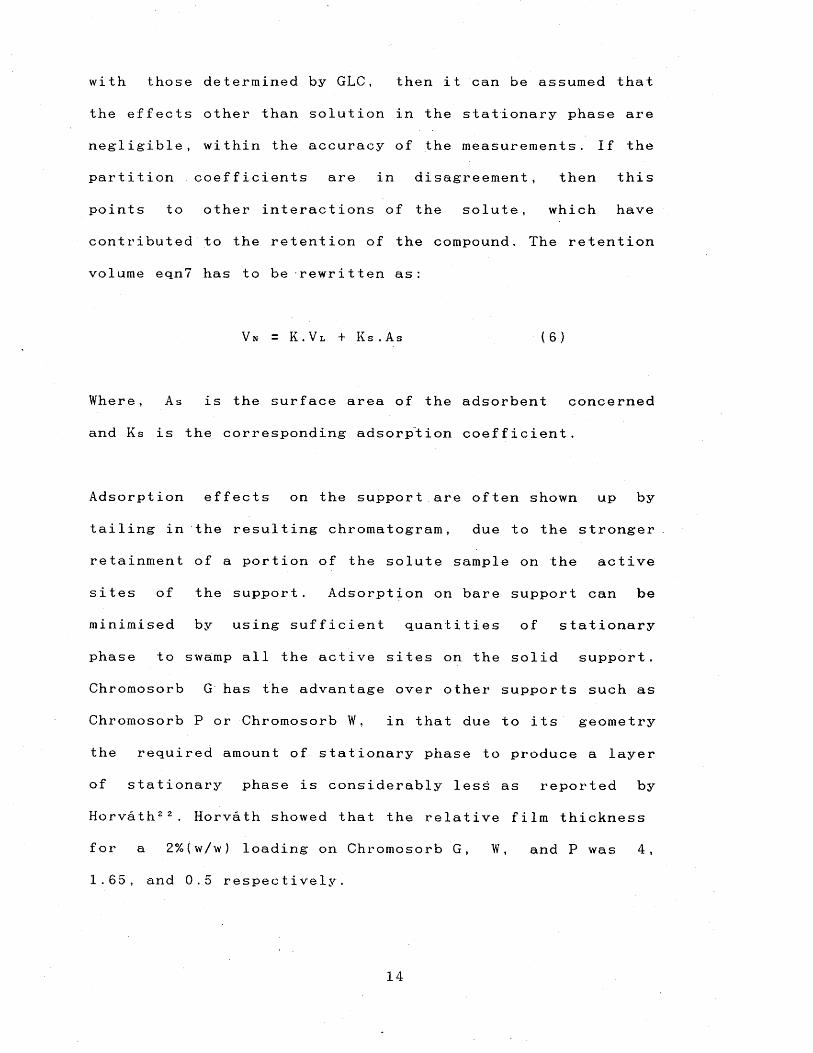
volume eqn7 has to be rewritten as:
Vn = K . V l + Ks.As (6)
Where, As is the surface area of the adsorbent concerned
and Ks is the corresponding adsorption coefficient.
Adsorption effects on the support are often shown up by
tailing in the resulting chromatogram, due to the stronger
retainment of a portion of the solute sample on the active
sites of the support. Adsorption on bare support can be
minimised by using sufficient quantities of stationary
phase to swamp all the active sites on the solid support.
Chromosorb G has the advantage over other supports such as
Chromosorb P or Chromosorb W, in that due to its geometry
the required amount of stationary phase to produce a layer
of stationary phase is considerably less as reported by
H orvath2 2 . Horvath showed that the relative film thickness
for a 2%(w/w) loading on Chromosorb G, W, and P was 4,
1.65, and 0.5 respectively.
14
SUPPORT TREATMENT
Diatomite supports are basically made up of a network of
siloxane groups (Si-O-Si), which can contain silanol groups
(Si-OH). The interaction of the stationary phase and/or the
solute with the support can be through hydrogen-bonding
sites, which includes both the siloxane ether group, which
can act as a hydrogen-bond acceptor, and the silanol group
which can act as a hydrogen-bond donor and acceptor. Dipole
and dispersion interactions can occur and also the support
can hold the liquid partly by capillary forces, depending
on the quantities present.
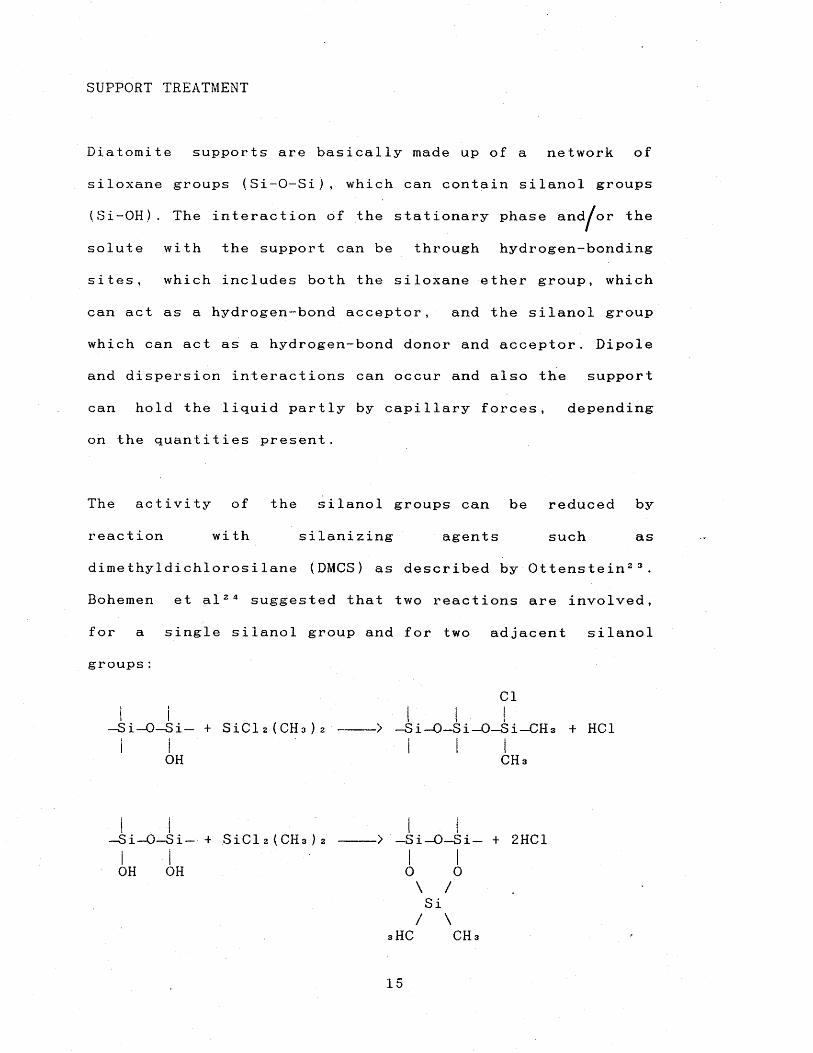
The activity of the silanol groups can be reduced by
reaction with s ilani zing agents such as
dimethy1dichlorosilane {D M C S ) as described by O t t e n s t e i n 2 3 .
Bohemen et a l 24 suggested that two reactions are involved,
for a single silanol group and for two adjacent silanol
g r o u p s :
Cl
-Si-O-Si- + S i C l 2 (C H 3 )2 > —Si—0 —Si—0—Si—C H 3 + HC1
OH CHa
—Si—0 —Si— + SiCl 2 (C H 3 )2 > _Si-0-Si- + 2HC1
OH OH 0 0\ / Si
/ \aHC c h 3
15
The procedure of silanisation thus eliminates the hydroxyl
functionality and reduces the possibility of interaction of
any bare support with hydrogen-bond base solutes (which is
by far the majority of solutes). In addition the support
can be treated with acid, which helps remove any iron
present in the diatomite.
When a non-polar stationary phase is used, it is best to
use the most inert form of the support, which is the acid
washed (AW) and silanised (D M C S ) form of the diatomite
(Chromosorb G AW DMCS). If a polar stationary phase is to
be coated, the non silanised form might be considered
(Chromosorb G A W ) , to ensure that the support still
retained sufficient activity for the polar stationary phase
to wet the support. However the experience gained in this
work showed that polar stationary phases coated well on
silanised supports. So normally the support Chromosorb G AW
DMCS was used for investigations carried out in this
work.
PREPARATION OF PACKING
The stationary phase in most cases is suitably coated onto
the inert support by rotary evaporation of a slurry of
support material and stationary phase dissolved in a
volatile solvent. However for very high molecular weight
polymers this method is unsuitable, as the polymer is
16

thrown to the side of the glass round bottomed flask and
very little actually coats the support. In this instance it
is better to coat the support as a slurry simply standing
in a beaker and slowly stirred with the aid of a mechanical
stirrer as the volatile solvent is evaporated off at room
temperature.
For accurate measurement of partition coefficients the
stationary phase loading must be accurately known, because
the partition coefficient (K) is related to the loading by
eqn7 , where V n is the retention volume and Vi is the volume
of stationary phase liquid at the column temperature. There
V NK = — (7)
VI
are several methods which have been used in the
literature2 5 '2 6 , which include Soxhlet extraction of the
stationary phase and combustive methods (silanized supports
require a correction made for the organic part of the
methylsilyl layer removed by combustion). However a much
simpler technique is a calculation of the loading by
accurate weighing procedures before and after coating the
support (see experimental S e c 7 .1.1.P224 for details).
COLUMN PACKING
Packed columns are usually constructed from glass,
17
stainless steel or copper, but glass has the advantage that
the packing can be viewed while filling the column and
after use in the GC . The packing is normally free flowing
even though it is coated with a liquid stationary phase and
is added in small quantities to the column at a time, the
column being tapped to settle and pack down. Excessive
mechanical packing should be avoided as diatomaceous
support materials have' the tendency to break down into
fines. For coiled columns, vacuum applied at the detector
end of the column and moderate gas pressure at the injector
end forcing the support through the column aids packing
(see experimental S e e ? .1.1.P229 for details).
2.1.4. OPTIMUM GLC WORKING CONDITIONS
VAN DEEMTER EQUATION
If the peak profile of a solute sample were followed as it
progressed through a GC column from injector to
detector, then what would be seen initially at the
injection point is a vertical line corresponding to the
peak, assuming a vertical injection profile (governed by
secondary affects such as the vaporising of the solute
before it interacts with the column packing and injection
technique of the GC operator). The peak would then be seen
to spread, with the corresponding reduction in peak height
and solute concentration, initially quite fast and then
18
slowing up but still spreading until the solute eluted from
the column. The maximum amplitude (A) of the peak (or
concentration) is inversely related to the square root of
the column length (1) .
A a 1/T1 (8)
The reasoning behind this band spreading can be separated
into two groups. The first of which involves processes that
occur in all columns, and are thus referred to as "normal”
processes. These are, spreading due to non-equivalent paths
in the packing (often called "eddy diffusion"),
longitudinal or axial diffusion, and non-equilibrium due to
resistance to mass transfer between phases. These three
processes are responsible for the terms in the van
Deemter2 7 equation for the height equivalent to a
theoretical plate (H) shown in its simplified version in
eqn9 .
H = A + B/u + Cu ( 9 )
Band spreading due to eddy diffusion (term A) needs little
explanation and is purely a random effect of some molecules
choosing a more direct path through the column than others
and is independent of the carrier gas velocity (u).
Longitudinal diffusion (term B/u), is the band spreading
associated with diffusion lengthwise in the column which
19
occurs both in the gas and liquid phases, (although in the
liquid the longitudinal diffusion is negligible.) and is
inversely proportional to ”u" . Mass transfer (term C u ) is
not an instantaneous process and the solute molecules
migrate along the column in a jerklike motion. In one
instance a molecule may be sorbed on the stationary phase
and hence stationary and the next moment volatilised and
carried along with the carrier gas. While moving with the
gas flow, the molecule possesses an above average velocity
and is thus experiencing a forward displacement with
respect to the bands centre of gravity. And while held
stationary in the liquid, the molecule suffers a negative
displacement with respect to the band centre. These
displacements are totally random and are determined by the
erratic diffusion of the solute molecules in and out of the
stationary liquid phase. Note that the observed solute peak
or band at exit is spread but its centre of gravity is
located where it would have been for instantaneous
equilibrium, provided the degree of non-equilibrium is
small. The mass transfer term is proportional to " u " ,
because an increase in the gas velocity increases the
amplitude of the jerklike motion of the solute progression
through the column.
The second group of processes leading to band spreading
include such effects as slow desorption from "active s i tes”
which hold on to the solute molecules more strongly than
20
the bulk of the packing (sometimes due to adsorption on
bare support). Another band spreading process is commonly
referred to as the "sorption effect” , which results in
areas of high concentration in the column moving faster
than areas of low concentration. A simple way of looking at
this was described by Lit t 1e w ood2 8 . ”The total pressure
inside a peak in the column is not different from the total
pressure elsewhere in the column (neglecting the overall
pressure gradient). Hence, since there is a finite vapour
pressure of sample, the partial pressure of carrier must be
correspondingly reduced. Since the mass flow rate of
carrier gas in the column must remain constant along its
length, it follows that the carrier velocity is greater
inside the peak than elsewhere, particularly in those parts
of the peak where the concentration is high. The effect of
this is to move the centre of the peak through the column
more rapidly than the other parts, so that it becomes
skewed towards the end of the column, and so a slight
asymmetry is imposed upon the peaks, making their front
profiles sharper than their rear profiles." This can result
in slightly smaller than expected retention volumes and is
minimised by working as close as possible to infinite
dilut i o n .
FLOW RATE AND ITS EFFECT ON ”H"
When measuring physicochemical properties it is best to
21
chose the flow rate corresponding to minimum H, this
maximises the ratio of retention time to peak width and
hence the precision with which the retention is determined.
The easiest way to do this is to plot H determined at
several flow rates against the flow rat e 28 and choose the
flow rate corresponding to minimum H. Optimum flow rates
are often in the region of 20-60 c m 3/min in 3-4mm i.d.
packed columns.
The plate height is obtained by dividing the length of the
column (L), by the number of plates (n). And "n" is
obtained from any peak on the chromatogram by e q n l l , where
LH = - (10)
n
n = 5 . 5 4 ( t ’r/Wh)2 ’(11)
t’’r is the adjusted retention time and Wh is the peak width
at half height in the same units of time.
22

2.1.5. CHROMATOGRAPHY THEORY
The fundamental datum to be obtained from a gas
chromatographic elution peak is the retention volume, which
can be related to physicochemical properties of vapour-
liquid equilibria such as the partition coefficient,
activity coefficient, or the H e n r y ’s constant.
The measurement and calculation procedures for the above
are outlined below, using similar nomenclature and
methodology as Conder and Y o u n g 1 0 .
A typical elution chromatogram is shown in Fig3, which
describes the concentration-time profile of the solute
observed by the detector as the solute elutes the end of
the GC column. The shape of the eluted solute peak can be
Fig3 ELUTION CHROMATOGRAM
Solute Elution of nonin jection sorbed sample
Elution of solute peak
co tmCOc0ocoo0JDOCO
Time
23
very informative about the nature of the processes that
have occurred in the column and their extent. The retention
time (t R ) is the average time a solute molecule takes to
travel from the point of injection to the point of
detection, and is taken as the midpoint of the symmetrical
solute peak or at the highest point of the solute peak, if
their are overlapping peaks or the peak is slightly
a symmetrical.
There is a finite time taken by the solute to pass through
the mobile gas phase from inlet to outlet and this is the
time "t■" taken for an unretained gas to pass through the
column. If the times, t« and t> are multiplied by the
measured flow rate (F) at the pressure of the column
outlet, the measured retention volume (Vr) and the gas
hold-up volume (Vn) are obtained. The contribution to
retention created by the stationary phase is the adjusted
retention volume ( V ’r) given by eqnl4.
tn.F = V b (12)
tm.F = V. (13)
V ’r = V r - V m (14)
Owing to the compressibility of the carrier gas and the
pressure drop across the column, the carrier gas flow rate
24

differs from inlet to outlet and gradually rises from inlet
to outlet as the carrier gas expands with the pressure
drop. Hence the adjusted retention volume V ’r measured at
outlet pressure needs to be corrected to the mean column
pressure. This is done by multiplying V ’ r by the pressure
correction factor J 23 to give the net retention volume V n ,
as shown in eqnlS using eqnl6 to calculate the pressure
correction factor. Pi . and Po are the inlet and outlet
pressures at the two ends of the column containing the
packing.
Vn = J 23 . V ’r (15)
n [(P i / P o )m -1]J“n = -.---------------- (16)
m [(Pi/Po)- -1]
In practice the flow rate is determined with a soap-bubble
meter, which necessitates a correction for the vapour
pressure of the soap solution, taken as the vapour pressure
of pure water (P w ) at the temperature of the soap solution.
In addition the column and flowmeter temperatures, Tc and
Ti respectively, may not be the same . Under these
conditions the equation for the net retention volume Vn
b e c o m e s :
(Po-Pw) TcV N — J 2 3 . V * r .-------- .-- (17)
Po Tf
25
The net retention volume Vn is the chromatographic
parameter from which the equilibrium thermodynamic
parameters, such as the partition or activity coefficients
are calculated. There is a very simple relationship between
the partition coefficient K and the net retention volume Vn
and is given by eqn7 . The partition coefficient can be
V nK = — (7)
V L
CsK = — (18)
C a
defined by eqnl8 as the rat io of the concentrati on of the
solute in the liquid s tationary phase (Cs) to the
concentration of solute in the mobile gas phase (Co ) , at
the temperature of the liquid stationary phase.
If it is necessary to take into account gas imperfections
due to a finite interaction of the solute vapour and the
’’inert" carrier gas, eqn7 may be replaced by eqnl9. In
which Bz3 is the cross second virial coefficient between
the solute vapour and carrier gas, and V 2 is the solute
molar volume (the correction term actually contains V ® 2 ,
the partial molal volume of the solute in the stationary
phase, but V 2 is nearly always used as an approximation to
V “ 2 ) .
26
Ln K° = Ln(Vn / V l ) - (2 B 2 3- V 2 )P o .J 4 3/RT (19)
Values of B a 3 when the carrier gas is helium as used in
this work (when eqnl9 was applied) are not known for most
of the solutes studied. The few measured values of Bz 3 are
all positive, however, so that there is a cancellation of
effects in the term (2Bz 3 - V 2 ) . B23 was calculated using one
of the suggested formulae10 (eqn20), which requires a
knowledge of the "cross” critical temperature T c 2 3 and the
critical volume of the gas-solute pair V c 2 3 . These were in
turn calculated using the combining rules in eqns21 and
e q n 2 2 .
B 2 3 T ° 2 3 = 0.461 - 1.158.----- - 0. 5 0 3 . (Tc 2 3/ T ) 3 (20)V'
T ° 2 3 = (T c 22 .Tc33 )* (21)
V c 2 3 = 1/8 [ ( V c 2 2 ) 1 / 3 + (V'ss ) 1 ''3 ] 3 (22)
The values of T c 3 3 and V c 3 3 for helium were taken as 5.19K
and 58.0 c m 3m o l ~ 1 respectively, and those for other solutes
were from Kudchadker et a l . 29 Values of B 2 3 calculated via
eqns 2 0 - 2 2 agreed reasonably well with observed values when
the latter were known: thus for helium-pentane B 23 was
calculated as 29cm3mol 1 at 310K as . compared with
28cm3m o l _1 at 298K by Laub et a l 3 0 , and for he 1ium-benzene
27
6 2 3 was calculated as 36c m 3m o l '1 at 310K as compared with a
value of 4 9 c m 3m o l -1 at 323K by Everett et a l 3 1 . In any
case, since Pi and Po were quite close to atmospheric
pressure (typical values being 1.3 atm for Pi and 1.0 atm
for P o ), the term P o . J 43 in eqnl9 is not far from unity,
and the entire- correction term amounts to -0,004 in a
typical case, corresponding to only -0.002 in log K.
Absolute K values were calculated for n-alkanes on olive
oil at 310K and are given together with the corrected K*
via eqnl9 in Appendix2.
For an ideal solution the partial pressure of a solute (Pz)
is related to the mole fraction of the solute in the liquid
solvent (X z ) b y :
P 2 = P ’2 .Xz (23)
Where P *2 is the saturated vapour pressure (SVP) of the
pure solute. However if the solution is not ideal and
Raoults law is not obeyed (i.e. the partial pressure of the
solute is greater or smaller than expected by e q n 2 3 ), then
a term is required to correct for the departure from
ideality, and is called the activity coefficient of the
solute (4>2 ) . The solute partial pressure is now given by:
P 2 — P ' 2 > X 2 . $ Z (24)
28
Assuming that the ideal gas law applies then it can be
shown that the activity coefficient is related to the
partition coefficient b y 1 0 :
d i .R .Tc$ 2 r ---------- (25)
K.P° 2 .Mi
From which activity coefficients can be calculated provided
that the solvent stationary phase molecular weight (Mi) and
density (di) at the temperature "K" was measured at (Tc). R
is the Universal gas constant. When taking into account
gas-phase imperfections similar corrections as applied in
eqnl9 are required1 0 .
The H e n r y ’s law constants K H can also be calculated from
the activity coefficients using eqn26 or directly from the
partition coefficient via eqn27; <£“ 2 and K “ refer to the
activity and partition coefficient at infinite dilution,
where H e n r y ’s law is obeyed.
K H = P* 2 . $ " 2 (26)
K H =d 1 .R .Tc
Mi .K'(27)
29
,2.1.6. PRACTICAL CONSIDERATIONS FOR THE MEASUREMENT OF
PARTITION COEFFICIENTS
For the measurement of absolute values of K or K° using
eqn7 and eqnl9 respectively, a gas chromatograph with a
katharometer detector is used, so that the gas flow rate
can be easily determined by passing the eluent from the
detector through a soap-bubble meter. Accurate measurement
of flow rate is less easy with an FID. It is possible to
measure the flowrate through the jet, with the flame out
and the air and hydrogen gas supplies switched off (if the
carrier gas is nitrogen or helium), by placing a PVC tube
over and sealed to the detector or directly sealed to the
jet. This procedure is only satisfactory if switching off
the air and hydrogen supplies produces no significant
pressure change at the jet. It is also inconvenient in that
every time a flow measurement is to be made the the
detector flame has to be extinguished and allowed to cool.
Commercial gas chromatographs require several modifications
in order to obtain accurate measurements. The
thermostatting of commercial instruments is usually poor,
especially at ambient temperatures and in this instance it
is highly desirable that the usual air-oven thermostat be
replaced by a liquid filled thermostat in which the column
is immersed to a level that totally immerses the column
packing. Liquid thermostats provide much better isothermal
30
temperature control and can provide column temperatures of
up to about 420K. Additionally the flow controllers
provided in commercial instruments are commonly inadequate
and must be replaced by much more sensitive flow
controllers to ensure a constant gas flow rate. Measurement
of Pi and Po is not usually a problem, and is carried out
using mercury manometers. One of the most difficult
quantities to measure is V l , the volume of liquid
stationary phase in the column at the column temperature.
Methods are available for measurement of liquid stationary
volume as previously described, but for a stationary phase
used at a temperature at which it is a solid, V l must be.
obtained from the weight of the stationary phase and the
(hypothetical) liquid density at the column temperature. If
absolute K values are known then relative K values
necessary, and in this case a knowledge of V l
required.
One disadvantage of a system using.a katharometer
is the low detector sensitivity compared to, for
the flame ionisation detector (FID), which is some four to
six orders of magnitude more sensitive. Hence using a
katharometer, comparatively large quantities of solutes
need to be chromatographed, with the concurrent possibility
of adsorption effects. To overcome this difficulty, a
katharometer detection system is used to obtain absolute K
values for n-alkane solutes which are much less likely to
only are
is not
detector
e x a m p l e ,
interact strongly with the support, and then an FID system
is used to obtain K values for other solutes relative to
those for the alkanes.
Relative K values can be determined by chromatographing two
or more solutes at the same time. Suppose the K values are
denotbd as K r and K u . Then the ratio of K r and K “ is given
very simply by the ratio of their adjusted retention times:
K 1' trR-tm— = (28)K u t u R - t m
Much literature work is given in terms of the specific
retention volume of a solute, Vg. The connection between Vo
and K is given by eqn29, defining the specific retention
volume as the net retention volume at the column
temperature for a unit weight of stationary phase , where
di is the density of the liquid stationary phase at the
column temperature. It follows that relative K values are
given by eqn30
1V g = ----- (29.)
K.di
K 1* V * a— = --- (3 0)K u V u a
32
2.1.7. COMPARISON OF STATIC HEAD-SPACE ANALYSIS AND THE
DYNAMIC GAS-LIQUID CHROMATOGRAPHY METHOD FOR THE
DETERMINATION OF PHYSICOCHEMICAL MEASUREMENTS.
The main difference between the two methods is how the
solute is allowed to equilibrate between the vapour and
liquid. In the head-space analysis the system is enclosed
and the equilibrium is achieved without any agitation to
either phase (and hence is referred to as a static method).
Note that sufficient time must be allowed for equilibration
and this can be significantly larger for more viscous
solutions where rates of absorption and desorption are much
slower. In contrast to the head-space method the dynamic
GLC method involves the equilibration of the solute between
a static liquid phase and a mobile gaseous phase (and hence
is termed a dynamic method). To ensure equilibration care
should be taken in choosing the flow rate. If the flow rate
is too fast equilibration will not be achieved. The flow
rate can be optimised as described earlier by measuring the
flow rate corresponding to minimum plate height (Sec2.1.4.)
Experimentally, problems from secondary effects such as
adsorption can occur in both the head-space and GLC
methods, especially on rubber seals and the support
respectively, but both can be minimised as discussed
earli e r .
33
Head-space analysis can suffer from impurity problems from
both the solvent and the .solute. In the dynamic method of
GLC the solvent stationary phase purity is still a strong
requirement but as a general rule it does not suffer from
solute impurities, because the equilibration process itself
separates any impurity from the solute being investigated.
In addition much smaller samples can be dealt with by
dynamic GLC where concentrations are quite often near
infinite dilution, where solute-solute intermolecular
interactions are negligible and the thermodynamic function
depends only on the solute-solvent interactions.
The main advantage of dynamic GLC over static head-space
analysis is the much greater speed with which data can be
accumulated. Mixtures of homologues can even be injected
and partition coefficients measured simultaneously by
dynamic GLC, this has the added advantage other than saving
time, that more accurate results can be achieved as
experimental conditions are less likely to be affected by
instrument variations. However it is still important to
measure partition coefficients by head-space analysis
because if these values agree with those measured by
dynamic GLC, then the worker can be confident that
secondary effects due to adsorption are minimal (or that
opposing secondary effects cancel one another out), and
that equilibration is achieved at the flow rates used in
dynamic G L C .
34

2.1.8. PREVIOUS WORK ON STATIONARY PHASE SOLVENT
CHARACTERISATION
Numerous attempts have been made to characterise and to
evaluate stationary solvent phases, usually by studying the
retention values (as retention indices, logK partition
coefficients or logVa retention volumes) of a number of
test solutes. Most of these attempts are of little general
use, being restricted to certain specific classes of solute
(see e.g. the review by E c k n i g 32).
The most widely used analysis on these lines is that first
used by R o hrschneider33 and developed by M c R e y n o l d s 3 4 . A
number of test solutes with characteristics (a,b,c,d,e) are
chromatographed on a series of stationary phases of
characteristics (X,Y,Z,U,S) and a series of regression
equations of the type in eqn31 are constructed. It is usual
to regress, not I-values but differences between I-values
on a given stationary phase and I-values on a standard
apolar stationary phase (Al) . M c R e y n o l d s 3 4 extended the
scheme to ten solutes and McReynolds constants are widely
quoted.
I (or A l ) = aX + bY + cZ + dU + eS (31)
There is however, no connection between the solvent
parameters (X,Y,Z,U,S) and any other system of solvent
35
parameters and so the McReynolds scheme remains as a useful
self-consistent method of evaluation of stationary phases,
but outside the general analysis of solvents. Other
w o r k e r s 3 5 ’ 38 have used different ’’test" solutes, those of
Grob being of general u s e , but again these lead to self-
consistent but isolated factors.
A much more sophisticated procedure has been developed by
Laffort et a l 3 7 , who use a linear equation, eqn32, to
predict retention indices. In this equation, the terms,
a ',w ’,€’,tc’ and 0 ’ refer to solute properties and, A,0,E,P
and B are the solvent properties.
I = a ’A + w ’O + 6 ’E + tc’P + £ ’B + 100 (32)
Several of the solute terms in eqn32 refer to well-known
properties, for example a' is proportional to solute molar
volume at the boiling point. Other terms might be equated
with solute parameters discussed in Sec4 . 1 . 2 . P98 : thus tc ’
and 13’ refer to solute monomer proton-donor and proton-
acceptor factors. Laffort et a l 37 used eqn32 to
characterise 240 solutes and 207 stationary phases. This
represents the most thorough such analysis yet reported.
There are, however, a number of disadvantages encountered
by the use of eqn32. First of all, there is no reason why
the solvent factors (A,0,E,P,B) should be comparable with
36
any other solvent properties: the term B may or may not
equate with the so1vatochromic a 1 parameter that refers to
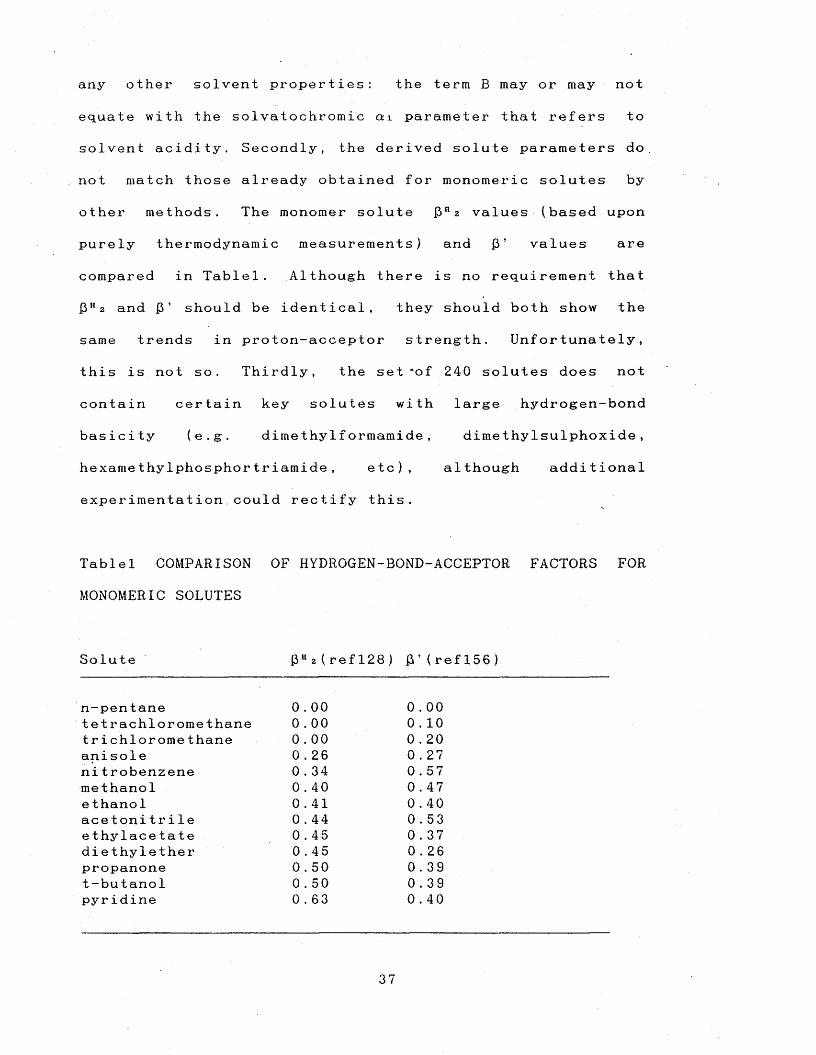
solvent acidity. Secondly, the derived solute parameters do
not match those already obtained for monomeric solutes by
other methods. The monomer solute f3Hz values (based upon
purely thermodynamic measurements) and 13’ values are
compared in Tablel. Although there is no requirement that
j3H2 and J3 ’ should be identical, they should both show the
same trends in proton-acceptor strength. Unfortunately,
this is not so. Thirdly, the set *of 240 solutes does not
contain certain key solutes with large hydrogen-bond
basicity (e.g. dimethy1formamide, dimethylsulphoxide,
hexamethylphosphortriamide, etc), although additional
experimentation.could rectify this.
Tablel COMPARISON OF HYDROGEN-BOND-ACCEPTOR FACTORS FOR
MONOMERIC SOLUTES
Solute £}H 2(refl28) £ ’ ( r e f 15 6 )
n-pentane 0.00 0 . 00tetrachloromethane 0 . 00 0 . 10trichioromethane 0 . 00 0 . 20anisole 0 . 26 0 . 27ni trobenzene 0 . 34 0.57methanol 0 . 40 0 . 47ethanol 0 . 41 0 . 40acetonitrile 0 . 44 0 . 53ethylacetate 0 . 45 0 . 37diethylether 0 . 45 0 . 26propanone 0 . 50 0.39t-butanol 0 . 50 0.39pyridine 0 . 63 0.40
37
Ecknig and co-workers30 have used a semi-empirical method
of estimating logVa values, based upon two parameters, 0
and D. The former is a polar parameter that includes
dipole-dipole interactions, hydrogen-bonding, induction
effects, etc, and D is a non-polar dispersion parameter
calculated from atomic group refractions. Note the values
of 0 are the same for each class of compound in any one
stationary phase. If this is compared to the approach used
in this work, this would imply that the sum of 7E*2, £ H 2,
and a a 2 are the same for each compound in one class of
compound. This is not true, but it is true that the
differences are relatively small within classes of
compound. 0 and D are used to predict retention data in
eqn3 3,
logVa = A- + A 1 . 0 + A 2 .D (33)
where A» , A i , and A 2 are empirical coefficients. In eqn33
thei r is no parameter that corresponds directly or
indirectly to any "cavity term", although this is central
to the scaled particle theory (S P T ), the most general
method used in gas solubility calculations. P i e r o t t i ’s
version39 of SPT is commonly used to calculate gas-liquid
partition coefficients especially for the permanent gases,
although it is not so useful for the calculation of the
solubility of larger solutes15..
38
The statistical results of correlations for logVa against 0
and D in eqn33 are lacking, but a figure of 6.7% as an
average deviation is quoted, but only when one substance
class is being studied. This figure is commensurate with
Rohrschneider19 (6%), Mar t i r e 42 (5%) and Gassiot et a l 43
(3%), when using solutes of one substance class only.
Ec k n i g 32 admits though, that for different types of
compound, their model is only a rough approximation to the
real conditions in gas-liquid chromatography.
39
2.2. SURFACE ACOUSTIC WAVE CHEMICAL SENSORS
2.2.1 INTRODUCTION TO PIEZOELECTRIC CRYSTAL CHEMICAL
SENSORS
The selective detection of gases and vapours is of
considerable interest and importance in industry, in
military areas, and in the environment. Detectors capable
of detecting, identifying, and quantifying potentially
dangerous emissions of gases or vapours (chemical sensors)
are needed to identify the hazard and its source, to
monitor levels of exposure and the transport through the
environment, to protect the health and safety of workers,
military and citizens, and to protect the environment from
harmf effects of pollution. The need for chemical sensors
can not be stressed enough in this day and age where nature
is struggling to keep pace with industrial and military
advancement.
pointed out in 1964 that when Piezoelectric
als are coated with various materials they
tive gas or vapour detectors . Piezoelectric
als have been used as frequency and time
curate to 1 part in 10®, or better, for
requency in communication equipment and to run
clocks . Less familiar u s e s 45 range from the
of temperature to the adsorption of gases on
40
K i n g 4 4 first
quartz cryst
become selec
quartz cryst
standards ac
controlling f
very accurate
measurement

quartz. The latter employs the sensitivity of the vibrating
material on its
are coated on the
reduced due to the
gas or vapour is
vibration is again
principle of gas
two piezoelectric
of which is coated
with a selective coating (detector crystal), the other
acting as the reference crystal. The crystals vibrate at
radio-frequencies but when heterodyned an audio-frequency
can be obtained from the difference in frequency of the
reference and detector crystals. This difference frequency
if in the audio range, is readily displayed with the use of
an audio-frequency meter or similar device.
The use of SAW devices was first reported in 1979 by
Wohltjen and D e s s y 46 and has since been investigated by
several groups47-64. SAW devices consist of a thin slab of
piezoelectric material (such as quartz) on which two sets
of interdigital microelectrodes have been fabricated.
Typical devices range in size from less than a square
crystal to the presence of a foreign
surf a c e .
When liquids such as polymeric materials
crystal, the frequency of vibration is
mass action of the coating. Now if a
sorbed by the coating, the frequency of
further reduced. This is the basic
detection using piezoelectric crystals.
In surface acoustic' wave (SAW) devices
crystals are used for each sensor, one
41
millimetre to several square centimetres. When a set of
interdigital electrodes is excited with a radio-frequency
voltage, a mechanical Rayleigh surface wave is generated.
This wave is then free to propagate across the surface
until received by the other set of electrodes and is
converted back into a radio-frequency voltage. Connection
of these two sets of electrodes together through a radio
frequency amplifier permits the device to oscillate at a
resonant frequency. The oscillator frequency is measurably
altered by small changes in mass or elastic modulus. Vapour
sensitivity is typically achieved by coating one set of
electrodes with a thin film of a stationary phase which
will selectively sorb the target vapour. Vapour sorption
increases the mass of the surface film and a shift in the
oscillator frequency is observed.
Surface acoustic wave (SAW) devices are attractive for
chemical microsensor applications due to their small size,
low cost, ruggedness and high sensitivity. The detection
limit is estimated to be about 1 0 " 12g r a m 4 4 . A further
advantage is the potential for these sensors to be adapted
to a variety of gas-phase analytical problems by designing
or selecting specific coatings for particular applications.
Methods to quantify vapour sorption and to elucidate
solubility interactions responsible for vapour sorption
will facilitate coating development.
42
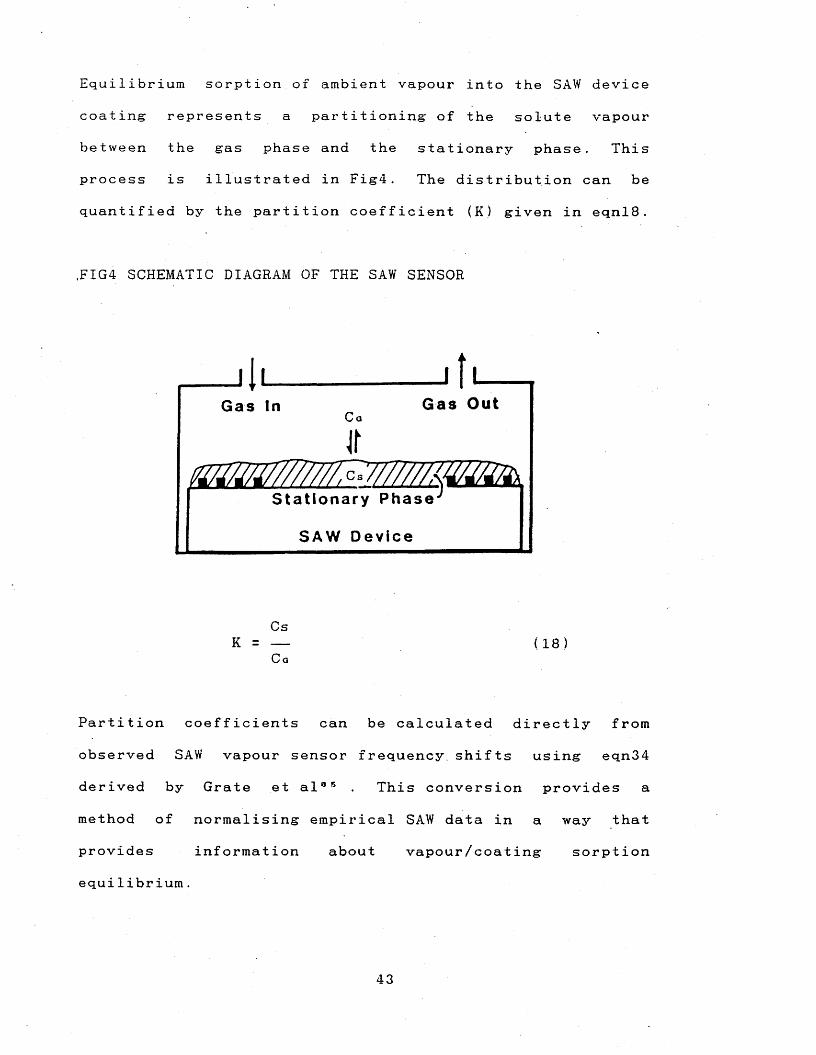
Equilibrium sorption of ambient vapour into the SAW device
coating represents a partitioning of the solute vapour
between the gas phase and the stationary phase. This
process is illustrated in Fig4. The distribution can be
quantified by the partition coefficient (K) given in eqnl8.
.FIG4 SCHEMATIC DIAGRAM OF THE SAW SENSOR
IGas In Gas OutC a
atStat ionary Phase-'
SAW Device
CsK = — (18)
Co
Partition coefficients can be calculated directly from
observed SAW vapour sensor frequency, shifts using eqn34
derived by Grate et a l 05 . This conversion provides a
method of normalising empirical SAW data in a way that
provides information about vapour/coating sorption
equilibrium.
43
As a sorption detector, the SAW sensor is similar to the
bulk-wave piezoelectric (B W P ) crystal detector first
reported by K i n g 4 4 '0 8 . A linear relationship between the
BWP crystal frequency shift (Af) and K was later derived by
Janghorbani and F r e u n d 8 7 . These authors investigated the
use of coated BWP crystals as gas chromatographic detectors
and demonstrated that peak areas were linearly related to
retention volumes for three n-alkanes on squalene (note,
retention volumes are directly proportional to K). Edmonds
and W e s t 88 demonstrated that the responses of a tricresyl
phosphate-coated BWP crystal to five vapours at 30*C
correlated with relative gas-liquid chromatography (GLC)
retention times at 9 3 ’C. These results provided qualitative
experimental support for the linear relationship between Af
and K, and showed that the slope of response-concentration
plots should provide a measure of K 8 9 . The relevance of K
to SAW vapour sensor responses has also been previously
n o t e d 5 1 ’5 3 . The frequency shifts of a p o l y (ethylene
maleate) coated device in response to five vapours were
compared with relative K values estimated using solubility
parameters5 3 .
None of the previous studies, however, have calculated
partition coefficients from sensor responses or compared
them with absolute values of K determined by any other
method. This is due, in part, to the scarcity of literature
data on absolute K values, especially near or at ambient
44
temperatures; Absolute K values have been determined by GLC
in this work at 2 5 *C for a wide variety of vapours on SAW
coating materials, with several objectives in mind. First,
GLC is used as an independent method of measuring sorption
into the coating materials, and hence K values determined
by GLC (KGI,C) can be compared with K values determined from
SAW measurements (KS A W ). Partition coefficients provide the
best available first approximation of the prediction of SAW
sensor responses. Second, the database of K GI,C values have
been used in correlations using eqn75 and eqn73 with solute
parameters using the technique of multiple linear
regression analysis (as described in Sec4.1.P88). The
coefficients of these equations provide a method for
characterising the solubility properties of the coating
materials and for predicting partition coefficients and
hence SAW shifts for solutes for which the various
parameters are known.
The equation relating the frequency shift to the partition
coefficient is:
A f » . C a . K SAWAf ▼ = -------------- (34)
di
Where,
Af^ = solute vapour frequency shift in Hz.
Af» = coating frequency sift in kHz.
45
di = coating density in g e m " 3 .
C g = solute concentration in the gas phase in g d m '3 .
K SAW = partition coefficient determined by SAW device.
Experimentally, A f B is determined when the solute vapour
sensitive coating is applied to the bare SAW device. A f ▼ is
measured when the sensor is exposed to a calibrated vapour
stream of concentration Co. Eqn34 provides a simple
relationship for calculating K values from measurable
sensor characteristics. The relationship is independent of
the specific SAW substrate, having no dependence on SAW
device frequency (F) or piezoelectric material constants.
The assumptions inherent in eqn34 are that the SAW device
functions as a mass sensor (i.e. mechanical effects are
negligible) and that the observed mass change is due to
partitioning of the solute vapour between the gas phase and
the stationary phase coating. One additional assumption is
made in that the density of the coating is taken as the
density of the pure coating and is equal to the density of
the coating plus the dissolved solute vapour. As long as
the mass loading of the stationary phase by solute vapour
is low, as for low vapour concentrations or weakly sorbed
vapours, then this assumption is valid.
Eqn34 is related (but not identical) to equations in
references 67-69 which describe the relevance of K to the
46
responses of coated BWP crystal detectors.
2.2.2. SENSOR ARRAYS
The ultimate chemical sensor would be able to selectively
interact with and respond to the target solute only
providing absolute knowledge of their presence or absence.
However it is not reasonable to expect a single sensor to
be developed for each chemical situation (note the human
body goes a long way to achieving this through the so
called ’’lock and k e y ” mechanisms of for example enzymes) or
for it to be possible practically for the large majority of
si tuat i o n s .
To increase the information content of chemical sensors
they are used in the form of an array. This is a series of
chemical sensors, in this case SAW devices, which are
coated with different stationary coatings which have
different sorption characteristics. For example one could
be a non-polar stationary phase coating capable of only
dispersion type interactions with solute vapours, the
second could be a polar stationary phase coating (not
capable of hydrogen-bonding), the third a stationary phase
coating capable of some form of hydrogen-bonding, and so
on. The number of chemical sensors required in an array to
pos i tively identify a target solute depends on the
difference in the s e 1ectivities of the separate sensors
47
towards the target solute vapour and the degree of their
interactions. The use of pattern recognition techniques,
for example principal component analysis and hierarchial
clustering are very useful for this analytical problem.
This approach has been applied to vapour response data from
and to the selection of coatings for, piezoelectric crystal
sensors by Ballantine et a l 5 0 , and Carey et a l 7°. To
visualise the selectivity of coatings, bar graphs are used
in this work showing partition coefficient patterns of six
polymer coatings to specific vapours (Figl5.P159) and
partition coefficient patterns of 8-9 solute vapours to
specific coatings (F i g l 4 .P 1 5 6 ).Patterns obtained using K SAW
and K ai*c are compared visually as well as the individual
LogK (T a b l e l 3 .P155)values and conclusions are drawn about
the mechanism of sorption in SAW devices. Regressions of
all k q l c measured values against solute parameters have
been carried out and details are given in Tables8-10 in S e c 5 .1.2.P 1 4 2 .
Seven polymer stationary phases suitable for SAW devices
have been studied by GLC at 298K and at additional
temperatures when necessary. For six of these coatings K SAW
measurements are available for comparison with the GLC
measurements. Details of the seven polymers are given in
t a b l e s 5 ,35-37P121 & 233. The seven polymers are:
fluoropolyol, polyvinylpyrrolidone, p o l y e p i c h l o r o h y d r i n ,
p o l y ethylenemaleate, p o l y (4-vinylhe xafluorocumylalcohol) ,
polyisobutylene, and polymethylmethacrylate.
48
2.2.3. COMPARISON OF K GLC AND K SAW METHODOLOGY
Both methods are dynamic, in that a solute vapour is
allowed to equilibrate itself between a mobile gas phase
and a stationary 'liquid phase (as opposed to static methods
such as head-space analysis discussed in S e c 2 .1.1.P 6 ). The
fundamental difference in the determination of k g l c and
K SAW is in the way the solute vapour is fed to the GLC
column and the SAW d e v i c e . In the method of GLC used here
an elution technique is used whereby a discrete solute
sample is passed through the column. SAW devices on the
other hand use a technique where by a mixture of pure air
carrier gas and solute vapour is continuously passed over
the device when measurements are made. Although the method
is dynamic in that a continuous flow of vapour is used, it
is static in that equilibrium concentrations of solute in
the vapour and the stationary liquid-phase are set up.
The techniques differ in other aspects which could give
rise to secondary effects other than sorption into the
stationary phases, which K describes. In GLC these are
adsorption at interfaces, which are in addition to
absorption in the stationary p h a s e . These effects in GLC
are minimised by use of suitable loadings and choice of
support as discussed in S e c 2 .1.3.P I 2. In SAW devices
secondary effects such as adsorption are also possible and
can occur on the quartz c r y s t a l , in particular the
49
reference oscillator from which Af is determined. The
interaction of solute vapour on the detector oscillator is
mainly precluded due to the coating; and thus Af might
include a factor due to quartz adsorption. Adsorption on
the surface of SAW coatings or GLC stationary phase
coatings is of particular importance when dealing with
polymeric substances and it is important to use the
polymers above their glass transition points (to ) , where
sorption corresponds more closely to absorption only.
Solute impurity can be a problem for SAW devices, because
they will partition into the detector as well as the solute
vapour of interest. Note this can even be a problem if the
liquid solute is of high purity, because this does not
necessarily mean that the vapour phase above the solute
liquid will be in the same proportion of solute and
impurity. If a minor impurity in the solute liquid is
relatively more volatile than the solute in question then
the vapour phase could contain a comparatively larger
amount of impurity (the principle of distillation). GLC
does not suffer from these types of impurity problem,
because the process involves separation of any impurities
from the solute sample in the GLC column.
An important question to be asked is whether or not
equilibrium is achieved, because if not, then the partition
coefficients determined will not be strictly valid and more
50
susceptible to external variables such as flow rate. If the
flow rates used in GLC columns are toohigh then the solute
will not be allowed to come to equilibrium as it is passed
over the stationary phase. In GLC columns the flow rate can
be simply optimised using the van Deemter equation2 7 ’10 as
discussed in S e c 2 .1.4.P I 8. Another effect that determines
whether equilibration of the solute sample is achieved is
the rate of diffusion into the stationary phase, which
depends to a large extent on the state of the stationary
phase (often polymeric.) i.e. whether or not it is a
liquid, solid, or somewhere inbetween as for glassy
p o l y m e r s . As stated above it is preferable to use liquid
stationary phases or at least polymeric phases above their
t o , where diffusion processes into the stationary phase are
much easier than for solids and hence sorption more closely
corresponds to absorption only. Rates of sorption are not a
problem with SAW devices, because the vapour stream can be
passed oyer the device for as long as is necessary for
equilibrium to be attained.
The temperature at which K values are measured is critical
as the logK values are inversely proportional to
temperature (i.e. the higher the temperature the lower the
K value). In SAW measurements, up until now little effort
has been made to thermostat the SAW devices, which have
been operated at or near room temperature. In contrast the
K aLC measurements are made under controlled isothermal
51
conditions and in measurements made in this work k g l c
values were determined at 2 S 8 .15 ± 0 .0 5 K , whereas the £ SAW
values for example of fluoropolyol were determined at
308±2K. All the polymers studied in both SAW devices and by
GLC were studied at temperatures above their to values
(except P V P ). . So the K values should primarily correspond
to absorption phenomena buc undoubtably there will be some
adsorption effects at the low operating; temperatures. This
can be studied by varying the stationary phase loading in
GLC and by using different thickness of coatings in SAW
devices and noting its effect on K values. Some additional
measurements at higher temperatures than 298K were measured
by GLC which showed better solution properties of the
polymers by the increased peak symmetry obtained.
The carrier gas used for the SAW devices was air and the
flow rate passing over the FPOL stationary phase coating
was 100cm3/min, whereas the carrier gas rate used in GLC
measurements was about 4 0 c m 3/min.
The K values when determined by GLC require an accurate
knowledge of the volume or mass of the polymer deposited on
the support. This was determined by simple accurate
weighing procedures as described in S e c 7 .1.1.P 2 2 4 .: Whereas
in contrast the volume or mass is not required in the
calculation of K values by SAW devices using e q n 3 4 .
52
3.1. INTRODUCTION TO ADSORPTION
The adsorption of gases an
commercial and industrial i
of solids available. Any
certain amount of gas,
equilibrium depending on,
gas and the surface area
are, therefore, highly por
silica gel which can have
1000in2/g. Because of their
these solids can adsorb
gaseous s o l u t e s . When a g
contact with a solid sur
attached to the surface in
The solid is generally refer
gas or vapour as the ads
absorption into the bulk
place, and since adsorption
distinguished experimentally
sometimes used to describe
uptake by solids.
The ability of porous sol
volumes of vapour was rec
century, but the practical
Large scale separation
d vapours on solids is of
nterest, hence the large
solid is capable of adsor
the extent of adsorpt
temperature, the pressure
of the solid. The most
ous solids, such as chare
surface areas of up to
large surface area:weight
remarkably large quantit
as or a vapour is brought into
face, some of it will become
the form of an adsorbed layer,
red to as the adsorbent and the
orbate. It is possible that
of the solid might also take
and absorption cannot always be
, the generic term sorption is
the general phenomenon of gas
ids to reversibly adsorb large
ognised as far back as the 18th
appli ca t ion of this property to
and purification processes is
great
number
bing a
ion at
of the
notable
oal and
about
ratio,
ies of
53
relatively recent. At the turn of the 20th century,
manufacturing processes for active carbons first appeared,
but it took the 1914-18 world war to provide the stimulus
to develop the high quality adsorbents used today. Chlorine
gas was used by the German army against the allied forces,
for which an effective countermeasure had to be found
quickly. Since then the chemical industry has continued
research into the production, characterisation and uses of
adsorbents. As part of this research and development of
adsorbents, more recently there has been a trend towards
developing synthetic porous polymers, which might be
superior in their selectivity and/or their adsorbent power
to the activated carbons.
3.2. PREVIOUS WORK IN ADSORBENT CHARACTERISATION .
Unlikely though it may seem, very little is known about the
selectivity of adsorbents towards various classes of
solute. Nelson and H a r d e r 71 studied the adsorption of 121
gases and vapours on activated carbon, by measuring-
breakthrough times and were only able to conclude that, in
general, the less volatile the solute, the more it was
adsorbed. More recently, Sansone et a l 72 predicted the
adsorption of 8 vapours on activated carbon using solute
properties such as the molar refractive index, vapour
pressure and molar volume; significantly., no solutes
capable of hydrogen-bonding were studied. Parcher et a l 73
54
have applied a form of scaled particle theory (SPT), for
use in adsorption of vapours on graphitised carbon black.
As it stands, the theory does not include terms for
specific hydrogen-bonding between vapour and the solid, and
it remains to be seen how the theory can be developed for
the prediction of adsorption properties under thes.e
conditions. Snyder7 4 '7 e reviewed progress up to 1968, but
predictive equations were in general limited to semi-
empirical methods. Snyder used two solute parameters A and
S', A is a size parameter calculated from the covalent and
van der Waal radii of the atoms comprising the adsorbate
molecule. The other solute parameter S * is measured as the
free energy of adsorption of a solute from n-pentane as
eluent (in a liquid-solid chromatographic set up) onto the
dry adsorbent. The S ’ solute parameters are not the same
for each adsorbent, which limits the scope of such a method
to any sort of generalised characterisation of adsorbents.
The corresponding adsorbent parameters used by Snyder are
aa and a, ad is calculated from the adsorption energy of n-
pentane and is an attempt to estimate the dispersion type
interaction. The other adsorbent parameter a is calculated
from the retention properties of napthalene from n-pentane
as eluent at different levels of moisture content in the
adsorbent. Sn y d e r 76 admits that the complete experimental
determination of all the possible adsorption parameters is
■’undoubtebly unrealistic” by such a method. Kiselev et a l 77
calculated retention volumes on graphitised carbon black,
o o
us ing atom-at om potential f unc tions for solute-adsorbent
interactions, but it is not clear how such an approach
could be used as in a general classification of adsorbents.
The simple lattice structure of graphite and the non
specific adsorption allows the potential energy between
solute and graphite to be calculated as a function of the
co-ordinates of the centre of mass of the solute and the
orientation relative to the crystal plane. Interactions of
all parts of the adsorbate molecu1e with the lattice are
found by summation over all atoms. Good agreement between
experimental and predicted H e n r y ’s constants was obtained
by Kiselev and Y ashin78 for n-alkanes on graphitised
thermal carbon black, where the interactions are non
specific and related in the main to dispersion forces. How
these predictive methods could be applied to specific
interactions such as hydrogen-bonding with heterogeneous
solids such as porous polymers or functionalised carbons is
not clear. Other attempts7 3 '80 have also been made to
calculate retention volumes or H e n r y ’s constants, but, as
pointed out by Lopez-Garzon et a l 8 1 , this is difficult when
solutes contain different functional groups. Vidal-Madjar
et a l 82 have developed a theoretical model to account for
elution peak profiles, and have applied this to a number of
specific cases8 3 , but again, this approach falls short of
any general method of characterising adsorbents. Cooper and
H a y e s 84 have attempted to classify adsorbents by a surface
polarity scale analogous to -the Rohrscheider and
5 6
M c R e y n o l d ’s scales2 3 ■ 3 4 that describe the "polarity” of
gas-liquid - chromatography (GLC) stationary phases. Only 3
solutes, chloroform, pyridine, and dichloromethane are used
to characterise each adsorbent and their choice is not very
satisfactory (even Rohrscheider and M c R e y n o l d ’s used 5-10
solutes). Chloroform is described as a proton donor, infact
it is a rather weak hydrogen-bond acid (aH 2 , 0.20),
pyridine is described as a proton acceptor and is a strong
hydrogen-bond base and dichloromethane is described as a
dipole interactor. The results are limited in the poor
choice and number of reference solutes; significantly no
strong hydrogen-bond donor solute was chosen (other
limitations of the Rohrscheider and M c R e y n o l d ’s "polarity"
scale are discussed in S e c 2 .1.8.P 3 5).
The work described a b o v e 71'78 mainly refers to work
involving adsorption measurements on dry adsorbents at zero
humidity levels. However it is known that the presence of
water or some other substrate in the adsorbent can affect
its adsorbent characteristics quite dramatically. Recently
Gray et a l 8 5 '37 studied the effect of humidity on the
adsorption of alkanes in cellulose paper. Adsorption
isotherms were obtained by the peak maxima m e t h o d 3 8 . Dry
and water saturated helium carrier gas were mixed to obtain
different levels of humidity. Their results show that there
was a significant decrease in adsorption with increasing
relative humidity. This decrease in adsorption (measured as
57

Henry's constants) was assigned to a sharp reduction in
surface area available for alkane adsorption. For example
specific retention volumes (Va) were quoted for n-decane as
51.2 and 4.65cm3g _1 at humidities producing 26 and 143%
water on the adsorbent by weight respectively. This
elevenfold decrease in V g compared favourably with the
value of 11.7 for the ratio of the calculated B.E.T surface
areas calculated at the two humidities. Nelson and H a r d e r 71
commented in a study of adsorption in activated carbon that
water vapour was found in general to decrease the amount of
solute vapour adsorbed, especially of the more volatile
solutes and those soluble in water. N o n a k a 89, studied gas
solid chromatography using steam mixed with carrier gas and
noticed a marked reduction in tailing of GC peaks and of
their retention times when compared with results using dry
carrier gas. S c o t t 90 compared the adsorptive properties of
ethene and propane on alumina and showed that as the water
content of the adsorbent column increased, the polarity of
the adsorbent decreased to a point and then increased at
higher levels of water content. The polarity was measured
empirically by:
LogV.a ethene Polarity = ----------------
LogVa propane
Rudenko et a l 9 1 ’92 have studied the effect of water vapour
as a modifying component of the carrier gas in GLC and in
GSC using polymer liquid stationary phases and porous
58
polymeric sorbents respectively. They have shown that it is
possible to reduce peak tailing for polar solutes and polar
adsorbates, with possible higher chromatographic separation
when wet carrier gas is used. Notably, the effect of water
vapour on the retention properties of the porous polymeric
sorbent chromosorb-102 (unfunctionalised polystyrene based
sorbent) was negligible. Rudenko et a l 92 suggest that the
values of retention indices found from dry carrier gas
measurements on chromosorb-102 can be used with a degree of
caution for adsorption on chromosorb-102 at different
levels of humidity.
More recently Mandrov and Rude n k o 93 studied the effect of
water vapour on the sorption of nitrogen containing
compounds on p o l y (dimethylsiloxane) or OVl-stationary
phase. They showed that the sorption capacity of the GLC
column and the asymmetry of eluted peaks decreased sharply
with the use of water vapour, mixed with carrier gas. The
nature of the change in sorption characteristics was
explained by the modifying effect of water, hindering the
sorption of polar solutes on the interfaces. Measured
partition coefficients decreased significantly in changing
from dry carrier gas to humidified carrier. And with
increasing replacement of available hydrogen atoms of the
amino group by methyl groups, the asymmetry of the
chromatographic band decreased. According to the authors
this reflects a decrease in the role of specific
intermolecular interactions.
59
3.3. AIMS OF THE ADSORPTION WORK
The search for a suitable adsorbent is generally the first
step in the development of an adsorption, separation
process. The adsorption isotherm describes the uptake of
adsorbate and from this isotherm, the H e n r y ’s constant can
be obtained. Preliminary selection of a suitable adsorbent
can be made when the H e n r y ’s constants are known. More
often than not these parameters (or others) are' not known,
and it is necessary to screen a range of adsorbents in
order to obtain by experiment some particular function of
the adsorption process. This can be time consuming and may
not necessarily select the best adsorbent suitable for the
p r o c e s s . This is because there has been developed no
general method of characterising adsorbents which can
successfully predict adsorbent-adsorbate interactions for
various classes of solute and under various conditions,
such as humidity.
The main aim of the present work is to provide a general
method of characterising adsorbents, that will enable the
factors contributing to adsorption to be elucidated and
hence make it possible to predict the interactions between
adsorbate and adsorbent for compounds which the relevant
parameters are known. This is important for any application
of the adsorbent to solutes for which the adsorption
parameters have not been measured. For example, it would be
60
of considerable value if the adsorption properties of toxic
compounds could be predicted. Experimental results for a
variety of adsorbents at different relative humidities has
been sought, especially in terms of the H e n r y ’s constant
for uptake at low solute partial pressures. Analysis of the
adsorption parame ters measured (using mult iple 1 inear
regression analysis in solvatochromic equations), are
carried out to allow the factors influencing uptake to be
elucidated and conclusions to be reached as to whether or
not the particular adsorbent can act as a selective
adsorbent, and as to the role of hydrogen-bonding (if any) .
No general method of characterising adsorbents is available
along the lines outlined above. Nearly all previous work
has centred on the characterisation of one particular
adsorbent of interest and quite often with a limited data
set, not covering a wide enough range of solute types to be
considered complete. In this work adsorption measurements
have been carried out on eight different adsorbents, four
of which were studied at different relative humidities. The
number and type of solutes were carefully chosen to provide
a full range of possible adsorbent-adsorbate interactions
and a sufficient variety to- satisfy any statistical
requirements for regression analysis. Examination of the
constants in the obtained regression equation will then
yield information to enable the adsorbent to be
characterised in terms of solute or adsorbate-adsorbent
interactions.
61
3.4. THE ADSORPTION ISOTHERM & ITS CALCULATION
3.4.1. THE ADSORPTION
The adsorption of gas
adsorption isotherm,
relationship between
given temperature. It
solute (adsorbate)
concentration of the adsorbate in the unadsorbed phase (gas
in this case), hence the isotherms are partition curves.
Several types of isotherms are possible, but at low
concentrations the main three possible are concave, linear,
and convex as shown in Fig5. In this work the latter two
are observed exclusively. Various chromatographic methods
for the determination of distribution isotherms have been
described in the literature; Huber and Gerritse84 review
them and compare chromatographic methods with classical
static volumetric and gravimetric methods. Gas
c (G C ) methods are a very convenient way of
s data, due to their speed and the high
inable. Although in principle the static
for determining isotherms84 can be used as
these methods when compared with the GC
the disadvantages of being time consuming,
ler temperature range and being less precise,
the low end of the concentration range.
62
chroma tographi
obtaining thi
accuracy atta
measurements
ref e r e n c e s ,
m e t h o d s , have
having a smal
especially at
ISOTHERM
es on solids is best described by the
which describes the equilibrium
adsorbed and unadsorbed sample at a
is a plot of the concentration of the
in the • adsorbent versus the
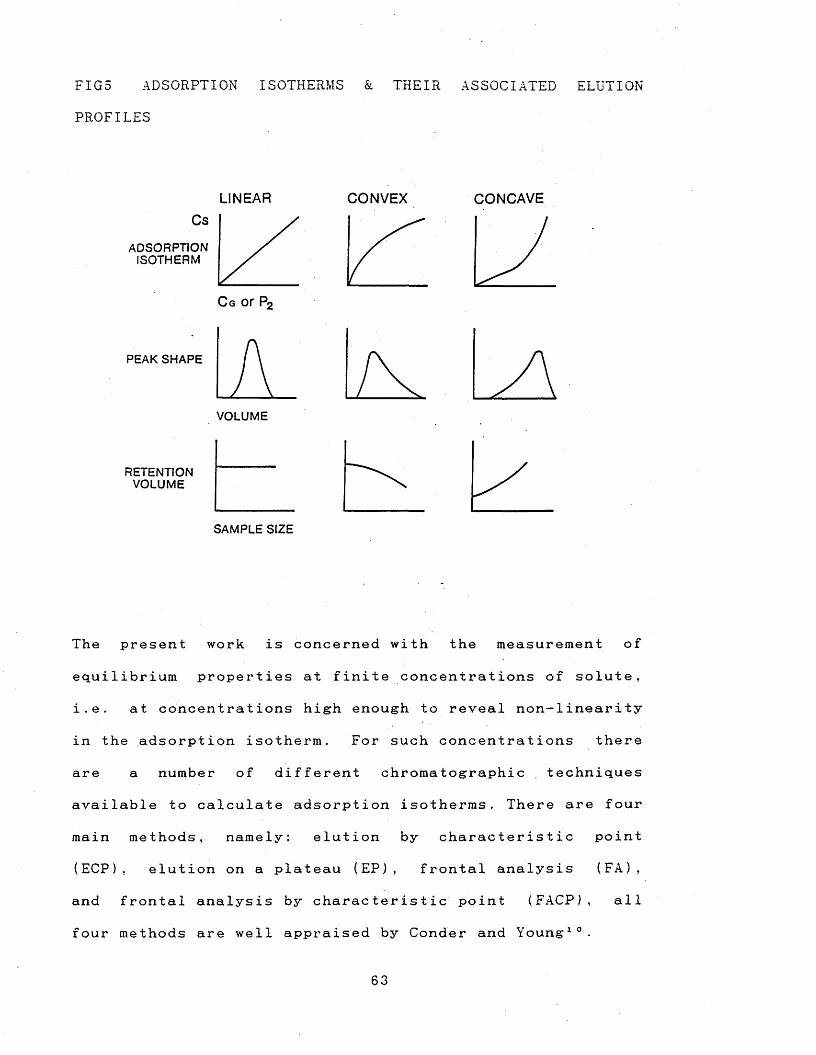
FIGS ADSORPTION ISOTHERMS & THEIR ASSOCIATED ELUTION
PROFILES
LINEAR CONVEX CONCAVECs
ADSORPTIONISOTHERM
C g or P;
PEAK SHAPE
V O L U M E
RETENTIONV O L U M E
SAMPLE SIZE
The present work is concerned with the measurement of
equilibrium properties at finite concentrations of solute,
i.e. at concentrations high enough to reveal non-linearity
in the adsorption isotherm. For such concentrations there
are a number of different chromatographic . techniques
available to calculate adsorption isotherms. There are four
main methods, namely: elution by characteristic point
(E C P ), elution on a plateau (E P ), frontal analysis (FA),
and frontal analysis by characteristic point (FACP), all
four methods are well appraised by Conder and Y o u n g 1 0 .
63
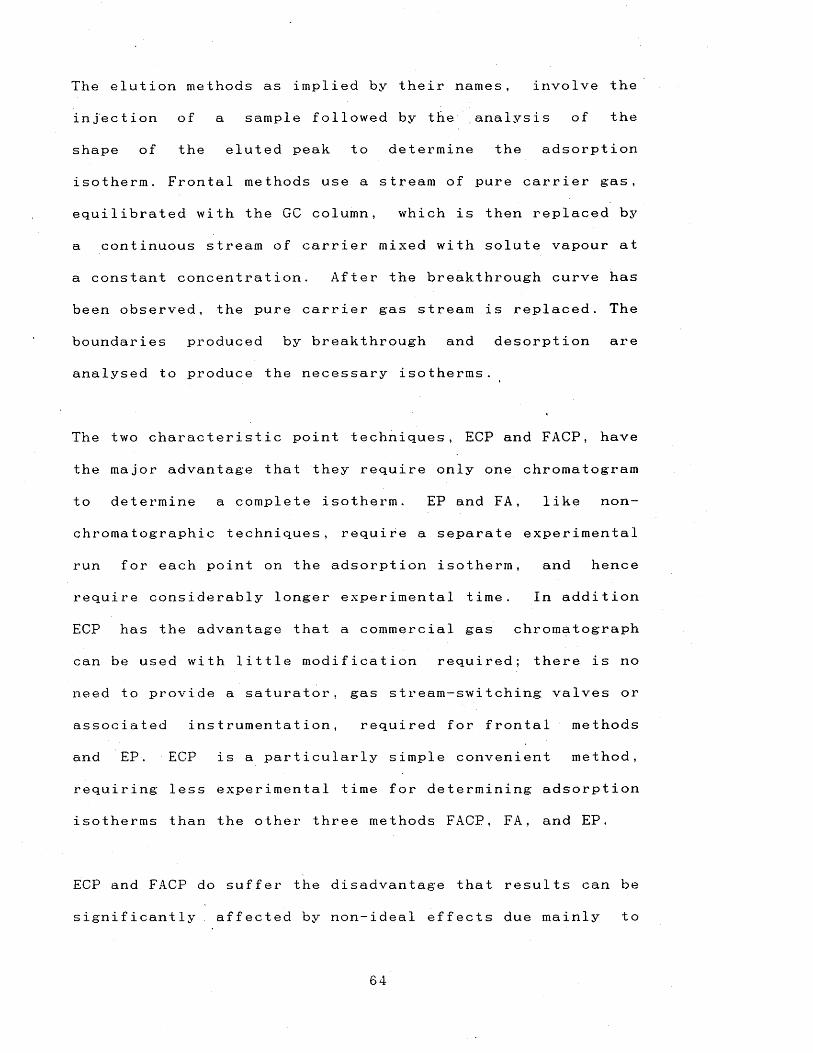
The elution method
injection of a
shape of the
isotherm. Front
equilibrated wi
a continuous s
a constant cone
been observed
boundaries
analysed to
The two characteristic point
the major advantage that the
to determine a complete is
chromatographic techniques,
run for each point on the a
require considerably longer
ECP has the advantage that
can be used with little modi
need to provide a saturator,
associated instrumentation,
and EP . ECP is a particul
requiring less experimental
isotherms than the other thr
ECP and FACP do
significantly
their names, involve the
by the analysis of the
determine the adsorption
stream of pure carrier gas,
which is then replaced by
mixed with solute vapour at
the breakthrough curve has
ier gas stream is replaced. The
akthrough and desorption are
ssary isotherms.
ECP and FACP, have
chromatogram
like non-
experimental
and hence
In addition
chromatograph
there is no
valves or
me thods
m e t h o d ,
orpt i on
EP.
can be
nly to
s as implied by
sample followed
eluted peak to
al methods use a
th the GC column,
tream of carrier
entration. After
, the pure carr
produced by bre
produce the nece
techniques,
y require only one
otherm. EP and FA,
require a separate
dsorption isotherm,
experimental time,
a commercial gas
fication required;
gas stream-switching
required for frontal
arly simple convenient
time for determining ads
ee methods FACP, FA, and
suffer the disadvantage that results
affected by non-ideal effects due mai
64
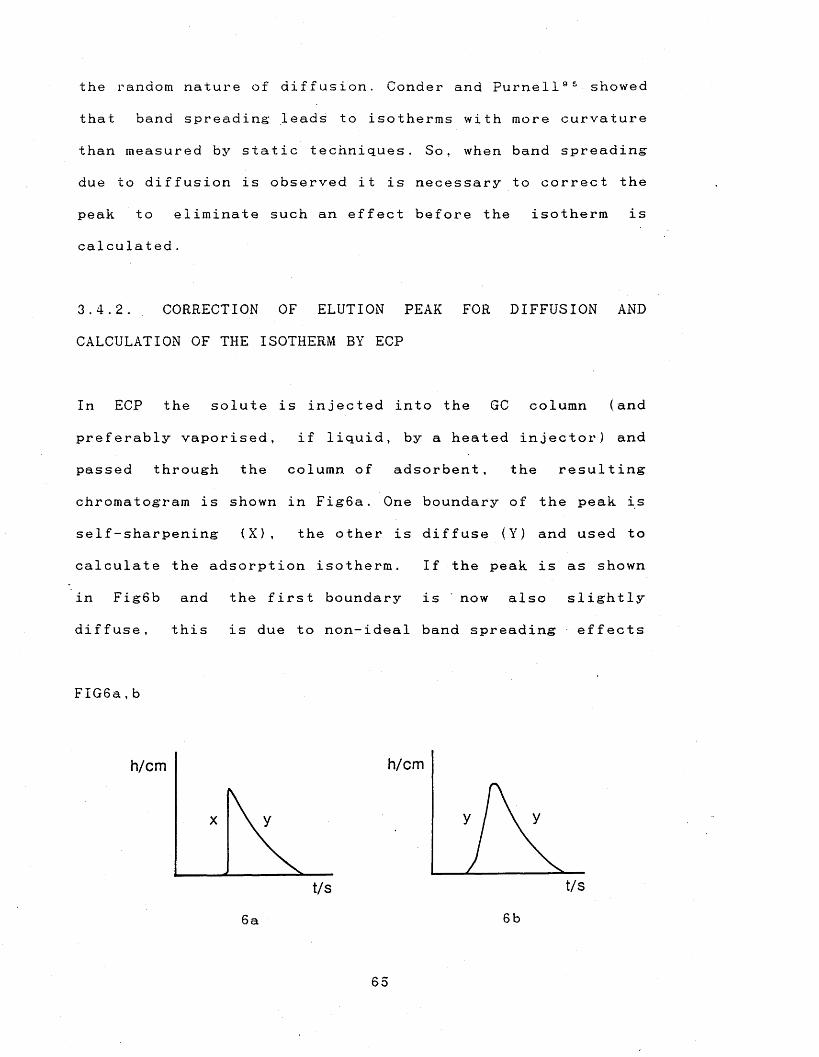
the random nature of diffusion. Conaer and P u r n e l l 80 showed
that band spreading- leads to isotherms with more curvature
than measured by static techniques. So, when band spreading
due to diffusion is observed it is necessary to correct the
peak to eliminate such an effect before the isotherm is
calculated.
3.4.2. CORRECTION OF ELUTION PEAK FOR DIFFUSION AND
CALCULATION OF THE ISOTHERM BY ECP
In ECP the solute is injected into the GC column (and
preferably vaporised, if liquid, by a heated injector) and
passed through the column of adsorbent, the resulting
chromatogram is shown in Fig6a. One boundary of the peak is
self-sharpening (X), the other is diffuse (Y) and used to
calculate the adsorption isotherm. If the peak is as shown
in Fig6b and the first boundary is " now also slightly
diffuse, this is due to non-ideal band spreading effects
F I G 6 a ,b
h/cm h/cm
t/s t/s
6a 6b
65
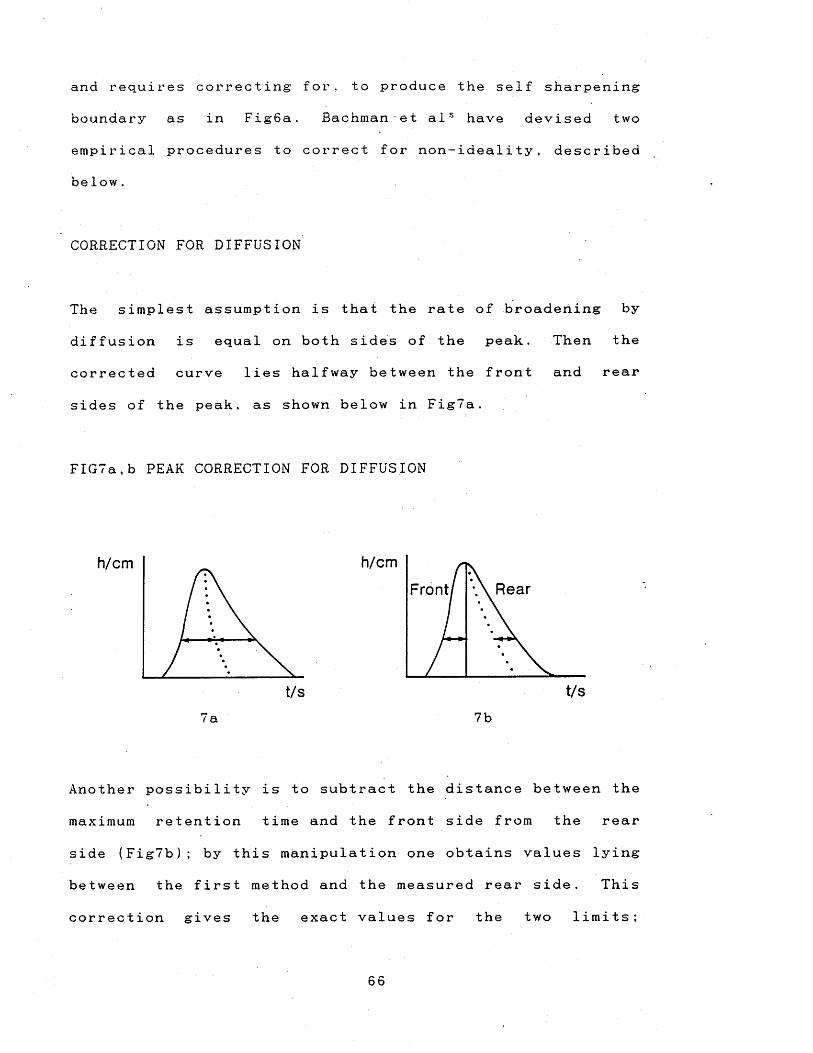
and requires correcting for. to produce the self sharpening
boundary as in FigSa. Bachman et a l 5 have devised two
empirical procedures to correct for non-ideality, described
below.
CORRECTION FOR DIFFUSION
The simplest assumption is that the rate of broadening by
diffusion is equal on both sides of the peak. Then the
corrected curve lies halfway between the front and rear
sides of the peak, as shown below in Fig7a.
FIG7a ,b PEAK CORRECTION FOR DIFFUSION
h/cm
\ \ RearFront
h/cm
t/s t/s
7a 7b
Another possibility is to subtract the distance between the
maximum retention time and the front side from the rear
side (Fig7b); by this manipulation one obtains values lying
between the first method and the measured rear side. This
correction gives the exact values for the two limits;
66
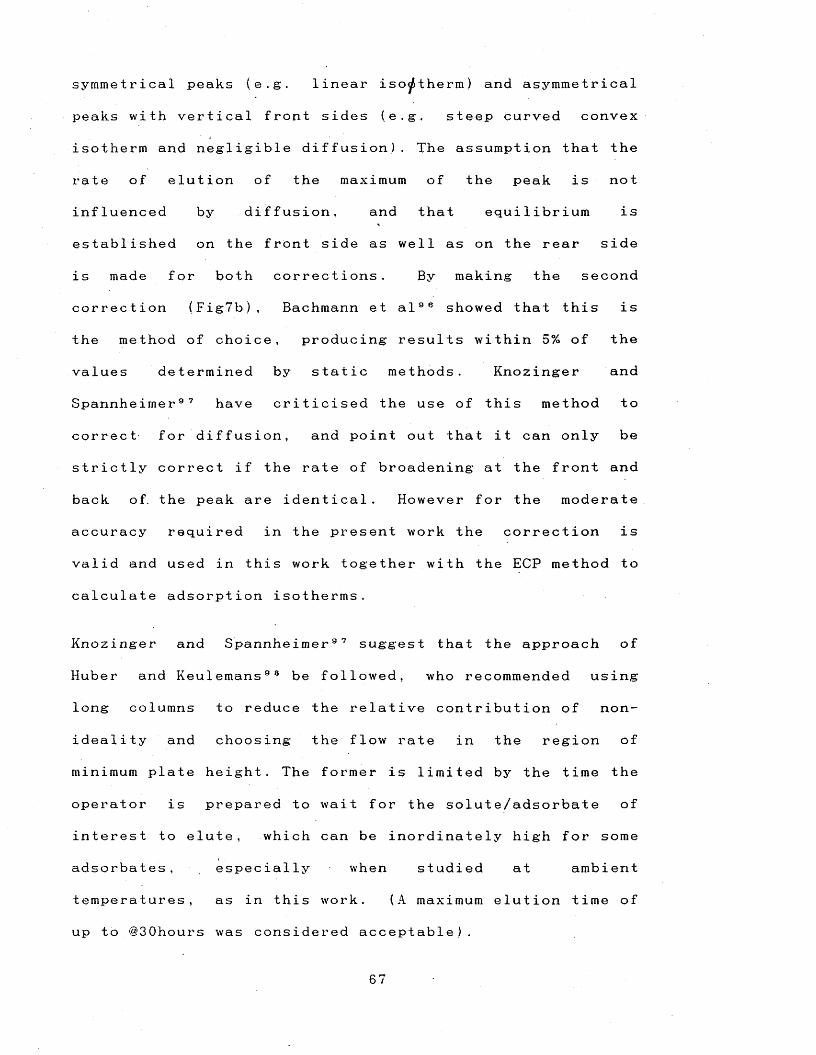
symmetrical peaks (e.g. linear iso^therm) and asymmetrical
peaks with vertical front sides (e.g. steep curved convex
isotherm and negligible diffusion). The assumption that the
rate of elution of the maximum of the peak is not
influenced by diffusion, and that equilibrium is
established on the front side as well as on the rear side
is made for both corrections. By making the second
correction (Fig7b), Bachmann et a l 9e showed that this is
the method of choice, producing results within 5% of the
values determined by static methods. Knozinger and
Spannheimer97 have criticised the use of this method to
correct for diffusion, and point out that it can only be
strictly correct if the rate of broadening at the front and
back of. the peak are identical. However for the moderate
accuracy required in the present work the correction is
valid and used in this work together with the ECP method to
calculate adsorption isotherms.
Knozinger and Spannheimer97 suggest that the approach of
Huber and Keulemans98 be followed, who recommended using
long columns to reduce the relative contribution of n o n
ideality and choosing the flow rate in the region of
minimum plate height. The former is limited by the time the
operator is prepared to wait for the solute/adsorbate of
interest to elute, which can be inordinately high for some
adsorbates, especially when studied at ambient
temperatures, as in this work. (A maximum elution time of
up to @30hours was considered acceptable).
3.4.3. LANGMUIR ADSORPTION ISOTHERM
The adsorption of gases on solids can mostly be describe.d
by the Langmuir9 9 adsorption isotherm, see eqn35, where Cs
is the concentration of solute adsorbed on the solid {gg~
M , and P 2 is the partial pressure (atm) of the solute in
the gas phase. The Langmuir isotherm occurs when the solute
adsorption is on the most active sites first and the ease
with which adsorption takes place decreases until the
monolayer is complete, when all the adsorption sites are
occupied. A typical Langmuir adsorption isotherm is shown
in FiglO. If the concentration of the solute in the gas
phase is measured by, C g (gl-1), instead of P 2 , an entirely
analogous equation may be set up, because C e is linearly
related to P 2 , see eqn36. The terms S and B in eqn35 have
been given a variety of symbols but are always referred to
S . B . P 2Cs = ---------- (35)
1 + B . P 2
C g .R .Tp 2 = ------- (36)
M 2
as the Langmuir capacity constant and the Langmuir affinity
parameter. The capacity constant gives the amount of solute
required to cover the surface of one gram of solid with a
unimolecular surface layer. The combined term, 1/S.B, is
actually the Henry's constant K HP , and is found by
measuring the slope of the plot of Cs against P 2
68
(adsorption isotherm.) as P 2— >0 . Also the H e n r y ’s constant
K Hc can be found by plotting- Cs against Cg as Cg >0 . For
adsorption on a homogeneous surface at sufficiently low
concentrations, such that all adsorbate molecules are
isolated from each other, the equilibrium relationship
between gas phase and adsorbent is constant over a range of
concentrations, known as the "He n r y ’s region". This linear
relationship between P 2 or Cg and Cs is known as H e n r y ’s
law, by analogy with the limiting behaviour of the
solubility of gases in liquids. The constant of
proportionality is referred to as the H e n r y ’s constant. We
have therefore, the equations:
( P 2 / C s ) p 2 — >0 = K % (37)
(C g/C s )c g— >0 = K Hc (38)
Eqn35 can be rearranged to give eqn39, so that a plot of
P 2 /CS against P 2 will have a slope of 1/S and an intercept
of 1/S.B. In principle, values of the slope and intercept
may be combined to give the parameter B, but in practice it
is not very accurate to use the intercept of this plot to
obtain 1/S.B or K HP . A better method is to use a plot of Cs
against P 2 at low partial pressure to obtain K HP , and to
combine the value of S.B thus found with the value of S
from the P 2/CS against P 2 plot, to obtain B.
P 2 1 P 2 = --- + — (39)Cs S.B S
69
It should be noted that although S and B are interesting
parameters, it is the combined parameter 1/S.B, or K HP ,
that reflects the adsorbance of the solute gas or vapour at
low partial pressures.
The work presented here uses the elution by characteristic
point method (ECP), sometimes known as the peak profile
m ethod8 8 ’9 4 ’9 8 ’9 8 '10 0 , to calculate adsorption isotherms.
The chromatographic peak observed on injection of a solute
sample is corrected for diffusion (if necessary) as shown
in Fig8 and Fig7b, and then a series of areas, A h ,
corresponding to the recorder pen deflections, h, are
obtained (see Fig9). Cs is calculated from the area on the
chart recorder (Ah ) and C g , from the recorder pen
deflection (h), using known equations. The area, A h , is
proportional to the volume of carrier gas required to elute
the adsorbate (at the point on the elution curve at height,
h, this is the so called characteristic point), which is in
turn proportional to the time spent in the adsorbent, i.e.
the concentration in the adsorbent, C s . The pen deflection,
h, is proportional to the number of adsorbate molecules
passing through the detector at that particular moment
(assuming detector linearity with the concentrations
studied), which is proportional to the concentration in the
gas phase, C g , or the partial pressure, P 2 . Cs and Cg are
given by:
70
Cs = A h/S .Wi
C g = h.Q/F.S
(40)
(41.)
Where, S, is the sensitivity, defined as the area under the
uncorrected peak divided by the amount of sample injected,
Wi is the active weight of adsorbent (i.e. the dry weight
after purging in g ) , Q is the chart recorder speed, and F
is the carrier gas flow rate (Is-1 ) at column temperature,
T (K). The isotherm is calculated using eqns40,41 above,
from points on the appropriate boundary (i.e. the diffuse
boundary following the sharp front boundary).
From the ratios of A h/h, values of C s / P 2 or Cs/Cg are
calculated via known eqns42 and 43 respectively. Where, Pa,
is the solute partial pressure (atm), M 2 , is the solute
molecular weight (g), and R, is the gas constant taken as
8.2056*10-2latmmol-1d e g - 1 .
(Note eqns42 and 43 are simply related by e q n 3 6 ) .
Cs A h .F .M2 = ------------ (42)P 2 h.Wx.Q.R.T
Cs A h .F— = ------- (43)Cg h.Wi.Q
71
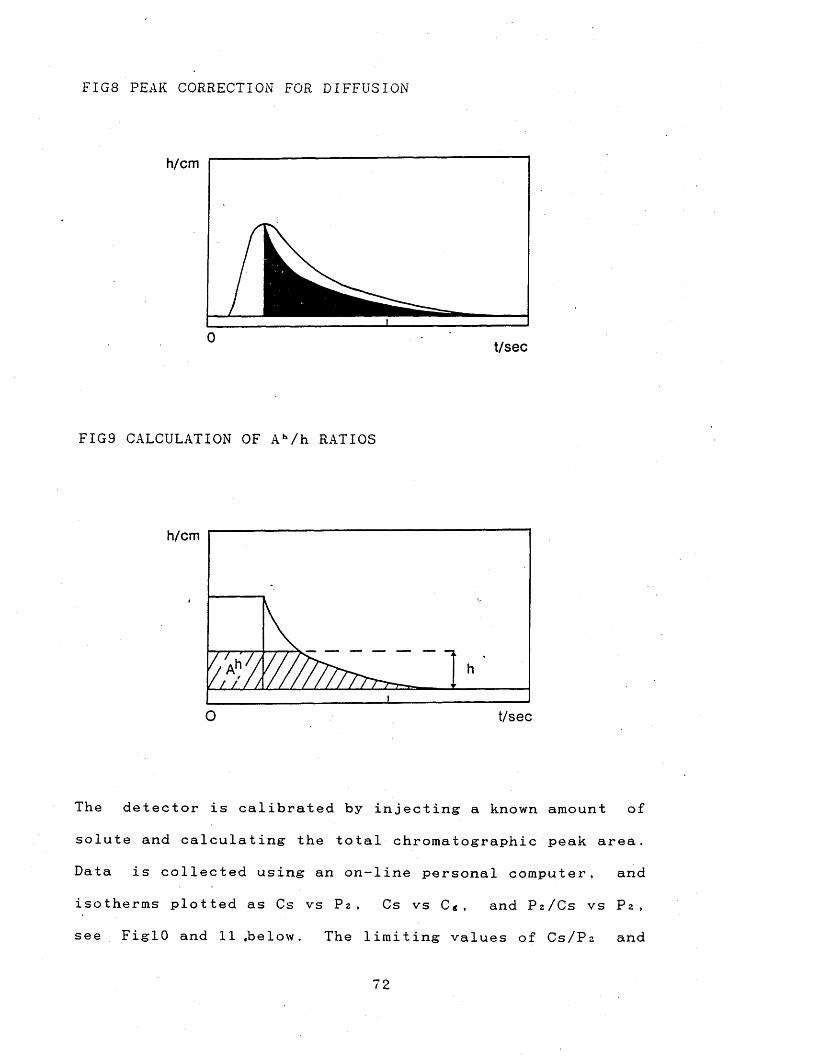
FIG8 PEAK CORRECTION FOR DIFFUSION
h/cm
0 t/sec
FIG9 CALCULATION OF A h/h RATIOS
h/cm
O t/sec
The detector is calibrated by injecting a known amount of
solute and calculating the total chromatographic peak area.
Data is collected using an on— line personal computer, and
isotherms plotted as Cs vs P 2 , Cs vs C g , and P 2 /CS vs P 2 ,
see FiglO and 11 .below. The limiting values of Cs/Pa and
72
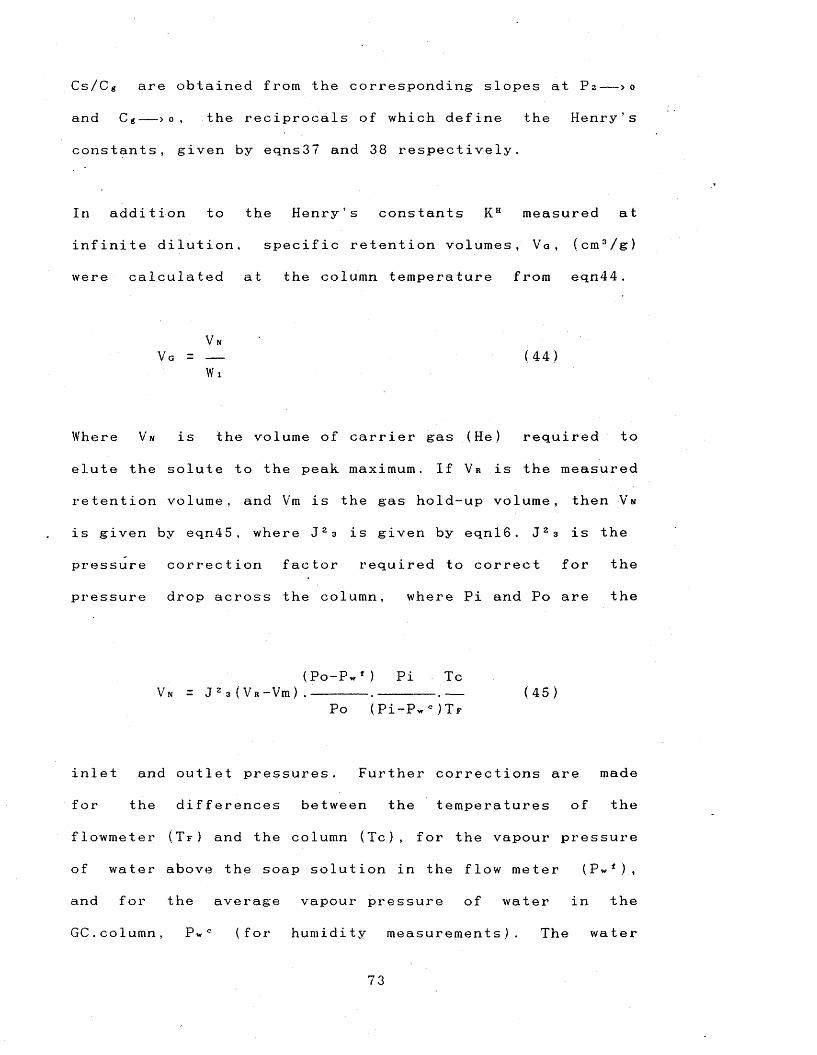
Cs/Cg are obtained from the corresponding slopes at P 2 — >0
and Cg— >0 , the reciprocals of which define the H e n r y ’s
constants, given by eqns37 and 38 respectively.
In addition to the H e n r y ’s constants K H measured at
infinite dilution, specific retention volumes, Va, (cm3/g)
were calculated at the column temperature from e q n 4 4 .
V nVa = -- (44)
W 1
Where Vn is the volume of carrier gas (He) required to
elute the solute to the peak maximum. If Vr is the measured
retention volume, and Vm is the gas hold-up volume, then Vn
is given by e q n 4 5 , where J 23 is given by eqnl6. J 23 is the
pressure correction factor required to correct for the
pressure drop across the column, where Pi and Po are the
(Po-PwM Pi TcVn = J 2 3 ( V r - Vm ) . --- .--------.— (45)
Po (Pi-Pw c ) T f
inlet and outlet pressures. Further corrections are made
for the differences between the temperatures of the
flowmeter (Tf ) and the column (Tc), for the vapour pressure
of water above the soap solution in the flow meter (Pwf ),
and for the average vapour pressure of water in the
GC.column, P»' (for humidity measurements). The water
73
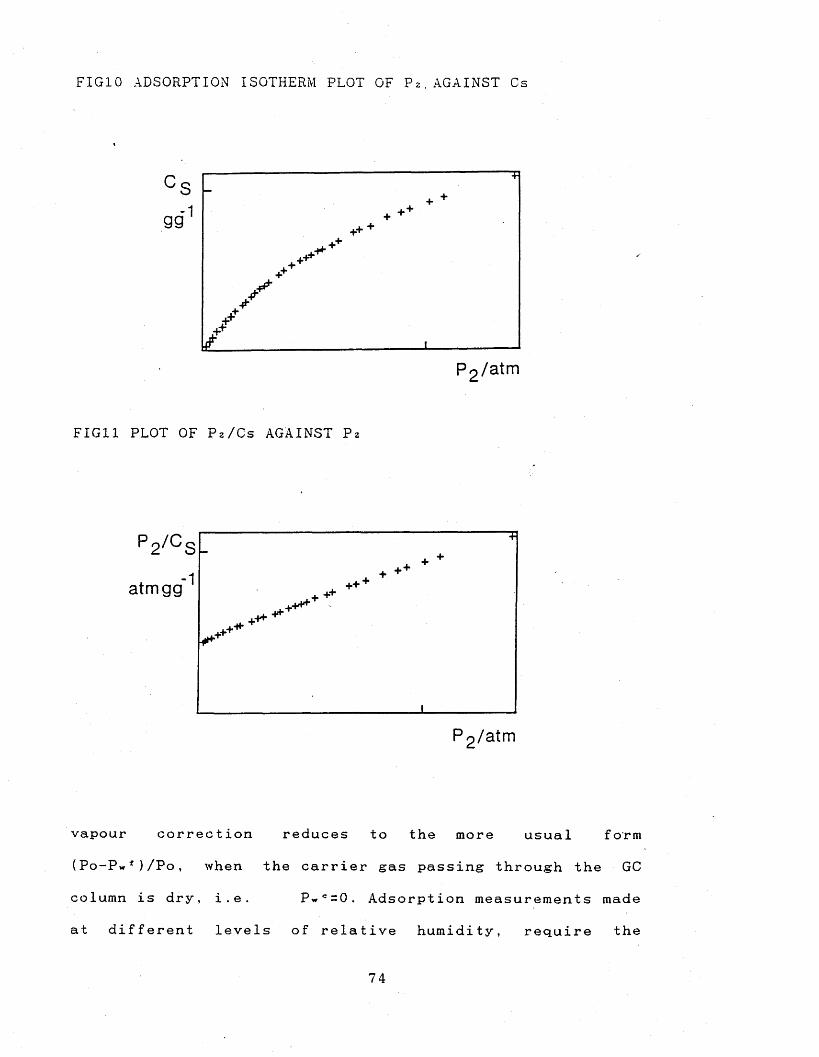
FIG10 ADSORPTION ISOTHERM PLOT OF P 2. AGAINST Cs
s-1gg
P9/atm
FIGll PLOT OF Pz/Cs AGAINST P 2
P n / C
++atmgg
vapour correction reduces to the more usual form
(Po-Pwf )/Po, when the carrier gas passing through the GC
column is dry, i.e. P w c=0. Adsorption measurements made
at different levels of relative humidity, require the
74
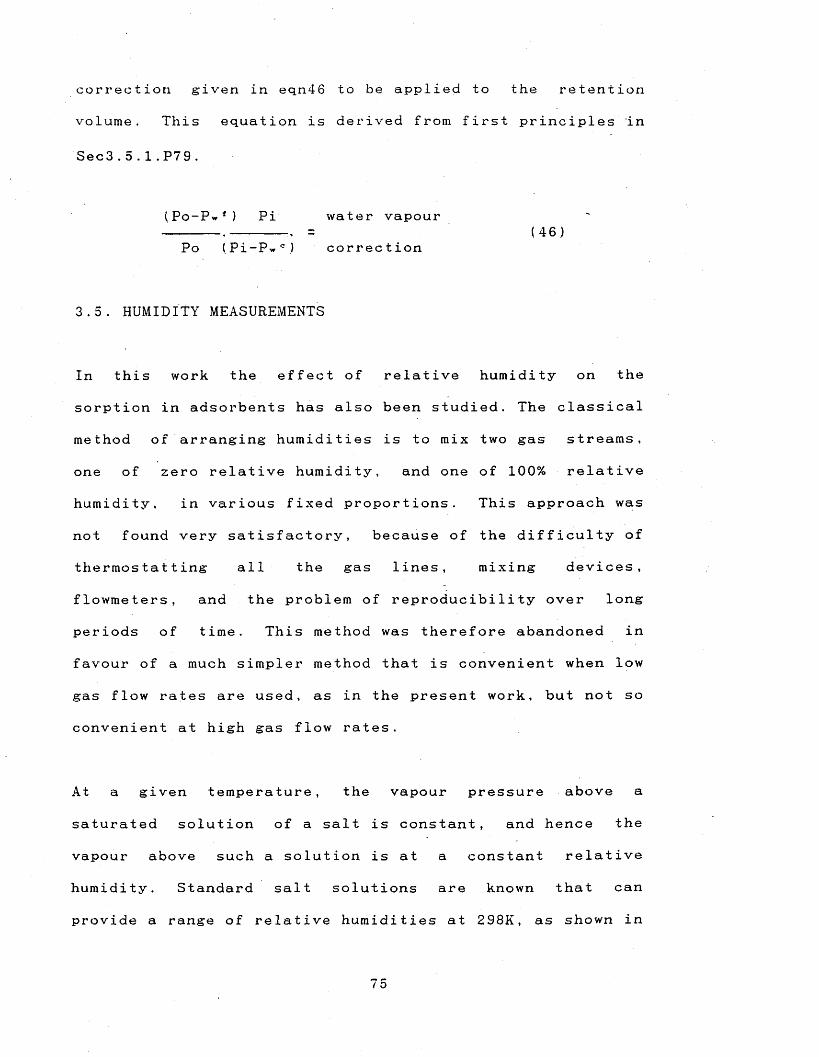
correction given in eqn46 to be applied to the retention
volume. This equation is derived from first principles in
S e c 3 .5.1.P7 9 .
P o - P w 1 ) Pi water vapour------ .------- -. = (46)Po (Pi-Pwc ) correction
3.5. HUMIDITY MEASUREMENTS
In this work the effect of relative humidity on the
sorption in adsorbents has also been studied. The classical
method of arranging humidities is to mix two gas streams,
one of zero relative humidity, and one of 1 0 0 % relative
humidity, in various fixed proportions. This approach was
not found very satisfactory, because of the difficulty of
thermos tatting all the gas lines, mixing devices,
flowmeters, and the problem of reproducibility over long
periods of time. This method was therefore abandoned in
favour of a much simpler method that is convenient when low
gas flow rates are used, as in the present work, but not so
convenient at high gas flow rates.
At a given temperature, the vapour pressure above a
saturated solution of a salt is constant, and hence the
vapour above such a solution is at a constant relative
humidity. Standard salt solutions are known that can
provide a range of relative humidities at 298K, as shown in
/ o
Table2. Usually, vapour streams are equilibrated by
bubbling them through the saturated salt solution using a
sintered disc to obtain rapid equilibration. The sintered
discs and even small-bore tubing (id 4mm), unfortunately
became blocked over a period of days by evaporation of the
saturated solution. To counter this effect the helium
vapour stream was equilibrated by bubbling through three
successive wash bottles containing a given saturated salt
solution, using rather wide-bore glass tubing (id 14mm) in
the gas wash bottles. In the apparatus constructed
(Fig24.P240) all inlet lines, including wash bottles, were
immersed in a liquid thermostat bath together with the GC
columns, with the bath temperature regulated to
298.1 5 ± 0 .0 5 K . This provides a very satisfactory
equilibration method, although othe.r problems arise at high
relative humidities.
Ideally, if the pressure were constant through the GC
column, the relative humidity (R H ) would be the same at
each position along the column. In practice, the pressure
drop across the column results in higher relative humidity
at the inlet than at the outlet. The average partial
pressure of water in the column (P*c ) is given by eqn47,
where P * c is the water vapour pressure in the carrier gas
at the inlet of the GC column or in the humidifier.
76

TABLE2 RELATIVE HUMIDITIES ABOVE SATURATED SALT SOLUTIONS
AT 2 9 8 K 101
Solid Phase Relative Humidity %
K 2 Cr 2 0 7
K 2 SO 4
KNOs
KCL
KBr
NaC L
NaNOs
N a N 0 2
N a B r .2H 20
N a z C r 2 O 7 .2H2O
Mg (N O 3)2 .6H2O
K 2 C O 3 .2H2O
M g C L 2 .6H2O
K C 2 H 3 O 2 .(1 .5H 20 )
L i C L .H2O
KOH
98 . 0
97
92 . 5
84 . 3
80 . 7
7 5,. 3
73.8
65
57 . 7
54
52. 9
42.8
33 . 0
22 . 5
10.2
8
PoP w c = P w c .--------- ( 4 7 )
P i . J 2 3
The water vapour pressure in the carrier gas at the end of
the GC column P ’w° was measured periodically by passing the
eluent gas stream through a U-tube containing a 50:50 mix
of Linde 4A molecular sieve and dry calcium chloride, and
noting the change in weight with time. The average partial
pressure of water in the column is given by e q n 4 8 .
P i .J 2 3= p* w« .------ (48)
Po
The values calculated by eqn47 assume that the carrier gas
is completely saturated to the relative humidity produced
by the salt solution. If this is not the case, values of
P » c found from eqn48, using measured values of P ’w c , will
be slightly less than predicted using e q n 4 7 . The average
relative humidity in the column (RH) is given by eqn49,
where the SVP is the saturated vapour pressure of water at
P w CRH = --- *100 (49)
S V P
column temperature. To avoid any significant variation in
RH along the column the pressure drop across the column
should be kept to a minimum.
78
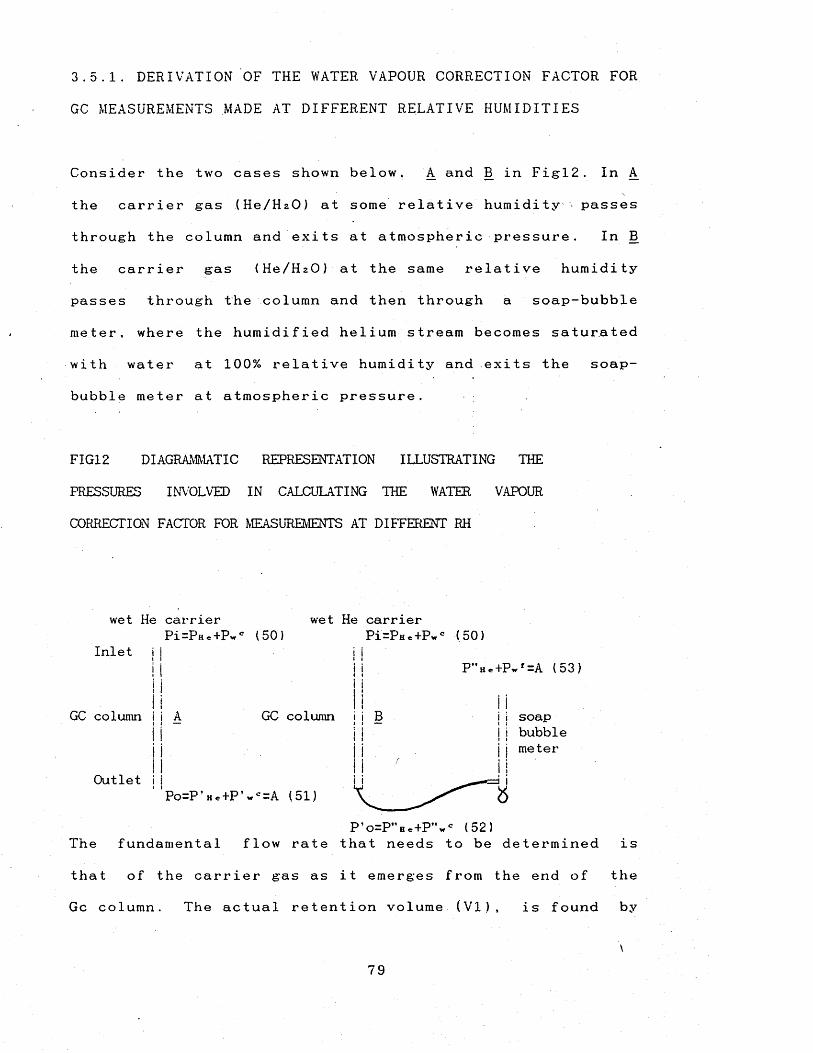
3.5.1. DERIVATION OF THE WATER VAPOUR CORRECTION FACTOR FOR
GC MEASUREMENTS MADE AT DIFFERENT RELATIVE HUMIDITIES
Consider the two cases shown below, A and B in Figl2. In A
the carrier gas (He/HzO) at some relative humidity passes
through the column and exits at atmospheric p r e s s u r e . In B
the carrier gas (He/HzO) at the same relative humidity
passes through the column and then through a soap-bubble
meter, where the humidified helium stream becomes saturated
with water at 100% relative humidity and exits the soap-
bubble meter at atmospheric pressure.
The fundamental flow rate that needs to be determined is
that of the carrier gas as it emerges from the end of the
Gc column. The actual retention volume (VI), is found by
FIG12 DIAGRAMMATIC REPRESENTATION ILLUSTRATING THE
PRESSURES INVOLVED IN CALCULATING THE WATER VAPOUR
CORRECTION FACTOR FOR MEASUREMENTS AT DIFFERENT RH
wet He carrierP i = P H e + P w C (50)
Inlet i j
wet He carrierP i = P He+ P w c (50
t ii i PMHe+Pwf=A (53)
GC column i i A, i — GC column i i B i i soap i i bubblet ij j metert t
Outlet i i
P ,o = P " h * + P " w c (52)
79

correcting: the measured retention volume (V2) by some
correction factor (C F ), i.e. V1=CF.V2.
The eqns50-53 shown in Figl2 and below describe how the
pressure at that' point in the apparatus is made up.
Pi = P h* + Pw °Po = A = P ’He + P ’w c
P ’O = P" H e + P " w c
A = P " H e + P w f
Using B o y l e ’s law, we h a v e :—
P1V1 = P2V2
i.e. PoVl = P ’oV2
Using eqnsSl & 52
AVI = (P”He + P"w«)V2 (56)
Using eqn53
AVI = (A - P w f + P m w c )V2 (57)
P " HeNow, P " w c = .Pwc , by comparison (58)
P h.
Using eqns5 0 & 5 3
( 5 4 )
( 5 5 )
( 5 0 )
( 5 1 )
( 5 2 )
( 5 3 )
80
> c —(A - P w M P ,
Pi - P .
Substituting eqn59 into eqn57
(A - P » 1 ) P w c A V I = [ A - P w 1 + ----- =---------- ] . V 2
{P i - P w c )Rear ranging
( 5 9 )
( 60 )
(A - P w f ) P iV I = --------------.--------■----. V 2
A ( P i - P w c )(61)
So the correction factor is now given by: —
CF =(Po - P w f )
Po
Pi
( P i - P w c )( 6 2 )
SPECIAL CONDITIONS OF EQN62
If the carrier gas flowing through the GC column is dry
i.e. P w c = 0 (the normal c a s e ) , the CF in eqn31 reduces to
eqn32, which is the normal correction quoted w i d e l y 1 0 .
CF =(Po - P w f )
Po( 6 3 )
The other limiting case is when P w f = P w c , this might be
thought the case when carrier gas' saturated at 100%
relative humidity is passed through the GC column. However
81
for P w f to equal P w c , Po must also equal P i , and the
correction factor reduces to unity, i.e. there is no
correction. Po must equal P i for this condition, because if
there is a pressure drop across the column then P w ° at the
inlet of the column (for 100% relative humidity) will also
drop to P " w c and will not be equal to P w f . Infact it will
be slightly lower. So even when 100% relative humidity
adsorption measurements are made, it is necessary to apply
a correction for the water vapour pressure'. Theoretically
it is possible for P » f to equal P w c , but not practically.
Pi = Inlet pressure
Po = Outlet pressure
P w c = Vapour pressure of water at the column inlet
P w f = Vapour pressure of water in the flow meter,
which sensibly is equal to the vapour
pressure of water at 100% relative humidity
at the flowmeter temperature.
P h e = Vapour pressure of helium
A = Atmospheric pressure
V = volume of helium
3 . 6 PRACTICAL CONSIDERATIONS FOR ADSORPTION MEASUREMENTS
3.6.1. FLOW RATE
To minimise the effects of non-ideality the flow rate
corresponding to minimum height of equivalent theoretical
plate (H) and the longest column practicable should be
used. Increasing the length of the column actually reduces
the relative contributions of non-ideality. Eqn64 shows
that the ratio of the retention volume (V n ) and the band
spreading ( cr) is equal to the square root of the number of
plates (N ) .
V N— = VN (64)cr
To minimise the disturbing influence of non-ideality on
the shape of the elution peak, the ratio V n / ct must be
high, i.e. the columns should be as long as possible. The
length of the column is limited by pressure drop
considerations and the time considered reasonable to wait
for the solutes to elute from the column. In considering
the pressure drop across the GC column, the particle size
is critical. It has been shown that the pressure drop is
inversely proportional to the square of the par t ic1e
diameter, so increasing the particle size can have a large
effect in lowering the pressure drop.
83
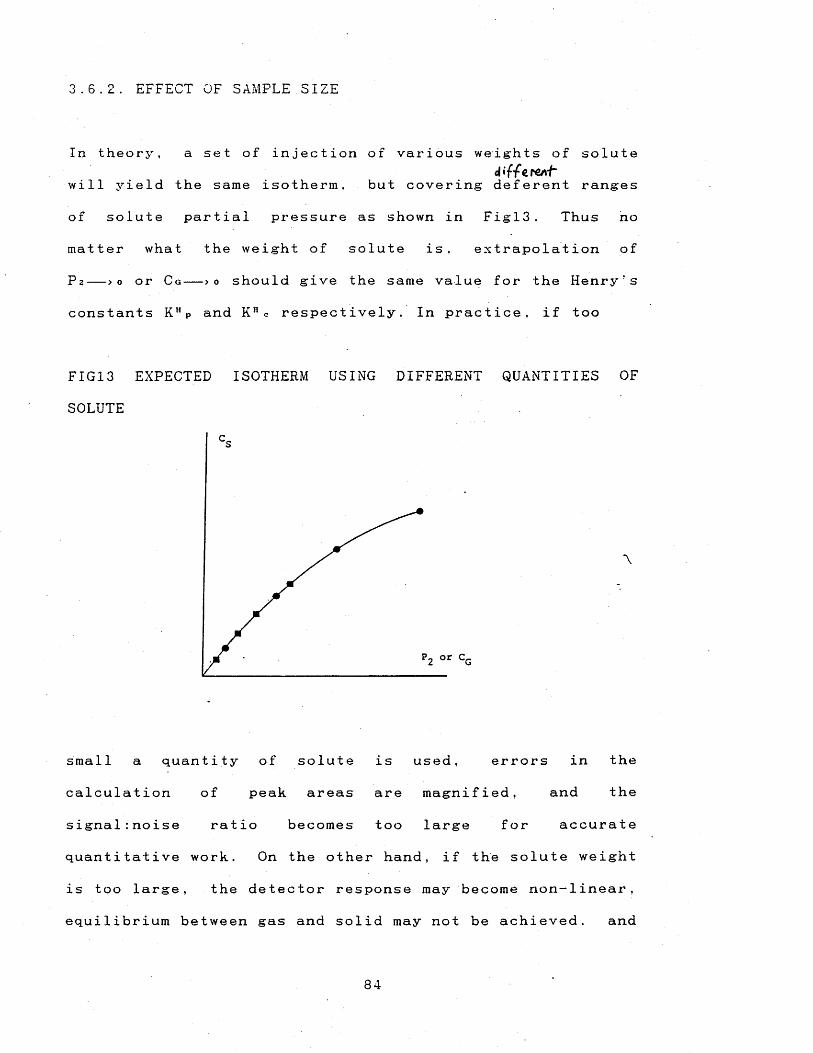
3.6.2. EFFECT OF SAMFLE SIZE
In theory, a set of injection of various weights of soluted«'ffe reA-h
will yield the same isotherm, but covering deferent ranges
of solute partial pressure as shown in Figl3. Thus no
matter what the weight of solute is, extrapolation of
P 2 >0 or C g >0 should give the same value for the Henry's
constants K HP and K H c respectively. In practice, if too
FIG13 EXPECTED ISOTHERM USING DIFFERENT QUANTITIES OF
SOLUTE
or C.
small a quantity of solute is used, errors in the
calculation of peak areas are magnified, and the
signal:noise ratio becomes too large for accurate
quantitative work. On the other hand, if the solute weight
is too large, the detector response may become non-linear,
equilibrium between gas and solid may not be achieved. and
84
flow rates may be disturbed on injection. For a given
experimental arrangement, there will therefore be a range
of solute weights or partial pressures that gives the same
correct Henry's constant.
3.6.3. THERMODYNAMICS AND KINETICS OF ADSORPTION
Adsorption is governed by the thermodynamic equation,
A G = A H - T .AS (65)
Adsorption reduces the imbalance of attractive forces which
exists at a surface, and hence the surface free energy of
the system. Adsorption from the gas phase results in a loss
of three degrees of translational freedom, assuming that
the adsorbate possesses negligible translational freedom.
This means the change in entropy A S must be negative,
therefore, A H must be negative for the adsorption process
to take place spontaneously (i.e. negative A G . All gas or
vapour adsorptions are exothermic, except in a few rare
c a s e s .
These thermodynamic quantities can be determined from GC
measurements, through a plot of LnfVn/T) vs. 1/T, the slope
of which is -AH/R. Calorimetric methods are more accurate
but this chromatographic method is widely used.
85
Both the equilibrium extent of adsorption and rates of
adsorption/desorption are capable of markedly affecting-
chromatographic separation. In practice adsorption/
desorption in gas chromatography is necessarily a fast
process (i.e. equilibrium is established q u i c k l y ) , because
if this were not the case the sample would simply pass
through the column without adsorption taking place. This
can be a problem with very fine pore adsorbents such as
zeolites, but it can normally be assumed that
adsorption/desorption rates will be fast, so apart from
adsorbents whose fine pore size can limit rates, the
kinetics is not very interesting, and will not be discussed
any f u r t h e r .
3.7. ANALYSIS OF ADSORPTION PARAMETERS
Adsorption isotherms have been determined by the GC ECP
technique for a series of organic solutes (.20-30
representing a wide range of solute types) on eight
different adsorbents, three of which were activated carbons
and five porous polymers. Values of the limiting Henry's
constants, K HP and K HC , have been calculated from the
isotherms and the specific retention volumes, Va, at the
column temperature, have also been determined. Adsorption
results have been analysed by the method of multiple linear
regression using eqnsTS & 73, as detailed in Sec4.1.P88,
the preferred such equation being eqn75. The sorption
86
properties (S P ) used in the regression equations were
-LogKHc ,-LogKuP , and L o g V a . An important feature of eqns75
& 73, is not only the correlation of known values of S P ,
but the pos sibility of predic t ing SP values for o ther
solutes that are not easily studied practically.
There has been no previous application of any general
equation such as eqn75 to the problem of prediction of
adsorption of gases or vapours on solids, and so results of
the present application cannot be compared to any former
s t u d y .
4.1. LINEAR SOLVATION ENERGY RELATIONSHIPS (L S E R ) AND THEIR
USE IN MULTIPLE REGRESSION ANALYSIS (M R A )
Over the past few years, Abraham, Doherty, Kamlet, Taft and
co-workers1 0 2 ’100 have constructed equations for the
correlation . and prediction of a large number of
physicochemical and biochemical phenomena, using the
principle of LSER reviewed by Kamlet et a l 104. Kamlet and
T a f t 105 have reviewed and referenced the widely different
types of correlation carried out up until about the end of
1985. The type of correlations have varied from
correlations of reaction rates in different solvents to
the solubility of solutes in blood. These equations are
based upon a cavity theory of solution, in which the
process of dissolution of a solute in a solvent may be
broken down into a number of hypothetical steps: (i) the
endoergic formation of a cavity in the bulk solvent, (ii)
rearrangement of solvent molecules around the cavity, and
{ i i i .) the exoergic interaction of the solute with the
surrounding solvent molecules after the solute has been
inserted into the cavity. If the Gibbs energy change in
step {i i ) is zero, or very nearly zero, as is usually
assumed, only steps (i) and ( i i i .) need be modelled. The
energy of formation of a cavity can be taken as
proportional to the Hildebrand cohesive energy
density1 0 8 ’107, (o h 2 ) i , where 5 h is the Hildebrand
solubility parameter, and to some function of the solute
88
size, or volume, V 2 ,‘ leading to a term iou2 )i.V 2 with the
units of energy. With the introduction of the solute into
the cavity in step (iii), various solvent-solute
interactions can take place (normally exoergic) depending
on the nature of both the solvent and solute. Hydrogen-bond
acid/base interactions will be set up if the solvent is a
hydrogen-bond acid (ai) and the solute is a hydrogen-bond
base (fta), or if the solvent is a hydrogen-bond base (]3i)
and the solute is a hydrogen-bond acid (az) the two
respective hydrogen-bond terms are ai.$z and {3i.az. In
these two terms, ai and refer to the solvent hudrogen-
bond • acidity and basicity, and az and ftz to the solute
hydrogen-bond acidity and basicity respectively. In
addition there may be dipolar interactions (dipole-dipole
and dipole-induced dipole), between a polar/polarisable
solvent (tg*i) and a polar/polar isable solute {it* z) , the
term corresponding to polar interaction is tc*i.tc*2 . In this
term tc* 1 and tc* 2 are measures of the solvent and solute
dipolarity/polarisability respectively.
The full general equation which has been used extensively
by Abraham and co-workers for the correlation of some
solubility related property, S P , is given by the multiple
linear regression (MLR) equation:
+ Note that solvent properties are denoted by the subscript
1 and solute properties by the subscript 2. This
nomenclature is held throughout the thesis.
89
Log SP = SPo + A . t c * i . t c * 2 + B.ai.fta + C'. i .az + D . ( o h 2 ) i . V 2 (66)
where, A, B, C, and D are constants which are are dependent
upon the solvent or solute dependent property be ing
regressed in the MLR and not the individual solutes or
solvents.
For the case in which a process involving the solubility
property of a single solute in a series of solvents, tc*2 ,
£ 2 , a 2 , and V 2 will all be constant and can be subsumed
together with the constants, A, B, C, and D in the
coefficients of the multiple regression, s, a, b, and h.
Thus, the general eqn66 can be rewritten as,
Log SP = SPo + s . tc * 1 + a.ai + b . 131 + h . (6 h 2 ) 1 (67)
On the other hand if a the properties of a series of
solutes in a given solvent are being investigated, then
tc * 1 , a 1 , |31 and (5 h 2 ) 1 will all be cons tan t . Thus in this
case the general eqn66 can be rewritten as,
Log SP = SPo + s.tc * 2 + b . 13 2 + a. ci 2 + m.Va (68)
J
No te tha t it was f ound necessary to include a
polarisabi1 ity correction term (d .o 2 )10 0 if aromatic and/or
poiyha1ogenated solutes were included in the solute set.
The general eqn66 is now written as,
90
Log SP = SPo + d.52 + s . tc * 2 + b.02 + a . « 2 + m.V’2 (69)
The 5 2 parameter is equal to 0.0 for nonchlorinated
aliphatic solutes, 0.5 for polychlorinated aliphatics, and
1 . 0 for aromatic solutes.
In this thesis the work is primarily concerned with L S E R ’s
of the kind described by the general eqn69, i.e. the
solubility properties of a series of solutes in single
solvents is studied. So as such, the solvent parameters
[ tc* i , cti, £1 , and (o h 2 ) i ] are not of primary interest.
However, when the general solute eqn69 was first set up,
the required solute parameters, tc * 2 , <22 , and 0 2 were not
available. As a first approximation it was assumed that for
non-se 1 fassociated compounds tc*2 , 0:2 , and 132 could be taken
as identical to the solvent tc*i, ai, and 0 i values that had
been determined by the solvatochromic methods of Kamlet and
Taft. The difficulty over assigning values of az and 0 2 to
self. associated compounds such as alcohols and phenols was
never satisfactorily resolved, and most of these a 2 and 0 2
values have either been "back-calculated” or have simply
been estimated on the basis of chemical intuition.
In the case of the tc* parameter, the problem was partially
overcome by the observation that for n on-se 1 fassociated
compounds with a single dominant dipole (e.g. ethers,
ketones, sulphoxides) there was a reasonable correlation
91
between solvent tc* 1 values and dipole m o m e n t s 109. Since the
latter is actually a solute scale, and since for these non
self assoc iated compounds tc*i is assumed identical to tc*2 ,
the tc*i(tc*2 .) vs ji2 correlation could then be used to obtain
tc*2 values for important classes of selfassociated
compounds such as the alcohols.
The problem of ct2 and 0 2 values for amphiprotic solutes
presented a serious problem, because correlations involving
hydrogen-bond acid or base properties of a series of
monomeric solute molecules (such as the solubility of
solutes in water and in blood, the octanol-water partition
coefficients, and gas-liquid partition coefficients),
required the exclusion of these important classes of
solutes.
Recently Abraham et a l 1 1 0 , 1 1 1 have reported two new solute
scales of hydrogen-bond acidity (a112 ) and basicity (0 H 2 ),
which were developed to overcome some of the difficulties
encountered with the Kamlet and Taft scales a 2 and 0 2 . a H 2
and 0 H 2 are the preferred scales and used in this work.
Note that the use of a H 2 and 0 H 2 instead of a 2 and 0 2 does
not negate the regressions previously carried out as the
scales are very similar and scaled to the same range of
about zero to’ one. The general eqn69 recast with a 112 and
0 H 2 is:
Log SP = SPo + d .02 + s . tc * 2 + b.0 H 2 + a . a H 2 + 111.V2 (70)
92
4.1.1. THE ROLE OF DISPERSION FORCES AND THE SOLUTE SIZE
PARAMETER IN THE SOLUTION OF LIQUID AND GASEOUS SOLUTES IN
SOLVENTS
112 commented on the role of dispersion
ion of the cavity and pointed out, that
ution of a liquid solute in a liquid
not important. This is because any
solute-solvent dispersion interactions
large extent with the loss of solvent-
nteractions in forming the cavity. In
eqn69, the cavity size was taken as
o the solute molar volume, V 2 , at 293K.
as the bulk molar volume i.e. the ratio
ecular weight divided by the solvent
io divided by 1 0 0 , to scale the values
off to suitable values comparable in magnitude to the
p o 1 ari ty and hydrogen-bond scales. It was found necessary
to add 1 0 c m 3m o l ' 1 to V 2 for aromatic and acyclic compounds,
giving an adjusted molar volume V 2 o d J for use in the
general eqn69 113 ■ 114. Apart from the the oretical difficulty
of the above adjustment to V 2 there are other
disadvantages of using V 2 or V 2 «<ij as a measure of the
cavity size required for the solute. First, because Vz is
measured as a bulk solvent property it is not strictly
speaking a true solute parameter and for associated
compounds such as amphiprotic compounds which have a
Mulliken and Person
forces in the format
in the case of sol
solvent they are
contribution from
will cancel out to a
solvent dispersion i
the application of
. being proportional t
This was calculated
of the solute mol
density and this rat
93
network-like hydrogen-bond structure, it will always give
rise to a molar volume that reflects not only the
’’intrinsic” molecular volume of the monomeric species but
also the bulk structure. Thus as pointed out by Abraham and
McGowan 1 15 for pairs of structural isomers (e.g. n-butanol
and dieth ylether) the associated compound always has an
appreciably lower molar volume, whereas this is not the
case for measures of intrinsic volume. Secondly, the use of
Vz or V 2 a d j is inconvenient when dealing with solutes that
are solids. As an alternative parameter L e a h y 11 6 calculated
intrinsic volumes, Vi, for specific solute conformations as
derived from X-ray structures. Vi can be calculated for any
solute, including both liquids and solids and has been
s h o w n , to lead to better correlations in M L R 1 1 8 . 117 with
coefficients which were easier to interpret. V i is
therefore the preferred parameter and the general equation
for solubility properties of liquid solutes in a solvent
with Vi is,
Log SP = SPo + d . <5 2 + s.7t;*2 + b.j3H 2 + a.a:H 2 + m.Vi (71)
McGowan 118 120 has also developed a method of calculating
intrinsic solute volumes V*, by which the addition of
characteristic atomic volumes for the elements present in
the solute and subtracting the constant 6.56c m 3m o l ~ 1 for
each bond. Recently Abraham and M c G o w a n 11 5 have shown that
for a regression of Vi with V'x using 209 solutes ( including
94
gaseous, liquid, and solid solutes) there is a very good
correlation, where Vi and Vx are in c m 3m o l "1 .
Vi = 0/597 + 0.682V* (72)
n = 2 0 9 , S.D.=1.24, r=0.9988
This means that either Vi or V* may be used as the solute
parameter in the general equation for the solubility of
liquid or solid solutes in solvents. Because of the ease
with which Vx is calculatable for any solute, this is the
parameter favoured in this work, although any regression
separately carried out with Vi or Vx should give completely
interchangeable results. The general equation'used with V*
is ,
Log SP = SPo + d . O z + s . tc * 2 + b.]3H2 + a . a H 2 + m. Vx {'73)
This above equation can successfully be applied to the
solubility properties of liquid solutes in condensed
phases. However for the solution of gaseous solutes eqn73
or eqn71 is deficient in a term which corresponds to
solute-solvent dispersion. or van der Waals interaction.
For solution of the gaseous solute, dispersion forces play
an important role as pointed out by Mulli k e n 1 1 2 . This is
because in the gaseous state the solute molecules exhibit
very little or negligible dispersion interaction with each
other, whereas in the condensed solvent phase there are
95
dispersion interactions between the solute and the solvent
molecules. Hence there is no cancellation effect, in
contrast to the solution of a liquid solute described
earlier .
An alternative equation has therefore been put forward in
this work for the study of solubility or sorption
properties of gaseous solutes in liquids or solids, with a
new solute parameter, L o g L 2 1 6 , replacing the volume term
V 2 , Vi, or V*. This, new parameter is defined as the
logarithm of the solute Ostwald solubility coefficient, L,
on n-hexadecane at 298.15K121. Note that L is the same as
the gas-liquid partition coefficient, K. The L o g L 2 18
parameter is both a measure of the cavity size and the
solute solvent dispersion interaction, combined together.
The overall general equation now takes the form,
LogSP =SPo + A.tc*i.tc* 2 + B.ai.fJH 2 + C.$i.aH 2 + D[Di-(oh2 ) 1 ]LogL2 1 e (74)
where the solvent term is now given by [ D 1 - ( o h 2 ) 1 ] . Di is a
solvent dispersion parameter which favours solution of
gaseous solutes and offsets the cavity parameter ( o h 2 )i,
which opposes solution of solutes . Note that the <5 h 2
term, leading to an endoergic cavity term (AG* +ve) will
give rise to a negative term in LogSP. Eqn74 simplifies to
eqn75 below (with the inclusion of the d .02 term to correct
for the polarisability of polychlorinated and aromatic
96
solutes). when the properties of a series of solutes in a
given solvent are being investigated, as explained earlier.
LogSP = SPo + d.5 2 + s.iz*z + b.fjH 2 + a . a H a + m . L o g L 2 18 (75)
This is the preferred equation which is used in this work
when correlating solubility or sorption data of gaseous
solutes in liquid or solid polymers or adsorbents. It is
interesting to note that from all the results given in
S e c 5 .1.2.P I 20 & S e c 5 .1.5.P I 63 the coefficients of L o g L 2 18
were always positive, indicating that the energy released
from dispersion interaction between the solutes and liquid
polymers were greater than that required in cavity
forma t i o n .
The main two multiple regression equations used in this
work to formulate L S E R ’s , are shown in eqn75 and eqn73,
although some regressions are given using eqn76, because
results have been reported in the literature as such,
before the solute parameter scales $ a 2 and a n 2 used in
eqn75 and eqn73 were fully formulated.
LogSP = SPo + d.52 + s . tc * 2 + b.|3H2 + a . a H 2 + m . L o g L 2 10 (75.)
LogSP =.SPo + d.52 + s.tc * 2 + b . $ H 2 + a . a H 2 + m.Vx (73)
LogSP = SPo + d.52 + s . 7c * 2 + b .$2 + a. a 2 + m . L o g L 2 1 8 (76)
4.1.2. THE SOLVENT AND SOLUTE PARAMETERS. THEIR MEANING AND
METHOD OF DETERMINATION
THE SOLVATOCHROMIC PARAMETERS tc* , a, AND £.
The solvatochromic principle makes use of the phenomenon
tha t the wave 1 eng-th of maximum absorption of some
indicators which absorb in the uv/visible region of the
electromagnetic spectrum, ar
indicators are dissolved in
magnitude of this wavelength
degree and type (especially po
bond) of interactions possible
and the solvent under investi
such interactions enabled seal
basicity and acidity to
solvatochromic is derived fr
upon the colour of the indicat
of the spectrum) and literally
The so1vatochromic principle w
and T a f t 122 in 1977 when they
determination of the £i seal
basicity using the solvatochro
The solvatochromic comparison
measure the polarity, tc* i ,
e measurably shifted when the
different solvents. The
shift is dependent upon the
lar/polarisable and hydrogen-
between the solute indicator
gation. The unravelling of
es of polarity, hydrogen-bond
be formulated. The word
om the effect of the solvent
or (if in the visible region
means "solvent c o l o u r " .
as first introduced by Kamlet
published their paper on the
e for solvent hydrogen-bond
mic comparison method.
p rinciple 1 2 2 1 2 6 is used to
of a solvent, S, by the
98
bathochromic shift relative to cyclohexane, of the tz- tz*
transition (hence the naming of the polarity scale) of the
greatest wavelength of nonhydrogen-bond doner indicators
(e.g. N .N-diethy1-4-nitroani1ine or 4-nitro anisole). The
solvent hydrogen-bond basicity is measured by the
supplementary bathochromic shift, manifested by the
homomorph indicator in the same solvent. The homomorph
indicator of the nonhydrogen-bond doner indicator is the
hydrogen-bond acid form. For example 4-nitroani1ine is the
homomorph indicator of N ,N-diethy1-4-nitroani1 ine and
4-nitropheno1 is the homomorph indicator of 4-nitroaniso1e .
The methodology used by Kamlet and Taft has recently been
strongly criticised by Nicolet and Laure n c e 1 2 7 > 12 3 ,
especially on the formulation of the reference homomorphic
line (this is used to back off the hydrogen-bond effects
from polar effects and unravel the solvent hydrogen-bond
properties) with nonhydrogen-bonding solvents. They point
out that the low number of solvents to fix the reference
line was unsatisfactory and the choice of toluene, benzene
and dichloromethane as nonhydrogen-bond solvents was
inappropriate, because they have measurable hydrogen-bond
properties. In addition Nicolet and Laurence stress the
need for temperature control when making solvatochromic
measurements and use their temperature dependence ( 0-105 " O
to measure solvent polarity and basicities at different
temperatures in a method they termed the "thermoso 1 vato-
99
chromic comparison method"
The original £ 1 sC a le i 2 3 , 1 2 2 , 1 2 9 ' n 2 was formulated by
averaging up to five (3 values measured from five different
properties: a solvatochromic property using a nitrogen acid
indicator, a solvatochromic property involving an oxygen
acid indicator, and three properties involving solute
basicity towards oxygen acids; 18Fnmr shifts and formation
constants which were determined in dilute solutions in
carbontetrachloride (CCI4) solvent. Thus the average £ 1
values calculated by Kamlet and Taft are a mixture of
solvent and solute basicity measurements. The £.1 values of
amphiprotic solvents depends on the extent of its self
association, which is quite different in dilute solution in
CCla. Thus the method of calculating £31 values for
associated compounds was unsatisfactory. In addition Kamlet
and co-workers have directly transferred the ]31 values to
the solute scale of hydrogen-bond basicity, £ 2 133'1 3 6 . This
might be considered possible for most solvents but not for
amphiprotic solvents or solutes. This created a predicament
when multiple linear regressions in eqns 6 8 and 69 were
attempted and included data for amphiprotic solutes or
solvents. The unsatisfactory solution was to use a
selective sample set without the amphiprotic compounds.
More recently Abraham et a l 137 have re-evaluated the £3 x
parameter. It was shown that if indicators based on - only
1 0 0

aniline derivatives are used, a pure solvatochromic scale
is formulated which is a reasonably gene ra 1 scale of
hydrogen-bond basicity of non-associated solvents. Abraham
et a l 137 also point out, that the i3i values calculated also
correspond approximately to solute £>2 values. Note, the
values of (3 for amphiprotic solutes have recently been
sorted out with the formulation of a new scale of hydrogen-
bond basicity, £3H 2 1 1 1 , which supersedes the old Kamlet and
Taf t J32 scale .
The solvent hydrogen-bond acid scale, a i 1 2 3 1 2 5 •1 3 8 •1 39 was
introduced by Kamlet and Taft in the same year as 131 , 1977,
and used a similar methodology as the j3i scale, the
solvatochromic comparison method. The inadequacies of the
scale 131 equally apply for ai , although more so because of
several additional practical problems. First a major
problem is the fact that the hydrogen-bond base homomorphs
used for the nonhydrogen-bond solute 4-nitroanisole were
completely different in their structure to 4-nitroanisole ,
which may complicate the unravelling of ai from polarity
and introduce additional significant effects. For example
in the {3i measurements the two sets of homomorphs used by
Kamlet and Taft both had nitro functionality. This means
that if there is any solvent interaction at the nitro
group, then this effect will cancel out when the homorphic
pairs of indicators are compared. However for ai
measurements the homomorphic pairs are very different in
101
structure and thus if there is any solvent interaction at
the nitro group of 4-nitroanisole then this would influence
the ai measurement. With all its problems, however, ai
still remains the most suitable scale of solvent hydrogen-
bond acidity available. The solute scale of hydrogen-bond
acidity, az, 1 3 3 - 1 3 6 has been formulated using some of the
solvent ai values. As for the 132 scale, this is not a very
satisfactory procedure. Fortunately there exists now a new
solute scale of hydrogen-bond acidity, a H 2 recently
developed by Abraham et a l 110, this scale supersedes the
old Kamlet and Taft az scale.
As described earlier, the solvatochromic- parameters tc* i
have been determined by Kamlet and c o workers 123.124,140,141,109^ £• r om the so 1 vbtochromic shifts
of indicators in bulk liquid solvent relative to
cyclohexane. In order to achieve the required sensitivity
it was necessary to use indicator solutes, which from their
functionality had the capability of behaving as hydrogen-
bond bases. This presented no problem for the measurement
of tc *i values for non-hydrogen bond and hydrogen-bond base
solvents. However for the measurement of tc*i values of
hydrogen-bond acidic solvents indicators were chosen which
appeared to be least influenced by hydrogen-bond effects in
hydrogen-bond acidic solvents. Although not totally
satisfactory the tc*i scale is the most acceptable scale out
of the three solvatochromic solvent scales ai , (31 , and tc*i,
102
from considerations of precision of the measurements and
their applicability.
Unfortunately for some classes of solvents and solutes the
tc * x and tz* 2 parameters were found not capable of fully
accounting: for polarity and po lar i sabi 1 i ty effects and an
extra polarisabi1ity parameter, o, was introduced by Kamlet
et a l 1 0 8 . The <51 and 52 parameters are equal to 0.0 for
nonchlorinated aliphatic compounds, 0.5 for polychlorinated
aliphatics, and 1.0 for aromatic compounds. The o values
reflect the fact that, as a general rule, the differences
in solvent or solute polarisability [expressed in terms of
the refractive index function [( n 2-1 ) / ( 2 n 2-1 ) ] are
significantly greater between these classes of compounds
than within the classes.
THE CAVITY AND SOLUTE SIZE PARAMETERS
The Hildebrand cohesive energy density ( o h 2 ) 1 1 0 6 ’ 1 0 7 is a
measure of the solvent forces holding it together as a
liquid, and is defined as the heat of vaporisation (AH r ) ,
at 298K, per unit volume of solvent (V 1 ):
(o h 2 )1 = (AHv - R T )/ V 1 (77)
As such, it is used as a measure of the energy required to
form a cavity in the solvent. Note 5 h is the Hildebrand
103
solubility parameter. normally given the symbol, o, but is
here given the subscript H to differentiate it from the
polarisabi1ity correction parameter, o.
For the complimentary solute size parameter. there are
several parameters available (Vz, V 2 .d j , Vi, Vx. and
Log L 2 1 8 ); advantages and disadvantages are discussed in
Sec4 . 1 . 1 . P93 . The use of LogL.2 xe in studies of gas to
liquid solution has been successful in the work carried out
in this thesis, and merits a more detailed examination.
THE L o g L 2 18 SOLUTE PARAMETER
The. L o g L 2 16 parameter is defined as the solute Ostwald
solubility coefficient. L, on n-hexadecane (C16) at
298.15K. which is identical to the gas-liquid partition
coefficient. K. Values of L 18 or K 18 have been measured in
this work by the method of G L C , and together with values
abstracted from the literature a fairly comprehensive list
of L o g L 216 (240 solutes) has been pub l i s h e d 121 (see
Appendix 2).
The L o g L 2 18 parameter was developed, because there was a
need for a parameter which could describe both the cavity
size required for a solute molecule and its dispersion or
van der Waals type interactions with the solvent. In
particular this was very important for the study of
104
dissolution of gaseous solutes
The theoretical implications of the LogL.2 16 parameter has
been recently investigated by Abraham and F u c h s 14 2 . The
LogLa10 parameter itself was used in a multiple regression
analysis as the solvent property ( SP ) and regressed against
solute parameters V, MR, and yx2 in the following equation,
LogLz 1 6 = SPo + b.V + c . MR + d.ja2 (78.)
where, V = V 2 « d j , Vi, or Vx ; MR is the solute molar
refraction ; and m is the solute dipole moment. SPo is the-r'|
constant of the equation and b, c, and d are the
coefficients produced by multiple regression.
The endoergic work of creating a cavity in the solvent is
given by the term b.V, where V is a solute volume
parameter, and the exoergic solute-hexadecane interactions
are given by c . MR and d.jj2 , being representative of
dispersion and dipole-induced dipole effects respectively.
The regression results for 84 compounds, using V 2 »<1 j as the
solute size parameter are shown below,
L o g L z 16 = 0.293 - 0.026.Vzadj + 0.198.MR + 0.045.M2 (79)
n=84, S.D.=0.185, r=0.986.
Confidence levels for the parameters Vzadj, MR, and yx2 were
all over 99.9999% as judged by the Students Ttest
105
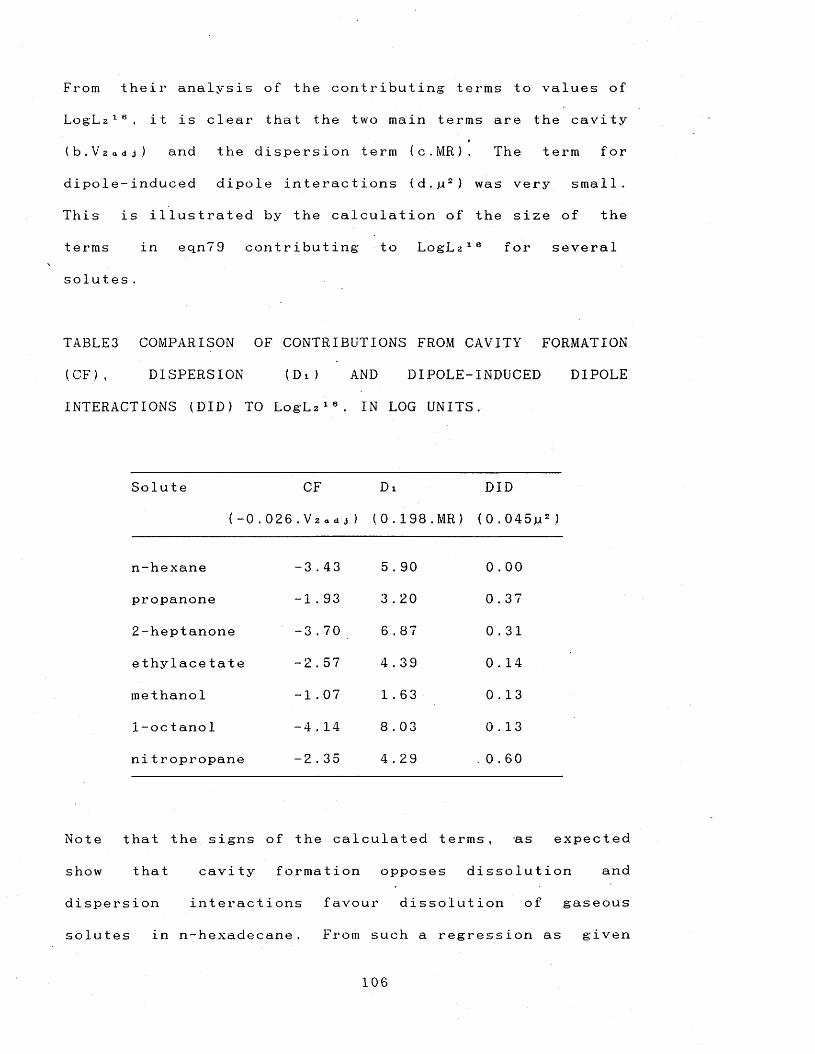
From their analysis of the contributing terms to values of
LogL 2 1 B , it is clear that the two main terms are the cavity
(b. Vzadj.) and the dispersion term (c .M R ). The term for
dipole-induced dipole interactions (d.p2 ) was very small.
This is illustrated by the calculation of the size of the
terms in eqn79 contributing to L o g L a 18 for several
s olutes.
TABLE3 COMPARISON OF CONTRIBUTIONS FROM CAVITY FORMATION
(CF), DISPERSION (Di) AND DIPOLE-INDUCED DIPOLE
INTERACTIONS (DID) TO L o g L a 1 8 , IN LOG UNITS.
Solute
(- 0 ,
CF
. 0 2 6 . V 2«dj )
Di
(0.198.MR)
DID
(0.045m2 )
n-h ex ane -3 . 43 5 . 90 0 . 0 0
propanone -1 . 93 3 . 20 0 . 37
2 -h ep tanone -3.70 6 . 87 0.31
ethylace tate -2.57 4 . 39 0 . 14
methan ol - 1 . 07 1 . 63 0.13
1 -octanol -4 . 14 8 . 03 0 . 13
ni trop ropane -2 . 35 4.29 . 0 . 60
Note that the signs of the calculated terms, as expected
show that cavity formation opposes dissolution and
dispersion interactions f avour dissolut ion of gaseous
solutes in n-hexadecane. From such a regression as given
1 0 6
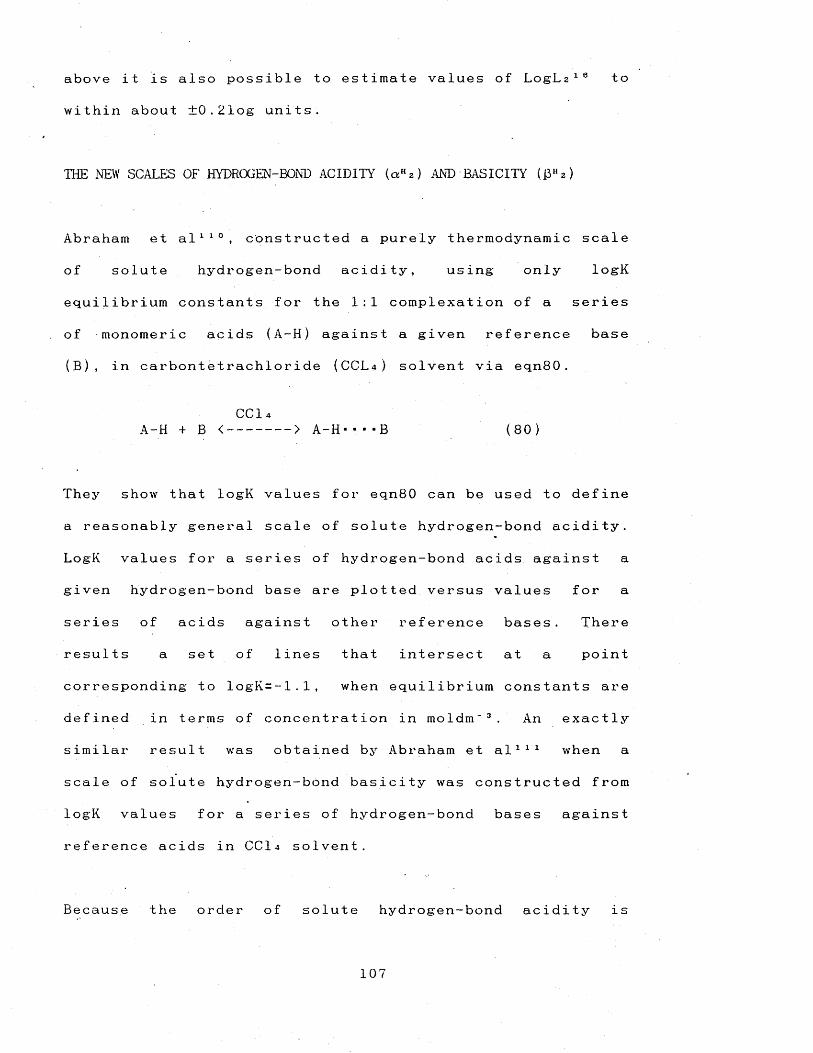
above it is also possible to estimate values of L o g L a 18 to
within about ±0.21og units.
THE NEW SCALES OF HYDROGEN-BOND ACIDITY («Ha) AND BASICITY' (DHa)
Abraham et a l 1 1 0 , constructed a purely thermodynamic scale
of solute hydrogen-bond acidity, using only logK
equilibrium constants for the 1:1 complexation of a series
of monomeric acids (A-H) against a given reference base
(B), in carbontetrachloride (CCL4) solvent via eqn80.
CC14A-H + B <-------- > A-H- • • -B (80)
They show that logK values for eqn80 can be used to define
a reasonably general scale of solute hydrogen-bond acidity.
LogK values for a series of hydrogen-bond acids against a
given hydrogen-bond base are plotted versus values for a
series of acids against other reference bases. There
results a set of lines that intersect at a point
corresponding to logK=-l.1, when equilibrium constants are
defined in terms of concentration in m o l d m " 3 . An exactly
similar result was obtained by Abraham et a l 111 when a
scale of solute hydrogen-bond basicity was constructed from
logK values for a series of hydrogen-bond bases against
reference acids in C C I 4 solvent.
Because the order of solute hydrogen-bond acidity is
107
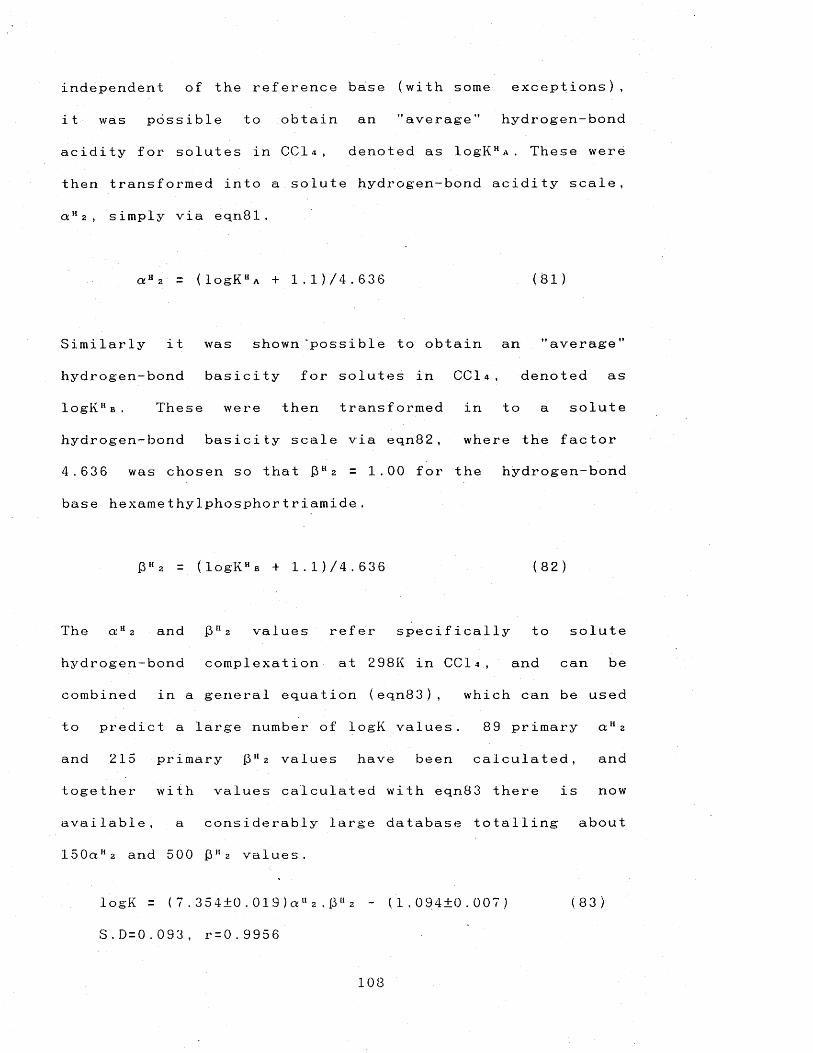
independent of the reference base (with some exceptions),
it was possible to obtain an ’’average” hydrogen-bond
acidity for solutes in CC1 4 , denoted as logKHa . These were
then transformed into a solute hydrogen-bond acidity scale,
a H 2 , simply via eqn81.
a H 2 = ( l o g K H A + l.l) /4.636 (81)
Si m i l a r l y it was shown 'possible to o b t a i n an " a v e r a g e ”
h y d r o g e n - b o n d b a s ic it y for solutes in CCI4, d e n o t e d as
l o g K H b , These were then tran s f o r m e d in to a solute
h y d r o g e n - b o n d b a s i c i t y scale via eqn82, where the factor
4.636 was ch osen so that J3H 2 = 1.00 for the h y d r o g e n - b o n d
base h e x a m e t h y l p h o s p h o r t r i a m i d e .
D H 2 = ( l o g K H B + 1.1) / 4 .636 (82)
The a a 2 and £ H 2 values refer specifically to solute
hydrogen-bond complexation at 298K in C C I 4 , and can be
combined in a general equation (eqn83), which can be used
to predict a large number of logK values. 89 primary ckh 2
and 215 primary 13112 values have been calculated, and
together with values calculated with eqn83 there is now
available, a considerably large database totalling about
15 0aH2 and 500 f3H z values.
logK = (7.3 5 4 ± 0 .019)a“ 2 .0“ 2 - (1.0 9 4 ± 0 .007) (83)
S .D = 0 .093, r = 0 . 9 9 5 6
108
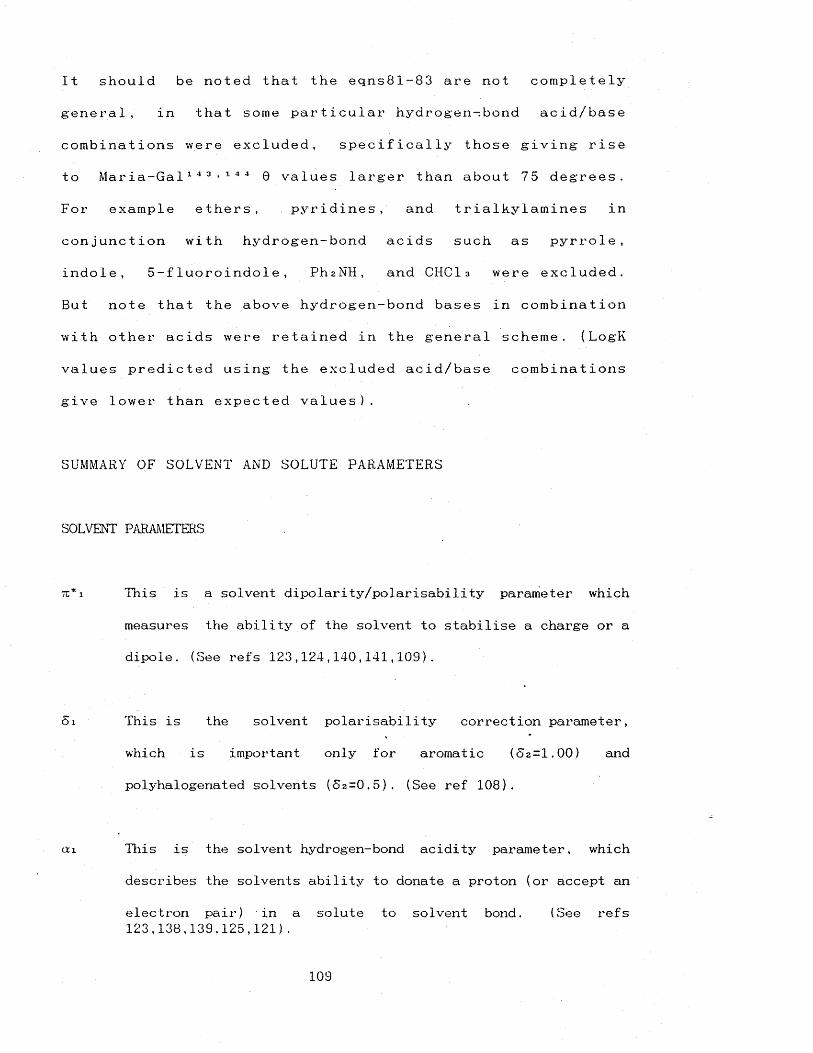
It should be noted that the eqns81-83 are not completely
g e n e r a l , in that some particular hydrogen-bond acid/base
combinations were excluded, specifically those giving rise
to Maria-Gal14 3 ■ 1 4 4 0 values larger than about 75 degrees.
For example ethers, pyridines, and trialkylamines in
conjunction with hydrogen-bond acids such as pyrrole,
indole, 5-fluoroindole, PI12NH, and CHCI3 were excluded.
But note that the above hydrogen-bond bases in combination
with other acids were retained in the general scheme. (LogK
values predicted using the excluded acid/base combinations
give lower than expected v a l u e s ).
SUMMARY OF SOLVENT AND SOLUTE PARAMETERS
SOLVENT PARAMETERS
tc* 1 This is a solvent dipolarity/polarisability parameter which
measures the ability of the solvent to stabilise a charge or a
dipole. (See refs 123,124,140,141,109).
01 This is the solvent polarisability correction parameter,
which is important only for aromatic (52=1.00) and
polyhalogenated solvents (52=0.5). (See ref 108).
ai This is the solvent hydrogen-bond acidity parameter, which
describes the solvents ability to donate a proton (or accept an
electron pair) in a solute to solvent bond. (See refs 123,138,139,125,121).
109
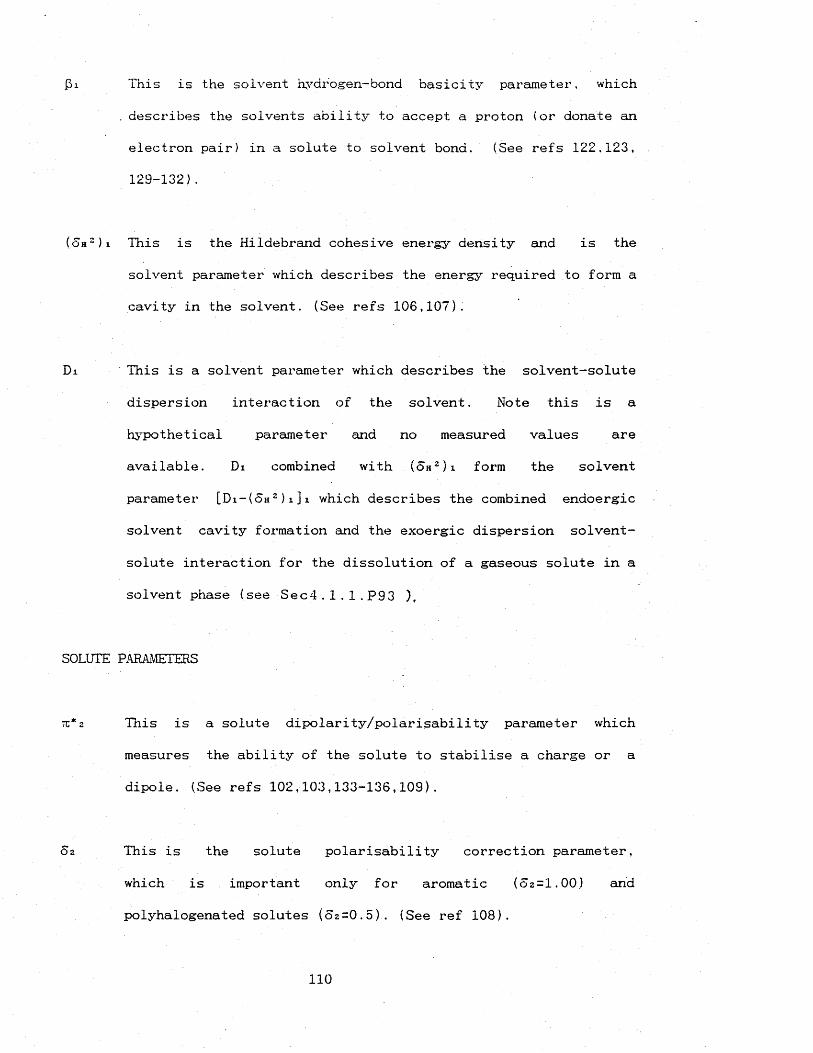
01 This is the solvent hydrogen-bond basicity parameter, which
. describes the solvents ability to accept a proton (or donate an
electron pair) in a solute to solvent bond. (See refs 122.123,
129-132).
(<5h 2) i This is the Hildebrand cohesive energy density and is the
solvent parameter which describes the energy required to form a
cavity in the solvent. (See refs 106,107).
Di This is a solvent parameter which describes the solvent-solute
dispersion interaction of the solvent. Note this is a
hypothetical parameter and no measured values are
available. Di combined with (oh2)i form the solvent
parameter [Di-(oh2)i]i which describes the combined endoergic
solvent cavity formation and the exoergic dispersion solvent-
solute interaction for the dissolution of a gaseous solute in a
solvent phase (see Sec4 .1.1. P93 ),
SOLUTE PARAMETERS
tc* 2 This is a solute dipolarity/polarisability parameter which
measures the ability or the solute to stabilise a charge or a
dipole. (See refs 102,103,133-136,109).
02 This is the solute polarisability correction parameter,
which is important only for aromatic (6 2 =1 .0 0 ) and
polyhalogenated solutes (52=0.5). (See ref 108).
110

This is the Kamlet and Taft solute hydrogen-bond acidity
parameter, which describes the solutes ability to donate
a proton (or accept an electron pair) in a solute to solvent
bond. (See refs 133-136).
This is the Kamlet and Taft solute hydrogen-bond basicity
parameter, which describes the solutes ability to accept a
proton (or donate an electron pair) in a solute to solvent
bond. (See refs 133-136).
This is the new solute hydrogen-bond acidity
parameter,recently developed by Abraham and co-workers
using log K values for hydrogen-bond complexation. Note a H 2
corresponds to the hydrogen-bond acidity of monomer solute,
even for amphiprotic solutes. (See ref 110)
This is the new solute hydrogen-bond basicity parameter,
recently developed by Abraham and co-workers using log K values
for hydrogen-bond complexation. Note ]3H 2 corresponds to the
hydrogen-bond basicity of monomer solute, even for amphiprotic
solutes. (See ref 111).
This is a solute size parameter, calculated as the bulk molar
volume at 293K divided by 100. (See refs 113,114).
'This is V2 adjusted by adding 10cm3mol-1 for aromatic and
acyclic compounds.(See refs 113,114).
Vi This is a measure of the intrinsic solute volume, for specific
conformations as derived by x-ray structures. (See refs
116,115).
*Vx This is a measure of the intrinsic solute volume, calculated by
adding characteristic atomic volumes for the elements present
in the solute and subtracting a constant term for each bond.
(See refs 118-120,115).
LogLa16 This is a combined riieasure of the solute size and dispersion
contribution to solute dissolution. LogLa16 is defined as the
log of the Ostwald solubility coefficient, L, on n-hexadecane
at 298.15K. Note the solute subscript 2 is normally not used
and the parameter denoted by LogL16 (See refs 121,142).
4.1.3. INTERPRETATION OF MULTIPLE LINEAR REGRESSION
EQUATIONS AND LINEAR SOLVATION ENERGY RELATIONSHIPS
The main multiple regression equation used in this work,
given below, consists of four major terms ( s . tc * 2 , b . |3 H 2 ,
a . a H a, and m . L o g L a 16), which correspond to the various
processes and interactions between solvent and solute that
are possible in the dissolution of a gaseous solute. In
addition there is a p o 1arisabi1ity correction term (d.oa),
which is only relevant for aromatic or polyhalogenated
solutes.
LogSP = SPo + d.oa + s.tc*2 + b . (3H a + a . a 11 a + m. LogLa 16 (75)
112
The mu ltip le r e g r e s s i o n of the logged s o l u b i l i t y p r o p e r t y
(LogSP) against the solute parameters, 0 2 , tc* 2 , D H 2 , a 11 2 ,
and L o g L 2 1 6 gives rise to an equ a t i o n with c o e f f icie nt s of
the solute paramet er s (d, s, b, a, and m) and a constant
SPo. This is the linear s o l va tion energy r e l a t i o n s h i p
(LSER) from w h i c h it is po ssible to unravel the natu r e of
the so lute - s o l v e n t interactions, their magnitude, and to
predict values of LogSP for solutes w h i c h have not b een
e x p e r i m e n t a l l y measured, but for whi ch the rel ev ant
p ar am eters are known. For many so l u b i l i t y processes, not
all the terms will be required, this results in a zero or
s t a t i s t i c a l l y ins ig nifican t coef fi cient of the parameter.
For example the s o l u b i l i t y in a polar h y d r o g e n - b o n d basic
solvent, should result in an i n si gn ificant term in J3 H 2 ,
because solute h y d r o g e n - b o n d bases have no h y d r o g e n - b o n d
ca pa b i l i t y towards h y d r o g e n - b o n d base solvents. After
running the reg r e s s i o n with all parameters, if one of the
terms is ver y small and s t a t i s t i c a l l y insignificant, then
the r e g r ess io n may be rerun without this term.
The c oe ff icient s of the r e g r e s s i o n eq u a t i o n c h a r a c t e r i s e
the solvent phase, and their mag n i t u d e is prop o r t i o n a l to
the s o lu te -solv en t type in te r a c t i o n that the c o e f f i c i e n t s
and their solute para me ters describe. For example the Mb"
c oef ficient of J3H 2 is a m e a su re of the solvents h y d r o g e n -
bond acidity. However "b" is p r o p o r t i o n a l and not equal to
the solvents h y d r o g e n - b o n d acidity, ai. This is b e cause in
113
a d d it io n to m , the constant B is su bsum ed into the
coefficient, cf e q n s 6 6 and 6 8 .
To compare m a g n i t u d e s of diffe re nt c oeffic ie nts in the same
regression, it must be r e m e m b e r e d that not all the solute
param et er scales have a similar range. Although, 0 2 , tc*2 ,
f3H 2, and a H 2 have similar ranges of about zero to one, the
L o g L z 1 6 p a r a me te r ranges in theor y from - 0 0 to + 0 0. H o w ev er
for normal solutes as m e a s u r e d in this work L o g L z 1 8 varies
from about -2.00 to +8.00. So even if the c o e f f i c i e n t of
L o g L z 1 6 is smaller than for the other solute paramete rs,
d ep e n d i n g on the size of the L o g L z 1e for the p a r t i c u l a r
solute in question, the term in L o g L z 1 8 may be still
st ron gly c o n t r i b u t i n g to the logged sol u b i l i t y prope rty . It
is sometimes very e n l i g h t e n i n g to ac t u a l l y work out the
various co nt ri b u t i o n s from each term of the LSER.
To di r e c t l y compare m a g n it ud es of c o e f f i c i e n t s of
diffe ren t so lu bility properties, is quite difficult.
For example, whe n a t t e m p t i n g to compare c o e f f i c i e n t s of-
diff ere nt regre ss io ns it is important to bear in min d the
exp eri ment al cond ition s that the s o l u b i l i t y p r o p e r t i e s were
made under. For example if a series of the same s o l u b i l i t y
de pendent pr o p e r t i e s were m e a sure d at one te mp e r a t u r e and
another higher temperature, then the c o e f f i c i e n t s d e r i v e d
are not n e c e s s a r i l y di r e c t l y comparable. This is because,
for example, at higher temperat ur es the degree of p o lar or
hydrogen-bond interaction may be reduced due to the
increased kinetic motion at higher temperatures. Nicolet
and Laurence 1 2 7 ’ 1 2 8 have studied the effect of temperature
on the polarity and hydrogen-bond basicity of solvents, and
show that for some solvents over a range of 273K to 378K
the hydrogen bond basicity is relatively unaltered, but for
others it can decrease dramatically. For example £ 1 at 323K
for pentafluoropyridine is shown to be half or more less
than its value at 273K.
THE STATISTICAL RESULTS FROM MULTIPLE REGRESSION ANALYSIS
The regression results for a hypothetical solvent are
shown b e l o w , in the form used in this t h e s i s ,
SP d.S S. a.«Hz b.&Hz L L o g L16 SPo n r S.D.
SOLVENT Log Kt Coeffs -0.55 1.79 (0.30) 4.75 1.03 -2.11 32 0.987 0.26PHASE St dev 0.21 0.25 0.37 0.28 0.06 0.23
Ttest 0.99 1.00 0.75 1.00 1.00 1.00
The solubility property Log K t (K measured in the solvent
phase at temperature, T) was regressed against the solute
parameters 5, tc*2 , a H 2 , £ “ 2 , and L o g L 18 (the subscript 2
indicating solute parameters is dropped for 62 and L o g L z 1 6 )
and the resulting coefficients (Coeffs) of * the multiple
regression, d, s, a, b, and 1 were determined. The constant
115
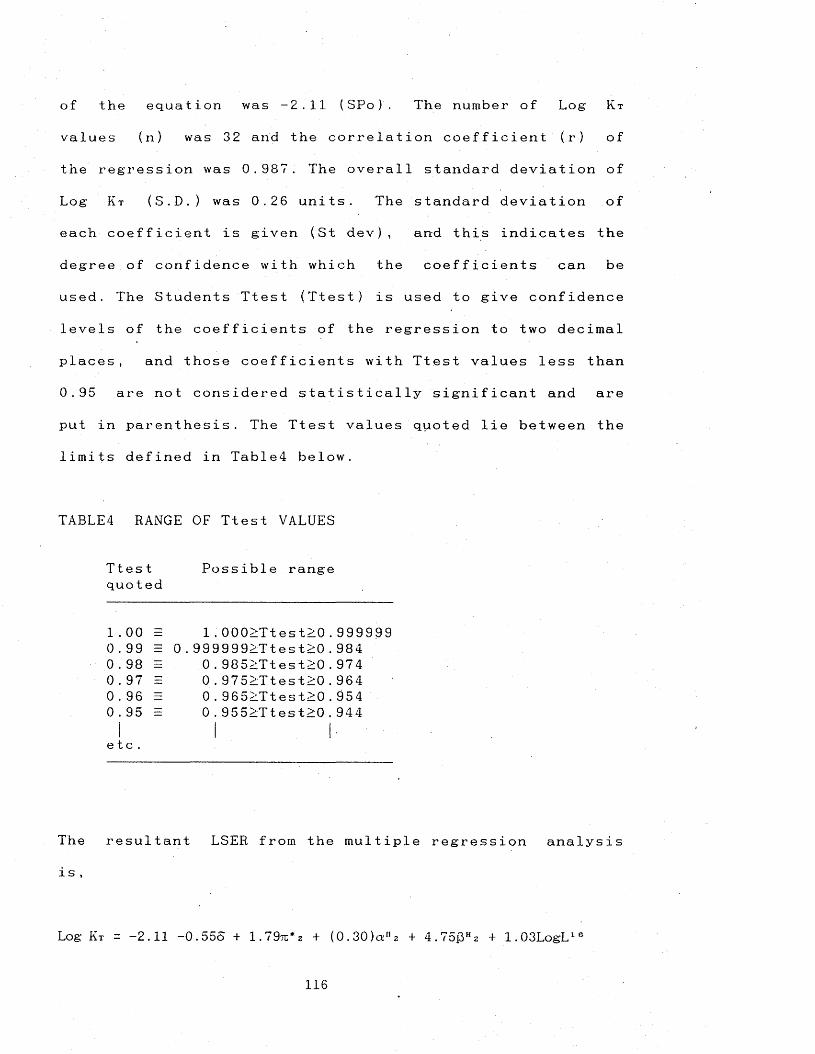
of the equation was -2.11 (S P o ). The number of Log Kt
values (n) was 32 and the correlation coefficient (r) of
the regression was 0.987. The overall standard deviation of
Log Kt (S.D.) was 0.26 units. The standard deviation of
each coefficient is given (St dev), and this indicates the
degree of confidence with which the coefficients can be
used. The Students Ttest (Ttest) is used to give confidence
levels of the coefficients of the regression to two decimal
places, and those coefficients with Ttest values less than
0.95 are not considered statistically significant and are
put in parenthesis. The Ttest values quoted lie between the
limits defined in Table4 below.
The resultant LSER from the mult iple regression analys i s
is ,
Log Kt = -2.11 -0.55d + 1.79ti;*2 + (0.30)aH2 + 4.75£H2 + 1.03LogL16
TABLE4 RANGE OF Ttest VALUES
Ttest Possible rangequo ted
1 . 00 0 . 99 0 . 98 0 . 97 0 . 96 0 . 95
0.999999>Ttest>0.984 0.985>Ttest>0.974 0.975>T test>0.964 0.965LTtest>0.95 4 0.95 5LTtest>0.944
1.000>Ttest>0.999999
etc.
116
and shows that the coefficients of all the solute
parameters except a H 2 are significant at the 95% confidence
level or greater,
For chemical sensible results the possible interactions of
solute and solvent must be analysed and compared with the
results shown from the regression analysis. The signs of
the coefficients for exoergic processes should be positive
and those for endoergic negative. So the coefficients of
7E* 2 , cih 2 , and f5H a , should be positive if significant and
the coefficient of L o g L 16 may be positive or negative
depending upon the balance of energy required to form the
cavity in the solvent and the energy released from
dispersion interaction of the solute and solvent.
The number of points required to perform satisfactory
multiple regressions is usually about five times the number
of explanatory variables. For a regression involving all
the solute parameters used above, about twenty five Log Kt
values would be suitable. Note that for regressions where
terms are shown to be not statistically significant, then
the number of Log Kt values required is reduced
accordingly.
117
5.1. RESULTS AND DISCUSSIONS
5.1.1. GENERAL AIMS OF THE PRESENT WORK
One of the continuing puzzles of physical chemistry is a
precise understanding of what controls the solubility of
one compound in another. The objectives of the present work
are to extend this level of understanding to the extent
that general models of solubility and sorption can be set
up which quantitatively describe the various processes that
o c c u r .
The major aim of the work carried out in this thesis is to
set up a system for the characterisation of solvents,
(including both liquid polymers and normal solvents) and
adsorbents (including porous polymers and activated
c harcoals). The solvent phases and adsorbents will be
characterised in terms of their polarity/polarisabi1 i t y ,
hydrogen-bond capability and dispersion interaction towards
gaseous solutes. And hence solvent phases and adsorbents
will be evaluated with respect to their power to
discriminate between solutes. Not only will this provide a
complete and systematic framework that will include both
solutes, solvents and adsorbents, but the work will lead to
significant practical advances. For example , it will be
possible to select chemical sensors for specific solute
selectivity, gas-liquid chromatography stationary phases
118
and adsorbents for particular separations, more easily than
has hitherto been possible.' In addition the effect of
relative humidity on the sorption properties of adsorbents
will be studied. It is of considerable interest to
determine not only how the general adsorbent power alters
with relative humidity, but also how the relative
adsorbance of solutes alters.
The method of characterisation will involve measuring some
solubility or sorption property (S P ), which is analysed by
the method of multiple linear regression against various
solute parameters. The end result is a linear solvation
energy relationship, which enables the characterisation of
the solvent or adsorbent (by the coefficients of the
regression equation) to be made and provides a method of
predicting further values of the SP from known solute
parame t e r s .
119
5.1.2. REGRESSION ANALYSIS OF POLYMERIC LIQUIDS AND OLIVE
OIL
The solubility of a series of solutes were studied in a
number of polymeric liquid phases and olive oil (detailed
in T a b l e 5 ) . In general quite good correlations were
ob s e r v e d , although some were poorer than might be expected.
This is probably because of the necessity of making
measurements at 298K for the polymeric p h a s e s , at which
temperature the polymers were in general very viscous
materials. Absorption into the polymers is made much easier
at higher temperatures, enabling faster equilibration of
sample between "liquid" and vapour phases in the GLC
column. However the SAW data (to be compared with) is
collected at or near room temperature, so 298K was an
obvious choice to make measurements at.
In nearly all cases eqn75 leads to superior regressions
^than those obtained with eqn73, and gives chemically
reasonable results. For this reason the discussions have
been limited to the results obtained via eqn75 (using
the L o g L 16 parameter) only, although full regression
results are given in Tables9&10 for both eqns75 and 73.
The solute set was chosen to provide a range of solute
types as wide as was possible, including both a range of
hydrogen-bond bases and acids (see T a b l e 6 ) . The data used
1 2 0
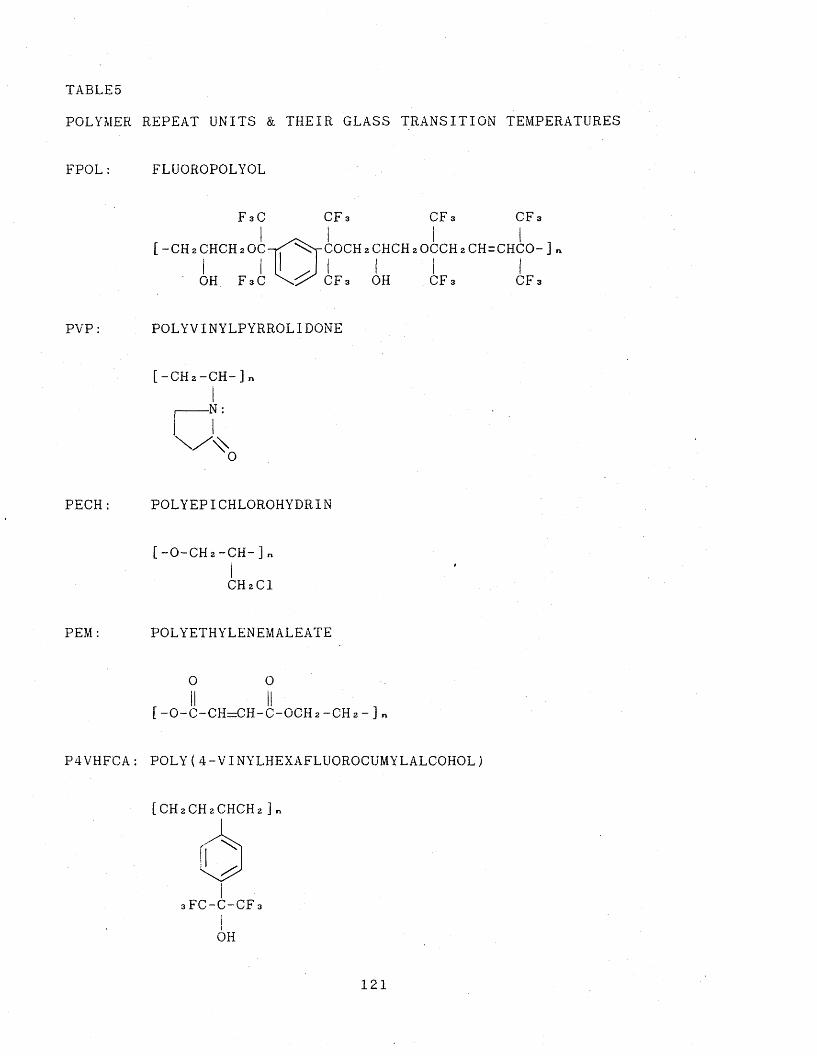
TABLES
POLYMER
FPOL :
P V P :
PECH:
PEM:
P 4 V H F C A :
REPEAT UNITS & THEIR GLASS TRANSITION TEMPERATURES
FLUOROPOLYOL
F 3 C CF 3 O F 3 O F 3I I I I[ -CH 2 CHCH 2OC-^^Sr-COCH 2 CHCH 2 O C C H 2 CH=CHCO- ]i i [ I A 1 i 1 iOH FsC C F 3 OH CFs C F 3
POLYVINYLPYRROLIDONE
[-CH 2-CH-]
-N:
0
POLYEPICHLOROHYDRIN
[-O-CH 2-CH-]n
C H 2CI
POLYETHYLENEMALEATE
0 0
[-0-C-CH=CH-C-0CH2- C H 2 -]n
P O L Y (4-VINYLHEXAFLUOROCUMYLALCOHOL)
[C H 2C H 2C H C H 2 ]n
sFC-C-CF 3
L
121
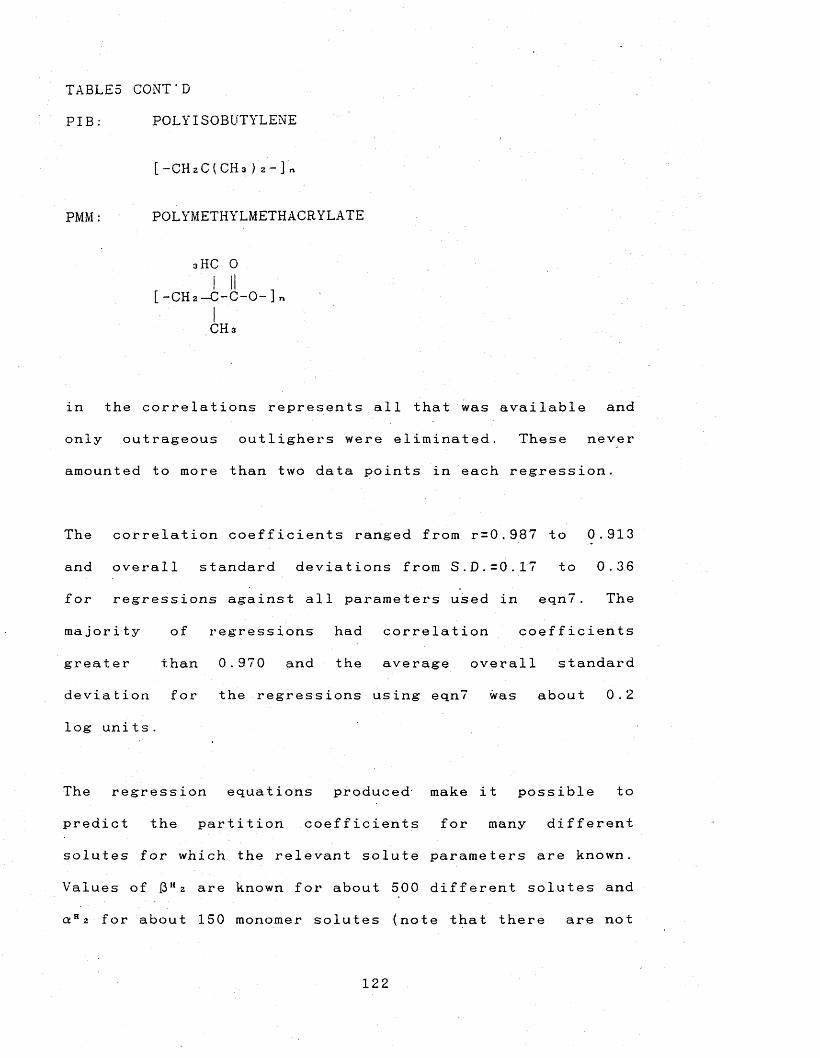
TABLES CONT'D
P I B : POLYISOBUTYLENE
[-CHzC(CH3)Z~]n
P M M : POLYMETHYLMETHACRYLATE
3HC 0i I ,[-CHz-C-C-O-ln
. 1 CHs
in the correlations represents all that was available and
only outrageous outlighers were eliminated. These never
amounted to more than two data points in each regression.
The correlation coefficients ranged from r=0.987 to 0.913
and overall standard deviations from S.D.=0.17 to 0.36
for regressions against all parameters used in e q n 7 . The
majority of regressions had correlation coefficients
greater than 0.970 and the average overall standard
deviation for the regressions using eqn7 was about 0.2
log uni t s .
The regression equations produced make it possible to
predict the partition coefficients for many different
solutes for which the relevant solute parameters are known.
Values of |3H 2 are known for about 500 different solutes and
a H 2 for about 150 monomer solutes (note that there are not
122
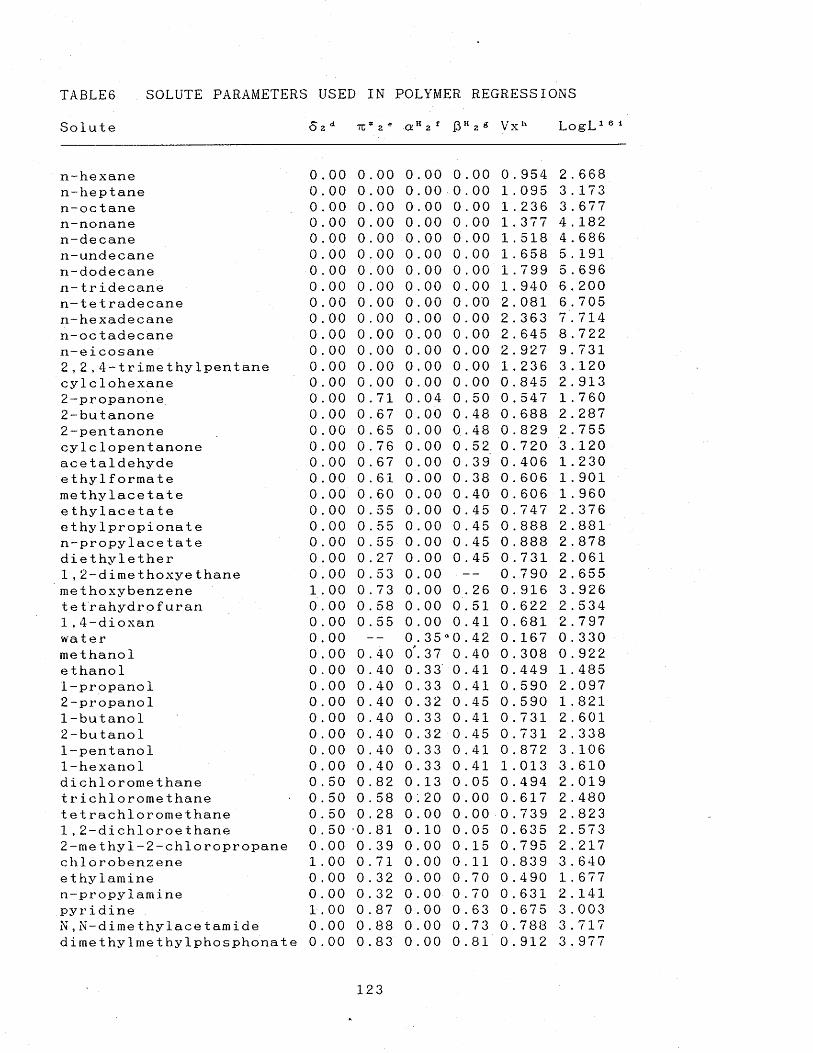
TABLE6 SOLUTE PARAMETERS USED IN POLYMER REGRESSIONS
Solute 0 2 d 7n*2e a H2f D H 2g V x h L o g L 161
n-hexane 0n-heptane 0n-octane 0n-nonane 0n-decane 0n-undecane 0n-dodecane 0n-tridecane 0n-tetradecane 0n-hexadecane 0n-octadecane 0n-eicosane 02,2,4-trimethy1pentane 0cylclohexane 02-propanone 02-butanone 02-pentanone 0cylclopentanone 0acetaldehyde 0e thylf ormate 0methylacetate 0e thylace ta te 0e thy1propi onat e 0n-propylacetate 0die thy1ether 01,2-dimethoxyethane 0methoxybenzene 1tetrahydrofuran 01,4-dioxan 0water 0methanol 0ethanol 01-propanol 02-propano1 01-butanol 02-butanol 01-pentanol 01-hexano1 0dichioromethane 0t r i chioromethane 0t et rachloromethane 01,2-dichioroethane 02-methy1-2-chloropropane 0chiorobenzene 1ethylamine 0n-propylamine 0pyridine 1N ,N-dime thylace tamide 0dimethylmethylphosphonate 0
0.00 0.00 0.00 0.954 2.668 0.00 0.00 0.00 1.095 3.173 0.00 0.00 0.00 1.236 3 . 677 0.00 0.00 0.00 1.377 4.182 0.00 0.00 0.00 1.518 4.686 0.00 0.00 0.00 1.658 5.191 0.00 0.00 0.00 1.799 5.696 0.00 0.00 0.00 1.940 6.200 0.00 0.00 0.00 2.081 6.705 0.00 0.00 0.00 2.363 7 . 714 0.00 0.00 0.00 2.645 8.722 0.00 0.00 0.00 2.927 9.731 0.00 0.00 0.00 1.236 3 . 120 0.00 0.00 0.00 0.845 2.913 0.71 0.04 0.50 0.547 1.760 0.67 0.00 0.48 0.688 2.287 0.65 0.00 0.48 0.829 2.755 0.76 0.00 0.52 0.720 3.120 0.67 0.00 0.39 0.406 1.230 0 . 61 O'. 00 0 . 38 0 . 606 1 . 901 0.60 0.00 0.40 0.606 1.960 0.55 0.00 0.45 0.747 2.376 0.55 0.00 0.45 0.888 2.881 0.55 0.00 0.45 0.888 2.878 0.27 0.00 0.45 0.731 2.061 0.53 0.00 — 0.790 2.6550.73 0.00 0.26 0.916 3.926 0.58 0.00 0.51 0.622 2.534 0 . 55 0.00 0.41 0.681 2.797 -- 0.3 5 ° 0 .42 0.167 0.330
0.40 0\3 7 0.40 0.308 0.922 0.40 0.33 0.41 0.449 1.485 0.40 0.33 0.41 0.590 2.097 0 . 40 0.32 0.45 0.590 1 . 821 0 . 40 0.33 0.41 0 .731 2.601 0.40 0 . 3 2 0 . 4 5 0.731 2.338 0.40 0.33 0.41 0.872 3.106 0.40 0.33 0.41 1.013 3.610 0.82 0.13 0.05 0.494 2 .019 0.58 0:20 0.00 0.617 2.480 0.28 0.00 0 . 0 0 0 . 7 3 9 2.823 0.81 0.10 0.05 0.635 2.573 0.39 0.00 0.15 0.795 2.217 0.71 0.00 0.11 0.839 3.640 0.32 0.00 0.70 0.490 1.677 0.32 0.00 0.70 0.631 2.141 0.87 0.00 0.63 0.675 3.003 0.88 0.00 0.73 0.788 3.717 0.83 0.00 0.81 0.912 3.977
00000000000000000000000000000000000000000000000000000000000000000000000000005050505000000000000000
123
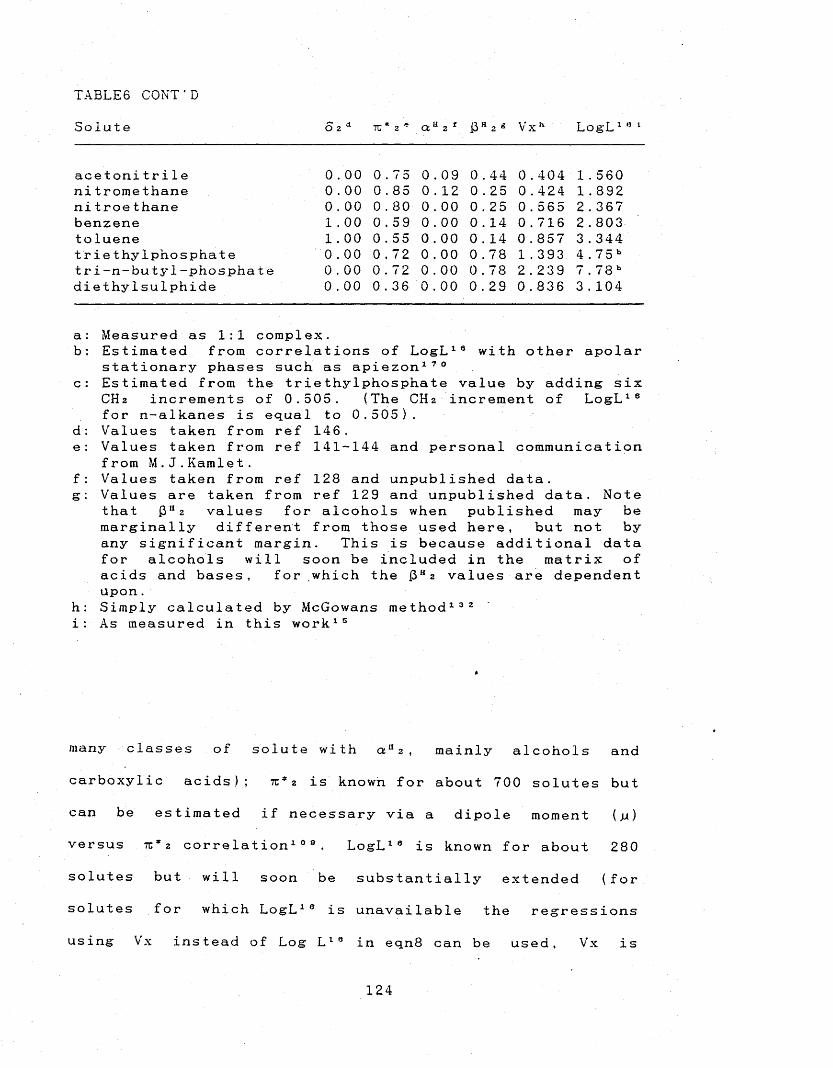
TABLES C O N T ’D
Solute o z d it* 2 * a a 2 1 13H 2 < V x h L o g L 161
acetoni tr i1e nitromethane ni troe thane benzene toluenetrie thylphosphate tri-n-butyl-phosphate diethylsulphide
0 . 00 0 .. 7 5 0 ,. 09 0 ,. 44 0 ,. 404 1 ,. 5600 . 00 0 ,. 85 0 .. 12 0 ,. 25 0 . 424 1 ,. 8920 .. 00 0 .. 80 0 .. 00 0 .. 25 0 ,,5 65 2,.3671 ,. 00 0 ., 59 0 .. 00 0 ,. 14 0 ,, 716 2 ,. 8031 ., 00 0 . 55 0 ., 00 0 ., 14 0 ., 857 3 ., 3440 ., 00 0 . 72 0 ., 00 0 .,78 1 ,, 393 4 ,. 7 5 b0 . 00 0 . 72 0 . 00 0 . 78 2 ., 239 7 ., 78 b0 . 00 0 . 36 0 . 00 0 . 29 0 . 836 3 . 104
a: Measured as 1:1 complex.b: Estimated from correlations of L o g L 18 with other apolar
stationary phases such as a p i e z o n 170 c: Estimated from the triethylphosphate value by adding six
C H 2 increments of 0.505. (The C H 2 increment of L o g L 18 for n-alkanes is equal to 0.505) .
d: Values taken from ref 146.e: Values taken from ref 141-144 and personal communication
from M.J.Kamlet. f: Values taken from ref 128 and unpublished data,g: Values are taken from ref 129 and unpublished data. Note
that £}h 2 values for alcohols when published may be marginally different from those used here, but not by any significant margin. This is because additional data for alcohols will soon be included in the matrix of acids and bases, for .which the J3K2 values are dependent u p o n .
h: Simply calculated by McGowans m e t h o d 132 i: As measured in this w o r k 15
many classes of solute with a,112 , mainly alcohols and
carboxylic acids ) ; tz* 2 is known for about 700 solutes but
can be estimated if necessary via a dipole moment (ji)
versus 71: *2 correlation1 0 9 . L o g L 18 is known for about 280
solutes but will soon be substantially extended (for
solutes for which L o g L 18 is unavailable the regressions
using Vx instead of Log L 18 in eqn8 can be used, Vx is
124
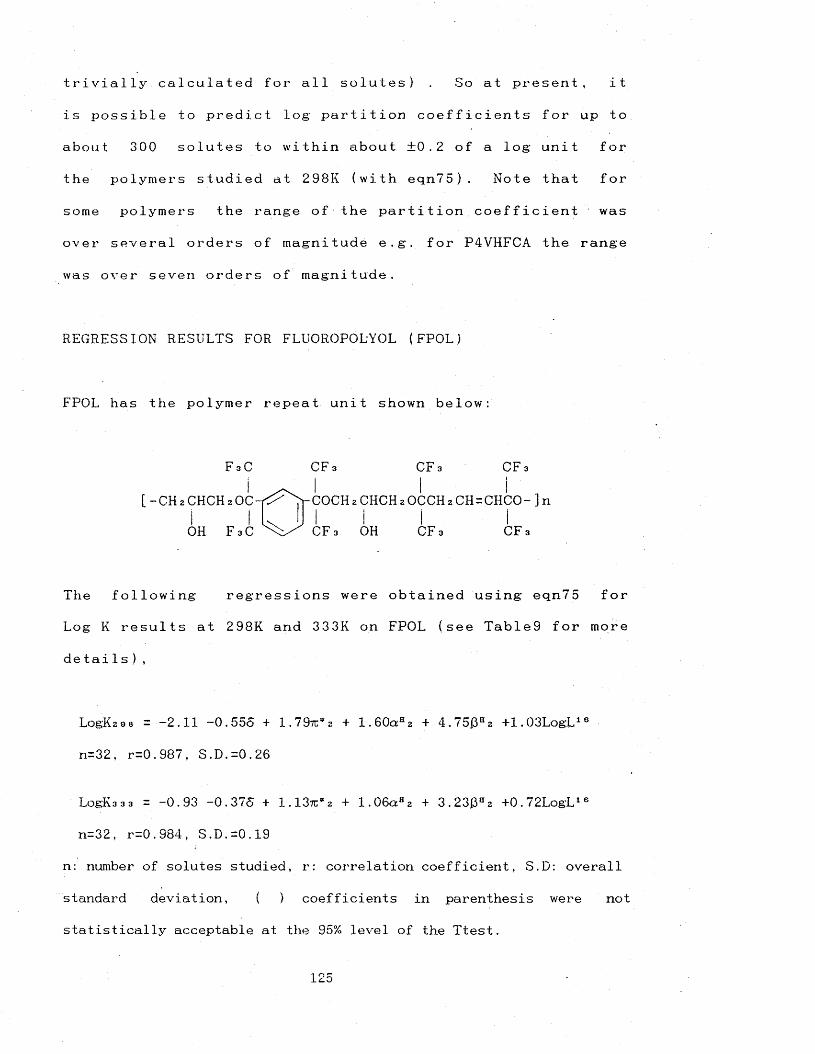
t r i v i a 1 ly c a l c u l a t e d for all solutes) . So at present, it
is po ss ib le to predict log' par t i t i o n c o e f f ic ients for up to
about 300 solutes to wi th in about ±0.2 of a log unit for
the polymers studied at 298K (with e q n 7 5 ) . Note that for
some polymers the range of the p a r t i t i o n c o e f f icie nt was
over several orders of ma gnitude e.g. for P 4 V H F C A the range
was over seven orders of magnitude.
R E G R E S S I O N R E S ULTS FOR F L U O R O P O L Y O L (FPOL)
FPOL has the polymer repeat unit shown below:
F 3 C O F 3 CF 3 O F 3
L-GH s CHCH i O C ^i^Ji-C O C H i CHCH iOCCHtCH=CHCO- ]ni I L U I IOH F 3C C F 3 OH C F 3 CPs
The fol lo wi ng r egressi on s were o b t aine d u s ing eqn75 for
Log K results at 298K and 333K on FPOL (see T a ble9 for more
d e t a i l s ) ,
LogK 2 o a = -2 . 1 1 -0.55o + 1.7 97c* 2 + 1.60aH2 + 4.75j3H2 +1.03LogL16
n=32, r=0.987, S.D.=0.26
LogK3 3 3 = -0.93 -0.375 + 1.13tu*2 + 1.06aH2 + 3.23J3H2 +0.72LogL16
n=32, r=0.984, S.D.=0.19
n: number of solutes studied, r: correlation coefficient, S.D: overall
standard deviation, ( ) coefficients in parenthesis were not
statistically acceptable at the 95% level of the Ttest.
125
The regression for results at 298K indicates as expected
that FPOL is a strong hydrogen-bond donor molecule. shown
by the large b=4.75 coefficient. This shows that FPOL is
capable of s t rongly selective absorpt ion of hydrogen-bond
bases. This interaction occurs at the hydroxyl group, the
0-H bond of which has been weakened by the presence of
four {3-1 r i f luorome thy 1 groups, resulting in a strong
hydrogen-bond donor site (electron deficient). The polymer
is also quite a weak hydrogen-bond base (a=1.60) and medium
dipole interactor (s=1.79). FPOL proves also to be strong
dispersion interactor with a coefficient of 1=1.03, for
L o g L 18 (note Ml” is defined as unity for n-hexadecane at
298K). This shows that the polymer displays dispersion type
forces to a similar extent to n-hexadecane, which will
occur mainly along the carbon backbone and at the benzene
r i n g s .
When the regression results at 333K are compared with those
at 298K for Log K values, it is clear that a very similar
regression is obtained but all the coefficients are reduced
at 333K (although still at a similar level, of statistical
significance). This is to be expected because the partition
coefficients at 333K are much smaller than those at 298K. A
temperature correlation between Log K298 and Log K333 has
been carried out (see Sec5 . 1 . 3 . PI 47 ) and the results gave
t.he following equation:
126
L o g K 2 o 8 - 1.47 OLog K 3 3 3 — 0.728 (84)±0.050 ±0.122
n = 27 r = 0.986 S . D . =0.156
If this equ at ion is a p p l i e d to the r e g r e s s i o n for Log K 3 3 3
and each coeffic ie nt (d=-0.37, s=1.13, a=1.06, b=3.23, and
1=0.72) and the constant (SPo=-0.93) m u l t i p l i e d by the
factor 1.470 and the constant of the t e m p eratu re
corr e l a t i o n (-0.728) added, then the foll ow ing e q u a t i o n is
f o u n d :
LogK = -2.10 -0.545 + 1 .6 6 7c* 2 + 1 .5 5 a H 2 + 4.7513“ 2 + 1.06LogL16
LogK 2 9 8 = -2.11 -0.555 + 1.79tc*2 + 1.60aH2 + 4 .7 5 1 3 H 2 + 1.03LogLie
This is in good agr ee me nt with the r e g r e s s i o n results
found using K 2 8 8 (included aga in for comparison). This
means that each of the r e g r e s s i o n coef f i c i e n t s has been
reduced at 333K by the same proportion. A de c r e a s e in the
h y d r o g e n - b o n d c a p a b i l i t y and p o l a r / p o l a r i s a b l e p r o p e r t i e s
of the pol yme r is expecte d due to the i n c r eas ed ki n e t i c
motion at higher temperatures, but it was not e x p e c t e d that
they would be in the same pr op o r t i o n s as they cl e a r l y are
in the case of FPOL. For FPOL at least, this means that
r e g r es si on equations could be i n t e r p o l a t e d or e x t r a p o l a t e d
to other tem peratures from the results at 298K and 333K.
127
CALCULATION OF SOLUTE PARAMETERS FROM FPOL REGRESSION
FPOL is very selective towards hydrogen-bond base solutes,
so it would be an ideal candidate to use in the
estimatation of values of {3H2 from the regressions given
earlier. With the knowledge of Log K x 33 3, the coefficients
and constant of the regression equation, and the
parameters (o, tz* 2 , a H 2 , and Log L ie) for the solute (x),
the ]3h2 value for a solute is simply computed. For
monofunctional hydrogen-bond base solutes there is no real
problem in the experimental determination of 13H 2 , however
for difunctional hydrogen-bond base solutes there is
considerable doubt as to what the experimentally
determined values actually mean with respect to regression
equations. This is because it is not clear whether or .not
both hydrogen-bond base sites in the molecule interact
with the solvent molecule. If the two hydrogen-bond base
sites were not constricted by geometrical problems and
could equally interact with solvent molecules, then the
sum hydrogen-bond basicity might be considered as the sum
of the two separate sites. This is only an ideal
hypothesis. and normally the actual ‘’effective” basicity
would be less than the sum. The method described above
using a back calculation of parameters provides a method
of determining the “effective” hydrogen-bond capability of
a difunctional solute for the particular system being
s tudied.
128
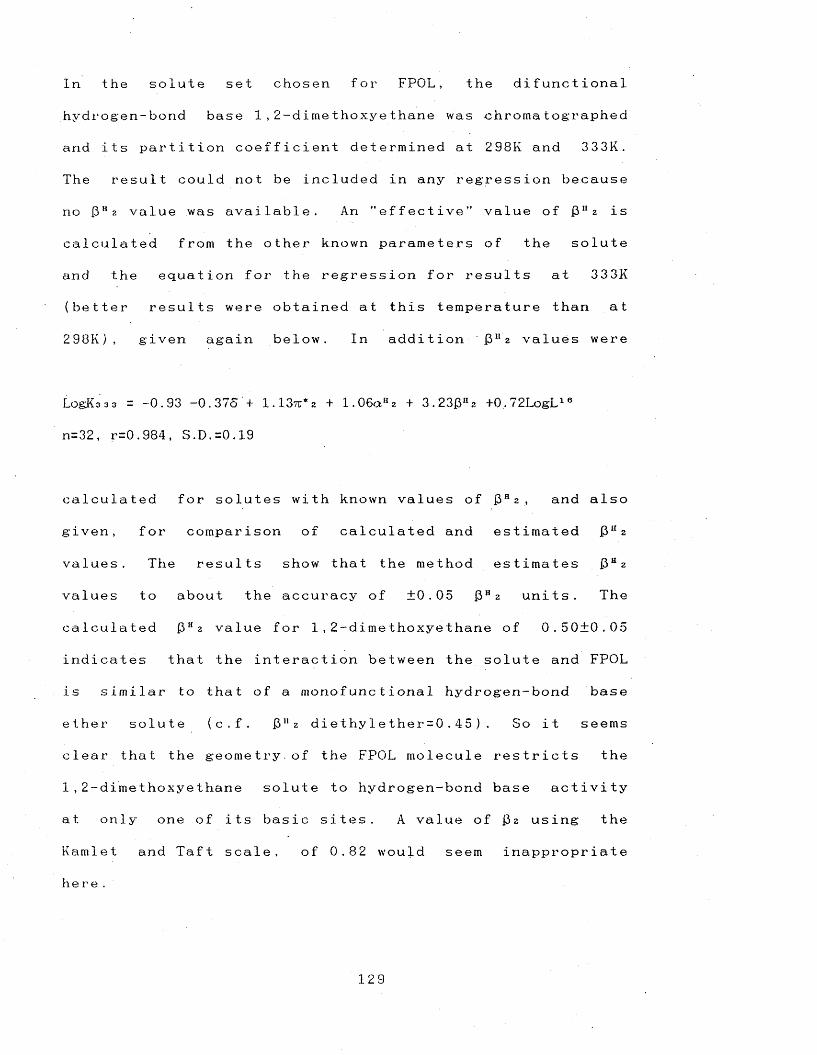
In the solute set chosen for FPOL, the difunctional
hydrogen-bond base 1 ,2 -dimethoxyethane was chromatographed
and its partition coefficient determined at 298K and 333K.
The result could not be included in any regression because
no ]3h 2 value was available. An "effective" value of J3U 2 is
calculated from the other known parameters of the solute
and the equation for the regression for results at 333K
(better results were obtained at this temperature than at
298K) , given again below. In addition £3112 values were
LogK 3 3 3 = -0.93 -0.375 + 1.13ti:*2 + 1.06ctHz + 3.23£H2 +0.72LogL16
n=32, r=0.984, S.D.=0.19
calculated for solutes with known values of f3H 2 , and also
given, for comparison of calculated and estimated j3H 2
values. The results show that the method estimates ]3H2
values to about the accuracy of ±0.05 f3H 2 units. The
calculated f3H 2 value for 1 , 2-d i me thoxye thane of 0 . 50±0 . 05
indicates that the interaction between the solute and FPOL
is similar to that of a monofunctional hydrogen-bond base
ether solute (c.f. £ “ 2 diethylether=0.45). So it seems
clear that the geometry.of the FPOL molecule restricts the
1,2-dimethoxyethane solute to hydrogen-bond base activity
at only one of its basic sites. A value of 13 2 using the
Kamlet and Taft scale, of 0.82 would seem inappropriate
here.
129
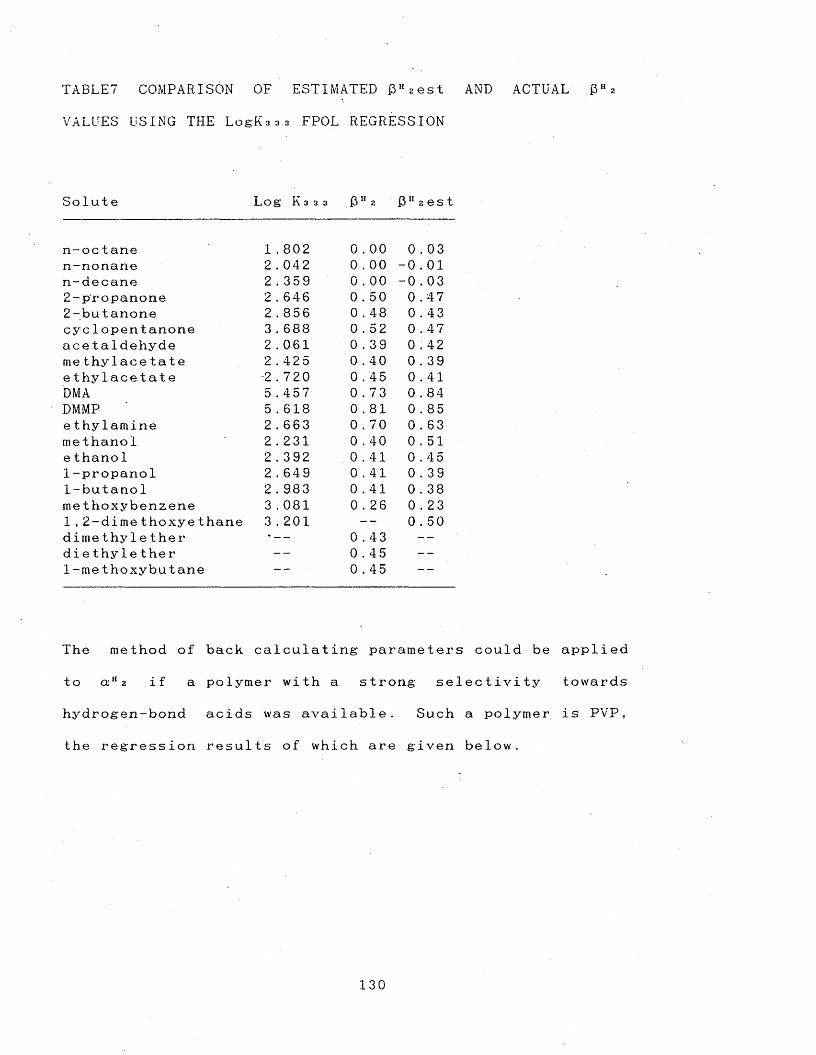
TABLE? COMPARISON OF ESTIMATED £ H 2est AND ACTUAL £ h2
VALUES USING THE LogKaaa FPOL REGRESSION
Solute Log K 3 3 3 $ h 2 D 11 2 es
n-octane 1 . 802 0 ,, 0 0 0 ,. 03n-nonane 2 . 04 2 0 ,. 0 0 - 0 ..01n-decane 2 . 359 0 ,.00 - 0 ,. 032 -p'r opanone 2 . 646 0 ., 50 0 .. 472 -butanone 2 . 856 0 ,. 48 0 .. 43eye 1 opentanone 3 . 6 8 8 0 ., 52 0 ,. 47acetaldehyde 2 . 061 0 ,, 39 0 ,; 42methylacetate 2 . 425 0 ., 40 0 ,,39ethylacetate 2 . 720 0 ,, 45 0 .. 41DMA 5 .457 0 ., 73 0 .. 84DMMP 5 . 618 0 ,, 81 0 .. 85ethylamine 2 .663 0 ., 70 0 .. 63methanol 2 . 231 0 .. 40 0 ,, 51e t hano 1 2 .392 0 ., 41 0 ,, 451 -propanol 2 . 649 0 .. 41 0 ,.391 -butano 1 2 . 983 0 ., 41 0 ., 38me thoxybenzene 3 . 081 0 ,. 26 0 ,. 231 ,2 -dimethoxyethane 3 . 201 -- 0 .. 50d i m e t hylether -- 0 ,. 43 --die thylether -- 0 .. 45 --1 -methoxybutane -- 0 ,, 4 5 --
The method of back calculating parameters could be applied
to ckh 2 if a polymer with a strong selectivity towards
hydrogen-bond acids was available. Such a polymer is P V P ,
the regression results of which are given below.
130
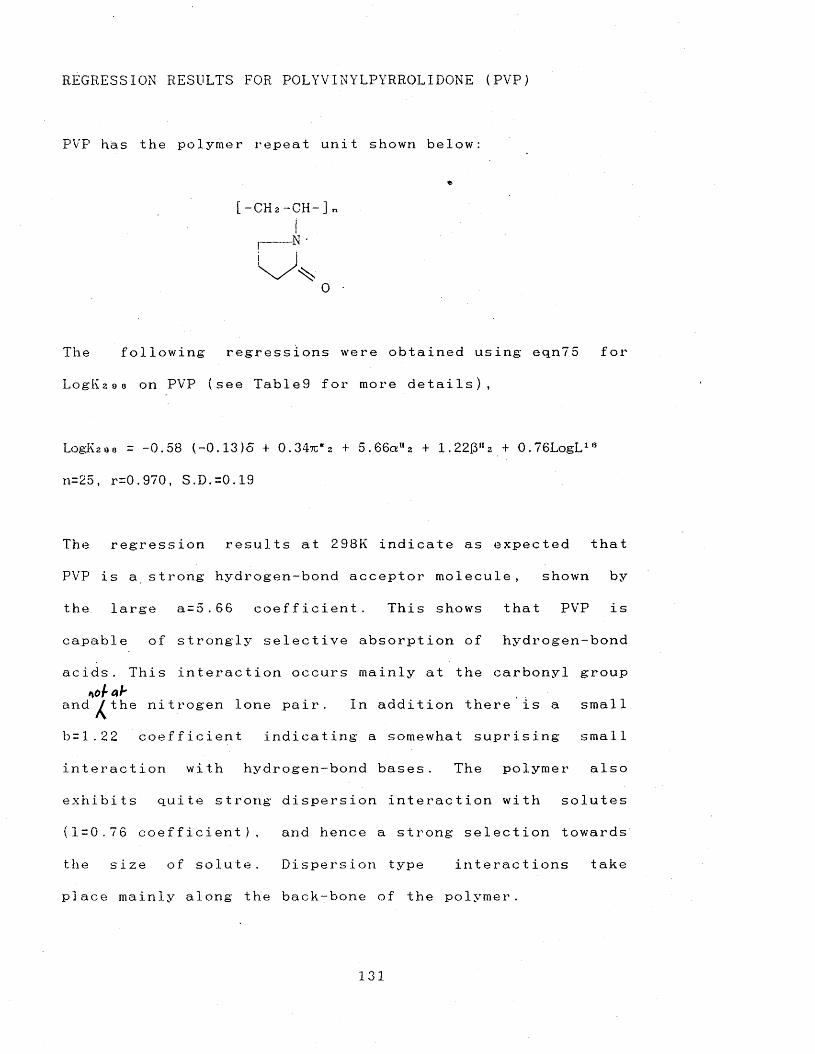
REGRESSION RESULTS FOR POLYVINYLPYRROLIDONE (PVP)
PVP has the polymer repeat unit shown below:
[-CH 2 -CH-]n
0
The following regressions were obtained using eqn75 for
LogK298 on PVP (see Table9 for more details),
LogK2 9 8 = -0.58 (-0.13)o + 0.34tc*2 + 5.66au2 + 1.220Hz_+ 0.76LogL18
n=25, r=0.970, S.D.=0.19
The regression results at 298K indicate as expected that
PVP is a strong hydrogen-bond acceptor molecule, shown by
the large a = 5 .66 coefficient. This shows that PVP is
capable of strongly selective absorption of hydrogen-bond
acids. This interaction occurs mainly at the carbonyl group nofab
a n d ^ t h e nitrogen lone pair. In addition there is a small
b=1.22 coefficient indicating a somewhat suprising small
interaction with hydrogen-bond bases. The polymer also
exhibits quite strong dispersion interaction with solutes
(1=0.76 coefficient), and hence a strong selection towards
the size of solute. Dispersion type interactions take
place mainly along the back-bone of the polymer.
131
REGRESSION RESULTS FOR POLYEPICHLOROHYDRIN (PECH)
PECH has the polymer repeat unit shown below:
[-O-CHz-CH-]nICH 2 Cl
The following regressions were obtaine'd using eqn75 for
LogKzas on PECH (see Table9 for more details),
LogK2 o» = -0.82 + (0.08)5 + 1.40tc*2 + 2.05a»2 + 1.47f5“ 2 + 0.86LogL16
n=39, r=0.978, S.D.=0.19
The regression results at 298K show that the polymer has a
medium sized coefficient of a=2.05, which indicates
selectivity towards hydrogen-bond acid solutes at the ether
linkage. This selectivity is not as strong as for PVP
(a=5.66), where the hydrogen-bond base polymer site was a
carbonyl group. There is also a small but statistically
significant coefficient of J3H 2 (b=1.47), which shows that
the -CH- bond may be sufficiently weakened by the electron
withdrawing groups (oxygen and chlorine) to take part in
hydrogen-bond interactions with hydrogen-bond bases. Strong
dispersion interaction with solutes is shown by the
coefficient of Log L ie (1=0.86), and some dipole
interaction is evident from the coefficient in tc*2
( s = 1 . 4 0 ) .
132
REGRESSION RESULTS FOR POLYETHYLENEMALEATE (PEM)
PEM has the polymer repeat unit shown below:
0 0li ii[-0-C-CH=CH-C-OCH2-C H z- ]„
The following- regressions were obtained using eqn?5 for
LogKzsB on PEM (see Table9 for more details),
LogK2 o s = -2.28 + -0.76c + 2.48tu*2 + 4.01aH2 + 1.29£H2 + l.OOLogL18
n=32, r=0.949, S.D.=0.36
The regression results at 298K show that the polymer has a
large coefficient of a H z (a = 4.0'l), which shows a strong
selectivity towards hydrogen-bond acid solutes (although
not as strong as PVP, a=5.66) which will occur at the
carbonyl groups of the polymer chain. There is also a small
but statistically significant coefficient of j3H 2 (b=1..29),
which may be due some hydrogen-bond donor activity at the
alkenic hydrogens; the C-H bond is weakened by the presence
of an adjacent ester type linkage. PEM also interacts quite
strongly with polar solutes as shown by the medium
coefficient of tz* z (s=2.48) and is a strong dispersion
interactor with a coefficient of 1=1.00 (note 1=1.00, by
definition for n-hexadecane, for which the solution forces
are cavity formation and dispersion only).
133

REGRESSION RESULTS FOR P O L Y (4-VINYLHEXAFLUOROCUMYLALCOHOL)
(P4VHFCA)
P4VHFCA has the polymer repeat unit shown below:
[- C H 2C H 2C H C H 2-]n
01
3F C-C-CF 3IOH
The following regressions were obtained using eqn75 for
LogKa 9 a and L o g (t !r*/t 'rc 1 3 ) 3 3 3 at 333K on P4VHFCA (see
Table9 for more de t a i l s ) ,
\
LogKz o a = -1.37 -1.29o + 2.857c* 2 + 2.59a112 + 5.OO0H2 +0.92LogLie
n=34, r=0.981, S.D.=0.31
r 1 it’»> iLogj | = -4.43 -0.735 + 1.99tc*3 + 2.00a“2 + 3.960»2 +0.71LogL16
I t ' RC 1 ° I| IL - 333
n=25, r=0.966, S.D.=0.17
The regression for results at 298K indicates that P4VHFCA
is a very strong hydrogen-bond acid (b=5.00), stronger than
FPOL (b=4.75). This is due to the presence of the
hexafluorodimethylcarbinol" [C F 3C (R )O H C F 3 ] functionality,
which results in a weakened 0-H bond,- which readily accepts
134
electron density from hydrogen-bona base solutes.. The
polymer also exhibits a selectivitj7 towards hydrogen-bond
acid solutes (a=2.85), but not as strong as PVP (a=5.66) or
PEM (a=4.01). P4VHFCA is quite a strong dipole interactor
as shown by the coefficient of tc* 2 (s=2.85).
At 333K the regression with L o g (t 'r x/ t !r c 1 3 ) 3 3 3 gives
similar coefficients to the regression of LogKags but all
reduced by about a factor of about 0.77. The coefficients
of the regressions can be directly compared because
L o g (t ’r x/t ’r c 13)333 is proportional to Log K333, but not
the SPo constants of the equations produced. As, for FPOL a
temperature correlation of results at 298K and 333K has
been carried out (see S e c 5 .1.3.P I 47) and the following
equation was determined:
r 1i t ’ R * jLog K x 29 s = 4.519 + 1.595Logj------ i
11 ’ B c 13 iI IL J 3 3
n=19, r = 0 .988, S.D.=0.14
If the coefficients of the regression at 333K are
multiplied by the factor 1.595 (in a similar fashion as
described for FPOL.) then the resulting coefficients do not
correspond very well (c.f. FPOL results for which good
agreement was obtained) to those for the regression at
298K, infact they are all too large (a factor of ca 1.3
(85 )
3
135
would have proved suitable). However it is still
interesting to note that the decrease of the hydrogen-bond,
polar, and Log L 16 coefficients was similar
REGRESSION RESULTS FOR POLYISOBUTYLENE (PIB)
PIB has the polymer repeat unit shown below:
[-CH2C ( C H 3 )2-]n
The following regressions were obtained using LogK.298 in
eqn75 for PIB (see Table9 for more details),
LogKaas = (-0.23) + 0.315 - 0.51tc*2 + 0.72aHa + 1.150"a + 0.86LogL16
n=36, r=0.968, S.D.=0.20
LogK2 9 8 = -0.32 + 0.94LogLie (excluding alcohols and ethylamine.)
n=29, r=0.960, S.D.=0.22
The regression for results at 298K using all the solute
parameters shows,- as expected, that PIB selects solutes
according to their size, as indicated by the coefficient of
L o g L 16 (1=0.86). However, statistically significant
coefficients of a 112 and 13112 were obtained, although small
(a=0.72 and b=1.15). This was not expected, and is at first
sight chemically unreasonable. The coefficients ”a" and ”b ”
could have been introduced because of support adsorption
effects, which would be prevalent if the support was not
136
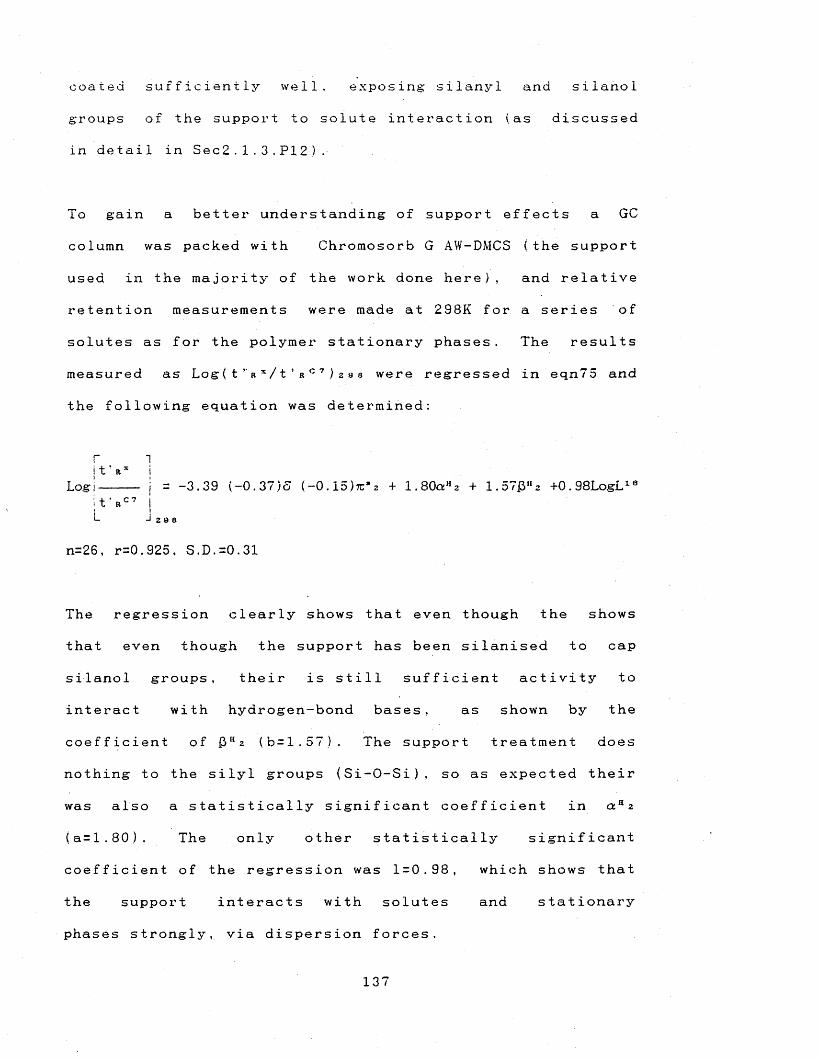
coated s u f f i c i e n t l y well. exposing- sil anyl and silanol
groups of the support to solute i n t e r a c t i o n (as d i s c u s s e d
in detail in S e c 2 . 1.3 .P 12).
To gain a better understanding of support effects a GC
column was packed with Chromosorb G AW-DMCS (the support
used in the majority of the work done here), and relative
retention measurements were made at 298K for a series of
solutes as for the polymer stationary p h a s e s . The results
measured as L o g ( t r x / 1 ’ r c 7 .) 2 9 a were regressed in eqn75 and
the following equation was determined:
r 1!t 'R * j
Logi j = -3.39 (-0.37)5 ( —0.15)7C*2 + 1.80aH2 + 1.5713"2 +0.98LogL18lt'RC7 i! I*- J 2 9 8
n=26, r=0.925, S.D.=0.31
The regression clearly shows that even though the shows
that even though the support has been silanised to cap
silanol groups, their is still sufficient activity to
interact with hydrogen-bond bases, as shown by the
coefficient of (3H2 (b=1.57). The support treatment does
nothing to the silyl groups (Si-O-Si), so as expected their
was also a statistically significant coefficient in a H 2
(a=1.80). The only other statistically significant
coefficient of the regression was 1=0.98, which shows that
the support interacts with solutes and stationary
phases strongly, via dispersion forces.
137
Bearing the above results for the support, it would not be
suprising for regressions for a non-polar stationary phase
such as PIB to include terms in a fI2 and 13H 2 , if bare
support was available for the solute to interact with.
Reconciled with the knowledge that support interaction was
the likely cause for the coefficients in a u 2 and j3H 2 , a
further regression W a s carried out using L o g K 2 9 8 results
for PIB using only the solute parameter L o g L 1 6 , and
eliminating all alcohols and ethylamine (a bad point in the
previous PIB regression). The resulting regression (given
below the regression using all the solute parameters,
above) was similar in its statistical fit and the overall
standard deviation increased from only 0.20 to 0.22, and
the correlation coefficient dropped from 0.968 to 0.960.
The equation using only L o g L 16 is clearly the best one to
use in this instance for PIB. The importance of choosing
suitable stationary phase loadings is highlighted here. If
a higher loading of PIB was used, .then the support effects
might have been eliminated, or at least, somewhat reduced.
1 3 8
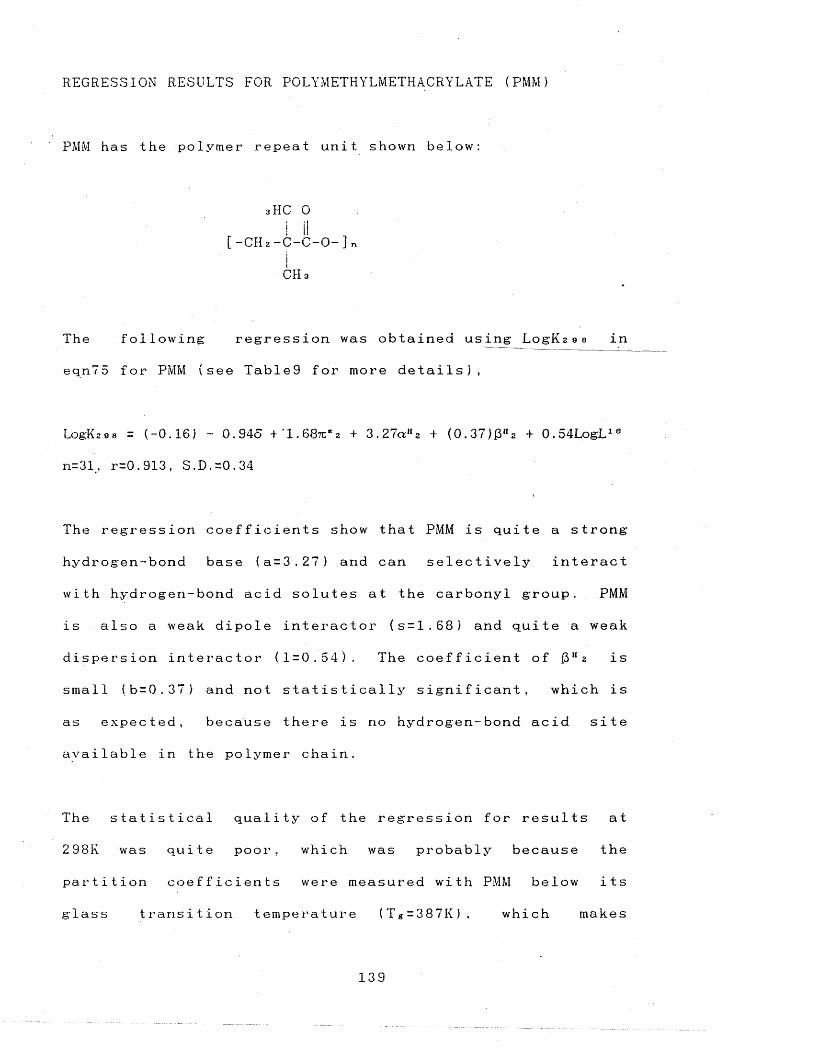
REGRESSION RESULTS FOR POLYMETHYLMETHACRYLATE (P M M )
PMM has the polymer repeat unit shown below:
3HC 0i j j
[-CH2-C-C-0-]njCH 3
The following regression was obtained using L o g K 298 in
eqn75 for PMM (see Table9 for more d e t a i l s ) ,
LogK2oe = (-0.16) - 0.94o + '1.687c*2 + 3.27a«2 + (O.37)0«2 + 0.54LogL18
n=31, r=0.913, S.D.=0.34
The regression coefficients show that PMM is quite a strong
hydrogen-bond base (a=3.27) and can selectively interact
with hydrogen-bond acid solutes at the carbonyl group. PMM
is also a weak dipole interactor (s=1.68) and quite a weak
dispersion interactor (1=0.54). The coefficient of p H2 is
small (b=0.37) and not statistically significant, which is
as expected, because there is no hydrogen-bond acid site
available in the polymer chain.
The statistical quality of the regression for results at
298K was quite poor, which was probably because the
partition coefficients were measured with PMM below its
glass transition temperature (Tg=387K), which makes
139
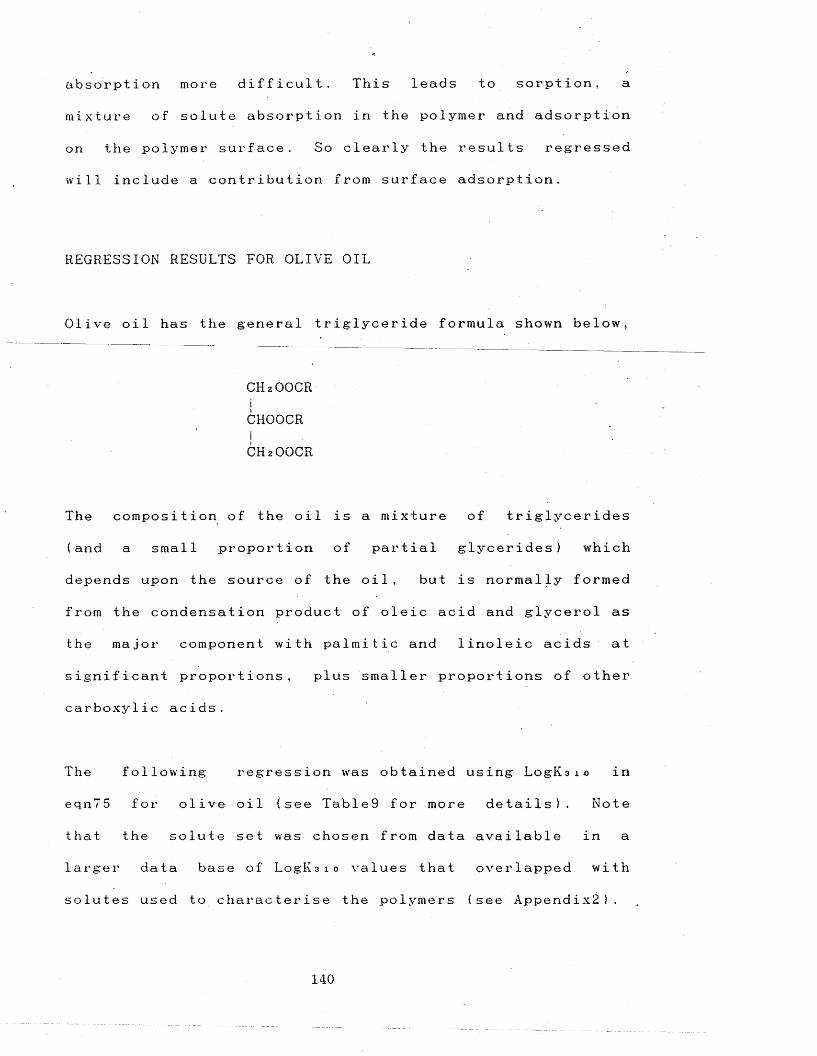
absorption more difficult. This leads to sorption, a
mixture of solute absorption in the polymer and adsorption
on the polymer surface. So clearly the results regressed
will include a contribution from surface adsorption.
REGRESSION RESULTS FOR OLIVE OIL
Olive oil has the general triglyceride formula shown below,
C H 2OOCRiCHOOCRic h 2o o c r
The composition of the oil is a mixture of triglycerides
(and a small proportion of partial glycerides) which
depends upon the source of the oil, but is normally formed
from the condensation product of oleic acid and glycerol as
the major component with palmitic and linoleic acids at
significant proportions, plus smaller proportions of other
carboxylic acids.
The following regression was obtained using LogK3io in
eqn75 for olive oil (see Table9 for more details) . Note
that the solute set was chosen from data available in a
larger data base of LogI\3 10 values that overlapped with
solutes used to characterise the polymers (see A p p e n d i x 2 ) .
140
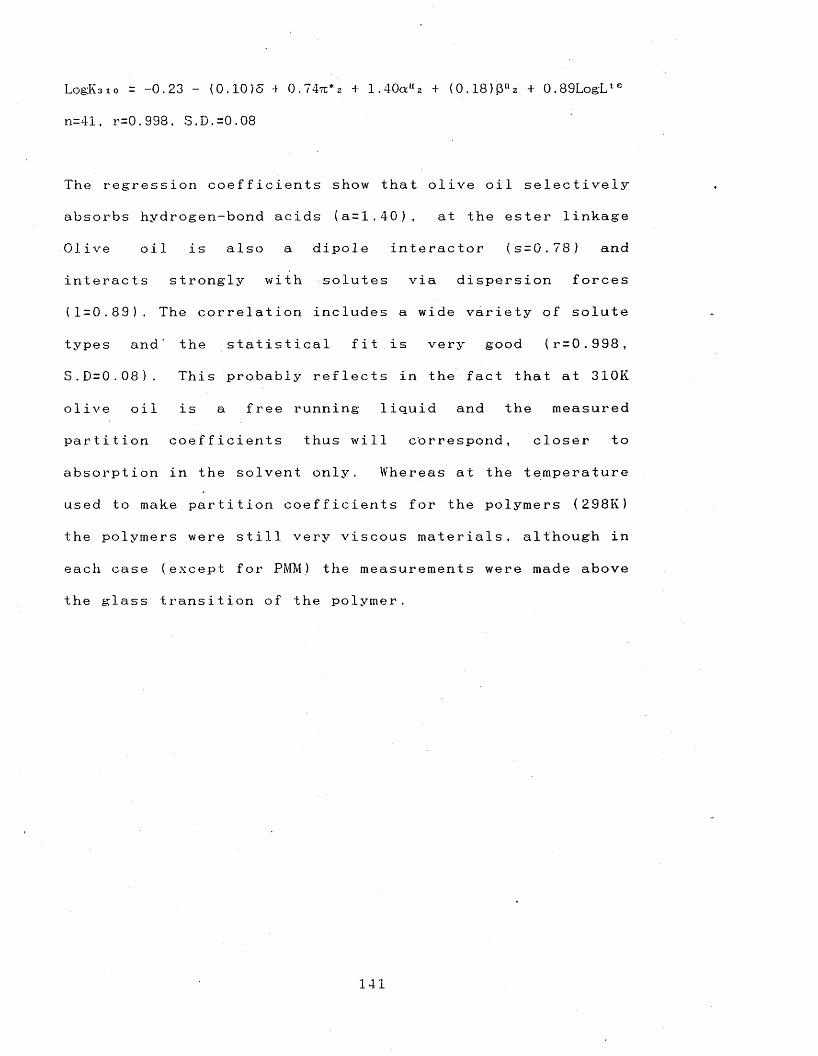
LogK310 = -0.23 - (0.10)5 + 0.74tc*z + 1.40aH2 + (0.18)fSHz + 0.89LogL16
n=41, r=0.998. S.D.=0.08
The regression coefficients show that olive oil selectively
absorbs hydrogen-bond acids (a=1.40), at the ester linkage
Olive oil is also a dipole interactor (s=0.78) and
interacts strongly with solutes via dispersion forces
(1=0.89). The correlation includes a wide variety of solute
types and' the statistical fit is very good (r=0.998,
S. D =0.08). This probably reflects in the fact that at 310K
olive oil is a free running liquid and the measured
partition coefficients thus will correspond, closer to
absorption in the solvent only. Whereas at the temperature
used to make partition coefficients for the polymers (298K)
the polymers were still very viscous materials, although in
each case (except for P M M ) the measurements were made above
the glass transition of the polymer.
141
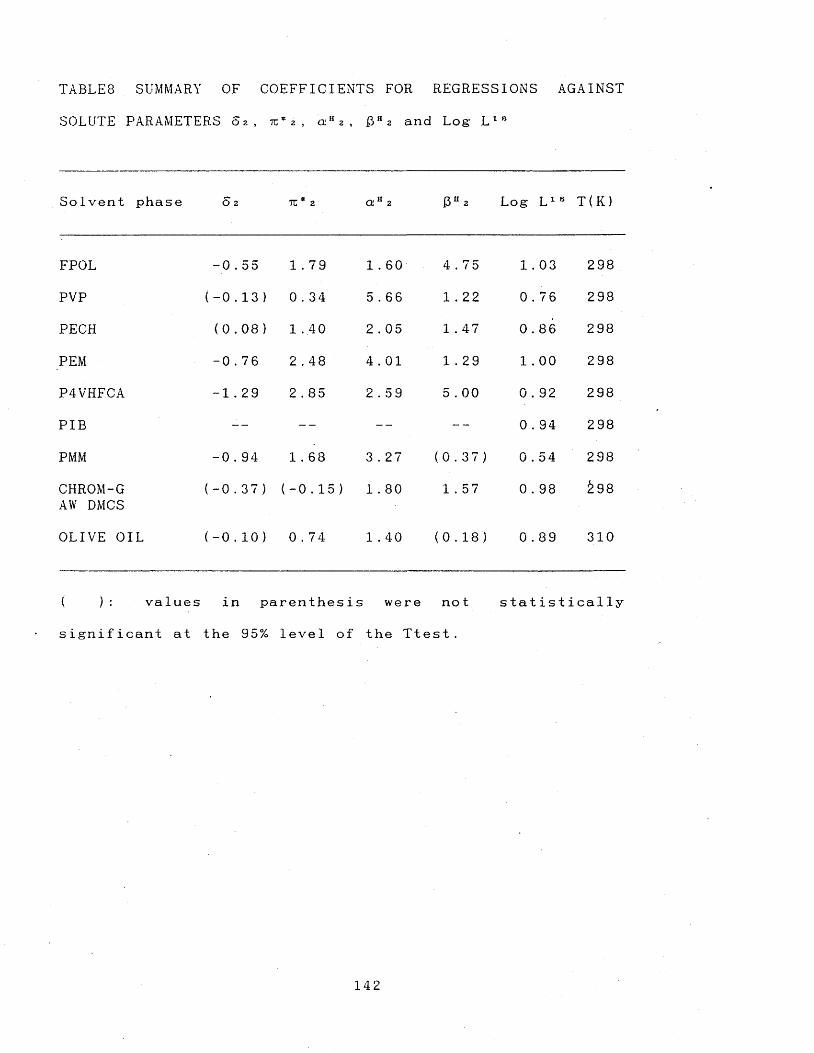
TABLE8 SUMMARY OF COEFFICIENTS FOR REGRESSIONS AGAINST
SOLUTE PARAMETERS 0 2 , t z * z , a u 2 , j3H2 and Log- L 1 8
Solvent phase 0 2 7U * 2 a H 2 0 H2 Log L 16 T(K)
FPOL -0.55 1 . 79 1 . 60 4.75 1. 03 298
PVP (-0.13) 0.34 5 . 66 1 . 22 0 . 76 298
PECH (0.08) 1 .40 2 . 05 1 . 47 0 . 86 298
PEM -0.76 2 . 48 4 . 01 1 . 29 1 . 00 2 98
P4VHFCA -1 . 29 2 . 85 2 . 59 5 . 00 0. 92 298
PIB -- -- -- -- 0 . 94 298
PMM -0 . 94 1 . 68 3 . 27 (0.37) 0.54 298
CHROM-G AW DMCS
(-0.37) (-0.15) 1 . 80 1 . 57 0 . 98 &98
OLIVE OIL (-0.10) 0 . 74 1 . 40 (0.18) 0 . 89 310
( ): values in parenthesis were not statistically
significant at the 95% level of the Ttest.
14 2
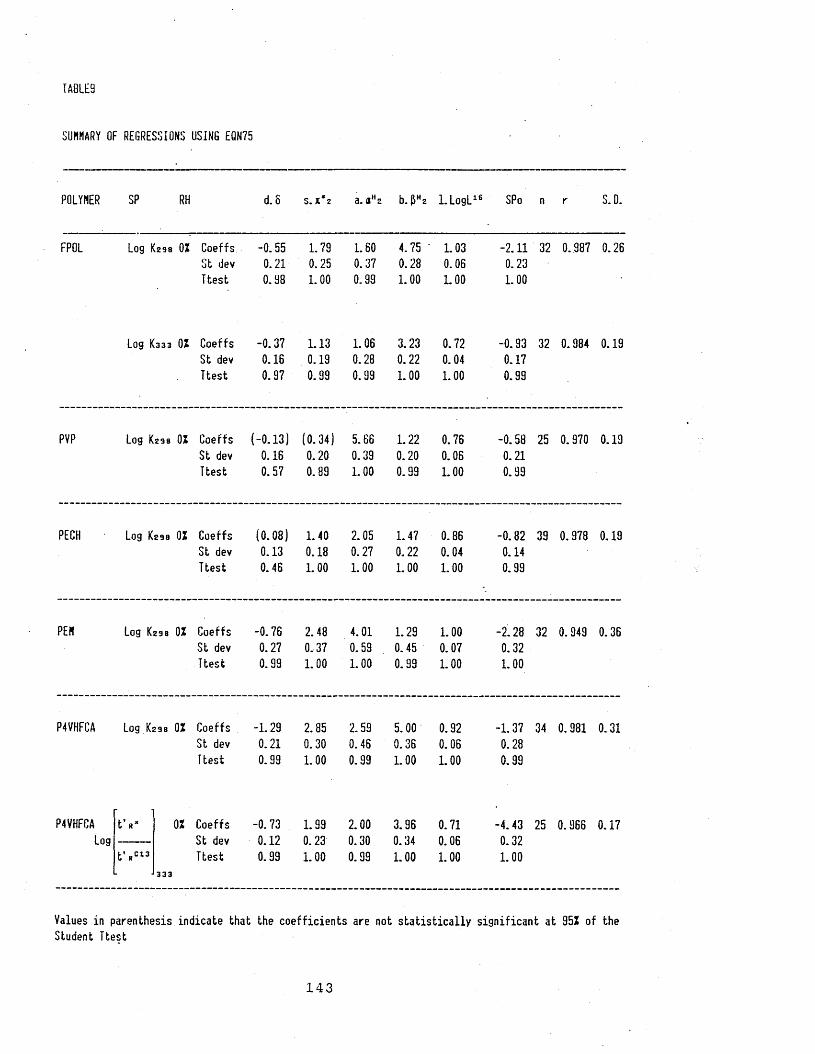
TABLES
SUMMARY OF REGRESSIONS USING EQN75
POLYMER SP RH d.8 S. X*2 a. aH2 M H2 1.LogL16 SPo n r S.D.
FPOL Log K298 0Z Coeffs -0.55 1.79 1.60 4.75 ' 1.03 -2.11 32 0. 987 0.26St dev 0.21 0.25 0.37 0.28 0.06 0.23Ttest 0.98 1.00 0.99 1.00 1.00 1.00
Log K333 0Z Coeffs -0.37 1.13 1.06 3.23 0.72 -0.93 32 0.984 0.19St dev 0.16 0.19 0.28 0.22 0.04 0.17Ttest 0.97 0.99 0.99 1.00 1.00 0.99
PVP Log <298 0Z Coeffs (-0.13) (0.34) 5.66 1.22 0.76 -0.58 25 0.970 0.19St dev 0.16 0.20 0.39 0.20 0.06 0.21Ttest 0.57 0.89 1.00 0.99 1.00 0.99
PECH Log <29 8 0Z Coeffs (0.08) 1.40 2.05 1.47 0.86 -0.82 39 0.978 0.19St dev 0.13 0.18 0.27 0.22 0.04 0.14Ttest 0.46 1.00 1.00 1.00 1.00 0.99
PEN Log <298 0Z Coeffs -0.76 2.48 4.01 1.29 1.00 -2.2Q 32 0.949 0.36St dev 0.27 0.37 0.59 0.45 0.07 0.32Ttest 0.99 1.00 1.00 0.99 1.00 1.00
P4VHFCA Log <298 0Z Coeffs -1.29 2.85 2.59 5.00 0.92 -1.37St dev 0.21 0.30 0.46 0.36 0.06 0.28Ttest 0.99 1.00 0.99 1.00 1.00 0.99
P4VHFCA ft v 0Z Coeffs -0.73 1.99 2.00 3.96 0.71 -4.43
Log St dev 0.12 0.23 0.30 0.34 0.06 0.32t V 13 Ttest 0.99 1.00 0.99 1.00 1.00 1.00. 333
Values in parenthesis indicate that the coefficients are not statistically significant at 95Z of the Student Ttest
143

TABLE3 CONT’D
SUMMARY OF REGRESSIONS USING EQN75
POLYMER SP RH d.6 S.X*2 a. flHz M H2 L L o g L 16 SPo n r S.O.
PIB Log K29B OZ Coeffs 0.31 -0.51 0.72 1.15 0.86 (-0.23) 36 0.968 0.20St dev 0.15 0.17 0.28 0.20 0.05 0.16Ttest ■ 0.96 0.99 0.98 0.99 1.00 0.83
Log K298 0Z Coeffs (-0.17) 0.36 1.00 -0.66 29 0.969 0.21St dev 0.12 0.14 0.06 0.20Ttest 0.80 0.98 1.00 0.99
Log Kz 3b 0Z Coeffs 0.94 -0.32 29 0.960 0.22St dev 0.05 0.15Ttest 1.00 0.96
Note in the last two regressions all alcohols and ethylanine were eliminated
PMH Log K29B 0Z Coeffs -0.94 1.68 3.27 (0.37) 0.54 (-0.16) 31 0.913 0.34St dev 0.34 0.45 0.51 0.53 0.08 0.30Ttest 0.99 0.99 0.99 0.50. 1.00 0.41
CHR0N G AW-DHCS
Logt vt V 7
OZ
298
Coeffs St dev Ttest
(-0.37) 0.35 0.70
(-0.15) 0.35 0.33
1.80 0.48 0.99
1.57 0.48 0.99
0.98 0.11 1.00
-3.39 0.37 1.00
26 0.925 0.31
OLIVE OIL Log Kaio 0Z Coeffs (-0.10) 0.74 1.40 (0.18) 0.89 -0.23 41 0.998 0.08St dev 0.05 0.08 0.11 0.09 0.01 0.06Ttest 0.94 1.00 1.00 0.94 1.00 0.99
Values in parenthesis indicate that the coefficients are not statistically significant at 952 of the Student Ttest
144

TA0LE1O
SUHHARY OF REGRESSIONS USING EQN73
POLYHER SP RH d. 5 S.X*2 a. aH2 M Hz v.Vx SPo n r S.D.
FPOL Log Kzafl OZ Coeffs (0.14) 2.97 2.21 5.45 3.84 -3.23 32 0.964 0.43St dev 0.34 0.48 0.65 0.47 0.39 0.50Ttest 0.32 0.99 0.99 1.00 1.00 0.99
Log K333 0Z Coeffs (0.12) 1.91 1.44 3.72 2.62 -1.64 32 0.953 0.33St dev 0.26 0.37 0.50 0.36 0.30 0.39Ttest 0.34 0.99 0.99 1.00 1.00 0.99
PVP Log K298 0Z Coeffs (0.30) 1.14 6.29 1.68 2.84 -1.38 25 0.934 0.28St dev 0.24 0.32 0.61 0.31 0.33 0.41Ttest 0.78 0.99 1.00 0.99 1.00 0.99
PECH Log <298 0Z Coeffs 0.57 2.05 2.36 1.60 2.79 -1.12 40 0.923 0.37St dev 0.25 0.40 0.54 0.41 0.25 0.32Ttest 0.97 0.99 0.99 0.99 1.00 0.99
PEM Log <298 0Z Coeffs (-0.29) 3.56 4.54 1.76 3.67 -3.22 32 0.900 0.50St dev 0.37 0.59 0.86 0.62 0.38 0.55Ttest 0.56 0.99 0.99 0.99 1.00 0.99
P4VHFCA Log <298 0Z Coeffs -0.78 4.22 3.33 5.65 3.72 -2.81 34 0.978 0.34St dev 0.23 0.38 0.52 0.40 0.26 0.40Ttest 0.99 1.00 0.99 1.00 1.00 1.00
P4VHFCA t v Coeffs -0.33 2.92 2.70 4.27 2.75 -5.32 25 0. 968 0.16Log OZ St dev 0.11 0.27 0.32 0.35 0.21 0.38
t v 13333
Ttest 0.99 1.00 1.00 1.00 1.00 1.00
Values in parenthesis indicate that the, coefficients are not statistically significant at 95Z of the Student Itest
145
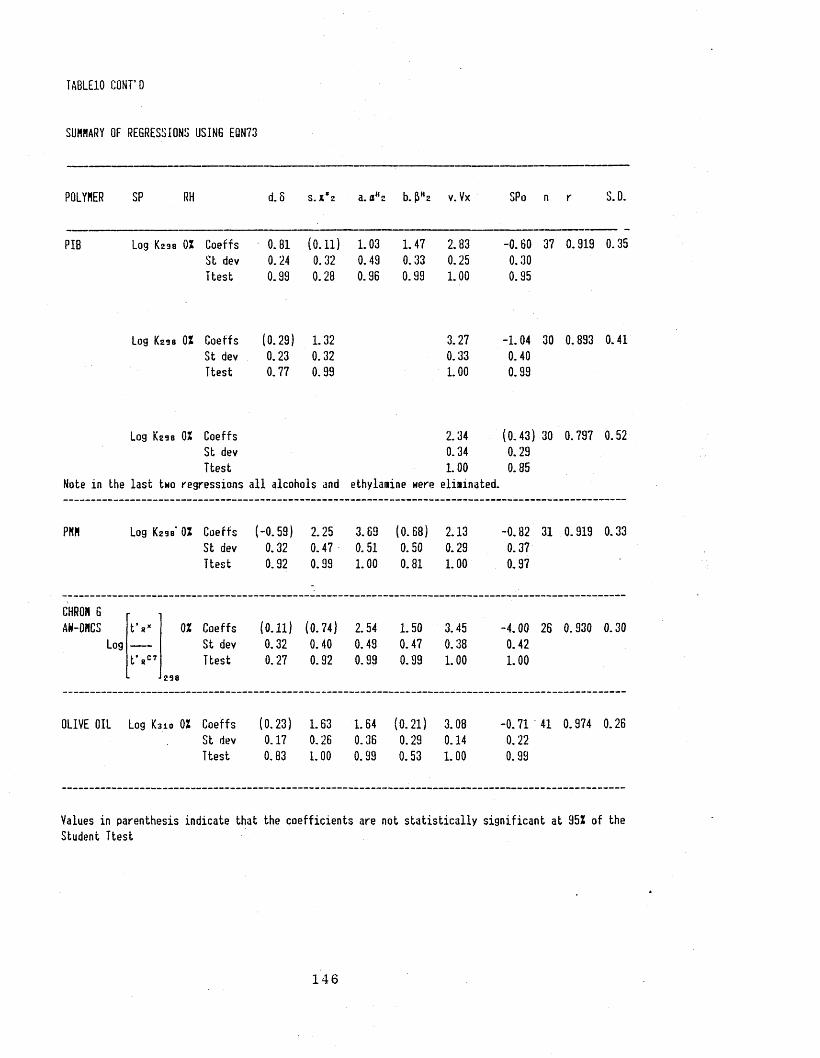
TABLE10 CONT’0
SUMMARY OF REGRESSIONS USING EQN73
POLYMER SP RH d.S S. **2 a. aM 2 M H2 v. Vx SPo
PIB Log <298 0Z Coeffs 0.81 (0.11) 1.03 1.47 2.83 -0.60St dev 0.24 0.32 0.49 0.33 0.25 0.30Ttest 0.99 0.28 0.96 0.99 1.00 0.95
Coeffs (0.29) 1.32 3.27 -1.04 30 0.893 0.41St dev 0.23 0.32 0.33 0.40Ttest 0.77 0.99 1.00 0.99
Log K29B OZ Coeffs 2.34 (0.43) 30 0.797 0.52St dev 0.34 0. 29Ttest 1.00 0.85
Note in the last tuo regressions all alcohols and ethylanine were eliainated.
PMM Log K29B* 0Z Coeffs St dev Ttest
(-0.59) 0.32 0.92
2.250.470.99
3.69 0.51 1.00
(0.68) 0.50 0.81
2.130.291.00
-0.82 0.37 0.97
31 0.919 0.33
CHR0M GAH-DflCS t v ox Coeffs (0.11) (0.74) 2.54 1.50 3.45 -4.00 26 0.930 0.30
Log -- St dev 0.32 0.40 0.49 0.47 0.38 0.42t V 7 Ttest 0.27 0.92 0.99 0.99 1.00 1.00
298
OLIVE OIL Log <310 0Z Coeffs (0.23) 1.63 1.64 (0.21) 3.08 -0.71 41 0.974 0.26St dev 0.17 0.26 0.36 0.29 0.14 0.22Ttest 0.83 1.00 0.99 0.53 1.00 0.99
Values in parenthesis indicate that the coefficients are not statistically significant at 95Z of the Student Ttest
146
5.1.3. MEASUREMENTS MADE ABOVE AMBIENT TEMPERATURE FOR
POLYMERIC LIQUIDS
At 298K the chromatography of some solutes is very
difficult, for example the larger solutes and strong
hydrogen-bond bases (such as N ,N-dimethylacetamide, DMA,
and dimethylmethylphosphonate, D M M P , which are of interest
in SAW work) . The solute peaks sometimes take a long time
to elute or not at all under the ambient temperature
conditions. This necessitates large sample injection with
the concurrent problem of skewed peaks and sample size-
retention volume dependency . Short columns were used to
alleviate this problem but even with these elution of
strongly retained solutes was sometimes a problem.
For FPOL and P4VHFCA it was necessary to carry out some
measurements at temperatures above ambient. Correlations
were made between results at 298K and the higher
temperature, for solutes for which suitable measurements
could be made at both temperatures. Using the temperature
correlation, then a partition coefficient (or relative
retention measurement) determined at the higher
temperature, for a solute apparently impossible to elute at
298K, can be used to predict its partition coefficient at
298K. Such temperature correlations assume that that the
relative molar heats of solution at the higher temperature
and 298K of the solutes correlated are invariant with
1 47
temperature, which is not strictly true but acceptable over
the limited temperature range studied (from 298K to 3 7 3 K ) .
FPOL PARTITION COEFFICIENT TEMPERATURE CORRELATION
Absolute partition coefficients were determined at 333K for
n-alconols using a Pye 104 with a katharometer detector (in
addition to those at 298K) see T a ble39.P 2 3 8 . Partition
coefficients for other solutes were then calculated from
relat ive re tent ion measurements to the standard n - a l c o h o 1 K
values at 333K or 298K using a Perkin-Elmer Fll with FID
(see T a b l e 3 8 ,P 2 3 6 ). The lower retention times obtained at
333K enabled smaller solute sample injections to be made,
with the advantage of lower solute concentrations and the
reduced chance of column overloading effects such as
support adsorption. The peak symmetry obtained at 333K was
quite good for n-alcohols and much superior than at 298K.
This is probably due to two main causes: the f i r s t ,' because
the solute concentrations used at 333K are closer to
infinite dilution, and the second, because FPOL at 333K is
considerably less viscous at 333K than at 298K and thus
solute absorption is made easier at 333K. Equilibration of
solute vapour between the carrier gas and FPOL liquid
stationary phase is therefore quicker at 333K.
Measurements of K 3 3 3 were made for a range of solutes (x) ,
and for the 27 partition coefficients values (Kx ) available
148
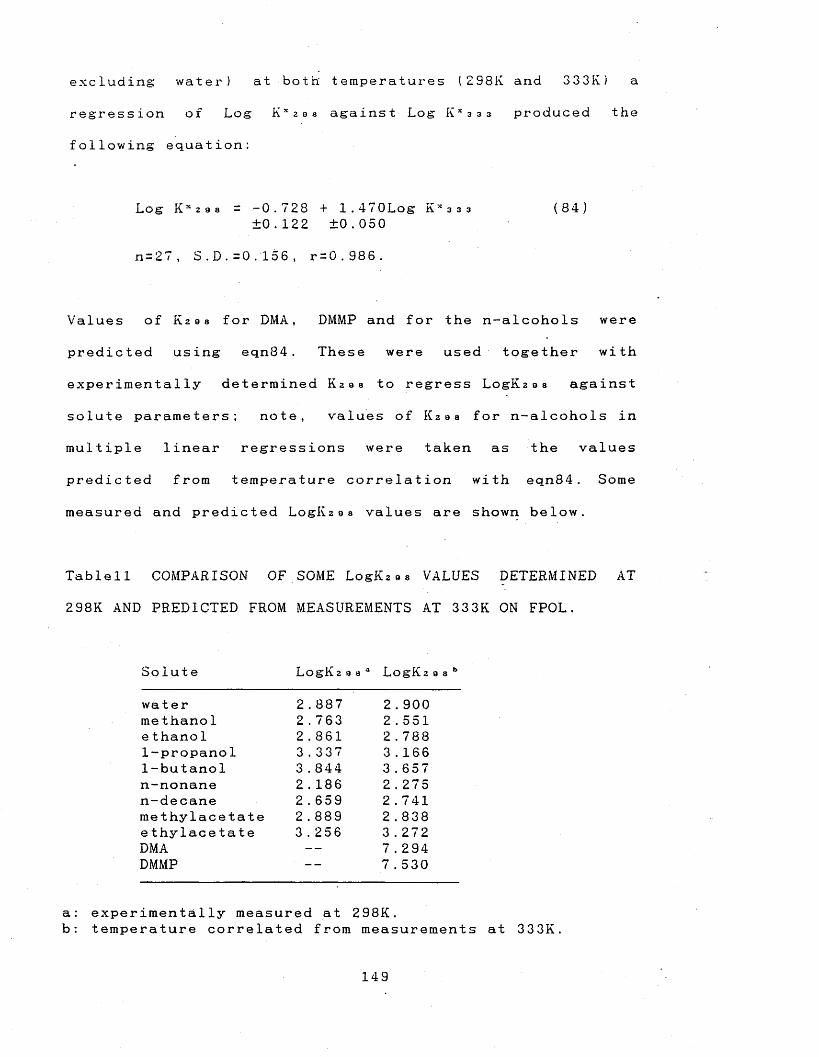
excluding water) at both temperatures (298K and 333K) a
regression of Log K x298 against Log K x 3 3 3 produced the
following equation:
Log K x 2 9 8 — —0.728 + 1.470Log K x 3 3 3 (84)±0.122 ±0.050
n = 2 7, S.D.=0/156, r = 0.986.
Values of K 2 9 8 for DMA, DMMP and for the n-alcohols were
predicted using e q n 8 4 . These were used together with
experimentally determined Kjqs to regress LogK.298 against
solute parameters; note, values of K 2 9 8 for n-alcohols in
multiple linear regressions were taken as the values
predicted from temperature correlation with e q n 8 4 . Some
measured and predicted L o g K 2 9 8 values are shown below.
Tablell COMPARISON O F .SOME L o g K 298 VALUES DETERMINED AT
298K AND PREDICTED FROM MEASUREMENTS AT 333K ON FPOL.
Solute L o g K 2 9 a a LogK2 9 s b
water 2 . 887 2 . 900m e t h a n o 1 2 . 763 2 . 551e thano1 2 . 861 2 . 7881-propanol 3 . 337 3 . 1661-butanol 3 . 844 3 . 657n-nonane 2 . 186 2 . 275n-decane 2 . 659 2 . 741methylacetate 2 . 889 2 . 838e thylacetate 3 . 256 3 . 272DMA -- 7 . 294DMMP — 7 . 530
a: experimentally measured at 298K.b: temperature correlated from measurements at 333K.
149
P4VHFCA PARTITION COEFFICIENT TEMPERATURE CORRELATION
Absolute partition coefficients were determined at 298K and
relative partition coefficients to standard n-alkanes,
using a Perkin-Elmer Fll with FID. Measurements of strong
bases and n-alcohols proved unsuitable because of long
elution times and the highly tailed peaks produced.
Relative retention times at 333K were made against
tridecane, which provided much improved elution peaks for
the n-alcohols studied. However the retention times of DMA
and DMMP still proved to be inordinately large, so some
limited measurements were made at 373K relative to
oc tadecane.
At 298K a -correlation of Log Kzae against
(C n ) for the five n-alkanes studied
corre lation:
Log K 2 9 8 = -1.618 + 0.456Cn (86)±0.089 ±0.009
n=5, r = 0 .999, S.D.=0.028
From this correlation Log K 2 9 8 values for n-alkanes can be
predicted, and for octadecane (C18.) a value of
Log K c 10 2 9 8=6.590 was obtained. This value was used
together with logged adjusted relative retention times at
373K (L o g [t ’rx/t ’rc 18]3 7 3 ) in eqn87, to predict from
results at 373K, values of Log K 2 9 8 for DMA and DMMP.
carbon number
produced the
150
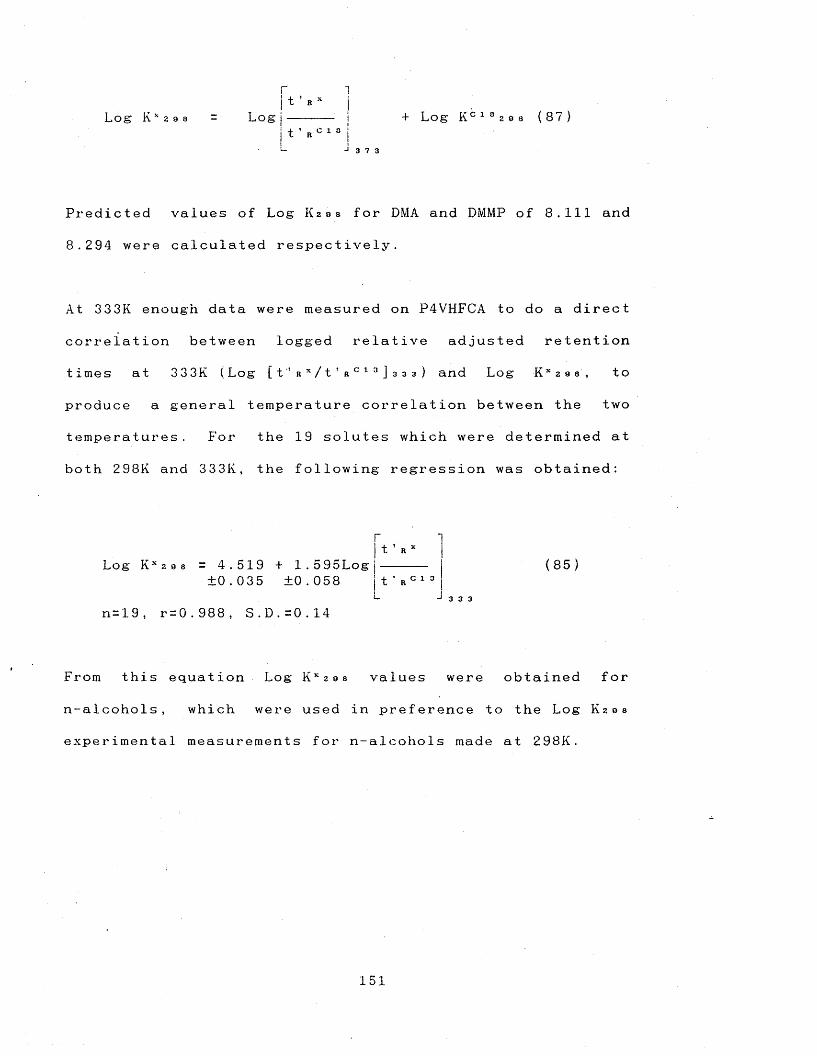
Log R s 2 9 8 = Logj------ | + Log K c 10 2 9 s (87)| t ’ R ° 1 ° |L J -1 7 o
Predicted values of Log K 2 9 8 for DMA and DMMP of 8.111 and
8.294 were calculated respectively.
At 333K enough data were measured on P4VHFCA to do a direct
correlation between logged relative adjusted re tent ion
times at 333K (Log [t" rx/ 1 ’ rc 13] 3 3 3 ) and Log K x 2 98, to
produce a general temperature correlation between the two
temperatures. For the 19 solutes which were determined at
both 298K and 333K, the following regression was obtained:
rI t ’ R X
Log K x 2 9 8 = 4.519 + 1.5 95Log|------ (85)±0.035 ±0.058 j t ' R C13
I_n=19, r = 0 . 9 8 8, S.D.=0.14
From this equation Log K x298 values were obtained for
n-alcohols, which were used in preference to the Log K 2 9 8
experimental measurements for n-alcohols made at 298K.
151
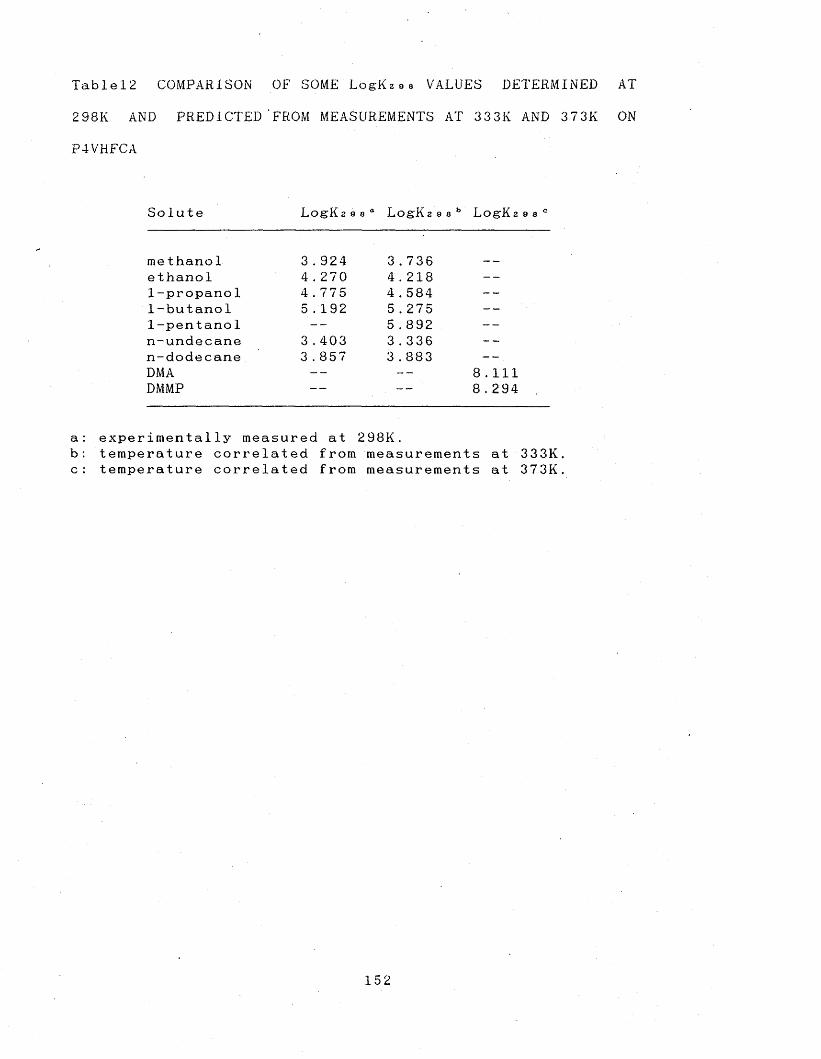
cr p)
T a b 1e 12 COMPARISON OF SOME LogKzss VALUES DETERMINED AT
298K AND PREDICTED'FROM MEASUREMENTS AT 333K AND 373K ON
P4VHFCA
Solute L o g K 2 9 8 ° LogKz 8 8 b Log'K 2 9 8 c
me thano1 3 . 924 3 . 736e thanol 4 . 270 4 . 218 --1-propanol 4.775 4 . 584 --1-butano1 5 .192 5.275 --1-pentanol -- 5 .892 --n-undecane 3 . 403 3 . 336 --n-dodecane 3 . 857 3 . 883DMA -- -- 8 . IllDMMP — — 8.2 94
: experimentally measured at 298K.: temperature correlated from measurements at 333K.
c: temperature correlated from measurements at 373K.
152
5.1.4. COMPARISON OF K g l c AND K s a w RESULTS
The partition coefficients measured by GLC ( K g l c ) and by
SAW devices ( K s a w .) are directly compared in Tablel3 as
logged values for eight-nine solutes on six polymeric
phases. The agreement between K g l c and K s a w is generally
quite good, although some polymeric phases gave closer
results than others (e.g. PECH) . However even for the
polymeric phases where results were not the same the trends
(e.g. FPOL) in partition coefficients from one solute to
another were generally the same. To illustrate this it is
convenient to use bar graphs showing the LogKs a w and
LogKcLc values for the eight-nine solute vapours on six
individual polymeric phases (see Figl4), and the K s a w and
K g l c values of specific solute vapours on the six.different
polymeric phases (see Figl5.). The bar graph patterns
confirm that even when there are systematic differences
between K s a w .and K g l c , the partition coefficient patterns
(or response patterns) are still very similar Note that,
although the individual partition coefficients are
important, it is the polymer "fingerprint" patterns in
FiglS that are most important in identifying or
characterising the solute vapours in chemical sensor
arrays. And likewise it is the solute "fingerprint’'
patterns shown in Figl4 that characterise the polymeric
p h a s e .
153

The agreement of the results. shows that GLC can be used
successfully to characterise potential SAW phases and
predict SAW frequency shifts via eqn34. and hence a’\
rational for the development of SAW and GLC phases. The
close agreement of some results indicates that the
mechanism of sorption in SAW devices is seemlier, and can
be approximated to that in GLC, i.e. reversible solute
sorption under equilibrium conditions. Where systematic
differences are found, these are very likely to bef:
associated with the methodological differences between the
two techniques, as discussed in S e c 2 .2.3.P 4 9, in particular
the SAW results were measured at about 308±2K, whereas the
GLC results were measured under under isothermal conditions
at 298.2 0 ± 0 .0 5 K . The temperatures at which K s a w and K g l c
were measured should lead to lower K s a w values than K g l c ,
and this is generally found to be the case for large LogK
values (4-8) but less so for solute vapours with smaller
LogK values (0-4).
The SAW partition coefficients presented were measured
using a 158MHz SAW device at the Naval Research
Laboratory in Washington by Dr J Grate and represent
interim results only, except for the results on F P O L 0 5 .
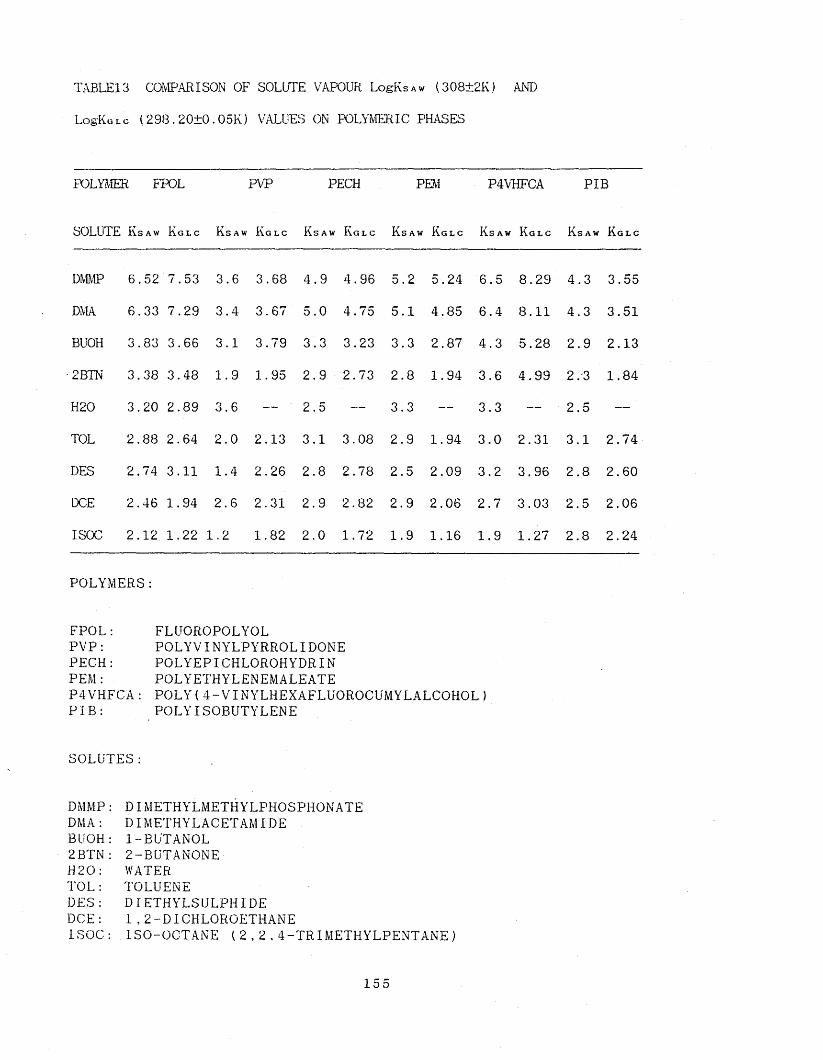
TABLE 13 COMPARISON OF SOLUTE VAPOUR Lo sKsaw (308±2K.) AND
Log'Ku l c ( 298. 20±0.05K) VALUES ON POLYMERIC PHASES
POLYMER FPOL PVP PECH PEM P4VHFCA PIB
SOLUTE K s a w K g l c K s a w K g l c K s a w K g l c K s a w K g l c K s a w K g l c K s a w K g l c
DMMP 6.52 7.53 3.6 3.68 4.9 4.96 5.2 5.24 6.5 8.29 4.3 3.55
DMA 6.33 7.29 3.4 3.67 5.0 4.75 5.1 4.85 6.4 8.11 4.3 3.51
BUOH 3.83 3.66 3.1 3.79 3.3 3.23 3.3 2.87 4.3 5.28 2.9 2.13
2BTN 3.38 3.48 1.9 1.95 2.9 2.73 2.8 1.94 3.6 4.99 2/3 1.84
H20 3.20 2.89 3.6 — ' 2.5 — 3.3 — 3.3 — 2.5 —
TOL 2.88 2.64 2.0 2.13 3.1 3.08 2.9 1.94 3.0 2.31 3.1 2.74
DES 2.74 3.11 1.4 2.26 2.8 2.78 2.5 2.09 3.2 3.96 2.8 2.60
DCE 2.46 1.94 2.6 2.31 2.9 2.82 2.9 2.06 2.7 3.03 2.5 2.06
ISOC 2.12 1.22 1.2 1.82 2.0 1.72 1.9 1.16 1.9 1.27 2.8 2.24
P O L Y M E R S :
F P O L : FLUOROPOLYOLPVP: POLYVINYLPYRROLIDONEP E C H : POLYEPICHLOROHYDRINPEM: POLYETHYLENEMALEATEP 4 V H F C A : POLY(4-VINYLHEXAFLUOROCUMYLALCOHOL) PIB: POLYISOBUTYLENE
S O L U T E S :
D M M P : DIMETHYLMETHYLPHOSPHONATEDMA: DIMETHYLACETAMIDEBUOH: 1-BUTANOL2 B T N : 2-BUTANONEH 2 0 : WATERTOL: TOLUENEDES: D 1' ETHYLS ULPHI DED C E : 1 ,2-DICHLOROETHANEISOC: ISO-OCTANE (2,2,4-TRIMETHYLPENTANE)
15 5

FIG14 BAR GRAPHS SHOWING LOGKsaw AND LCGKglc PATTERNS FOR A SERIES OF
SOLUTE VAPOURS IN INDIVIDUAL POLYMERIC PHASES
rPOL GLC
7
c
o
FPOL SAW98
7
» *<3 5
3
20 SOLUTC
PVP GLC
Om w P Ow a 0U-OH 287N rot OCS OC£ *SOCs o l u t e
PVP SAW
SOLUTE
156
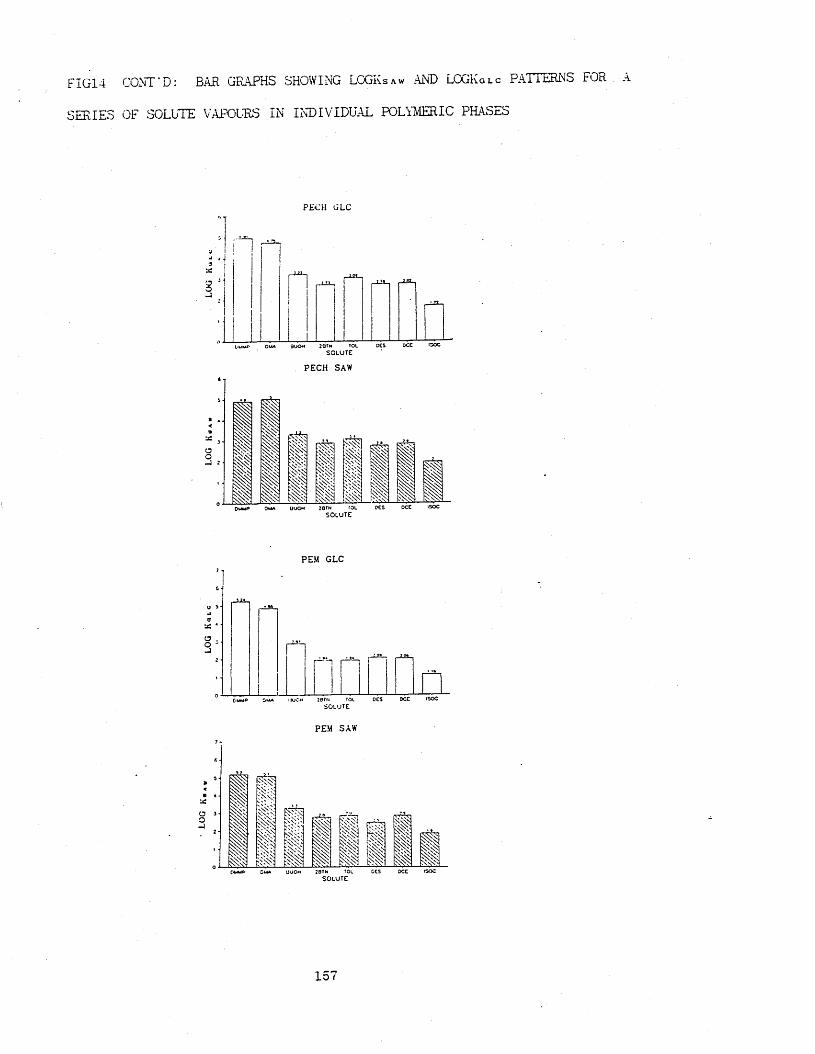
FIG14 COUNT'D: BAR GRAPHS SHOWING LOGKsaw AND LOGKglc PATTERNS FOR
SERIES OF SOLUTE VAPOURS IN INDIVIDUAL POLYMERIC PHASES
PECH GLC
PECH SAW6
0SOLUTE
PEM GLCic
0
PEM SAW
SOLUTE
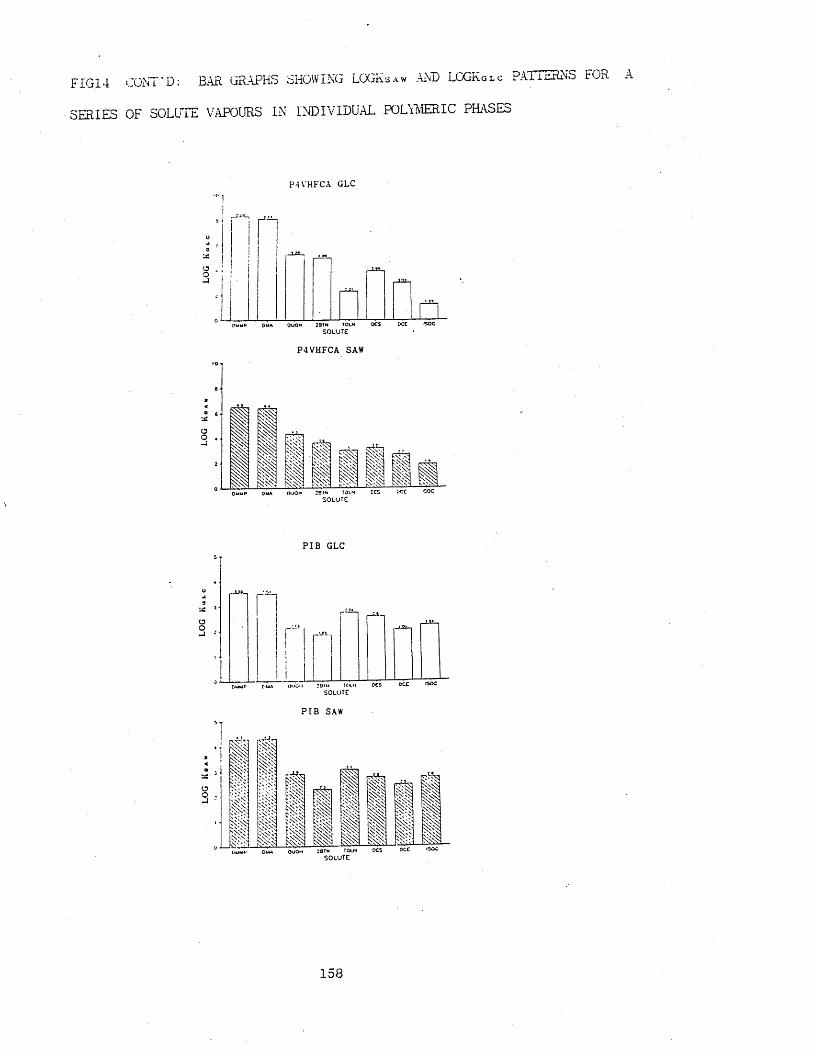
FIG14
SERIES
CONT'D: BAR GRAPHS SHOWING LOGKsaw AND LOGKglc PATTERNS FOR A
OF SOLUTE VAPOURS IN INDIVIDUAL POLYMERIC PHASES
P.IVHFCA GLC. . . ,
(3 HO-1
OUA OUOH 28TN TOln DCS OCC ISOCs o l u t e
P4VHFCA SAW
8><a t Xao-1
2
0
PIB GLC
PIB SAW
MOI I "
ouom ibtn roul SOLUTE
158
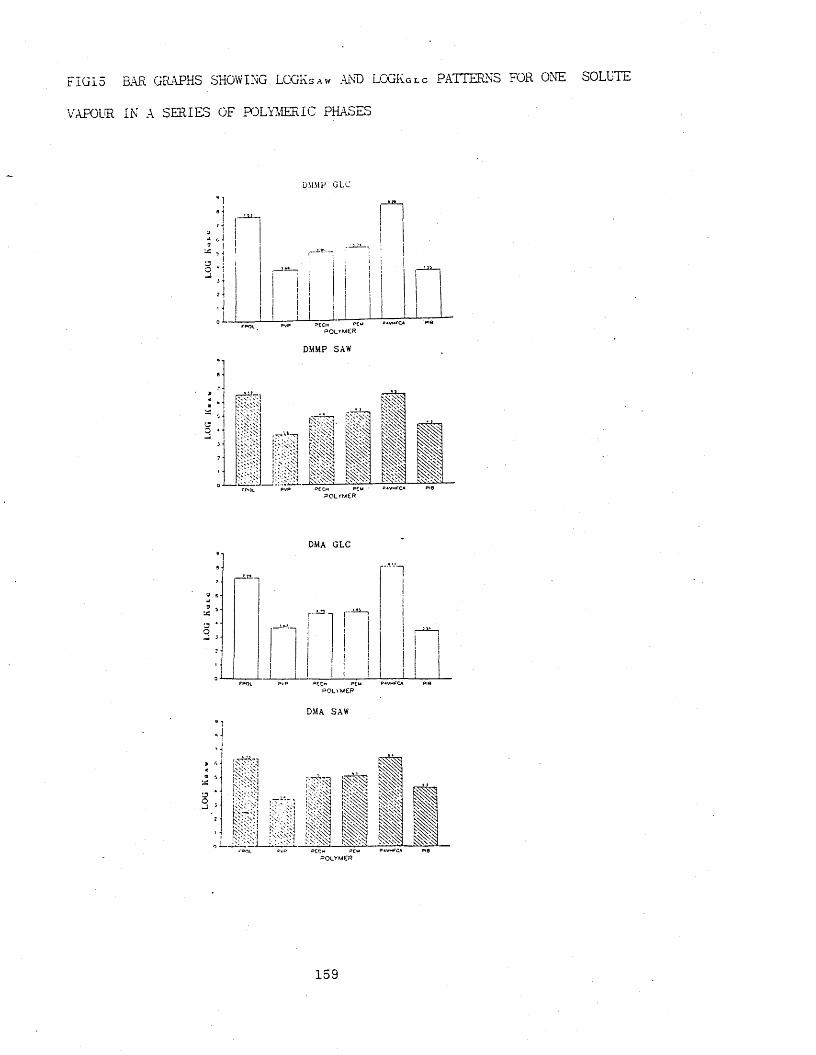
FIG15
VAPOUR
BAR GRAPHS SHOWING.LCGKsav .AND LCGKglc PATTERNS FOR ONE SOLUTE
IN A SERIES OF POLYMERIC PHASES
DMMP GLC
3 I* tiO ‘1
I !3CCM p*wPOLYMER
DMMP SAW
UYM K M
P*VMfC4 Pi 8
!C''Cx;K M K M
H ii HI
DMA GLC
■3 4O 3
9 CCh p£m P«vmFC* Pi8POLVMEP
DMA SAW
<
20
159
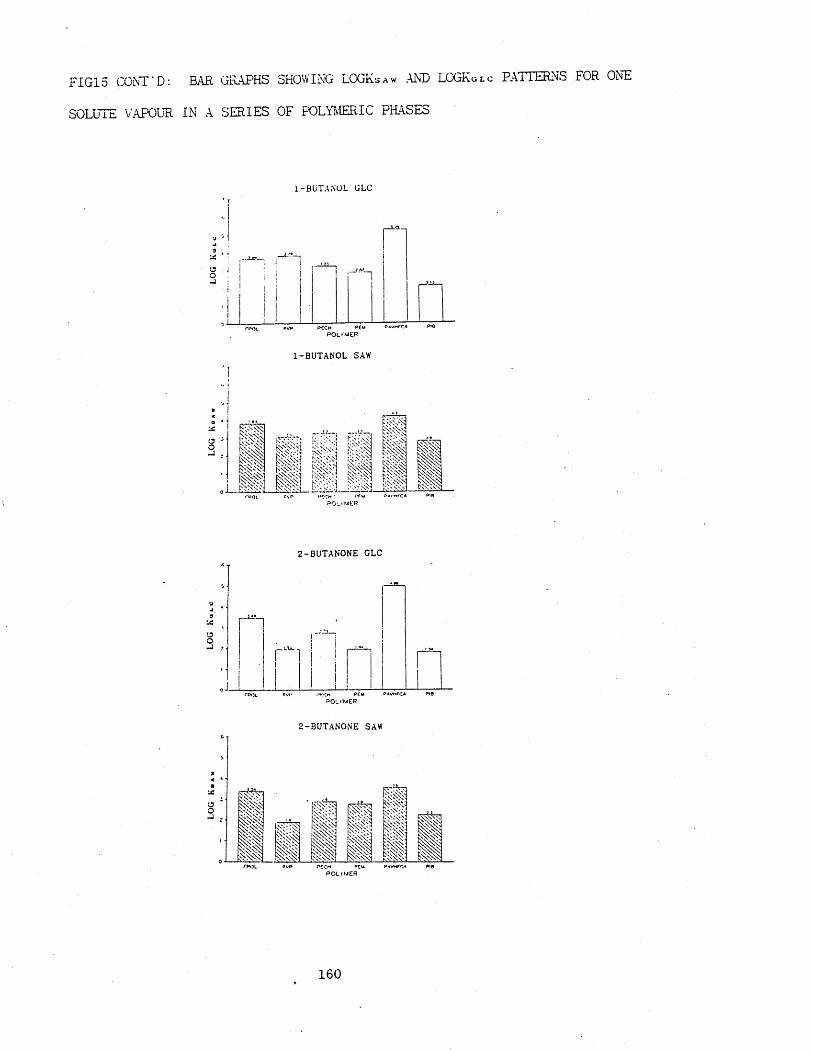
FIG15 CONT' D :
SOLUTE VAPOUR
BAR GRAPHS SHOWING LOGKsaw AND LOGKulc PATTERNS FOR ONE
IN A SERIES OF POLYMERIC PHASES
1-BUTANOL GLC
--I*-, f
P£Cm pCu p«vMfC* P'6POLYMER
1-BUTANOL SAW
2-BUTANONE GLC
2-BUTANONE SAW
160
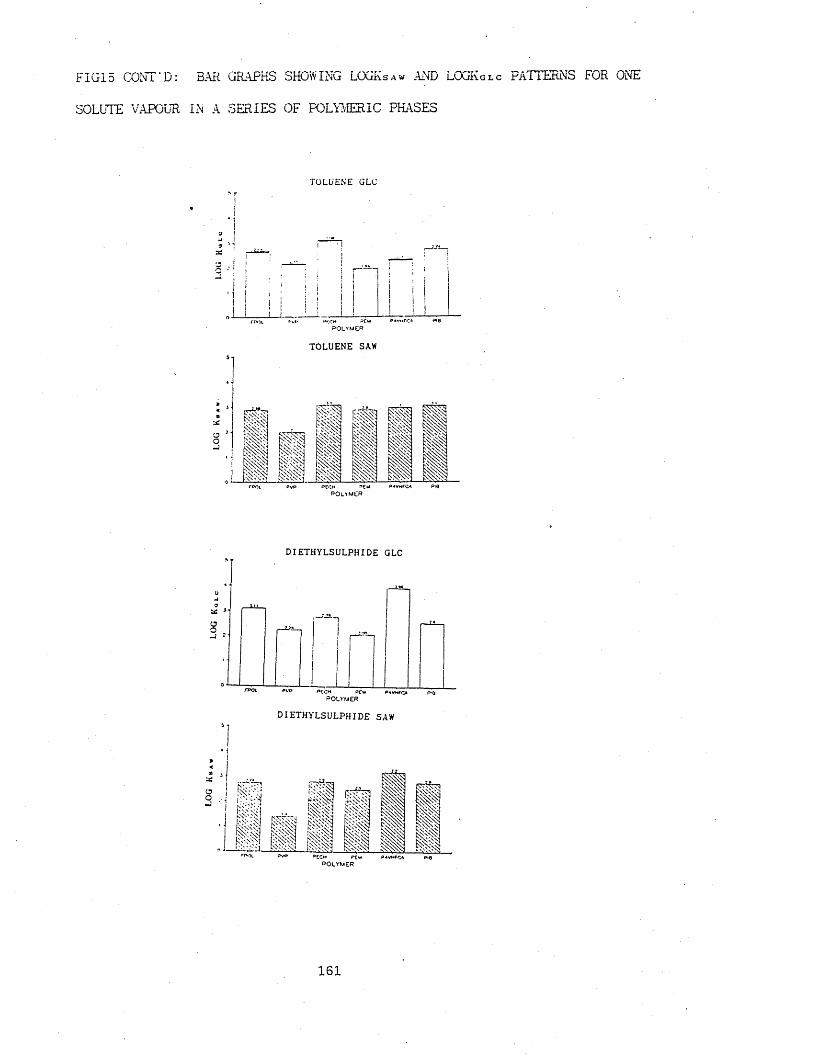
FIG15 CONT'D:
SOLUTE VAPOUR
BAR GRAPHS SHOWING LOGKsaw AND LOGKglc PATTERNS FOR ONE
IN A SERIES OF POLYMERIC PHASES
TOLUENE GLC
TOLUENE SAW
j-po l pvp *»CCh pcw P4v«rcA piepO limi'R
DIETHYLSULPHIDE GLC
u9
oo-J
DIETHYLSULPHIDE SAW
rp ,H pvp p CCh pcw P *vH rc* PiePOtrMGR
161
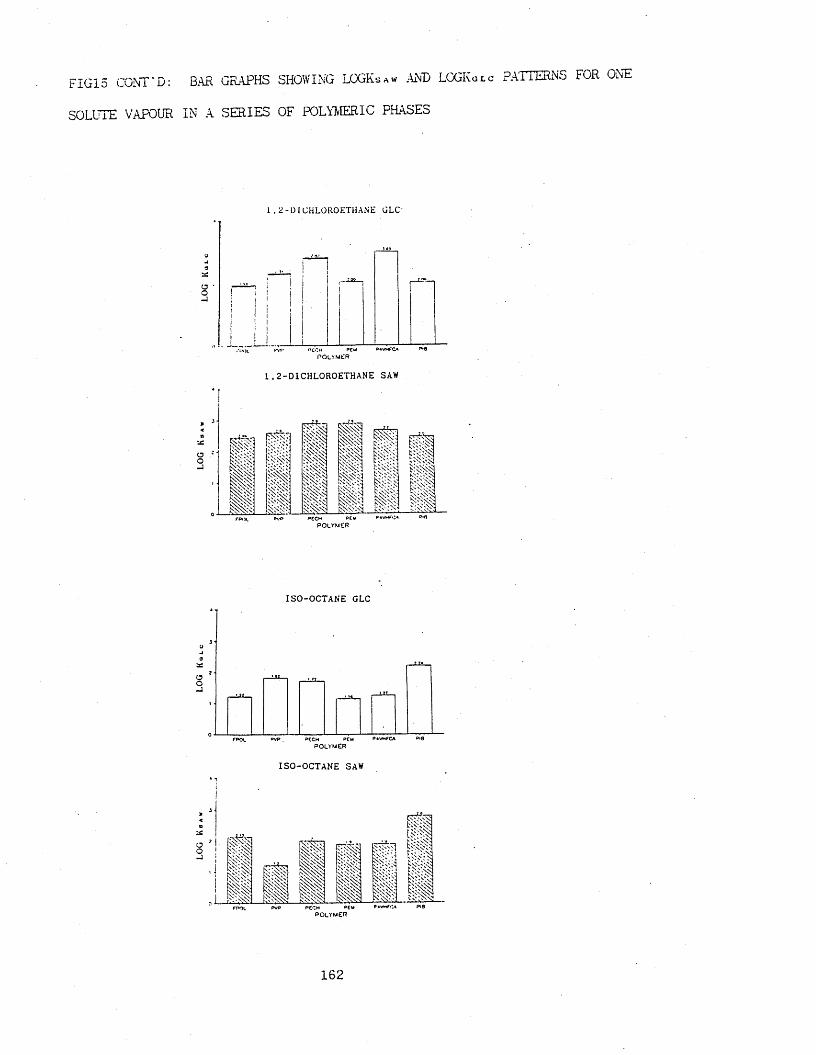
FIG15 CONT'D:SOLUTE VAPOUR
BAR GRAPHS SHOWING LOGKsaw AND LOGKatc PATTERNS FOR ONE
IN A SERIES OF POLYMERIC PHASES
1,2-D1CHLOROETHANE GLC’
O • O -1
PC‘~H PCUPOLYMER
1,2-DICHLOROETHANE SAW
H> N > \V; \ \ \
oil
ss>yvl
» Pi:11 pffte ii
ISO-OCTANE GLC
PECH PEM P4VMEC*POLYMER
ISO-OCTANE SAW
K'CvSo
PECH PEMPOLYMER
162
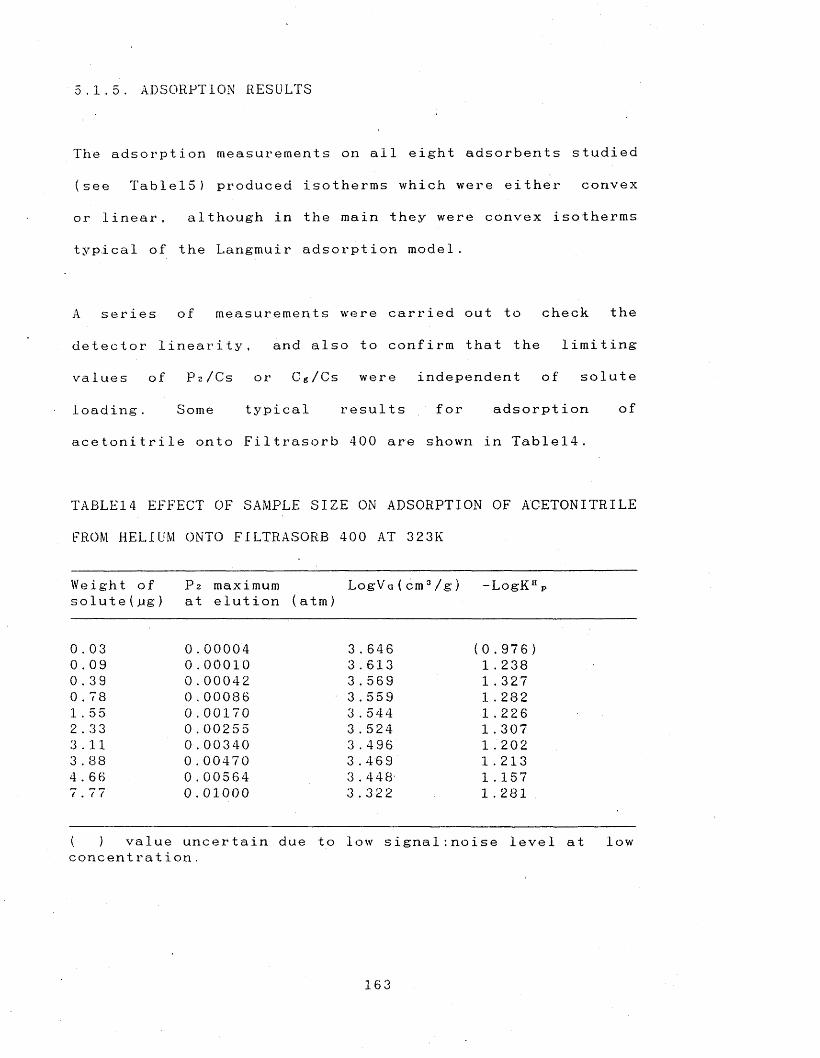
5.1.5. ADSORPTION RESULTS
The adsorption measurements on all eight adsorbents studied
(see TablelS) produced isotherms which were either convex
or linear, although in the main they were convex isotherms
typical of the Langmuir adsorption model.
A series of measurements were carried out to check the
detector linearity, and also to confirm that the limiting
values of Pa/Cs or Cg/Cs were independent of solute
loading. Some typical results for adsorption of
acetonitrile onto Filtrasorb 400 are shown in Tablel4.
TABLE14 EFFECT OF SAMPLE SIZE ON ADSORPTION OF ACETONITRILE
FROM HELIUM ONTO FILTRASORB 400 AT 3 23K
Weight of Pa maximum LogV g (cm 3/ g ) -LogK11 Psolute(u s ) at elution (atm)
0 . 03 0.00004 3 . 646 (0 . 97 6 )0 .09 0.00010 3 . 613 1.2380.39 0.00042 3.569 1 . 3270 . 78 0.00086 3.559 1 . 2821.55 0.00170 3 . 544 1.2262.33 0.00255 3 . 524 1 . 3073.11 0.00340 3.496 1.2023 . 88 0.00470 3.469 1 . 2134.66 0.00564 3.448- 1 . 1577.77 0.01000 3.322 1 . 281
( ) value uncertain due to low s i g n a l :noise level at lowconcent rat i o n .
163

TABLE15 DETAILS OF SOLID ADSORBENTS USED
Adsorbent Manufacture Mesh Source Surface Bulk(.Mm) area(m2/g) density
(g/cm3)
Ambersorb Rohm & Haas 212-250 Synthetic 500 0.6XE-348F polymer &
carbon
207A Sutcliffe 425-500 Coal 1050-1150 0.5Speakman
207C Sutcliffe 425-500 Cpconut shell 1100-1200 0.51Speakman
Filtrasorb Calgon 390-500 Coal 950-1050 0.42400
Amberlite Rohm & Haas 500-850 sulphonated poly XE-393 divinylbenzene ion
exchange resin (acid form)
Amberlite Rohm & Haas 500-850 methacrylic ester XAD-7 polymer resin
Amberlite Rohm & Haas 500-850 polydivinylbenzene XAD-16 nonionic resin
Amberlite Rohm & Haas 355-500 polydivinylbenzene XE-511 with dialkylamine
functionality
164
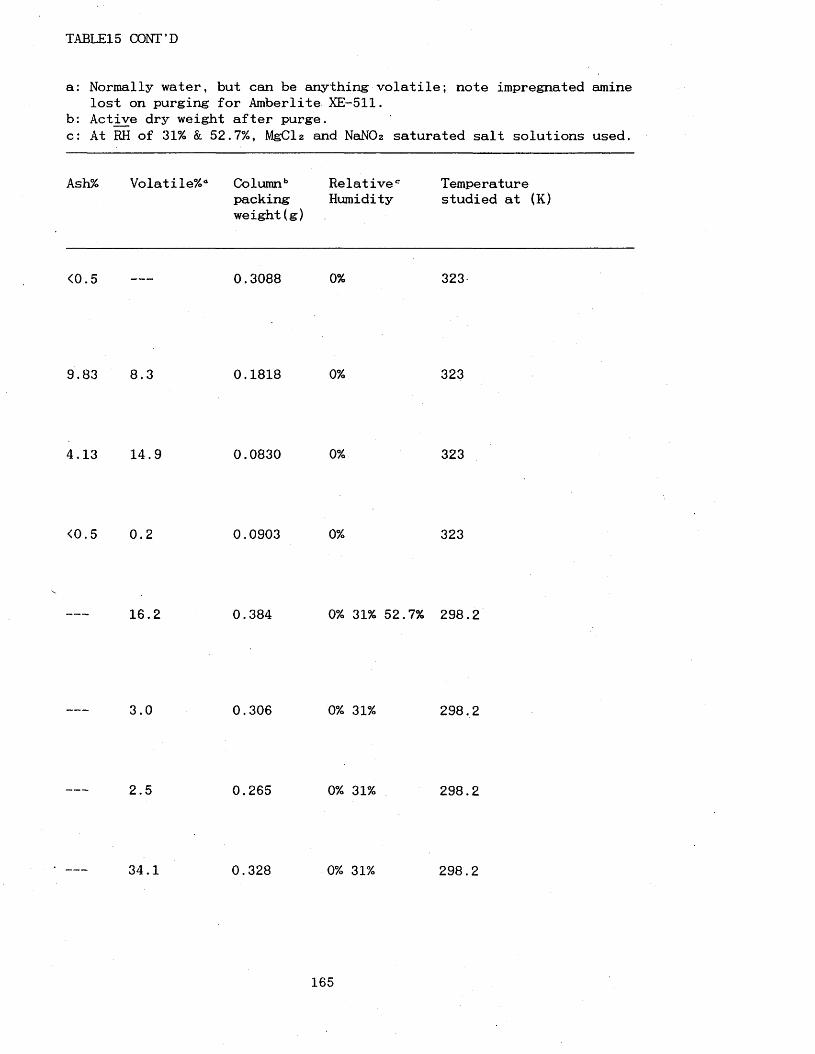
TABLE15 CONT’D
a: Normally water, but can be anything volatile; note impregnated amine lost on purging for Amberlite XE-511.
b: Active dry weight after purge.c: At RH of 31% & 52.7%, MgCl2 and NaNCh saturated salt solutions used.
Ash% Volatile%° Columnb Relative0 Temperaturepacking Humidity studied at (K)weight(g)
<0.5 0.3088 0% 323
9.83 8.3 0.1818 0% 323
4.13 14.9 0.0830 0% 323
<0.5 0.2 0.0903 0% 323
16.2 0.384 0% 31% 52.7% 298.2
3.0 0.306 0% 31% 298.2
2.5 0.265 0% 31% 298.2
34.1 0.328 0% 31% 298.2
165
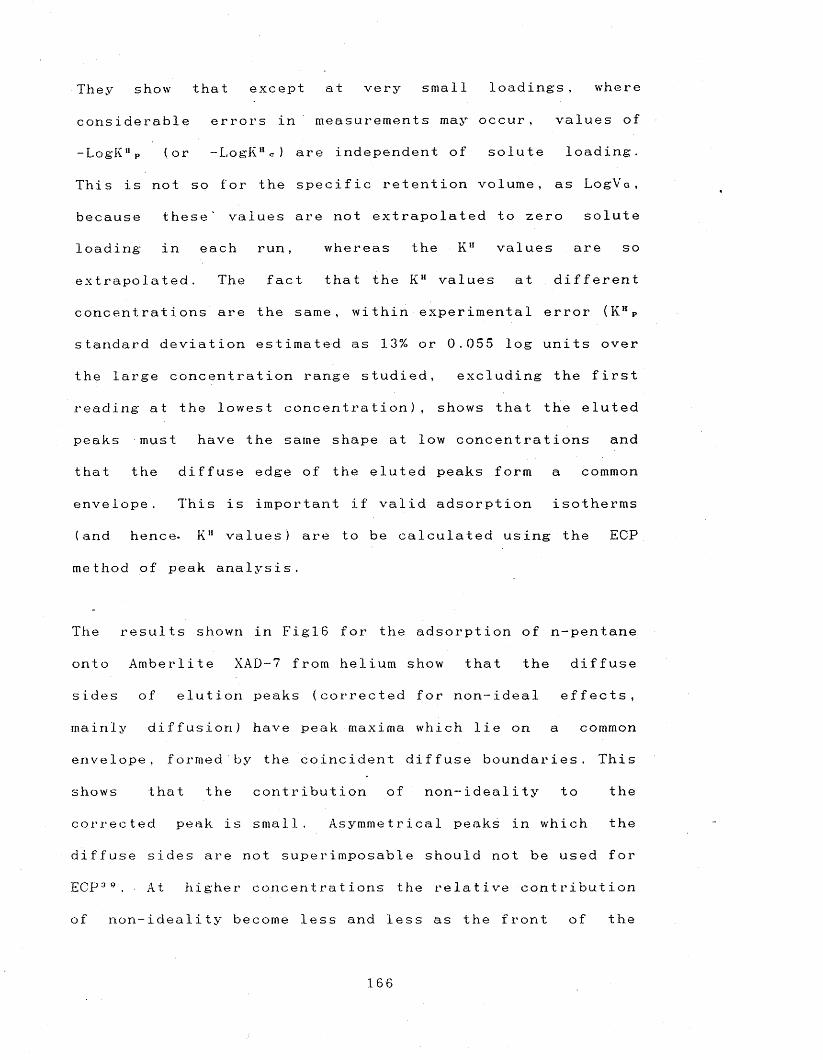
They show that except at very small loadings, where
considerable errors in measurements may occur, values of
- L o g K V (or -LogKHc) are independent of solute loading.
This is not so for the specific retention volume, as L o g V o ,
because these' values are not extrapolated to zero solute
loading in each run, whereas the K H values are so
extrapolated. The fact that the K H values at different
concentrations are the same, within experimental error (KH P
standard deviation estimated as 13% or 0.055 log units over
the large concentration range studied, excluding the first
reading at the lowest concent ration), shows that the eluted
peaks must have the same shape at low concentrations and
that the diffuse edge of the eluted peaks form a common
envelope. This is important if valid adsorption isotherms
(and hence. K H values) are to be calculated using the ECP
method of peak analysis.
The results shown in FiglB for the adsorption of n-pentane
onto Amberlite XAD-7 from helium show that the diffuse
sides of elution peaks (corrected for non-ideal effects,
mainly diffusion.) have peak maxima which lie on a common
envelope, formed by the coincident diffuse boundaries. This
shows that the contribution of non-ideality to the
corrected peak is small. Asymmetrical peaks in which the
diffuse sides are not superimposable should not be used for
E C P 3 9 . At higher concentrations the relative contribution
of non-ideality become less and "less as the front of the
166
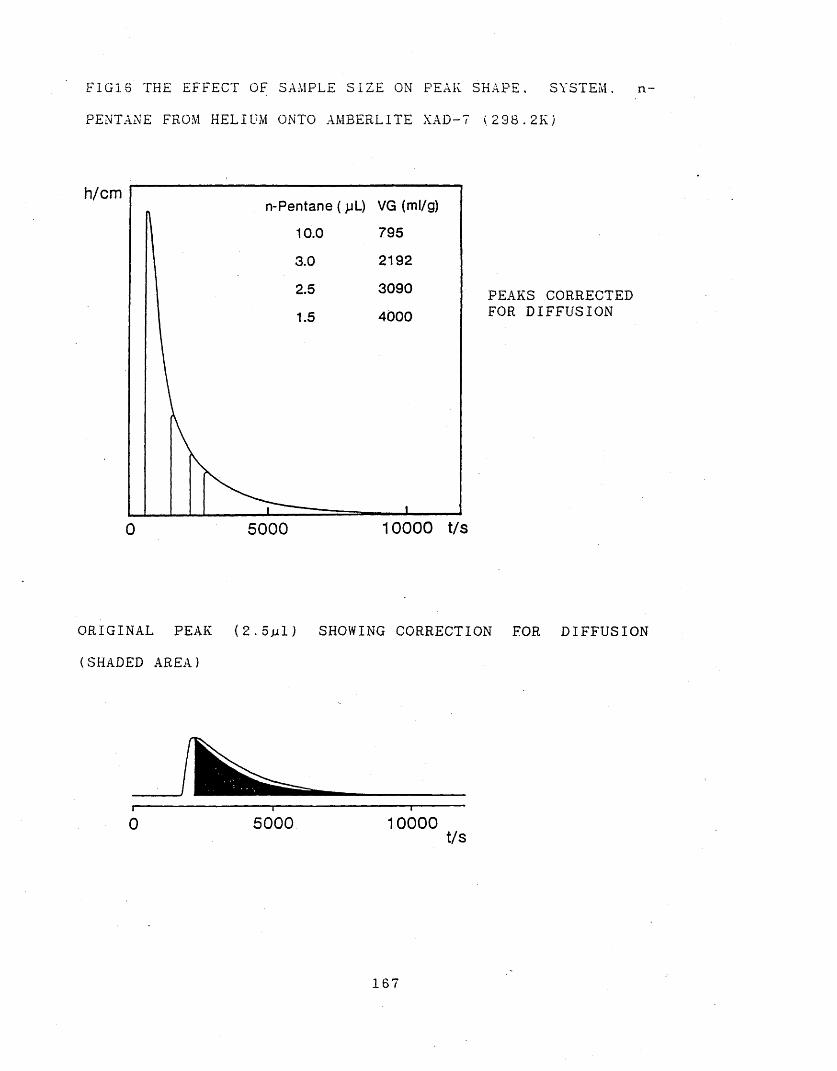
FIGiS THE EFFECT OF SAMPLE SIZE ON PEAK SHAPE. SYSTEM. n-
PENTANE FROM HELIUM ONTO AMBERLITE XAD-7 (298.2K)
PEAKS CORRECTED FOR DIFFUSION
0 5000 10000 t/s
ORIGINAL PEAK (2. 5^il) SHOWING CORRECTION FOR DIFFUSION
(SHADED AREA)
i------------------ 1----------------- 1-------0 5000 10000
t/s
n-Pentane ( pL) VG (ml/g)
30904000
167
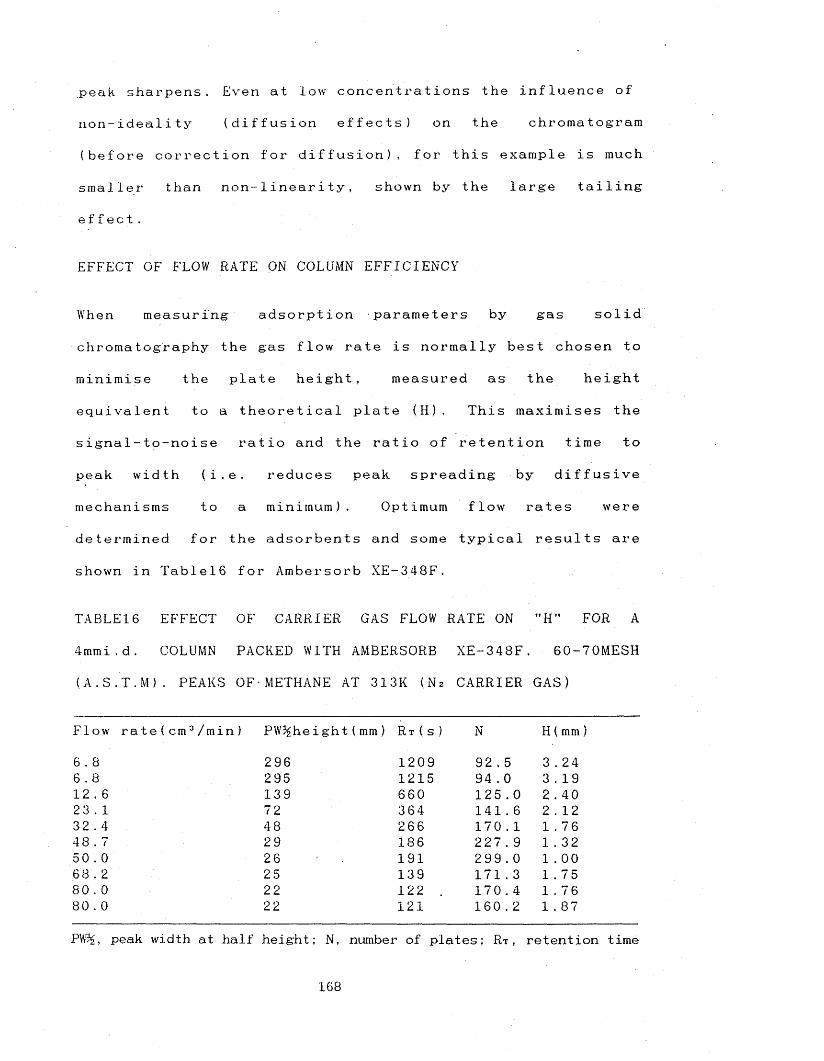
peak sharpens. Even at low concentrations the influence of
non-ideality (diffusion effects) on the chromatogram
(before correction for diffusion), for this example is much
smaller than non-linearity, shown by the large tailing
effect.
EFFECT OF FLOW RATE ON COLUMN EFFICIENCY
When measuring adsorption parameters by gas solid
chromatography the gas flow rate is normally best chosen to
minimise the plate height, measured as the height
equivalent to a theoretical plate (H). This maximises the
s igna1-to-noise ratio and the ratio of re tent ion time to
peak width (i.e. reduces peak spreading by diffusive
mechanisms to a minimum). Optimum flow rates were
determined for the adsorbents and some typical results are
shown in Tablel6 for Ambersorb XE-348F.
TABLE16 EFFECT OF CARRIER GAS FLOW RATE ON "H" FOR A
4mmi.d. COLUMN PACKED WITH AMBERSORB XE-348F. 60-70MESH
(A.S.T.M). PEAKS OF-METHANE AT 313K (N2 CARRIER GAS)
Flow r a t e ( c m 3 / m i n ) PW2£he ight ( mm ) R t ( s ) N H (m m )
6.8 296 1209 92 . 5 3 . 246.8 295 1215 94 . 0 3 . 1912.6 139 660 125 . 0 2 . 4023 . 1 72 364 141 . 6 2 . 1232 . 4 48 266 170 . 1 1 . 7648.7 29 186 227 . 9 1 . 3250.0 26 191 299 . 0 1 . 0068.2 25 139 171 . 3 1.7580.0 22 122 . 170 . 4 1 . 7680 . 0 22 121 160 . 2 1 . 87
PW%, peak width at half height; N, number of plates; Rt , retention time
168
The results show that the optimum flow rate (minimum H)
for Ambersorb XE-348F is about 50cm3/min under these
condi t i o n s .
HUMIDITY MEASUREMENTS
The effect of passing a stream of carrier gas (He.) at some
relative humidity, is to produce a steady equilibrium
baseline higher than normal (when using a katharometer
detector). This "plateau” of water is very sensitive to
changes in column temperature, and hence the necessity of a
liquid thermostat instead of the normal air thermostat to
produce isothermal conditions. The "plateau" would not be
seen if a flame ionisation detector (FID) was used, but
this would have led to the obscuring of some interesting
adsorption effects. There are also associated problems of
flow measurement when using an FID. The sensitivity of the
katharometer is some four to six orders of magnitude less
than the FID, but this is not a problem here as the
measurements are made at finite concentration.
When a sample is injected into the column, at some
particular relative humidity it has to compete with the
water for adsorption sites, and may or may not interact
with' the water bound in the adsorbent depending upon how
hydrophilic the adsorbent is. The effect of the water
present in the adsorbent on apolar solutes will probably be
169
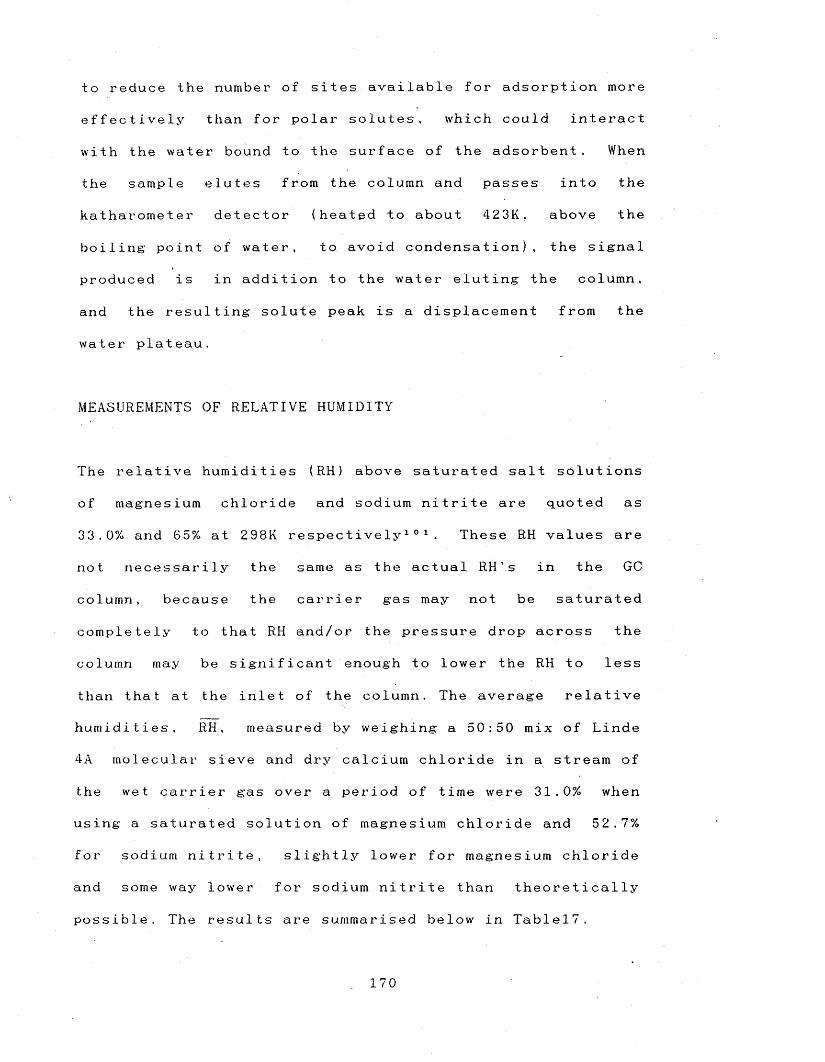
to reduce the number of sites available for adsorption more
effectively than for polar solutes, which could interact
with the water bound to the surface of the a d s o r b e n t . When
the sample elutes from the column and passes into the
katharometer detector (heated to about 423K, above the
boiling point of water, to. avoid condensation), the signal
produced is in addition to the water eluting the column,
and the resulting solute peak is a displacement from the
water plateau.
MEASUREMENTS OF RELATIVE HUMIDITY
The relative humidities ( R H ) above saturated salt solutions
of magnesium chloride and sodium nitrite are quoted as
33.0% and 65% at 298K respectively1 01. These RH values are
not necessarily the same as the actual R H ’s in the GC
column, because the carrier gas may not be saturated
completely to that RH and/or the pressure drop across the
column may be significant enough to lower the RH to less
than that at the inlet of the column. The average relative
humidities, R H , measured by weighing a 50:50 mix of Linde
4A molecular sieve and dry calcium chloride in a stream of
the wet carrier gas over a period of time were 31.0% when
using a saturated solution of magnesium chloride and 52.7%
for sodium nitrite, slightly lower for magnesium chloride
and some way lower for sodium nitrite than theoretically
possible. The results are summarised below in Tablel7.
1 7 0
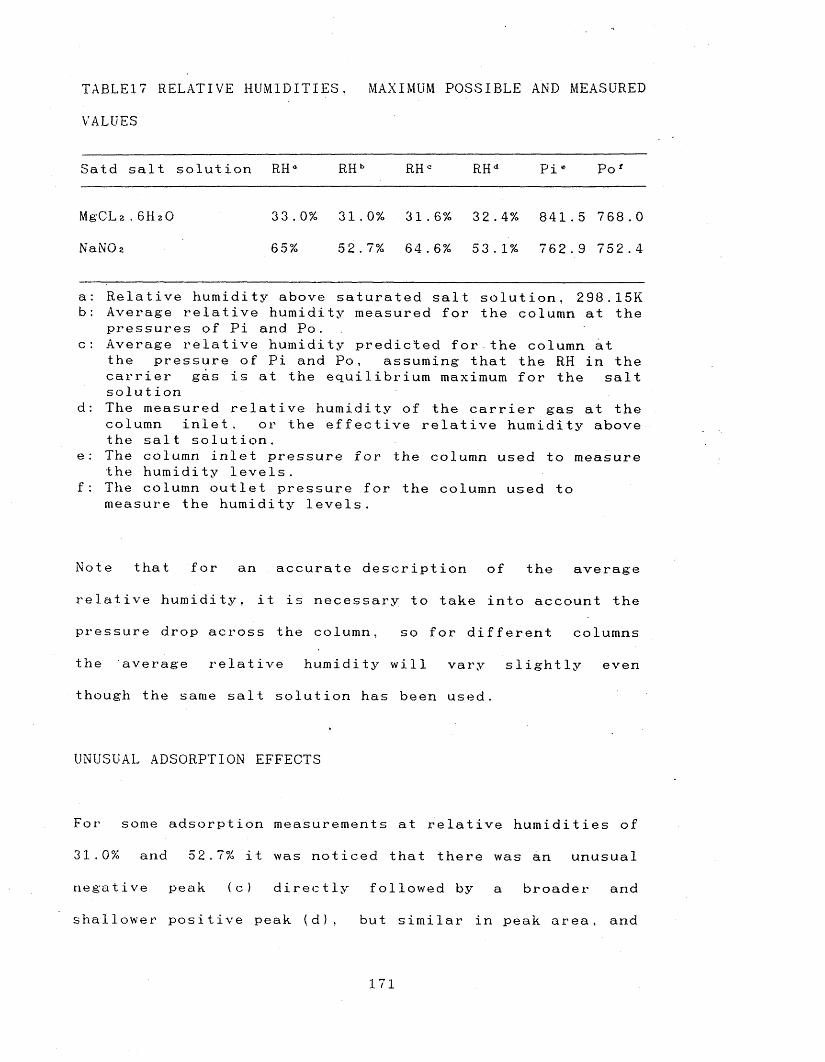
TABLE17 RELATIVE HUMIDITIES, MAXIMUM POSSIBLE AND MEASURED
VALUES
Satd salt solution RH* R H b RH° R H d Pi * P o f
M g C L a . 6HzO
NaN0 2
3 3 . 0%
65%
31 . 0%
52 . 7%
31 . 6%
64 . 6%
3 2 . 4%
53.1%
841 . 5
762 . 9
768 . 0
752 . 4
a: Relative humidity above saturated salt solution, 298.15K b: Average relative humidity measured for the column at the
pressures of Pi and P o . c: Average relative humidity predicted for the column at
the pressure of Pi and Po, assuming that the RH in the carrier gas is at the equilibrium maximum for the salt solution
d: The measured relative humidity of the carrier gas at thecolumn inlet, or the effective relative humidity above the salt solution,
e: The column inlet pressure for the column used to measurethe humidity levels,
f: The column outlet pressure for the column used to measure the humidity levels.
Note that for an accurate description of the average
relative humidity, it is necessary to take into account the
pressure drop across the column, so for different columns
the average relative humidity will vary slightly even
though the same salt solution has been used.
UNUSUAL ADSORPTION EFFECTS
For some adsorption measurements at relative humidities of
31.0% and 52.7% it was noticed that there was an unusual
negative peak (c) directly followed by a broader and
shallower positive peak (d), but similar in peak area, and
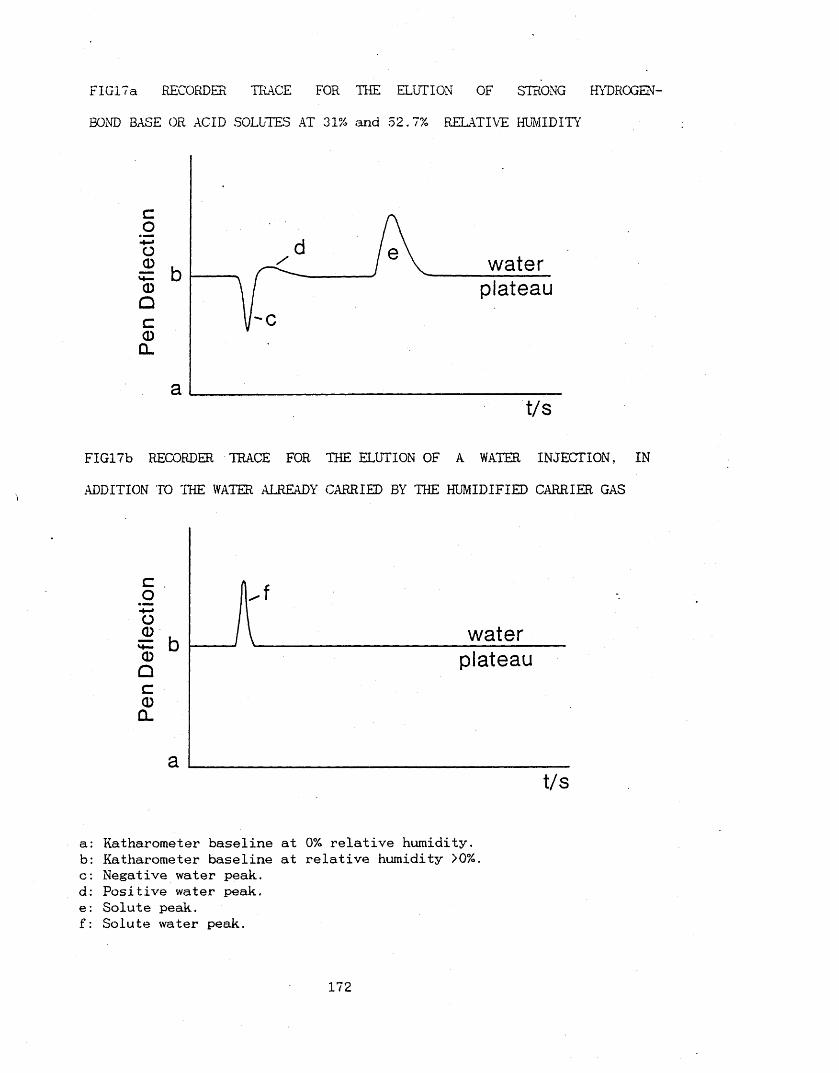
FIGlTa RECORDER TRACE FOR THE ELUTION OF STRONG HYDROGEN-
BOND BASE OR ACID SOLUTES AT 31% and 52.7% RELATIVE HUMIDITY
CO
o0M—0Qc0
cl
waterplateau
at/s
FIG17b RECORDER TRACE FOR THE ELUTION OF A WATER INJECTION, IN
ADDITION TO THE WATER ALREADY CARRIED BY THE HUMIDIFIED CARRIER GAS
Coo-2 h 0 Q c 0 CL
waterplateau
t/s
a: Katharometer baseline at 0% relative humidity,b: Katharometer baseline at relative humidity >0%.c: Negative water peak,d: Positive water peak,e: Solute peak, f: Solute water peak.
172
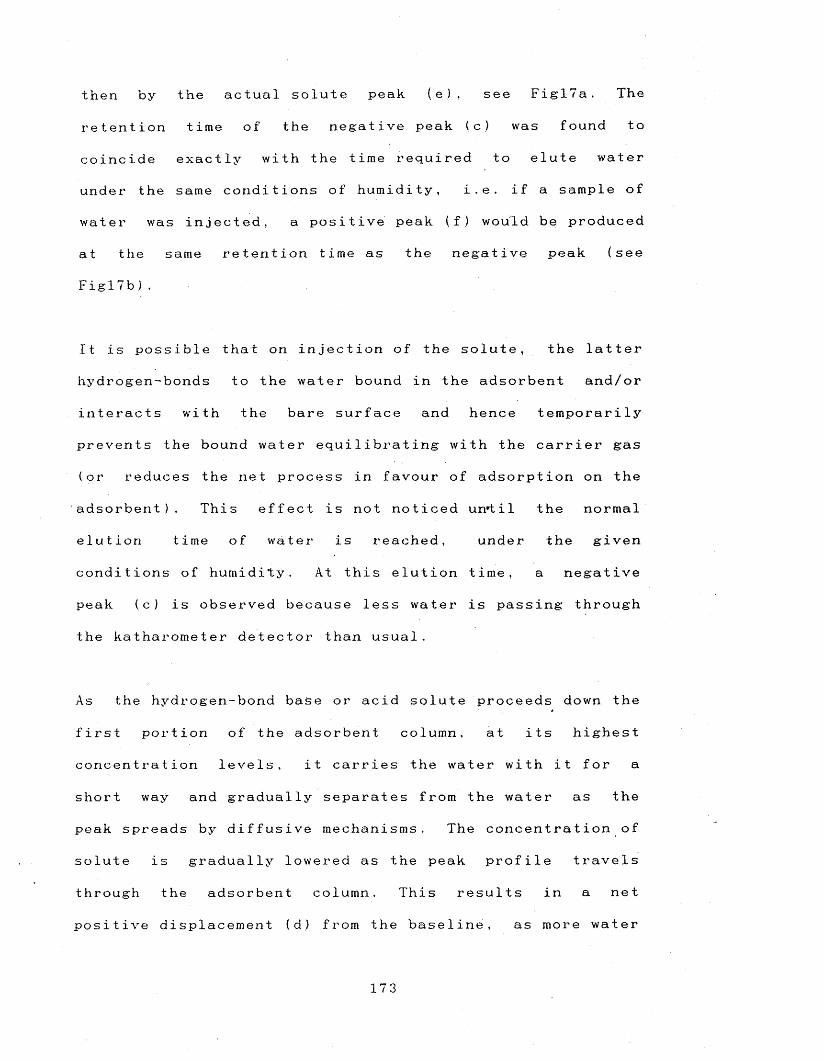
then by the actual solute peak (e), see FiglTa. The
retention time of the negative peak (c) was found to
coincide exactly with the time required to elute water
under the same conditions of humidity, i.e. if a sample of
water was injected, a positive peak (f) would be produced
at the same retention time as the negative peak (see
F i g 17 b ) .
It is possible that on injection of the solute, the latter
hydrogen-bonds to the water bound in the adsorbent and/or
interacts with the bare surface and hence temporarily
prevents the bound water equilibrating with the carrier gas
(or reduces the net process in favour of adsorption on the
adsorbent ) . This effect is not noticed un'til the normal
elution time of water is reached, under the given
conditions of humidity. At this elution time, a negative
peak (c) is observed because less water is passing through
the katharometer detector than usual.
As the hydrogen-bond base or acid solute proceeds down the
first portion of the adsorbent column, at its highest
concentration levels, it carries the water with it for a
short way and gradually separates from the water as the
peak spreads by diffusive mechanisms. The concentration of
solute is gradually lowered as the peak profile travels
through the adsorbent column. This results in a net
positive displacement (d.) from the baseline, as more water
173
will be passing through the detector than at normal
equilibration levels. The extent of thee broadness of this
peak (d) depends on the concentration level of solute in
the adsorbent and the solute hydrogen-bond capability
(i.e. the extent of solute interaction with water). The
negative peaking effect is not shown for solute injections
of apolar solutes such as alkanes, but is shown for both
strong hydrogen-bond acids and bases (i.e. a H 2 and
J3h2>0.3.) . When the concentration of the solute drops, due
to ban spreading, this interaction with the water becomes
less and less as there are enough sites to accommodate the
solute molecules.
The fact that the negative peak effect does not occur for
alkanes does not mean that the adsorption of such apolar
solutes is not affected by levels of humidity, it just
means that for apolar solutes there are less adsorption
sites available because they are covered by water. Marked
differences were observed for elution of both apolar and
polar solutes, between dry and wet adsorption. For example,
for Amberlite XE-393, both the retention volumes and peak
tailing were greatly reduced for measurements at relative
humidity levels 31% and even greater at 52.7%, when
compared with the dry measurements.
These effects are the result of water covering up active
sites (which are the normal cause of peak taili n g ) , leaving
174
only less active sites available for adsorption. For a
solute capable of interacting with water, as it approaches
an active site surrounded by water molecules then it will
interact with the water and depending on the strengths of
the adsorbate/water interaction, possibly pass back into
the carrier gas with the water and loose the water further
down stream. The bare active site will then probably be
covered up by other water molecules or possibly interact
with a solute molecule, the chances of this decrease as the
relative humidity levels are increased. This explains why
there is a progressive decrease in retention volume or
-LogK” as the humidity levels are increased. For a solute
not capable of any specific interaction with the bound
water, the number of sites available is proportionally
decreased as the relative humidity*is increased.
The positioning of the solute peak need not necessarily lie
after the negative water peak, if the solute is adsorbed to
a lesser extent than water. So before injection of the next
sample it is sometimes necessary to wait until the water
peak appears. If the solute coelutes with water, the
negative water peak can have a misleading effect on the
peak shape of the solute, producing falsely symmetrical
peaks. This was observed for some solutes when using
Amberlite XE-393, which was found to be selective towards
hydrogen-bond acids, including water, which took some
considerable time to elute. Another complicating factor
175
arises when the solute coelutes with water. If the sample
contains water as an impurity to begin with, this may lead
to a diminished negative water peak and affect the tail of
the solute peak. This leads to less reliable H e n r y ’s
constants, as they are calculated from the shape of the
peak profile, but does not normally affect the retention
time of the solute, as long as there is some separation
between the water and solute peak. When problems arose like
those described above it was necessary to choose solutes
which did not coelute with water, thus avoiding any
artificial peak shape distortion.
PEAK TAILING
For the Langmuir model of adsorption which gives rise to
convex isotherms, it is possible to compare the tailing of
peaks at zero and other relative humidities, by a purely
empirical method described by Conder and Y o u n g 1 0 . In the
construction shown in Figl8 the leading edge of the peak is
mirrored in a vertical plane through the peak at the
maximum. This splits the peak into two areas, a symmetrical
peak area (A), and a tail (B). The tail ratio A/B is a *
parameter which allows comparisons to be made about the
extent of peak tailing (note, the larger the tail ratio,
the smaller is the extent of tailing). Results for five
representative solutes are given in Tablel8, they show that
for the adsorbents Amberlite XAD-16 and Amberlite XE-511
176
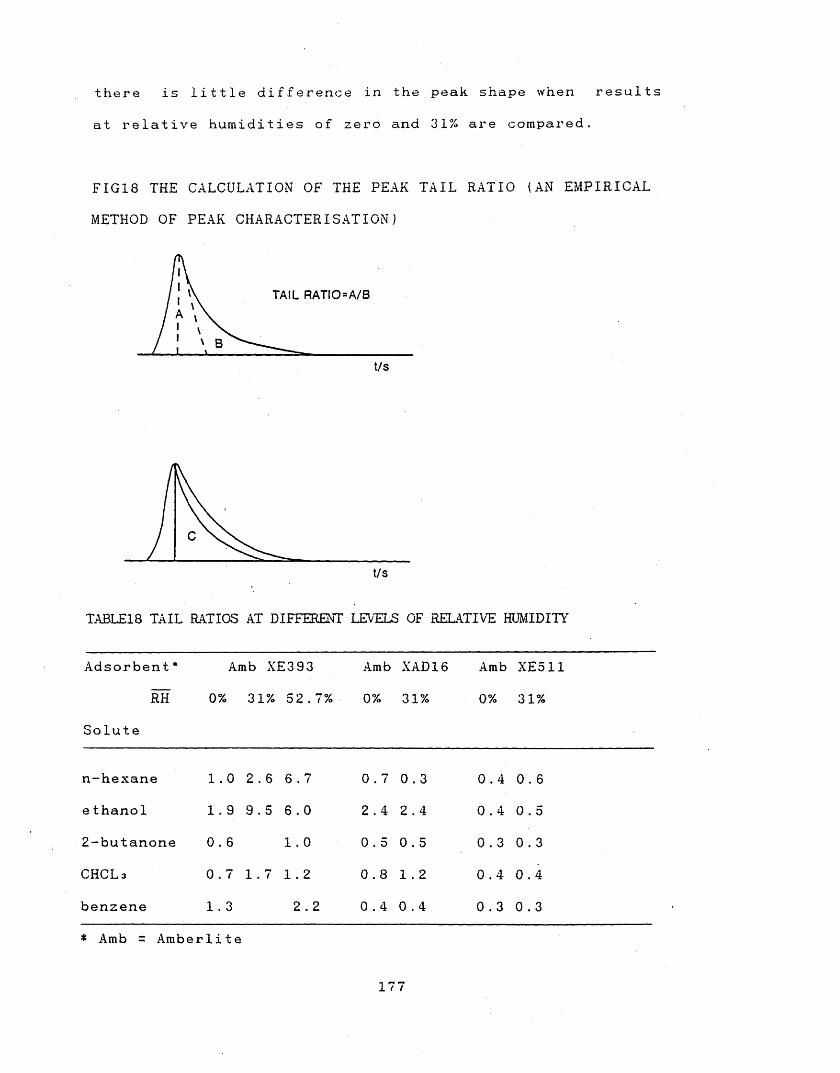
there is little difference in the peak shape when results
at relative humidities of zero and 31% are compared.
FI G 18 THE CALCULATION OF THE PEAK TAIL RATIO (AN EMPIRICAL
METHOD OF PEAK CHARACTERISATION.)
TAIL RATIO=A/B
t/s
t/s
TABLE18 TAIL RATIOS AT DIFFERENT LEVELS OF RELATIVE HUMIDITY
Adsorbent *
RH
Solute
Amb XE393
0% 31% 52.7%
Amb
0%
XAD16
31%
Amb
0%
XE511
31%
n-hexane 1.0 2.6 6 . 7 0 . 7 0 . 3 0.4 0. 6
e thanol 1 . 9 9.5 6.0 2 . 4 2 . 4 0 . 4 0 . 5
2-butanone 0.6 1.0 0.5 0. 5 0.3 0 . 3
CHCLs 0 . 7 1 . 7 1 . 2 0 . 8 1 . 2 0.4 0.4
benzene CO 2.2 0 . 4 0 . 4 0 . 3 0 . 3
* Amb = Amberlite
177
However the tail ratios for Amberlite XE-393 clearly
indi ca te that the peak tail is subs tan tially diminished at
relative humidities of 31% and 52.7% when compared to
results at 0%. These tail ratios are only a rough guide to
the extent of tailing, and have been calculated to provide
a numerical method of showing the extent of peak tailing,
because it is impossible to include the chromatograms of
all the GC r u n s .
Rudenko and Dzhaburov92 have measured peak asymmetry in a
similar fashion and showed that the peak profiles of
alkanes, alcohols and carboxylic acids were unchanged on
chromosorb-102 (polystyrene based porous polymer.) when
adsorption was studied in dry and wet carrier gas. this is
in accord with the results obtained here on Amberlite
XAD-16.
178
DISCUSSION OF REGRESSION ANALYSIS OF ADSORBENT RESULTS FOR
ADSORBENTS STUDIED AT ZERO RELATIVE HUMIDITY ONLY
For the four adsorbents studied at zero relative humidity
only (Ambersorb XE-348F, 207A, 207C, and Filtrasorb 400),
twenty-two solutes were studied, being selected so as to
provide a reasonably wide range of dipolarity, and
hydrogen-bond ability. The solutes together with the
parameters used in the regression equations are given in
Tablel9. Also given are the vapour pressures of some of the
solutes at 323K, as LogP*, where P* is in atm. Results for
the adsorption from helium onto the four solids at 323K are
given in T a b l e 4 0 .P 2 2 4 , as values of - L o g K HP , - L o g K “ c , and
LogVa. By inspection of the results, it is quite difficult
to deduce the factors that contribute to adsorption, and
even to rank the four solids as regards adsorptive power.
The method of multiple regression analysis is very useful
here, and full details of the regressions, using both
eqns75 & 73 are given in Tables20 & 21 respectively. Of
these eqn75 is always the most satisfactory, and the
results are interpreted only in terms of eqn75 and not
considered by eqn73 further.
For all four solids, the only generally significant term in
the regression equation is l.LogL1 6 ; the dipolarity term
s.7z*z contributes marginally in a few cases. Hence it can
be concluded that interactions on these four solids of
179
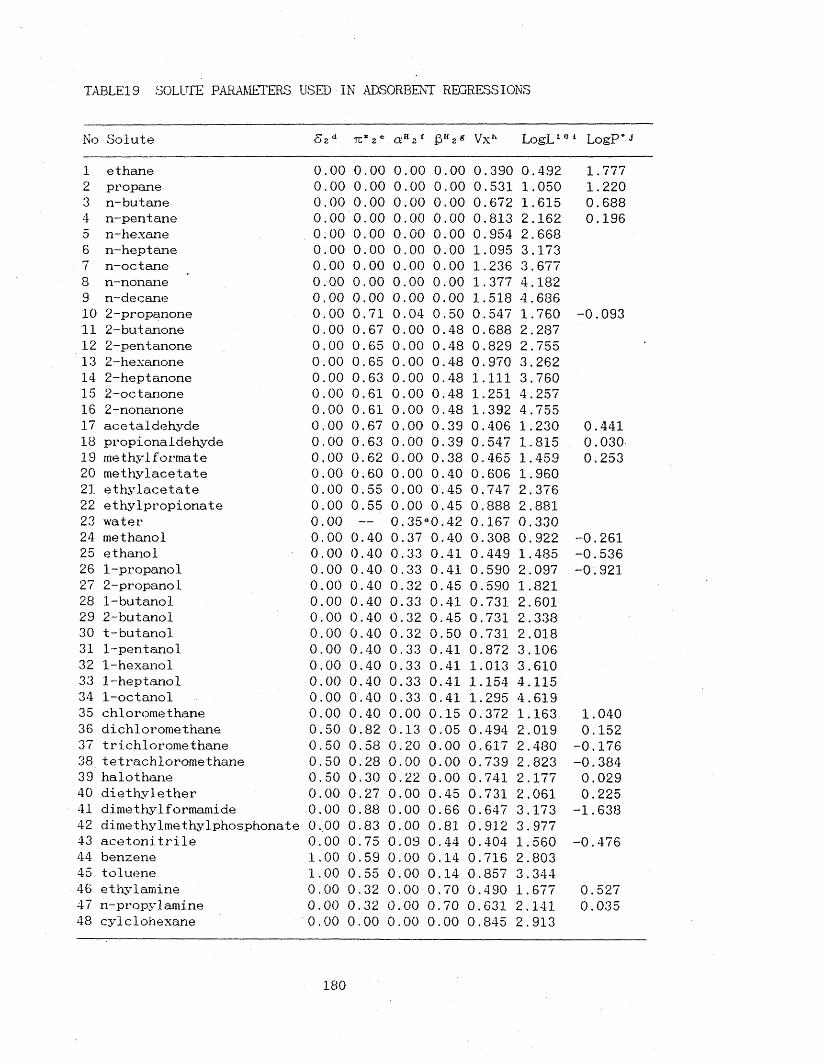
TABLE19 SOLUTE PARAMETERS USED IN ADSORBENT REGRESSIONS
No .Solute 5zd tc*2* a H2f JE311 2s Vxh LogL16 1 LogP'J
1 ethane 0.00 0.00 0.00 0.00 0.390 0.492 1.7772 propane 0.00 0.00 0.00 0.00 0.531 1.050 1.2203 n-butane 0.00 0.00 0.00 0.00 0.672 1.615 0.6884 n-pentane 0.00 0.00 0.00 0.00 0.813 2.162 0.1965 n-hexane 0.00 0.00 0.00 0.00 0.954 2.6686 n-heptane 0.00 0.00 0.00 0.00 1.095 3.1737 n-octane 0.00 0.00 0.00 0.00 1.236 3.6778 n-nonane 0.0.0 0.00 0.00 0.00 1.377 4.1829 n-decane 0.00 0.00 0.00 0.00 1.518 4.68610 2-propanone 0.00 0.71 0.04 0.50 0.547 1.760 -0.09311 2-butanone 0.00 0.67 0.00 0.48 0.688 2.28712 2-pentanone 0.00 0.65 0.00 0.48 0.829 2.75513 2-hexanone 0.00 0.65 0.00 0.48 0.970 3.26214 2-heptanone 0.00 0.63 0.00 0.48 1.111 3.76015 2-octanone 0.00 0.61 0.00 0.48 1.251 4.25716 2-nonanone 0.00 0.61 0.00 0.48 1.392 4 .75517 acetaldehyde 0.00 0.67 0.00 0.39 0.406 1.230 0.44118 propionaldehyde 0.00 0.63 0.00 0.39 0.547 1.815 0.03019 me thy1forma t e 0.00 0.62 0.00 0.38 0.465 1.459 0.25320 methylacetate 0.00 0.60 0.00 0.40 0.606 1.96021 ethylacetate 0.00 0.55 0.00 0.45 0.747 2.37622 ethylpropionate 0.00 0.55 0.00 0.45 0.888 2.88123 water 0.00 — 0.35a0 .42 0.167 0.33024 methanol 0.00 0.40 0.37 0.40 0.308 0.922 -0.26125 ethanol 0.00 0.40 0.33 0.41 0.449 1.485 -0.53626 1-propanol 0.00 0.40 0.33 0.41 0.590 2.097 -0.92127 2-propanol 0.00 0.40 0.32 0.45 0.590 1.82128 1-butanol 0.00 0.40 0.33 0.41 0.731 2.60129 2-butanol 0.00 0.40 0.32 0.45 0.731 2.33830 t-butanol 0.00 0.40 0.32 0.50 0.731 2.01831 1-pentanol 0.00 0.40 0.33 0.41 0.872 3.10632 1-hexanol 0.00 0.40 0.33 0.41 1.013 3.61033 1-heptanol 0.00 0.40 0.33 0.41 1.154 4.11534 1-octanol 0.00 0.40 0.33 0.41 1.295 4.61935 chloromethane 0.00 0.40 0.00 0.15 0.372 1.163 1.04036 dichlorometnane 0.50 0.82 0.13 0.05 0.494 2.019 0.15237 trichloromethane 0,50 0.58 0.20 0.00 0.617 2.480 -0.17638 tetrachloromethane 0.50 0.28 0.00 0.00 0.739 2.823 -0.38439 halothane 0.50 0.30 0.22 0.00 0.741 2.177 0.02940 diethylether 0.00 0.27 0.00 0.45 0.731 2.061 0.22541 dime thy1formamide 0.00 0.88 0.00 0.66 0.647 3.173 -1.63842 dimethylmethylphosphonate 0.00 0.83 0.00 0.81 0.912 3.97743 acetoni trile 0.00 0.75 0.09 0.44 0.404 1.560 -0.47644 benzene 1.00 0.59 0.00 0.14 0.716 2.80345 toluene 1.00 0.55 0.00 0.14 0.857 3.34446 ethylamine 0.00 0.32 0.00 0.70 0.490 1.677 0.52747 n-propylamine 0,00 0.32 0.00 0.70 0.631 2.141 0.03548 cylclohexane 0.00 0.00 0.00 0.00 0.845 2.913
180
a: Measured as 1:i complex,d: Values taken from ref 108.e: Values taken from ref 133-136 and personal communication
from M.J.Kamlet. f: Values taken from ref 110 and unpublished data,g: Values are taken from ref 111 and unpublished data. Note
that ]3 a 2 values for alcohols when published may be marginally different from those used here, but not by any significant margin. This is because additional data for alcohols will soon be included in the matrix of acids and bases, for which the {3az values are dependent upon.
h: Simply calculated by McGowans m e t h o d 115i: As measured in this w o r k 121j: At 323K with P" in atm.
hydrogen-bonding type, and probably also of dipolarity, are
absent, and that the dominant interaction is one involving
general dispersion forces. Since the K H values refer to
zero solute concentration, this conclusion actually refers
to a state of very low surface coverage, where solute-
solute interactions will be very small or non-existent. It
is therefore possible to be more specific in this
conclusion. and state that the dominant solute-solid
interaction for the four solids is one of general
dispersion forces. Because the terms in tz* z , a Hz, and j3Hz
are so small, a single regression,
SP = SPo + 1.L o g L 18 (88)
will suffice to characterise the adsorption on these
particular solids. Details of the results using eqn88 with
SP as - L o g K H and LogVa are in Table20. Because the slopes
in eqn88 are different for the different solids, the
181
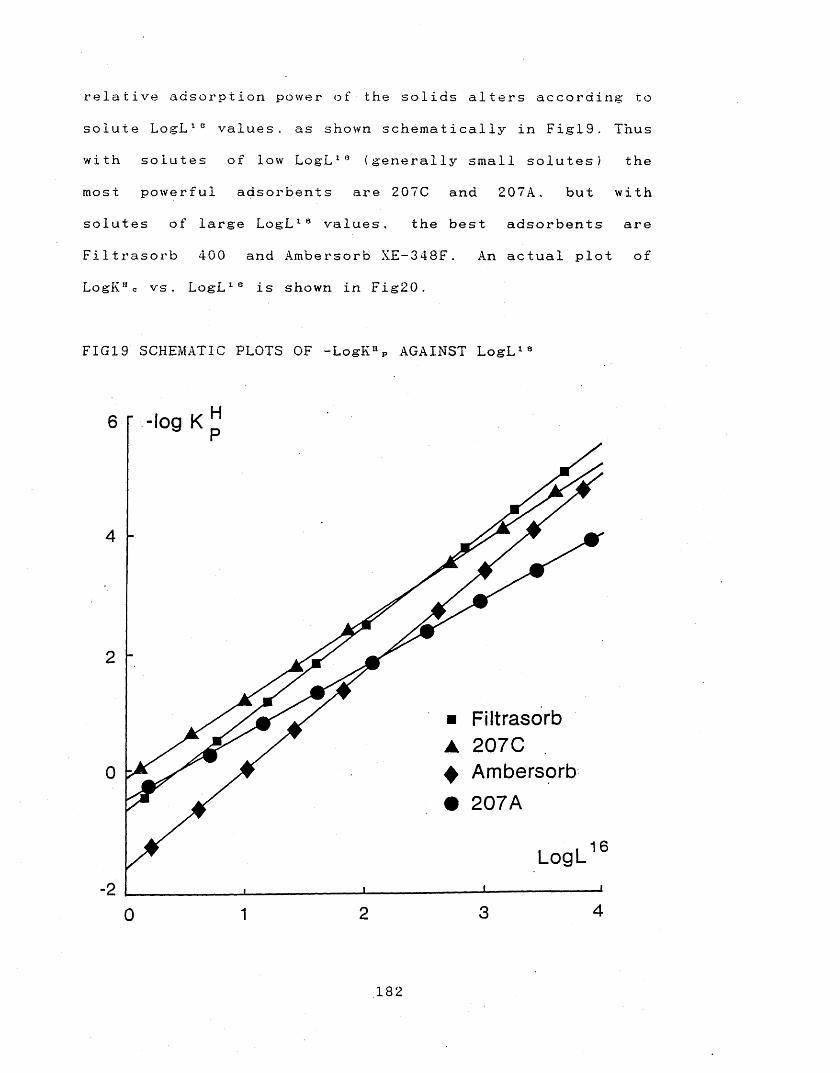
relative adsorption power of the solids alters according: to
solute L o g L 16 values, as shown schematically in Figl9. Thus
with solutes of low L o g L 16 (generally small solutes) the
most powerful adsorbents are 207C and 207A, but with
solutes of large L o g L 16 values, the best adsorbents are
Filtrasorb 400 and Ambersorb XE-348F. An actual plot of
LogK“c vs. L o g L 16 is shown in Fig20.
FIG19 SCHEMATIC PLOTS OF -LogK11 P AGAINST L o g L 16
6 r -log K
4
2
Filtrasorb207CAmbersorb207A
0
16LogL
24
182
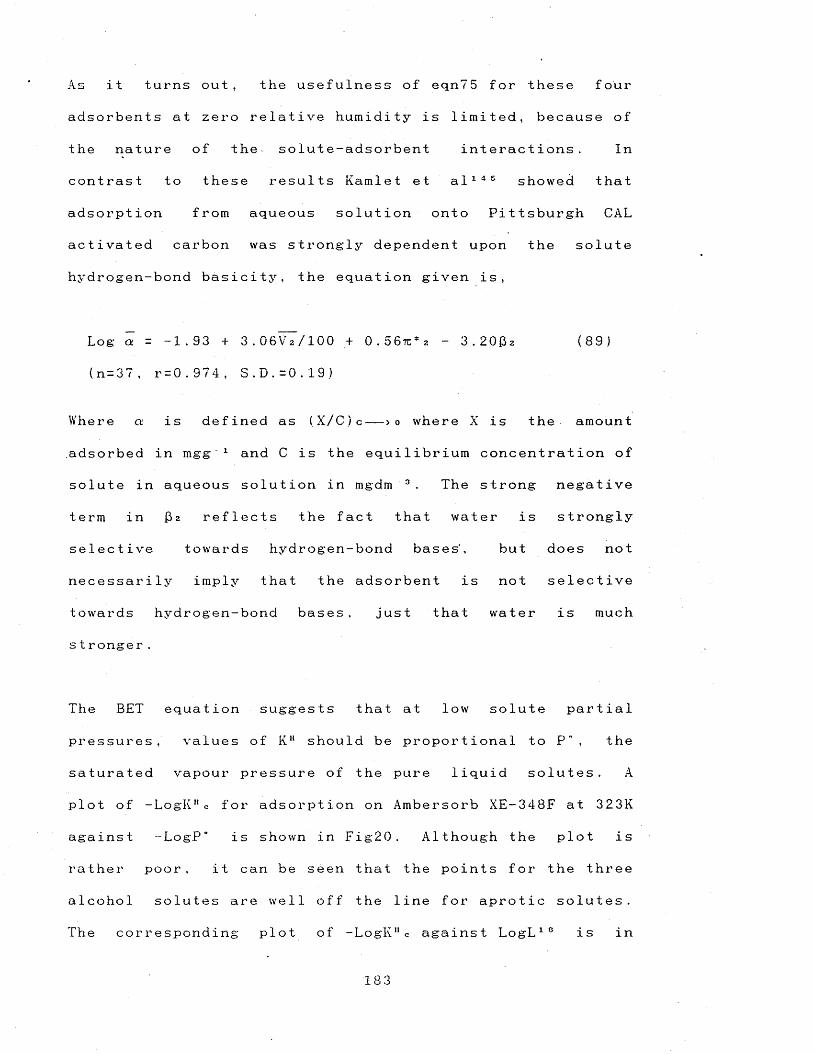
As it turns out, the usefulness of eqn75 for these four
adsorbents at zero relative humidity is limited, because of
the nature of the solute-adsorbent interactions. In
contrast to these results Kamlet et a i 145 showed that
adsorption from aqueous solution onto Pittsburgh CAL
activated carbon was strongly dependent upon the solute
hydrogen-bond basicity, the equation given is,
Log a = -1.93 + 3.06VT /100 + 0.56tc*2 - 3.2002 <89)
(n = 37, r = 0.974 , S.D.=0.19)
Where a is defined as (X/C)c— >o where X is the amount
adsorbed in mgg 1 and 0 is the equilibrium concentration of
solute in aqueous solution in mgdm 3 . The strong negative
term in 02 reflects the fact that water is strongly
selective towards hydrogen-bond bases', but does not
necessarily imply that the adsorbent is not selective
towards hydrogen-bond bases, just that water is much
s tronger.
The BET equation suggests that at low solute partial
pressures, values of K H should be proportional to P", the
saturated vapour pressure of the pure liquid solutes. A
plot of -LogKHc for adsorption on Ambersorb XE-348F at 323K
against -LogP“ is shown in Fig20. Although the plot is
rather poor, it can be seen that the points for the three
alcohol solutes are well off the line for aprotic solutes.
The corresponding plot of -LogK11 c against L o g L ie is in
18 3
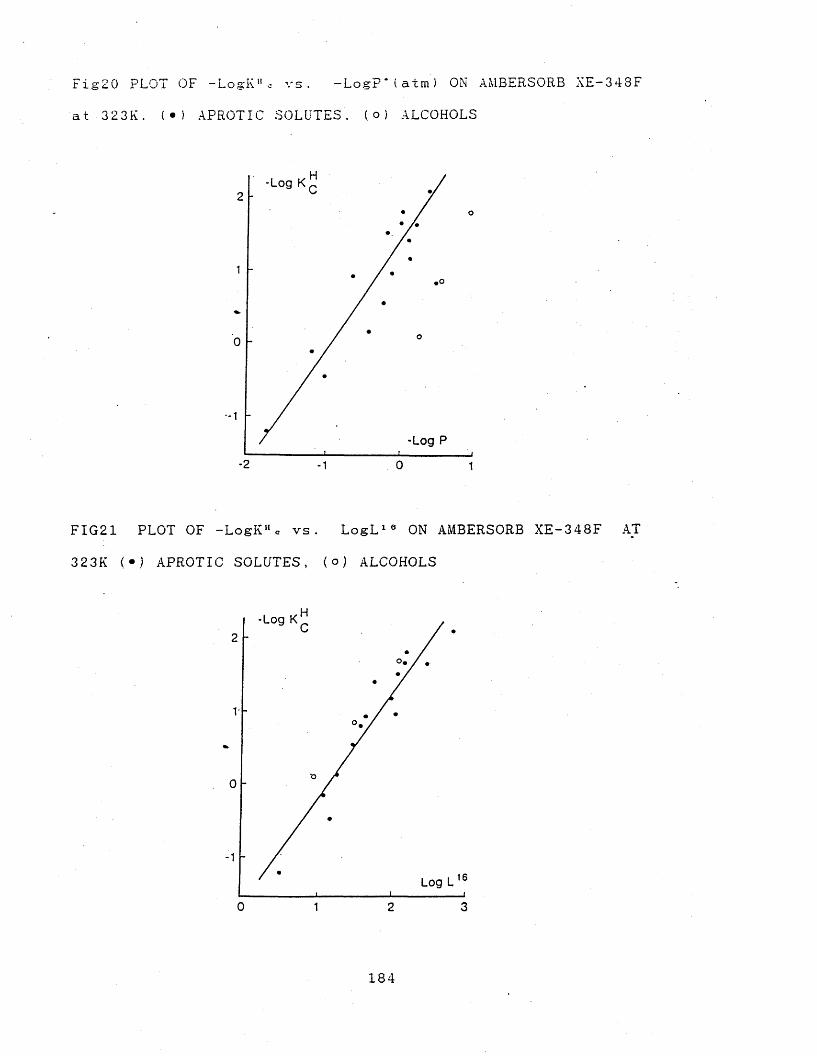
Fig20 PLOT OF -LogK"c vs. -Log?* i a t m ! ON AMBERSORB XE-343F
at 3 23K. (•) APROTIC SOLUTES. (o } ALCOHOLS
-Log K2
1
0
1-Log P
2 01 1
FIG21 PLOT OF -LogK'L vs. L o g L 10 ON AMBERSORB XE-348F AT
323K (•) APROTIC S O L U T E S , (o) ALCOHOLS
-Log K
Log L
0 31 2
184

Fig21: not only do the alcohol solutes lie on the best
line, but the plot is altogether much better than shown in
Fig20 (note _ that a simple plot of -LogKHc against V 2 /IOO
is even worse than the plot against - L o g P * ). To some
extent, the L o g L 16 parameter can be regarded as an
"effective solute vapour pressure", free from hydrogen-
bonding effects.
185
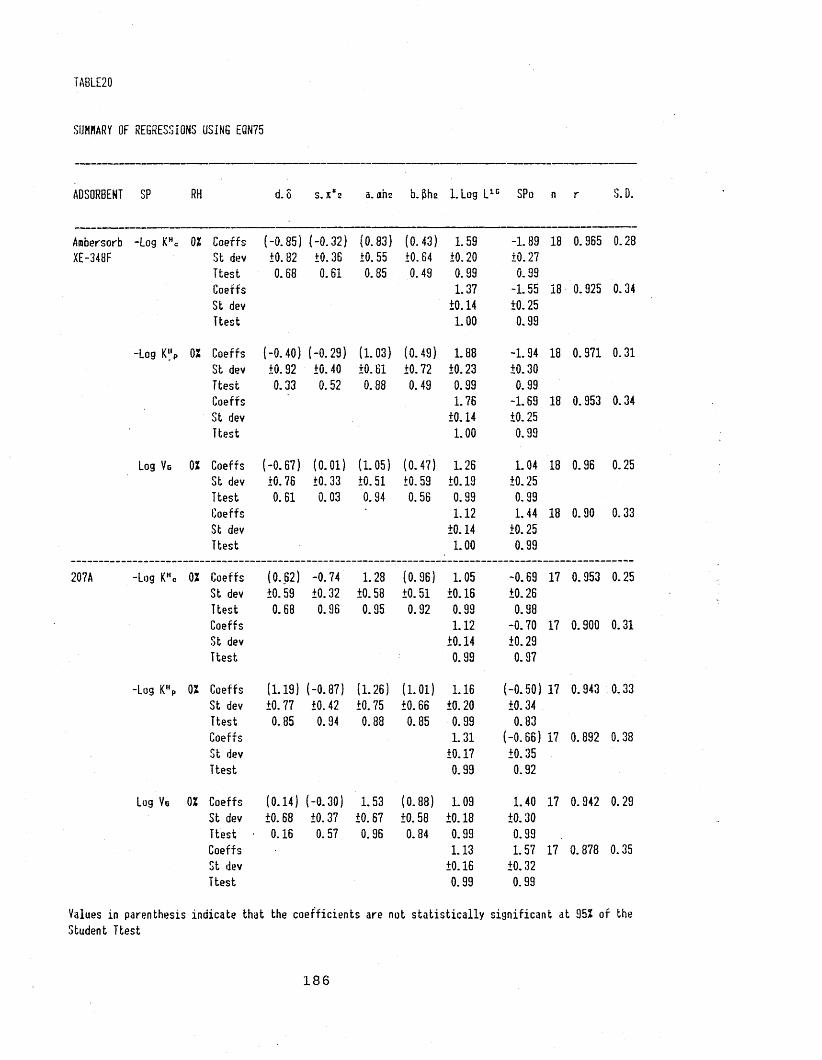
TABLE20
SUMMARY OF REGRESSIONS USING EQN75
ADSORBENT SP RH d. o s. x*z a. ahz b.&hz L L o g L1C SPo n r S.D.
Ambersorb -Log KHC 02 Coeffs (-0.85) (-0.32) (0.83) (0.43) 1.59 -1.89 18 0.965 0.28XE-348F St dev +0.82 +0.36 +0.55 +0.64 +0.20 +0.27
Ttest 0.68 0.61 0.85 0.49 0.99 0.99Coeffs 1.37 -1.55 18 0.925 0.34St dev +0.14 +0.25Ttest L O O 0.99
1 1— O <Q ‘O-’ 02 Coeffs (-0.40) (-0.29) (1.03) (0.49) 1.88 -1.94 18 0.971 0.31St dev +0.92 +0.40 +0.61 +0.72 +0.23 +0.30Ttest 0.33 0.52 0.88 0.49 0.99 0.99Coeffs 1.76 -1.69 18 0.953 0.34St dev +0.14 +0.25Ttest 1.00 0.99
Log Vg 02 Coeffs i(-0.67) (0.01) (1.05) (0.47) 1.26 1.04 18 0.96 0.25St dev +0.76 +0.33 +0.51 +0.59 +0.19 +0.25Ttest 0.61 0.03 0.94 0.56 0.99 0.99Coeffs 1.12 1.44 18 0.90 0.33St dev +0.14 tO. 25Ttest L O O 0.99
207A -Log KHC 02 Coeffs (0.62) -0.74 1.28 (0.96) 1.05 -0.69 17 0.953 0.25St dev +0.59 +0.32 +0.58 +0.51 +0.16 +0.26Ttest 0.68 0.96 0.95 0.92 0.99 0.98Coeffs 1.12 -0.70 17 0.900 0.31St dev +0.14 +0.29Ttest 0.99 0.97
-Log KHP 02 Coeffs (1.19) (-0.87) (1.26) (1-01) 1.16 (-0.50) 17 0.943 0.33St dev +0.77 +0.42 +0.75 +0.66 +0.20 +0.34Ttest 0.85 0.94 0.88 0.85 0.99 0.83Coeffs 1.31 (-0.66) 17 0.892 0.38St dev +0.17 +0.35Ttest 0.99 0.92
Log Vg 02 Coeffs (0.14) (-0.30) 1.53 (0.88) 1.09 1.40 17 0.942 0.29St dev +0.68 +0.37 tO. 67 +0.58 +0.18 +0.30Ttest 0.16 0.57 0.96 0.84 0.99 0.99Coeffs 1.13 1.57 17 0.878 0.35St dev +0.16 +0.32Ttest 0.99 0.99
Values in parenthesis indicate that the coefficient s are not statistically significant at 952 of theStudent Ttest
186
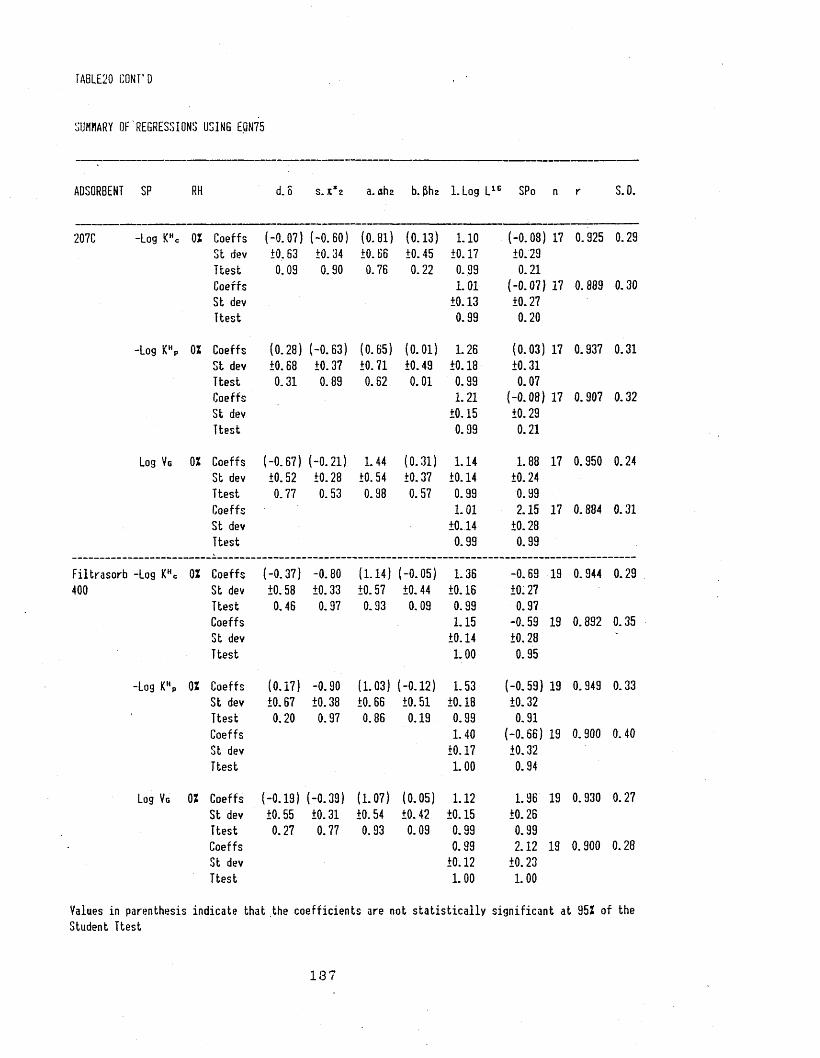
TABLE20 CONT’D
SUMMARY OF'REGRESSIONS USING EQN75
ADSORBENT SP RH d.6 _ _* S. I 2 a. ah c b. &hz 1.Log L1E SPo n r S.D.
207C -Log KHC 0 Z Coeffs (-0.07) (-0.60) (0.81) (0.13) 1.10 (-0.08) 17 0.925 0.29St dev 10.63 10.34 10.66 10.45 10.17 10.29Ttest 0.09 0.90 0.76 0.22 0.99 0.21Coeffs 1.01 (-0.07) 17 0.889 0.30Sfc dev 10.13 10.27Ttest 0.99 0.20
-Log KHP OZ Coeffs (0.28) (-0.63) (0.65) (0.01) 1.26 (0.03) 17 0.937 0.31St dev 10.68 10.37 10.71 10.49 10.18 10.31Ttest 0.31 0.89 0.62 0.01 0.99 0.07Coeffs 1.21 (-0.08) 17 0.907 0.32St dev 10.15 10.29Ttest 0.99 0.21
Log Vg OZ Coeffs (-0.67) (-0.21) 1.44 (0.31) 1.14 1.88 17 0.950 0.24St dev 10.52 10.28 10.54 10.37 10.14 10.24Ttest 0.77 0.53 0.98 0.57 0.99 0.99Coeffs 1.01 2.15 17 0.884 0.31St dev 10.14 10.28Ttest 0.99 0.99
Filtrasorb -Log KHC OZ Coeffs (-0.37) -0.80 (1-14) 1[-0.05) 1.36 -0.69 19 0.944 0.29400 St dev 10.58 10.33 10.57 10.44 10.16 10.27
Ttest 0.46 0.97 0.93 0.09 0.99 0.97Coeffs 1.15 -0.59 19 0.892 0.35St dev 10.14 10.28 *Ttest 1.00 0.95
-Log K \ OZ Coeffs (0.17) -0.90 (1.03) (-0.12) 1.53 (-0.59) 19 0.949 0.33St dev 10.67 10.38 10.66 10.51 10.18 10.32Ttest 0.20 0.97 0.86 0.19 0.99 0.91Coeffs 1.40 (-0.66) 19 0.900 0.40St dev 10.17 10.32Ttest 1.00 0.94
Log Vg OZ Coeffs (-0.19) (-0.39) (1-07) (0.05) 1.12 1.96 19 0.930 0.27St dev 10.55 10.31 10.54 10.42 10.15 10.26Ttest 0.27 0.77 0.93 0.09 0.99 0.99Coeffs 0.99 2.12 19 0.900 0.28St dev 10.12 10.23Ttest 1.00 1.00
Values in parenthesis indicate that the coefficients are not statistically significant at 95Z of theStudent Ttest
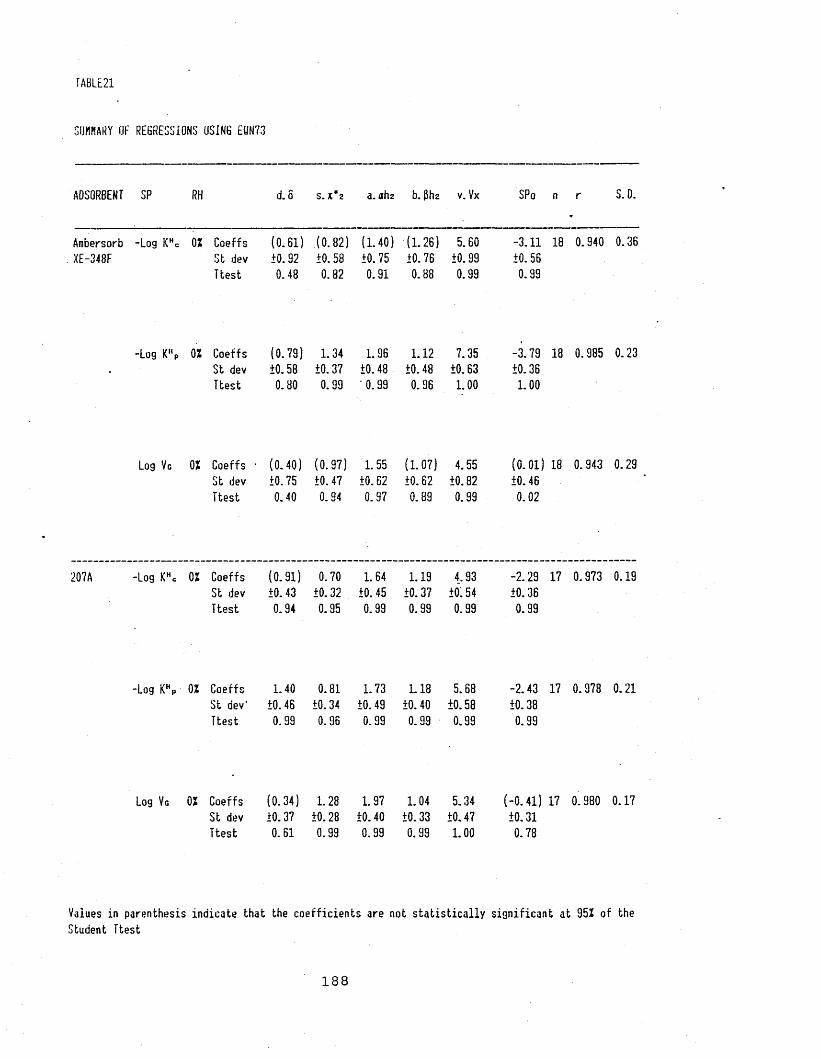
TABLE2I
SUMMARY OF REGRESSIONS USING EUN73
ADSORBENT SP RH d. o s. x*z a. ahz b. v. Vx SPo n r S. D.
Ambersorb -Log K Hc 0Z Coeffs (0.61) (0.82) (1.40) (1.26) 5.60 -3.11 18 0.940 0.36XE-348F St dev 10.92 10.58 10.75 10.76 10.99 10.56
Ttest 0.48 0.82 0.91 0.88 0.99 0.99
-Log KHP 0Z Coeffs (0.79) 1.34 1.96 1.12 7.35 -3.79 18 0.985 0.23, St dev 10.58 10.37 10.48 10.48 +0.63 10.36
Ttest 0.80 0.99 0.99 0.96 1.00 1.00
Log Vg 0Z Coeffs • (0.40) (0.97) 1.55 (1.07) 4.55 (0.01) 18 0.943 0.29St dev 10.75 10.47 10.62 10.62 10.82 10.46Ttest 0.40 0.94 0.97 0.89 0.99 0.02
207A -Log KHc 0Z Coeffs (0.91) 0.70 1.64 1.19 4.93 -2.29St dev 10.43 10.32 10.45 10.37 10:54 10.36Ttest 0.94 0.95 0.99 0.99 0.99 0.99
17 0.973 0.19
-Log K V OZ Coeffs 1.40 0.81 1.73 1.18 5.68 -2.43 17 0.978 0.21Coeffs 1.40 0.81 1.73 1.18 5.68 -2.43St dev' 10.46 10.34 10.49 10.40 10.58 10.38Ttest 0.99 0.96 0.99 0.99 0.99 0.99
Log Vg 0Z Coeffs (0.34) 1.28 1.97 1.04 5.34 (-0.41) 17 0.980 0.17St dev 10.37 10.28 10.40 10.33 10.47 10.31Ttest 0.61 0.99 0.99 0.99 1.00 0.78
Values in parenthesis indicate that the coefficients are not statistically significant at 95Z of theStudent Ttest
188
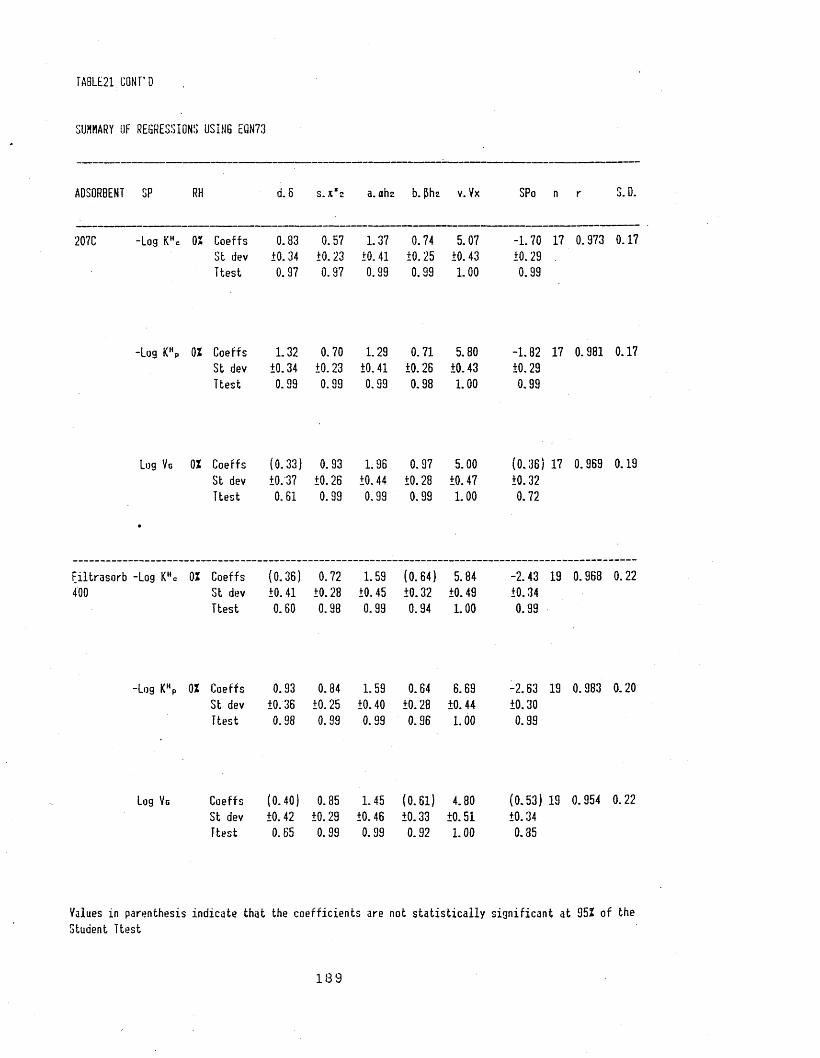
TABLE21 CONT'D
SUHHARY IJF REGRESSION!) USING EQN73
ADSORBENT SP RH d.S s.x’e a.ahz b j h z v.Vx SPo n r S.D.
207C -Log KHc OX Coeffs 0.83 0.57 1.37 0.74 5.07 -1.70 17 0.973 0.17St dev +0.34 10.23 10.41 10.25 10.43 10.29 .Ttest 0.97 0.97 0.99 0.99 1.00 0.99
-Log KHP OX Coeffs 1.32 0.70 1.29 0.71 5.80 -1.82 17 0.981 0.17St dev 10.34 10.23 10.41 10.26 10.43 10.29Ttest 0.99 0.99 0.99 0.98 1.00 0.99
Log Vc OX Coeffs (0.33) 0.93 1.96 0.97 5.00 (0.36/ 17 0.969 0.19St dev 10.37 10.26 10.44 10.28 10.47 10.32Ttest
•
0.61 0.99 0.99 0.99 1.00 0.72
Coeffs (0.36) 0.72 1.59 (0.64) 5.84 -2.43 19 0.968 0.22St dev 10.41 10.28 10.45 10.32 10.49 10.34Ttest 0.60 0.98 0.99 0.94 1.00 0.99
-Log KHP OX Coeffs 0.93 0.84 1.59 0.64 6.69 -2.63 19 0.983 0.20St dev 10.36 10.25 10.40 10.28 10.44 10.30Ttest 0.98 0.99 0.99 0.96 1.00 0.99
Log Vg Coeffs (0.40) 0.85 1.45 (0.61) 4.80 (0.53) 19 0.954 0.22St dev 10.42 10.29 10.46 10.33 10.51 10.34Ttest 0.65 0.99 0.99 0.92 1.00 0.85
Values in parenthesis indicate that the coefficients are not statistically significant at 95X of theStudent Ttest
189
REGRESSION ANALYSIS OF ADSORBENTS STUDIED AT DIFFERENT
LEVELS OF RELATIVE HUMIDITY.
In general, reasonably good correlations were observed for
the three adsorption parameters used -LogKH c , - L o g K HP , and
L o g V g using eqns75 and 73. In nearly all cases eqn75 leads
to superior regressions than those obtained with eqn8 and
gives chemically sensible results. For this reason the
discussions have been limited to the results obtained via
eqn75 (using the L o g L 10 parameter) only, although full
regression results, are given in Tables26-33 for both eqns75
and 7 3.
The correlation coefficients ranged from r=0.988 to 0.859
and overall standard deviations from S.D.-0.11 to 0.36 for
regressions against all parameters used in eqn75. By far
the most regressions had correlation coefficients greater
than 0.95 and the average overall standard deviation for
full regressions was about 0.2 log units. This is not too
bad considering that the experimental error for a series of
solute sample sizes for one solute was ±0.06 log units at
one standard deviation, as detailed earlier (S e c 5 .1.5.163 ) .
Adsorption results at different levels of humidity showed
that some adsorbents are markedly affected by the presence
of water and by the use eqn75 it has been possible to
elucidate these effects. The regression equations produced
190
(see Tables22-25) make it now possible to predict the
adsorbent interactions for many different solutes for which
the relevant parameters are known. Values of ]3H2 are known
for about 500 different solutes and a H 2 for about 150
protic solutes (there are not many classes of solute with
a K 2 , mainly ROH , RCOOH AROH and A R C O O H ), t z * z is known for
about 700 solutes but can be estimated if necessary via a
dipole moment (ja) , tc* i correlation109 and Log L 16 is known
for about 300 solutes but will be extended soon. So it is
possible, at present, to predict Log H e n r y ’s constants for
up to about 300 solutes for each adsorbent at each humidity
level studied, to within ±0.2 of a log unit, using eqn75.
(Note that the range of K 11 is over several orders of
magni t u d e ) .
By and large, the regressions using -LogKH c , -L ogKaP and
LogVc gave similar results in that the regression
coefficients were of the same order of magnitude and sign.
However it was found that in general the regressions using
-LogKHc and -LogKHP were superior to those of LogVa. This
is because the H e n r y ’s constants are measured at
essentially zero solute concentration whereas the specific
retention volumes are measured at a finite, although low,
concentration and thus are open to considerable error.
This arises because for non-linear adsorption isotherms (as
observed in nearly all cases in this work) the retention
volume depends on the concentration of the solute and hence
191
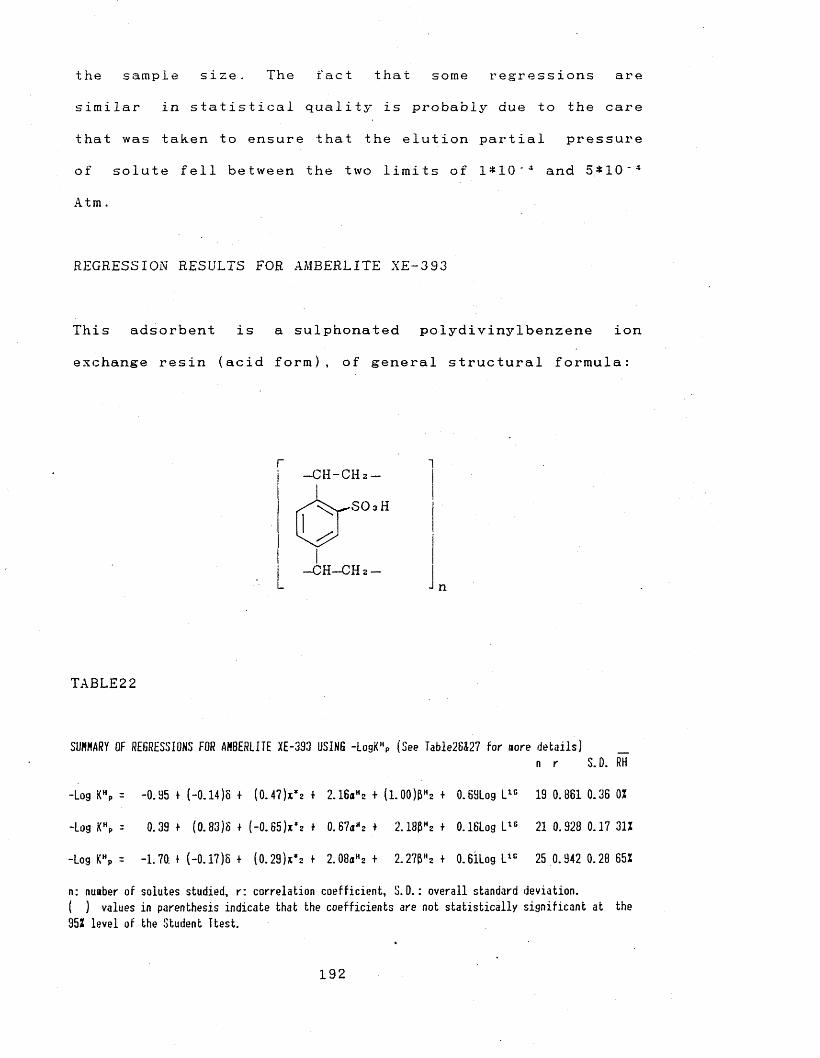
the sample size. The fact that some regressions are
similar in statistical quality is probably due to the care
that was taken to ensure that the elution partial pressure
of solute fell between the two limits of 1*10'* and 5 * 1 0 " 4
A t m .
REGRESSION RESULTS FOR AMBERLITE XE-3 93
This adsorbent is a sulphonated polydivinylbenzene ion
exchange resin (acid form), of general structural formula:
C H - C H 2 -
SOaH
-CH-CHz-
TABLE22
SUMMARY OF REGRESSIONS FOR AMBERLITE XE-393 USING -LogX% (See Table26427 for aore details) _n r S. D. RH
-Log KHP = -0.95 + (-0.14)6 + (0.47)jt*2 + 2.16aH= + (l.00)BHz + 0.69Log LlG 19 0. 861 0.36 0Z-Log KHP = 0.39 + (0.83)8 + (-0.65)x*z * 0.67a«2 + 2.18pHz + O.lb'Log L16 21 0.928 0.17 31Z-Log KHP = -1.70. + (-0.17)8 + (0.29)k *2 + 2.08aH2 + 2.27&HZ + 0.61Log L1C 25 0.942 0.28 65Zn: nuaber of solutes studied, r: correlation coefficient, S.0.: overall standard deviation.( ) values in parenthesis indicate that the coefficients are not statistically significant at the 95Z level of the Student Ttest.
192
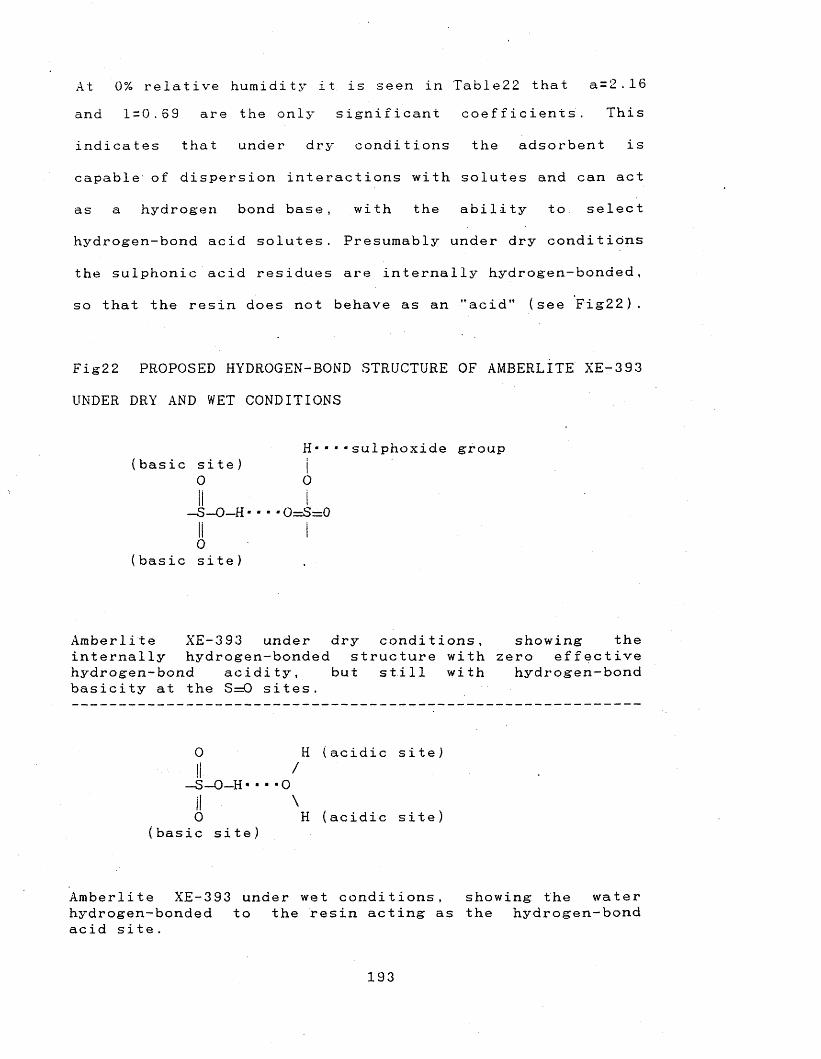
At 0% relative humidity it is seen in Table22 that a=2.16 and 1=0.69 are the only significant coefficients. This
indicates that under dry conditions the adsorbent is
capable" of dispersion interactions with solutes and can act
as a hydrogen bond base, with the ability to select
hydrogen-bond acid solutes. Presumably under dry conditions
the sulphonic acid residues are internally hydrogen-bonded,
so that the resin does not behave as an "acid" (see F i g 2 2 ) .
Fig22 PROPOSED HYDROGEN-BOND STRUCTURE OF AMBERLITE XE-393
UNDER DRY AND WET CONDITIONS
H ••■•sulpnoxide group bas i c s i t e ) j
0 0
—S—O —H • • - '0=S=0
0basic site)
Amberlite XE-393 under dry conditions, showing the internally hydrogen-bonded structure with zero effective hydrogen-bond acidity, but still with hydrogen-bond basicity at the S=0 sites.
0 H (acidic site)II /-S-O-H-■•‘0II N0 H (acidic site)
basic site)
Amberlite XE-393 under wet conditions, showing the water hydrogen-bonded to the resin acting as the hydrogen-bond acid site.
193
The magnitudes of ’’a" and ”1” indicate that the adsorbent
is quite a strong hydrogen-bond base and: a medium
dispersion interactor. The regressions at an average
relative humidity (R H ) of 31% show a marked difference to
those at 0% and give coefficients a=0.67, and b=2.18 as
being statistically significant and a very small
coefficient of Log L 18 (1=0.16) . The magnitudes of "b" and
Ma M indicates that the adsorbent is now behaving as quite a
strong hydrogen-bond acid and a medium hydrogen- bond base
respectively. The water bound in the adsorbent has altered
the adsorbent so it can now selectively adsorb hydrogen-
bond bases much more strongly than at 0% R H , presumably via
some hydrogen-bond interaction with the bound water and
hydrogen-bond base solute (water is a strong hydrogen-bond
acid). The coefficient "a" is much reduced at 31% RH when
compared to 0% R H , but still significant. This is possibly
due to the water interacting with the basic sites on the
a d s o rbent, which would hinder hydrogen-bond acid
solute/adsorbent interaction. Very surprisingly the
coefficient of Log L 18 at 31% RH is very small. This could
reflect the fact that the solubility of gaseous n o n
electrolytes in bulk water has a small negative coefficient
for the cavity or size parameter (Log L 18). For a similar
set of solutes the solubility in water can be described by
the equation b e l o w 1 4 8 , where K c a q > refers to the partition
coefficient of solute between water and vapour phase at
2 9 8 K .
194
Log K(aq) = -1.15 t 3.925 - 0.46k*2 * 4.43aH2 + 9.73(JHZ - 0.27Log L16 n=28 r=0. 999 S.D. =0.14 ±0.08 ±0.42 ±0.32 ±0.25 ±0.47 ±0.02
Hence, the larger the solute, the m-ore difficult it is to
dissolve in water. This, combined with the positive
coefficient of Log L 18 at 0% RH on Amberlite XE-393, could
by coincidence lead to a coefficient of L o g ie equal to zero
at 31% R H . Because there is no "homologous series” effect,
or very little, all alkanes give rise to the same Log Va
value, all ketones give rise to the same Log Va value etc.
Furthermore, because many functional groups have about the
same D u 2 value (ethers ca 0.45, ketones ca 0.48, alkanol ca
0.41, and esters ca 0.42) there is very little
discrimination between a wide range of compounds at 31% R H .
The regression results at 65% RH show that the adsorbent is
still behaving as a strong hydrogen-bond acid as at 31%RH
but slightly stronger (b=2.27) , reflecting the greater
amount of water bound in the a d s orbent. But the
coefficients "a" and "1” have now returned to similar
levels as measured at 0% RH (a=2.08, 1=0.61) . This
complicates the explanation, and indicates that there may
be more than one mechanism of adsorption at various levels
of humidity, which oppose one another, the dominance of the
preferred mechanism depending upon the level of relative
humidity at which the adsorption is carried out. The
overall main effect to note here is that when dry,
Amberlite XE-393 does not selectively adsorb bases but when
wet it does so quite strongly.
195
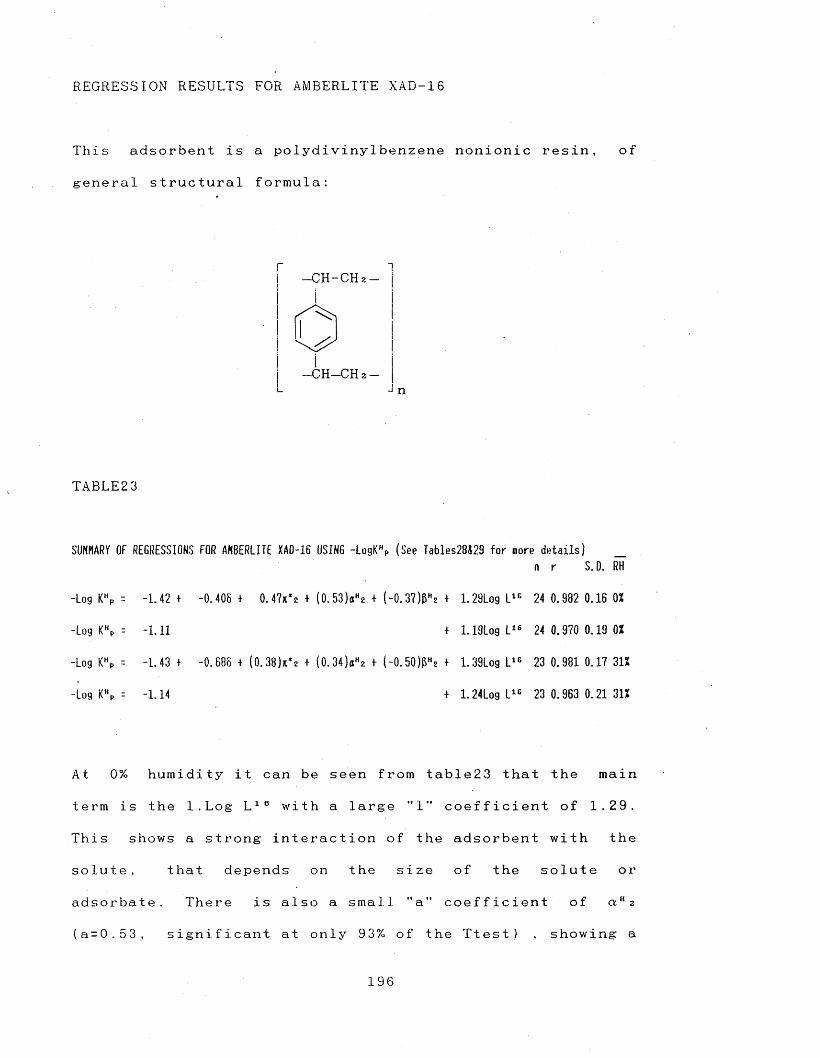
REGRESSION RESULTS FOR AMBERLITE XAD-16
This adsorbent is a polydivinylbenzene nonionic resin, of
general structural formula:
r ii —C H - C H 2 —
— C H — C H 2-j n
TABLE23
SUMMARY OF REGRESSIONS FOR AMBERLITE XAD-16 USING -LogKHP (See Tables28&29 for more details)
-Log KHP - -1.42 + -0.405 + 0. 47jc*c + (0.53)aH2 + (-0.37)&H2 4 1.29Log L1Gn r S. D. RH 24 0.982 0.16 OX
-Log KHP = -1.11 + 1.19Log L16 24 0.970 0.19 OX-Log KHP = -1.43 t -0.685 + (0.38)k*2 + (0.34)aH2 t (-0.50)&H2 + 1.39Log L1C 23 0.981 0.17 31X
11 a.Xcr»a1 -1.14 + 1.24Log Lie 23 0.963 0.21 31X
At 0% humidity it can be seen from table23 that the main
term is the 1.Log L 16 with a large ”1” coefficient of 1.29.
This shows a strong interaction of the adsorbent with the
solute, that depends on the size of the solute or
adsorbate. There is also a small ”a" coefficient of a H 2
(a=0.53, significant at only 9 3% of the T t e s t ) , showing a
19 6
weak interaction of hydrogen-bond acid solutes, presumably
with the electron rich benzene ring. At 31% RH the
coefficient of a H 2 is even less pronounced (a=0.34),
probably due to a small effect of the water, hindering
interaction at the benzene ring. However no real effect is
seen at 31% RH to the 1.Log L 16 term, which is by far the
major term, and as a result the adsorption at 0% and 31% RH
leads to very similar results. This is in agreement with
Rudenko and Dzhaburov8 2 , who found little difference in GSC
retention data on Chromosorb 102 at 0% and greater levels
of humidity (Chromosorb 102 is.a polystyrene based porous
polymer).
The adsorption results for Amberlite XAD-16 are so
dependent on Log L 16 that when dealt in terms of this
solute parameter only, good regressions, as seen above in
Table23, are observed. Amberlite XAD-16 is thus selective
towards solutes mainly by size and is not affected by
levels of humidity to any great extent at 31% R H . Bearing
this in mind, it was not considered necessary to carry out
experiments at higher relative humidity than 31% RH because
it is assumed that if their is no effect noticable at 31%
R H , then it would seem unlikely there will be any at higher
levels of humidity than this.
197
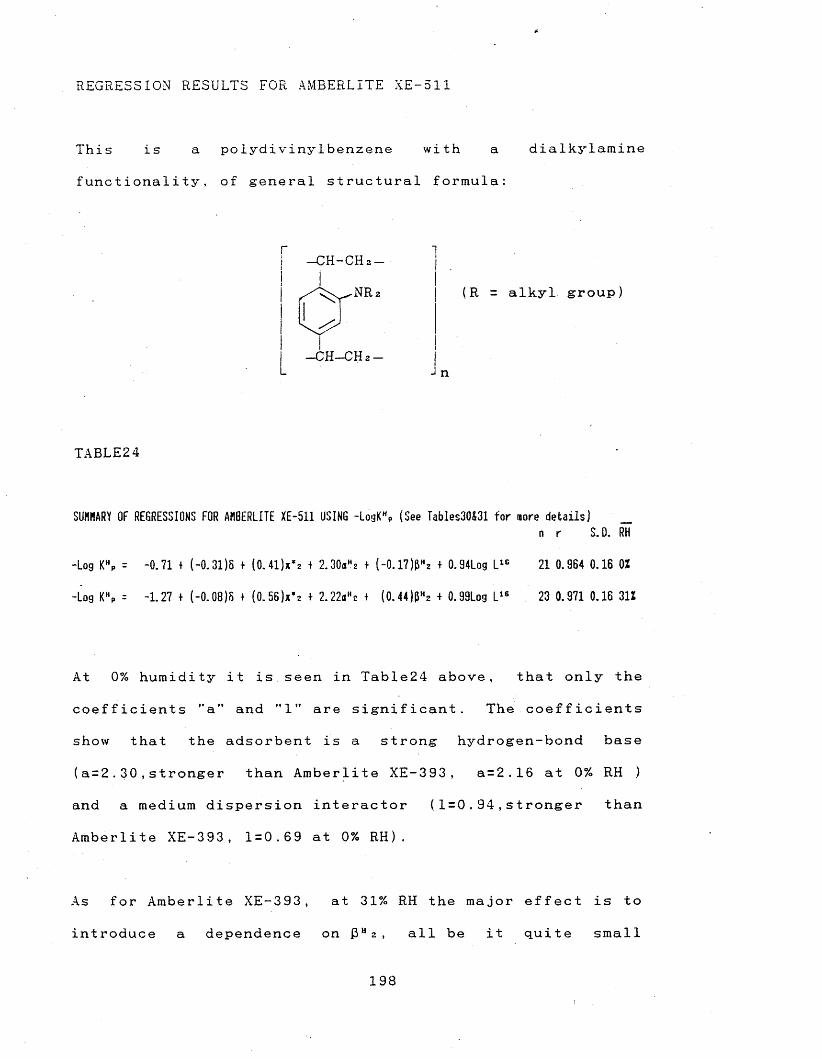
REGRESSION RESULTS FOR AMBERLITE XE-511
This is a polydivinylbenzene with a dialkylamine
functionality, of general structural formula:
-CH-CHa-
/ s\ ^ N R 2
- C H - C H z -
(R = alkyl group)
■J n
TABLE24
SUMHARY OF REGRESSIONS FOR AMBERLITE XE-511 USING -LogK% (See Tables30&31 for more details) _ n r S.D. RH
-Log KHP = -0.71 + (-0.31)5 + (0.41)*** + 2.30aHz + (-0.17)&Hz + 0.94Log L16 21 0.964 0.16 02-Log KHP = -1.27 + (-0.08)5 + (0.56)x’2 t 2.22aHc + (0.44)pHz + 0.99Log L16 23 0.971 0.16 312
At 0% humidity it is. seen in Table24 above, that only the
coefficients "a" and "1" are significant. The coefficients
show that the adsorbent is a strong hydrogen-bond base
(a = 2 .30,stronger than Amberlite XE-393, a=2.16 at 0% RH )
and a medium dispersion interactor (1=0.94,stronger than
Amberlite XE-393, 1=0.69 at 0% R H ).
As for Amberlite XE-393, at 31% RH the major effect is to
introduce a dependence on fiu 2 , all be it quite small
198
and not significant at the 95% level of the Ttest (b = 0 .44),
and much less than in Amberlite XE-393 at 31% R H . However
in contrast to Amberlite XE-393 at 31% RH there is little
or no effect on the coefficients ”a ” and M1" when compared
to 0% RH results.
The hydrogen-bond basicity of the adsorbent is due to the
lone pair electrons on the nitrogen, and the dispersion
interaction to the carbon back-bone of the polymer and the
aromatic r i n g s ’
Amberlite XE-511 is the strongest hydrogen-bond base
adsorbent that has been studied in this work and shows good
tolerance to levels of humidity, which introduces a small
hydrogen bond acidity in the adsorbent.
REGRESSION RESULTS FOR AMBERLITE XAD-7
This adsorbent is an methacrylic ester based polymer resin
of general structural formula:
r i-CH- if lI ICOOR i -In
199
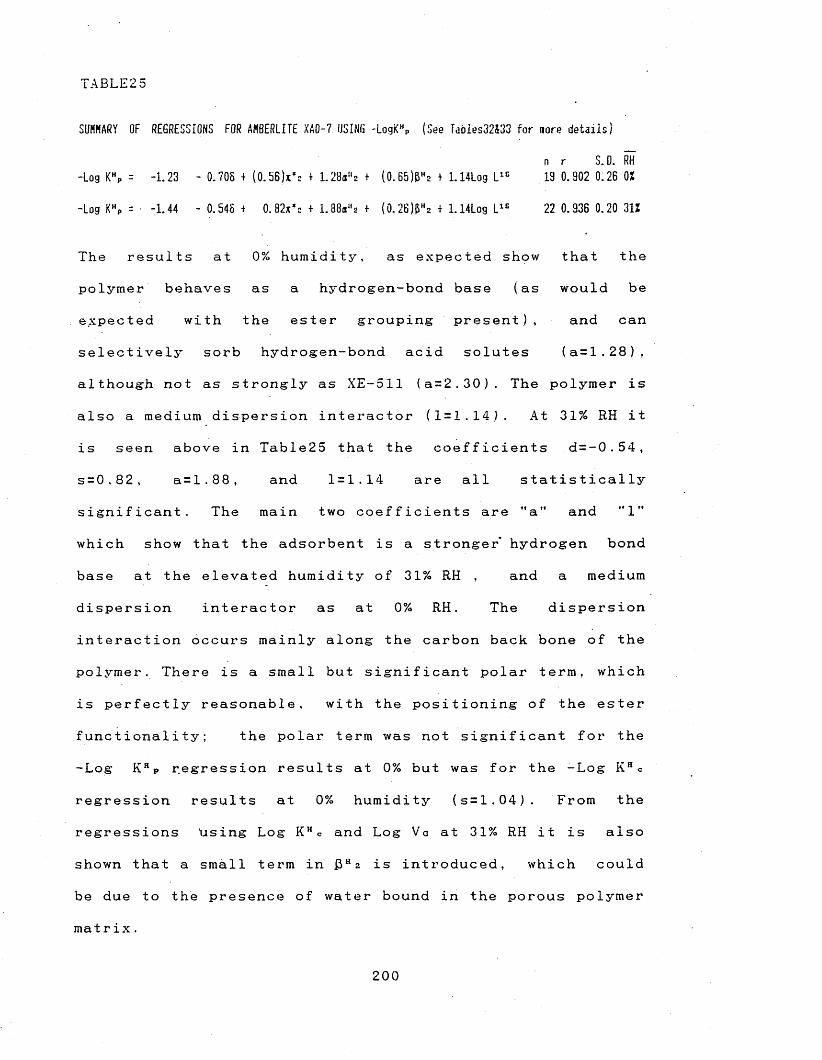
TABLE2 5
SUMMARY OF REGRESSIONS FOR AMBERLITE XAD-7 USING -LogKHP (See Tables32433 for aore details)
n-Log KHP = -1.23 - 0.706 4 (0.56)**= + 1.28b"2 4 (0.65)&Hc 4 1.14Log L1C 19-Log K % = • -1.44 - 0.546 4 0. 82x*2 4 1.88aa2 4 (0.26)fiH2 4 1.14Log L16 22
The results at 0% humidity, as expected show
polymer behaves as a hydrogen-bond base (as
expected with the ester grouping present),
selectively sorb hydrogen-bond acid solutes
although not as strongly as XE-511 (a=2.30). The polymer is
also a medium dispersion interactor (1=1.14). At 31% RH it
is seen above in Table25 that the coefficients d=-0.54,
s=0.82, a=1.88, and 1=1.14 are all statistically
significant. The main two coefficients are "a” and ”1”
which show that the adsorbent is a stronger' hydrogen bond
base at the elevated humidity of 31% RH , and a medium
dispersion interactor as at 0% R H . The dispersion
interaction occurs mainly along the carbon back bone of the
polymer. There is a small but significant polar term, which
is perfectly reasonable, with the positioning of the ester
functionality; the polar term was not significant for the
-Log K HP regression results at 0% but was for the -Log K H c
regression results at 0% humiditj’- (s = 1.04). From the
regressions using Log K HC and Log Va at 31% RH it is also
shown that a small term in fiH 2 is introduced, which could
be due to the presence of water bound in the porous polymer
m a t r i x .
r S. D. RH 0.902 0.26 OX0.936 0.20 31Z
that the
would be
and can
(a = 1.28) ,
200
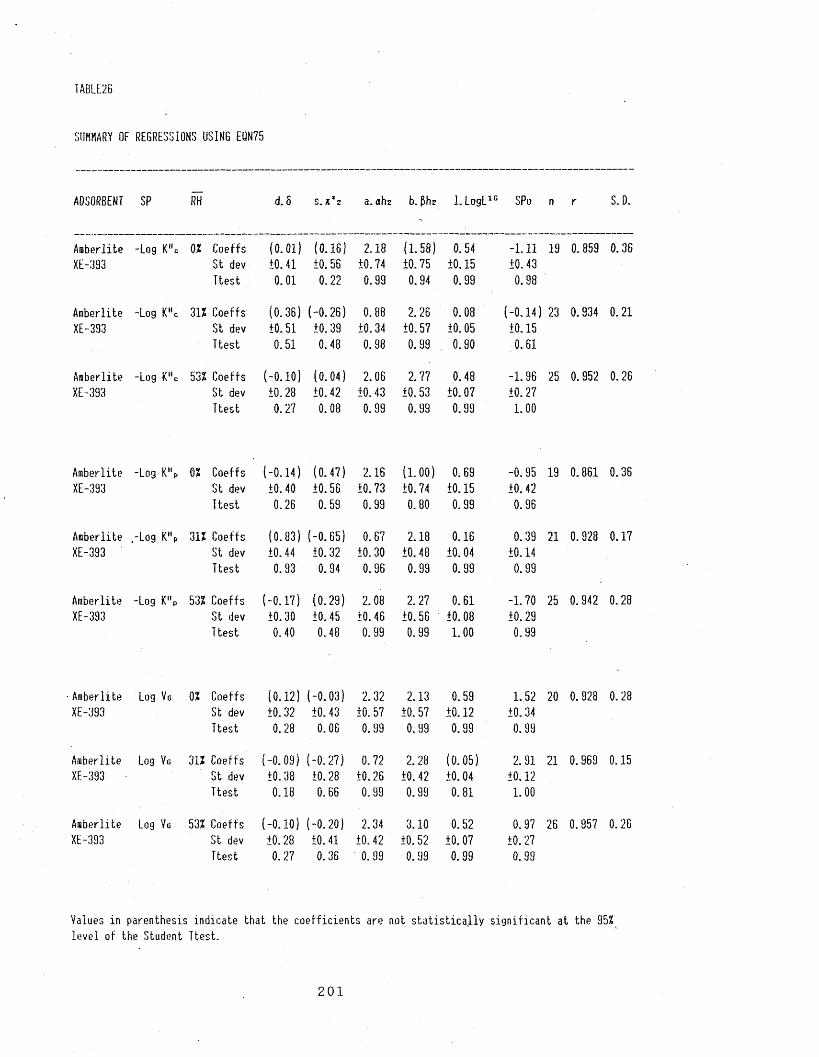
TABLE26
SUMMARY OF REGRESSIONS USING EQN75
ADSORBENT SP RH d. 5 S. K XS a. ahz b. 0h2 l.LogL10 SPo n r S. D.
Amberlite -Log K Hc 02 Coeffs (O.OlJ (0.16) 2.18 (1.58) 0.54 -1.11 19 0.859 0.36XE-393 St dev +0.41 +0.56 10.74 10.75 10.15 10.43
Ttest 0.01 0.22 0.99 0.94 0.99 0.98Amberlite -Log K H c 312 Coeffs (0.36) (-0.26) 0.88 2.26 0.08 (-0.14) 23 0.934 0.21XE-393 St dev +0.51 10.39 10.34 10.57 10.05 10.15
Ttest 0.51 0.48 0.98 0.99 0.90 0.61Amberlite -Log KHC 532 Coeffs (-0.10) (0.04) 2.06 2.77 0.48 -1.96 25 0.952 0.26XE-393 St dev +0.28 10.42 10.43 10.53 10.07 10.27
Ttest 0.27 0.08 0.99 0.99 0.99 1.00
Amberlite -Log KHP 02 Coeffs (-0.14) (0.47) 2.16 (1.00) 0.69 -0.95 19 0.861 0.36XE-393 St dev 10.40 10.56 10.73 10.74 10.15 10.42
Ttest 0.26 0.59 0.99 0.80 0.99 0.96Amberlite .-Log K % 312 Coeffs (0.83) (-0. 65) 0.67 2.18 0.16 0.39 21 0.928 0.17XE-393 St dev 10.44 10.32 10.30 10.48 10.04 10.14
Ttest 0.93 0.94 0.96 0.99 0.99 0.99Amberlite -Log KHP 532 Coeffs (-0.17) (0.29) 2.08 2.27 0.61 -1.70 25 0.942 0.28XE-393 St dev 10.30 10.45 10.46 10.56 10.08 10.29
Ttest 0.40 0.48 0.99 0.99 1.00 0.99
Amberlite Log V g 02 Coeffs (0.12) (-0.03) 2.32 2.13 0.59 1.52 20 0.928 0.28XE-393 St dev 10.32 10.43 10.57 10.57 10.12 10.34
Ttest 0.28 0.06 0.99 0.99 0.99 0.99Amberlite Log V g 312 Coeffs (-0.09) (-0.27) 0.72 2.28 (0.05) 2.91 21 0.969 0.15XE-393 ■ St dev 10.38 10.28 10.26 10.42 10.04 10.12
Ttest 0.18 0.66 0.99 0.99 0.81 1.00Amberlite Log V g 532 Coeffs (-0.10) (-0.20) 2.34 3.10 0.52 0.97 26 0.957 0.26XE-393 St dev 10.28 10.41 10.42 10.52 10.07 10.27
Ttest 0.27 0.36 0.99 0.99 0.99 0.99
Values in parenthesis indicate that the coefficients are not statistically significant at the 95%level of the Student Itest.
201
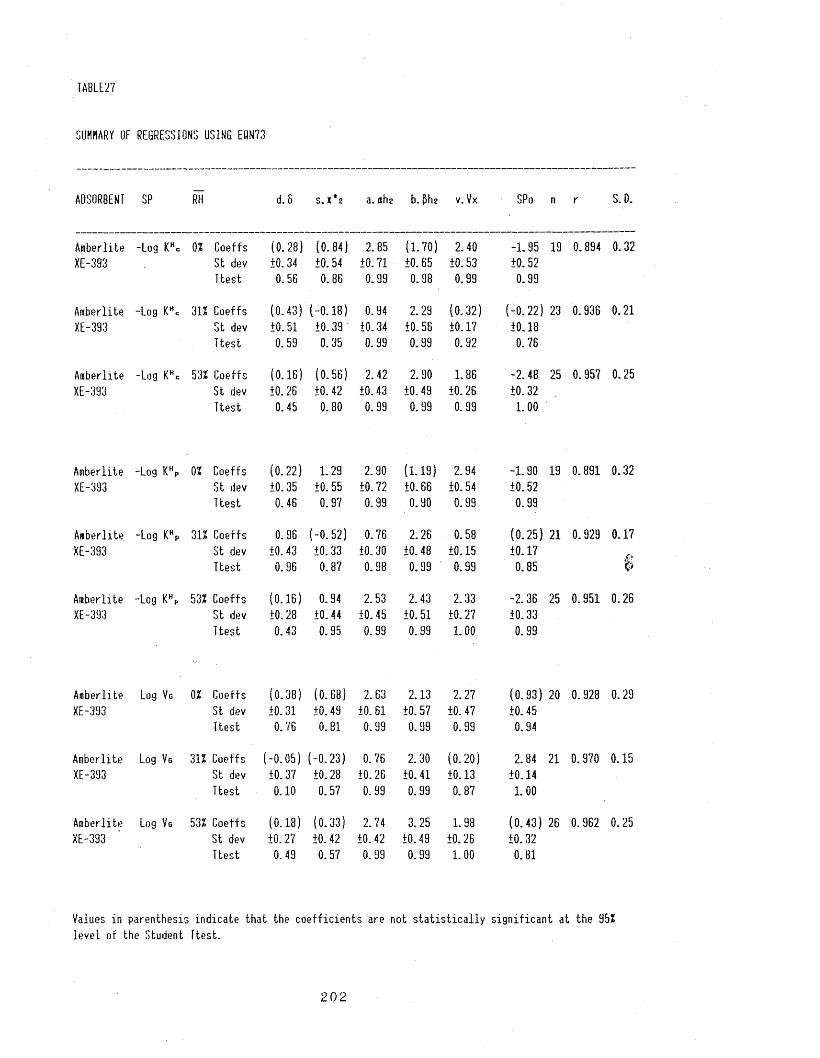
TABLE27
SUMMARY (JF REGRESSIONS USING EQM73
ADSORBENT SP RH d.8 s.x’e a.ahz b.&hs v.Vx SPo n r S.D.
Amberlite -Log KHc 02 Coeffs (0.28) (0.84) 2.85 (1.70) 2.40 -1.95 19 0.894 0.32XE-393 S.t dev 10.34 10.54 10.71 10.65 10.53 10.52
Ttest 0.56 0.86 0.99 0.98 0.99 0.99Amberlite -Log KHc 312 Coeffs (0.43) (-0.18) 0.94 2.29 (0.32) (-0.22) 23 0.936 0.21XE-393 St dev 10.51 10.39 10.34 10.56 10.17 10.18
Ttest 0.59 0.35 0.99 0.99 0.92 0.76Amberlite -Log KHc 532 Coeffs (0.16) (0.56) 2.42 2.90 1.86 -2.48 25 0.957 0.25XE-393 St dev 10.26 10.42 10.43 10.49 10.26 10.32
Ttest 0.45 0.80 0.99 0.99 0.99 1.00
Amberlite -Log KHP 02 Coeffs (0.22) 1.29 2.90 (1-19) 2.94 -1.90 19 0.891 0.32XE-393 St dev 10.35 10.55 10.72 10.66 10.54 10.52
Ttest 0.46 0.97 0.99 0.90 0.99 0.99Amberlite -Log K % 312 Coeffs 0.96 (-0.52) 0.76 2.26 0.58 (0.25) 21 0.929 0.17XE-393 St dev 10.43 10.33 10.30 10.48 10.15 10.17
Ttest 0.96 0.87 0.98 0.99 0.99 0.85 %
Amberlite -Log KHp 532 Coeffs (0.16) 0.94 2.53 2.43 2.33 -2.36 25 0.951 0.26XE-393 St dev 10.28 10.44 10.45 10.51 10.27 10.33
Ttest 0.43 0.95 0.99 0.99 1.00 0.99
Amberlite Log V g 02 Coeffs (0.38) (0.68) 2.63 2.13 2.27 (0.93) 20 0.928 0.29XE-393 St dev 10.31 10.49 10.61 10.57 10.47 10.45
Ttest 0.76 0.81 0.99 0.99 0.99 0.94Amberlite Log Vg 312 Coeffs (-0.05) (-0.23) 0.76 2.30 (0.20) 2.84 21 0.970 0.15XE-393 St dev 10.37 10.28 10.26 10.41 10.13 10.14
Ttest 0.10 0.57 0.99 0.99 0.87 1.00Amberlite Log Vg 532 Coeffs (0.18) (0.33) 2.74 3.25 1.98 (0.43) 26 0.962 0.25XE-393 St dev 10.27 10.42 10.42 10.49 10.26 10.32
Ttest 0.49 0.57 0.99 0.99 1.00 0.81
Values in parenthesis indicate that the coefficients are not statistically significant at the 952level of the Student Ttest.
202

TABLE28
SUMMARY OF REGRESSIONS USING EUN75
ADSORBENT SP RH d.8 S. Jt*2 a. ah2 b. &hz 1.LogL1G SPo n r S.D.
AMBERLITE -Log KHc 02 Coeffs -0.34 0.33 0.61 (-0.10) 1.15 -1.60 24 0.984 0.13XAD-16 St dev ±0.13 ±0.15 ±0.23 ±0.19 ±0.05 ±0.14
Ttest 0.98 0.95 0.99 0.40 1.00 L O OCoeffs 1.02 -1.20 24 0.966 0.17St dev ±0.06 ±0.14Ttest 1.00 1.00
AMBERLITE -Log KHc 312 Coeffs -0.57 (0.26) 0.42 (-0.18) 1.22 -1.60 23 0.988 0.11XAD-16 St dev ±0.12 ±0.13 ±0.19 ±0.17 ±0.05 ±0.12
Ttest 0.99 0.93 0.96 0.70 1.00 1.00Coeffs 1.06 -1.23 23 0.962 0.18St dev ±0.07 ±0.15Ttest 1.00 1.00
AMBERLITE -Log KHP 02 Coeffs -0.40 0:47 (0.53) (-0.37) 1.29 -1.42 24 0.982 0.16XAD-16 St dev ±0.16 ±0.19 ±0.28 ±0.23 ±0.07 ±0.18
Ttest 0.97 0.98 0.93 0.88 1.00 1.00Coeffs 1.19 -1.11 24 0.970 0.19St dev ±0.06 ±0.15Ttest 1.00 1.00
AMBERLITE -Log KHP 312 Coeffs -0.68 (0.38) (0.34) (-0.50) 1.39 -1.43 23 0.981 0.17XAD-16 St dev ±0.18 ±0.20 ±0.28 ±0.24 ±0.08 ±0.18
Ttest 0.99 0.93 0.76 0.94 1.00 1.00Coeffs 1.24- -1.14 23 0.963 0.21St dev ±0.08 ±0.18Ttest 1.00 0.99
AMBERLITE Log Vg 02 Coeffs -0.36 (0.28) 0.85 (-0.02) 1.04 1.29 24 0.977 0.14XAD-16 St dev ±0.14 ±0.16 ±0.24 ±0.20 ±0.06 ±0.15
Ttest 0.98 0.90 0.99 0.08 1.00 1.00Coeffs 0.88 1.79 24 0.943 0.20St dev ±0.07 ±0.16Ttest 1.00 1.00
AMBERLITE Log Vg 312 Coeffs -0.46 0.27 0.63 . (0.16) 1.05 1.33 24 0.986 0.11XAD-16 St dev ±0.11 ±0.13 ±0.18 ±0.16 ±0.05 ±0.12
Ttest 0.99 0.95 0.99 0.67 1.00 1.00Coeffs 0.89 1.87 24 0.936 0.21St dev ±0.07 ±0.17Ttest 1.00 1.00
Values in parenthesis indicate that the coefficients are not statistically significant at 952 of theStudent Ttest
203
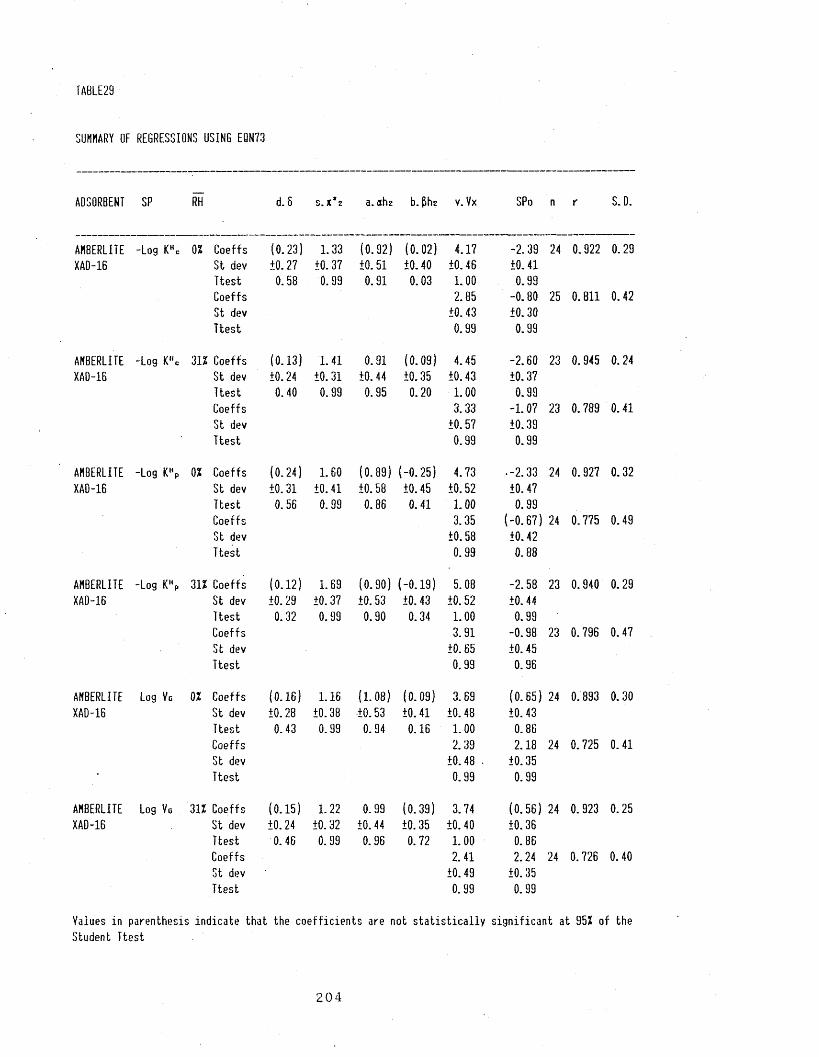
TABLE29
NUMMARY OF REGRESSIONS USING EQN73
ADSORBENT SP
AHBERLITE -Log KH, XAD-16
AHBERLITE -Log KH« XAD-16
AHBERLITEXAD-16
-Log KHf
AHBERLITE -Log K % XAD-16
AHBERLITEXAD-16
Log Vg
AHBERLITEXAD-16
Log Vg
RH d. 6 S. X * 2 a. ahz b. £hz v.Vx SPo n r S. D.
0? Coeffs (0.23) 1.33 (0.92) (0.02) 4.17 -2.39 24 0.922 0.29St dev +0.27 +0.37 ±0.51 ±0.40 ±0.46 ±0.41Ttest 0.58 0.99 0.91 0.03 1.00 0.99Coeffs 2.85 -0.80 25 0.811 0.42St dev tO. 43 ±0.30Ttest 0.99 0.99
31? Coeffs (0.13) 1.41 0.91 (0.09) 4.45 -2.60 23 0.945 0.24St dev +0.24 ±0.31 ±0.44 ±0.35 ±0.43 ±0.37Ttest 0.40 0.99 0.95 0.20 1.00 0.99Coeffs 3.33 -1.07 23 0.789 0.41St dev ±0.57 ±0.39Ttest 0.99 0.99
0? Coeffs (0.24) 1.60 (0.89) (-0.25) 4.73 •-2.33 24 0.927 0.32St dev ±0.31 ±0.41 ±0.58 ±0.45 ±0.52 ±0.47Ttest 0.56 0.99 0.86 0.41 1.00 0.99Coeffs 3.35 (-0.67) 24 0.775 0.49St dev ±0.58 ±0.42Ttest 0.99 0.88
31? Coeffs (0.12) 1.69 (0.90) (-0.19) 5.08 -2.58 23 0.940 0.29St dev +0.29 ±0.37 ±0.53 ±0.43 ±0.52 ±0.44Ttest 0.32 0.99 0.90 0.34 1.00 0.99Coeffs 3.91 -0.98 23 0.796 0.47St dev ±0.65 ±0.45Ttest 0.99 0.96
0? Coeffs (0.16) 1.16 (1.08) (0.09) 3.69 (0.65) 24 0.893 0.30St dev +0.28 ±0.38 ±0.53 ±0.41 ±0.48 ±0.43Ttest 0.43 0.99 0.94 0.16 1.00 0.86Coeffs 2.39 2.18 24 0.725 0.41St dev ±0.48 • ±0.35Ttest 0.99 0.99
31? Coeffs (0.15) 1.22 0.99 (0.39) 3.74 (0.56) 24 0.923 0.25St dev +0.24 ±0.32 ±0.44 ±0.35 ±0.40 ±0.36Ttest 0.46 0.99 0.96 0.72 1.00 0.86Coeffs 2.41 2.24 24 0.726 0.40St dev ±0.49 ±0.35Ttest 0.99 0.99
Yaiues in parenthesis indicate that the coefficients are not statistically significant at 95Z of theStudent Ttest
2 04
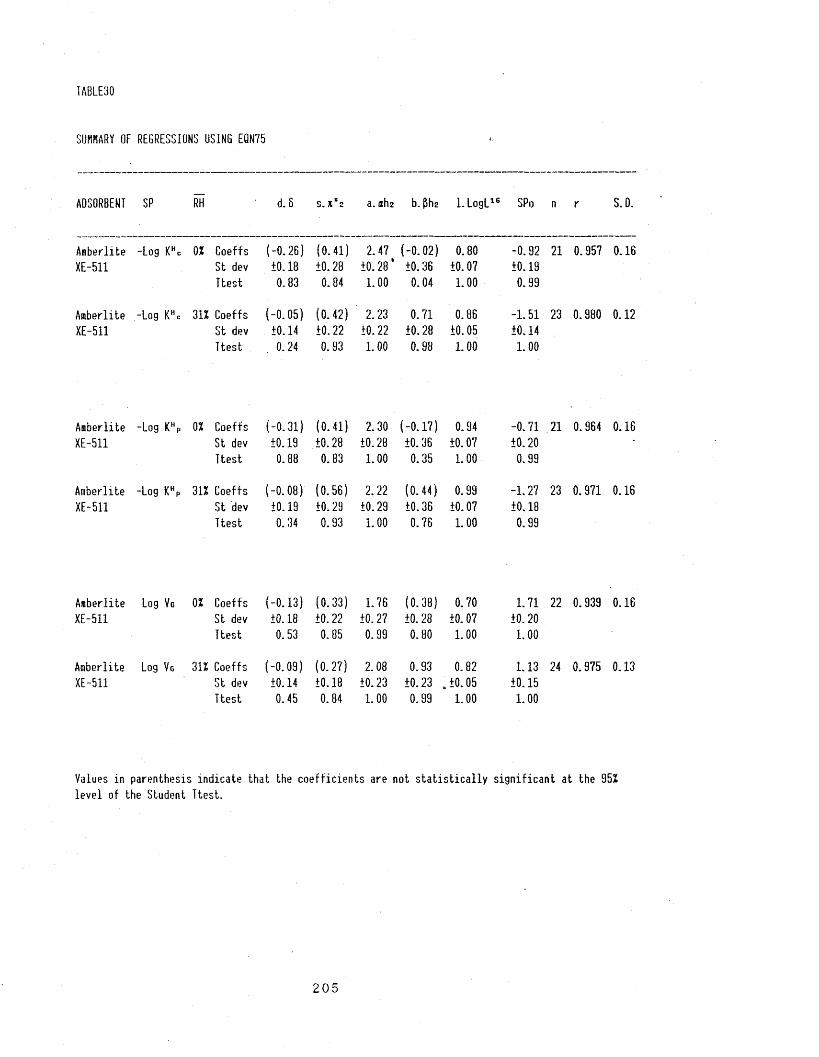
TABLE30
SUMMARY OF REGRESSIONS OSING EQN75
ADSORBENT SP RH d.S S. K*2 a. ahz b.flhz l.LogL16 SPo n r S. D.
Amberlite -Log KHC 0? Coeffs (-0.26) (0.41) 2.47 (-0.02) 0.80 -0.92 21 0.957 0.16XE-511 St dev +0.18 10.28 10.28' 10.36 10.07 10.19
Ttest 0.83 0.84 1.00 0.04 1.00 0.99Amberlite -Log KHc 312 Coeffs (-0.05) (0.42) 2.23 0.71 0.86 -1.51 23 0.980 0.12XE-511 St dev 10.14 10.22 10.22 10.28 10.05 10.14
Ttest 0.24 0.93 1.00 0.98 1.00 1.00
Amberlite -Log KHP 02 Coeffs (-0.31) (0.41) 2.30 (-0.17) 0.94 -0.71 21 0.964 0.16XE-511 St dev 10.19 10.28 10.28 10.36 10.07 10.20
Ttest 0.88 0.83 1.00 0.35 1.00 0.99Amberlite -Log KHP 312 Coeffs (-0.08) (0.56) 2.22 (0.44) 0.99 -1.27 23 0.971 0.16XE-511 St dev 10.19 10.29 10.29 10.36 10.07 10.18
Ttest 0.34 0.93 1.00 0.76 1.00 0.99
Amberlite Log Vg 02 Coeffs (-0.13) (0.33) 1.76 (0.38) 0.70 1.71 22 0.939 0.16XE-511 St dev 10.18 10.22 10.27 10.28 10.07 10.20
Ttest 0.53 0.85 0.99 0.80 1.00 1.00Amberlite Log Vg 312 Coeffs (-0.09) (0.27) 2.08 0.93 0.82 1.13 24 0.975 0.13XE-511 St dev 10.14 10.18 10.23 10.23 „ 10.05 10.15
Ttest 0.45 0.84 1.00 0.99 1.00 1.00
Values in parenthesis indicate that the coefficients are not statistically significant at the 952 level of the Student Ttest.
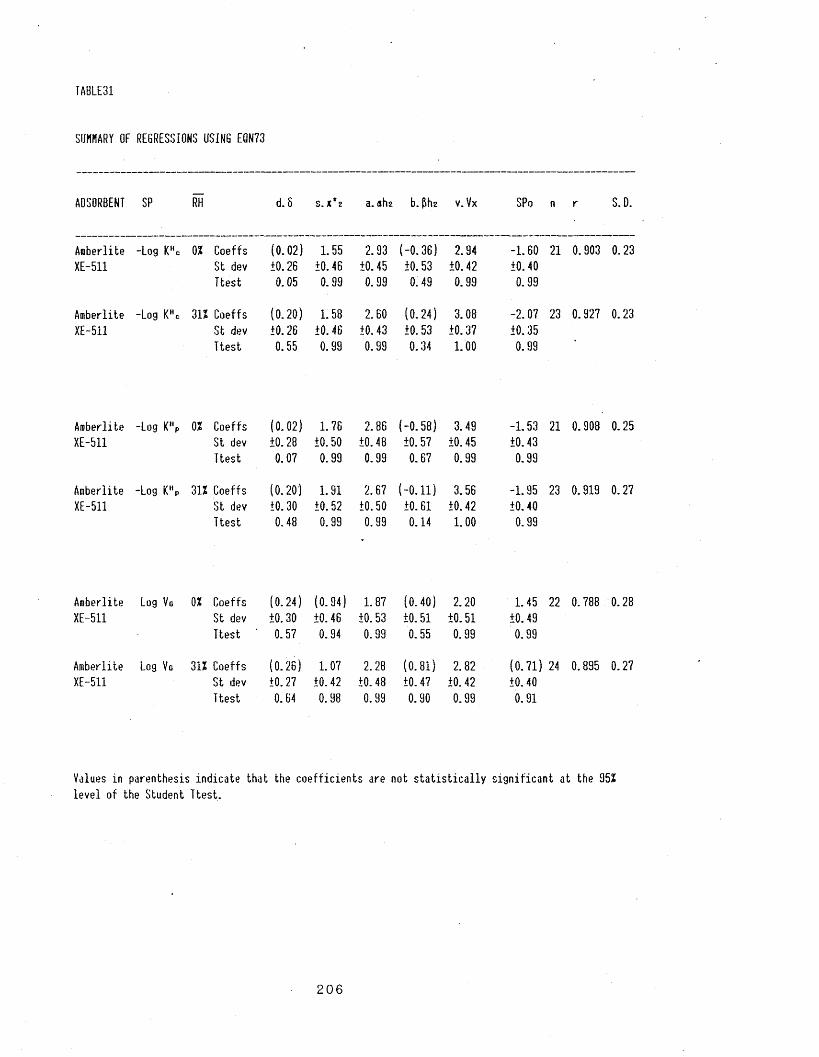
TABLE31
SUMMARY OF REGRESSIONS USING EQN73
ADSORBENT SP RH d.8 S. X*2 a. aha b. v. Vx SPo n r S.D.
Amberlite -Log KHc 0? Coeffs (0.02) 1.55 2.93 (-0.36) 2.94 -1.60 21 0.903 0.23XE-511 St dev ±0.26 10.46 10.45 10.53 10.42 10.40
Ttest 0.05 0.99 0.99 0.49 0.99 0.99Amberlite -Log KHc 31? Coeffs (0.20) 1.58 2.60 (0.24) 3.08 -2.0? 23 0.927 0.23XE-511 St dev 10.26 10.46 10.43 10.53 10.37 10.35
Ttest 0.55 0.99 0.99 0.34 1.00 0.99
Amberlite -Log KHP 0? Coeffs (0.02) 1.76 2.86 (-0.58) 3.49 -1.53 21 0.908 0.25XE-511 St dev 10.28 10.50 10.48 10.57 10.45 10.43
Ttest 0.07 0.99 0.99 0.67 0.99 0.99Amberlite -Log KHP 31? Coeffs (0.20) 1.91 2.67 (-0.11) 3.56 -1.95 23 0.919 0.27XE-511 St dev 10.30 10.52 10.50 10.61 10.42 10.40
Ttest 0.48 0.99 0.99 0.14 1.00 0.99
Amberlite Log Vg 0? Coeffs (0.24) (0.94) 1.87 (0.40) 2.20 1. 45 22 0.788 0.28XE-511 St dev 10.30 10.46 10.53 10.51 10.51 10.49
Ttest 0.57 0.94 0.99 0.55 0.99 0.99Amberlite Log Vg 31? Coeffs (0.26) 1.07 2.28 (0.81) 2.82 (0.71) 24 0.895 0.27XE-511 St dev 10.27 10.42 10.48 10.47 10.42 10.40
Ttest 0.64 0.98 0.99 0.90 0.99 0.91
Yalues in parenthesis indicate that the coefficients are not statistically significant at the 95? level of the Student Ttest.

TABLE32
SUMMARY OF REGRESSIONS USING EQN75
ADSORBENT SP RH d. 8 S. S*2 a. ah2 b.phz l.LogL16 SPo n r S.D.
Amberlite -Log KHc 0% Coeffs -0.54 1.04 1.48 (0.14) 0.821 -1.02 19 0.927 0.18XAD-7 St dev +0.22 +0.26 +0.37 +0.32 +0.11 +0.28
Ttest 0.97 0.99 0.99 0.32 0.99 0.99Amberlite -Log KHc 312 Coeffs -0.43 0.65 1.97 0.53 0.94 -1.49 22 0.935 0.17XAD-7 St dev +0.19 +0.20 +0.32 +0.21 +0.10 +0.26
Ttest 0.96 0.99 0.99 0.98 1.00 0.99
Amberlite -Log KHP 0% Coeffs -0.70 (0.56) 1.28 (0.65) 1.14 -1.23 19 0.902 0.26XAD-7 St dev +0.33 +0.38 +0.54 +0.47 +0.16 +0.41
Ttest 0.95 0.84 0.97 0.81 0.99 0.99Amberlite -Log KHP 312 Coeffs -0.54 0.82 1.88 (0.26) 1.14 -1.44 22 0.936 0.20XAD-7 St dev +0.23 +0.24 +0.39 +0.25 +0.12 +0.31
Ttest 0.97 0.99 0.99 0.68 1.00 0.99
Amberlite Log Vg 02 Coeffs (-0.02) (0.40) 1.44 (0.59) 0.62 2.03 19 0.921 0.16XAD-7 St dev +0.20 +0.23 +0.33 +0.29 +0.10 +0.25
Ttest 0.08 0.90 0.99 0.94 0.99 0.99Amberlite Log Vg 312 Coeffs (-0.10) 0.52 1.58 0.86 0.71 1.63 22 0.951 0.13XAD-7 St dev +0.15 +0.15 +0.24 +0.16 +0.08 +0.20
Ttest 0.50 0.99 0.99 0.99 1.00 1.00
Values in parenthesis indicate that the coefficients are not statistically significant at the 952 level of the Student Ttest.
2 0 7
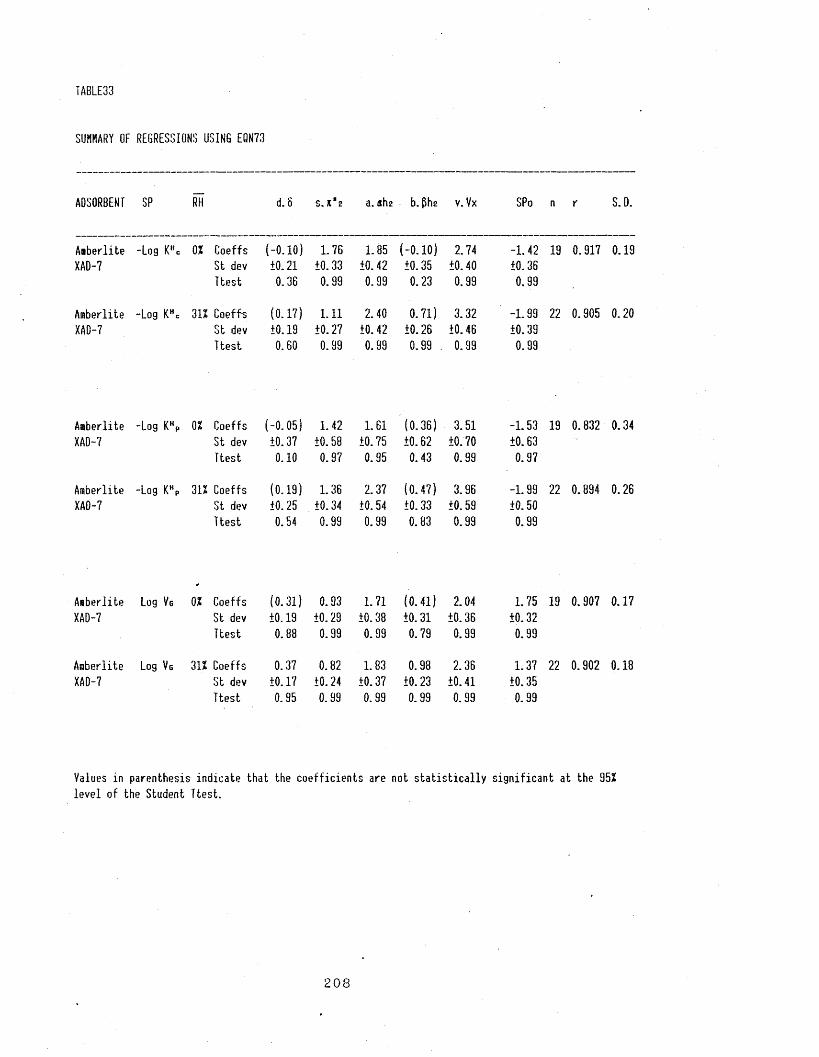
TABLE33
SIJHUARY OF REGRESSIONS USING EQN73
ADSORBENT SP RH d.8
1cj
i«
jK
11Ui
|
a. ahz b. fth2 v. Vx SPo n r S. D.
Amberlite -Log KHC OX Coeffs (-0.10) 1.76 1.85 (-0.10) 2.74 -1.42 19 0.917 0.19XAD-7 St dev ±0.21 10.33 10.42 10.35 10.40 10.36
Ttest 0.36 0.99 0.99 0.23 0.99 0.99Amberlite -Log K H c 312 Coeffs (0.17) 1.11 2.40 0.71) 3.32 -1.99 22 0.905 0.20XAD-7 St dev 10.19 10.27 10.42 10.26 10.46 10.39
Ttest 0.60 0.99 0.99 0.99 . 0.99 0.99
Amberlite -Log KHP 02 Coeffs (-0.05) 1.42 1.61 (0.36) 3.51 -1.53 19 0.832 0.34XAD-7 St dev 10.37 10.58 10.75 10.62 10.70 10.63
Ttest 0.10 0.97 0.95 0.43 0.99 0.97Amberlite -Log KHP 312 Coeffs (0.19) 1.36 2.37 (0.47) 3.96 -1.99 22 0.894 0.26XAD-7 St dev 10.25 10.34 10.54 10.33 10.59 10.50
Ttest 0.54 0.99 0.99 0.83 0.99 0.99
Amberlite Log Vg 02 Coeffs (0.31) 0.93 1.71 (0.41) 2.04 1.75 19 0.907 0.17XAD-7 St dev 10.19 10.29 10.38 10.31 10.36 10.32
Ttest 0.88 0.99 0.99 0.79 0.99 0.99Amberlite Log Vg 312 Coeffs 0.37 0.82 1.83 0.98 2.36 1.37 22 0.902 0.18XAD-7 St dev 10.17 10.24 10.37 10.23 10.41 10.35
Ttest 0.95 0.99 0.99 0.99 0.99 0.99
Values in parenthesis indicate that the coefficients are not statistically significant at the 95Z level of the Student Ttest.
208
6.1. SUMMARY DISCUSSION AND CONCLUSIONS AND FUTURE WORK
The use of linear solvation energy relationships (LSER) via
eqn75 describing cavity formation and possible solvent-
solute interactions has lead to a remarkedly simple model
of solvation or sorption. This model has made it possible
logSP = SPo + d.oz + s.7t;*2 + a . a H 2 + b . j3 H 2 + l.Lo gLa18 (75)
to estimate the various contributions, especially those due
to hydrogen-bonding, to the solvation or sorption of
gaseous solutes. The method is based on the assumption
that all the various interactions are independent and can
be simply summed to yield the total solvation or sorption
energy. This cannot generally be entirely correct, but with
the rather simple solutes used here (note a wide range of
solute types are considered), it appears to be a valid
assumpt i o n .
By the use of an empirical method of correlation (using
eqn75) relating a variety of physico-chemical phenomena to
solute characteristics, it has been possible to
characterise solvent phases, including liquid polymers,
solvents, 'porous polymeric adsorbents, and activated
charcoals in terms of solute properties. Together with Dr.
Grate and his coworkers147 we have successfully used eqn75
to predict the solubility of gases and vapours into liquid
2 0 9
polymeric phases used in chemical sensors. Hence it is now
possible, to predict the actual sensor response to
challenge gases and v a p o u r s 147, and in addition to provide
a model for the chemical sensor operation. Such
characterisation of polymeric compounds provides a rational
for the selection and development of chemical sensors for
use in surface acoustic wave devices and other chemical
sen s o r s .
Likewise for the adsorbents considered in this work
the linear solvation energy relationships developed provide
a general method of characterisation, hitherto impossible,
which enables the worker to select an adsorbent for the
particular operation (including adsorption of gases and
vapours under conditions of varying relative humidity) much
more easily than before.
The use of LSER's as a predictive method of calculating
partition coefficients or Henry's constants, will be of
great value for those solutes that are difficult to measure
experimentally due, for example to the danger in handling
some toxic substances. Also the model can be used in a
predictive manner to estimate solute parameters (see
Sec 5 . 1 . 2 . PI 28 .) . For example the effective hydrogen-bond
basicity (in the particular phase of interest) of
difunctional solutes can be estimated.
210
A new solute parameter, L o g L 18 has been developed121 which
describes the summed energy required to form a cavity for a
solute in a solvent and the dispersion interaction between
solute and solvent, for the dissolution of a gas or vapour.
This has proved very useful in the correlation of
solubility or sorption properties using eqn75 of gases or
vapours, in particular the solubility in po l y m e r s 1 4 8 ,
sorption on adsorbents149 and toxicological d a t a 1 5 0 .
6.1.1. FUTURE WORK
ADSORBENT CHARACTERISATION
A program of adsorbent characterisation needs to be set up,
to systematically cover a wide range of adsorbents at
different levels of humidity. About 20-30 solutes are
required per adsorbent, and each adsorbent at a single
humidity level takes about three weeks to characterise per
gas chromatographic set up. The experimentation, once the
relevant apparatus has been constructed, is minimal (all
calculations are carried out by on-line computing) and
there is no reason why two or more gas chromatographic set
ups could not be run in parallel with little extra operator
effort required. Such a comprehensive adsorbent
classification would provide a system whereby suitable
adsorbents could be easily chosen for specific sorptions of
gases or vapours, in particular toxic agents (under
211
different conditions such as humidity), by a worker with
little experience in the adsorbent industry. The present
work has been confined to adsorption studies of gases or
vapours, but there is no reason why it could not be applied
to the adsorption of solutes from solution, and to high
performance liquid chromatography (HPLC). Some HPLC studies
as described above have already been carried out by Carr et
a l 151 with promising results, and recently Kamlet et a l 145
have studied the adsorption of non-electrolytes from water
on to activated carbon, by" multiple regression analysis.
SOLVENT AND LIQUID POLYMER PHASE CHARACTERISATION
A systematic evaluation of gas-liquid stationary phases is
required along the same lines as for olive oil and liquid
polymeric phases carried out in this work. Fortunately this
will not require many experimental measurements as there
are available in the literature large retention data bases
for most of the available stationary p h a s e s . In particular
Laffort et a l ir>2 have published retention data for 240
solutes on 5 stationary phases, and McRey n o I d s 153 has
publi shed large amount s of retention data on 77 stati onary
phases, which would be suitable for multiple regression
an a 1ysi s .
From preliminary work carried out it was clear that nearly
all the stationary phases used in gas chromatography are
212
poor hydrogen-bond acids, being nearly always either
neutral (e.g. squalane, apiezon) or basic (e.g.
dinonyIphthalate,polyethyleneglycol,tricyanoethoxypropane).
Even for those phases with hydroxylic functionality e.g.
diglycerol the hydrogen-bond basicity selection is not
particularly large. It would be of considerable interest
and practical use to develop such phases that have s t rong
hydrogen-bond acidity, for both chromatographic use and
chemical sensor work. With particular reference to chemical
sensor coatings, the solute property that allows the best
distinction be tween chemical agents and other vapours i s
the solute hydrogen-bond basicity, which is high for
compounds containing the P=0 group (present in several
nerve agents). So it is essential to use sensor coatings
with a strong selection towards hydrogen-bond bases. Two
such coatings, fluoropolyol and poly(4-
vinylhexafluorocumyl-alcohol) have been studied in this
work and shown to have the desired properties. Further
solvent phases with strong hydrogen-bond acid properties
need to be synthesised and characterised by the method of
multiple linear regression used in this work, to provide
alternatives to the above compounds and to attempt to
better their selectivity. One particularly interesting
functionality is the hexafluorocarbinol group, whi ch i f
incorporated into solvent phases w o u 1d provide a prime
hydrogen-bo.nd acidic site at the hydroxyl group.
213
The chemical sensor coatings are ultimately intended to be
used for industrial and military applications, in the
field. This means exposing the chemical sensor to gases and
vapours in the air. Depending upon the prevailing weather
conditions this could mean subjecting the chemical sensor
to varying levels of humidity, which may or may not affect
sorption into the device. The effects of relative humidity
on the sorption effects in chemical sensor coatings could
be modelled by gas chromatography as before but with a
carrier gas at some relative humidity, just as was used in
the study of adsorbents at various levels of humidity in
the present work.
SOLUTE PARAMETERS
The L o g L 18 parameter has been reported121 for 240 solutes,
but due to its successful use in eqn75, it would be very
useful to extend the parameter data base further. Primary
values could be obtained on n-hexadecane as detailed in
this work, or for solutes with retention times too long to
be considered at 2 98K, secondary values could be estimated
by correlation of retention data determined on other apolar
stationary phases. For apolar phases such as apiezon or
squalane, a considerable amount of data exists already in
the literature, which should be extracted. And from
correlations of known primary L o g L 1B with suitable
retention data on apiezon or squalane; secondary values of
21 4
L o g L 18 can be obtained. In addition secondary estimates of
L o g L 18 can be made using an equation developed by Abraham
and F u c h s 142 to describe the theoretical implications of
L o g L 18, providing values of solute molar refraction, dipole
moment and volume are available.
One difficulty in the physicochemical interpretation of
eqn75 is that polarisability effects are contained in both
logSP = SPo + d .02 + s . t c * 2 + a . a H 2 + b.j3u2 + l.LogL 2 18 (75)
the s . t c * 2 and d .52 terms. In addition the solute parameter
tg* 2 is partially derived from the solvent parameter, tc* i .
This is not a very satisfactory position and it would be
preferable if the polarity and polarisability effects could
be separated into two independent terms. Two solute
parameters which could be investigated as possible
replacements of tcL and Oz are the dipole moment, jli , as a
measure of solute polarity, and the refractive index
function or molar refraction as a measure of
po 1 arisabi1i t y . Recent work 'by Abraham et al 154,1 55 using
such parameters has lead to unsatisfactory results, with
some problems in explaining the chemical sense of
regressions. Regressions using m 2 instead of tl* z did give
chemical sensible results, but with lower statistical
quality. This is not suprising since some of the iz* z values
are obtained via a )i versus tc * i correlation. However it
215
should still be a long- term aim to attempt to replace the
solvatochromic solute parameters it* z and oz, with more
suitable measure of solute polarity and p o 1arisabi1i t y .
The solute parameters a H z and 13" z are measures of solute
hydrogen-bond acidity and basicity respectively and have
been measured for monofunctional solutes. However for
difunctional or trifunctional solutes values are
unavailable. Such values would be of considerable interest
in particular in the characterisation of drugs, which
commonly have more than one hydrogen-bond functionality.
One main problem in the measurement of "effective"
hydrogen-bond acidity or basicity is that they will be very
much dependent upon steric and conformational effects. For
example, consider a drug with two hydrogen-bond basic
sites. If the drug fits into a receptor site according to
some lock and key mechanism, whereby both hydrogen-bond
basic sites can interact with hydrogen bond acid sites at
the receptor, then the "effective” hydrogen-bond basicity
of the drug can be considered to a first approximation as
the sum of the separate hydrogen-bond base functionalities
However, if for steric or conformational considerations the
alignment of the two hydrogen-bond basic sites with
corresponding acidic sites . is not possible. then one
hydrogen-bond basic site will predominate in drug receptor
interaction, depending upon the relative strengths of the
two hydrogen-bond basic sites. The "effective" hydrogen-
216
bond basic strength of the drug will then lie somewhere
between the linear combination of the hydrogen-bond
basicity of the two sites and the basicity of the weaker
hydrogen-bond site on its own.
A method of predicting "effective" hydrogen-bond parameters
for difunctional solutes using LSER's formulated from GLC
data is described in S e c 5 .1.2.P 1 2 8 ). Further measurement of
retention data of difunctional solutes could be used to
estimate "effective" a H 2 and J3H 2 values on suitable
stationary phases.
217
7.1. EXPERIMENTAL
7.1.1. DYNAMIC GAS-LIQUID CHROMATOGRAPHY EXPERIMENTAL
MEASUREMENT OF ABSOLUTE PARTITION COEFFICIENTS
Absolute partition coefficients were measured using a Pye-
Unicam 104 chromatograph with a heated katharometer
detector. The instrument (Fig-2. Pll) was modified by
replacing the original flow controllers with high precision
Negretti and Zambra M2545 flow controllers, to ensure
reproducible and steady gas flow rates, such that a
variation of 0.6atm of the downstream pressure would cause
a change in flow of less than 0.3% at constant temperature.
For measurements at ambient or near temperatures the
original air thermostat was replaced by a Grant SE-50
liquid bath thermostat, enabling the column to be
thermostat ted to within ±0.05K. The Pye 104 gas
chromatograph lends itself to such modification, because
the head can be lifted straight off and placed over the
water thermostat (this is not the case for more modern gas
chromatographs). Using a large water bath, such as the
Grant SE 50, allows thermal equilibration at 298K even when
laboratory temperatures are close to but less than 298K,
because a large surface area of water is available for
surface evaporation. However if laboratory temperatures
218
strayed very close to 298K or higher a Haake EK12 immersion
cooler was used to ensure isothermal conditions. •
Exit gas flow rates were measured with a soap-bubble meter
and were corrected both for the vapour pressure of water
and the temperature differences between the soap-bubble
meter and the gas chromatographic column . Inlet and exit
gas pressures were measured with mercury-in-glass U-tubes
and corrections for the pressure drop across the column
were also applied. Column temperatures were measured with
mercury thermometers (±0.05) wrhich had been accurately
calibrated at the National Physical Laboratory, Teddington.
A hand held digital thermometer (type Tempcon TC1100) with
a thermocouple was used to measure the temperature (±0.1K)
of the soap solution and the carrier gas in the soap-bubble
meter. The thermocouple was calibrated at the temperature
to be measured with the accurate thermometers available.
The use of the thermocouple to measure the carrier gas
temperature in the flowmeter was found to be more suitable
than a mercury thermometer, because the carrier gas
saturated with water from the soap solution condenses on
the mercury bulb and the latent heat produced results in a
false temperature observed. This effect is not observed by
the use of a thermocouple.
219
MEASUREMENT OF RELATIVE PARTITION COEFFICIENTS
Relative partition coefficients were measured using a
F'erkin-Elmer Fll gas chromatograph equipped with a flame
ionisation detector (FID). modified by the incorporation of
high precision flow controllers and by replacement of the
air thermostat with a liquid bath thermostat, as described
above for the Pye unicam 104. The gas chromatograph head
was placed over a Grant SX10 liquid thermostat, the fit
being so good that surface area of water available for
evaporation and hence cooling was effectively zero. This
resulted in a gradual rise in the temperature of the water
bath over a period of time, so it was found necessary to
incorporate a Grant CC15 immersion cooler to produce
isothermal conditions. Over a long period of time using
both a liquid thermostat and an immersion cooler to provide
isothermal conditions is much preferred to just the use of
the liquid thermostat, because effects due to laboratory
temperature variations are minimised.
CARRIER GAS
When absolute partition coefficients were measured with the
katharometer detector, helium carrier gas was used. and
when relative partition or absolute measurements were made
using a flame ionisation detector nitrogen carrier gas was
used.
2 20
To eliminate any moisture in the carrier gas stream a
silica gel adsorbent column was used to pass the _ carrier
gas through prior to entering the GC column
DATA C O L L E C T I O N
Chromatograms were observed with a Goerz Servoscribe
RE-511 chart recorder and retention measurements made using
a Spectra-Physics minigrator (model 23000-011). When
retention times were too long to be measured by the
integrator they were calculated directly from the chart
recorder.
SAMPLE SIZE AND INJECTION
For thermodynamic properties such as partition coefficients
it is desirable to make measurement s near infinite
dilution. so sample size is critical and sh ou1d be kept to
a minimum. As a general rule the majority of measurements
in non-polymeric and polymeric stationary phases involved
the injection of 0.02j.tl of the neat liquid solute and only
in exceptional cases more than O.lOjil.
For relative measurements of partition coefficients it was
found convenient to inject a mixture of the standard solute
(normally an n-aikane.) and test solute by drawing up first
the test solute into a microlitre syringe and then a sample
221
of the standard solute. This is more convenient than
preparing solutions of the standard and test solutes, which
may be insoluble in each other anyway. For solid solutes,
solutions in a suitable volatile solvent were prepared and
injected as above.
Samples were injected with a Hamilton microlitre syringe
and volatilised by heating the injector to a temperature
close to the boiling point of the solute, to ensure that as
the solute passes onto the head of the packing it is a
vapour (partition coefficients are measured for the
equilibrium of solute vapour between a solvent and the
gas ) .
PREPARATION OF PACKING
The stationary phase in the majority of cases was coated
onto the support by rotary evaporation of a slurry of
support material and stationary phase dissolved in a
suitable volatile solvent. For very high molecular weight
stationary phases e.g. polyisobutylene MW 380,000 (PIB)
this method proved unsuitable and when attempted the
polymer was thrown to the side of the round-bottemed flask
and refused to enter the porous support. This could be due
to several causes but the two most likely are that the
kinetics of the coat ing procedure are to fast for the
polymer chain to penetrate the porous support, and/or that
222
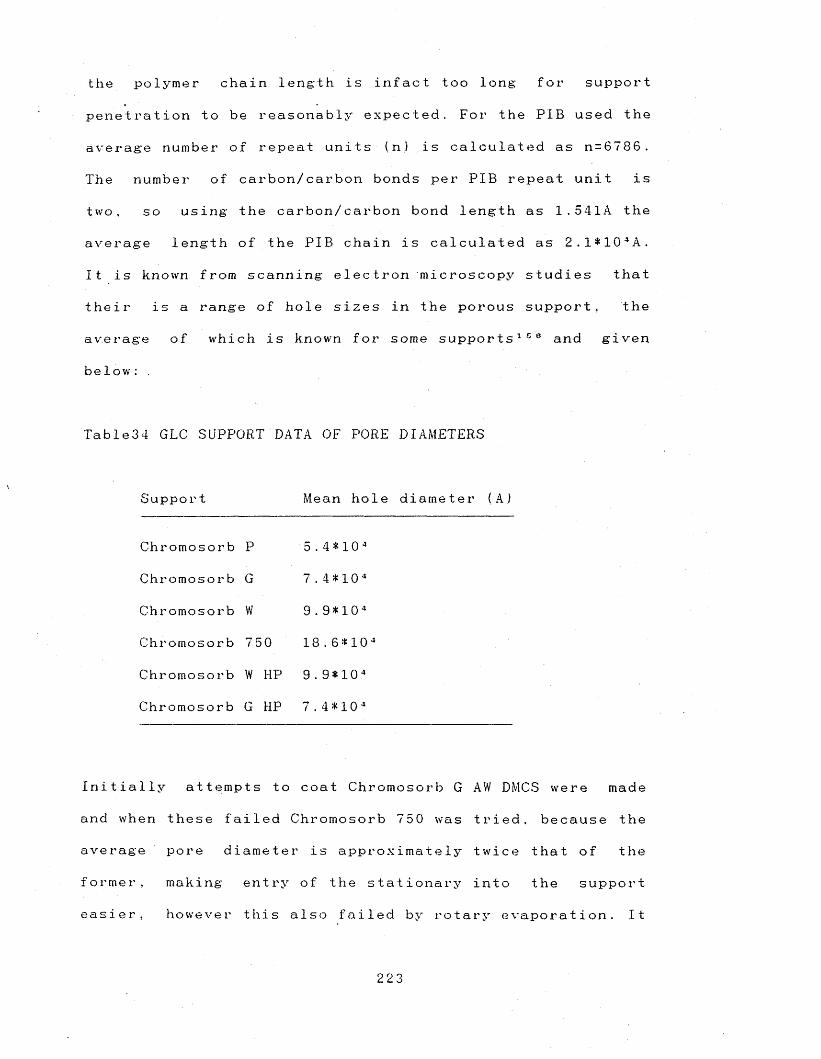
the polymer chain length is infact too 1ong for support
penetration to be reasonably expected. For the P1B used the
average number of repeat units (n ) is calculated as n=6786.
The number of carbon/carbon bonds per PIB repeat unit is
two, so using the carbon/carbon bond length as 1.541A the
average length of the PIB chain is calculated as 2.1*104A.
It is known from scanning electron microscopy studies that
their is a range of hole sizes in the porous support, the
average of which is known for some supports158 and given
below:
T a b 1e34 GLC SUPPORT DATA OF PORE DIAMETERS
Support Mean hole diameter (A.)
C-hromosorb P 5. 4 *10 4
Chromosorb G 7.4*104
Chromosorb W 9.9*104
Chromosorb 750 18.6*104
Chromosorb W HP 9.9*104
Chromosorb G HP 7.4* 104
Initially attempts to coat Chromosorb G AW DMCS were made
and when these failed Chromosorb 750 was tried, because the
average pore diameter is approximately twice that of the
former, making entry of the stationary into the support
easier, however this also failed by rotary evaporation. It
223
was concluded that the problem lay in the kinetics of the
coating, so a simpler method was adopted for high molecular
weight polymers (with average chain lengths greater or
equal to about one fifth of the mean support pore
d iameter).
This involved coating the support by mixing a slurry of
support and s tat ionary phase dissolved in a volat ile
solvent, in a clean beaker and allowing the solvent to
slowly evaporate, this method was termed the static coating
procedure although s t irr ing was necessary to ensure a
uniform coating.
STATIONARY PHASE COATING PROCEDURE BY ROTARY EVAPORATION
For accurate measurement of absolute partition coefficients
the stationary phase loading must be accurately known,
because the partition coefficient is related to the loading
by eqn7.P17, which requires a knowledge* of the volume of
the stationary liquid phase at the column operating
temperature. A method using accurate weighing procedures is
used to calculate stationary phase loading in this work.
A quantity of stationary phase is weighed accurately into a
small beaker and dissolved up in a suitable solvent. The
solution is transferred to a round-bottemed flask
containing a known weight of "inert” support material. It
224
is important for accurate measurements that the transfer of
s tat ionary phase into the flask containing the support is
quantitative, so several washings of the beaker with fresh
solvent are necessary. The slurry produced is mixed using a
rotary evaporator (vacuum off) and then a vacuum is
applied and the solvent slowly stripped off, to ensure a
uniform coating of the stationary phase, over a period of
time 1-2 h o u r s ) . If necessary heat is applied to the
slurry by placing the round-bottemed flask over a steam
bath or in a liquid thermostat. this is normally required
for less volatile solvents (e.g. toluene) and towards the
end of solvent stripping. When all the solvent has been
removed, which can be seen by repeated weighings of the
round-bottemed flask. The whole procedure is made as a bulk
preparation to produce several times more packing than is
required for column packing, to cut down the inherent
errors in weighing procedures. Also when jointing ground
glass joints PTFE tape is used. so errors from weighed
grease do not arise. The coated support is sieved to ensure
a uniform mesh size, care being taken to minimise the
amount of shaking to reduce the production of fines. The
collected packing is ready for column packing.
STATIONARY PHASE COATING BY STATIC PROCEDURE
A quantity of stationary phase is weighed accurately into a
small beaker and dissolved up in a suitable solvent. The
225
solution is transferred to another larger beaker
containing a known weight of "inert” support material. It
is important for accurate measurements that the transfer of
stationary phase into the larger beaker containing the
support is quantitative, so several washings of the beaker
with fresh solvent are necessary. The slurry produced is
mixed using a mechanical PTFE blade stirrer and the
volatile solvent allowed to evaporate. The important thing
to ensure is that the rate of evaporation is slow: it was
found that 12 hours to dryness was about sufficient. If the
rate of evaporation was quicker than this then a polymer
skin would form at the surface of the solution and reduce
the actual coating dramatically. Therefore a solvent must
be chosen that can dissolve the polymer and evaporates at a
suitable rate. If the solvent evaporates too quickly at
room temperature then the beaker containing the slurry is
partially immersed in a water bath cooled to a suitable
temperature. If the solvent evaporates too slowly then the
beaker containing the slurry can be put in a fume cupboard
with the f ume extract o n , or par t ially immersed in a wat e r
bath at a temperature elevated above ambient, to facilitate
evaporation.
The stationary phase coating by this procedure is not 100%
and it is necessary for absolute measurements, to apply a
back calculation procedure to determine the loading
accurately. This involves filtering the prepared packing to
2 26
the desired mesh size and weighing; this accurately. The
discarded packing is all carefully collected and placed
back in the dirty beaker used to perform the coating in.
The stationary phase in the discarded packing and on the
sides of the dirty beaker is then extracted into fresh
solvent by boiling, and is decanted into a clean weighed
beaker. The solvent extraction is repeated until all the
stationary phase has been removed successfully into the
clean beaker. This solution of polymer in solvent is’ now
heated to dryness on an isomantle and when dry, weighed. It
is now possible from all the weighed measurements to back
calculate the actual amount of stationary phase that has
been deposited on the support in the packing that was
sieved to use in the GC column. Experience showed that to
achieve a 10% loading it was necessary to use quantities of
polymer that could theoretically produce a loading of about
2 0%.
CALCULATION OF LOADING
In GLC the liquid loading (o) can be defined in two
different ways. Usually it is calculated using e q n 9 0 . as in
this work.
mass of stationary liquid phase0 = ------------------------------------------------------ (90)
mass of (support + stationary liquid phase)
But sometimes the loading is calculated as:
mass of stationary liquid phase0 *= --------------------- (91)
mass of support
COLUMNS AND COLUMN PACKING
COLUMN LENGTH
For the majority of the stationary phases studied, both
long (3m) and short (0.6m) glass columns were made so that
a broad range of solutes could be studied. Solutes strongly
retained were run on the short column and solutes weakly
retained on the long column. This saves time and eliminates
the need to inject large volumes of solute onto the column,
which could lead to deleterious effects. For example if a
sample was chromatographed on the long column which was
s t rongly retained then inorde r to be able to detect the
solute as it eluted through the detector a very large
(>0.2jil) sample would be required, as the concentration
falls off with column length according to e q n 8 . So although
the concentration of solute observed at the detector may be
at the desired infinite dilution the concentration at the
injector end of the column will not be at infinite
dilution. The choice of which column to use for each solute
is very much a question of the experience of the operator
but a good guide is to ensure that the ratio of the
adjusted retention time ( t ’R) to the unretained gas time
228
(tm) is greater than about ten times, i . e . ,
criterion for suitable retention measurement on any column. tm
t ’ R> 10
For solutes suitable for measurement on both the short and
long column some were run on both columns to ensure that
the calculated partition coefficients were comparable on
both c o l u m n s .
PACKING PROCEDURE
The glass columns were cleaned with soap solution and
rinsed with water and with acetone or ether and dried ready
for packing. The clean empty columns are filled by
attaching the detector end of the column to a vacuum pump
and the injector end to a resevoir of packing material and
a cylinder of nitrogen with a pressure of ca. 10-20psi
(,Fig23 ) . So that at one end the packing is being pulled
through and at the other pushed along the column, packing
down towards the detector end of the column.
PACKING CONDITIONING
Before physicochemical measurements were made the packings
were conditioned by passing carrier gas through the column
at a temperature 10-20K above the operating temperature
229
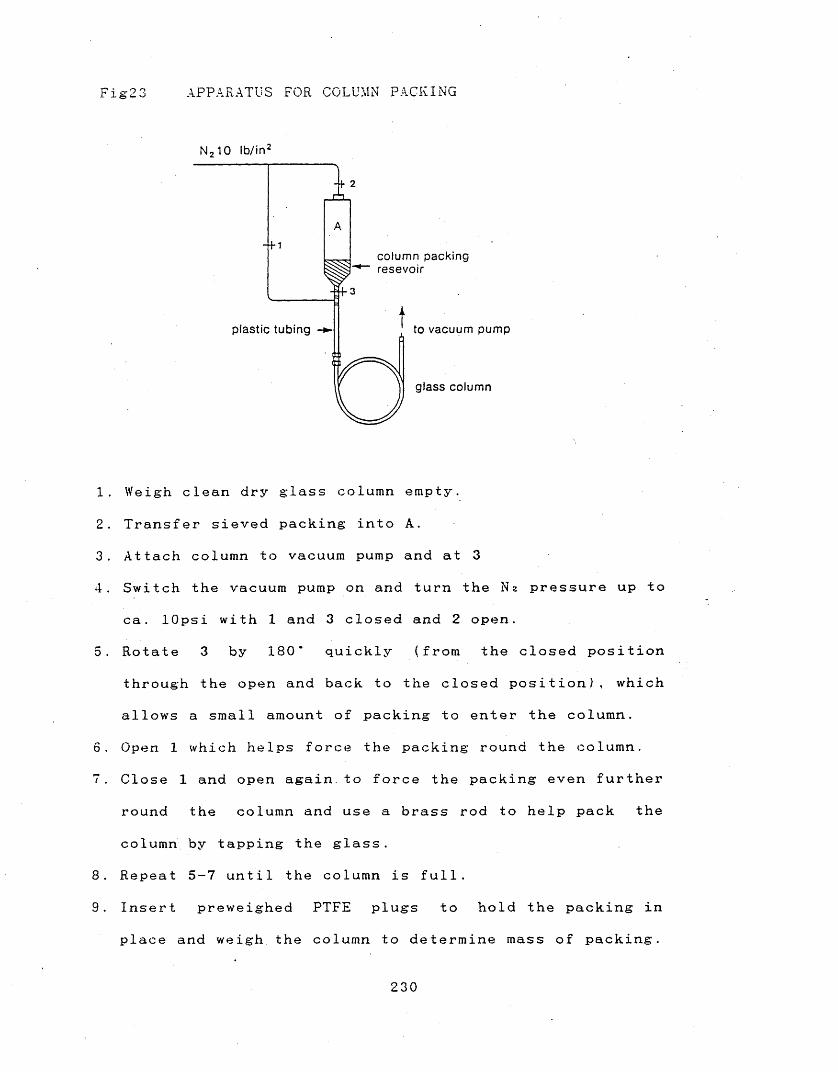
F ig23 APPARATUS FOR COLUMN PACKING
N 210 lb/in2
column packing P H H - resevoir
¥i-3
plastic tubing to vacuum pump
glass column
1. Weigh clean dry glass column empty.
2. Transfer sieved packing into A.
3. Attach column to vacuum pump and at 3
4. Switch the vacuum pump on and turn the Nz pressure up to
ca. lOpsi with 1 and 3 closed and 2 open.
5. Rotate 3 by 180* quickly (from the closed position
through the open and back to the closed position), which
allows a small amount of packing to enter the column.
6. Open 1 which helps force the packing round the column.
7. Close 1 and open again.to force the packing even further
round the column and use a brass rod to help pack the
column by tapping the g l a s s .
8. Repeat 5-7 until the column is full.
9. Insert preweighed PTFE plugs to hold the packing in
place and weigh the column to determine mass of packing.
230
overnight. This allows the liquid phase molecules to settle
to a stationary position. and also removes any
residual trace of volatile solvent used to coat the
stationary phase on the support. The columns were reweighed
after conditioning to check any loss in weight.
EXPERIMENTAL ERRORS IN THE EXPERIMENTAL DETERMINATION OF
PARTITION COEFFICIENTS BY G L C 10 - 157 ■ 168 .
The main general possible sources of error can be
summarised as follows:
1. Errors in determination of retention time or
volume (measurement errors, ' influence of sample size,
flow rate, operator e r r o r ) . In this work the use of
interfaced computing integrators, sensitive accurate flow
controllers, and the use of small sample size injections
has minimised the influence of such errors.
2. Insufficient coating or inhomogenous coating, with
active support interaction. In general the maximum
recommended loadings were used in this work and careful
coating procedures followed to minimise such problems.
3. Fluctuation of instrumental conditions (oven temperature
gas flow r a t e ) . High oven temperature control was achieved
in this work with the incorporation of liquid thermostats.
231
and gas flow rates were controlled with accurate and
sensitive flow controllers.\
4. Calculation of the amount of stationary phase coated
onto the support material. In this work the loading was
calculated accurately by simple weighing procedures.
STATIONARY PHASES STUDIED
Measurements were made on seven polymeric phases, detailed
in Tables35-37 and the results as LogK values are given in
Tables38-39. Two non-polymeric phases, olive oil and n-
hexadecane were also studied and experimental details and
results for these two phases are given in Appendix2.
232
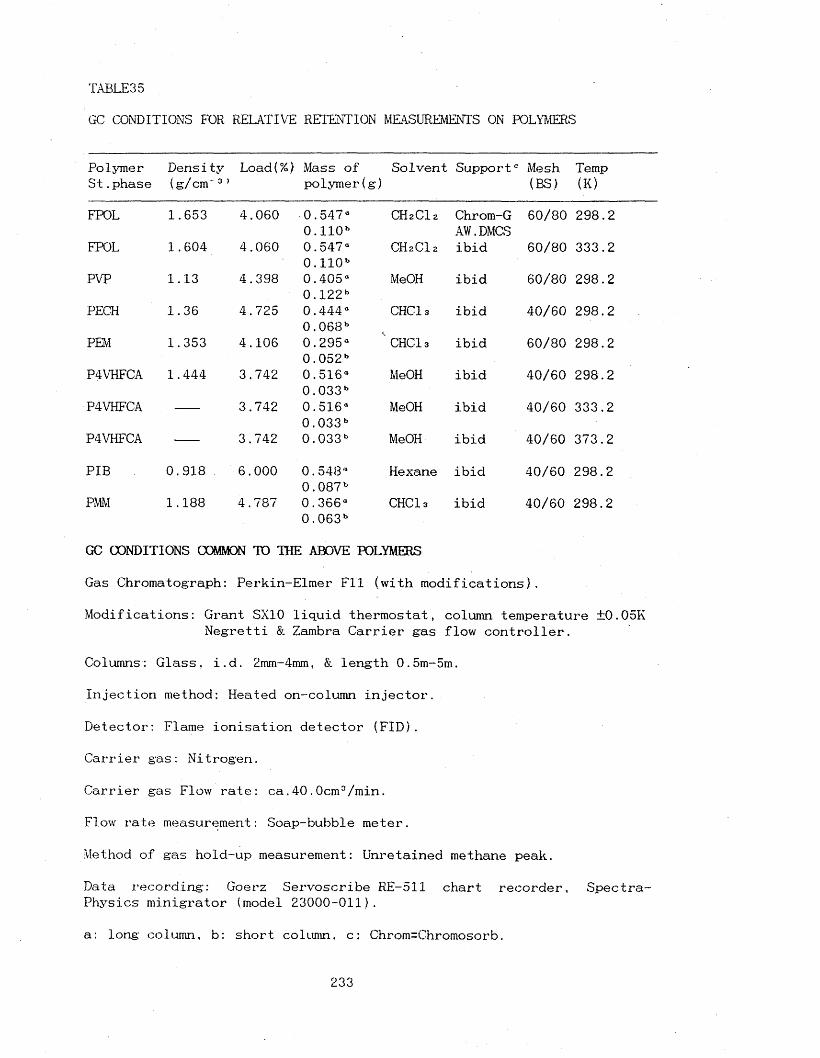
TABLE35
GC CONDITIONS FOR RELATIVE RETENTION MEASUREMENTS ON POLYMERS
Polymer St.phase
Density (g/cm'3’
Load(%) Mass of polymer(g)
Solvent Support0 Mesh(BS.)
Temp(K)
FPOL 1.653 4.060 0.547*0 .1 1 0b
CH2C12 Chrom-G AW.DMCS
60/80 298.2
FPOL 1.604 4.060 0.547° 0 .1 1 0b
ch2ci2 ibid 60/80 333.2
PVP 1.13 4.398 0.405° 0 .1 2 2 b
MeOH ibid 60/80 298.2
PECH 1.36 4.725 0.444° 0.068b
CHCls ibid 40/60 298.2
PEM 1.353 4.106 0.295° 0.052b
CHC13 ibid 60/80 298.2
P4VHFCA 1.444 3.742 0.516“ 0.033b
MeOH ibid 40/60 298.2
P4VHFCA 3.742 0.516° 0.033b
MeOH ibid 40/60 333.2
P4VHFCA 3.742 0.033b MeOH ibid 40/60 373.2
PIB 0.918 . 6.000 0.548° 0.087b
Hexane ibid 40/60 298.2
PMM 1.188 4.787 0.366“ 0.063b
CHCls ibid 40/60 298.2
GC CONDITIONS COMMON TO THE ABOVE POLYMERS
Gas Chromatograph: Perkin-Elmer Fll (with modifications).
Modifications: Grant SX10 liquid thermostat, column temperature ±0.05K Negretti & Zambra Carrier gas flow controller.
Columns: Glass, i.d. 2mm-4mm, & length 0.5m-5m.
Injection method: Heated on-column injector.
Detector: Flame ionisation detector (FID).
Carrier gas: Nitrogen.
Carrier gas Flow rate: ca.40.OcmVmin.
Flow rate measurement: Soap-bubble meter.
Method of gas hold-up measurement: Unretained methane peak.
Data recording: Goerz Servoscribe RE-511 chart recorder, Spectra- Physics minigrator (model 23000-011).
a: long column, b: short column, c: Chrom=Chromosorb.
233
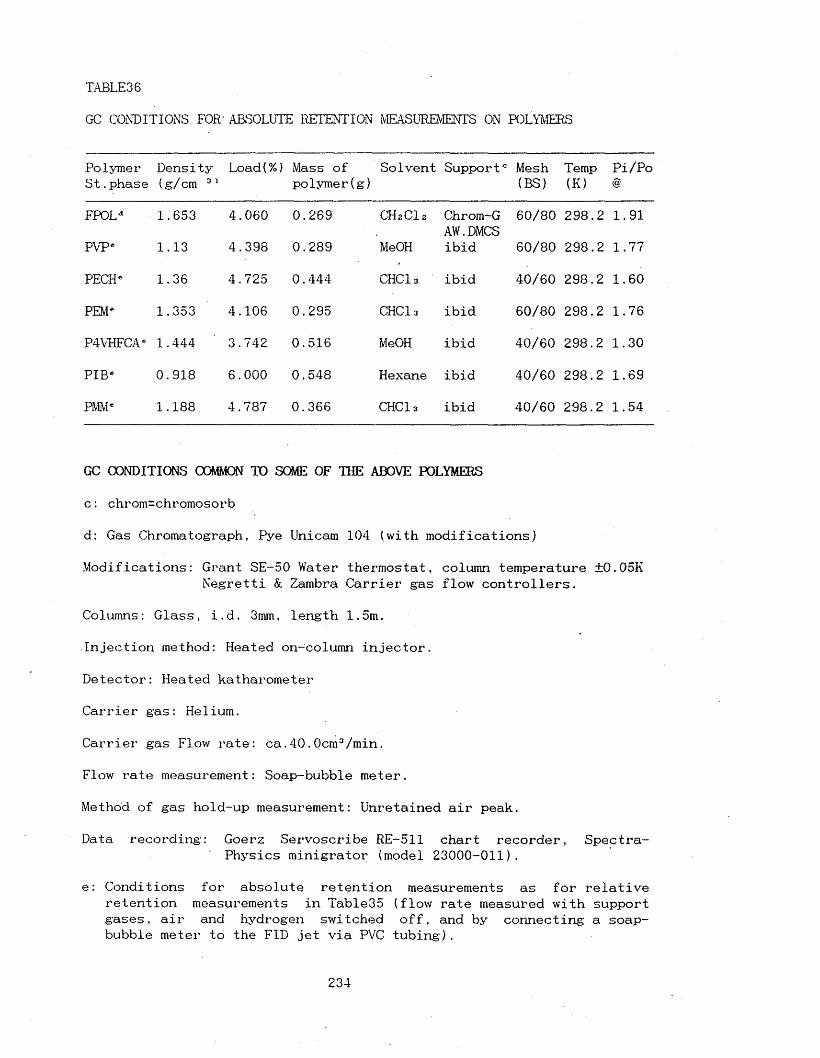
TABLE36
GC CONDITIONS BOR' ABSOLUTE RETENTION MEASUREMENTS ON POLYMERS
Polymer St.phase
Dens i ty (g/cm 01
Load(%) Mass of polymer(g)
Solvent Support'3 Mesh(BS)
Temp(K)
Pi/Po@
FP0Ld 1.653 4.060 0.269 GHzCl 2 Chrom-GAW.DMCS
60/80 298.2 1.91
FVPe 1.13 4.398 0.289 MeOH ibid 60/80 298.2 1.77
PECH* 1.36 4.725 0.444 CHC13 ibid 40/60 298.2 1.60
PEM* 1.353 4.106 0.295 CHCls ibid 60/80 298.2 1.76
P4VHFCA* 1.444 3.742 0.516 MeOH ibid 40/60 298.2 1.30
PIBe 0.918 6.000 0.548 Hexane ibid 40/60 298.2 1.69
PMM* 1.188 4.787 0.366 CHCls ibid 40/60 298.2 1.54
GC CONDITIONS COMMON TO SOME OF THE ABOVE POLYMERS
c : chrom=chromosorb
d: Gas Chromatograph, BVe Unicam 104 (with modifications)
Modifications: Grant SE-50 Water thermostat, column temperature ±0.05K Negretti & Zambra Carrier gas flow controllers.
Columns: Glass, i.d. 3mm, length 1.5m.
Injection method: Heated on-column injector.
Detector: Heated katharometer
Carrier gas: Helium.
Carrier gas Flow rate: ca.40.0cm3/min.
Flow rate measurement: Soap-bubble meter.
Method of gas hold-up measurement: Unretained air peak.
Data recording: Goerz Servoscribe RE-511 chart recorder, Spectra-Physics minigrator (model 23000-011).
e: Conditions for absolute retention measurements as for relative retention measurements in Table35 (flow rate measured with support gases, air and hydrogen switched off, and by connecting a soap- bubble meter to the FID jet via PVC tubing).
234
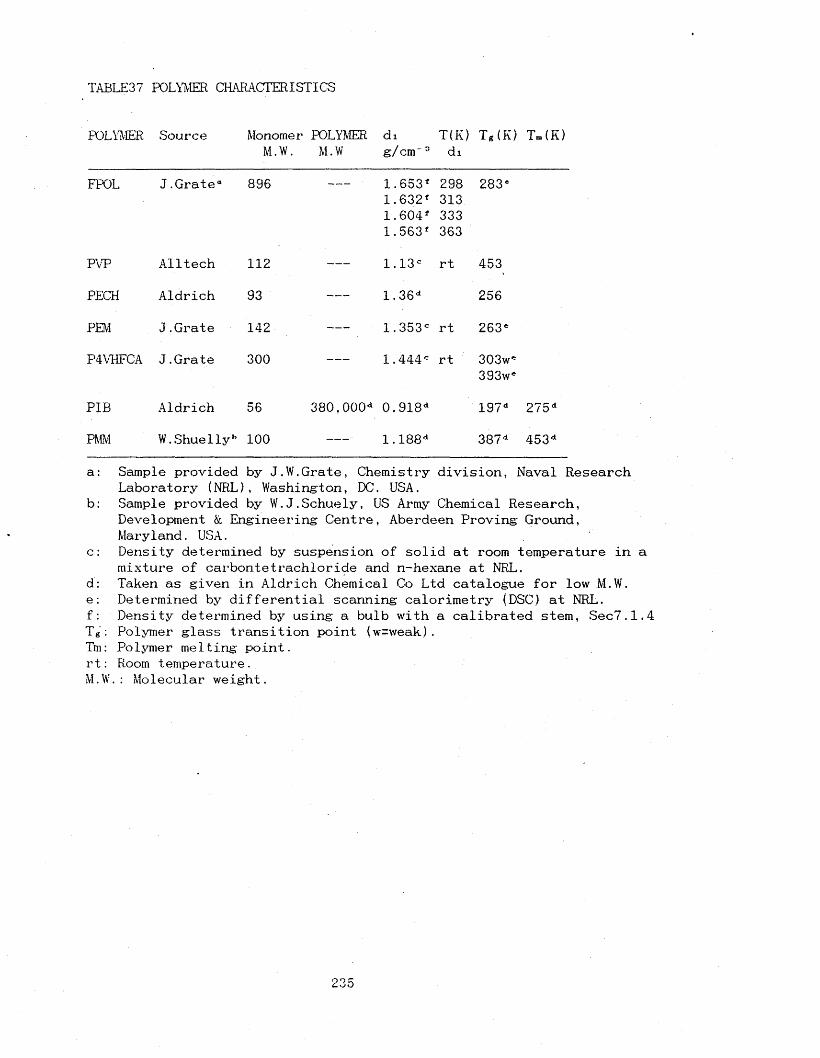
TABLE37 POLYMER CHARACTERISTICS
POLYMER Source Monomer POLYMER M.W. M.W
dig/cm'0
T(K)di
T g(K ) Tm(K)
FPOL J.Grate0 896 1.653*1.632*1.604*1.563*
298313333363
283*
PVP Alltech 112 1.13° rt 453
PECH Aldrich 93 1.36d 256
PEM J.Grate 142 1.353° rt 263*
P4VHFCA J.Grate 300 1.444° rt 303w*393w*
PIB Aldrich 56 380,000d 0.918d 197d 275d
PMM W.Shuellyb 100 1.188d 387 d 453d
a: Sample provided by J.W.Grate, Chemistry division, Naval ResearchLaboratory (NRL), Washington, DC. USA.
b: Sample provided by W.J.Schuely, US Army Chemical Research,Development & Engineering Centre, Aberdeen Proving Ground,Maryland. USA.
c: Density determined by suspension of solid at room temperature in amixture of carbontetrachloride and n-hexane at NRL.
d: Taken as given in Aldrich Chemical Co Ltd catalogue for low M.W.e: Determined by differential scanning calorimetry (DSC) at NRL.f: Density determined by using a bulb with a calibrated stem, Sec7.1.4T g: Polymer glass transition point (w=weak).Tm: Polymer melting point, rt: Room temperature.M.W7.: Molecular weight.
235
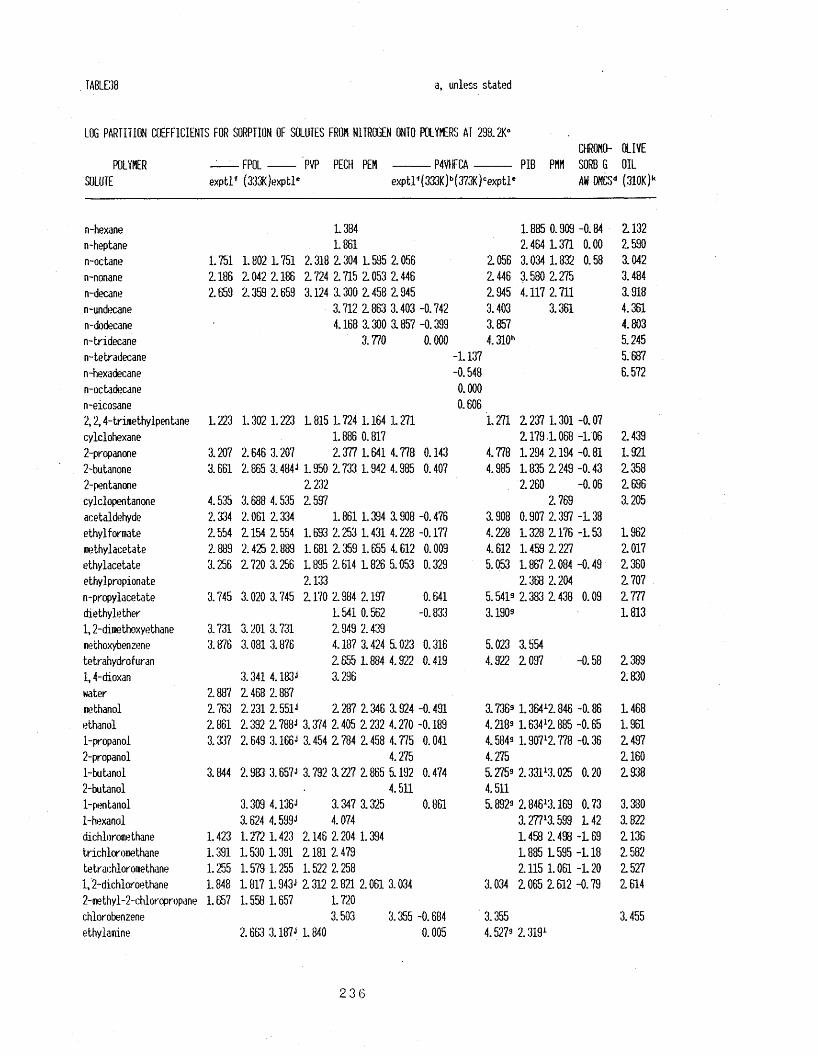
TABLE38 a, unless stated
LOG PARTITION COEFFICIENTS FOR SORPTION OF SOLUTES FROR NITROGEN ONTO POLYMERS AT 298.2K°CHRONO- OLIVE
POLYMER — FPOL- - - PVP PECH PEM - - - - P4VHFCA- - - - - PIB PMM SORB G OILSOLUTE exptl* (333K)exptle exptlf(333K)b(373K)cexptl' AW DMCSd (310K)k
n-hexane L384 1.885 0.909 -0.84 Z132n-heptane L861 2.464 1 371 0.00 Z590n-octane 1.751 1.802 1.751 2.318 Z 304 1.595 Z056 Z056 3.034 1.832 0.58 3.042n-nonane Z186 Z042 2.186 Z724 Z 715 Z 053 2.446 Z446 3.580 Z275 3.484n-decane 2.659 2.359 2.659 3.124 3.300 2.458 Z945 Z945 4.117 2.711 1918n-undecane 3.712 2.863 3.403 -0.742 3.403 3.361 4.361n-dodecane 4.168 3.300 1857 -0.399 3.857 4.803n-tridecane 3.770 0.000 4.31Gh 5.245n-tetradecane -1.137 5.687n-hexadecane -0.548 6.572n-octadecane 0.000n-eicosane 0.6062,2,4-tnsethylpentane 1.223 1.302 1.223 1.815 1.724 1.164 L271 1.271 Z237 1.301 -0.07cylclohexane 1.886 0.817 2.179.L 068 -1.06 2.4392-propanone 3.207 2.646 3.207 2.377 1.641 4.778 0.143 4.778 1.294 2.194 -0.81 1.9212-butanone 3.661 2.865 3.484J 1.950 2.733 1.942 4.985 0.407 4.985 1.835 Z249 -0.43 Z3582-pentanone 2.232 2.260 -0.06 Z696cylclopentanone 4.535 3.688 4.535 2.597 2.769 3.205aeetaldehyde 2.334 2.061 2.334 1.861 1.394 1908 -0.476 3.908 0.907 2.397 -L38ethylformate 2.554 Z154 2.554 1.693 2.253 1.431 4.228 -0.177 4.228 1.328 Z176 -1.53 1.962methylacetate 2.889 2.425 2.889 1.681 2.359 1.655 4.612 0.009 4.612 1.459 2.227 Z017ethylacetate 3.256 2.720 3.256 L895 2.614 1.826 5.053 0.329 5.053 1.867 2.084 -0.49 Z360ethylpropionate 2.133 2.368 2.204 Z707n-propylacetate 3.745 3.020 3.745 Z170 2.984 2.197 0.641 5.5413 2.383 Z 438 0.09 Z777diethylether 1.541 0.562 -0.833 3.190s 1.8131,2-diraethoxyethane 3.731 3.201 3.731 2.949 2.439methoxybenzene 3.876 3.081 3.876 4.187 3.424 1023 0.316 5.023 3.554tetrahydrofuran 2.655 1.884 4.922 0.419 4.922 Z097 -0.58 Z3891,4-dioxan 3.341 4.183J 1296 2.830water 2.887 Z468 2.887methanol 2.763 2.231 2.551J 2.287 2.346 1 924 -0.491 3.7369 l. 36412.846 -0.86 1468ethanol 2.861 2.392 2.788* 3.374 2.405 Z 232 4.270 -0.189 4.2189 1.634 *Z 885 -0.65 1.9611-propanol 3.337 2.649 3.166J 3.454 Z 784 2.458 4.775 0.041 4.5849 l. 90712.778 -0.36 Z4972-propanol 4.275 4.275 Z1601-butanol 3.844 2.983 3.657J 3.792 1Z27 2.865 5.192 0.474 5.2759 2.33113.025 0.20 Z9382-butanol 4.511 4.5111-pentanol 3.309 4.136* 3.347 3.125 0.861 5.8929 2.84613.169 0.73 3.3801-hexanol 3.624 4.599J 4.074 3.27713.599 L42 3.822dichloromethane 1.423 1.272 1.423 2.146 2.204 1.394 1458 2.498 -L69 2.136trichloromethane 1.391 1.530 1.391 Z181 2.479 1.885 1_ 595 -1.18 2.582tetrachloroiiethane 1.255 1.579 1.255 1.522 2.258 2.115 1.061 -120 Z5271,2-dichloroethane 1.848 1.817 1.943* Z 312 2.821 2.061 3.034 3.034 2.065 2.612 -0.79 2.6142-methyl-2-chloropropane 1.657 1.558 1.657 1.720chlorobenzene 3.503 3.355 -0.684 3.355 3.455ethylamine 2.66:3 3.187J 1.840 0.005 4.5279 2.3191
O O /**£6 b
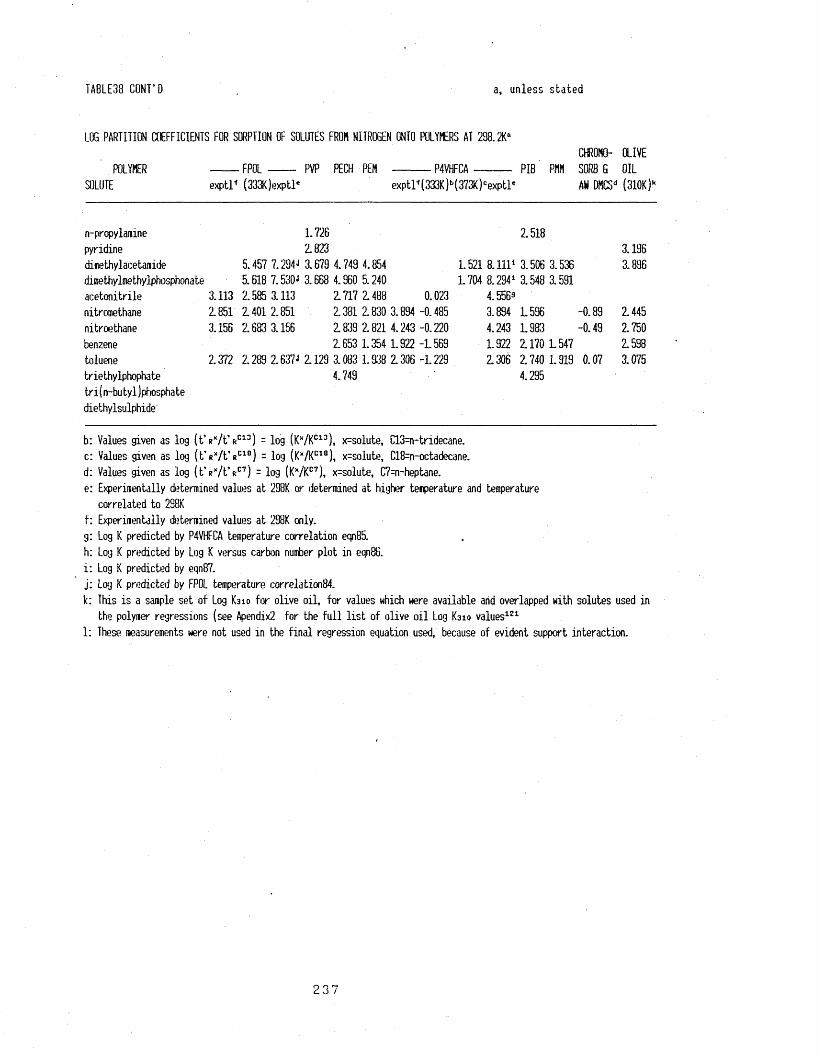
IABLE38 CONT’D a, unless stated
LOG PARTITION COEFFICIENTS FOR SORPTION OF SOLUTES FROM NITROGEN ONTO POLYMERS AT 298.2K°CHROHO- OLIVE
POLYMER FPOL- PVP PECH PEM - - - - P4VHFCA- - - - - PIB PMM SORB G OILSOLUTE exptl* (333K)exptle exptr(333K)b(373K)cexptle AN OMCSd (310K)k
n-propylaraine 1.726 2.518pyridine Z823 3.196dinethylacetaraide 5.457 7.294J 3.679 4.749 4.854 1.521 8. Ill1 3.506 3.536 3.896dimethylmethylphosphonate 5.618 7.530J 3.668 4.960 5.240 1704 8.2941 3.548 3.591acetonitrile 3.113 2.585 3.113 Z717 2.488 0.023 4.5569nitromethane Z851 Z401 2.851 2.381 2.830 3.894 -0.485 3.894 1.596 -0.89 Z445nitroethane 3.156 2.683 3.156 Z839 2.821 4.243 -0.220 4.243 1.983 -0.49 2.750benzene 2.653 1.354 1.922 -1.569 1.922 2.170 L547 Z598toluene 2.372 2.289 2.637J 2.129 3.083 1.938 Z306 -1.229 2.306 2.740 1.919 0.07 3.075triethylphophate 4.749 4.295tri(n-bu tyl)phosphatediethylsulphideb: Values given as log ( tV /t ’ rC13) = log (KX/KC13), x=solute, C13=n-tndecane. c: Values given as log ( t Y W rc1°) = log (KX/KC18), x=solute, C18=n-octadecane. d: Values given as log ( t Y / t V 7) = log (KX/KC7), x-solute, C7=n-heptane. e: Experimentally determined values at 298K or determined at higher temperature and temperature
correlated to 298K f: Experimentally determined values at 2$K only, g: Log K predicted by P4VHFCA temperature correlation eqn85. h: Log K predicted by Log K versus carbon number plot in eqnfE i: Log K predicted by eqn87. j: Log K predicted by FPOL temperature correlation84.k: This is a sample set of Log K310 for olive oil, for values which were available and overlapped with solutes used in
the polymer regressions (see Apendix2 for the full list of olive oil Log K310 values121 1: These measurements were not used in the final regression equation used, because of evident support interaction.
237
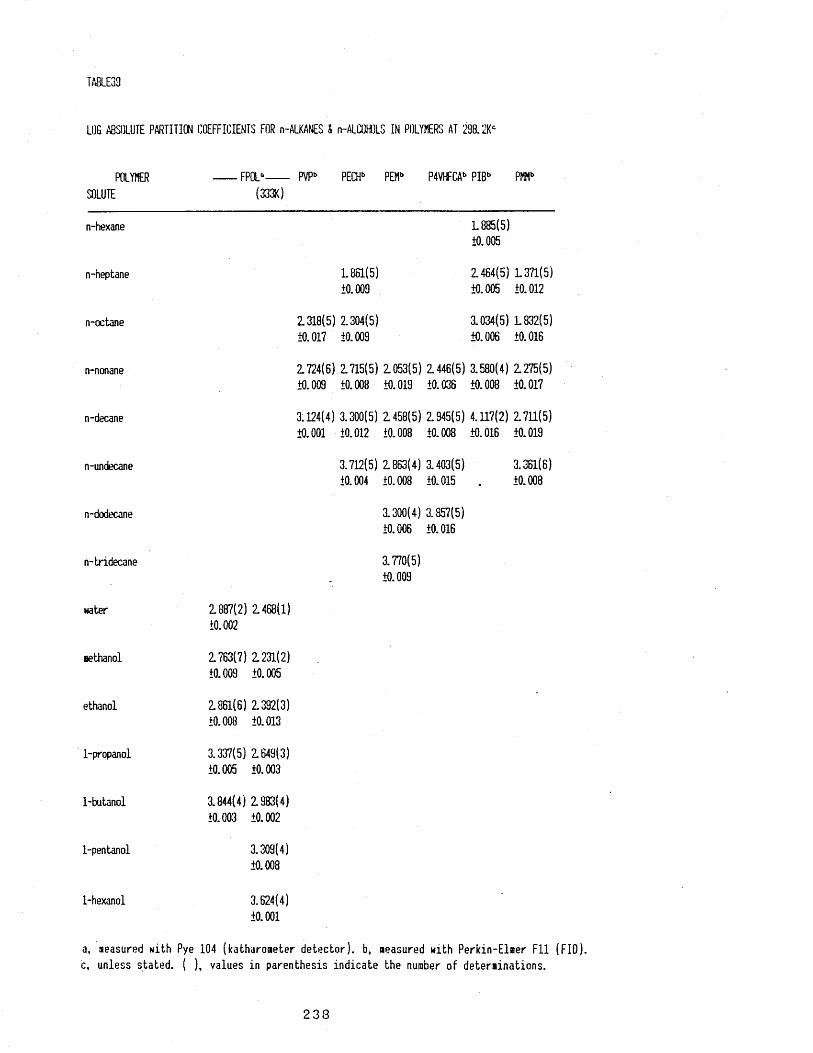
TABLE33
LOG ABSOLUTE PARTITION COEFFICIENTS FOR n-ALKANES S n-ALCOHOLS IN POLYMERS AT 298.2KC
POLYMERSOLUTE
FPOL0 PVPb PECHb PEMb P4VHFCAb PIBb PMMb(333K)
n-hexane 1.885(5)+0.005
n-heptane
n-octane
n-nonane
n-decane
n-undecane
L 851(5)+0.009
Z 318(5) Z 304(5)+0.017 +0.009Z 724(6) Z 715(5) Z 053(5) Z 446(5) +0.009 +0.008 +0.019 +0.0363.124(4) 3.300(5) Z 458(5) 2.945(5) +0.001 +0.012 +0.008 +0.008
3.712(5) Z 863(4) 3.403(5) +0.004 +0.008 +0.015
Z 464(5) 1371(5) +0.005 +0.0123.034(5) 1832(5) +0.006 +0.0163.580(4) Z 275(5) +0.008 +0.0174.117(2) 2.711(5) +0.016 +0.019
3.361(6) +0.008
n-dodecane 1300(4 ) 3.857(5) +0.006 +0.016
n-tridecane 3.770(5)+0.009
water Z 887(2) Z 468(1) +0.002
Hethanol Z 763(7) Z 231(2) +0.009 +0.005
ethanol Z 861(6) Z 392(3) +0.008 +0.013
1-propanol 3.337(5) Z 649(3) +0.005 +0.003
1-butanol
1-pentanol
3.844(4) Z 983(4) +0.003 +0.002
3.309(4)+0.008
1-hexanol 3.624(4)+0.001
a, measured with Pye 104 (katharometer detector), b, measured with Perkin-Eluer Fll (FID), c, unless stated. ( ), values in parenthesis indicate the number of determinations.
238
7.1.2. ADSORPTION EXPERIMENTAL
In order to obtain the required isotherms at low surface
coverage for a variety of solutes (adsorbates) on each of
the eight solid adsorbents in Tablel4, the technique of
gas-solid chromatography (G S C ) was used. The experimental
set up and procedure for flow measurement is essentially
the same as was used for the measurement of absolute
partition coefficients described in S e c ? .1.1.P218 &
T a b l e 3 6 .P 2 3 4 , with a few additional changes outlined below.
The results as values of - LogKH c , - L o g K ”P , and LogVa for
the adsorbents are given in Tables40-44.
The instrument (Fig24), incorporates a few additional
features (cf. Fig2.Pll), notably the gas washing bottles
with saturated salt solution to saturate the carrier gas to
the required level of relative humidity when adsorption
work was being carried out at levels- greater than zero
relative humidity. The soap-bubble meter was modified to
incorporate a water jacket, with water circulating from the
liquid bath around the soap-bubble meter and back into the
liquid bath. This arrangement ensures a uniform temperature
along the full length of the soap-bubble meter, without
which, temperature differences of up to IK have been noted.
For dry adsorption experiments a stream of helium, predried
by passage through a silica gel column, was passed over a
239
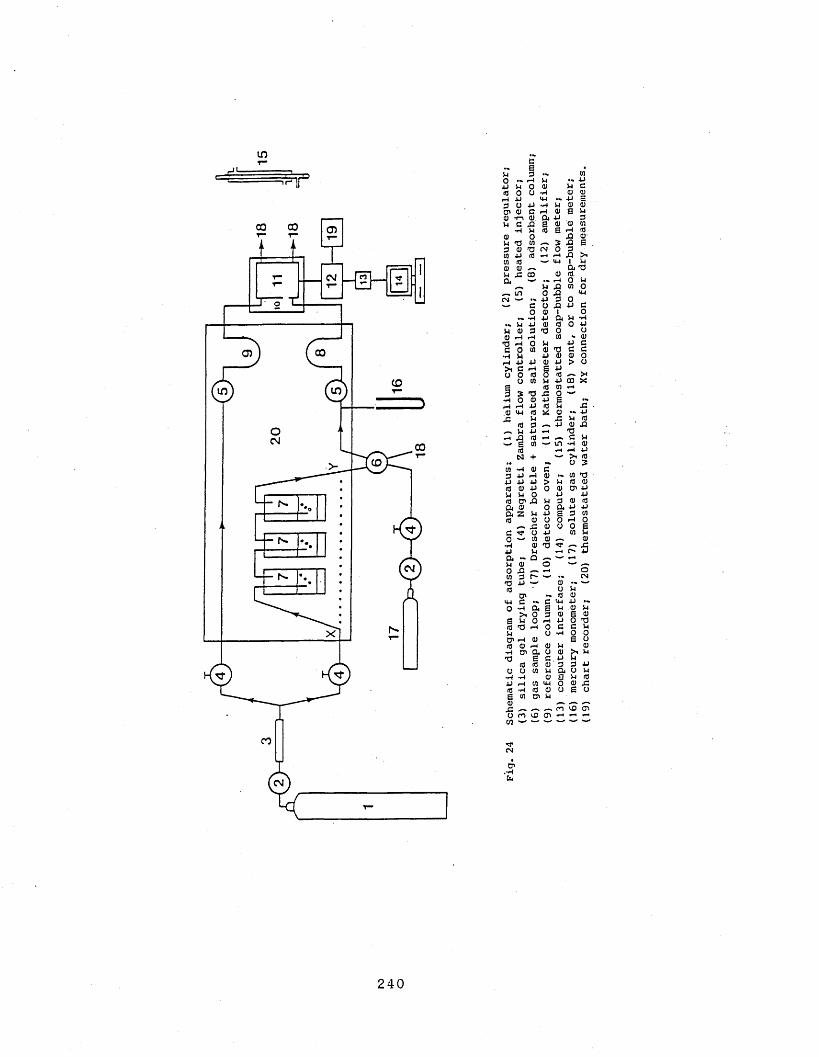
in cEp 3 •»o r-4 Pp P o 33 0 o Pp tp3 o p PO'3 c ip3 T-l 3.04P a XI sp P 33 OP •a 33 3 00 CN3 P 3 P3 3 --3 3P XX CO04 — •»P_ in 0OJ • ■»p<—* C o
0 3p Pp p 3P 3 3 03
>. pp c3 3 P E 3 0)a) E
_ 3 P X! <P I
>i. P Ou *0 (U 3. r—I O V4in o X3 <p 3 O XX P IQt P<3 O
O P P >i Cu
o <w* 3 ^ p-•§
o u3 3 -u4j a>p s fl o 3 P(0T3 JS0) JJ P 10 <0 Ui P3 —»P3 3 —
oi - P •0 C o 3
ay o04 z10c ?0pp04 ~p <u0 xx01 3
P P<0 ■—- >-« 4J CO X 01 P 0S £3 •* P£ H « P 3 XI•o^ G Pin p aiP r*“4 4J '—• >n 40
O 3
X) u OP P01 Oxx ai0 p01 0) 01 T3 Pa -» o
- c04 E O 3 O p 0
.. oi 03 p 3 3 0) O' P P P3 01 nl04 P P E 3 01 O P O O O £01 P 01
O P(0 01
O3 O_ C. 3 3 01 P 301 >P 3 3 O' P
P C O P>i6 h3 'O PO' P 3 3 P O'03 3Cl CJ P P P r-4 3 P e 3£ n vO flio m io O' p p p
P O O E O P 3 3 >1 P p p3 3 P04 O PE P AO 3 XXO E O
240
plug (2-25cm) of solid adsorbent packed in glass columns
(id 2-3mm). Preliminary experiments were carried out to
determine the length of plug of adsorbent suitable to
produce reasonable elution times (up to 36hours) at normal
GSC flow rates (25-70cm°/min). Measurements at different
flow rates were carried out to determine the optimum flow
rate and in general a flow rate of ~ 40-5 0cm3/ m i n , proved
very suitable.
A solute sample was injected into the carrier, either as a
gas, using a gas sample loop, or as a known quantity of
liquid, using a suitable microlitre syringe. Liquid sample
sizes varied between O . I jjI and 10j.il, depending on the
solute to be injected. Before interacting with the solid
adsorbent the liquid samp1es were volati1ised using a
heated injector to reduce any effect of injection profile
to a minimum. In all cases it was endeavoured to inject an
amount that corresponded to a maximum elution partial
pressure of between 1*10 4 and 5*10 4 Atm. When the
adsorption isotherms are plotted, the maximum solute
partial pressure is observed, and if it is outside the
limits set a repeat run is carried out to achieve this.
Suitable exit concentration limits were found by examining
the effect of sample size on the adsorption parameters
derived from the peak profile (see Tablel4.P163) , namely the
specific retention volume (Vo) and the Henry's constants
(K“ ) . If solute loadings less than that required to produce
241
an eluate partial pressure of 1*10 4 Atm are used, values
of K H become less reliable, due to the inherent larger
measurement errors involved. Retention volumes are
dependent on the solute concentration for curved adsorption
isotherms, so in order to give them more meaning when
compared with other retention volumes, a high limit of
eluate partial pressure of 5*10 4 Atm was used. The K H
values refer to the solute sample at infinite dilution and
should therefore be independent of sample concentration, so
for K H it does not matter if the eluate concentration is
higher than 5*10'4 Atm.
DATA HANDLING
Data was collected using an on-line Sinclair ZX Spectruml28
and the katharometer signal displayed in the normal
chromatographic fashion (signal response vs. time). The
software was all written by Dr G J Buist to display the
chromatogram and carry out all the necessary calculations,
and from the peak shape determine the adsorption isotherms
and ultimately the Henry's constants and the specific
retention volume of the solute for adsorption from helium
carrier gas to the adsorbent. The time taken to analyse an
adsorption peak and print out the relevant isotherms is
about 5-10 minutes depending upon the length of the
chromatogram. When the program was first written peak
analysis was carried out by. hand to confirm that the
242

compu ted results were in agr ee ment (note that by hand each
peak analysis takes several hours).
The Z X S p e c t r u m 128 was i n t e rfa ce d using a Beta Plus disk
interface to a 5 . 2 5 ” slimli ne M itsubi sh i disk drive
( 8 0 T D / S ) , both the Beta plus disk interface and the disk
drive were sup pl ied by T e c h n o l o g y R e s e a r c h Ltd. The Pye 104
am pli fier was int erf ac ed via another inter face (designed
and c o n s t r u c t e d by Dr G J Buist) to the Bet a Plus
interface. All data was stored on 5.25" floppy discs. A
listing of the main program, " G C A D ” , (gas c h r o m a t o g r a p h y
adsorption) in Basic is given in appendixl, this covers all
the main c al culatio ns but does not include the p r o g r a m m i n g
for, the c o r r ec ti on of diffusion, taking readings, the
baseline correction, and the smoothing program, w h i c h were
all written in mach ine code, details of whi ch are held by
Dr G J Buist, C h e m i s t r y Dept, U n i v e r s i t y of Surrey.
2 43
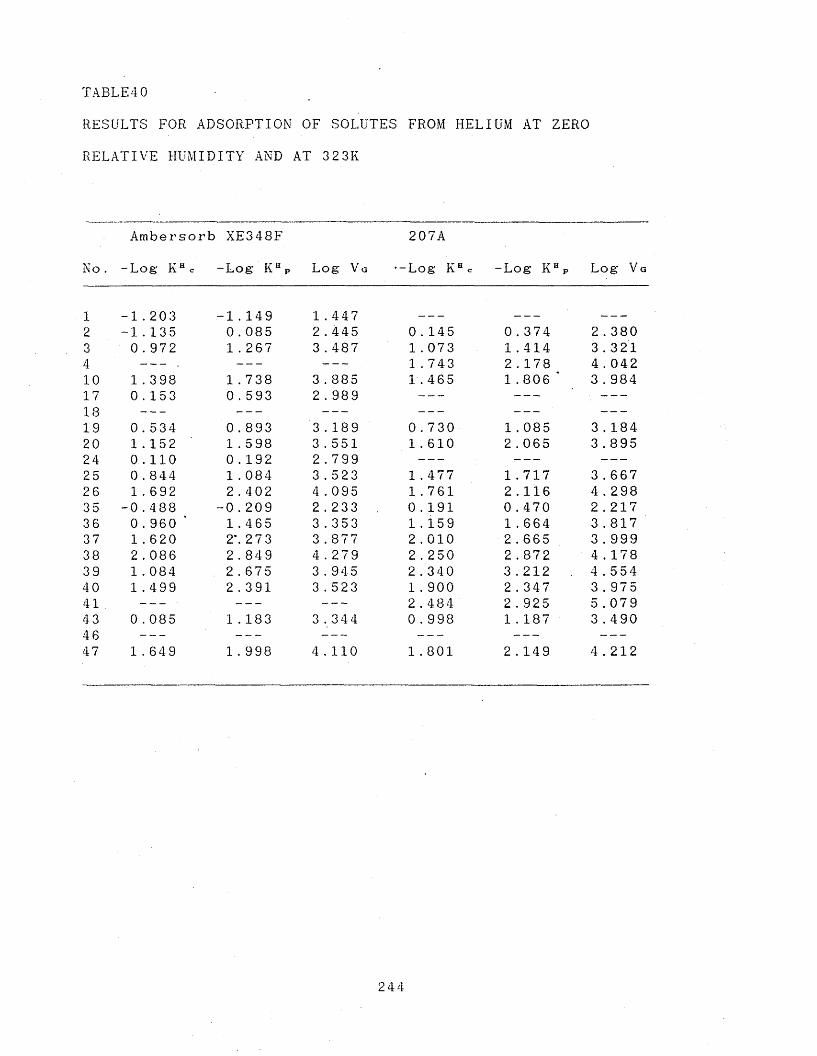
TABLE4 0
RESULTS FOR ADSORPTION OF SOLUTES FROM HELIUM AT ZERO
RELATIVE HUMIDITY AND AT 3 2 3K
No .
Ambersor
-Log K Hc
b XE348F
-Log K HP Log V g
207A
'-Log K Hc -Log K Hp Log V g
1 -1.203 -1 . 149 1 . 4472 -1.13 5 0 . 085 2 . 445 0 . 145 0 . 374 2 . 3803 0 . 972 1.267 3 . 487 1.073 1 .414 3.3214 ---. --- --- 1 . 743 2 . 178 4 . 04210 1 .398 1 . 738 3 . 885 1 . 465 1 . 806 * 3 . 984171 Q
0 . 153 0 . 593 2 . 989 --- --- ---i O19 0 . 534 0 . 893 3 . 189 0 . 730 1 . 085 3 . 18420 1.152 1 . 598 3.551 1 . 610 2 . 06 5 3 . 89524 0.110 0 . 192 2 .799 --- --- ---25 0 . 844 1 . 084 3 . 523 1 . 477 1 .717 3 . 66726 1 . 692 2 . 402 4 . 095 1 . 761 2 .116 4 . 29835 -0 . 488 -0 . 209 2.233 0.191 0 . 470 2 .21736 0.960 ’ 1.465 3 .353 1 . 159 1 .664 3 . 81737 1 . 620 2*. 27 3 3 . 877 2 . 010 2.665 3 . 99938 2 . 086 2 . 849 4 . 279 2 . 250 2 . 872 4 . 17839 1 . 084 2 . 675 3 . 945 2 . 340 3.212 4.55440 1 . 499 2 . 391 3 . 523 1 . 900 2 . 347 3.97541 --- ■ --- --- 2 . 484 2 . 925 5.0794 3 0 . 085 1 . 183 3 . 344 0 . 998 1 . 187 3 .4904 6 --- --- --- --- --- ---47 1 . 649 1 . 998 4.110 1 . 801 2 . 149 4 . 212
2 44
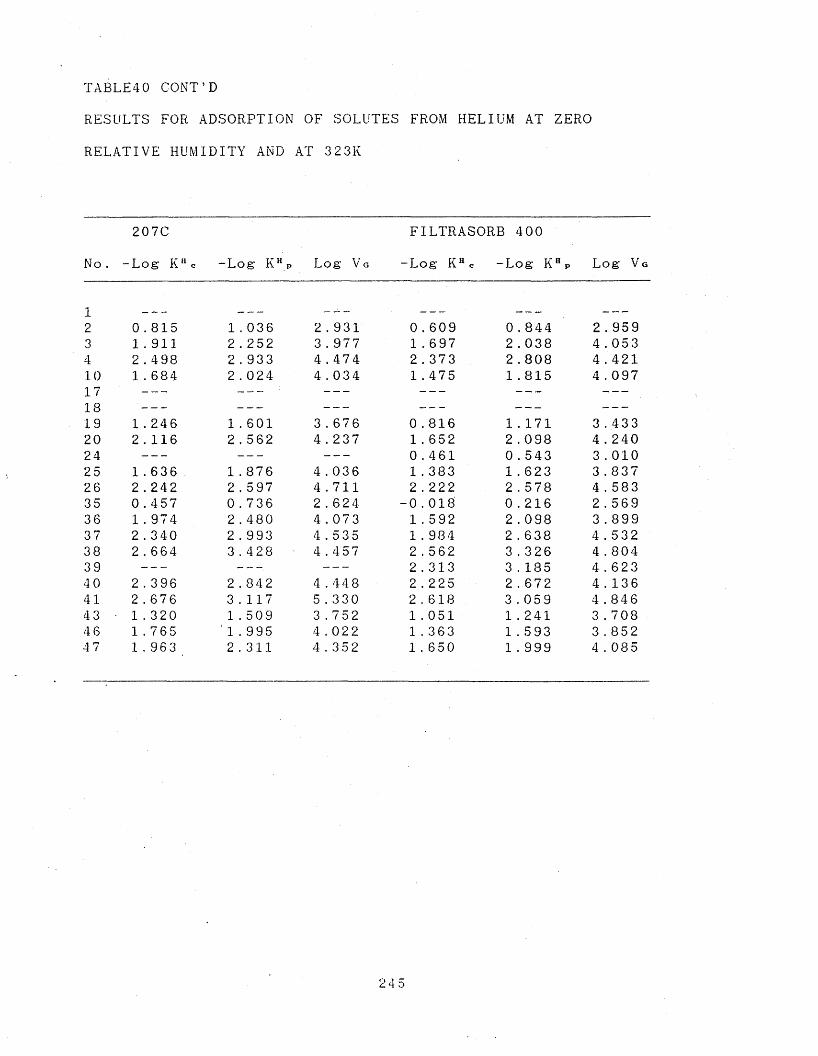
TABLE40 C O N T ’D
RESULTS FOR ADSORPTION OF SOLUTES FROM HELIUM AT ZERO
RELATIVE HUMIDITY AND AT 323K
No .
207C
-Log K Hc -Log K HP Log Vg
FI L T R A S O R B 4 00
-Log K H c -Log K HP Log Vg
12 0.815 1 . 036 2 . 931 0 . 609 0 . 844 2 . 9593 1 . 911 2 . 252 3 . 977 1 . 697 2 . 038 4 . 05 34 2 . 498 2 . 933 4 . 474 2.373 2 . 808 4 . 42110 1 . 684 2 . 024 4 . 034 1.475 1 .815 4 . 09717 --- --- --- --- --- ----18 19 1 . 246 1 . 601 3 . 676 0 . 816 1 . 171 3 . 43320 2 . 116 2 . 562 4 . 237 1 . 652 2 .098 4 . 24024 --- --- --- 0 .461 0 . 543 3 . 01025 1 . 636 1 . 876 4 . 036 1 . 383 1 . 623 3 . 83726 2 . 242 2.597 4.711 2.222 2 . 578 4 . 58335 0 . 457 0 . 736 2 . 624 -0 .018 0 . 216 2 . 56936 1 . 974 2 . 480 4 . 07 3 1.592 2 .098 3 . 89937 2 . 340 2 . 993 4.535 1 . 98 4 2 . 638 4 . 53238 2 . 664 3.428 4.457 2 . 562 3.326 4 . 80439 --- --- --- 2.313 3 . 185 4.62340 2 . 396 2.842 4 . 44 8 2.225 2 . 672 4 . 13641 2 . 676 3.117 5 . 330 2 . 618 3 . 059 4 . 84643 • 1 . 320 1 . 509 3 .752 1 . 051 1 . 241 3 . 7084 6 1 . 765 ' 1.995 4 . 022 1 . 363 1.593 3 .85247 1 . 963 2.311 4 . 352 1 . 650 1 . 999 4 . 085
2 4 5
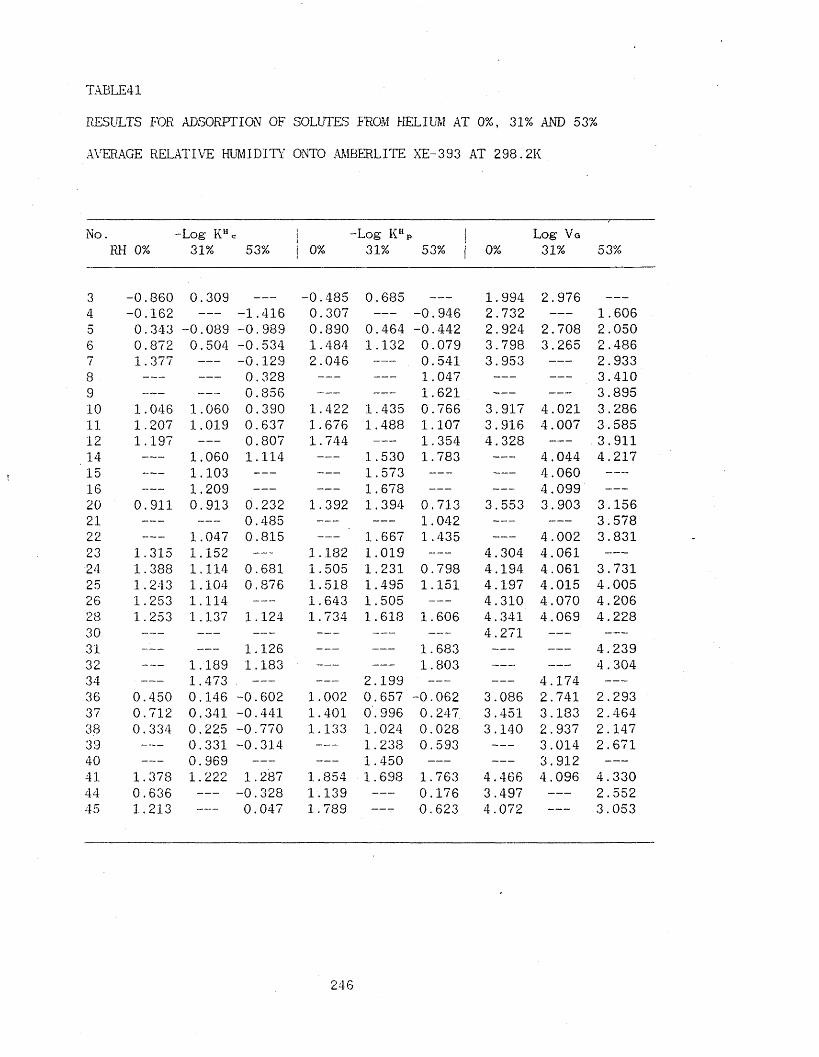
TABLE41
RESULTS FOR ADSORPTION OF SOLUTES FROM HELIUM AT 0%, 31% AND 53%
AVERAGE RELATIVE HUMIDITY ONTO AMBERLITE XE-393 AT 298.2K
No.RH 0%
•Log KH 31%
c
53% ! 0% 1
-Log KHP 31% 53% j 0%
Log Vg 31% 53%
3 -0.860 0.309 -0.485 0.685 1.994 2.9764 -0.162 -- -1.416 0.307 -0.946 2.732 -- 1.6065 0.343 -0.089 -0.989 0.890 0.464 -0.442 2.924 2.708 2.0506 0.872 0.504 -0.534 1.484 1.132 0.079 3.798 3.265 2.4867 1.377 -- -0.129 2.046 ------ 0.541 3.953 -- 2.9338 -- -- 0.328 -- -- 1.047 -- -- 3.4109 -- -- 0.856 -- -- 1.621 -- -- 3.89510 1.046 1.060 0.390 1.422 1.435 0.766 3.917 4.021 3.28611 1.207 1.019 0.637 1.676 1.488 1.107 3.916 4.007 3.58512 1.197 -- 0.807 1.744 -- 1.354 4.328 -- 3.91114 -- 1.060 1.114 -- 1.530 1.783 -- 4.044 4.21715 -- 1.103 -- -- 1.573 -- -- 4.060 --16 -- 1.209 -- -- 1.678 -- -- 4.099 --20 0.911 0.913 0.232 1.392 1.394 0.713 3.553 3.903 3.15621 -- -- 0.485 -- -- 1.042 -- -- 3.57822 -- 1.047 0.815 -- 1.667 1.435 -- 4.002 3.83123 1.315 1.152 -- 1.182 1.019 -- 4.304 4.061 --24 1.388 1.114 0.681 1.505 1.231 0.798 4.194 4.061 3.73125 1.243 1.104 0.876 1.518 1.495 1.151 4.197 4.015 4.00526 1.253 1.114 -- 1.643 1.505 -- 4.310 4.070 4.20628 1.253 1.137 1.124 1.734 1.618 1.606 4.341 4.069 4.22830 -- -- -- -- -- -- 4.271 -- --31 -- 1.126 -- -- 1.683 -- -- 4.23932 -- 1.189 1.183 -- -- 1.803 -- -- 4.30434 -- 1.473 -- -- 2.199 -- -- 4.174 --36 0.450 0.146 -0.602 1.002 0.657 -0.062 3.086 2.741 2.29337 0.712 0.341 -0.441 1.401 0.996 0.247. 3.451 3.183 2.46438 0.334 0.225 -0.770 1.133 1.024 0.028 3.140 2.937 2.14739 -- 0.331 -0.314 -- 1.238 0.593 -- 3.014 2.67140 -- 0.969 -- -- 1.450 -- -- 3.912 --41 1.378 1.222 1.287 1.854 1.698 1.763 4.466 4.096 4.33044 0.636 -- -0.328 1.139 -- 0.176 3.497 -- 2.55245 1.213 0.047 1.789 0.623 4.072 3.053
246

TABLE42
RESULTS FOR ADSORPTION OF SOLUTES FROM HELIUM AT 0% & 31%
AVERAGE RELATIVE HUMIDITY ONTO AMBERLITE XAD-16 AT 298. 2K
No .RH
-Log0%
K H c ...
31%j -Log i 0%j
K %31%
j Log i 0 %J
V G 31%
3 0 . 177 0 . 280 0.553 0 . 662 2 . 930 3 .0194 0 . 970 1 . 002 1 . 439 1. 472 3 . 618 3 . 6935 1 .590 1 . 683 2.137 2 . 229 4 .165 4 .1586 1.854 ----- 2.455 ----- 4 . 573 4 . 49610 0 . 717 0 . 702 1 . 092 1 . 077 3 . 470 3 . 50011 1.358 1.428 1 . 828 1 . 897 3 . 992 4 . 00912 1 .818 1 .896 2 . 364 2 . 442 4 . 135 4 . 44219 0.161 0 . 176 0.551 0 . 563 3.047 3 . 02220 0 . 966 1 . 001 1 . 447 1 . 482 3 . 632 3 . 74821 ----- 1.457 ----- 2 . 013 ----- 4 .16822 1 . 808 2 .015 2 . 428 2 . 635 4 . 345 4 . 55023 - 0 . 322 -0 . 569 -0.455 -0.702 2 . 048 2 . 0312 4 -0.305 - 0 . 364 - 0 . 188 -0.247 2 . 479 2 .51825 0.357 0 . 377 0 . 632 0 . 666 3 . 162 3 . 19326 1 . 081 1 . 096 1 . 472 1 . 487 3 . 920 3 . 9452 8 1.819 1 . 701 2 . 301 2 . 183 4 .591 4 . 6013 0 1 . 095 1.164 1 . 576 1 . 646 3 . 821 3 . 92936 0 . 800 0 . 747 1 . 341 1 . 288 3 .394 3 .51037 1 . 306 1 . 444 1 . 994 2 . 132 3 . 992 4 . 048 .38 1 . 504 1 . 572 2.303 2.3 70 4 . 281 4 . 12740 0 . 944 1 .014 1 . 425 1 .495 3 .538 3 . 81141 2 . 073 ■ 2 . 138 2 . 548 2 .613 4 . 776 4 . 89944 1 . 534 1 . 456 2 . 038 1.960 4.071 4.07545 2.114 1 . 983 2 .690 2.558 4 . 520 4 . 48447 0.655 0 . 835 1 . 038 1.218 3 . 447 3 . 68548 1.758 2 . 295 4 . 090
247
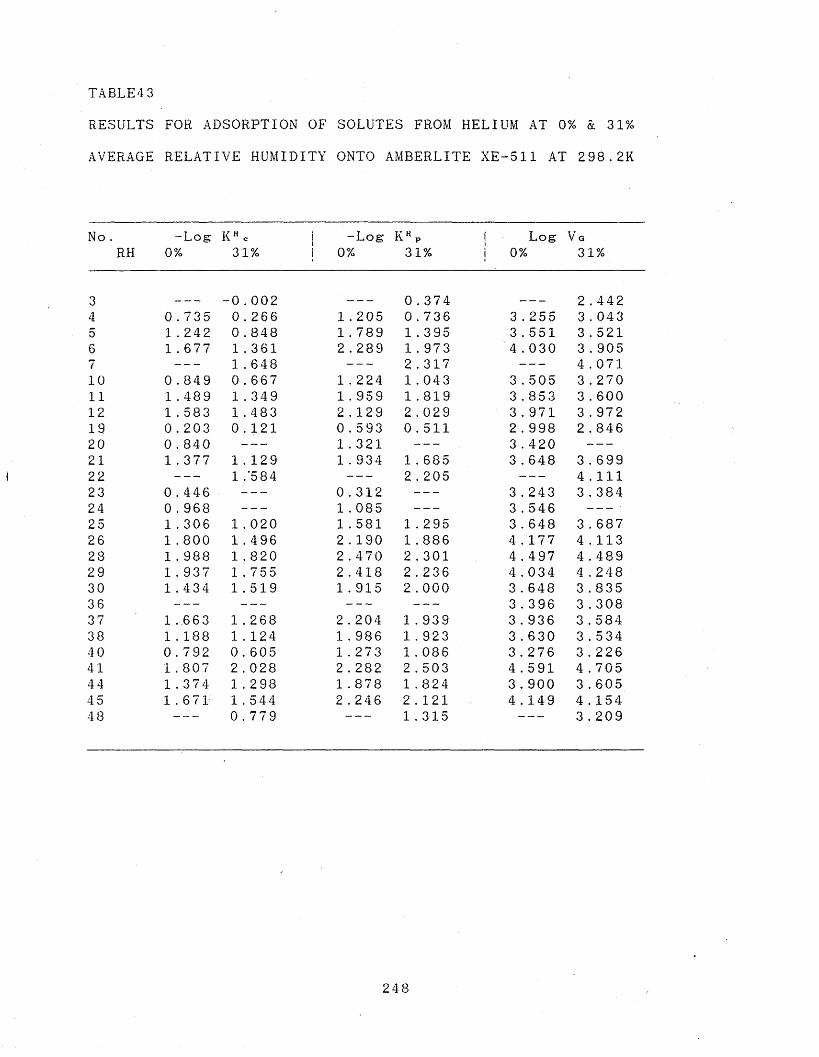
TABLE43
RESULTS FOR ADSORPTION OF SOLUTES FROM HELIUM AT 0% & 31%
AVERAGE RELATIVE HUMIDITY ONTO AMBERLITE XE-511 AT 298. 2K
No .R H
-Log0 %
piCO
X | -Logj 0 %
K “ P3 1 %
j Log i 0 %i
V g3 1 %
3 - 0 . 0 0 2 0 . 3 7 4 2 . 4 4 24 0 . 7 3 5 0 . 2 6 6 1 . 2 0 5 0 . 7 3 6 3 . 2 5 5 3 . 0 4 35 1 . 2 4 2 0 . 8 4 8 1 . 7 8 9 1 . 3 9 5 3 . 5 5 1 3 . 5 2 16 1 . 6 7 7 1 . 3 6 1 2 . 2 8 9 1 . 9 7 3 4 . 0 3 0 3 . 9 0 57 - - - - 1 . 6 4 8 - - - - 2 . 3 1 7 - - - - 4 . 0 7 11 0 0 . 8 4 9 0 . 6 6 7 1 . 2 2 4 1 . 0 4 3 3 . 5 0 5 3 . 2 7 01 1 1 . 4 8 9 1 . 3 4 9 1 . 9 5 9 1 . 8 1 9 3 . 8 5 3 3 . 6 0 01 2 1 . 5 8 3 1 . 4 8 3 2 . 1 2 9 2 . 0 2 9 3 . 9 7 1 3 . 9 7 21 9 0 . 2 0 3 0 . 1 2 1 0 . 5 9 3 0 . 5 1 1 2 . 9 9 8 2 . 8 4 62 0 0 . 8 4 0 - - - - 1 . 3 2 1 - - - - 3 . 4 2 0 - - - -2 1 1 . 3 7 7 1 . 1 2 9 1 . 9 3 4 1 . 6 8 5 3 . 6 4 8 3 . 6 9 92 2 - - - - 1 . ’ 5 8 4 - - - - 2 . 2 0 5 - - - - 4 . 1 1 12 3 0 . 4 4 6 - - - - 0 . 3 1 2 - - - - 3 . 2 4 3 3 . 3 8 42 4 0 . 9 6 8 - - - - 1 . 0 8 5 - - - - 3 . 5 4 6 - - - -2 5 1 . 3 0 6 1 . 0 2 0 1 . 5 8 1 1 . 2 9 5 3 . 6 4 8 3 . 6 8 72 6 1 . 8 0 0 1 . 4 9 6 2 . 1 9 0 1 . 8 8 6 4 . 1 7 7 4 . 1 1 32 8 1 . 9 8 8 1 . 8 2 0 2 . 4 7 0 2 . 3 0 1 4 . 4 9 7 4 . 4 8 92 9 1 . 9 3 7 1 . 7 5 5 2 . 4 1 8 2 . 2 3 6 4 . 0 3 4 4 . 2 4 83 0 1 . 4 3 4 1 . 5 1 9 1 . 9 1 5 2 . 0 0 0 3 . 6 4 8 3 . 8 3 53 6 - - - - - - - - - - - - - - - - 3 . 3 9 6 3 . 3 0 83 7 1 . 6 6 3 1 . 2 6 8 2 . 2 0 4 1 . 9 3 9 3 . 9 3 6 3 . 5 8 43 8 1 . 1 8 8 1 . 1 2 4 1 . 9 8 6 1 . 9 2 3 3 . 6 3 0 3 . 5 3 44 0 0 . 7 9 2 0 . 6 0 5 1 . 2 7 3 1 . 0 8 6 3 . 2 7 6 3 . 2 2 64 1 1 . 8 0 7 2 . 0 2 8 2 . 2 8 2 2 . 5 0 3 4 . 5 9 1 4 . 7 0 544 1 . 3 7 4 1 . 2 9 8 1 . 8 7 8 1 . 8 2 4 3 . 9 0 0 3 . 6 0 54 5 1 . 6 7 1 1 . 5 4 4 2 . 2 4 6 2 . 1 2 1 4 . 1 4 9 4 . 1 5 44 8 0 . 7 7 9 1 . 3 1 5 3 . 2 0 9
248
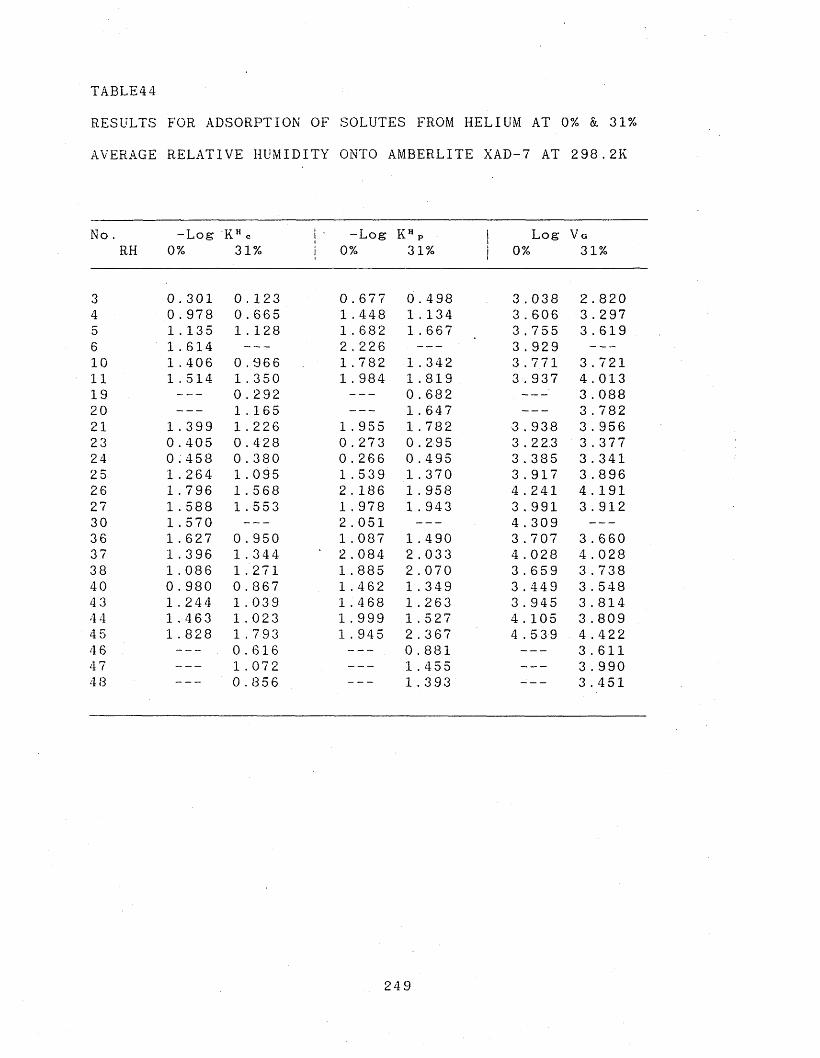
TABLE44
RESULTS FOR ADSORPTION OF SOLUTES FROM HELIUM AT 0% & 31%
AVERAGE RELATIVE HUMIDITY ONTO AMBERLITE XAD-7 AT 2 98.2K
No .RH
-Log K H c i 0% 31% i
-Log K HP 0% 31%
j Log V g i 0% 31%
3 0 . 301 0.123 0 . 677 0 . 498 3 . 038 2 . 8204 0 . 978 0 . 665 1 . 448 1 . 134 3 . 606 3 . 2975 1 . 135 1 . 128 1 . 682 1.667 3,755 3 . 6196 1 . 614 --- 2 . 226 --- 3 . 929 ---10 1 . 406 0.966 1.782 1 . 342 3 . 771 3 . 72111 1.514 1 . 350 1 . 984 1 . 819 3 . 937 4 . 01319 --- 0 . 292 --- 0 . 682 --- 3 . 08820 --- 1 . 165 --- 1 . 647 --- 3 . 78221 1 . 399 1 . 226 1.955 1 . 782 3 . 938 3 . 95623 0 . 405 0 .428 0 . 273 0 . 2 95 3.223 3 . 37724 0 . 458 0 . 380 0 . 266 0 . 495 3 . 385 3 . 34125 1 . 264 1 . 095 1 . 539 1 . 370 3 . 917 3 .89626 1 . 796 1 . 568 2 . 186 1 . 958 4 . 241 4 . 19127 1 . 588 1 . 553 1 . 978 1 . 943 3 . 991 3 . 91230 1 . 570 --- 2 . 051 --- 4 . 309 ---36 1 . 627 0 . 950 1.087 1 .490 3 . 707 3 . 66037 1 . 396 1 . 344 • 2.084 2 . 033 4 . 028 4 . 02838 1 . 08 6 1 .271 1 . 885 2 . 070 3 . 659 3 . 73840 0 . 980 0 . 867 1.462 1 . 349 3 . 449 3 . 54843 1 . 244 1 . 039 1 . 468 1 . 263 3 . 945 3 . 81444 1 . 463 1 . 023 1 . 999 1 . 527 4 . 105 3 . 80945 1 . 828 1 .793 1 . 945 2.367 4.539 4 . 4224 6 --- 0 . 616 --- 0 . 881 --- 3 .61147 --- 1 . 072 --- 1.455 --- 3 . 9904 8 0 . 856 1 .393 3 . 451
249
7.1.3. STATIC HEAD-SPACE EXPERIMENTAL
Two solvents were studied by this method, n-hexadecane and
olive oil. Solutions of solvent were prepared in 5 0 c m ' 3
head-space flasks, with about 5 c m ' 3 of accurately pipetted
solvent, 30m1 of reference solute, and 30}xl of solute to be
investigated, injected into the head-space flask using a
lOOjul syringe. The head-space flask (Figl.PT) was sealed
with a rubber septum cap and the flask suspended in a water
thermostat at either 298.2K for n-hexadecane or 323K for
olive oil. A sheet of polythene was placed over the flasks
to reduce heat loss and each septum cap was pierced with a
small needle, which was left permanently in place to ensure
no pressure build up developed in the head-space flask. The
flasks were left to equilibrate for approximately 60
minutes, and then the analysis carried out by analytical
GLC .
A Pye Unicam GCV chromatograph equipped with a flame
ionisation detector was used for the analysis, fitted with
a 1.5m glass column packed with a 10% loading of Carbowax
20m on Chromosorb W AW. Operating conditions were usually
as f o 1l o w s :
Gas flow rates: H 2 4 0 c m ' 3/min, air 4 0 0 c m ‘3/min, and N 24 0 cm'3/min.
Temperatures: Injector 500K, detector 520K, and column 330-4 6 0 K .
250
The chromatograph was attached to a Servoscribe RE-511
chart recorder to give a paper trace and also to a Pye
Unicam DP 88 computing integrator which automatically gave
a print out of the areas under each peak, and its retention
time. Prior to the analysis of each solution, the retention
time of each solute was measured.
The analysis of each solution was carried out in two
stages. Firstly, using a 2.5cm'3 glass gas-tight syringe,
about 1cm"3 of the vapour above the solution was removed
and injected onto the column. Head-space analysis was
carried out on each solution in turn, giving time for the
solutions to re-equilibrate before repeating the procedure.
A note was made of the areas under the two solute peaks for
each solution (solvent peaks were not obtained in the
vapour phase because of their involatile nature). When the
head-space analysis had been carried out three times
consecutively to produce consistent ratios of sample to
standard solute areas, to within 5%, the liquid solutions
were sampled. The rubber septum caps were replaced by glass
stoppers. Using a ijil glass syringe 0.5jil samples were
removed from each solution in turn and injected into the
column. Again the areas under the two solute elution peaks
were recorded for each solution, and the analysis repeated
several times. The n-hexadecane or olive oil was also
slowly eluted and to avoid any interference between solvent
and solute peaks the column was periodically heated to its
251
maximum operating temperature (490K) following liquid
injections, to remove the solvent collected on the column.
Analysis of the vapour and liquid phases of the head-space
solutions was sometimes not successful, for a number of
r e a s o n s :
(1) Some solutes were so involatile that no vapour phase
peaks were obtained
(2) Some solutes (in particular aromatics) contained
significant amounts of volatile impurities. Although
injection of the liquid solute would give one peak,
injection of the vapour above the solution resulted in
numerous peaks. These solutes could not be used as
such.
(3) The concentrations of the solutions were approximately
0.01 molar, which for some solutes was near enough to
"infinite dilution” to permit this treatment. However,
for a 1cohoIs and phenols more dilute s o 1utions were
required (methanol was not sufficiently soluble in
either n-hexadecane or olive oil).
When the chromatographic operating conditions are constant,
the concentrations of the solutes are proportional to their
respective elution peak areas, as measured by the
integrator. Computation of the partition coefficients can
simply made using eqn4 as described in Sec2.1.1.P6.
252

7.1.4. DETERMINATION OF THE DENSITY OF FLUOROPOLYOL
Fluoropolyol (FPOL) is a clear, very viscous oligomeric
material, which precluded the use of a density bottle or a
pycnometer tube. Instead the density was determined using a
glass bulb (5cm3.) with a calibrated stem (15cm)
which is referred to as the density bulb.
The density bulb was weighed before and after careful
addition of F P O L , and placed in a thermostatted bath at
various temperatures. The level up the calibrated stem to
the meniscus of the FPOL was noted at each temperature.
After thorough cleaning of the density bulb with methanol
and chloroform and drying, doubly distilled deionised water
was carefully added with a dropping pipe'tte and the density
bulb replaced in the thermos tat ted bath. At each
temperature previously used to measure the level of the
FPOL meniscus, the level of the water meniscus was adjusted
by adding or removing by pipette, water to the same FPOL
meniscus level. The density bulb at each of these
temperatures was removed from the thermostatted bath and
the external surface thoroughly cleaned and dried without
disturbing its water content (a rubber cap is suitable
here). The density bulb (full with water) is now weighed
(for each temperature measurement). Knowing the density of
water at each temperature (Handbook of Chemistry and
Physics) it is now possible to calculate the volume of FPOL
253
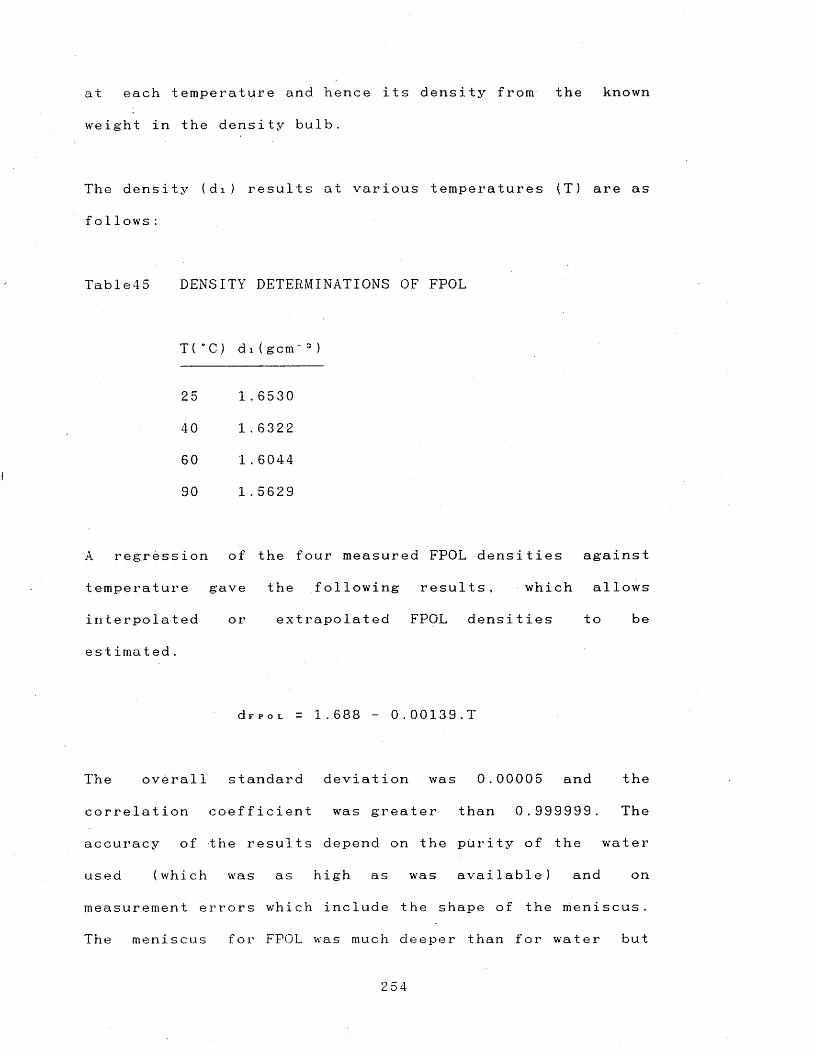
at each temperature and hence its density from the known
weight in the density bulb.
The density (di) results at various temperatures (T) are as
f o 1l o w s :
Table45 DENSITY DETERMINATIONS OF FPOL
T (°C) di(gem"3)
25
40
60
90
1.6530
1.6322
1.6044
1 . 5629
A regression of the four measured FPOL densities against
temperature gave the following results, which allows
interpolated or extrapolated FPOL densities to be
e s t imat e d .
d f p o l - 1 . 6 8 8 0 . 0 0 1 3 9 .T
The overall standard deviation was 0.00005 and the
correlation coefficient was greater than 0.999999. The
accuracy of the results depend on the purity of the water
used (which was as high as was available) and on
measurement errors -which include the shape of the meniscus.
The meniscus for FPOL was much deeper than for water but
2 54
reduced at higher temperatures. To limit any error
introduced by the meniscus the stem of the density bulb was
filled quite high up (allowing for expansion at higher
temperatures.) and a bulb as large as possible was used,
within the restriction of limited quantities of FPOL being
available. The precision of the measurements was quite
good, as shown from the low standard deviation obtained
from the temperature correlation above.
2 5 5
8.1. REFERENCES
1 A.I.M.Keulemans, Gas Chromatography, Reinhold, New York,1959.
2 M.Tswett, Ber. deut. botan. Ges., 24 (1906) 316.M.Tswett, Ber. deut. botan. Ges., 24 (1906) 384.
3 F.F.Runge, Zur Farbenchemie, Mittler U. Sohn, Berlin (1850).
4 F.F.Runge, Der Bildungstrieb der Stoffe, Selbstbering, Oranenburg (1855).
5 A.J.P.Martin and R.L.M.Synge, J.Biochem., 35 (1941) 1358.
6 G.Hesse, H.Eilbrecht and F.Reicheneder, Liebigs Ann. Chem., 546 (1941) 233.
7 A.Tiselius, Arkiv. Kemi, Mineral. Geol., 16A, No.18 (1943) 11.
8 S.Claesson, Arkiv. Kemi. Mineral. Geol., 23A, No.l (1946) 133.
9 A.T.James and A.J.P.Martin, J.Biochem., 50 (1952) 679.
10 J.R.Conder and C.L,Young, Physicochemical Measurements by Gas Chromatography, Wiley, New York, 1979.
11 R.J.Laub and R.L.Pecsok, Physicochemical Applications of Gas Chromatography, Wiley, Ney York, 1978.
12 M.H.Abraham, J .Chem.Soc.Perkin Trans.II, (1972) 1343.
13 M .H .Abraham, P.L.Grellier and J.Mana, J.Chem. Thermodynamics, 6 (1974) 1175.
14 M .H .Abraham, A .Nasehzadeh, M.J.Cook and F.Kaberia, J.C.S.Chem. Comm., (1980) 312.
15 M.H.Abraham and A .Nasehzadeh, J .Chem.Soc.Faraday Trans.I., 77 (1981) 321.
16 M.H.Abraham, L.E.Xodo, M.J.Cook and R.Cruz, J .Chem.Soc.Perkin Trans.II, (1982) 1503.
17 M.H.Abraham, J.Chem.Soc.A, (1971) 1061.
18 L.Rohrschneider, Anal.Chem., 45 (1973) 1241.
19 H.Miethte, Deut.Lebensm.-Rdsch., 65 (1969) 379.
20 P.L.Davis, J.Chromatog.Sci., 8 (1970) 423.
21 H.G.Maier, J .Chromatog., 50 (1970) 329.
256
22 C.Horvath, The practice of gas chromatography, ed L.S.Ettre and A.Zlatkis, Interscience, New York, (1967) pl88-189.
23 D.M.Ottenstein, J.Gas. Chromatog., 6 (1968) 129.
24 J.Bohemen, S.H.Langer, R.H.Perrett and J.H.Purnell, J.Chem.Soc., (1960) 2444.
25 E.C.Pease and S.Thorburn, J .Chromatog., 30 (1967) 344.
26 D.E.Martire and P.Riedl, J .Phys.Chem., 72 (1968) 3478.
27 J.J.van Deemter, F .J .Zuiderweg and A.Klinkenberg, Chem.Eng.Sci., 5 (1956) 271.
28 R.H.Perrett and J.H.Purnell, Anal.Chem., 35 (1963) 430.
29 A.P.Kudchadker, G.H.Alani and B.J.Zwolinski, Chem.Rev., 68 (1968) 659.
30 R.J.Laub and R.L.Pecsok, J.Chromatog., 98 (1974) 511.
31 D.H.Everett, B.H.Gainey and C.L.Young, Trans. Faraday Soc. , 64 (1968) 2667.
32 W.Ecknig, Z.Chem., 25 (1985) 240.
33 L.Rohrschneider, J.Chromatog., 17 (1965) 1.L.Rohrschneider, J .Chromatog., 22 (1966) 6.
34 W.O.McReynolds, J.Chromatog.Sci., 8 (1970) 685.
35 K.Grob and G.Grob, Chromatographia., 4 (1971) 422.K.Grob and G.Grob, J.Chromatog., 156 (1978) 1.
36 L.R.Snyder, J .Chromatog., 92 (1974) 223.
37 F.Patte, M.Etcheto and P.Laffort, Anal.Chem., 54 (1982) 2239.
38 T.Kleinert and W.Ecknig, J.Chromatog., 315 (1984) 75.T.Kleinert and W.Ecknig, J.Chromatog., 315 (1984) 85.
39 R.A.Pierotti, Chem. Rev., 76 (1976) 717.
42 D.E.Martire, Anal.Chem., 33 (1961) 1143.
43 M.Gassiot, E.Fernandez, G.Firpo, R.Carbo and M.Martin,J.Chromatog., 108 (1975) 337.
44 W.H.King, Anal.Chem., 36 (1964) 1735.
45 Ref44 and references cited therein.
46 H.Wohltjen and R.E.Dessy, Anal.Chem., 51 (1979) 1458.
257
47 J.W.Grate, A.W.Snow, D.S.Ballantine, H.Wohltjen, M.H.Abraham,R.A.McGill and P.Sasson, Proc. of the 4th Int. Conf. on Solid- State Sensors and Actuators, Transducers ’87, Tokyo., (1987) 579.
48 J.W.Grate, A.W.Snow, D.S.Ballantine, H.Wohltjen, M .H .Abraham,R.A.McGill and P.Sasson, NRL Memorandum Report., (1987) 6024, NTIS ADA 183694.
49 H.Wohltjen, A.W.Snow, W.R.Barger and D.S.Ballantine, IEEE Trans. Ultrason. Ferroelectrics. Freq. Contr., UFFC-34 (1987) 172.
50 D.S.Ballantine, S.L.Rose, J.W.Grate and H.Wohltjen, Anal.Chem., 58 (1986) 3058.
51 H.Wohltjen, A.W.Snow, D.S.Ballantine, Proc. of the 3rd Int. Conf. on Solid State Sensors and Actuators, Transducers’85, Philadelphia, PA., IEEE Cat. No. CH2127-9/85/0000-0066 (1985) 66.
52 H.Wohltjen, Sens. Actuators., 5 (1984) 307.
53 A.W.Snow and H.Wohltjen, Anal.Chem., 56 (1984) 1411.
54 A.Venema, E.Nieuwkoop, M.J.Vellekoop, W.J.Ghijsen, A.N.Barendsz and M.S.Nieuwenhuizen, IEEE Trans. Ultrason. Ferroelectrics. Freq. Contr., UFFC-34 (1987) 148.
55 M.S.Nieuwenhuizen and A .W .Barendsz, Sens. Actuators., 11 (1987) 45.
56 M.S.Nieuwenhuizen, A.W.Barendsz, E.Nieuwkoop, M.J.Vellakoop and A.Venema, Electron Lett., 22 (1986) 184.
57 A.Venema, E.Nieuwkoop, M.J.Vellekoop, M.S.Nieuwenhuizen and A.W.Barendsz, Sens.Actuators., 10 (1986) 47.
58 S.J.Martin, A.J.Ricco, D.S.Ginley and T.J.Zipperian, IEEE Trans. Ultrason. Ferroelectrics. Freq. Contr., UFFC-34 (1987) 142.
59 A.J.Ricco, S.J.Martin, T.E.Zipperian, Sens.Actuators., 8 (1985)319.
60 S.J.Martin, K.S.Schweizer, A.J.Ricco, T.E.Zipperian, Proc. of the 3rd Int. Conf. on Solid-State Sensors and Actuators, Transducers’85 Philadelphia, PA., IEEE Cat. No. CH2127-9/85/0000-0066 (1985) 71.
61 J.F.Vetelino, R.K.Lade and R.S.Falconer, IEEE Trans. Ultrason. Ferroelectrics. Freq. Contr., UFFC-34 (1987) 156.
62 A.Bryant, M.Poirer, G.Riley, D.L.Lee and J.F.Vetelino, Sens. Actuators., 4 (1983) 105.
63 A.D’Amico, A.Palma and E.Verona, Sens.Actuators., 3 (1982/1983) 31.
64 C.T.Chuang, R.M.White and J.J.Bernstein, IEEE Electron. Device Lett., EDL-3 (1982) 145.
258
65 J.W.Grate, A.Snow, D.S.Ballantine, H.Wohltjen, M.H.Abraham,R.A.McGill and P.Sasson, Anal.Chem., in the press.
66 For a review see: J.F.Alder and J .J.McCallum, Analyst., 108 (1983) 1169.
67 M. Janghorbani and H.Freund, Anal.Chem., 45 (1973) 325.
68 T.E.Edmunds and T.S.West, Anal.Chim.Acta., 117 (1980) 147.
69 J .J.McCallum, P.R.Fielden, M.Volkan and J.F.Alder, Anal.Chim.Acta., 162 (1984) 75.
70 W.P.Carey, K.R.Beebe, B.R.Kowalski, D.L.Illman and T.Hirschfeld, Anal.Chem., 58 (1986) 149.
71 G.O.Nelson and C.A.Harder, Amer.Ind.Hygiene Ass.J., (1974) 391.
72 E .B .Sansone, Y.B.Tewari and L.A.Jonas, Environ.Sci.Technol., 13 (1979) 1511.,
73 J.F.Parcher and D.M.Johnson, J.Chromatog.Sci., 23 (1985) 459.
74 L.R.Snyder, Principles of Adsorption chromatography, Marcel Dekker, New York, 1968.
75 L.R.Snyder and E.R.Fett, J .Chromatog., 18 (1965) 461.
76 L.R.Snyder, Adv.Anal.Chem.-and Inst., vol3 p251-313.
77 A .V .Kiselev, V .I.Nazarova, K .D .Shcherbakova, E .Smolkova- Keulemansova and L.Felti, Chromatographia., 17 (1983) 533. And references therein.
78 A.V.Kiselev and Y. I.Yashin, Gas’-Adsorption chromatography, Plenum Press, New York., (1969) p36-39.
79 P.J.Reucroft, W.H.Simpson and L.A.Jones, J.Phys.Chem., 23 (1971) 3526
80 F.Saura-Calixto and A.Garcia-Raso, Chromatographia., 15 (1982) 771.
81 F .J .Lopez-Garzon, I.Fernadez-Morales and M.Domingo-Garcia, Chromatographia., 23 (1987) 97.
82 A.Jaulmes, C.Vidal-Madjar, A.Ladurelli and G.Guichon, J .Phys.Chem., 88 (1984) 5379.
83 A.Jaulmes, C.Vidal-Madjar, M.Gaspar and G.Guichon, J.Phys.Chem., 88(1984) 5385.
84 W.T.Cooper and J.M.Hayes, J.Chromatog., 314 (1984) 111.
85 G.M.Dorris and D.G.Gray, J .Chem.Soc.Faraday Trans.1.,77 (1981) 713.
259
86 G.M.'Dorris and D.G.Gray, J.Chem.Soc.Faraday Trans. 1 7 7 (1981) 725.
87 P.R.Tremaine, U-B.Mohlin and D.G.Gray, J.Coll.Inter.Sci., 60 (1977) 548.
88 E.Cremer and H.F.Huber, Angew.Chem., 73 (1961) 461.
89 A.Nonaka, Adv.Chromatog, Marcel Dekker, New York., voll2 p223.
90 C.G.Scott, J.Inst.Pet., 45 (1959) 118.
91 B.A.Rudenko, M.A.Baidarovtseva and V.F.Kucherov,Izv.Akad.Nauk SSSR, Ser.Khim., No.8 (1973) 1773.
92 B.A.Rudenko and F .Z .Dzhabarov, Zh.Anal.Khim., 39,No.11 (1984) 2073.
93 G.A.Mandrov and B.A.Rudenko, J .Analyt.Chem,USSR., 41 (1986) 1489.
94 J.F.K.Huber and R.G.Gerritse, J.Chromatog., 58 (1971) 137. And refs therein.
95 J.R.Conder and D.H.Purnell, Trans.Farad.Soc., 65 (1969) 824.
96 L.Bachman, E.Bechtold and E.Cremer, J.Catal., 1 (1962) 113.
97 H.Knozinger and H.Spannheimer, J .Chromatog., 16 (1964) 1.
98 J.F.K. Huber and A. I .M.Keulemans, Gas Chromatography, Ed. M.van Swaay Butterworths, London., (1962) p26.
99 I.Langmuir, Chem.Rev., 13 (1933) 147.
100 E.Cremer, Monatsh.Chem., 92 (1961) 112.
101 Lange’s Handbook of Chemistry, pl0,84.
102 M.J.Kamlet, R.M.Doherty, J .-L.M.Abboud, M.H.Abraham and R.W.Taft, Cheratech., (1986) 566.
103 M.H.Abraham, R.M.Doherty, M.J.Kamlet and R.W.Taft, Chem.Brit., 75(1986) 629.
105 M.J.Kamlet and R.W.Taft, Acta Chemica Scandinavica., B 39 (1985)611.
106 J.H.Hildebrand and R.L.Scott, Regular Solutions, Prentice-Hall, UK & Canada, 1962.
107 J.H.Hildebrand and R.L.Scott, The solubility of non-electrolytes, Dover publications, New York, 1964.
108 M.J.Kamlet, P.W.Carr, R.W.Taft and M.H.Abraham, J.Amer.Chem.Soc.,103 (1981) 6062.
260
109 J .-L.M.Abboud, M.J.Kamlet and R.W.Taft, J.Amer.Chem.Soc., 99 (1977) 8325.
110 M .H .Abraham, P.P.Duce, P.L.Grellier, D.V.Prior, J.J.Morris and P.J.Taylor, Tetrahedron Letters., in the press.
111 M.H.Abraham, P.L.Grellier, D.V.Prior, J.J.Morris, P.J.Taylor,C.Laurence and M.Berthelot., in preparation.
112 R.S.Mulliken and W.B.Person, J .Amer.Chem.Soc., 91 No.13 (1969)3409.
113 M.J.Kamlet, M.H.Abraham, R.M.Doherty and R.W.Taft, J.Amer.Chem. Soc., 106 (1984) 464.
114 R.W.Taft, M.H.Abraham, G.R.Famini, R.M.Doherty, J .-L.M .Abboud and M.J.Kamlet, J.Pharm.Sci., 74 (1985) 807.
115 M.H.Abraham and J.C.McGowan, Chromatographia., 23 (1987) 243.
116 D.E.Leahy, J.Pharm.Sci., 75 (1986) 629.
117 D.E.Leahy, P.W.Carr, R.S.Pearlman, R.W.Taft and M.J.Kamlet, Chromatographia., 21 (1986) 473.
118 J.C.McGowan, J.Appl.Chem.Biotechnol., 28 (1978) 599.
119 J.C.McGowan, P.Ahmad and A.Mellors, Canad. J.Pharm.Sci. , 14 (1979) 72.
120 J.C.McGowan, J.Appl.Chem.Biotechnol., 34A (1984) 38.
121 M.H.Abraham, P.L.Grellier and R.A.McGill, J .Chem.Soc.Perkin Trans.2(1987) 797. See Appendix2.
122 M.J.Kamlet and R.W.Taft, J .Amer.Chem.Soc., 98 (1976) 377.
123 M.J.Kamlet, J .-L.M. Abboud, and R.W.Taft, Prog. Phys. Org. Chem. , 13 (1981) 485.
124 M.J.Kamlet, J.-L.M.Abboud, and R.W.Taft, J.Amer.Chem.Soc., 99 (1977) 6027.
125 R.W.Taft and M.J.Kamlet, J .Amer.Chem.Soc., 98 (1976) 2866.
126 R.R.Minesinger, M.E.Jones, R.W.Taft and M.J.Kamlet, J.Org.Chem., 42 (1977) 1929.
127 P.Nicolet and C.Laurence, J.Chem.Soc. Perkin Trans.2 (1986) 1071.
128 C.Laurence, P.Nicolet and M.Helbert, J.Chem.Soc. Perkin Trans.2 (1986) 1081.
261

129 T.Yokoyama, R.W.Taft and M.J.Kamlet, J .Amer.Chem.Soc., 98 (1976) 3233.
130 M.J.Kamlet, M.E.Jones, R.W.Taft and J .-L.M.Abboud, J.Chem.Soc. Perkin Trans2., (1979) 342.
131 M.J.Kamlet, A.Solomonovici and R.W.Taft, J.Amer.Chem.Soc., 101 (1979) 3734.
132 R.W.Taft, N.J.Pienta, M.J.Kamlet and E.M.Arnett, J.Org.Chem., 46 (1981) 661.
133 M.J.Kamlet, R.M.Doherty, G.D.Veith, R.W.Taft and M.H.Abraham,Envir.Sci.Tech., 20 (1986) 690.
134 M.J.Kamlet, R.M.Doherty, R.W.Taft, M.H.Abraham, G.D.Veith and ■ D.J.Abraham, Envir.Sci.Tech., 21 (1987) 149.
135 M.J.Kamlet, R.M.Doherty, J .-L.M.Abboud, M.H.Abraham and R.W.Taft, J.Pharm.Sci., 75 (1986) 338.
136 M.J.Kamlet, R.M.Doherty, M.H.Abraham, P.W.Carr, R.F.Doherty and R.W.Taft, J.Phys.Chem., 91 (1987) 1996.
137 M.H.Abraham, P.L.Grellier, R.A.McGill, J.-L.M.Abboud, M.J.Kamlet, W.J.Schuely and R.W.Taft, Faraday Discussions’88 (marchi988).
138 M.J.Kamlet and R.W.Taft, J .Chem.Soc.Perkin Trans.2., (1979) 349.
139 M.J.Kamlet and R.W.Taft, J .Chem.Soc.Perkin Trans.2., (1979) 1723.
140 B.Chawla, S.K.Pollack, C.B.Lebrilla, M.J.Kamlet and R.W.Taft,J.Amer.Chem.Soc., 103 (1981) 6924.
141 M.J.Kamlet, T.N.Hall, J.Boykin and R.W.Taft, J.Org.Chem., 44 (1979) 2599.
142 M.H.Abraham and R.Fuchs, J .Chem.Soc.Perkin Trans.2., (1987) in the press.
143 P.-C.Maria, J.-F.Gal, J.de Franceschi and E.Fargin, J.Amer.Chem. Soc., 109 (1987) 483.
144 M.H.Abraham, P.L.Grellier, D.V.Prior, J.J.Morris, P.J.Taylor, P.- C.Maria and J.-F.Gal, Part4, submitted to J .Chem.Soc.Faraday Trans.
145 M.J.Kamlet, R.M.Doherty, M.H.Abraham and R.W.Taft, Carbon., 23(1985) 549.
146 Personal communiacation P.L.Grellier.
147 J.W.Grate, A.Snow, D.S.Ballantine, H.Wohltjen, M .H .Abraham,R.A.McGill and P.Sasson, Anal.Chem., in the press.
262
148 M.H.Abraham, P.L.Grellier, R.A.McGill, R.M.Doherty, M.J.Kamlet, T.N.Hall, R.W.Taft, P.W.Carr and W.J.Koros, Polymer., 28 (1987)1363. See Appendix2.
149 M.H.Abraham, G.J.Buist, P.L.Grellier, R.A.McGill, R.M.Doherty, M.J.Kamlet, R.W.Taft and S.G.Maraldo., J .Chromatog., 409 (1987) 15. See Appendix2.
150 M.J.Kamlet, R.M.Doherty, R.W.Taft, M.H.Abraham, G.D.Nielsen and Y.Alarie, Environ.Sci.Technol., submitted.
151 P.C.Sadek, P.W.Carr, R.M.Doherty, M.J.Kamlet, R.W.Taft, and M.H.Abraham, Anal.Chem ., 57 (1985) 2971.
152 F.Patte, M.Etcheto and P.Laffort, Anal.Chem., 54 (1982) 2239.
153 W.O.McReynolds, Gas Chromatographic Retention Data, Preston Technical Abstracts Co., Evanston 1966.
154 M.H.Abraham, P.L.Grellier, I.Hammerton, R.A.McGill, D.V.Prior and G.S.Whiting, Faraday Discussions ’88. Submitted.
155 M.H.Abraham, P.L.Grellier, R.A.McGill, D.V.Prior and G.S.Whiting, in preparation.
156 Personal communication from Phase Separations Ltd. (Johns Manville data).
157 J.A.Rijks, PHD Thesis, Eindovan, 1973.
158 L.S.Ettre, Chromatographia., 6 (1973) 489. .
263
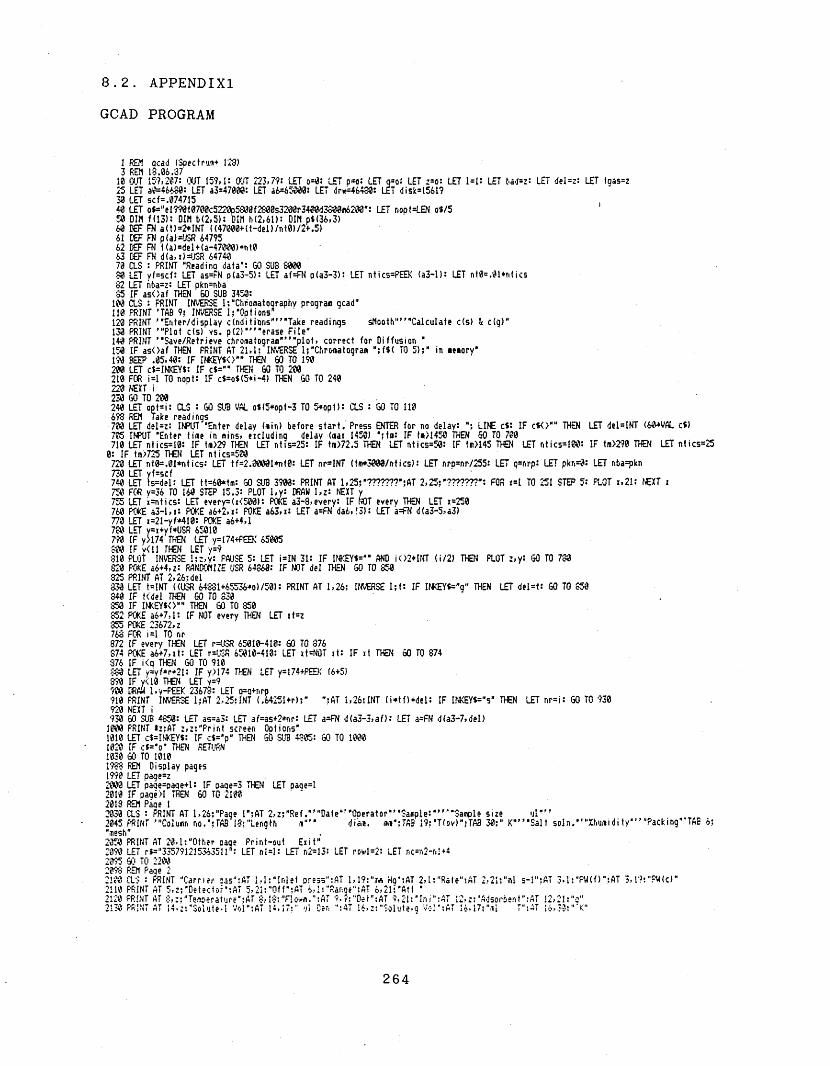
8.2. APPENDIX1
GCAD PROGRAM
1 REM ocad (Soectru/*+ 123)3 REM 18.06.3710 a n 15?1207: OUT 159*1: a n 223,7?: LET o=4: LET p=o: LET q=o: LET z=o: LET 1=1: LET bad=z: LET del=z: LET tqas=z 25 LET a8=46680: LET a3=470P0: LET a6=65840: LET drw=46430: LET disk=1561?30 LET scf=.87471540 LET o*="el?90t0700c5220p5S00f2800s3208r34«8d3880<n6200": LET r.opt=L£N o*/5 50 DIM f(13): DIM b(2,5): DIM h(2,6l): DIM pi(36,3)60 DEF FN a(t)=2*INT ((47008+(t-del)/nt8)/2+.5)61 DEF FN p(a)=USR 6479562 DEF FN t<a>=del+(a-47000)*nt863 DEF FN d(a.x)=USR 6474070 a S : FAINT "Readinq data": GO SUB 800080 LET yf=scf: LET as=fN p(a3-5): LET af=FN p(a3-3): LET ntics=PEEK (a3-l): LET nt8=.81*ntics 82 LET nba=z: LET pkn=nt>a 85 IF asOaf THEN 60 SUB 3450:100 CLS : FAINT INVERSE 1:“Chromatography program qcad"110 FAINT ’TAB 9: INVERSE i: "Opt ions"120 PAINT ’"Enter/display c(nditibns"” "Take readings sMooth"""Calculate c(s) & c(q)"130 PRINT ’"Plot c(s) vs. p(2)"” "erase File"140 PRINT ’"Save/Retrieve chronatoqraa"” "plot> correct for Diffusion "150 IF asOaf THEN PRINT AT 2 1 , 1 INVERSE 1;"Chronatogran “;f$( TO 5);" in ■e»ory*190 BEEP .05.40: IF IfKEYSO” THEN SO TO 190 200 LET ct=INKEYt: IF c$="" TIEN 60 TO 200 210 FCfi i=l TO nopf- IF c$=o$(5*i-4) THEN 60 TO 240 223 NEXT i 230 GO TO 200240 LET opt=i: a s : GO SLiB VAL o$(5*opt-3 TO 5*opt): a s : GO TO HO 698 REM Take readings700 LET del=z: INPUT "Enter delay (sin) before start. Press ENTER for no delay: ": LI)E c$: IF cfO"" THEN LET del=INT (60+VAL ct)705 INPUT "Enter tine in mins, eiduding delay (aai 1450 "jtn: IF t«>1450 THEN 60 TO 780710 LET ntics=10: IF tn>29 THEN LET r.tis=25: IF tn>72.5 TT£N LET ntics=50: IF tn>145 T®( LET r.tics=100: IF tm>2?0 THEN LET ntics=25 0: IF tn>725 THEN LET ntics=5M720 LET nf0=.81*ntics: LET tf=2.08001*nt0: LET nr=INT (tn+3080/ntics): LET nro=nr/255: LET q=nrp: LET pkn=0: LET nba=pkn 738 LET yf=5cf740 LET ts=del: LET tt=68*tm: GO SUB 3900: PRINT AT 1,25:"???????';AT 2,25:*???????': FOR x=l TO 251 STEP 5: PLOT x,2l: NEXT i750 FOR y=36 TO 160 STEP 15.3: PLOT l,y: DRAM l,z: NEXT y755 LET x=ntics: LET every=(x<500): PC«E a3-8,every: IF NOT every THEN LET x=250760 POKE a3-l,i: POKE a6+2.x: POKE a63,i: LET a=FN da6,!3): LET a=FN d(a3-5,a3)773 LET «=21-yf*410: POKE a6+4,l 780 LET y=x+yf*USR 65010 798 IF y>174 THEN LET y=174+FEEK 65805 800 IF v<U THEN LET y=9813 PLOT INVERSE !::,v: PALISE 5: LET i=IN 31: IF IIKEY**” AND i<>2*INT (i/2) TH01 PLOT z,y: GO TO 780 820 POKE a6+4,z: RANDOMIZE USR 64860: IF NOT del THEN GO TO 850 325 PRINT AT 2,26:del338 LET t=INT ((USR 64831+65536*0>/58): PRINT AT 1,26: INVERSE I;t: IF IWCEYi=*o" THEN LET del=f: 60 TO 850 348 IF K'del THEN 60 TO 330354 IF INKEYtO"" TO! GO TO 850852 POKE a6+7,l: IF NOT every THEN LET xt=z355 POKE 23672,z 768 FOR i=l TO nr872 IF every THEN LET r=USR 65018-418: GO TO 376874 POKE a6+7,xt: LET r=USR 65818-418: LET <t=NOT it: IF xt THEN 60 TO 874 376 IF i<Q THEN GO TO 918380 LET y=yf*r+2i: IF y>174 THEN LET y=174+PEEK (6+5)890 IF y<18 THEN LET y=99C0 CRAW l.y-PEEK 23678: LET q=q+r,rp910 PAINT INVERSE IjAT 2,25:INT (. 6 4 2 5 1 + r ) A T 1,26:INT (i*tf)+del: IF INKEY*="s" THEN LET nr=i: GO TO 930 924 NEXT i9.30 60 SUB 4854: LET as=a3: LET af=as+2*r,r: LET a=FN d(a3-3,af>: LET a=FN d(a3-7,del>18C4 FAINT #z;AT z,z:"Print screen Oqtions"1018 LET c$=INKEY$: IF c$="p" THEN 60 SUB 4385: GO TO 10881820 IF c*="o“ THEN RETURN1838 GO TO 10181988 REM Display pages1990 LET paqe=z2800 LET pade=paqe+l: IF paqe=3 THEN LET paqe=l 2818 IF paqe>I TflEN 60 TO 2188 ' '2018 REM Paqe 12830 a s : FAINT AT 1,26;"Paqe 1";AT 2,z;"Ref ."” ,Da»e“’"Operator"’'3anpie:"” ” 3ample size ul"”2045 FAINT ’“Column no.’:TAB'18:"Length m"’* diem. nn":TAB 19:"T(ov)";TAB 30:" K"” 'Salt soln."”Xhunidity'” "Packing" TAB 6; "mesh"2'054 PRINT AT 28,1:"Other paqe Print-out Exit"2898 LET r$="3357?12153635Tl": LET nl=I: LET n2*13: LET rowl=2: LET nc=r,2-n!+4 2095 SO TO 2208 2098 REM Paqe 22188 CLS : FAINT “Carrier 2as“:AT 1,1:“Inlet press":AT 1,19:"am Hq“:AT 2,1:"Rate":AT 2,21:"»1 s-l":AT 3,1:”PW(f)";AT 3,19:“PW(c)"2118 PRINT AT 5,z;"Detectof";AT 5,21:"Off":AT 6,i:''Rar,qe“:AT 6,21:“Att ’2128 FAINT AT 8,::"Temperature":AT 8,18:"FIown.":AT 9,r'!"Det":AT 9,21:*Ini“:AT 12,z:"Adsorbent":AT 12,21:"q"2138 PRINT AT 14,z:"Solute,I Voi":AT 14,17:“ ul Den AT S6,z:”Solute,g Vol":AT 16,17:"ml T";AT 16,30:"'K"
264

GCAD PROGRAM CONT’D
2140 FAINT AT 18,1:"Atms.press.AT 18,19:"m* Hq“:AT 19»1:‘RMM solute";AT 21,1;“Other page Print-out Exit" 2198 LET r$="3331512151218615153511’: LET r.l=14: LET n2=33: LET rowl=z: LET nc=n2-nl+4 22« 60 SUB 24802220 LET row=rowl: LET c=l: LET dnl=c: LET n=z 2225 60 SUB 24502230 LET itn=n+l-(dnl=-l)+(paoe=2)*132235 IF (paged AND itn>13) Oft (page=2 AND itn>33) THEN 60 TO 2300 2240 INPUT fcS): LINE i$: PRINT AT row,12*c;">";: LET x$=c$+x$2245 60 SUB 2580 2250 PRINT PAPER 6:x$2255 LET dn=l: 60 SUB 2470: GO TO 2225 2300 IF paqe=2 THEN LET itn=itn-202305 IF ith=14 THEN SO TO 20802310 IF itn=15 THEN LET y=167+8*(oaoe=2): LET r=18+2*(page=2>: (30 SUB 4810: 60 TO 22252315 IF itn=16 THEN CLS ': 60 SUB 4850: OVER2398 ftEN Retrieves & orints parameters2480 LET row=rowl: LET c=l2485 FOR i=nl TO r,2: FAINT AT row,l2*c+l:2410 FOR a=a0+VAL p$(i)+l TO a0+VAL p$(i+l): PRINT PAPER 6;CHR$ PEEK a;: hEXT a 2420 LET c=c+VAL r$(i-nl+l)2430 IF c>2 THEN LET c=c-3: LET ro«v=ro«v+l: 60 TO 24382435 NEXT i2448 RETURN2443 REN Move cursor2450 PRINT AT row,12*c: FLASH 1;">": PAUSE 52455 LET c$dNKEY$: IF c$="“ THEN GO TO 24552456 IF c$=CHR$ 13 THEN LET c$=""2460 IF c$<CHR$ 8 OR c$>CHR$ 11 THEN RETURN2465 LET dn=(c$=CHft$ 18)+(c$=CHR$ 9)-(c$=CHR$ ll)-(c$=CHR$ 3)2470 LET n=n+dn*<dn=dnl): LET dnl=dn: PRINT AT row,12*c;“ "2475 IF NOT n Oft n=nc THEN LET r.=n-dn: GO TO 2458 2480 LET c=c+dn*VAL r$(n)2485 IF c>2 OR c<z THEN LET c=c-3*dn: LET row=row+dn: GO TO 2485 2490 60 TO 2450 2493 REM Poke paran.2580 LET rl=VAL p$(itn): LET r=VAL p*<itn+1)—rl: LET o=a0+rl 2585 LET p=LEN i$: IF p>=r THEN LET x$=x$( TO r>: 60 TO 2515 2510 LET x$=x$+s$( TO r-p)2515 RANDOMIZE USR 64818 2550 RETURN2698 REM Ret. time S/R2700 POKE 65223,thold: LET a=FN d(651S7,a2): LET a=FN d(65l60,380): REM increment for ac 2785 LET a=FN d(a6+6,z): LET a=FN d(a6+3,a3)2710 LET c0=0: LET f2=i: LET a=FN d(a6+2,a)2715 LET da=USfi 65148: LET a=FN p(a6+2)2720 LET s=FN p(a+da)-FN p(a): LET a=a+da: IF a>a2 THEN RETURN2725 IF s>t THEN 60 TO 27182730 IF s>-t T)£N LET c0=c0+l: GO TO 27202735 60 TO 27582740 LET s=FN o(a+da)-FN p(a): LET a=a+da: IF a>a2 THEN RETURN2745 IF s>=z THEN GO TO 27102758 LET f2=f2+l: IF f2<t THEN 60 TO 27482755 LET ret=FN t(a-(t+c0/2)*da): LET ar=FN a(ret)2760 RETURN 2798 REM Erase file2800 CLS : PRINT “Press"” " f to erise floppy file"’" s to erase silicon file"’" r to return to options'”2818 LET c$=INKEY$: IF c $ = V THEN RETURN2828 IF c$ = 's’ THEN CAT !: 60 TO 28582838 IF c$<>"f* THEN 60 TO 28052848 RANDOMIZE USR disk: REM : LIST2858 PRINT 48:"Press a key": PAUSE z2868 INPUT “Name? oress ENTER to abort:":x$-2878 IF i$=’“ THEN RETURN2888 IF c$=“f" THEN RANDOMIZE USR disk.: .REM : ERASE x$CGD£2890 IF c$=’s" THEN ERASE ! x$>980 RETIRN3198 REM Save data on diskdr.3288 PRINT "Routine for savinq c'qm on disk:"”3210 LET r$=“": FCA a=a8+l TO'a0+5: IF PEEK a<>32 THEN LET r$=r$+CHRt PEEK a 3215 NEXT a: IF r$="" THEN FAINT "Reference? Select option 1": RETURN 3228 FAINT "Name of file: ";r$’"Chromatogram starts at ":FN t(a);“ s"3230 IhR.IT "Do you want the disk catalogue? (y/n)"s LINE c$: IF c$0"y" THEN (30 TO 3248 3235 RANDOMIZE USR disk: REM : CAT 3248 INPUT "Store from t=? (sec) ":ts3245 LET al=FN a(ts): IF aKa3 uR (al)a3 ANT* Ka3+320) 60 TO 3248 3250 INPUT "to t=? (sec) :tf3255 LET a2=FN a(tf>: LET r,a=a2-al+322: IF a2>64?98 OR r,a<322 THEN 60 TO 3248 3268 LET a=FN d(a3-5,al): LET a=FN d(a,a2): LET v=51-328 3278 IF aiOa3 THEN LET a=FN d(65394.y>: RANDOMIZE USR 6539032*0 CL? : RANIUMIZE USA disk: REM : ^AVE rtCuDE y,na
265
GCAD PROGRAM C O N T ,D
3235 IF al<>a3 THEN RANDOMIZE USR 653903290 PRINT ’"File ";r<:* saved (";rias“ bytes)*: GO TO 35803393 REM load chro/iatoqraii3408 INPUT "Do you want’the catalogue? (y/r.)’; LINE c<: IF c*=*y" T}£N RANDOMIZE USR disk: REM : CAT3418 INPUT "Enter reference: ";ft3420 RANDOMIZE USR 65415: REM Clear temorv3438 a s : PRINT FLASH l:”Loadino*: RANDOMIZE USR disk: REM : LOAD ftCODE3448 LET y=USR 65435: LET as=y+320: IF y<>a0 THEN LET a=FN d(65394,y): RANDOMIZE USR 653903458 GO SUB 4858: LET nba=z: LET pkn=Tiba: LET taas=riba: LET every=PEEK (a3-o): LET ntics=(l+NOT every)*PEEK (a3-I): LET nt0=.01*ntics: L£T deI=FN p(a3-7): LET af=FN pta3-3): LET ts=FN t(as): LET tf=FN ttaf): LET yf=scf3460 a s : PRINT "Chrooatogra# ":ft” "Fron *;ts;“ to **,tf;" sec."3588 PRINT tz:"Dotions'3510 IF INKEYtOV THEN GO TO 3510 3520 RETURN3798 REM Horizontal plat, baseline3880 LET nba*z: LET nc=z: LET ts=z: LET ti=5*ntics: LET h=l3885 IWMJT "Start at? (sec) ";ts3810 INPUT ("Tine scale - how aar.y ":ti;“ sec.*,"units? (1-36) *):t: IF t<l OR t>36 THEN GO TO 38103315 LET f=5: LET o=410: LET tt=l.02*t*ti: POKE 46512,2*INT t-13825 LET p=FN a(ts): IF p>af THEN a s : PRINT "End of chroieatografl”: GO TO 38053830 GO SUB 3988: REM Box etc.3335 POKE 46584,f: IF o<z LET o=z3848 RANDOMIZE USR drw3845 IF h THEN PRINT #z:AT z,z;Expand Forward Start OptionsContract Back Print sore Help"3347 IF NOT h THEN PRINT #z;AT z,z;“cursor keys to nove, then Read Integrate cAlculate 6as Help"3350 LET c*=INKEY*: IF c*=*" TIEN GO TO 3850 3852 LET cde=CODE c*3855 IF cde=10 OR cde=ll OR c*=*e" OR c*="c* TPEN GO SUB 4088: GO TO 33353868 IF cde<18 THEN GO SUB 4388: GO TO 33553865 IF c*=“o" THEN aS': RETURN3878 IF c*=*p" THEN GO SUB 4885: GO TO 38503375 IF c*=“s" THEN GO TO 388533:50 IF c*="i" THEN INVERSE 1: RANDOMIZE USR drw: INVERSE 8: GO SUB 5188: RANDOMIZE USR drw: GO SUB 5880: GO TO 38483882 IF ct=*h" THEN LET h=NOT h: GO TO 38453835 IF c*="a" THEN LET opt=3: a s : GO SUB 5220: RETURN3&?5 LET ts=ts+<c*=,f">*1*ti-<ci="b,)*t’*ti: GO TO 33253898 REM Box 1 scale3988 CIS : LET i=tt: LET d»=103910 IF i<126 THEN GO TO 39483920 LET x=x/2: LET dt=2*dt: LET e*=STR* d»: IF e*< TO 2>="20" THEN LET dt=1.25*dt3938 GO TO 3918 »3948 LET dx=253*dt/tt3958 PLOT z, 10: DRAM 255,z: DRAM z,164: DRAW -255,z: DRAW z,-l64: PRINT AT 21,z;ts3968 LET r,=I: LET i=z3970 LET i=n*di: IF i>255 THEN RETURN3988 PLOT x,l0: DRAW z,-2: IF i AND x<239 THEN PRINT AT 21,INT <x/8>-2;1s+n*dt3970 LET r,=T.+l: LET i=NOT i: 80 TO 3970?3998 REM Eipand etc.4088 INVERSE l: RANDOMIZE USR drw: INVERSE z: IF cde<12 THEN LET o=o+R*(l+f)*(cde=10)-3*<l*f)*<cde=ll): "RETURN4818 LET f=f+(f<10)*(c*="c")-(f>0)*(c*=,e*): RETURN4298 REM Cursor/baseline4308 IF bad=8 THEN LET nba=04305 RANDOMIZE USR 4661?4318 LET c*=INKEY*: IF c*="* THEN GO TO 4310 4315 LET cde=CODE c*4320 IF cde=8 OR cde=9 THEN POKE 46635,3+<cde=9>: RANDOMIZE USR 46628: GO TO 4310 4338 IF c*<>"g* AND c*<>"r“ THEN RANDOMIZE USR 46623: RETURN : RBI Erase cursor 4348 IF nba=5 THEN PRINT AT l,4:"No Jtore": GO TO 4310 4o45 LET bad=p+2*INT t*FEEK 236774358 IF ct="q THEN LET toas=FN t(bad): FRINT AT :,z:*q“:4380 4355 LET nba=nba+l: PRINT AT z,z:nba 4368 IF bad)af-4 TT€N LET bad=af-44370 LET s=z: FOR b=bad-4 TO bad+4 STEP 2- LET s=s+fN q(b): NEXT b: LET b(2,nba)=s/54375 LET b(l,nba)=bad4338 IF DKEYtO"" THEN SO TO 43804398 60 TO 43184748 REM Epson,t> blank lines4758 FOR i=l TO b: LPRINT : NEXT i: RETUIRN47'98 REM Screen duap to Epson4808 LPRINT ft” ”4305 LET y=175: LET r=224818 IF y>175 OR r>22 THEN PRINT AT z,z: FLASH 1:"Printer o/r“: RETURN 4315 LET a=FN d(23349,295): LPRINT :CHR* 27;"3*;CHR* 24;: POKE 65343,y4820 FOR i=l TO r: LPRINT :CHR* 27:"K":CHR* zsCHRS 1:: RANDOMIZE USR 65340: LPRINT CHR* 13: NEXT i 4825 LPRINT :CHR* 27:"2";: POKE 23349,36: LFRINT : LPRINT : LPRINT : RETURN 4843 REM Put ref. & date in ft4858 LET f*=““: FOR ;=a8+l TO a0+13: LET f*=ft+CHR* PEEK j: IF j=a3+5 THEN LET f*=f*v "4855 NEXT j: RETURN4993 REM Calc. Adsorption Iso.3003 IF nba\>3 THEN RETURN
266
GCAD PROGRAM CONT’D
5810 LET a=FN d(a6+2,b(l,l)>: LET *=INT (btl,31/256): POKE 65283,*: POKE 65278,b(1,3)-256+*5020 LET area=USR 65240+65536*P£EK 65004-(b(2,I)+b(2,3))*(b<l,3)-b(l,l))/45025 LET area=area*ntics/505038 PRINT AT 3,18;’area ';INT (area*.5)5090 LET nc*l: LET u*o: LET v=p: LET o=ar: LET p=b(l,3): LET end=USR 64658: LET o=u: LET p=v: RETURN5098 REM Baseline correction5180 IF nba<>3 THEN RETURN5185 FR1NT AT l,18;*q.peak *;tqas; s"5110 LET s=b(2,3)-b(2,l): IF ABS s<2 THEN (30 TO 52105115 IF s>256 THEN PRINT AT 3,8; FLASH li"Baseline slope too great*: INPUT "press 0tTER";c4: RETURN5120 POKE 65004,ABS 5-1: POKE 65085,s>85138 LET u=o: LET v=p: LET q=b(I,3)+2: LET p=INT ((b(l,3)-b(l,I))/(A8S s-l)/2)5148 LET o=b(l>l)+2*INT (p/2)5150 RANDOMIZE USR 64588 ‘5160 LET nl=y: LET n2=25178 FCft i=l TO 3 STEP 2: LET s=z5180 FOR j=b(l,i) TO b(l,i)+nl STEP n2: LET s=s+FN p(j): NEXT j5198 LET b(2,i)=s/5: LET b(l,i)=b(l,i)+2*n25200 LET nl=-r.l: LET r.2=-r.2: NEXT i5285 LET ar=b(l,2J: LET ret=FN ttar)5210 PRINT AT 2,13;“ret.t. “:INT (ret+.5);* s": LET o=0: LET p=v: RETURN5213 REM Calc, of h (, A(h): f(l)=T(ov) f(2)=in.p. f(3)=rate f(4)=PW(f) f(5)=PW(c) f(6)=T(fl) f(7)=wt.adsorb. f(8)=vol.li. f(10)=vol.qas f(ll)=T f(12)=at».p. f(13)=RNM5220 a s : PRINT Iz: FLASH l;"Retrieving data*: LET j=l5223 FOR i=9 TO 33: IF (i>9 AND i<15) OR (i>18 AND i<24) OR i=25 OR i=26 THEN GO TO 52585225 LET *5=*"5230 FOR a=a8+VAL p*(i)+l TO a8*VAL p*(i+l): LET x*=i*+CHR* PEEK a: NEXT a 5235 IF CODE *4=32 THEN LET f(j)=z: GO TO 5245 5248 LET f(j)=VAL x<5245 LET j=j+l 5258 NEXT i5255 PRINT #2 :AT z,z;“Additional correction"’"rquired? (y/n)"5268 LET c$=INKEY$: IF c<=** TI£N GO TO 5260 5265 LET x=l: IF c4=“y* THEN LET i=f<2)/<f(2)-f (5))5278 LET y=f(l)/f(6>*(f(12)-f(4>)/fI12)*i: LET x=f<2)/f(12): LET flow=f(3)/100&M.5*(i*i-l)/(i*x*x-l)*y 5275 IF f<10)Oz TFEN GO TO 5290 5238 LET w2=.001-*f(8)*f(9):. GO TO 5305 5298 LET vl=f(10)*.00l5308 LET mrt=f(131/62.364/f(11): LET w2=f(12)*vl*«rt 5385 LET fq=v2/(flou*area): LET fs=ntics/50*w2/(f(7)#area)5387 LET p=2: INPUT Pw2=";w2:" Press ENTER *1: LINE c4,"Enter y to print table LItE ci: IF cS=*y“ THEN LET p=3: LET b= 05310 LET br=b(2,3): LET na=end-ar: LET da=2 5320 IF r.a/da>68 THEN LET da=da+2: GO TO 5320 5325 INPUT “Print 1st r<: r,=? (99 for all) “:nv5>j0 LET aqas=FN a(tqaB): LET jq=3: LET s=z: LET i=s: LET j=l: LET n=j: LET dn=da/2: LET base=un*br 5332 PRINT’#q;‘Adj. flow rate *:fIou:"5335 PRINT *p:“ C(q) '■ C(s) slope": PRINT 12; FLASH 1?" *5340 FOR a=er,d TO ar STEP -25350 LET r=FN p(a): LET s=s+r: LET i=i+l: IF i<dr. THEN GO TO 53905355 IF r<br+2 THEN GO TO 53305360 LET h(i,j)=fq*(r-br): LET h(2, j)=fs*(s-ri*base+(a-aqas)/2*(r-br)): IF j>nv THEN GO TO 5378 5363 LET x=h(l,j): GO SUB 7988: PRINT Id;* *;: LET *=b(2,j): GO SUB 7900: PRINT #q;* *;5365 LET x=h(2. j)/h(l,j): GO SUB 7980: PRINT #p5370 LET j=j*l5388 LET n=n+l: LET i=z5385 IF INKEY*=*s* THEN LET a=ar 5390 NEXT a5395 IF p=3 THEN LET p=25397 BEEP .1,30: IF INKEYtO"" THEN GO TO 53975408 INPUT "Press ENTER for plot"; LINE c«5420 LET j=j-l: LET tr,o=j: LET e»="C(q>": LET g«="C(s)“: GO SUB 7000: GO SUB 5600 5438 GO TO 1000: REM End option 5598 REM Plot nx points etc.5680 INPUT "NK. ocinf5 r'fd to continue)*;ni: IF NOT nx TICN RETURN 5610 LET j=n*: GO SUB 78005620 INPUT “Least sq? (y/r,l LINE ci: IF c*="v" THEN '30 SUB 68005638 60 TO 56005793 REN C(s) vs. P(2)5388 CLS : PRINT FLASH I;" ": FOR i=I TO tnp: LET h(l,i)=h(l,i)*.03235*f(l)/f(13>: NEXT i5318 LET j=tr,q: LET e*="p(2)": GO SUB 7888: GO SUB 56085328 a s : PRINT FLASH 1:* •: FOR i=l TO tnp: LET h(2, i)=h(l, i)/h(2, i): NEXT i5s38 LET j=fno: LET qt=*p2/Cs": GO SUB 7088: GO SUB 56885988 60 TO 1888: REM'End option5998 REM Least sq.6888 LET sl=z: LET 5L-z • LET s3=z: LET s4=z6023 FOR i=I TO j: LET sl=sl*b(i, i): LET s2=s2*h<2, i): LET s3=s3+h(l,i>*h<2, i>: LET s4=s4+h(I,i)*h(l,i): NEXT i6838 LET det=j*s4-sl*si: LET sl=(j*53-sl*52)/det: LET it=(s2*s4-sl+s3)/det6848 LET x=it: PRINT AT 4,1;"int.=“ 1: bO bUB 7900: LET <=sl: PRINT ’AT 5,1:"sId.="«: bO SUB ^9886858 bO stJB "288: PETUnN
267
q. f(9)=dens
3: GO SUB 475
GCAD PROGRAM C O N T ’D
6198 REM Snooth620® LET a2=FN a(ff): LET na=a2-a0+2 6210 LET a=FN d(a3-5,a3): LET a=EN d(a,a2)6260 SAVE ! "z’CCDE a8,na6300 RANDOMIZE USR disk: REM :load"qcsn.andy"6310 STOP 6998 REM Plots7009 CIS : PLOT 2,2: DRAW 253,z: DRAW z,173: DRAW -253,z: DRAW z,-173: PLOT 180,2: DRAW z,4: PLOT 2,156: CRAW 3,07010 LET i=z: LET y=x: FOR i=l TO j: IF h(l,i)>i THEN LET x=h(I,i)7020 IF h(2, i)>y TFEN LETy=h(2,i)7025 NEXT i7030 LET r=249/x: LET s=169/y7050 LET i=178/r: PRINT AT 20,27:e*:AT 20,18;: GO SUB 79007860 LET x=154/s: FRINT AT l,l;q$;AT 2,1;: GO SUB 79007070 FOR i=l TO j: LET x=r*h(l,t)+2: LET y=s*h<2,i)+2: GO SUB 7500: NEXT i7198 REM Print-out?7200 PRINT 10;"Press p tor qrint-out"7285 LET c*=IM<EY*: IF c4=“" THEN GO TO 7205 7210 IF ct=’pH THEN LET b=2: GO SUB 4750: GO SUB 4880 7220 RETURN 7493 REM Plot *7588 PLOT x-2,y: DRAW 4,z: PLOT x,y-2: DRAW z,4: RETLIRN 7893 REM No. fornattino7980 LET q=SGN x: IF NOT q THEN LET x4="8.0“: GO TO 79307905 LET xq=LN (ABS ll/LN 10: LET nq=INT iq: LET c*=STK$ (INT (18Ajq*t0'(xq-nq} + .5)/ir jq)7910 IF c4=’10" TPEN LET c4=“1.0": LET nq=nq+l 7915 IF LEN c«=l THEN LET c*=c$+".0"7920 IF LEN c«jq+2 THEN LET c«=c<+"0": GO TO 79157925 LET it=("-" AND (q=-l))+c4+"E"+("+" AND nq)=z)+C-" AND r,q<0)+STR$ (ABS nq)7930 PRINT #p; i*;: RETURN7993 REM Data for lengths of boxes(opt.l)8888 RESTORE 8050: LET r=z8010 FOR n=l TO 34: READ x<: LET r=r+VAL x$: LET p«n)=STR$ r: NEXT n 8015 LET s$=“8020 RETURN8050 DATA "8","5","8",*18","30","3","3","3","1","5","19",M5","19",*8"8855 DATA "2","5","7","5","5","7","2","4","4","3","5"."3","3",*7","4","5","4","5","5","7"9080 a s : INPUT "OK to CLEAR It enter TRDOS ?":c«: IF c$<> "y" THEN STOP 9010 CLEAR : RANDOMIZE USR 15616 9020 STOP9050 a s : PRINT "Machine code version:"’PEEK 65453;"."?PEEK 5454;".";FEEK 65455
268

8.3. APPEND1X2 PUBLISHED WORK
269
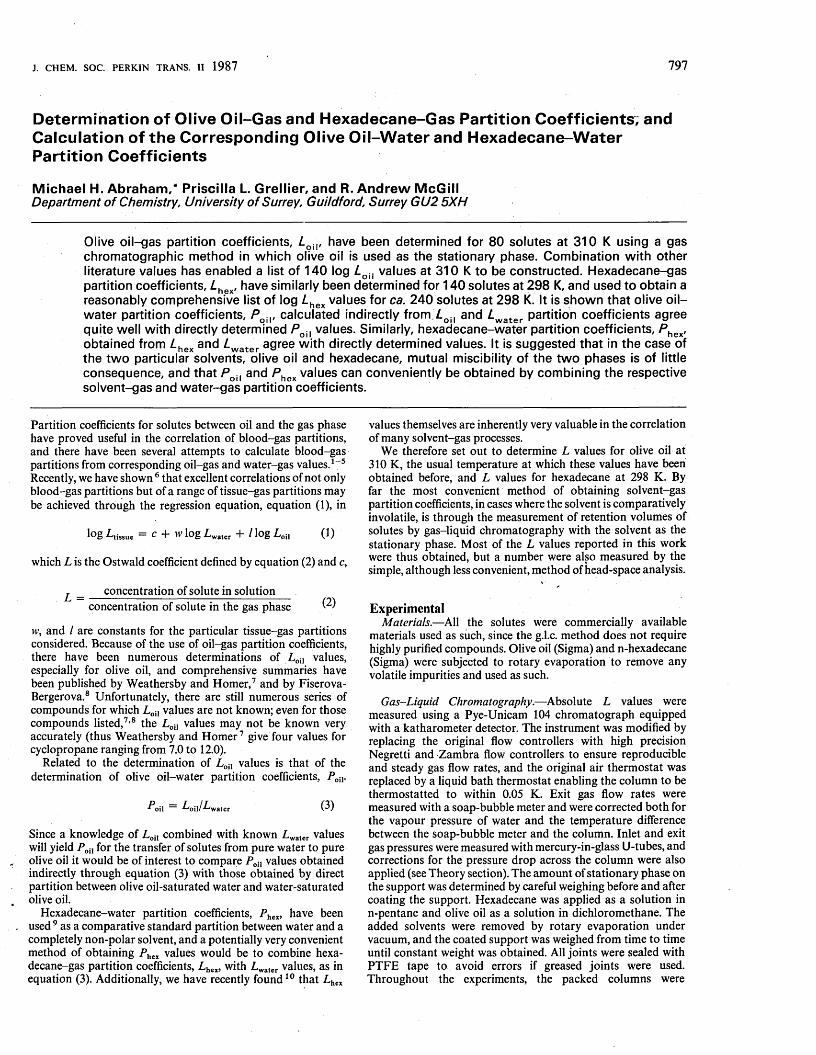
J. CHEM. SOC. PERKIN TRANS. II 1987 797
Determination of Olive Oil-Gas and Hexadecane-Gas Partition Coefficients; and Calculation of the Corresponding Olive O il-W ater and Hexadecane-Water Partition Coefficients
Michael H. Abraham,* Priscilla L. Grellier, and R. Andrew McGillDepartment of Chemistry, University of Surrey, Guildford, Surrey GU2 5XH
Olive o il-g as partition coefficients, LoU, have been determ ined for 80 so lu tes a t 3 1 0 K using a gas ch rom atographic m ethod in w hich olive oil is used as th e stationary phase. C om bination w ith o ther literature values has enabled a list of 140 log Loil values a t 310 K to be constructed . H ex ad ecan e-g as partition coefficients, Z.hex, have similarly been determ ined for 140 so lu tes at 298 K, and used to obtain a reasonably com prehensive list of log Lhex values for ca. 2 4 0 so lu tes a t 298 K. It is sh o w n th a t olive oil— w ater partition coefficients, Poii, calculated indirectly from ,Loii and Lwater partition coefficients agree qu ite well w ith directly determ ined P oil values. Similarly, hex ad ecan e-w a te r partition coefficients, P hex, ob tained from Lhex and Lwater agree w ith directly determ ined values. It is su g g ested th a t in th e case of th e tw o particular so lvents, olive oil and hexadecane, m utual miscibility of th e tw o p h ases is of little co n sequence , and th a t Pon and P hex values can convenien tly be ob tained by com bining th e respective so lv en t-g as and w a te r-g a s partition coefficients.
Partition coefficients for solutes between oil and the gas phase have proved useful in the correlation of blood-gas partitions, and there have been several attempts to calculate blood-gas partitions from corresponding oil-gas and water-gas values.1-5 Recently, we have shown 6 that excellent correlations of not only blood-gas partitions but of a range of tissue-gas partitions may be achieved through the regression equation, equation (1), in
log ^tissue = C + W log ■water+ / log ■oil (i)which L is the Ostwald coefficient defined by equation (2) and c,
^ _ concentration of solute in solutionconcentration of solute in the gas phase ^
w, and / are constants for the particular tissue-gas partitions considered. Because of the use of oil-gas partition coefficients, there have been numerous determinations of Loil values, especially for olive oil, and comprehensive summaries have been published by Weathersby and Homer,7 and by Fiserova- Bergerova.8 Unfortunately, there are still numerous series of compounds for which Loi, values are not known; even for those compounds listed,7,8 the L oil values may not be known very accurately (thus Weathersby and Homer 7 give four values for cyclopropane ranging from 7.0 to 12.0).
Related to the determination of LoiI values is that of the determination of olive oil-water partition coefficients, Poil.
7\>il 7'oil/7.VVater 0 )
Since a knowledge of L oil combined with known Lwater values will yield Poll for the transfer of solutes from pure water to pure olive oil it would be of interest to compare ^oil values obtained indirectly through equation (3) with those obtained by direct partition between olive oil-saturated water and water-saturated olive oil.
Hexadecane-water partition coefficients, Phex, have been used 9 as a comparative standard partition between water and a completely non-polar solvent, and a potentially very convenient method of obtaining Phex values would be to combine hexadecane-gas partition coefficients, L hex, with Lwater values, as in equation (3). Additionally, we have recently found10 that Lhex
values themselves are inherently very valuable in the correlation of many solvent-gas processes.
We therefore set out to determine L values for olive oil at 310 K, the usual temperature at which these values have been obtained before, and L values for hexadecane at 298 K. By far the most convenient method of obtaining solvent-gas partition coefficients, in cases where the solvent is comparatively involatile, is through the measurement of retention volumes of solutes by gas-liquid chromatography with the solvent as the stationary phase. Most of the L values reported in this work were thus obtained, but a number were also measured by the simple, although less convenient, method of head-space analysis.
ExperimentalMaterials.— All the solutes were commercially available
materials used as such, since the g.l.c. method does not require highly purified compounds. Olive oil (Sigma) and n-hexadecane (Sigma) were subjected to rotary evaporation to remove any volatile impurities and used as such.
Gas-Liquid Chromatography.— Absolute L values were measured using a Pye-Unicam 104 chromatograph equipped with a katharometer detector. The instrument was modified by replacing the original flow controllers with high precision Negretti and Zambra flow controllers to ensure reproducible and steady gas flow rates, and the original air thermostat was replaced by a liquid bath thermostat enabling the column to be thermostatted to within 0.05 K. Exit gas flow rates were measured with a soap-bubble meter and were corrected both for the vapour pressure of water and the temperature difference between the soap-bubble meter and the column. Inlet and exit gas pressures were measured with mercury-in-glass U-tubes, and corrections for the pressure drop across the column were also applied (see Theory section). The amount of stationary phase on the support was determined by careful weighing before and after coating the support. Hexadecane was applied as a solution in n-pentane and olive oil as a solution in dichloromethane. The added solvents were removed by rotary evaporation under vacuum, and the coated support was weighed from time to time until constant weight was obtained. All joints were sealed with PTFE tape to avoid errors if greased joints were used. Throughout the experiments, the packed columns were
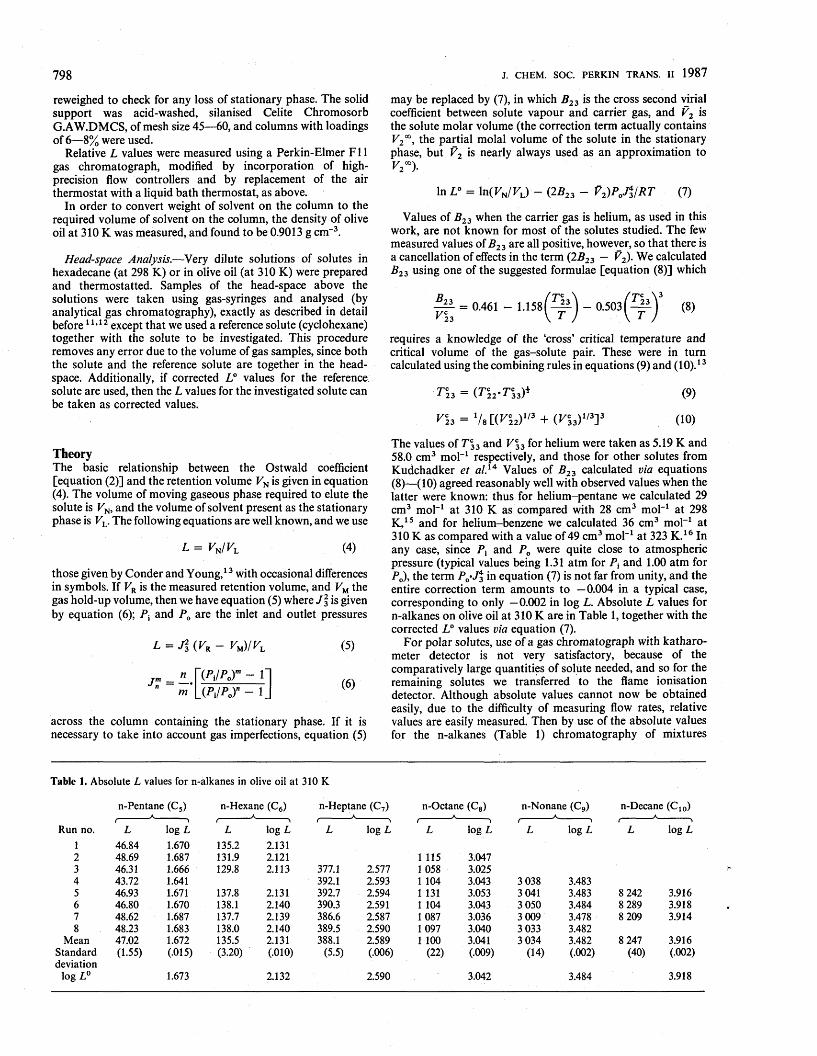
798 J. CHEM. SOC. PERKIN TRANS. II 1987reweighed to check for any loss of stationary phase. The solid support was acid-washed, silanised Celite ChromosorbG.AW.DMCS, of mesh size 45— 60, and columns with loadings of 6— 8% were used.
Relative L values were measured using a Perkin-Elmer F l l gas chromatograph, modified by incorporation of high- precision flow controllers and by replacement of the air thermostat with a liquid bath thermostat, as above.
In order to convert weight of solvent on the column to the required volume of solvent on the column, the density of olive oil at 310 K was measured, and found to be 0.9013 g cm-3.
Head-space Analysis.—Very dilute solutions of solutes in hexadecane (at 298 K) or in olive oil (at 310 K) were prepared and thermostatted. Samples of the head-space above the solutions were taken using gas-syringes and analysed (by analytical gas chromatography), exactly as described in detail before11,12 except that we used a reference solute (cyclohexane) together with the solute to be investigated. This procedure removes any error due to the volume of gas samples, since both the solute and the reference solute are together in the headspace. Additionally, if corrected L° values for the reference solute are used, then the L values for the investigated solute can be taken as corrected values.
TheoryThe basic relationship between the Ostwald coefficient [equation (2)] and the retention volume FN is given in equation(4). The volume of moving gaseous phase required to elute the solute is FN, and the volume of solvent present as the stationary phase is FL. The following equations are well known, and we use
L = FN/F L (4)those given by Conder and Young,13 with occasional differences in symbols. If VR is the measured retention volume, and Vu the gas hold-up volume, then we have equation (5) where J \ is given by equation (6); Ph and P0 are the inlet and outlet pressures
L-A (*« - Vu )/ lnm
~{PJPoT - 1]
. ( W - ij
(5)
(6)
across the column containing the stationary phase. If it is necessary to take into account gas imperfections, equation (5)
may be replaced by (7), in which B23 is the cross second virial coefficient between solute vapour and carrier gas, and V2 is the solute molar volume (the correction term actually contains V2a\ the partial molal volume of the solute in the stationary phase, but V2 is nearly always used as an approximation tof 2°°).
In L° = ln(FN/ Vl ) — (2B23 - V2) P J V R T (7)
Values of B 23 when the carrier gas is helium, as used in this work, are not known for most of the solutes studied. The few measured values of B23 are all positive, however, so that there is a cancellation of effects in the term (2B23 — V2). We calculated B23 using one of the suggested formulae [equation (8)] which
= 0.461 - 1.158 1 23T (8)
requires a knowledge of the ‘cross’ critical temperature and critical volume of the gas-solute pair. These were in turn calculated using the combining rules in equations (9) and (10).13
Tc23 = (T\2-Tl3)*
Fc23 = 1/8[(Fc22)1/3 + (F|3)1/3]2(9)(10)
The values of T c33 and V c33 for helium were taken as 5.19 K and 58.0 cm3 mol-1 respectively, and those for other solutes from Kudchadker et a l}A Values of B23 calculated via equations (8)— (10) agreed reasonably well with observed values when the latter were known: thus for helium-pentane we calculated 29 cm3 mol-1 at 310 K as compared with 28 cm3 mol-1 at 298 K ,15 and for helium-benzene we calculated 36 cm3 mol-1 at 310 K as compared with a value of 49 cm3 mol-1 at 323 K .16 In any case, since Pt and PQ were quite close to atmospheric pressure (typical values being 1.31 atm for P, and 1.00 atm for Pa), the term Pa‘J 3 in equation (7) is not far from unity, and the entire correction term amounts to —0.004 in a typical case, corresponding to only —0.002 in log L. Absolute L values for n-alkanes on olive oil at 310 K are in Table 1, together with the corrected L° values via equation (7).
For polar solutes, use of a gas chromatograph with katharo- meter detector is not very satisfactory, because of the comparatively large quantities of solute needed, and so for the remaining solutes we transferred to the flame ionisation detector. Although absolute values cannot now be obtained easily, due to the difficulty of measuring flow rates, relative values are easily measured. Then by use of the absolute values for the n-alkanes (Table 1) chromatography of mixtures
Table 1. Absolute L values for n-alkanes in olive oil at 310 K
n-Pentane (C5)A
n-Hexane (C6)A
n-Heptane (C7)A
n-Octane (C8)A
n-Nonane (C9)A
n-Decane (C 10)A
Run no.(L log L
(L log L
<L log L
fL log L
rL log L
tL log L
1 46.84 1.670 135.2 2.1312 48.69 1.687 131.9 2.121 1 115 3.0473 46.31 1.666 129.8 2.113 371.1 2.577 1058 3.0254 43.72 1.641 392.1 2.593 1 104 3.043 3 038 3.4835 46.93 1.671 137.8 2.131 392.7 2.594 1 131 3.053 3 041 3.483 8 242 3.9166 46.80 1.670 138.1 2.140 390.3 2.591 1 104 3.043 3 050 3.484 8 289 3.9187 48.62 1.687 137.7 2.139 386.6 2.587 1087 3.036 3 009 3.478 8 209 3.9148 48.23 1.683 138.0 2.140 389.5 2.590 1097 3.040 3 033 3.482
Mean 47.02 1.672 135.5 2.131 388.1 2.589 1 100 3.041 3 034 3.482 8 247 3.916Standard (1.55) (.015) (3.20) (.010) (5.5) (.006) (22) (.009) (14) (.002) (40) (.002)deviation
log L° 1.673 2.132 2.590 3.042 3.484 3.918
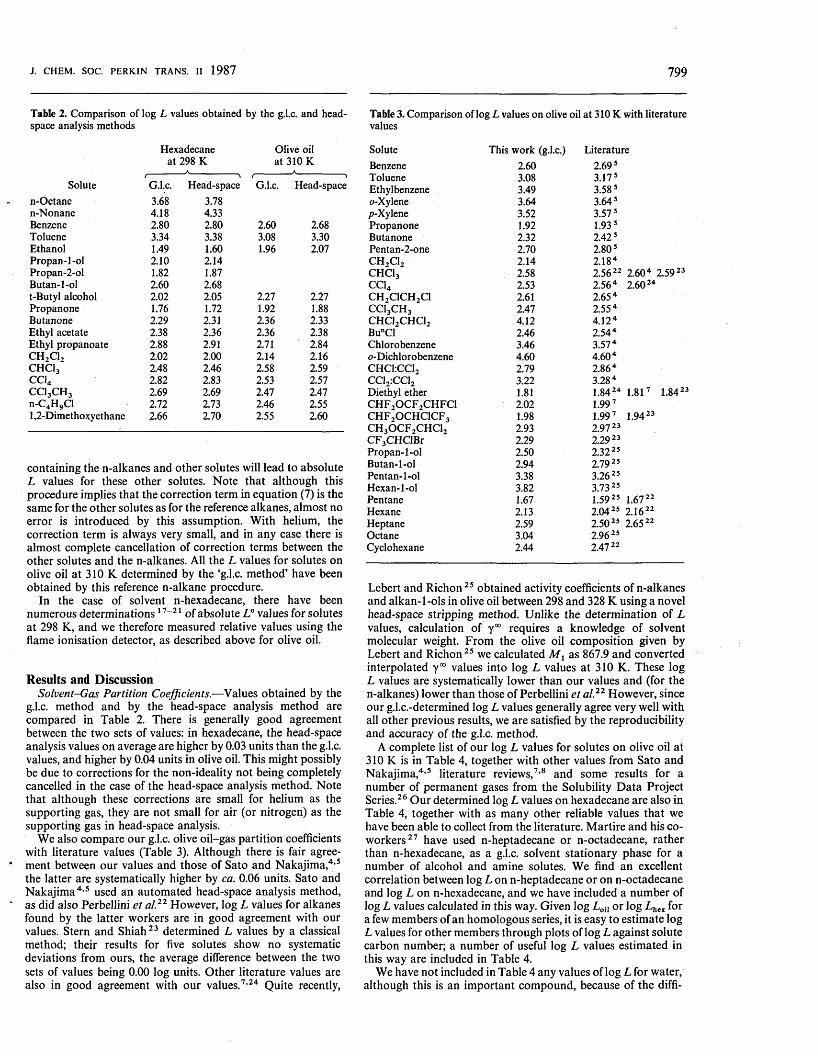
J. CHEM. SOC. PERKIN TRANS. II 1987 799
Table 2. Comparison of log L values obtained by the g.l.c. and headspace analysis methods
Hexadecane Olive oilat 298 K at 310 K
t tSolute G.l.c. Head-space G.l.c. Head-sp
n-Octane 3.68 3.78n-Nonane 4.18 4.33Benzene 2.80 2.80 2.60 2.68Toluene 3.34 3.38 3.08 3.30Ethanol 1.49 1.60 1.96 2.07Propan-1-ol 2.10 2.14Propan-2-ol 1.82 1.87Butan-l-ol 2.60 2.68t-Butyl alcohol 2.02 2.05 2.27 2.27Propanone 1.76 1.72 1.92 1.88Butanone 2.29 2.31 2.36 2.33Ethyl acetate 2.38 2.36 2.36 2.38Ethyl propanoate 2.88 2.91 2.71 2.84CH2C12 2.02 2.00 2.14 2.16CHC13 2.48 2.46 2.58 2.59e c u 2.82 2.83 2.53 2.57CC13C H 3 2.69 2.69 2.47 2.47n-C4H 9Cl 2.72 2.73 2.46 2.551,2-Dimethoxyethane 2.66 2.70 2.55 2.60
containing the n-alkanes and other solutes will lead to absolute L values for these other solutes. N ote that although this procedure implies that the correction term in equation (7) is the same for the other solutes as for the reference alkanes, almost no error is introduced by this assumption. With helium, the correction term is always very small, and in any case there is almost complete cancellation of correction terms between the other solutes and the n-alkanes. All the L values for solutes on olive oil at 310 K determined by the ‘g.l.c. method’ have been obtained by this reference n-alkane procedure.
In the case of solvent n-hexadecane, there have been numerous determinations17-21 of absolute L° values for solutes at 298 K, and we therefore measured relative values using the flame ionisation detector, as described above for olive oil.
Results and DiscussionSolvent-Gas Partition Coefficients.— Values obtained by the
g.l.c. method and by the head-space analysis method are compared in Table 2. There is generally good agreement between the two sets of values: in hexadecane, the head-space analysis values on average are higher by 0.03 units than the g.l.c. values, and higher by 0.04 units in olive oil. This might possibly be due to corrections for the non-ideality not being completely cancelled in the case of the head-space analysis method. Note that although these corrections are small for helium as the supporting gas, they are not small for air (or nitrogen) as the supporting gas in head-space analysis.
We also compare our g.l.c. olive oil-gas partition coefficients with literature values (Table 3). Although there is fair agreement between our values and those of Sato and Nakajima,4,5 the latter are systematically higher by ca. 0.06 units. Sato and Nakajim a4,5 used an automated head-space analysis method, as did also Perbellini et al.22 However, log L values for alkanes found by the latter workers are in good agreement with our values. Stern and Shiah23 determined L values by a classical method; their results for five solutes show no systematic deviations from ours, the average difference between the two sets of values being 0.00 log units. Other literature values are also in good agreement with our values.7,24 Quite recently,
Table 3. Comparison of log L values on olive oil a t 310 K with literature values
Solute This work (g.l.c.) LiteratureBenzene 2.60 2.69 5Toluene 3.08 3.17 5Ethylbenzene 3.49 3.585o-Xylene 3.64 3.64 sp-Xylene 3.52 3.57 sPropanone 1.92 1.93 sButanone 2.32 2.42 sPentan-2-one 2.70 2.80 sCH2C12 2.14 2.18 4CHCI3 2.58 2.56 22 2.60 4 2.59 2CC14 2.53 2.56 4 2.60 24C H 2C1CH2C1 2.61 2.65 4CC13C H 3 2.47 2.55 4CHC12CHC12 4.12 4.124BunCl 2.46 2.54 4Chlorobenzene 3.46 3.57 4o-Dichlorobenzene 4.60 4.60 4CHC1:CC12 2.79 2.86 4CC12:CC12 3.22 3.28 4Diethyl ether 1.81 1.8424 1.817 1.84C H F2O C F2CHFCl 2.02 1.99 7c h f 2o c h c i c f 3 1.98 1.99 7 1.94 23c h 3o c f 2c h c i 2 2.93 2.97 23C F 3CHClBr 2.29 2.29 23Propan-l-ol 2.50 2.32 25Butan-l-ol 2.94 2.79 25Pentan-l-ol 3.38 3.26 25Hexan-l-ol 3.82 3.73 25Pentane 1.67 1.59 25 1.67 22Hexane 2.13 2.0425 2.1622Heptane 2.59 2.50 25 2.65 22Octane 3.04 2.96 25Cyclohexane 2.44 2.47 22
Lebert and R ichon25 obtained activity coefficients of n-alkanes and alkan-l-ols in olive oil between 298 and 328 K using a novel head-space stripping method. Unlike the determination of L values, calculation of y°° requires a knowledge of solvent molecular weight. From the olive oil composition given by Lebert and R ichon25 we calculated A/j as 867.9 and converted interpolated y 00 values into log L values at 310 K. These log L values are systematically lower than our values and (for the n-alkanes) lower than those of Perbellini et al.22 However, since our g.l.c.-determined log L values generally agree very well with all other previous results, we are satisfied by the reproducibility and accuracy of the g.l.c. method.
A complete list of our log L values for solutes on olive oil at 310 K is in Table 4, together with other values from Sato and Nakajima,4,5 literature reviews,7,8 and some results for a number of permanent gases from the Solubility Data Project Series.26 Our determined log L values on hexadecane are also in Table 4, together with as many other reliable values that we have been able to collect from the literature. Martire and his co workers27 have used n-heptadecane or n-octadecane, rather than n-hexadecane, as a g.l.c. solvent stationary phase for a number of alcohol and amine solutes. We find an excellent correlation between log L on n-heptadecane or on n-octadecane and log L on n-hexadecane, and we have included a number of log L values calculated in this way. Given log Loil or log L hex for a few members of an homologous series, it is easy to estimate log L values for other members through plots of log L against solute carbon number; a number of useful log L values estimated in this way are included in Table 4.
We have not included in Table 4 any values of log L for water, although this is an important compound, because of the diffi-
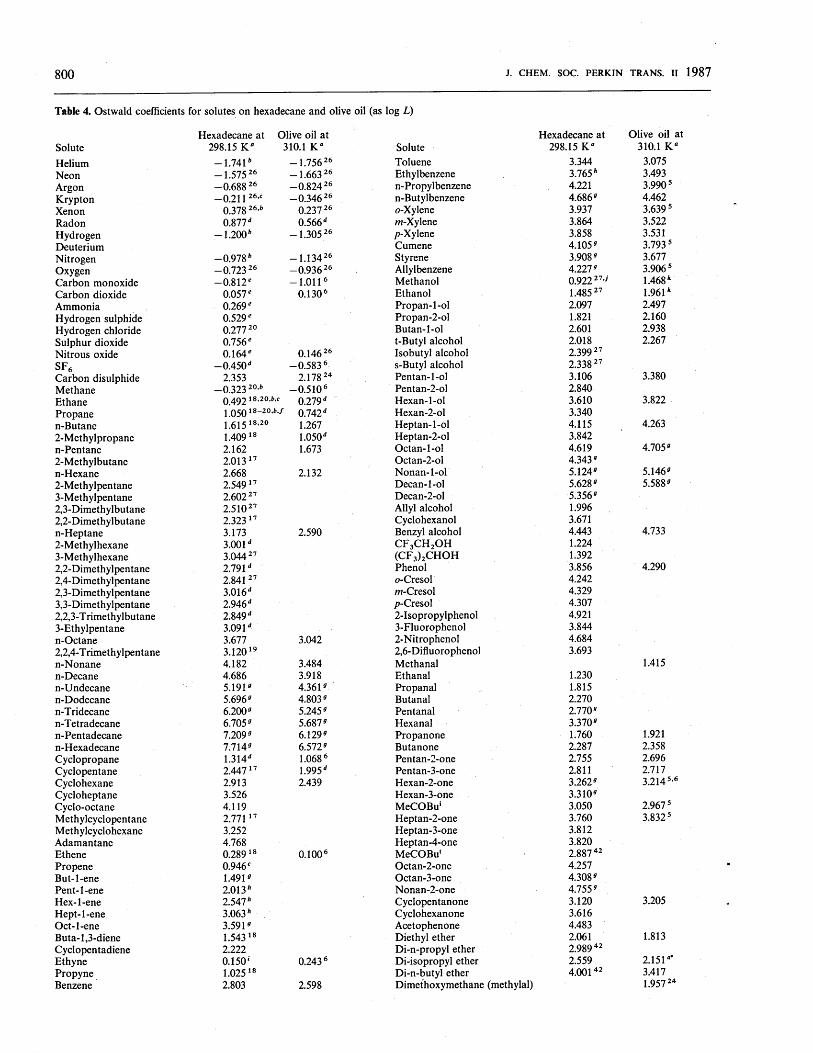
800 J. CHEM. SOC. PERKIN TRANS. II 1987
Table 4. Ostwald coefficients for solutes on hexadecane and olive oil (as log L)
Hexadecane at Olive oil atSolute 298.15 K “ 310.1 K “
Helium -1.741* -1 .7 5 6 26Neon -1 .575 26 -1 .663 26Argon -0 .688 26 -0 .8 2 4 26Krypton -0 .2 1 1 26-c -0 .3 4 6 26Xenon 0.378 26'b 0.237 26Radon 0.877'' 0.566"Hydrogen — 1.200fc -1 .305 26DeuteriumNitrogen - 0.978 * —1.134 26Oxygen -0 .723 26 —0.936 26Carbon monoxide —0.812e —1.0116Carbon dioxide 0.057e 0.130 6Ammonia 0.269eHydrogen sulphide 0.529cHydrogen chloride 0.277 20Sulphur dioxide 0.756eNitrous oxide 0.164e 0.146 26s f 6 -0 .450" -0 .583 6Carbon disulphide 2.353 2.178 24Methane —0.323 20b —0.5106Ethane 0.49218-20-'’-f 0.279"Propane 1.05018- 20-i,’/ 0.742"n-Butane 1.6151820 1.2672-Methylpropane 1.40918 1.050"n-Pentane 2.162 1.6732-Methylbutane 2.01317n-Hexane 2.668 2.1322-Methylpentane 2.549173-Methylpentane 2.602 272,3-Dimethylbutane 2.510272,2-Dimethylbutane 2.32317n-Heptane 3.173 2.5902-Methylhexane 3.001"3-Methylhexane 3.044 272,2-Dimethylpentane 2.791"2,4-Dimethylpentane 2.841 272,3-Dimethylpentane 3.016"3,3-Dimethylpentane 2.946"2,2,3-T rimethylbutane 2.849"3-Ethylpentane 3.091"n-Octane 3.677 3.0422,2,4-T rimethylpentane 3.12019n-Nonane 4.182 3.484n-Decane 4.686 3.918n-Undecane 5.1919 4.3619n-Dodecane 5.6969 4.8039n-Tridecane 6.2009 5.2459n-Tetradecane 6.705 9 5.687 9n-Pentadecane 7.2099 6.129 9n-Hexadecane 7.7149 6.572 9Cyclopropane 1.314" 1.068 6Cyclopentane 2.44717 1.995"Cyclohexane 2.913 2.439Cycloheptane 3.526Cyclo-octane 4.119Methylcyclopentane 2.77117Methylcyclohexane 3.252Adamantane 4.768Ethene 0.28918 p o o
Propene 0.946cBut-l-ene 1.4919Pent-l-ene 2.013*Hex-l-ene 2.547*Hept-l-ene 3.063*Oct-l-ene 3.5919Buta-l,3-diene 1.54318Cyclopentadiene 2.222Ethyne 0.150' 0.243 6Propyne 1.02518Benzene 2.803 2.598
Hexadecane at Olive oil atSolute 298.15 K “ 310.1 K “Toluene 3.344 3.075Ethylbenzene 3.765* 3.493n-Propylbenzene 4.221 3.990 5n-Butylbenzene 4.686 9 4.462o-Xylene 3.937 3.639 5m-Xylene 3.864 3.522p-Xylene 3.858 3.531Cumene 4.1059 3.7935Styrene 3.908 9 3.677Allylbenzene 4.227 9 3.906 5Methanol 0.922 27-J' 1.468*Ethanol 1.485 27 1.961*Propan-l-ol 2.097 2.497Propan-2-ol 1.821 2.160Butan-l-ol 2.601 2.938t-Butyl alcohol 2.018 2.267Isobutyl alcohol 2.399 27s-Butyl alcohol 2.338 27Pentan-l-ol 3.106 3.380Pentan-2-ol 2.840Hexan-l-ol 3.610 3.822Hexan-2-ol 3.340H eptan-l-ol 4.115 4.263Heptan-2-ol 3.842Octan-l-ol 4.619 4.705 9Octan-2-ol 4.343 9Nonan-l-ol 5.1249 5.1469Decan-l-ol 5.628 9 5.588 9Decan-2-ol 5.3569Allyl alcohol 1.996Cyclohexanol 3.671Benzyl alcohol 4.443 4.733C F 3C H 2OH 1.224(C F3)2CHOH 1.392Phenol 3.856 4.290o-Cresol 4.24207-Cresol 4.329p-Cresol 4.3072-Isopropylphenol 4.9213-Fluorophenol 3.8442-Nitrophenol 4.6842,6-Difluorophenol 3.693Methanal 1.415Ethanal 1.230Propanal 1.815Butanal 2.270Pentanal 2.770 9Hexanal 3.3709Propanone 1.760 1.921Butanone 2.287 2.358Pentan-2-one 2.755 2.696Pentan-3-one 2.811 2.717Hexan-2-one 3.2629 3.2145-6Hexan-3-one 3.3109MeCOBu' 3.050 2.9675Heptan-2-one 3.760 3.8325Heptan-3-one 3.812Heptan-4-one 3.820MeCOBu* 2.887 42Octan-2-one 4.257Octan-3-one 4.308 9Nonan-2-one 4.755 9Cyclopentanone 3.120 3.205Cyclohexanone 3.616Acetophenone 4.483Diethyl ether 2.061 1.813Di-n-propyl ether 2.989 42Di-isopropyl ether 2.559 2.151“*Di-n-butyl ether 4.00142 3.417Dimethoxymethane (methylal) 1.957 24
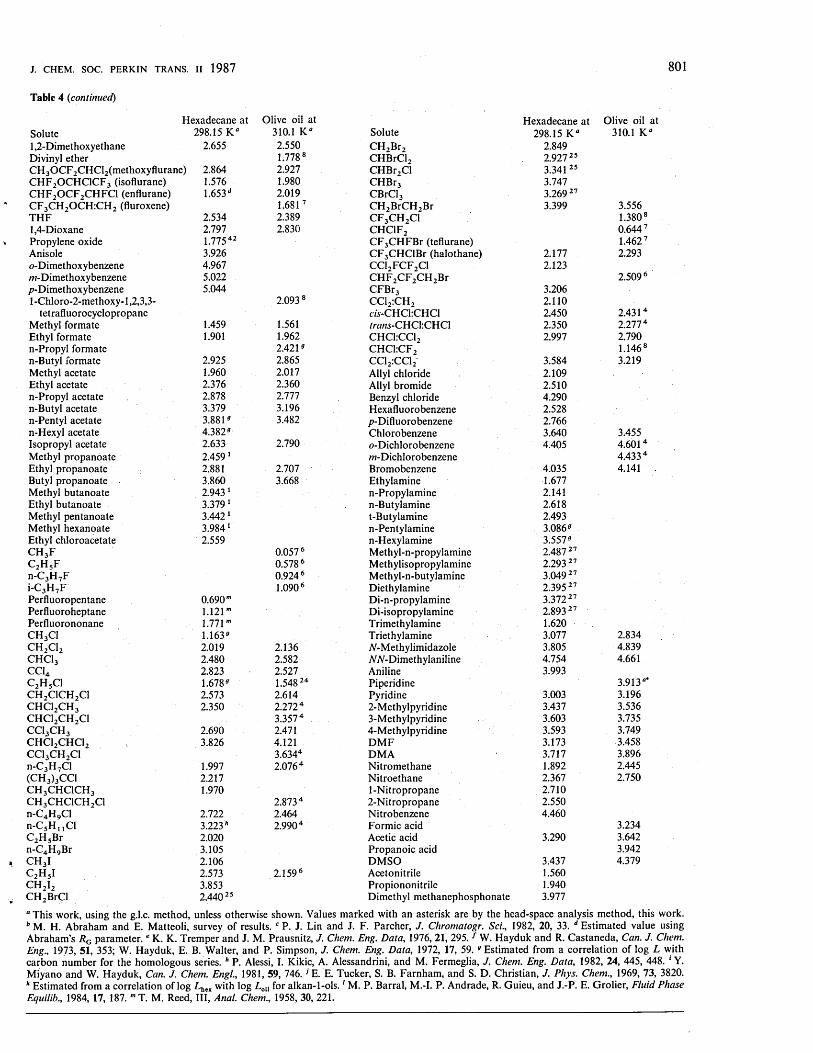
J. CHEM. SOC. PERKIN TRANS. II 1987 801Table 4 (continued)
Hexadecane at Olive oil at Hexadecane at Olive oil atSolute 298.15 K a 310.1 K a Solute 298.15 K a 310.1 K a1,2-Dimethoxyethane 2.655 2.550 C H 2Br2 2.849Divinyl ether 1.778 8 CHBrCl2 2.927 25CH 3O C F2CHCl2(methoxyflurane) 2.864 2.927 CHBr2Cl 3.34125C H F2O CH ClCF3 (isoflurane) 1.576 1.980 CHBr3 3.747C H F2O C F2CHFCl (enflurane) 1.653 d 2.019 CBrCl3 3.269 27C F3CH2OCH:CH2 (fluroxene) 1.6817 C H 2BrCH2Br 3.399 3.556TH F 2.534 2.389 C F3C H 2C1 1.380 81,4-Dioxane 2.797 2.830 c h c i f 2 0.644 7Propylene oxide 1.775 42 C F3CHFBr (teflurane) 1.462 7Anisole 3.926 C F 3CHClBr (halothane) 2.177 2.293o-Dimethoxybenzene 4.967 CC12FC F2C1 2.123m-Dimethoxybenzene 5.022 C H F2C F 2C H 2Br 2.509 6p-Dimethoxybenzene 5.044 CFB r3 3.2061 -Chloro-2-methoxy-1,2,3,3- 2.093 8 CC12:CH2 2.110
tetrafluorocyclopropane c/j -CHC1:CHC1 2.450 2.4314Methyl formate 1.459 1.561 tram-CHChCHCl 2.350 2.277 4Ethyl formate 1.901 1.962 CHC1:CC12 2.997 2.790n-Propyl formate 2.421s CHC1:CF2 1.146 8n-Butyl formate 2.925 2.865 CCl2:CCl2 3.584 3.219Methyl acetate 1.960 2.017 Allyl chloride 2.109Ethyl acetate 2.376 2.360 Allyl bromide 2.510n-Propyl acetate 2.878 2.777 Benzyl chloride 4.290n-Butyl acetate 3.379 3.196 Hexafluorobenzene 2.528n-Pentyl acetate 3.8819 3.482 p-Difluorobenzene 2.766n-Hexyl acetate 4.382 s Chlorobenzene 3.640 3.455Isopropyl acetate 2.633 2.790 o-Dichlorobenzene 4.405 4.6014Methyl propanoate 2.4591 m-Dichlorobenzene 4.433 4Ethyl propanoate 2.881 2.707 ■ Bromobenzene 4.035 4.141Butyl propanoate 3.860 3.668 Ethylamine 1.677Methyl butanoate 2.9431 n-Propylamine 2.141Ethyl butanoate 3.3791 n-Butylamine 2.618Methyl pentanoate 3.4421 t-Butylamine 2.493Methyl hexanoate 3.9841 n-Pentylamine 3.086 sEthyl chloroacetate 2.559 n-Hexylamine 3.557 sc h 3f 0.057 6 Methyl-n-propylaminc 2.487 27c 2h 5f 0.578 6 Methylisopropylamine 2.293 27n-C3H 7F 0.924 6 Methyl-n-butylamine 3.049 27i-C3H 7F 1.090 6 Diethylamine 2.395 27Perfluoropentane 0.690 m Di-n-propylamine 3.372 27Perfluoroheptane 1.121" Di-isopropylamine 2.893 27Perfluorononane 1.771m Trimethylamine 1.620C H 3C1 1.163s Triethylamine 3.077 2.834c h 2c i 2 2.019 2.136 A-Methylimidazole 3.805 4.839c h c i 3 2.480 2.582 AW-Dimethylaniline 4.754 4.661CC14 2.823 2.527 Aniline 3.993c 2h 5c i 1.678 s 1.548 24 Piperidine 3.913a*c h 2c i c h 2c i 2.573 2.614 Pyridine 3.003 3.196c h c i 2c h 3 2.350 2.272 4 2-Methylpyridine 3.437 3.536c h c i 2c h 2c i 3.357 4 3-Methylpyridine 3.603 3.735c c i 3c h 3 2.690 2.471 4-Methylpyridine 3.593 3.749c h c i 2c h c i 2 3.826 4.121 D M F 3.173 3.458c c i 3c h 2c i 3.6344 DMA 3.717 3.896n-C3H 7Cl 1.997 2.076 4 Nitromethane 1.892 2.445(CH3)3CC1 2.217 Nitroethane 2.367 2.750c h 3c h c i c h 3 1.970 1-Nitropropane 2.710c h 3c h c i c h 2c i 2.873 4 2-Nitropropane 2.550n-C4H 9Cl 2.722 2.464 Nitrobenzene 4.460n -C jH uC l 3.223* 2.990 4 Formic acid 3.234C2H 5Br 2.020 Acetic acid 3.290 3.642n-C4H 9Br 3.105 Propanoic acid 3.942c h 3i 2.106 DM SO 3.437 4.379c 2h 5i 2.573 2.159 6 Acetonitrile 1.560C H 2I2 3.853 Propiononitrile 1.940C H 2BrCl 2.440 2 5 Dimethyl methanephosphonate 3.977
“ This work, using the g.l.c. method, unless otherwise shown. Values marked with an asterisk are by the head-space analysis method, this work. 6 M. H. Abraham and E. Matteoli, survey of results. c P. J. Lin and J. F. Parcher, J. Chromatogr. Sci., 1982, 20, 33. d Estimated value using Abraham’s Rc parameter. e K. K. Tremper and J. M. Prausnitz, J. Chem. Eng. Data, 1976, 21, 295. f W. Hayduk and R. Castaneda, Can. J. Chem. Eng., 1973, 51, 353; W. Hayduk, E. B. Walter, and P. Simpson, J. Chem. Eng. Data, 1972, 17, 59. 9 Estirtiated from a correlation of log L with carbon number for the homologous series. h P. Alessi, I. Kikic, A. Alessandrini, and M. Fermeglia, J. Chem. Eng. Data, 1982, 24, 445, 448. ‘ Y. Miyano and W. Hayduk, Can. J. Chem. Engl., 1981, 59, 746 .; E. E. Tucker, S. B. Farnham, and S. D. Christian, J. Phys. Chem., 1969, 73, 3820. * Estimated from a correlation of log L hex with log Loil for alkan-l-o ls.' M. P. Barral, M.-I. P. Andrade, R. Guieu, and J.-P. E. Grolier, Fluid Phase Equilib., 1984, 17, 187. m T. M. Reed, III, Anal. Chem., 1958, 30, 221.
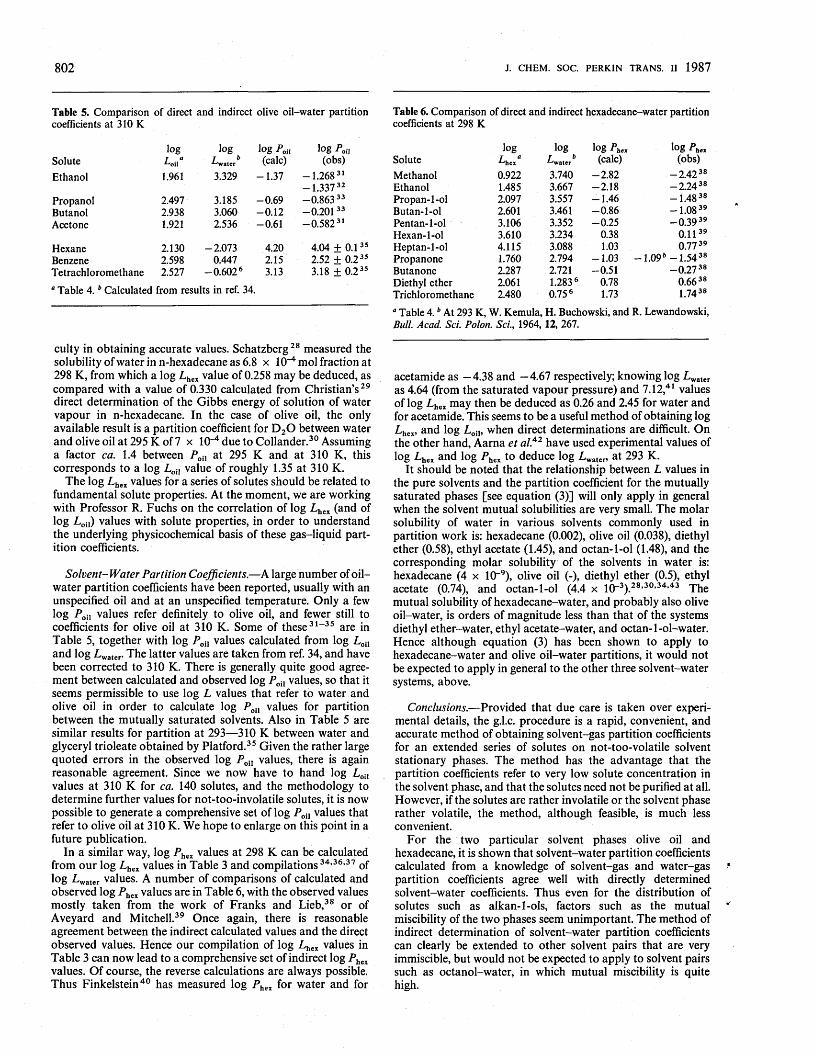
802 J. CHEM. SOC. PERKIN TRANS. II 1987
Table 5. Comparison of direct and indirect olive oil-water partition coefficients at 310 K
log log log P0u log PoilSolute T °^oil L b■ water (calc) (obs)
Ethanol 1.961 3.329 -1 .3 7 -1 .2 6 8 31 -1 .3 3 7 32
Propanol 2.497 3.185 -0 .6 9 -0 .863 33Butanol 2.938 3.060 - 0.12 - 0.20133Acetone 1.921 2.536 -0 .61 -0 .5 8 2 31
Hexane 2.130 -2 .073 4.20 4.04 + 0.1Benzene 2.598 0.447 2.15 2.52 + 0.2Tetrachloromethane 2.527 -0 .6 0 2 6 3.13 3.18 + 0.2
° Table 4. b Calculated from results in ref. 34.
culty in obtaining accurate values. Schatzberg28 measured the solubility of water in n-hexadecane as 6.8 x 10⁻⁴ mol fraction at 298 K, from which a log Lhex value of 0.258 may be deduced, as compared with a value of 0.330 calculated from Christian’s 29 direct determination of the Gibbs energy of solution of water vapour in n-hexadecane. In the case of olive oil, the only available result is a partition coefficient for D 20 between water and olive oil at 295 K of 7 x 10⁻⁴ due to Collander.30 Assuming a factor ca. 1.4 between P0n at 295 K and at 310 K, this corresponds to a log Loi} value of roughly 1.35 at 310 K.
The log Lhex values for a series of solutes should be related to fundamental solute properties. At the moment, we are working with Professor R. Fuchs on the correlation of log Lhex (and of log Loil) values with solute properties, in order to understand the underlying physicochemical basis of these gas-liquid partition coefficients.
Solvent-W ater Partition Coefficients.— A large number of o il- water partition coefficients have been reported, usually with an unspecified oil and at an unspecified temperature. Only a few log Poil values refer definitely to olive oil, and fewer still to coefficients for olive oil at 310 K. Some of these31-35 are in Table 5, together with log Poil values calculated from log Loil and log Lwater. The latter values are taken from ref. 34, and have been corrected to 310 K. There is generally quite good agreement between calculated and observed log Poil values, so that it seems permissible to use log L values that refer to water and olive oil in order to calculate log A ,. values for partition between the mutually saturated solvents. Also in Table 5 are similar results for partition at 293— 310 K between water and glyceryl trioleate obtained by Platford.35 Given the rather large quoted errors in the observed log P0n values, there is again reasonable agreement. Since we now have to hand log Loi, values at 310 K for ca. 140 solutes, and the methodology to determine further values for not-too-involatile solutes, it is now possible to generate a comprehensive set of log PcU values that refer to olive oil at 310 K. We hope to enlarge on this point in a future publication.
In a similar way, log Phex values at 298 K can be calculated from our log Lhex values in Table 3 and com pilations34,36,37 of log Lwater values. A number of comparisons of calculated and observed log P hex values are in Table 6, with the observed values mostly taken from the work o f Franks and Lieb,38 or of Aveyard and Mitchell.39 Once again, there is reasonable agreement between the indirect calculated values and the direct observed values. Hence our compilation of log Lhex values in Table 3 can now lead to a comprehensive set o f indirect log Phex values. O f course, the reverse calculations are always possible. Thus Finkelstein40 has measured log Phex for water and for
Table 6. Comparison of direct and indirect hexadecane-water partition coefficients at 298 K
log log log Pbex log Ph»Solute Lhexa L b■'-'water (calc) (obs)
Methanol 0.922 3.740 -2 .8 2 -2 .4 2 38Ethanol 1.485 3.667 -2 .1 8 -2 .2 4 38Propan-l-ol 2.097 3.557 -1 .4 6 -1 .4 8 38Butan-l-ol 2.601 3.461 - 0.86 -1 .0 8 39Pentan-l-ol 3.106 3.352 -0 .2 5 -0 .3 9 39Hexan-l-ol 3.610 3.234 0.38 0.1139Heptan-l-ol 4.115 3.088 1.03 0.77 39Propanone 1.760 2.794 -1 .0 3 -1 .0 9 * -1 .5 4 38Butanone 2.287 2.721 -0 .51 -0 .2 7 38Diethyl ether 2.061 1.283 6 0.78 0.66 38T richloromethane 2.480 0.75 6 1.73 1.74 38
“ Table 4. b At 293 K, W. Kemula, H. Buchowski, and R. Lewandowski, Bull. Acad. Sci. Polon. Sci., 1964, 12, 267.
acetamide as —4.38 and —4.67 respectively; knowing log Lwater as 4.64 (from the saturated vapour pressure) and 7.12 41 values of log Lhex may then be deduced as 0.26 and 2.45 for water and for acetamide. This seems to be a useful method of obtaining log Lhex, and log Loil, when direct determinations are difficult. On the other hand, Aarna et al.42 have used experimental values of log Lhex and log P hex to deduce log Lwater, at 293 K.
It should be noted that the relationship between L values in the pure solvents and the partition coefficient for the mutually saturated phases [see equation (3)] will only apply in general when the solvent mutual solubilities are very small. The molar solubility of water in various solvents commonly used in partition work is: hexadecane (0.002), olive oil (0.038), diethyl ether (0.58), ethyl acetate (1.45), and octan-l-ol (1.48), and the corresponding molar solubility of the solvents in water is: hexadecane (4 x 10~9), olive oil (-), diethyl ether (0.5), ethyl acetate (0.74), and octan-l-ol (4.4 x lo -3).28-30’34-43 The mutual solubility of hexadecane-water, and probably also olive oil-water, is orders of magnitude less than that of the systems diethyl ether-water, ethyl acetate-water, and octan-l-ol-water. Hence although equation (3) has been shown to apply to hexadecane-water and olive oil-water partitions, it would not be expected to apply in general to the other three solvent-water systems, above.
Conclusions.— Provided that due care is taken over experimental details, the g.l.c. procedure is a rapid, convenient, and accurate method of obtaining solvent-gas partition coefficients for an extended series of solutes on not-too-volatile solvent stationary phases. The method has the advantage that the partition coefficients refer to very low solute concentration in the solvent phase, and that the solutes need not be purified at all. However, if the solutes are rather involatile or the solvent phase rather volatile, the method, although feasible, is much less convenient.
For the two particular solvent phases olive oil and hexadecane, it is shown that solvent-water partition coefficients calculated from a knowledge of solvent-gas and water-gas partition coefficients agree well with directly determined solvent-water coefficients. Thus even for the distribution of solutes such as alkan-l-ols, factors such as the mutual miscibility of the two phases seem unimportant. The method of indirect determination of solvent-water partition coefficients can clearly be extended to other solvent pairs that are very immiscible, but would not be expected to apply to solvent pairs such as octanol-water, in which mutual miscibility is quite high.
J. CHEM. SOC. PERKIN TRANS. II 1987 803AcknowledgementsThis work was carried out under U.S. Navy Contract N 60921- 84-C-0069. We are grateful to Drs. M. J. Kamlet and R. M. Doherty for their interest in this work, to Drs. N. F. Franks and W. H. Lieb for their unpublished work on hexadecane-water partition coefficients, and to Professor R. Fuchs for kind gifts of chemicals.
References1 R. ,N. Featherstone, C. Muehlbaecher, F. L. De Bon, and J. A.
Forsaith, Anesthesiology, 1961, 22, 977.2 A. Feingold, Anesth. Analgesia, 1976, 55, 593.3 P. D. Wagner, P. F. Naumann, and R. B. Laravuso, J. Appl.
Physiology, 1974, 36, 600.4 A. Sato and T. Nakajima, Arch. Environment. Health, 1979, 34, 69.5 A. Sato and T. Nakajima, Br. J. Ind. Med., 1979, 36, 231.6 M. H. Abraham, M. J. Kamlet, R. W. Taft, R. M. Doherty, and P. K.
Weathersby, J. Med. Chem., 1985, 28, 865.7 P. K. Weathersby and L. D. Homer, Undersea Biomed. Res., 1980,7,
277.8 V. Fiserova-Bergerova, Model. Inhalation Exposure Vap., 1983, 1, 3.9 N. P. Franks and W. R. Lieb, Nature {London), 1978, 274, 339.
10 M. H. Abraham, P. L. Grellier, and R. A. McGill, unpublished work.11 M. H. Abraham, J. Chem. Soc. A, 1971, 1061.12 M. H. Abraham, P. L. Grellier, and J. Mana, J. Chem. Thermodyn.,
1974,6,1175.13 J. R. Condor and C. L. Young, ‘Physicochemical Measurements by
Gas Chromatography,’ Wiley, New York, 1979.14 A. P. Kudchadker, G. H. Alani, and B. J. Zwolinski, Chem. Rev.,
1968, 68, 659.15 R. J. Laub and R. L. Pecsok, J. Chromatogr., 1974, 98, 511.16 D. H. Everett, B. H. Gainey, and C. L. Young, Trans. Faraday Soc.,
1968, 64, 2667.17 A. Kwantes and G. W. A. Rijinders in ‘Gas Chromatography 1958,’
ed. D. H. Desty, Butterworths, London, 1958.
18 J.-Y. Lenoir, P. Renault, and H. Renon, J. Chem. Eng. Data, 1971,16, 340.
19 I. Kikic and H. Renon, Sep. Science, 1976, 11, 45.20 D. Richon and H. Renon, J. Chem. Eng. Data, 1980, 25, 59.21 C. F. Chien, M. M. Kopecni, R. J. Laub, and C. H. Smith, J. Phys.
Chem., 1981, 85, 1864.22 L. Perbellini, F. Brugnone, D. Caretta, and G. Maranelli, Br. J. Ind.
Med., 1985, 42, 162.23 S. A. Stern and S.-P. Shiah, Mol. Pharmacol., 1981, 19, 56.24 K. H. Meyer and H. Hemmi, Biochem. Z., 1935, 277, 39.25 A. Lebert and D. Richon, J. Food Sci., 1984, 49, 1301.26 Solubility D ata Project Series, vols. 1— 10, Pergamon, Oxford.27 D. E. M artire and P. Riedl, J. Phys. Chem., 1968, 72, 3478; J. P.
Sheridan, D. E. Martire, and Y. B. Tewari, J. Am. Chem. Soc., 1972, 94, 3294.
28 P. Schatzberg, J. Phys. Chem., 1963, 67, 776.29 S. D. Christian, R. French, and K. O. Yeo, J. Phys. Chem., 1973, 77,
813.30 R. Collander, Phys. Plantarum, 1954, 7, 420.31 H. Meyer, N S Archiv Exp. Path. Pharmakol., 1901, 46, 338.32 W. H. Oldendorf, Proc. Soc. Exp. Biol. Med., 1974, 147, 813.33 N. Bindslev and E. M. Wright, J. Membrane Biol., 1976, 29, 265.34 M. H. Abraham, J. Chem. Soc., Faraday Trans. 1, 1984, 80, 153.35 R. Platford, Bull. Env. Contam. Toxicol., 1979, 21, 68.36 J. Hine and P. K. Mookerjee, J. Org. Chem., 1975, 40, 292.37 S. Cabani, P. Gianni, V. Mollica, and L. Lepori, J. Solution Chem.,
1981, 10, 563.38 N. F. Franks and W. H. Lieb, personal communication.39 R. Aveyard and R. W. Mitchell, Trans. Faraday Soc., 1969,65, 2645.40 A. Finkelstein, J. Gen. Physiol., 1976, 68, 127.41 R. Wolfenden, J. Am. Chem. Soc., 1976, 98, 1987.42 A. Ya. Aama, L. J. Melder, and A. V. Ebber, Zhur. Prikl. Khim., 1979,
52, 1640 (English transl. p. 1558).43 J. A. Riddick, and W. B. Bunger, ‘Organic Solvents,’ Wiley-
Interscience, New York, 3rd edn., 1970.
Received 14th July 1986; Paper 6/1396

I
□g published by butterworths
international journal for the science and technology of polymers

EDITORSU S A ssoc ia te Editor o f P O LYM ER R. K. Eby PhDProfessor, Department of Materials Science & Engineering, The Jo h n s Hopkins University, Baltimore, MD 21218, USA Telephone: (301) 338-7142
Ja p a n ese A sso c ia te Editor, P O LYM ER a n d POL. YM ER C O M M U N IC A TiO N S Y. ImanishiProfessor, Department of Polymer Chemistry, Kyoto University, Kyoto 606, Japan
Sir Geoffrey Allen FRS, PhD, FPRI, FlnstP Unilever PLC, PO Box 68, Unilever House, Blackfriars, London EC4 4BQ, UK
C, H. Bamford FRS, PhD, ScDProfessor, Biomedical Engineering and Medical Physics Unit, Faculty of Medicine, Duncan Building, University of Liverpool, Liverpool L69 3BX, UK
D. C. Bassett PhD, ScDProfessor of Physics, J . J. Thomson Physical Laboratory, University of Reading, Whiteknights, Reading RG6 2AF, UK
D. N. Batchelder PhD, MlnstPDepartment of Physics, Queen Mary College, Mile End Road, London El 4 IMS, UK
C. E. H. B awn CBE, FRSSpringfields, Stoodleigh, Tiverton, Devon EX16 9PT, UK
J. M. G. Cowie PhD, FRSC, FRSEProfessor, University of Stirling FK9 4LA, Scotland, UK
W. J, Feast PhDDepartment of Chemistry, Science Laboratories, South Road, Durham DH1 3LE, UK
J. K. Gillham PhDProfessor, Polymer Materials Program, Department of Chemical Engineering, Princeton University, Princeton, NJ 08540, USA
J. N. Hay DSc, PhDDepartment of Chemistry and Centre for Materials Science, The University of Birmingham, PO Box 363, Birmingham B15 2TT,UK
M. HirookaSenior Research Associate, Central Research Laboratory, Sumitomo Chemical Company, 2-40, Tsukahara, Takatsuki, Osaka 569, Japan
P. HodgeDepartment of Chemistry, University of Lancaster, Lancaster LA1 4YA, UK
UK A sso c ia te Editor, P O LYM ER C O M M U N IC A TIO N S R. Epton DSc, PhDButterworth Professor, Department of Physical Sciences, Wolverhampton Polytechnic, Wolverhampton WV1 1 LY, UK
U S A sso c ia te Editor, P O LYM E R C O M M U N IC A TIO N S L. SmithPolymers Division, National Bureau of Standards, Gaithersburg, Maryland 20899, USA 5
M. B. Huglin DSc, PhD, FRSCReader, Department of Chemistry &-Applied Chemistry, University of Salford, Salford M5 4WT, UK
B. R. Jennings DSc, PhD, FlnstPProfessor of Physics, Department of Applied and Modern Optics,J. J. Thomson Physical Laboratory, University of Reading, Whiteknights, Reading RG6 2AF, UK
H. KawaiProfessor of Polymer Chemistry, Kyoto University, Kyoto 606, Japan
A. Ledwith DSc, PhDPilkington Brothers PLC, Research and Development Laboratories, Lathom, Ormskirk, Lancashire, L40 5UF, UK
D. W. McCall PhDChemical Director, AT & T, Bell Laboratories, Murray Hill,NJ 07974, USA
A. Peterlin PhDPolymers Division, National Bureau of Standards, Washington DC 20234, USA
R. S. PorterProfessor, Department of Polymer Science and Engineering, University of Massachusetts, Amherst MA01003, USA
J. C. SalamoneProfessor of Chemistry, University of Lowell, Lowell,Massachusetts 01854, USA
P. SmithCentral Research and Development, Experimental Station,E. I. Du Pont de Nemours & Company Inc., Wilmington,Delaware 19898, USA
O. Vogl PhDHerman F. Mark Professor of Polymer Science, Polytechnic Institute of New York, 333 Jay Street, Brooklyn, New York 11201, USA
I. M. Ward FRS, DPhil, FPRI, FlnstPProfessor of Physics, University of Leeds, Leeds LS2 9JT, UK
J. G. Williams DSc(Eng), PhD, FEng, FPRI Professor of Polymer Engineering, Department of Mechanical Engineering, Imperial College, London SW7 2BX, UK
INTERNATIONAL ADVISORY BOARDS. L. A g g a rw a l PhDGenCorp, Research Division, 2990 Gilchrist Road, Akron, Ohio 44305, USA
H. C. B eno it PhDCentre de Recherches sur les Macromolecules, CNRS, 67083 Strasbourg, France
S. B y w a te r PhDNational Research Council, Ottawa K1A 0R9, Canada
G. ChallaLaboratory of Polymer Chemistry,University of Groningen, Nijenborgh 16, 9747 AG Groningen, The Netherlands
F. D an usso PhDDipartimento di Chimica Industriale ed Ingegneria Chimica del Politechnico, 20133 Milano, Italy
K. L. DeVries PhDDepartment of Mechanical and Industrial Engineering, University of Utah, Salt Lake City, Utah 84112, USA
D. HeikensLaboratory of Polymer Technology, Eindhoven University of Technology,PO Box 513, 5600 MB, Eindhoven,The Netherlands
A. M. North FRSE, PhD, DSc Asian Institute of Technology, GPO Box 2754, Bangkok 10501, Thailand
H. RingsdorfInstitut fur Organische Chemie, Johannes Gutenberg-Universitat, D-6500 Mainz, West Germany
G. W eg nerMax-Planck-lnstitute for Polymer Research, D-6500 Mainz, West Germany
SUBMISSIONSPapers should be sent to: The Executive Editor at the Publisher's address, except those from North America and Japan which should be sent to the respective Associate Editors, Prof. R. K. Eby or Prof. Y. Imanishi, at the addresses given above.
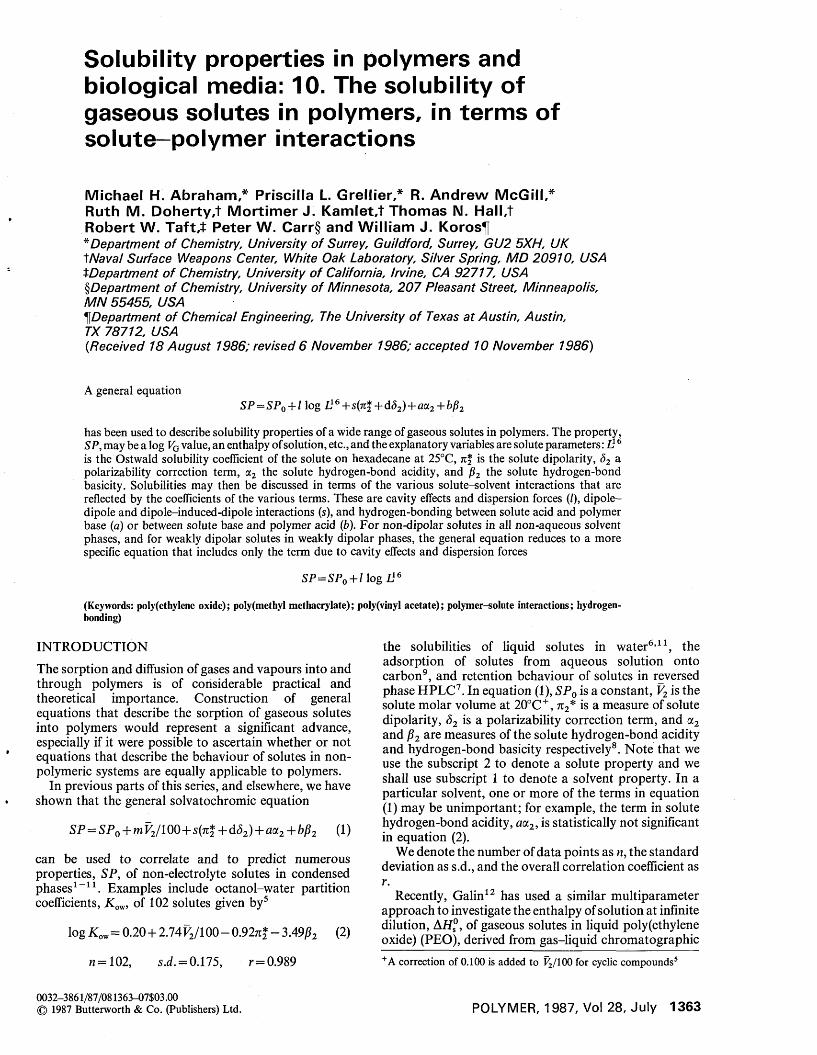
Solubility properties in polymers and biological media: 10. The solubility of gaseous solutes in polymers, in terms of solute—polymer interactions
Michael H. Abraham,* Priscilla L. Grellier,* R. Andrew McGill,* Ruth M. Doherty,t Mortimer J. Kamlet,t Thomas N. Hall,t Robert W. Taft,t Peter W. Carr§ and William J. Korosj* Department o f Chemistry, University o f Surrey, Guildford, Surrey, GU2 5XH, UK X Naval Surface Weapons Center, White Oak Laboratory, Silver Spring, M D 20910, USA XDepartment o f Chemistry, University o f California, Irvine, CA 92717, USA ^Department o f Chemistry, University of Minnesota, 2 0 7 Pleasant Street, Minneapolis, M N 55455, USATf,Department of Chemical Engineering, The University o f Texas at Austin, Austin,TX 78712, USA{Received 18 August 1986; revised 6 November 1986; accepted 10 November 1986)
A general equationSP = SP Q + l log L16+s(7rf + d<52) + aa2 + b 0 2
has been used to describe solubility properties of a wide range of gaseous solutes in polymers. The property, SP, may be a log Vc value, an enthalpy o f solution, etc., and the explanatory variables are solute parameters: L16 is the Ostwald solubility coefficient of the solute on hexadecane at 25°C, rcf is the solute dipolarity, b2 a polarizability correction term, a2 the solute hydrogen-bond acidity, and 0 2 the solute hydrogen-bond basicity. Solubilities may then be discussed in terms of the various solute-solvent interactions that are reflected by the coefficients of the various terms. These are cavity effects and dispersion forces (/), d ipole- dipole and dipole-induced-dipole interactions (s), and hydrogen-bonding between solute acid and polymer base (a) or between solute base and polymer acid (b). For non-dipolar solutes in all non-aqueous solvent phases, and for weakly dipolar solutes in weakly dipolar phases, the general equation reduces to a more specific equation that includes only the term due to cavity effects and dispersion forces
SP = SP 0 + l log I} 6
(Keywords: poIy(ethylene oxide); poly(methyl methacrylate); poly(vinyl acetate); polymer-solute interactions; hydrogen- bonding)
INTRODUCTIONThe sorption and diffusion of gases and vapours into and through polymers is of considerable practical and theoretical importance. Construction of general equations that describe the sorption of gaseous solutes into polymers would represent a significant advance, especially if it were possible to ascertain whether or not equations that describe the behaviour of solutes in nonpolymeric systems are equally applicable to polymers.In previous parts of this series, and elsewhere, we have
shown that the general solvatochromic equationSP=SPo + mV2/100+s(n% +d52) + aa2 + bp2 (1)
can be used to correlate and to predict numerous properties, SP, of non-electrolyte solutes in condensed phases1-11. Examples include octanol-water partition coefficients, K ov/, of 102 solutes given by5
logKow = 0.20+2.74F2/100-0.927rf-3.49j32 (2)n=102, s.d. = 0.175, r = 0.989
the solubilities of liquid solutes in water6,11, the adsorption of solutes from aqueous solution onto carbon9, and retention behaviour of solutes in reversed phase HPLC7. In equation (1), SP0 is a constant, V2 is the solute molar volume at 20°C+, n2* is a measure of solute dipolarity, d2 is a polarizability correction term, and a2 and 02 are measures of the solute hydrogen-bond acidity and hydrogen-bond basicity respectively8. Note that we use the subscript 2 to denote a solute property and we shall use subscript 1 to denote a solvent property. In a particular solvent, one or more of the terms in equation(1) may be unimportant; for example, the term in solute hydrogen-bond acidity, aa2, is statistically not significant in equation (2).We denote the number of data points as n, the standard
deviation as s.d., and the overall correlation coefficient as r.Recently, Galin12 has used a similar multiparameter
approach to investigate the enthalpy of solution at infinite dilution, A H s°, of gaseous solutes in liquid poly (ethylene oxide) (PEO), derived from gas-liquid chromatographic+A correction of 0.100 is added to F2/100 for cyclic compounds5
0032-3861/87/081363-07S03.00 © 1987 Butterworth & Co. (Publishers) Ltd. POLYMER, 1987, Vol 28, July 1363
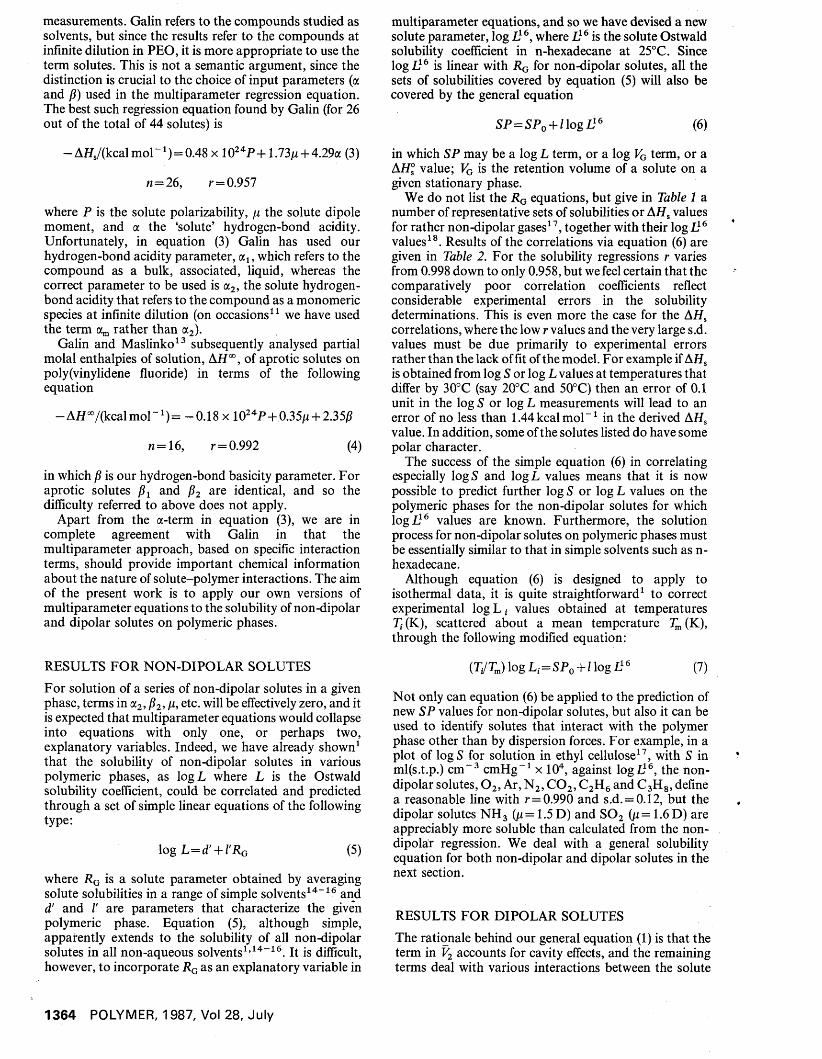
measurements. Galin refers to the compounds studied as solvents, but since the results refer to the compounds at infinite dilution in PEO, it is more appropriate to use the term solutes. This is not a semantic argument, since the distinction is crucial to the choice of input parameters (a and 0) used in the multiparameter regression equation. The best such regression equation found by Galin (for 26 out of the total of 44 solutes) is
- A H s/(kcalmol-1) = 0.48x 1024P + 1.73 + 4.29a (3)n = 26, r = 0.957
where P is the solute polarizability, p the solute dipole moment, and a the ‘solute’ hydrogen-bond acidity. Unfortunately, in equation (3) Galin has used our hydrogen-bond acidity parameter, al5 which refers to the compound as a bulk, associated, liquid, whereas the correct parameter to be used is a2, the solute hydrogen- bond acidity that refers to the compound as a monomeric species at infinite dilution (on occasions11 we have used the term am rather than a2).Galin and Maslinko13 subsequently analysed partial
molal enthalpies of solution, A H 00, of aprotic solutes on poly(vinylidene fluoride) in terms of the following equation— AH°°/(kcal mol-1) = -0.18 x 1024P + 0.35/1 + 2.350
n = 16, r = 0.992 (4)in which 0 is our hydrogen-bond basicity parameter. For aprotic solutes 0X and 02 are identical, and so the difficulty referred to above does not apply.Apart from the a-term in equation (3), we are in
complete agreement with Galin in that the multiparameter approach, based on specific interaction terms, should provide important chemical information about the nature of solute-polymer interactions. The aim of the present work is to apply our own versions of multiparameter equations to the solubility of non-dipolar and dipolar solutes on polymeric phases.
RESULTS FOR NON-DIPOLAR SOLUTESFor solution of a series of non-dipolar solutes in a given phase, terms in a2,02, \i, etc. will be effectively zero, and it is expected that multiparameter equations would collapse into equations with only one, or perhaps two, explanatory variables. Indeed, we have already shown1 that the solubility of non-dipolar solutes in various polymeric phases, as logL where L is the Ostwald solubility coefficient, could be correlated and predicted through a set of simple linear equations of the following type:
log L=d' + l’RG (5)where RG is a solute parameter obtained by averaging solute solubilities in a range of simple solvents14-16 and d' and /' are parameters that characterize the given polymeric phase. Equation (5), although simple, apparently extends to the solubility of all non-dipolar solutes in all non-aqueous solvents1,14-16. It is difficult, however, to incorporate RG as an explanatory variable in
multiparameter equations, and so we have devised a new solute parameter, log L16, where L16 is the solute Ostwald solubility coefficient in n-hexadecane at 25°C. Since logL16 is linear with RG for non-dipolar solutes, all the sets of solubilities covered by equation (5) will also be covered by the general equation
SP=SP0 + l\ogL16 (6)in which SP may be a log L term, or a log VG term, or a AH ° value; VG is the retention volume of a solute on a given stationary phase.We do not list the RG equations, but give in Table 1 a
number of representative sets of solubilities or AH s values for rather non-dipolar gases17, together with their log L16 values18. Results of the correlations via equation (6) are given in Table 2. For the solubility regressions r varies from 0.998 down to only 0.958, but we feel certain that the comparatively poor correlation coefficients reflect considerable experimental errors in the solubility determinations. This is even more the case for the AHs correlations, where the low r values and the very large s.d. values must be due primarily to experimental errors rather than the lack of fit of the model. F or example if A H s is obtained from log S or log Lvalues at temperatures that differ by 30°C (say 20°C and 50°C) then an error of 0.1 unit in the log S or log L measurements will lead to an error of no less than 1.44 kcal mol-1 in the derived AH s value. In addition, some of the solutes listed do have some polar character.The success of the simple equation (6) in correlating
especially logS and logL values means that it is now possible to predict further log S or log L values on the polymeric phases for the non-dipolar solutes for which logL16 values are known. Furthermore, the solution process for non-dipolar solutes on polymeric phases must be essentially similar to that in simple solvents such as n- hexadecane.Although equation (6) is designed to apply to
isothermal data, it is quite straightforward1 to correct experimental log L ,• values obtained at temperatures 7] (K), scattered about a mean temperature Tm (K), through the following modified equation:
{Ti/Tm) log L, = SP o 4-/log L16 (7)Not only can equation (6) be applied to the prediction of new SP values for non-dipolar solutes, but also it can be used to identify solutes that interact with the polymer phase other than by dispersion forces. For example, in a plot of logS for solution in ethyl cellulose17, with S in ml(s.t.p.) cm-3 cmHg-1 x 10⁴, against logL16, the non- dipolar solutes, 0 2, Ar, N 2, C 0 2, C2H 6 and C 3H 8, define a reasonable line with r=0.990 and s.d. = 0.12, but the dipolar solutes N H 3 (pi= 1.5 D) and S02 (ji= 1.6D) are appreciably more soluble than calculated from the non- dipolar regression. We deal with a general solubility equation for both non-dipolar and dipolar solutes in the next section.
RESULTS FOR DIPOLAR SOLUTESThe rationale behind our general equation (1) is that the term in V2 accounts for cavity effects, and the remaining terms deal with various interactions between the solute
1364 POLYMER, 1987, Vol 28, July

Table 1 Solubilities (as log L, log S or log VG) and enthalpies of solution (in kcal mol *) for non-polar solutes on various polymeric phases0log L16 log La log Lb AHb log l9 AH ° log SD A H d log SE A H e log SE A H e log V§
He -1 .741 -1 .3 5 0 0.15 - 1.8 -0 .1 3 7 2.4 -0 .4 3 2 1.5Ne -1 .5 7 5Ar - 0.688 -0 .4 4 0 1.20 - 0.1 0.875 0.8 0.518 -0 .3Kr - 0.211 -0 .3 4 7 -1 .3 9Xe 0.378 0.255 -2 .4 6h 2 - 1.200 -0 .9 2 4 0.69 0.8n 2 -0 .9 7 8 -0 .7 8 2 -1 .1 5 5 -0 .0 7 0.87 0.1 0.477 1.9 0.176 0.5o2 -0 .7 2 3 -0 .4 6 7 1.18 - 0.8 0.799 0.6 0.380 - 0 .4CO -0 .8 1 2 1.04 0.0 0.653 1.7 0.301 0.6co2 0.057 0.384 2.08 - 2.8 1.531 0.1 1.137 -1 .3n 2o 0.164 0.146 -2 .7 7Methane -0 .323 -0 .203 1.52 -1 .3 1.176 0.4 0.833 - 0 .7Ethane 0.492 2.000 - 1 .5 1.591 -2 .3Propane 1.050 2.90 -5 .6 2.477 - 2.1 2.041 -2 .9 -0 .208Butane 1.615 1.215Isobutane 1.409 -0 .0 6 6Pentane 2.162 1.798 - 6.88 0.255Hexane 2.668 0.447Heptane 3.173 0.681Cyclopropane 1.314 1.064 -2 .8 4 1.061 -4 .7 8Cyclopentane 2.447 0.484Cyclohexane 2.913 0.777Ethene 0.289 0.104 -2 .6 5Propene 0.946 3.15 -3 .3 2.400 - 2.1 2.033 - 3 .2Ethyne 0.150 2.22 - 2.2Propyne 1.025 2.602 - 2.6 2.204 - 3 .4s f 6 -0 .4 5 0 1.48 -3 .5 1.097 - 0 .5 0.724 - 1.8Diethylether 2.061 1.861 -6 .5 0 1.813 -7 .1 0Divinylether 2.055 1.778 -7 .4 1CHC1:CC12 3.130 2.594 -8 .0 3 2.954 -9 .2 7c h c i f c f 2o c h f 2 2.300 1.760 -7 .5 0 1.991 -7 .3 1C F 3CHClBr 2.177 1.989 -7 .0 0 2.342 -8 .9 4CHCl2C F2O C H 3 2.864 2.724 -9 .6 3 2.978 -9 .3 7c h c i 3 2.480 2.243 -8 .1 5 2.602 -9 .3 0 0.505C F3CH2OCH :CH2 1.940 1.681 -7 .5 0C H F2C F2CH2Br 2.830 2.505 -7 .8 9C F 3CHFBr 1.730 1.462 -4 .5 4Benzene 2.803 0.889Toluene 3.344 1.104CH2Cl2 2.019 0.525
“ Log L16 values from reference 18, other values as listed in Table 2
and the solvent phase through dipolar effects (7tf) or hydrogen-bond effects (a2 and fi2). However, there is no explicit term in equation (1) which corresponds to a dispersion interaction. This does not seem to matter for processes that involve condensed phases, because the dispersion interaction in each phase will largely cancel, e.g. the partition of solutes between octanol and water described by equation (2). However, this term may not be neglected for the process of transferring a solute from the gas phase to solution, and so we thought it useful to modify equation (1) by incorporation of a term in log L16. This term will include not only solute-solvent dispersion interactions but also the cavity effect, making the V2 term redundant, and leaving the modified equation as
SP=SP0 + l log L16 + s(n$ + dS2) + aa2 + bfi2 (8)We now apply both equations (1) and (8) to the AJTS results obtained by Galin12, as well as to other solubility properties such as log L or log VG.We start with the AH s values listed by Galin12 for
solution on poly(ethylene oxide). Of the 44 data points, Galin used 26 in equation (3), which yielded r=0.957, albeit with an incorrect set of a values. Our approach is that if multiparameter equations are considered to be general equations for the investigation of solute-solvent
interactions, they should be applied to as many data points as possible. All the required explanatory variables are available for 41 data points (the outstanding solutes being bis(2-methoxyethyl) ether, water, and 1,1,2- trichloroethane) and application of the various multiparameter equations yields the following:
- AHS = 3.34 +0.30 xl024P+l.17^+ 3.87oc2 n = 41, s.d. = 1.05, r = 0.805
— AHS = 2.25 — 3.45F2/100+3.89(7rf — 0.01<52) -h 3.98a2 +1
(9)
n = 41, s.d. = 1.12 r = 0.786(10)
-AH, = 2.33+ 1.46 log L16 + 3.49(tt| — 0.24<52) + 4.24a2 + 0.87/12
n = 41, s.d. = 0.86, r = 0.880(ID
As found for the non-dipolar solutes, values of s.d. are quite large, but again the large possible experimental error should be noted, e.g. for butanone, three values
POLYMER, 1987, Vol 28, July 1365

Table 2 Correlations of solubilities and heats of solution of non-polarsolutes in polymeric phases with logL16 valuesRegression equation n s.d.
A Values of log L at 30°C on dimethylsiloxane silicone rubber containing 33 % silica filler26 log La = 0.071 ± 0.052 + (0.787 ± 0.04)log L16 8 0.131 0.9886
B Values of log L at 30°C and AH on dimethylsiloxane silicone rubber containing 25% silica filler27log Lb = -0 .118 ± 0 .265+ (0.918 + 0 .1 12)log L16 8
AHB = 0.38 + 1.52—(3.22±0.64)log L16 8
C Values of log L at 37°C and AH on oil28 log Ip = — 0.156 ± 0.067 + (1.006 + 0.034)log L16 16 AHC = 2.05 + 0.34—(2.44 ± 0.18)log I i 6 16
D Values of log S in ml (s.t.p.) cm -3 cmHg- 1 x l 0 4 at 25°C and AH on poly-ds- isoprene ‘natural rubber’17 log SD = 1.961 + 0.031 + (1.073 ±0.036)log L16 12
AH d = - 2.37 ± 0 .4 2 -(1 .7 0 ±0.47)log L16 12
0.162 0.95830.93 0.8982
0.1650.84
0.0981.29
E Values of log S in ml (s.t.p.) cm 3 cmHg 1 x 10⁴ at 25°C and AH on branched polyethylene ‘Althon 14’1
log SE = 1.504+0.016 + (0.976 + 0.018)log L16 A H e = - 0.40 ± 0.14 - (1.81 ± 0.16)log L16
F Values of log S in ml (s.t.p.) cm -3 cmHg-1 x 10⁴ at 25°C and AH on linear polyethylene ‘Grex’17log SF = 1.127 + 0.018 + (0.941 + 0.021)log L16 12
AHF = -1 .4 5 ± 0 .1 3 -(1 .7 2 + 0.15)log L16 12
G Values of log Vq on molten polystyrene in ml(s.t.p.) g -1 polymer at 175°C29log V §= — 0.742± 0.166 + (0.512±0.066)log L16 11
1212
0.0540.48
0.0610.46
0.99180.9655
0.99450.7526
0.99830.9619
0.99760.9627
0.149 0.9318
The value for helium is quite out of line. Omission of this point gives u = 11, s.d. = 0.96 and r = 0.8855
given12 are 7.57, 7.65 and 8.25 kcalmol-1*. Equation(11) is markedly better than the other two, and shows that the three main features of solute-(PEG) interactions are a dispersive-cavity term, a dipolar term, and a term corresponding to hydrogen-bond solute acidity (a2). The jS2 term in equation (11) is statistically not significant. These conclusions are identical to those of Galin12, based on equation (3) covering 26 selected solutes.Not only are AH s values available for PEG, but also
log VG values were obtained by Galin12 and by Klein and Jeberien19 at 70°C, with VG in cm3g-1. Of 34 recorded12,19 values, explanatory variables are known for 31 assorted solutes including hydrogen-bond bases and hydrogen-bond acids. Regressions for all 31 solutes are
log FG = 0.45 ±0.40+0.087 ±0.027 x 1024P + 0.41 ± 0.1 In + 0.78±0.31a2 (12)
« = 31, s.d . = 0.46, r = 0.651
log FG = - 0.43 ± 0.22 + 0.57 ± 0.06 log L16 +1.68 ± 0.26(tt! — 0.08<52)+ 0.97 ±0.17a2 + 0.39 ±0.28jS2 (13)
n = 31, s.d . = 0.24, r = 0.927
log FG = - 0.41 ± 0.41 +1.29 ± 0.26 F2/l 00 +1.85 ±0.44(tt£ + 0.08 <52)+ 0.78 ± 0.026a2 + 0.53 ± 0.42j?2
n = 31, s.d. = 0.36, r = 0.821(14)
Again, the log L16 equation yields much the better correlation, although by our usual standards r = 0.927 would be regarded as only a fair correlation value. Interestingly, although the signs of the coefficients in the log VG and — AHs correlations are the same, the magnitude of those in the log VG correlations are lower by factors of 3 or 4. If the log VG coefficients are multiplied by 2.303RT, yielding a factor of 1.57, the scale of the coefficients is then the same, but still those in 2.303P77 log VG are lower by a factor of just over 2. As is often the case, there is a partial compensation by the PA5s0term of AH s. This is as expected, because any interactions that increase solubility (i.e. increase log VG) will give rise to negative AH s values and to negative ASs values due to loss of translational entropy on, for example, hydrogen-bond formation. However, the same factors that influence AH s also influence log VG, namely solute dispersion-cavity effects, solute dipolarity, and solute hydrogen-bond acidity; again the /?2 term in equation (13) is not significant.As mentioned in the introduction, equation (4) has
been used13 to correlate partial molal enthalpies of mixing, A H 00 values. There is a fundamental difference between AH s and AH°°: the former refers to solution of a gas, equation (15), and the latter to solution of the liquid solute, equation (16)19solute (gas)
AH.• solute (solution at zero concentration) (15)
solute (pure liquid) — ► solute (solution at zero concentration) (16)
Since there are no solute-solute interactions in the gaseous state, AH s includes only solute-solvent effects. However, A H 00 represents the difference between solute- solute effects in the pure liquid solute and solute-solvent effects in solution. There is therefore no comparison to be made between regression coefficients for AHS and those for A H 00. In our view, equation (8) and similar equations should really apply to AH s because these equations contain no term that refers to solute-solute interactions.However, there are further data sets on gas— solvent
equilibria, as VG values, to which equations (1) and (8) may be applied. In every case, equation (8) is superior to equation (1), and so we give results only in terms of the former equation. Dincer20 has obtained VG values for 34 solutes on poly (methyl methacrylate) at 150°C. Explanatory parameters are known for 29 solutes, the following equation being found:log FG = - 0.70 ± 0.16 + 0.36 ± 0.05 log L16
+ 1.40± 0 . 1 5 ( tt| - 0 . 1 6 5 2)
+ 0.73 ± 0 . 1 7 oc2 - 0.18 ±0.18j32 (17)n = 29, s.d. = 0.13, r = 0.9327
*N ote that in all cases we took a strict average of the quoted12 values. Note that the term in is statistically not significant.
1366 PO LYMER, 1987, Vol 28, J uly
Several workers have measured log VG values for solutes on poly(vinyl acetate) at various temperatures. Ward et al.21 have collected and analysed results in terms of the quantity TJT, where Tc is the solute critical temperature, and T is the experimental temperature. The regression takes the form
logF G = a + b(Tc/T )2 (18)
and Ward et al.21 found good correlations provided that solutes were grouped into families. Thus for 21 strongly polar solutes (95 data points)* r = 0.9916, for 5 aromatic solutes (44 data points) another regression equation with different slopes and intercepts gives r = 0.9984, and for a third different regression equation for 16 non-polar and non-aromatic solutes (53 data points) r = 0.9388. Although equations such as (18) are useful for the prediction of VG values, they are clearly not general equations and cannot yield information about solute- polymer interactions. Out of the 42 solutes studied by Ward et a l 21, we have obtained from the references given by Ward et al.21 values of VG for 38 solutes, all at 135°C. Without selecting any families of solutes at all, we applied our general equation to the solubility data at 135°C to yield the following regression equation:
log VG= - 0 .6 4 ± 0 .0 8 + 0 .3 8 ± 0 .0 2 logL16
+ 1.32±0.16(7rf —0.01<52) + 1 .19±0.19a2
+ 0.36 ±0.21/12 (19)
72 = 38, s.d. = 0.15, r = 0.9710
As found above in other correlations of solubility data on polymers, the s.d. and r values in equations (17) and (19) are poor by our usual standards. However, experimental errors in the determinations appear to be larger than expected. For example, five determinations of log VG for cyclohexane solute yield s.d. = 0.14 at 135°C, and seven such determinations for benzene solute give an s.d. of 0.09. Bearing in mind that errors in log VG may average as much as 0.1 unit, equations (17) and (19) are probably as good as expected for ‘all-solute’ correlations. Since Ward et al.21 give no numerical data, we list in Table 3 the log VG values at 135°C that we have used.
A rather different polymer has been studied by Dangayach and Bonner22, who measured VG in ml g -1 for 34 solutes at 150°C and 31 solutes at 170°C on polysulphone. Of these solutes, explanatory variables are available for 30 using log Li6,’ the regression at 150°C being given by
log VG= - 0 .4 5 ± 0 .1 9 + 0 .1 03± 0 .62 logL16+ 0.79
± 0.17(rcf + 0.43<52)'+ 0.03 ± 0.12a2 + 0.67 ± 0.19&,(20)
n = 30, s.d. = 0.16, r = 0.906
These results are unusual in that the dispersion-cavity term logL16 is statistically not significant, the main interactions involving solute dipolarity (7if) and hydrogen-bond basicity (/?2).
Copolymers can also be included in our system: Dincer
* The number of data points is much larger than the number of solutes, because each log VG measurement at each temperature is a new data point.
and Bonner23 have obtained VG values for 43 solutes at 150 and 161°C on an ethylene-vinyl acetate copolymer containing 29 wt % vinyl acetate. Explanatory variables are available for most of the solutes; the regression equation at 150°C is:
log VG= - 0.23± 0.09 + 0.428± 0.028 logL16 + 0.46
± 0.07(7tf + 0.05<52) + 0.13 ± 0.06a2 - 0.13 ± 0.09j?2
(21)n = 37, s.d. = 0.09, r = 0.958 v '
GENERAL DISCUSSION
Of the two general regression equations, (1) and (8), that we have used, equation (8) is always superior. Although equation (1) may be useful in predicting log VG or other solubility values for gaseous solutes on polymers, we limit this discussion to the use of equation (8), as a general equation, and to the use of the restricted equation (6).
For non-dipolar solutes on any non-aqueous solvent, and for solutes of rather low dipolarity on rather low dipolarity solvents, the simple equation (6) represents a reasonably accurate method of correlating and predicting gaseous solubilities. The only explanatory variable used, logL16, reflects a combination of cavity and dispersion terms.
A summary of the coefficients in equation (8) for the polymers studied here, and for some non-polymeric solvent phases18, is presented in Table 4. Of the materials listed, all are either monomer liquids or rubbery polymers above the glass transition temperature, with the exception of poly(sulphone) which has a Tg value of about 190°C22. We should point out that our approach is unambiguous for solution of solutes in non-polymeric liquids and in rubbery polymers, but would not be expected to apply to the solution of solutes (especially small solutes) in glassy polymers24,25. The presence of ‘free sites’ in glassy polymers can lead to enhanced solubility of small solutes. Furthermore, because the glassy polymer contains packing defects that provide these ‘free sites’, the dependence of solubility on the cavity dispersion term would be expected to be much less than for solution in rubbery polymers or in non-polymeric liquids. This is certainly so for the glassy polymer, poly(sulphone), where the /logL16 term is small and only just statistically significant. We therefore exclude poly(sulphone) from this general discussion on our approach based on equation (8).
The cavity-dispersive interaction term / log L16 is lower than unity for all the solvent phases, but the effect of temperature differences is not known. At any given temperature, cavity effects will be negative and dispersion effects positive, the balance between the two giving rise to larger or smaller net values of /. The srcf term represents dipolarity contributions of the dipole-dipole or dipole- induced-dipole type: the larger the value of s the more dipolar is the solvent phase. The polymeric phases are usually quite dipolar, cf. the triester, olive o il18. If the solvent phase is itself a hydrogen-bond base, then acid- base interactions will occur with acidic solutes, as shown by the aa2 term. As expected for polyethers or polyesters, all the polymers act as hydrogen-bond bases, to about the same extent as the triester, olive oil. The general chemical sense of our equation (8) is shown by the near-zero coefficient b in the bp2 term. This term will arise through
POLYMER, 1987, Vol 28, July 1367
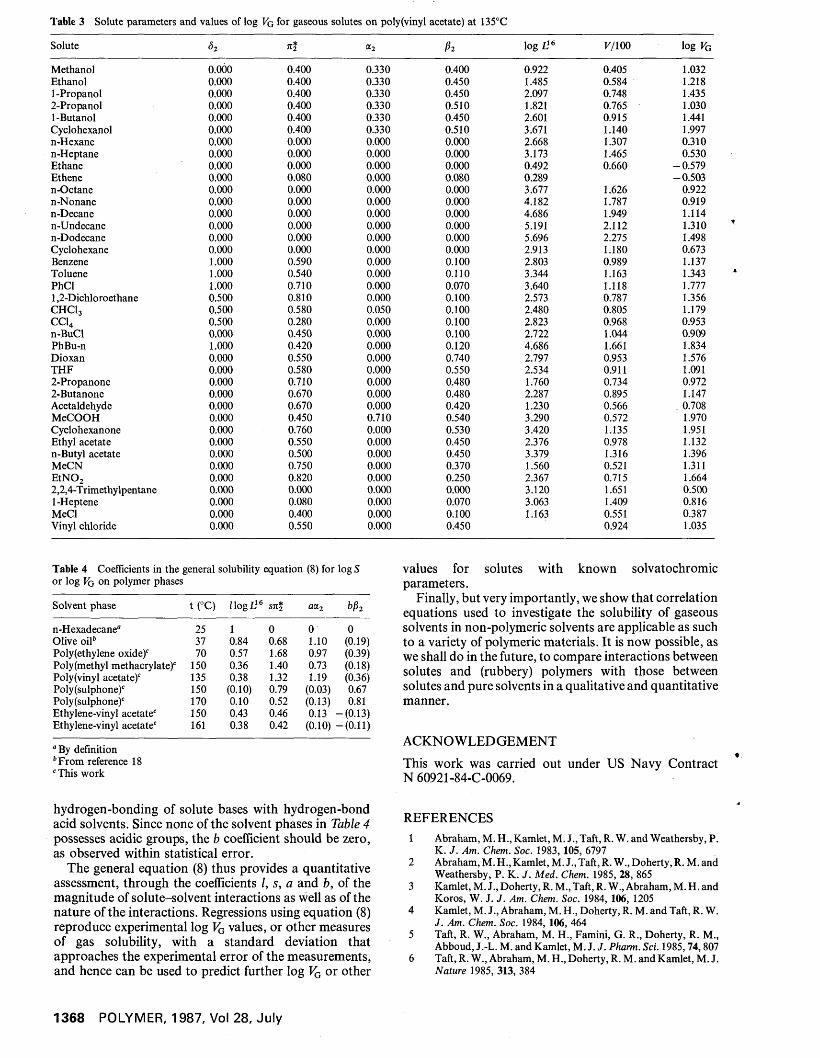
Table 3 Solute parameters and values of log % for gaseous solutes on poly(vinyl acetate) at 135°CSolute <52 n* a2 P2 log L16 F/100 log VG
Methanol 0.000 0.400 0.330 0.400 0.922 0.405 1.032Ethanol 0.000 0.400 0.330 0.450 1.485 0.584 1.2181-Propanol 0.000 0.400 0.330 0.450 2.097 0.748 1.4352-Propanol 0.000 0.400 0.330 0.510 1.821 0.765 1.0301-Butanol 0.000 0.400 0.330 0.450 2.601 0.915 1.441Cyclohexanol 0.000 0.400 0.330 0.510 3.671 1.140 1.997n-Hexane 0.000 0.000 0.000 0.000 2.668 1.307 0.310n-Heptane 0.000 0.000 0.000 0.000 3.173 1.465 0.530Ethane 0.000 0.000 0.000 0.000 0.492 0.660 -0 .579Ethene 0.000 0.080 0.000 0.080 0.289 -0 .503n-Octane 0.000 0.000 0.000 0.000 3.677 1.626 0.922n-Nonane 0.000 0.000 0.000 0.000 4.182 1.787 0.919n-Decane 0.000 0.000 0.000 0.000 4.686 1.949 1.114n-Undecane 0.000 0.000 0.000 0.000 5.191 2.112 1.310n-Dodecane 0.000 0.000 0.000 0.000 5.696 2.275 1.498Cyclohexane 0.000 0.000 0.000 0.000 2.913 1.180 0.673Benzene 1.000 0.590 0.000 0.100 2.803 0.989 1.137Toluene 1.000 0.540 0.000 0.110 3.344 1.163 1.343PhCl 1.000 0.710 0.000 0.070 3.640 1.118 1.7771,2-Dichloroethane 0.500 0.810 0.000 0.100 2.573 0.787 1.356CHC13 0.500 0.580 0.050 0.100 2.480 0.805 1.179CC14 0.500 0.280 0.000 0.100 2.823 0.968 0.953n-BuCl 0.000 0.450 0.000 0.100 2.722 1.044 0.909PhBu-n 1.000 0.420 0.000 0.120 4.686 1.661 1.834Dioxan 0.000 0.550 0.000 0.740 2.797 0.953 1.576TH F 0.000 0.580 0.000 0.550 2.534 0.911 1.0912-Propanone 0.000 0.710 0.000 0.480 1.760 0.734 0.9722-Butanone 0.000 0.670 0.000 0.480 2.287 0.895 1.147Acetaldehyde 0.000 0.670 0.000 0.420 1.230 0.566 . 0.708MeCOOH 0.000 0.450 0.710 0.540 3.290 0.572 1.970Cyclohexanone 0.000 0.760 0.000 0.530 3.420 1.135 1.951Ethyl acetate 0.000 0.550 0.000 0.450 2.376 0.978 1.132n-Butyl acetate 0.000 0.500 0.000 0.450 3.379 1.316 1.396MeCN 0.000 0.750 0.000 0.370 1.560 0.521 1.311E tN 0 2 0.000 0.820 0.000 0.250 2.367 0.715 1.6642,2,4-Trimethylpentane 0.000 0.000 0.000 0.000 3.120 1.651 0.5001-Heptene 0.000 0.080 0.000 0.070 3.063 1.409 0.816MeCl 0.000 0.400 0.000 0.100 1.163 0.551 0.387Vinyl chloride 0.000 0.550 0.000 0.450 0.924 1.035
Table 4 Coefficients in the general solubility equation (8) for log S or log Vq on polymer phases
Solvent phase t(°C ) I logL16 S7tf aa2 bP 2
n-Hexadecanefl 25 1 0 0 0Olive oil6 37 0.84 0.68 1.10 (0.19)Poly(ethylene oxide)c 70 0.57 1.68 0.97 (0.39)Poly(methyl methacrylate)' 150 0.36 1.40 0.73 (0.18)Poly(vinyl acetate)' 135 0.38 1.32 1.19 (0.36)Poly(sulphone)' 150 (0.10) 0.79 (0.03) 0.67Poly(sulphone)' 170 0.10 0.52 (0.13) 0.81Ethylene-vinyl acetate' 150 0.43 0.46 0.13 -(0 .13)Ethylene-vinyl acetate' 161 0.38 0.42 (0.10) - ( 0.11)
a By definition 6 From reference 18 ' This work
hydrogen-bonding of solute bases with hydrogen-bond acid solvents. Since none of the solvent phases in Table 4 possesses acidic groups, the b coefficient should be zero, as observed within statistical error.
The general equation (8) thus provides a quantitative assessment, through the coefficients I, s, a and b, of the magnitude of solute-solvent interactions as well as of the nature of the interactions. Regressions using equation (8) reproduce experimental log VG values, or other measures of gas solubility, with a standard deviation that approaches the experimental error of the measurements, and hence can be used to predict further log VG or other
values for solutes with known solvatochromic parameters.
Finally, but very importantly, we show that correlation equations used to investigate the solubility of gaseous solvents in non-polymeric solvents are applicable as such to a variety of polymeric materials. It is now possible, as we shall do in the future, to compare interactions between solutes and (rubbery) polymers with those between solutes and pure solvents in a qualitative and quantitative manner.
ACKNOW LEDGEM ENT
This work was carried out under US Navy Contract N 60921-84-C-0069.
REFERENCES1 Abraham, M. H., Kamlet, M. J., Taft, R. W. and Weathersby, P.
K. J. Am. Chem. Soc. 1983, 105, 67972 Abraham, M. H., Kamlet, M. J., Taft, R. W., Doherty, R. M. and
Weathersby, P. K. J. Med. Chem. 1985, 28, 8653 Kamlet, M. J., Doherty, R. M., Taft, R. W., Abraham, M. H . and
Koros, W. J. J. Am. Chem. Soc. 1984, 106, 12054 Kamlet, M. J., Abraham, M. H., Doherty, R. M. and Taft, R. W.
J. Am. Chem. Soc. 1984, 106, 4645 Taft, R. W., Abraham, M. H., Famini, G. R., Doherty, R. M.,
Abboud, J.-L. M. and Kamlet, M. J. J. Pharm. Sci. 1985,74,8076 Taft, R. W., Abraham, M. H., Doherty, R. M. and Kamlet, M. J.
Nature 1985, 313, 384
1368 POLYMER, 1987, Vol 28, July
7 Sadek, P. C., Carr, P. W., Doherty, R. M., Kamlet, M. J., Taft, 18 Abraham, M. H., Grellier, P. L. and McGill, R. A. J . Chem. Soc.R. W. and Abraham, M. H. Anal. Chem. 1985, 57, 2971 Perkin Trans. II , in press
8 Taft, R. W., Abboud, J.-L. M., Kamlet, M. J. and Abraham, M. 19 Klein, J. and Jeberien, H. E. Makromol. Chem. 1980,181, 1237H. J . Soln. Chem. 1985, 14, 153 20 Dincer, S. Bogazici Univ. Derg. Seri. Muhendislik 1976-77,4/5,1
9 Kamlet, M. J., Doherty, R. M., Abraham, M. H. and Taft, R. W. 21 W ard, T. C., Tseng, H.-S. and Lloyd, D. R. Polym. Commun.Carbon 1985, 23, 549 1984, 25, 262
10 Kamlet, M. J., Abraham, D. J., Doherty, R. M., Taft, R. W. and 22 Dangayach, K. C. B. and Bonner, D. C. Polym. Eng. Sci. 1980,Abraham, M. H. J. Pharm. Sci. 1986, 75, 350 20, 59
11 Kamlet, M. J., Doherty, R. M., Abboud, J.-L. M., Abraham, M. 23 Dincer, S. and Bonner, D. C. Macromolecules 1978, 11, 107H. and Taft, R. W. J . Pharm. Sci. 1986, 75, 338 24 Barrer, R. M., Barrie, J. A. and Slater, J. Polymer Sci. 1958, 27,
12 Galin, M. Polymer 1984, 25, 1784 17713 Galin, M. and Malinko, L. Macromolecules 1985, 18, 2192 25 Chern, R. T., Koros, W. J., Sanders, E. S., Chen, S. H. and14 Abraham, M. H . J . Am. Chem. Soc. 1979, 101, 5477 Hopfenberg, H. B. Am. Chem. Soc. Symp. Ser. 1983, 223, 4715 Abraham, M. H. J . Am. Chem. Soc. 1980, 102, 5910 26 Robb, W. L. Ann. N.Y. Acad. Sci. 1968, 146, 11916 Abraham, M. H. J . Am. Chem. Soc. 1982, 104, 2085 27 Fielding, R. and Salamonsen, R. F. J . Membrane Sci. 1979,5,31917 Bixler, H. J. and Sweeting, O. J. in ‘The Science and Technology 28 Allott, P. R„ Steward, A., Flook, V. and Mapleson, W. W.
of Polymer Films’, Vol. II (Ed. O. J. Sweeting), John Wiley, New Brit. J . Anaesth. 1973, 45, 294York, 1971 29 Steil, L. I. and Ham ish, D. F . Am. Inst. Chem. Eng. J . 1976,22,
117
t
POLYMER, 1987, Vol 28, July 1369
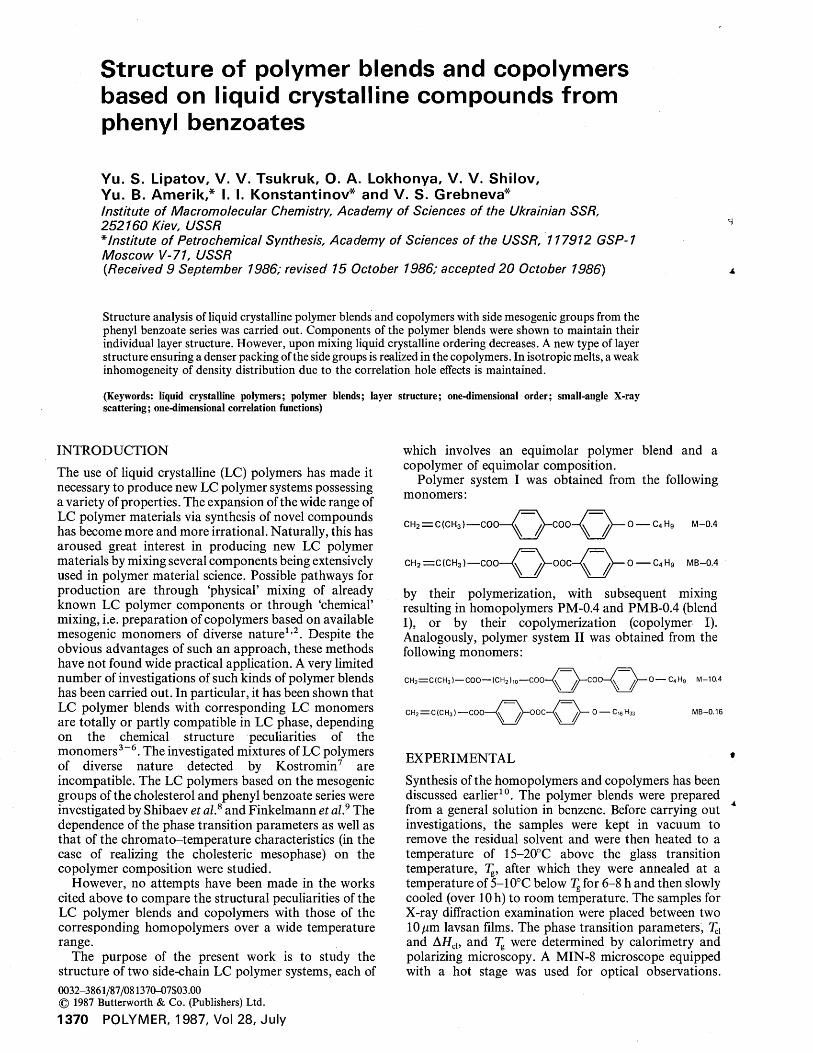
Structure of polymer blends and copolymers based on liquid crystalline compounds from phenyl benzoates
Yu. S. Lipatov, V. V. Tsukruk, O. A. Lokhonya, V. V. Shilov, Yu. B. Amerik,* I. I. Konstantinov* and V. S. Grebneva*Institute of Macromo/ecu/ar Chemistry, Academy of Sciences of the Ukrainian SSR, 252160 Kiev, USSR* Institute of Petrochemical Synthesis, Academy of Sciences of the USSR, 117912 GSP-1 M oscow V-71, USSR(,Received 9 September 1986; revised 15 October 1986; accepted 20 October 1986)
Structure analysis of liquid crystalline polymer blends and copolymers with side mesogenic groups from the phenyl benzoate series was carried out. Components of the polymer blends were shown to maintain their individual layer structure. However, upon mixing liquid crystalline ordering decreases. A new type of layer structure ensuring a denser packing of the side groups is realized in the copolymers. In isotropic melts, a weak inhomogeneity of density distribution due to the correlation hole effects is maintained.
(Keywords: liquid crystalline polymers; polymer blends; layer structure; one-dimensional order; small-angle X-ray scattering; one-dimensional correlation functions)
INTRO DUCTIO N
The use of liquid crystalline (LC) polymers has made it necessary to produce new LC polymer systems possessing a variety of properties. The expansion of the wide range of LC polymer materials via synthesis of novel compounds has become more and more irrational. Naturally, this has aroused great interest in producing new LC polymer materials by mixing several components being extensively used in polymer material science. Possible pathways for production are through ‘physical’ mixing of already known LC polymer components or through ‘chemical’ mixing, i.e. preparation of copolymers based on available mesogenic monomers of diverse nature1,2. Despite the obvious advantages of such an approach, these methods have not found wide practical application. A very limited number of investigations of such kinds of polymer blends has been carried out. In particular, it has been shown that LC polymer blends with corresponding LC monomers are totally or partly compatible in LC phase, depending on the chemical structure peculiarities of the monomers3-6. The investigated mixtures of LC polymers of diverse nature detected by Kostromin7 are incompatible. The LC polymers based on the mesogenic groups of the cholesterol and phenyl benzoate series were investigated by Shibaev et al.8 and Finkelmann et al.9 The dependence of the phase transition parameters as well as that of the chromato-temperature characteristics (in the case of realizing the cholesteric mesophase) on the copolymer composition were studied.
However, no attempts have been made in the works cited above to compare the structural peculiarities of the LC polymer blends and copolymers with those of the corresponding homopolymers over a wide temperature range.
The purpose of the present work is to study the structure of two side-chain LC polymer systems, each of0032-3861/87/081370-07S03.00 © 1987 Butterworth & Co. (Publishers) Ltd.
1370 POLYMER, 1987, Vol 28, July
which involves an equimolar polymer blend and a copolymer of equimolar composition.
Polymer system I was obtained from the following monomers:
0 c4 H9 M—0.4CH2 = C(CH3)— coo- -coo-
CH2=C(CH3)— coo- O C4H9 MB—0.4OOC-
by their polymerization, with subsequent mixing resulting in homopolymers PM-0.4 and PMB-0.4 (blend I), or by their copolymerization (copolymer I). Analogously, polymer system II was obtained from the following monomers:
:C(CH3)—COO—(CH2)i0—COO-
ch2= c(c h 3)— coo-
EXPERIMENTAL
Synthesis of the homopolymers and copolymers has been discussed earlier10. The polymer blends were prepared from a general solution in benzene. Before carrying out investigations, the samples were kept in vacuum to remove the residual solvent and were then heated to a temperature of 15-20°C above the glass transition temperature, Tg, after which they were annealed at a temperature of 5-10°C below Tg for 6-8 h and then slowly cooled (over 10 h) to room temperature. The samples for X-ray diffraction examination were placed between two 10 pm lavsan films. The phase transition parameters, Td and AHcl, and Tg were determined by calorimetry and polarizing microscopy. A MIN-8 microscope equipped with a hot stage was used for optical observations.
Journal o f Chromatography, 409 (1987) 15-27Elsevier Science Publishers B.V., Amsterdam — Printed in The Netherlands
CHROM. 19 926
SOLUBILITY PROPERTIES IN POLYMERS A N D BIOLOGICAL M EDIA
II. A NEW METHOD FOR THE CHARACTERISATION OF THE ADSORPTION OF GASES A N D VAPOURS ON SOLIDS
MICHAEL H. ABRAHAM*, GABRIEL J. BUIST, PRISCILLA L. GRELLIER and R. ANDREW McGILLDepartment o f Chemistry, University o f Surrey, Guildford, Surrey GU2 5X H (U.K.)RUTH M. DOHERTY and M O RTIM ER J. KAM LETNaval Surface Weapons Centre, White Oak Laboratory, Silver Spring, M D 20910 (U .S.A .)ROBERT W. TAFTDepartment o f Chemistry, University o f California, Irvine, CA 92717 (U .S.A .) andSTEPHEN G. MAROLDORohm and Haas Company, Research Laboratories, 727 Norristown Road, Spring House, PA 19477 (U .S.A .) (First received May 5th, 1987; revised manuscript received August 6th, 1987)
SUMMARY
Henry’s constants at zero solute pressure have been determined by the gas chromatographic peak shape method for twenty-two solutes on four adsorbents (Rohm and Haas Ambersorb® XE-348F carbonaceous adsorbent at 323 and 373 K, Sutcliffe Speakman 207A and 207C at 323 K, and Calgon Filtrasorb® activated carbon at 323 K). The limiting values o f log IsP have been analysed in terms o f solute dipolarity (zrf), solute hydrogen-bond acidity (a2), and basicity (/?2), and a new solute parameter (log L16), the solute Ostwald absorption coefficient on n-hexadecane. The multiple linear regression equation,
SP = SP0 + / • log L16 + s(n% + dd2) + aot2 + bfi2
where in this instance SP = —log KP, can be used to identify the nature o f the solute-adsorbent interactions, and to predict further values o f log X11. For the solutes and solids we have studied, only the / • log L 16 term is statistically significant, and hence — log fP1 is proportional to / • log L16. It is concluded that interactions between the gaseous solutes (that include alcohols and amines) and the four adsorbents involve just general dispersion forces.
INTRODUCTION
In previous parts o f this series, and elsewhere, we have used the general equa-
0021-9673/87/S03.50 © 1987 Elsevier Science Publishers B.V.
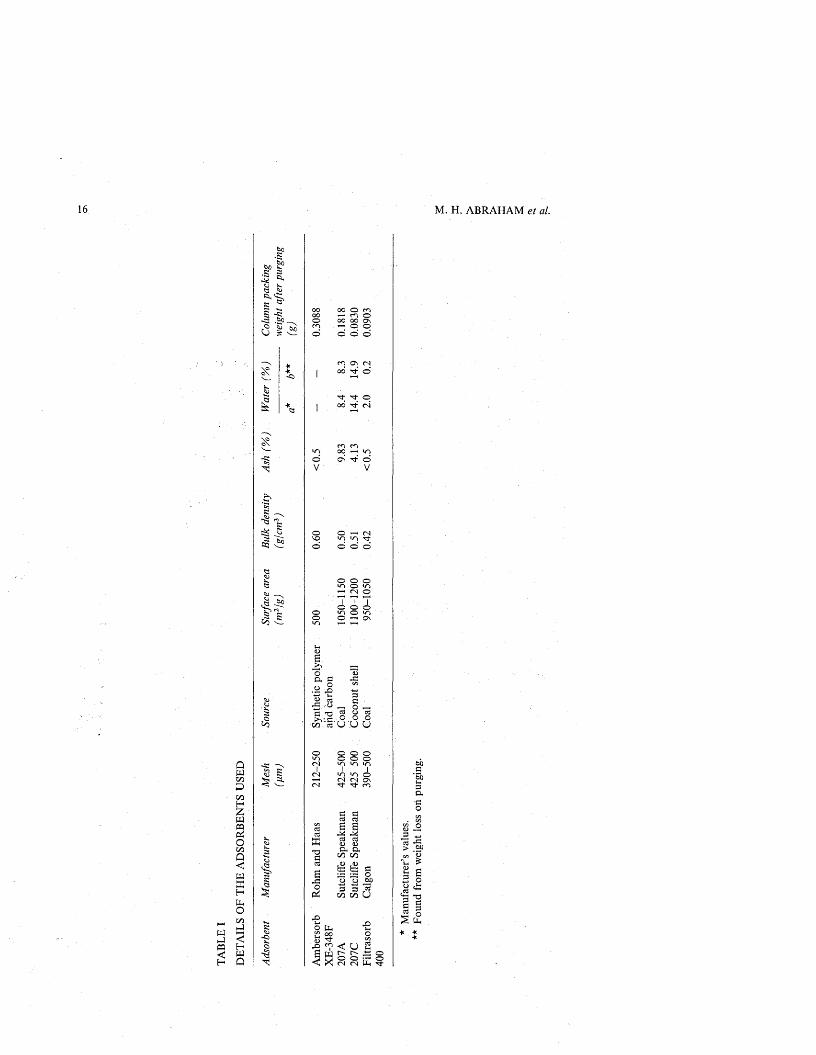
16 M. H. ABRAHAM et al.
•£?S? too
co ON (N OO 'J-' O'3;OC Tt
Co >,-c ■ ° ° ° do'5 u U U
QWx/iXooH£WcapSO00Q<wXHtL,o
o o o o o ol/o 00 00 I I I 00 00 oCN fN Os 'J’ CO
s acS C3a acd a o <uta eU S ™PS m m U
JD*-* r -Oo Uh2 00 O
x) <? < u a S w g g S g<1 X (N <N Ph "'t
13 > 60co ’S"u £s apH
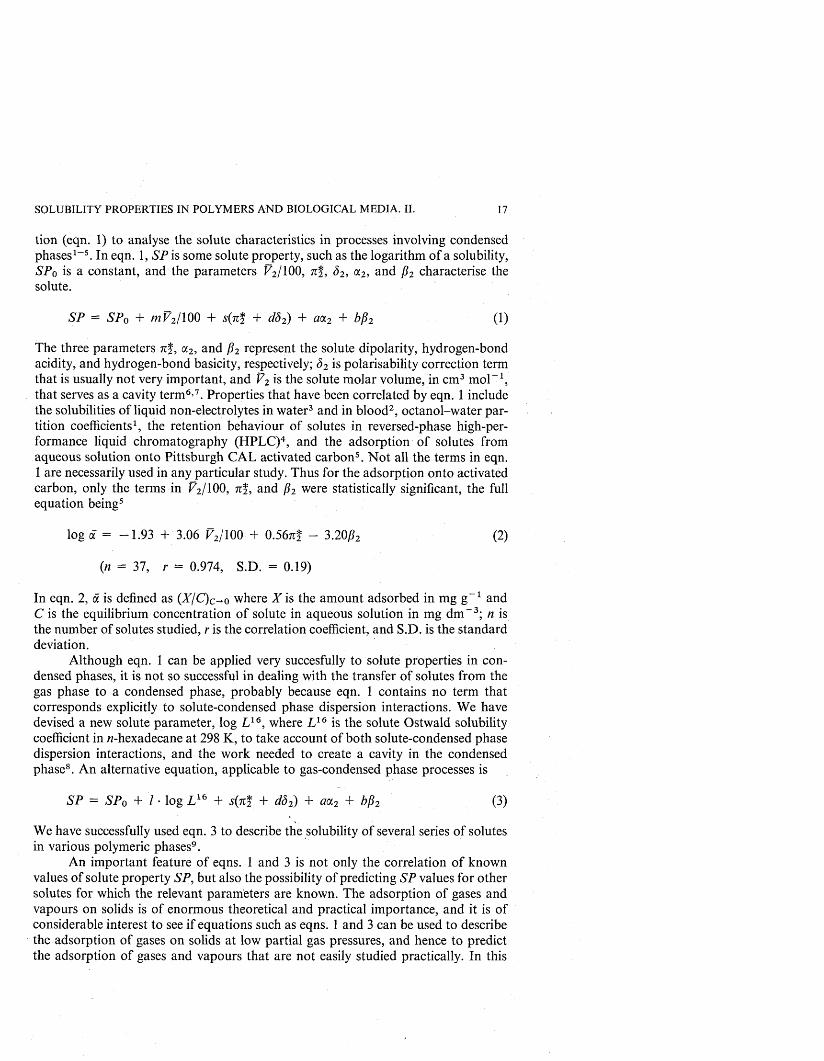
SOLUBILITY PROPERTIES IN POLYMERS AND BIOLOGICAL MEDIA. II. 17
tion (eqn. 1) to analyse the solute characteristics in processes involving condensed phases1-5. In eqn. 1, SP is some solute property, such as the logarithm o f a solubility, SP0 is a constant, and the parameters K2/100, n*, d2, «2, and /?2 characterise the solute.
SP = SP0 + m V 2/100 + s(n% + dd2) + aoc2 + bfo (1)The three parameters n2, a2, and /i2 represent the solute dipolarity, hydrogen-bond acidity, and hydrogen-bond basicity, respectively; d2 is polarisability correction term that is usually not very important, and V2 is the solute molar volume, in cm3 m ol-1 , that serves as a cavity term6’7. Properties that have been correlated by eqn. 1 include the solubilities o f liquid non-electrolytes in water3 and in blood2, octanol-water partition coefficients1, the retention behaviour o f solutes in reversed-phase high-performance liquid chromatography (HPLC)4, and the adsorption o f solutes from aqueous solution onto Pittsburgh CAL activated carbon5. N ot all the terms in eqn. 1 are necessarily used in any particular study. Thus for the adsorption onto activated carbon, only the terms in P2/100, n2, and /?2 were statistically significant, the full equation being5
log a = -1 .9 3 + 3.06 F2/100 + 0.56tt! - 3.20&, (2)
(n = 37, r = 0.974, S.D. = 0.19)
In eqn. 2, a is defined as (X /C )c-*o where X is the amount adsorbed in mg g -1 and C is the equilibrium concentration o f solute in aqueous solution in mg dm -3 ; n is the number o f solutes studied, r is the correlation coefficient, and S.D. is the standard deviation.
Although eqn. 1 can be applied very succesfully to solute properties in condensed phases, it is not so successful in dealing with the transfer o f solutes from the gas phase to a condensed phase, probably because eqn. 1 contains no term that corresponds explicitly to solute-condensed phase dispersion interactions. We have devised a new solute parameter, log L 16, where L 16 is the solute Ostwald solubility coefficient in w-hexadecane at 298 K, to take account o f both solute-condensed phase dispersion interactions, and the work needed to create a cavity in the condensed phase8. An alternative equation, applicable to gas-condensed phase processes is
SP = SP0 + / • log L 16 + s(n* + dd2) + aa2 + bfi2 (3)
We have successfully used eqn. 3 to describe the solubility o f several series o f solutes in various polymeric phases9.
An important feature o f eqns. 1 and 3 is not only the correlation o f known values o f solute property SP, but also the possibility o f predicting SP values for other solutes for which the relevant parameters are known. The adsorption o f gases and vapours on solids is o f enormous theoretical and practical importance, and it is o f considerable interest to see if equations such as eqns. 1 and 3 can be used to describe the adsorption o f gases on solids at low partial gas pressures, and hence to predict the adsorption o f gases and vapours that are not easily studied practically. In this
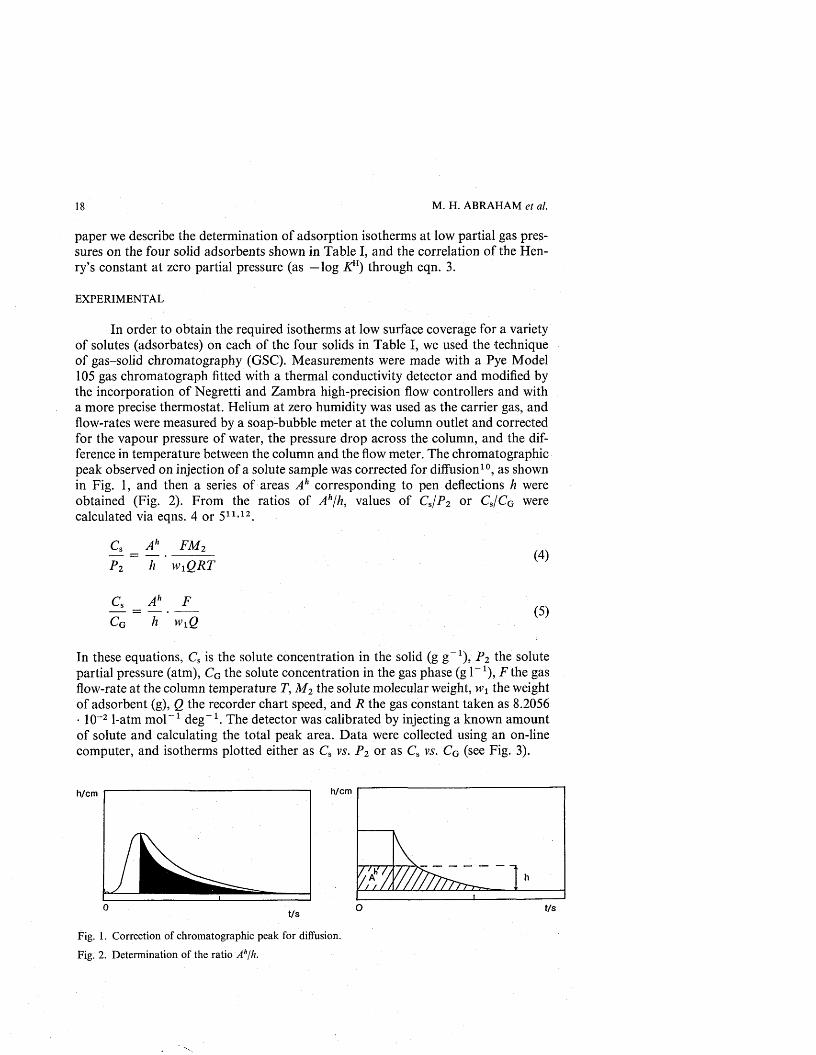
18 M. H. ABRAHAM et al.
paper we describe the determination o f adsorption isotherms at low partial gas pressures on the four solid adsorbents shown in Table I, and the correlation o f the Henry’s constant at zero partial pressure (as —log K through eqn. 3.
EXPERIM ENTAL
In order to obtain the required isotherms at low surface coverage for a variety of solutes (adsorbates) on each o f the four solids in Table I, we used the technique of gas-solid chromatography (GSC). Measurements were made with a Pye Model 105 gas chromatograph fitted with a thermal conductivity detector and modified by the incorporation o f Negretti and Zambra high-precision flow controllers and with a more precise thermostat. Helium at zero humidity was used as the carrier gas, and flow-rates were measured by a soap-bubble meter at the column outlet and corrected for the vapour pressure of water, the pressure drop across the column, and the difference in temperature between the column and the flow meter. The chromatographic peak observed on injection o f a solute sample was corrected for diffusion10, as shown in Fig. 1, and then a series o f areas A h corresponding to pen deflections h were obtained (Fig. 2). From the ratios o f A H/h, values o f Cs/P 2 or CS/CG were calculated via eqns. 4 or 511>12.
CsP i
A*_ f m 2h w xQ R T
(4)
£lCg h wxQ
(5)
In these equations, Cs is the solute concentration in the solid (g g -1 ), P 2 the solute partial pressure (atm), CG the solute concentration in the gas phase (g l -1 ), F the gas flow-rate at the column temperature T, M 2 the solute molecular weight, wx the weight of adsorbent (g), Q the recorder chart speed, and R the gas constant taken as 8.2056 • 10-2 1-atm mol - 1 deg-1 . The detector was calibrated by injecting a known amount of solute and calculating the total peak area. Data were collected using an on-line computer, and isotherms plotted either as Cs vs. P 2 or as Cs vs. CG (see Fig. 3).
h/cm h/cm
1. . h .
i
t/s
Fig. 1. Correction of chromatographic peak for diffusion.
Fig. 2. Determination of the ratio AH/h.
t/s
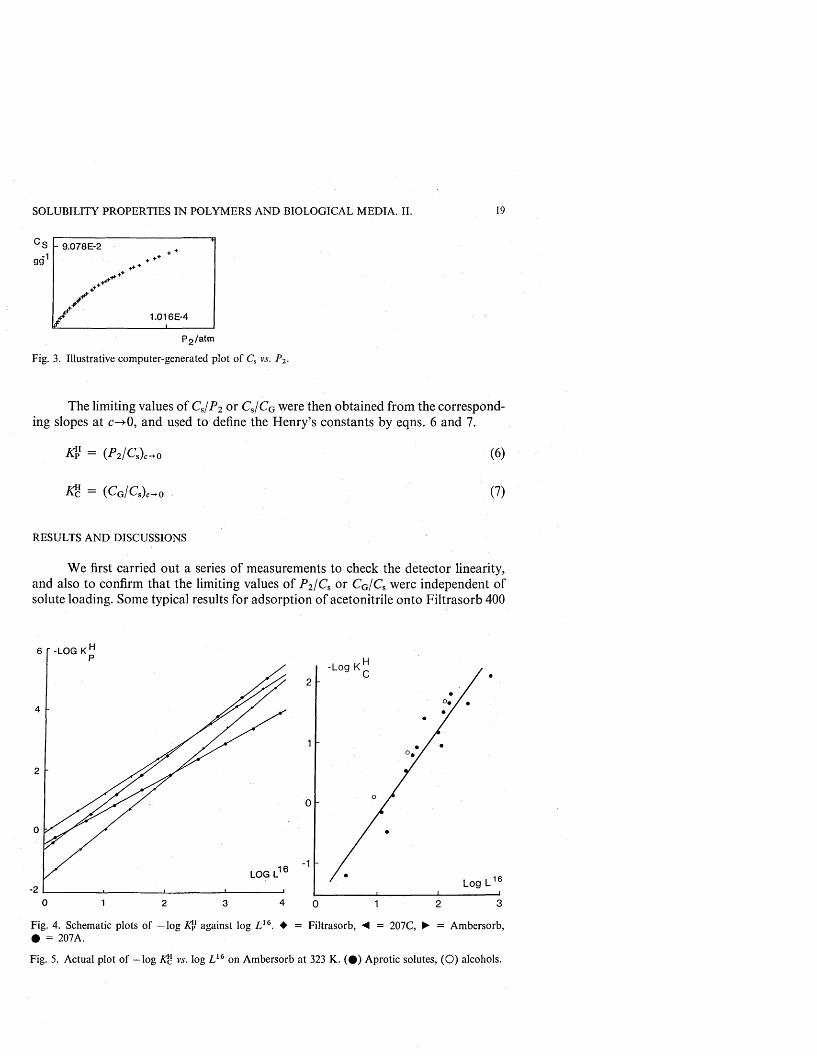
SOLUBILITY PROPERTIES IN POLYMERS AND BIOLOGICAL M EDIA. II. 19
'S - 9 .078E-2
gg1 ++ +
1.016E-4
P2 /atm
Fig. 3. Illustrative computer-generated plot o f Cs vs. P2-
The limiting values o f Cs/P 2 or CS/CG were then obtained from the corresponding slopes at 0, and used to define the Henry’s constants by eqns. 6 and 7.
A? = (P2I Q U 0
*2 = (Cg/Cs)c.o
(6)(7)
RESULTS AND DISCUSSIONS
We first carried out a series of measurements to check the detector linearity, and also to confirm that the limiting values o f P 2/C s or CG/CS were independent of solute loading. Some typical results for adsorption o f acetonitrile onto Filtrasorb 400
r -LOG K
LOG L
0 41 2 3
-Log K2
1
0
1
Log L30 1 2
Fig. 4. Schematic plots of —log Ap1 against log L 16. ♦ = Filtrasorb, < = 207C, ► = Ambersorb, • = 207A.
Fig. 5. Actual plot of —log Ac vs. log L 16 on Ambersorb at 323 K. ( # ) Aprotic solutes, (O ) alcohols.
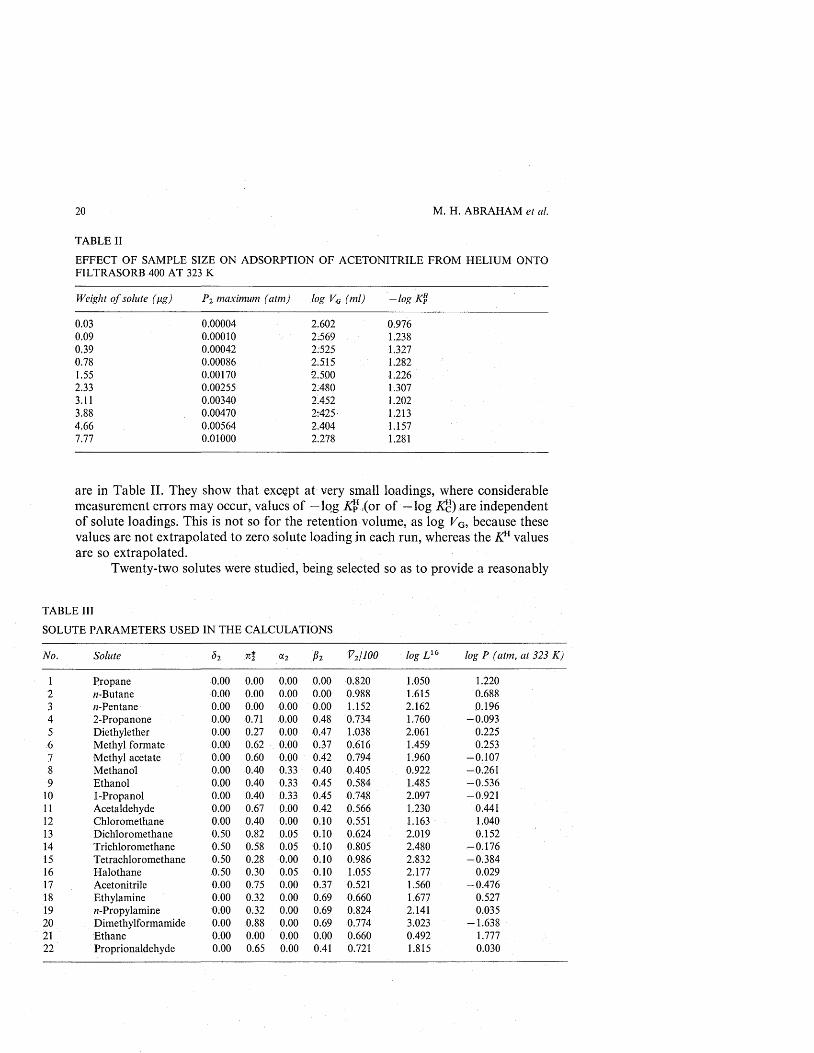
20 M. H. ABRAHAM et al.
TABLE IIEFFECT OF SAMPLE SIZE ON ADSORPTION O F ACETONITRILE FROM HELIUM ONTO FILTRASORB 400 AT 323 K
Weight o f solute (fig) P2 maximum (atm) log VG (ml) - lo g K ?
0.03 0.00004 2.602 0.9760.09 0.00010 2.569 1.2380.39 0.00042 2:525 1.3270.78 0.00086 2.515 1.2821.55 0.00170 2.500 1.2262.33 0.00255 2.480 1.3073.11 0.00340 2.452 1.2023.88 0.00470 2:425- 1.2134.66 0.00564 2.404 1.1577.77 0.01000 2.278 1.281
are in Table II. They show that except at very small loadings, where considerable measurement errors may occur, values o f — log ,(or o f — log Xc) are independent of solute loadings. This is not so for the retention volume, as log VG, because these values are not extrapolated to zero solute loading in each run, whereas the K11 values are so extrapolated.
Twenty-two solutes were studied, being selected so as to provide a reasonably
TABLE III
SOLUTE PARAM ETERS USED IN THE CALCULATIONS
No. Solute <52 7r*712 a2 h V2/100 log L 16 log P ( atm, at 323 K)
1 Propane 0.00 0.00 0.00 0.00 0.820 1.050 1.2202 tt-Butane 0.00 0.00 0.00 0.00 0.988 1.615 0.6883 n-Pentane 0.00 0.00 0.00 0.00 1.152 2.162 0.1964 2-Propanone .0.00 0.71 0.00 0.48 0.734 1.760 -0 .0 9 35 Diethylether 0.00 0.27 0.00 0.47 1.038 2.061 0.2256 Methyl formate 0.00 0.62 0.00 0.37 0.616 1.459 0.2537 Methyl acetate 0.00 0.60 0.00 0.42 0.794 1.960 -0 .1 0 78 M ethanol 0.00 0.40 0.33 0.40 0.405 0.922 -0 .2619 Ethanol 0.00 0.40 0.33 0.45 0.584 1.485 -0 .5 3 6
10 1-Propanol 0.00 0.40 0.33 0.45 0.748 2.097 -0 .92111 Acetaldehyde 0.00 0.67 0.00 0.42 0.566 1,230 0.44112 Chloromethane 0.00 0.40 0.00 0.10 0.551 1.163 1.04013 Dichloromethane 0,50 0.82 0.05 0.10 0.624 2.019 0.15214 T richloromethane 0.50 0.58 0.05 0.10 0.805 2.480 —0.17615 Tetrachloromethane 0.50 0.28 0.00 0.10 0.986 2.832 -0 .3 8 416 Halothane 0.50 0.30 0.05 0.10 1.055 2.177 0.02917 Acetonitrile 0.00 0.75 0.00 0.37 0.521 1.560 -0 .4 7 618 Ethylamine 0.00 0.32 0.00 0.69 0.660 1.677 0.52719 n-Propylamine 0.00 0.32 0.00 0.69 0.824 2.141 0.03520 Dimethylformamide 0.00 0.88 0.00 0.69 ■0.774 3.023 -1 .6 3 821 Ethane 0.00 0.00 0.00 0.00 0.660 0.492 1.77722 Proprionaldehyde 0.00 0.65 0.00 0.41 0.721 1.815 0.030

SOLUBILITY PROPERTIES IN POLYMERS AND BIOLOGICAL MEDIA. II. 21wide range o f dipolarity, and hydrogen-bonding ability. The solutes together with the parameters used in the regression equations are given in Table III. Also given are the vapour pressures o f the solutes at 323 K, as log P° where P° is in atm. Results for the adsorption from helium onto all four solids at 323 K and also onto Ambersorb XE-348F at 373 K are given in Table IV, as values o f —log Kp, — log Xc, and log VG. By inspection o f the results, it is quite difficult to deduce the factors that contribute to adsorption, and even to rank the four solids as regards adsorptive power. The method o f multiple regression analysis is here very useful, and the full regression equations, using both the general eqn. 1 and eqn. 3, are given in Tables V and VI. Of these, eqn. 3 is always the most satisfactory, and we shall interpret our results only in terms o f eqn. 3, and not consider eqn. 1 further. For all four solids, the only generally significant term in the regression equation is / • log L 16; the dipolarity term sn t contributes marginally in a few cases. Hence we can conclude that interactions on the solids o f hydrogen-bonding type, and probably also o f dipolarity, are absent, and that the dominant interaction is one involving general dispersion forces. Since our K11 values refer to zero solute concentration, this conclusion actually refers to a state o f very low surface coverage, where solute-solute interactions will be very small or non-existant. We can therefore, be more specific in our conclusion and state that the dominant solute-solid interaction is one o f general dispersion forces. Indeed, because the terms in a2, and /?2 are so small, a single regression equation,
SP = SP0 + I- log L 16 (8)
will suffice to characterise the adsorption on the particular solids used in the present work. Details o f eqn. 8 with SP as —log K” are in Table VII. Because the slopes in eqn. 8 are different for the different solids, the relative adsorption power o f the solids alters according to solute log L 16 values, as shown schematically in Fig. 4. Thus with solutes o f low log L 16 values (generally small solutes) the most powerful adsorbents are 207C and 207A, but with solutes o f large log L 16 values the best adsorbents are Filtrasorb and Ambersorb. An actual plot o f log Kc vs. log L 16 is shown in Fig. 5.
As it turns out, the usefulness o f eqn. 3 in the present work is limited, because o f the nature o f the solute-adsorbent interactions. However, if studies are carried out o f adsorption processes that do involve hydrogen-bond interactions, or dipolar interactions, eqn. 3 will be o f very great value in assessing the contribution o f various interactions, and in predicting the adsorption o f other solutes for which parameters are known. Furthermore, the present work has been carried out at zero relative humidity. We know, from our previous studies5, that in adsorption from aqueous solution onto the Pittsburgh CAL activated carbon the solute hydrogen-bond basicity is extremely important, eqn. 2, and we therefore, expect that adsorption from the gas phase at high relative humidities might also be dependent on solute basicity as well as on the P/100 or log L 16 term.
There have been no previous applications o f any general equation on the lines of eqn. 3 to the problem o f prediction of adsorption o f gases or vapours on solids. Snyder13 has reviewed progress up to 1968, but predictive equations were in general limited to semi-empirical methods. More recently, Kiselev et al.14 calculated retention volumes on graphitised carbon black, using atom-atom potential functions for
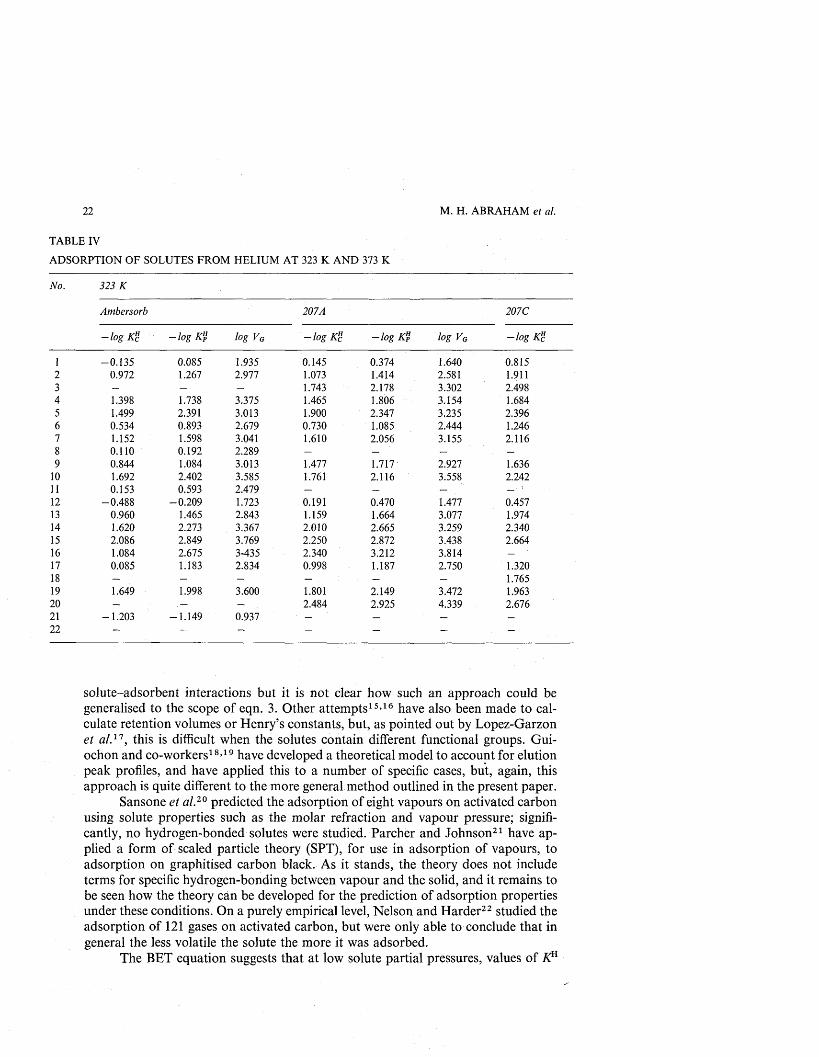
22 M. H. ABRAHAM et al.
TABLE IVADSORPTION OF SOLUTES FROM HELIUM AT 323 K AND 373 KNo. 323 K
Ambersorb 207A 207C
— log Kc - lo g K1,! log VG - lo g K'(! - lo g K? log VG - lo g K%
1 -0 .1 3 5 0.085 1.935 0.145 0.374 1.640 0.8152 0.972 1.267 2.977 1.073 1.414 2.581 1.9113 — 1.743 2.178 3.302 2.4984 1.398 1.738 3.378 1.465 1.806 3.154 1.6845 1.499 2.391 3.013 1.900 2.347 3.235 2.3966 0.534 0.893 2.679 0.730 1.085 2.444 1.2467 1.152 1.598 3.041 1.610 2.056 3.155 2.1168 0.110 0.192 2.289 — — —
9 0.844 1.084 3.013 1.477 1.717 2.927 1.63610 1.692 2.402 3.585 1.761 2.116 3.558 2.24211 0.153 0.593 2.479 — — — ■ 112 -0 .488 -0 .2 0 9 1.723 0.191 0.470 1.477 0.45713 0.960 1.465 2.843 1.159 1.664 3.077 1.97414 1.620 2.273 3.367 2.010 2.665 3.259 2.34015 2.086 2.849 3.769 2.250 2.872 3.438 2.66416 1.084 2.675 3-435 2.340 3.212 3.81417 0.085 1.183 2.834 0.998 1.187 2.750 1.32018 — — — 1.76519 1.649 1.998 3.609 1.801 2.149 3.472 1.96320 - 2.484 2.925 4.339 2.67621 -1 .203 - 1.149 0.9 3 7 - - - -
22 _ — — — —
solute-adsorbent interactions but it is not clear how such an approach could be generalised to the scope o f eqn. 3. Other attempts15-16 have also been made to calculate retention volumes or Henry’s constants, but, as pointed out by Lopez-Garzon et a l.11, this is difficult when the solutes contain different functional groups. Gui- ochon and co-workers18-19 have developed a theoretical model to account for elution peak profiles, and have applied this to a number of specific cases, but, again, this approach is quite different to the more general method outlined in the present paper.
Sansone et al.20 predicted the adsorption o f eight vapours on activated carbon using solute properties such as the molar refraction and vapour pressure; significantly, no hydrogen-bonded solutes were studied. Parcher and Johnson21 have applied a form o f scaled particle theory (SPT), for use in adsorption o f vapours, to adsorption on graphitised carbon black. As it stands, the theory does not include terms for specific hydrogen-bonding between vapour and the solid, and it remains to be seen how the theory can be developed for the prediction o f adsorption properties under these conditions. On a purely empirical level, Nelson and Harder22 studied the adsorption o f 121 gases on activated carbon, but were only able to conclude that in general the less volatile the solute the more it was adsorbed.
The BET equation suggests that at low solute partial pressures, values o f K11
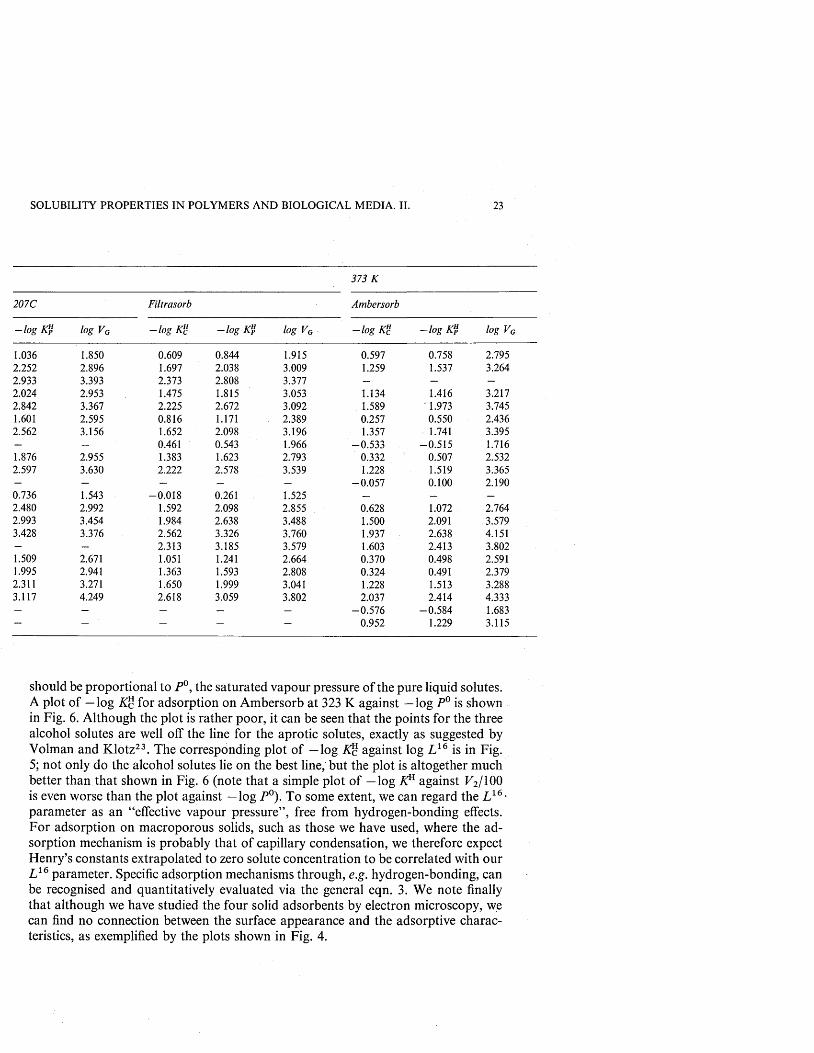
SOLUBILITY PROPERTIES IN POLYMERS AND BIOLOGICAL MEDIA. II. 23
373 K
207C Filtrasorb Ambersorb
- lo g K" log VG
*41
1
- lo g 0 log VG - lo g 0 - lo g 0 log VG
1.036 1.850 0.609 0.844 1.915 0.597 0.758 2.7952.252 2.896 1.697 2.038 3.009 1.259 1.537 3.2642.933 3.393 2.373 2.808 3.377 — — —2.024 2.953 1.475 1.815 3.053 1.134 1.416 3.2172.842 3.367 2.225 2.672 3.092 1.589 1.973 3.7451.601 2.595 0.816 1.171 2.389 0.257 0.550 2.4362.562 3.156 1.652 2.098 3.196 1.357 1.741 3.395— — 0.461 0.543 1.966 -0 .5 3 3 -0 .5 1 5 1.7161.876 2.955 1.383 1.623 2.793 0.332 0.507 2.5322.597 3.630 2.222 2.578 3.539 1.228 1.519 3.365- — — — -0 .0 5 7 0.100 2.1900.736 1.543 -0 .0 1 8 0.261 1.525 — — —2.480 2.992 1.592 2.098 2.855 0.628 1.072 2.7642.993 3.454 1.984 2.638 3.488 1.500 2.091 3.5793.428 3.376 2.562 3.326 3.760 1.937 2.638 4.151- — 2.313 3.185 3.579 1.603 2.413 3.8021.509 2.671 1.051 1.241 2.664 0.370 0.498 2.5911.995 2.941 1.363 1.593 2.808 0.324 0.491 2.3792.311 3.271 1.650 1.999 3.041 1.228 1.513 3.2883.117 4.249 2.618 3.059 3.802 2.037 2.414 4.333- - - — — -0 .5 7 6 -0 .5 8 4 1.683— — — — - 0.952 1.229 3.115
should be proportional to P°, the saturated vapour pressure o f the pure liquid solutes. A plot o f —log for adsorption on Ambersorb at 323 K against —log P° is shown in Fig. 6. Although the plot is rather poor, it can be seen that the points for the three alcohol solutes are well off the line for the aprotic solutes, exactly as suggested by Volman and Klotz23. The corresponding plot o f —log against log L 16 is in Fig. 5; not only do the alcohol solutes lie on the best line, but the plot is altogether much better than that shown in Fig. 6 (note that a simple plot o f —log K11 against K2/100 is even worse than the plot against —log P°). To some extent, we can regard the L 16 • parameter as an “effective vapour pressure”, free from hydrogen-bonding effects. For adsorption on macroporous solids, such as those we have used, where the adsorption mechanism is probably that o f capillary condensation, we therefore expect Henry’s constants extrapolated to zero solute concentration to be correlated with our L 16 parameter. Specific aclsorption mechanisms through, e.g. hydrogen-bonding, can be recognised and quantitatively evaluated via the general eqn. 3. We note finally that although we have studied the four solid adsorbents by electron microscopy, we can find no connection between the surface appearance and the adsorptive characteristics, as exemplified by the plots shown in Fig. 4.
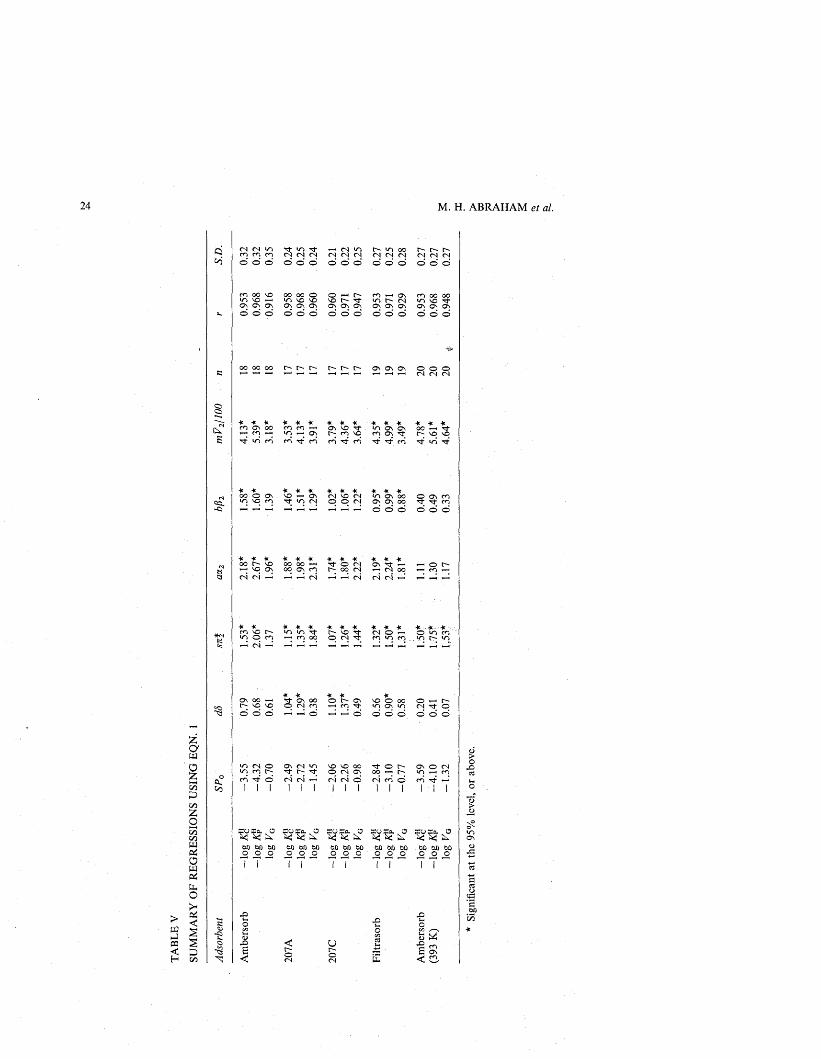
SUM
MA
RY
OF
R
EGR
ESS
ION
S US
ING
EQN
. 1
24 M. H. ABRAHAM et al.
© © © o o o o o o o o <N (N <N© ©* © ©
m oo vo in vo i—i Os Os Os
OO 00 ©in vo voOs Os Os
m *—< os m oo ooin r*- in voOs Os Os Os OS Os
© © © © © © © © © © © © © © ©
oo oo oo r- i> os os os © © ©
+ * * * * * * * * + + * * * *m on oo <n m i— < as so ^ . in ov on oo »— < rth ri m i n ^ o v h m vo m ov rt vo vo^ in rn <nrfcn rn n Tt rt ri ^ in tj-
+ * * * + *oo r-- vo oo oo i-<^ vo on oo on m(N (N ^ ^ ^ (N
© © © © © ©
* * * * * * * •■•* - *r- vo rf (N © o m m© cn m in m in «n
© r-~ on © © ooh rn rt in on in^ © © © ©
on <n in r- t (N (N ^111 I (N (N O
Tf © 00 *-h cs cnII III III
r u K a - O S U S q. k O S U S d. S O S a , O s u r a , a
OX) 00 00 00 oo 00o o o o o o7 7" 7 7 "
upH

SUM
MA
RY
OF
R
EGR
ESSI
ON
S US
ING
EQN
. 3
SOLUBILITY PROPERTIES IN POLYMERS AND BIOLOGICAL MEDIA. II. 25
bo
vo cn t**- h rf m(N m (S cn ro roO O O O O O
o oo m Tt t-* vovo vo vo m (NON Ov O n O n O n O nO O O O O O
ON 0 O ^ t O N O CN rOCN ro CN O O (N M m (NO O O o o o o o o
r o t - - r o ON VO CNCN CO T f ON O n ON
OOn On On O O O
OO UN rj-VO v o VO On On On O O O *
+ * * * * * * * *r - Tj- on h v o o oO CN O m r t o r r v o r f
O t-H ^
v o O n ^ o o v o v ov o O CN ON oo ^ d d d
1-Ho o d O ’—1*—'I I I
TT 00 ONo * v o o n O O O
ON ON T fvo vo CN O O - o o d o o o
o o o o o o o o oI I I I I IC— OO COo o dI I I
CN CN r o VO NO d d o
VO CNd d I I I I I
r - o o o c n r o O n v o v o onO v o r o « 1 0 *— c N o r -d d vo o o o CN
^ ^ O n t-- CO VO^ ©vo vo vo O O ooo d d v o o o o o
i i i i
=0=0. kO U=o. D SUIa-.O =u=a.kO SO?M.U .£0. k U £0. k t-GU k NJ
I I
uPh '
Ut
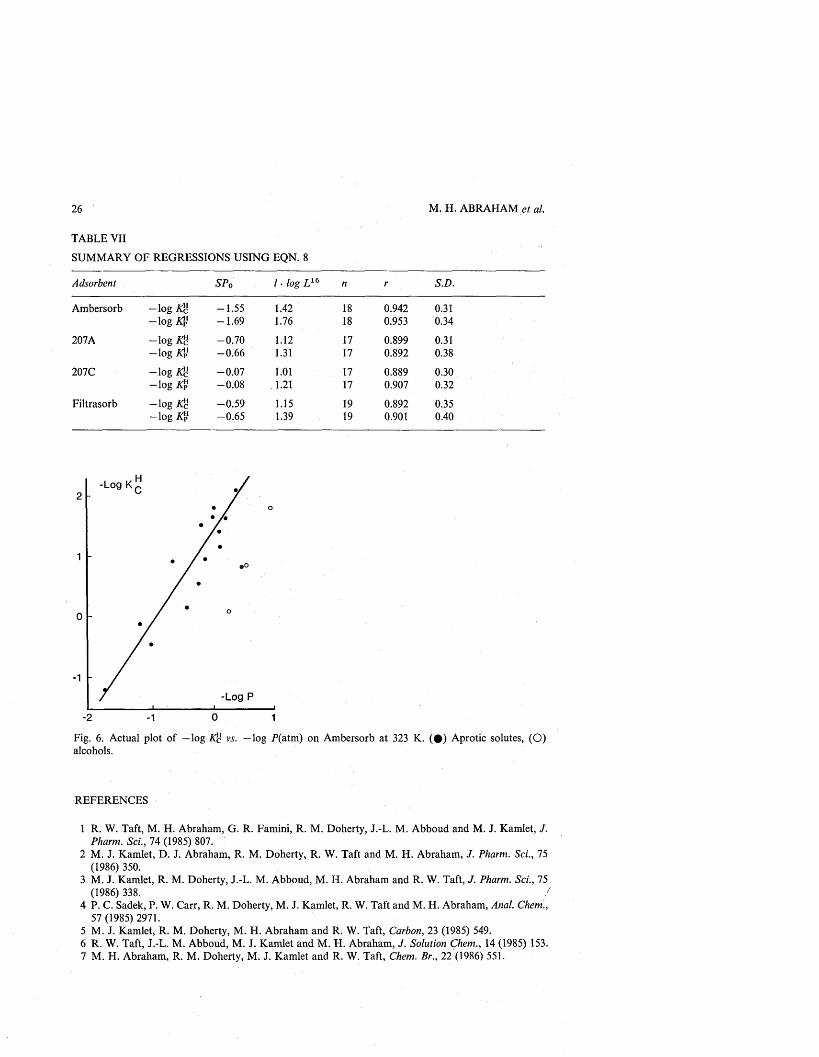
26 M. H. ABRAHAM et al.
TABLE VIISUMMARY OF REGRESSIONS USING EQN. 8Adsorbent SP0 I • log L 16 n r S.D.
Ambersorb - lo g -1 .5 5 1.42 18 0.942 0.31- lo g -1 .6 9 1.76 18 0.953 0.34
207A - lo g Kc -0 .7 0 1.12 17 0.899 0.31- lo g Kj.1 - 0.66 1.31 17 0.892 0.38
207C - lo g Ag -0 .0 7 1.01 17 0.889 0.30- lo g K$ -0 .0 8 1.21 17 0.907 0.32
Filtrasorb - lo g Ag -0 .5 9 1.15 19 0.892 0.35- l o g A? -0 .6 5 1.39 19 0.901 0.40
-Log K2
1 •O
0
1
-Log P
02 11Fig. 6. Actual plot of —log A'c vs. —log P(atm) on Ambersorb at 323 K. ( # ) Aprotic solutes, (O ) alcohols.
REFERENCES
1 R. W. Taft, M. H. Abraham, G. R. Famini, R. M. Doherty, J.-L. M. Abboud and M. J. Kamlet, J. Pharm. Sci., 74 (1985) 807.
2 M. J. Kamlet, D. J. Abraham, R. M. Doherty, R. W. Taft and M. H. Abraham, J. Pharm. Sci., 75 (1986) 350.
3 M. J. Kamlet, R. M. Doherty, J.-L. M. Abboud, M. H. Abraham and R. W. Taft, J. Pharm. Sci., 75 (1986) 338. /
4 P. C. Sadek, P. W. Carr, R. M. Doherty, M. J. Kamlet, R. W. Taft and M. H. Abraham, Anal. Chem., 57 (1985) 2971.
5 M. J. Kamlet, R. M. Doherty, M. H. Abraham and R. W. Taft, Carbon, 23 (1985) 549.6 R. W. Taft, J.-L. M. Abboud, M. J. Kamlet and M. H. Abraham, J. Solution Chem., 14 (1985) 153.7 M. H. Abraham, R. M. Doherty, M. J. Kamlet and R. W. Taft, Chem. Br., 22 (1986) 551.

SOLUBILITY PROPERTIES IN POLYMERS AND BIOLOGICAL MEDIA. II. 27
8 M. H. Abraham, P. L. Grellier and R. A. McGill, J. Chem. Soc. Faraday Trans. 1, (1987) 797.9 M. H. Abraham, P. L. Grellier, R. A. McGill, R. M. Doherty, M. J. Kamlet, T. N. Hall, R. W. Taft,
P. W. Carr and W. J. Koros, Polymer, 28 (1987) 1363.10 E. Bechtold, in M. van Swaay (Editor), Gas Chromatography 1962, Butterworths, London, 1962, p.
49.11 J. F. K. Huber and A. I. M. Keulemans, in M. van Swaay (Editor), Gas Chromatography 1962,
Butterworths, London, 1962, p. 26.12 M. J. Adams, J. Chromatogr., 188 (1980) 97.13 L. R. Snyder, Principles o f Adsorption Chromatography, Marcel Dekker, New York, 1968.14 A. V. Kiselev, V. I. Nazarova, K. D. Shcherbakova, E. Smolkova-Keulemansova and L. Felti, Chro-
matographia, 17 (1983) 533; and references cited therein.15 P. J. Reucroft, W. H. Simpson and L. A. Jones, J. Phys. Chem., 23 (1971) 3526.16 F. Saura-Calixto and A. Garcia Raso, Chromatographia, 15 (1982) 771.17 F. J. Lopez-Garzon, I. Fernandez-Morales and M. Domingo-Garcia, Chromatographia, 23 (1987) 97.18 A. Jaulmes, C. Vidal-Madjar, A. Ladurelli and G. Guiochon, J. Phys. Chem., 88 (1984) 5379.19 A. Jaulmes, C. Vidal-Madjar, M. Gaspar and G. Guiochon, J. Phys. Chem., 88 (1984) 5385.20 E. B. Sansone, Y. B. Tewari and L. A. Jones, Environ. Sci. Technol., 13 (1979) 1511.21 J. F. Parcher and D. M. Johnson, J. Chromatogr. Sci., 23 (1985) 459.22 G. O. Nelson and C. A. Harder, Am. Ind. Hyg. Assoc. J., 35 (1974) 391.23 D. H. Volman and I. M. Klotz, J. Chem. Phys., 14 (1946) 642.
Related Documents