Medical Education Council of Nevada Center for Education and Health Services Outreach University of Nevada School of Medicine Physician Workforce in Nevada Characteristics and Distribution 2009 Edition John Packham, PhD Tabor Griswold, MS CEHSO Health Workforce Report November 2009

Welcome message from author
This document is posted to help you gain knowledge. Please leave a comment to let me know what you think about it! Share it to your friends and learn new things together.
Transcript

Medical Education Council of Nevada
Center for Education and Health Services Outreach
University of Nevada School of Medicine
Physician Workforce in Nevada Characteristics and Distribution
2009 Edition
John Packham, PhD
Tabor Griswold, MS
CEHSO Health Workforce Report November 2009

Physician Workforce in Nevada – Characteristics and Distribution, 2009 Edition
The Center for Education and Health Services Outreach (CEHSO) at the University of Nevada School of Medicine is home to a number of education and outreach programs serving communities and medically underserved populations across Nevada. A wide-range of research, data collection, and policy analysis is conducted by CEHSO staff working under the auspices of several CEHSO units, including: $ Nevada State Office of Rural Health (SORH) $ Medical Education Council of Nevada (MECON) SORH coordinates a number of programs serving the health care needs of rural Nevadans, including the Nevada Health Service Corps, Nevada Rural Hospital Flexibility Program, and the Rural Obstetrical Access Program. A key function of the SORH is rural-relevant data collection and research that supports health care providers and residents in rural Nevada, including the publication of the biennial Nevada Rural and Frontier Health Data Book. MECON was established by the Nevada Legislature in 2003 to ensure that Nevada has an adequate, well-trained workforce to meet the needs of all residents of Nevada. MECON has been charged with conducting health workforce research identifying the health workforce needs for the provision of medical services in Nevada. For more information about CEHSO programs, research and policy analysis, please visit the following website www.medicine.nevada.edu/cehso/. For more information about this report, please contact:
John Packham, PhD Director of Health Policy Research Center for Education and Health Services Outreach University of Nevada School of Medicine Reno, Nevada (775) 784-1235 [email protected]

Physician Workforce in NevadaCharacteristics and Distribution
2009 Edition
Prepared by:
John Packham, PhD and Tabor Griswold, MSUniversity of Nevada School of Medicine
Prepared with support from the Medical Education Council of Nevada (MECON) and
the Nevada Rural Hospital Flexibility Program
November 2009

Physician Workforce in NevadaCharacteristics and Distribution
2009 Edition
Table of Contents
Contents Page
Table of Contents .............................................................................................. i
Introduction: Physician Workforce in Nevada ..................................................... 1
Physician Workforce in Nevada – Characteristics and Distribution ...................... 3
Figure 1: Licensed Physicians in Nevada – 1997 to 2007 .................................................................... 3
Figure 2: Distribution of Total Physician Population by Age and Gender in Nevada – 2007 .............. 4
Figure 3: Total Physician Population by Major Professional Activity in Nevada – 2007 ..................... 5
Figure 4: International Medical Graduates (IMGs) by Age in Nevada – 2007 ..................................... 6
Figure 5: IMGs by Major Professional Activity in Nevada – 1997 to 2007 ....................................... 6
Figure 6: Specialty and Primary-Care Specialty Distribution of Physician Workforce in Nevada –
2007 ................................................................................................................................................. 7
Figure 7: Specialty Distribution of Physician Workforce by Gender in Nevada – 2007 .................... 8
Figure 8: Total Physicians per 100,000 Population in Nevada, Mountain Region, and United States
– 1997 to 2007 .................................................................................................................................. 9
Figure 9: Number of Residents per Licensed Physician by County in Nevada – 2007 ......................... 10
Physician Workforce in Nevada – 2009 Edition i

Contents Page
Physician Workforce in Nevada – Detailed Data Tables ..................................... 11
Table 1: Total Physicians by Age in Nevada – 1997 to 2007 ............................................................... 11
Table 2: Total Physicians by Gender in Nevada – 1997 to 2007 ......................................................... 11
Table 3: Male Physicians by Age in Nevada – 1997 to 2007 ............................................................... 12
Table 4: Female Physicians by Age in Nevada – 1997 to 2007 ............................................................ 12
Table 5: Total Physicians by Major Professional Activity in Nevada – 1997 to 2007 .......................... 13
Table 6: Male Physicians by Major Professional Activity in Nevada – 1997 to 2007 .......................... 14
Table 7: Female Physicians by Major Professional Activity in Nevada – 1997 to 2007 ....................... 15
Table 8: International Medical Graduates (IMGs) by Age and Gender in Nevada – 2007 .................. 16
Table 9: IMGs by Major Professional Activity in Nevada – 1997 to 2007 ........................................... 17
Table 10: Total Physicians by Self-Designated Specialty in Nevada – 1997 to 2007 ........................... 18
Table 11: Total Physicians per 100,000 Population by Self-Designated Specialty in Nevada – 1997
to 2007 .............................................................................................................................................. 20
Table 12: Total Physicians per 100,000 Population by Self-Designated Specialty in Nevada,
Mountain Region, and United States – 2007 .................................................................................... 22
Table 13: Physicians in Patient Care by Self-Designated Specialty in Nevada – 1997 to 2007 ........... 24
Table 14: Physicians in Patient Care per 100,000 Population by Self-Designated Specialty in
Nevada – 1997 to 2007 ..................................................................................................................... 26
Table 15: Physicians in Patient Care per 100,000 Population by Self-Designated Specialty in
Nevada, Mountain Region, and United States – 2007 ...................................................................... 28
Table 16: Total Physicians by Gender and Self-Designated Specialty in Nevada – 2007 .................... 30
Table 17: Physicians in Patient Care by Gender and Self-Designated Specialty in Nevada – 2007 ..... 32
Table 18: Total Physicians by Self-Designated Primary Care Specialty in Nevada – 1997 to 2007 ..... 34
Table 19: Total Physicians by Gender and Self-Designated Primary Care Specialty
in Nevada – 2007 .............................................................................................................................. 35
Physician Workforce in Nevada – 2009 Edition ii

Contents Page
Table 20: Total Physicians by Country of Undergraduate Medical Education and Self-Designated
Primary Care Specialty in Nevada – 2007 .......................................................................................... 36
Table 21: Total Physicians by County in Nevada – 1997 to 2007 ........................................................ 37
Table 22: Total Physicians per 100,000 Population by County in Nevada – 1997 to 2007 ................ 38
Table 23: Physicians in Patient Care by County in Nevada – 1997 to 2007 ....................................... 39
Table 24: Physicians in Patient Care per 100,000 Population by County in Nevada –
1997 to 2007 .................................................................................................................................... 40
Table 25: Physicians, Population, and Physician/Population Ratios in Nevada and the United
States – 1980 to 2007 ........................................................................................................................ 41
Table 26: Number of Physicians per 100,000 Population in Nevada and Neighboring States – 1980
to 2007 .............................................................................................................................................. 42
Table 27: Residents per One Physician in Nevada and Neighboring States – 1980 to 2007 ............... 42
Table 28: Number of Physicians in Patient Care per 100,000 Population in Nevada and
Neighboring States – 1980 to 2007 ................................................................................................... 43
Table 29: Residents per One Physician in Patient Care in Nevada and Neighboring States – 1980 to
2007 .................................................................................................................................................. 43
Table 30: Nevada’s Rank Among US States in the Number of Total Physicians per 100,000
Population – 1980 to 2007 ............................................................................................................... 44
Table 31: Nevada’s Rank Among US States in the Number of Physicians in Patient Care per
100,000 Population – 1980 to 2007 ................................................................................................. 45
Table 32: Graduates of the University of Nevada School of Medicine (UNSOM) Currently Practicing
in the United States by Year of Graduation and Gender – 2007 ...................................................... 46
Table 33: Graduates of the University of Nevada School of Medicine (UNSOM) Currently Practicing
in the United States by Self-Designated Primary Care Specialty – 1997 to 2007 ............................. 46
Table 34: Osteopathic Physicians (DOs) by Gender and Age in Nevada – 2007 ................................. 47
Table 35: Osteopathic Physicians (DOs) by Gender and Major Professional Activity in Nevada –
2007 .................................................................................................................................................. 47
Table 36: Osteopathic Physicians (DOs) by Self-Designated Specialty and Major Professional
Activity in Nevada – 2007 .................................................................................................................. 48
Physician Workforce in Nevada – 2009 Edition iii
Contents Page
Table 37: Osteopathic Physicians (DOs) by Self-Designated Primary Care Specialty in Nevada and
the United States – 2007 ................................................................................................................... 50
Appendix: Definitions and Terms Used by the American Medical Association(AMA) and the AMA Division of Survey and Data Resources ........ 51
Physician Workforce in Nevada – 2009 Edition iv
Introduction: Physician Workforce in Nevada, 2009 Edition
Physician Workforce in Nevada: Characteristics and Distribution, 2009 Edition is the first
installment of an anticipated annual profile and update of the physician workforce in Nevada.
This volume contains current, historical, and comparative data on the allopathic (MD) and
osteopathic (DO) physician workforce in Nevada. The principal purpose of this and future
editions is to improve health workforce planning and policy development in Nevada through
the preparation and dissemination of accurate information on the physician workforce.
Data presented in this report are derived from multiple volumes of the American Medical
Association’s (AMA) annual publication, Physician Characteristics and Distribution in the US.
Each of these reports utilizes data from the continuously updated Physician Masterfile, which is
maintained by the AMA’s Division of Survey and Data Resources. The AMA Physician Masterfile
is widely considered to be the most complete and extensive source of physician-related
information in the United States. Data presented for the calendar year ending December 31,
2007 represents the most current data available on the Nevada’s physician workforce.
The first section of the Physician Workforce in Nevada, 2009 Edition summarizes major trends
and features of Nevada’s physician workforce over the past decade:
• Characteristics of the allopathic physician workforce (MDs),
• Distribution of the physician workforce by major professional activity,
• Distribution of the physician workforce by major specialty area,
• Geographic distribution of the physician workforce by county and region,
• Comparative trends in Nevada, the mountain region, and United States, and
• Characteristics and distribution of the osteopathic physician workforce (DOs)
Most of this report details trends for allopathic physicians (MD) only, while the last section of
the narrative includes data on osteopathic physicians (DO) recently incorporated into the AMA
Physician Masterfile. The report contains an appendix containing definitions and explanations
of terms used by the AMA.
The second section of the report contains 37 detailed tables on the characteristics, specialty
distribution, and geographic distribution of the state’s physician workforce. Physician
Workforce in Nevada, 2009 Edition highlights the current nature and composition of the
physician workforce in Nevada, as well as changes that have taken place over the past decade.
Future editions of this publication will undoubtedly provide a more detailed portrait of the
state’s physician workforce as the range and quality of data contained the AMA Physician
Masterfile improves. This volume nonetheless represents our attempt to provide a
comprehensive snapshot of the physician workforce in Nevada.
We would like to acknowledge the contributions of Brandon Weise and Alexandra Sigillo who
assisted us immensely with data abstraction and entry tasks, as well as the preparation and
editing of this report.
In closing, since health care and the health care workforce in Nevada are ever-changing, our
ambition is to update and distribute this volume on an annual basis. As such, we would
appreciate hearing from you on how future editions can be improved. Please direct all
comments and suggestions to John Packham at [email protected] or (775) 784-
1235.
John Packham, PhD
Director of Health Policy Research
University of Nevada School of Medicine
Tabor Griswold, MS
Health Services Research Analyst
University of Nevada School of Medicine
Reno, Nevada
November 2009
Physician Workforce in Nevada – 2009 Edition 2

Section One: Physician Workforce in Nevada Characteristics and Distribution
The physician workforce in Nevada changed considerably over the past couple of decades. It
has been characterized by growth in the proportion of female physicians and by growing
percentages of older physicians nearing retirement. Figure 1 highlights changes in the
distribution of actively and inactively licensed allopathic physicians (MDs) in Nevada from 1997
to 2007. During that period, the total physician population in Nevada increased by 2,405 or
75.5%.
In 2007, there were 5,591 licensed physicians in Nevada. This figure includes 4,796 (85.8%)
physicians with an active license to practice in the State of Nevada and 795 physicians (14.2%)
with an inactive license. Since 1997, the number of actively licensed physicians increased by
1,959 or 69.0%, and the number of inactively licensed physicians increased by 446 or 127.8%.
The faster growth of inactively licensed physicians is an important indicator of the state’s aging
physician workforce. While there are approximately three male physicians for every female
physician in Nevada, the number of female physicians increased by 162.4% from 492 in 1997 to
1,291 in 2007. By contrast, the number of male physicians in Nevada increased by 1,606 or only
59.6% during the same time frame.
Figure 1: Licensed Physicians in Nevada – 1997 to 2007
Physician Workforce in Nevada – 2009 Edition 3

Figure 2: Distribution of Total Physician Population by Age and Gender in Nevada – 2007
Figure 2 summarizes both the age and gender distribution of the physician workforce in
Nevada in 2007. Currently, there are 1,184 physicians over the age of 65. This figure represents
21.4% of the state’s physician workforce. Nearly two in five physicians in Nevada (39.2%) are 55
years or older. While the number of male physicians is greater than that of female physicians in
all but the youngest age category, the proportion of male to female physicians rises with each
older age cohort. For instance, over half of female physicians in Nevada (53.0%) are under the
age of 45 as compared to less than one third of male physicians (31.0%) in the same age
grouping. Conversely, 43.5% of male physicians are over the age of 55, as compared to only
23.3% of female physicians of the same age.
These data indicate that just as the demand for health care services is increasing as a result of
overall population aging – the number of Nevadans aged 65 and over is projected to increase
by 170,000 or 52.1% between 2008 and 2018 – the looming retirement of the baby boom
cohort of physicians will exacerbate existing shortages in the physician workforce.
Physician Workforce in Nevada – 2009 Edition 4

Figure 3 provides a current snapshot of the major professional activity reported by physicians
licensed in Nevada. In 2007, 4,442 Nevada physicians indicated that they provide patient care
in an office-based practice (69.1%) or hospital-based setting (10.4%). Another 2.1% listed
administration, medical research, or medical teaching as their principal professional activity.
The remaining 18.4% are engaged in other non-patient care work, non classified activities or
hold an inactive license.
Figure 3: Total Physician Population by Major Professional Activity in Nevada – 2007
Over the past decade, the number of physicians providing patient care increased by 1,779 or
66.8%. However, the number providing patient care as a percent of all licensed physicians
declined from 83.6% in 1997 to 79.4% in 2007. While this trend is occurring among both male
and female physicians, 83.7% of female physicians currently provide direct patient care as
compared to only 78.2% male physicians. Additionally, the number of male physicians holding
an inactive license is nearly seven times that of female physicians. In 2007, 7.9% of female
physicians held an inactive license as compared to 16.1% of male physicians.
Physician Workforce in Nevada – 2009 Edition 5

Figure 4: International Medical Graduates (IMGs) by Age in Nevada – 2007
Figures 4 and 5 highlight the distribution of International Medical Graduates (IMGs) by age and
major professional activity in Nevada. In 2007, IMGs accounted for 30.3% of all licensed
physicians in Nevada and 30.2% of all Nevada physicians who provide patient care in an office-
based setting or hospital.
Figure 5: IMGs by Major Professional Activity in Nevada – 1997 to 2007
Physician Workforce in Nevada – 2009 Edition 6
Over the past decade, the number of IMGs has increased by 1,072 or 172.6%. While the
percentage of IMGs aged 55 and over parallels that of the overall physician workforce in
Nevada (38.8%), 40.3% of IMGs are under the age of 45 years, as compared to 36.1% of all
physicians in Nevada. In 2007, approximately one in five IMGs (20.9%) were between the ages
of 45 and 54, as compared to one in four Nevada physicians (25.1%). Currently, 28.8% of IMGs
are women. Within the IMG population itself, 1,343 physicians are providing patient care in
office-based or hospital settings and 350 are employed in administrative, research, teaching,
and other non-patient care positions. While the number of IMGs providing patient care has
increased over the past decade by 152.4%, the proportion of IMGs whose principal
professional activity is patient care has declined from 85.7% in 1997 to 79.3% in 2007,
mirroring trends in the overall Nevada physician workforce.
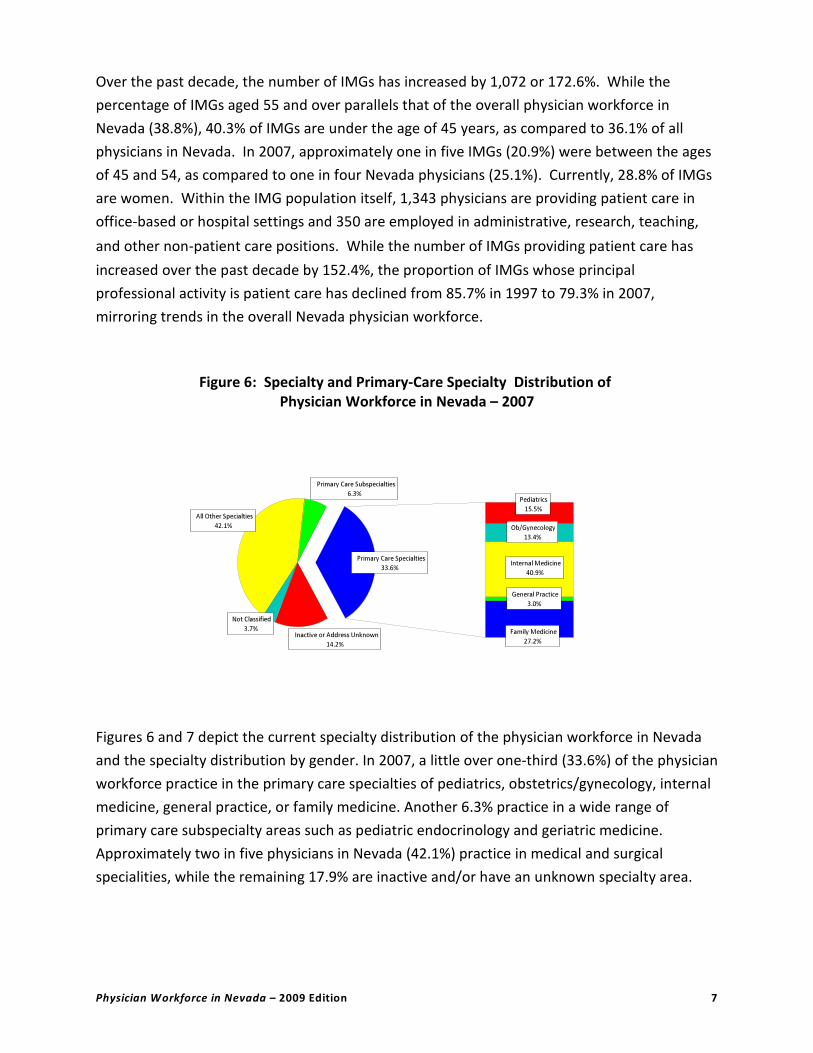
Figure 6: Specialty and Primary-Care Specialty Distribution of Physician Workforce in Nevada – 2007
Figures 6 and 7 depict the current specialty distribution of the physician workforce in Nevada
and the specialty distribution by gender. In 2007, a little over one-third (33.6%) of the physician
workforce practice in the primary care specialties of pediatrics, obstetrics/gynecology, internal
medicine, general practice, or family medicine. Another 6.3% practice in a wide range of
primary care subspecialty areas such as pediatric endocrinology and geriatric medicine.
Approximately two in five physicians in Nevada (42.1%) practice in medical and surgical
specialities, while the remaining 17.9% are inactive and/or have an unknown specialty area.
Physician Workforce in Nevada – 2009 Edition 7
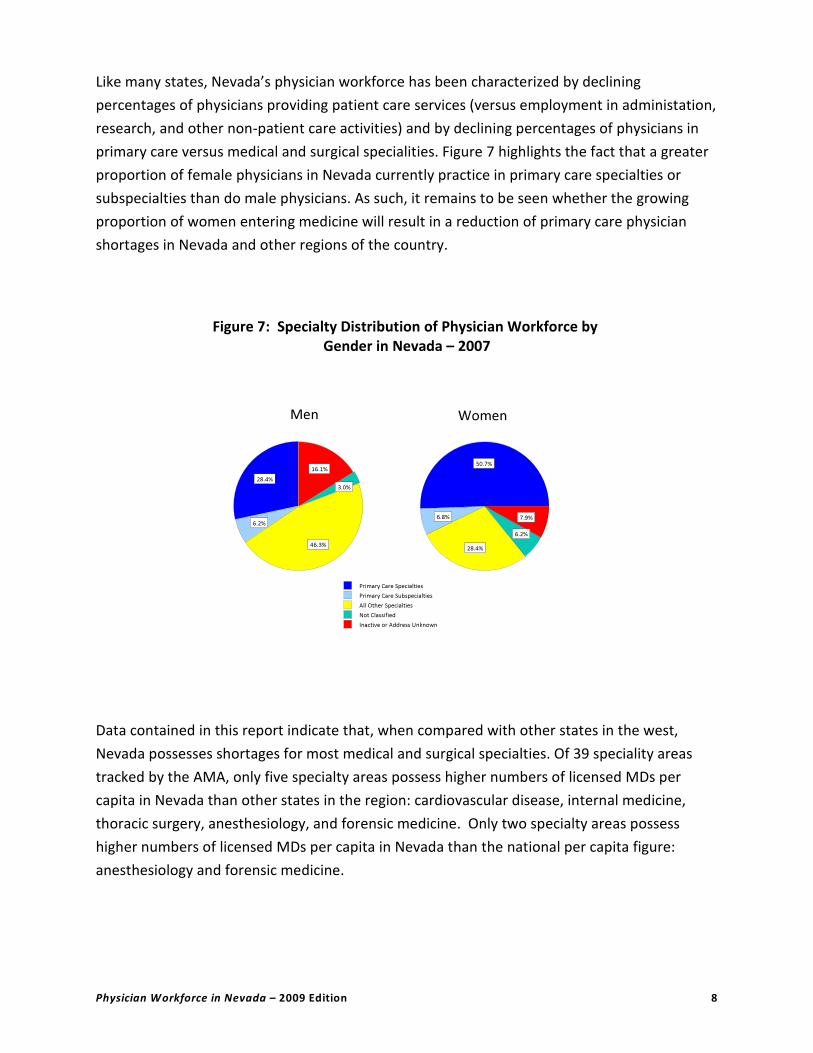
Like many states, Nevada’s physician workforce has been characterized by declining
percentages of physicians providing patient care services (versus employment in administation,
research, and other non-patient care activities) and by declining percentages of physicians in
primary care versus medical and surgical specialities. Figure 7 highlights the fact that a greater
proportion of female physicians in Nevada currently practice in primary care specialties or
subspecialties than do male physicians. As such, it remains to be seen whether the growing
proportion of women entering medicine will result in a reduction of primary care physician
shortages in Nevada and other regions of the country.
Figure 7: Specialty Distribution of Physician Workforce by Gender in Nevada – 2007
Data contained in this report indicate that, when compared with other states in the west,
Nevada possesses shortages for most medical and surgical specialties. Of 39 speciality areas
tracked by the AMA, only five specialty areas possess higher numbers of licensed MDs per
capita in Nevada than other states in the region: cardiovascular disease, internal medicine,
thoracic surgery, anesthesiology, and forensic medicine. Only two specialty areas possess
higher numbers of licensed MDs per capita in Nevada than the national per capita figure:
anesthesiology and forensic medicine.
Physician Workforce in Nevada – 2009 Edition 8

The final two figures highlight features of the geographic distribution of the physician
workforce in Nevada. Figure 8 indicates that, while the physician workforce has grown steadily
over the past decade, the number of physicians per 100,000 residents has consistently lagged
behind that of other states in the region and the nation.
Figure 8: Total Physicians per 100,000 Population in Nevada, Mountain Region, and United States – 1997 to 2007
While the number of physicians in Nevada grew by nearly 70% over the past decade, the
expansion of the physician workforce has barely kept pace with the state’s rapid population
growth. Presently, there are 218 physicians per 100,000 population in Nevada – a per capita
increase of only 14.7% since 1997. Despite steady growth in the physician workforce, Nevada
continues to have an extremely low number of physicans per capita versus other western
states in the US that are also experiencing overall physician shortages and shortages across the
majority of medical and specialty areas. Nevada currently ranks 48 in the number ofth
physicians per capita – a ranking that has not changed appreciably since 1990.
Physician Workforce in Nevada – 2009 Edition 9

Figure 9 highlights the considerable variation in geographic distribution of the physician
workforce across Nevada. In general, the number of physicians per capita is lower in rural
versus urban areas of Nevada. Among urban counties of the state, the number of physicians
per capita is lower in southern versus northwestern Nevada. For example, the ratio of county
residents per licensed physician ranges from 316 to 1 in urban Washoe County to 2,941 to 1 in
rural Lyon County. In Clark County, there are 509 residents per licensed physician.
Figure 9: Number of Residents per Licensed Physicians by County in Nevada – 2007
Physician Workforce in Nevada – 2009 Edition 10

Section 2: Physician Workforce in NevadaDetailed Data Tables
Table 1: Total Physicians by Age in Nevada – 1997 to 2007
Age Category1997 2002 2007
Change – 1997 to
2007
Number Percent Number Percent Number Percent Number Percent
< 35 344 10.8 463 10.8 496 8.9 152 44.2
35-44 1,002 31.5 1,179 27.5 1,521 27.2 519 51.8
45-54 781 24.5 1,053 24.6 1,404 25.1 623 79.8
55-64 476 14.9 694 16.2 986 17.6 510 107.1
$ 65 583 18.3 896 20.9 1,184 21.2 601 103.1
Total Physicians 3,186 100.0 4,285 100.0 5,591 100.0 2,405 75.5
Note: Figures for 1997 and 2002 are for nonfederal physicians only. Figures for 2007 include both federal and nonfederal physicians.
Table 2: Total Physicians by Gender in Nevada – 1997 to 2007
Gender1997 2002 2007
Change – 1997 to
2007
Number Percent Number Percent Number Percent Number Percent
Male Physicians 2,694 84.6 3,446 80.4 4,300 76.9 1,606 59.6
Female Physicians 492 15.4 839 19.6 1,291 23.1 799 162.4
Total Physicians 3,186 100.0 4,285 100.0 5,591 100.0 2,405 75.5
Note: Figures for 1997 and 2002 are for nonfederal physicians only. Figures for 2007 include both federal and nonfederal physicians.
Physician Workforce in Nevada – 2009 Edition 11

Table 3: Male Physicians by Age in Nevada – 1997 to 2007
Age Category1997 2002 2007
Change – 1997 to
2007
Number Percent Number Percent Number Percent Number Percent
< 35 231 8.6 277 8.0 277 6.4 46 19.9
35-44 795 29.5 865 25.1 1,056 24.6 261 32.8
45-54 677 25.1 863 25.0 1,098 25.5 421 62.2
55-64 439 16.3 610 17.7 826 19.2 387 88.2
$ 65 552 20.5 831 24.1 1,043 24.3 491 88.9
Total Male Physicians 2,694 100.0 3,446 100.0 4,300 100.0 1,606 59.6
Note: The “Total Male Physicians” figures for 1997 and 2002 are for nonfederal physicians only. The “Total Male Physicians” figures for 2007 include both federal and nonfederal physicians.
Table 4: Female Physicians by Age in Nevada – 1997 to 2007
Age Category1997 2002 2007
Change – 1997 to
2007
Number Percent Number Percent Number Percent Number Percent
< 35 113 23.0 186 22.2 219 17.0 106 93.8
35-44 207 42.1 314 37.4 465 36.0 258 124.6
45-54 104 21.1 190 22.6 306 23.7 202 194.2
55-64 37 7.5 84 10.0 160 12.4 123 332.4
$ 65 31 6.3 65 7.7 141 10.9 110 354.8
Total Female Physicians 492 100.0 839 100.0 1,291 100.0 799 162.4
Note: The “Total Female Physicians” figures for 1997 and 2002 are for nonfederal physicians only. The “Total Female Physicians” figures for 2007 include both federal and nonfederal physicians.
Physician Workforce in Nevada – 2009 Edition 12

Table 5: Total Physicians by Major Professional Activity in Nevada – 1997 to 2007
Major Professional Activity1997 2002 2007
Change – 1997
to 2007
Num ber Percent Num ber Percent Num ber Percent Num ber Percent
Patient Care
Office Based 2,320 72.8 3,152 73.6 3,861 69.1 1,541 66.4
Hospital-based Residents & Fellows 180 5.6 179 4.2 222 4.0 42 23.3
Hospital-based Physician Staff 163 5.1 163 3.8 359 6.4 196 120.2
Subtotal – Patient Care 2,663 83.6 3,494 81.5 4,442 79.4 1,779 66.8
Other Professional Activity
Administration 61 1.9 60 1.4 68 1.2 7 11.5
Medical Teaching 29 0.9 22 0.5 36 0.6 7 24.1
Medical Research 12 0.4 15 0.4 18 0.3 6 50.0
Other 15 0.5 19 0.4 24 0.4 9 60.0
Subtotal – Other Prof Activity 117 3.7 116 2.7 146 2.6 29 24.8
Not Classified 57 1.8 152 3.5 208 3.7 151 264.9
Inactive 349 11.0 523 12.2 795 14.2 446 127.8
Total Physicians 3,186 100.0 4,285 100.0 5,591 100.0 2,405 75.5
Note: Physicians in “Patient Care” refers to physicians whose principal professional activity is the provision of patient care in an office-based setting or hospital. Figures for 1997 and 2002 are for nonfederal physicians only.
Figures for 2007 include both federal and nonfederal physicians.
Physician Workforce in Nevada – 2009 Edition 13

Table 6: Male Physicians by Major Professional Activity in Nevada – 1997 to 2007
Major Professional Activity1997 2002 2007
Change – 1997
to 2007
Num ber Percent Num ber Percent Num ber Percent Num ber Percent
Patient Care
Office Based 1,974 73.3 2,542 73.8 2,986 69.4 1,012 51.3
Hospital-based Residents & Fellows 130 4.8 104 3.0 116 2.7 - 14 - 10.8
Hospital-based Physician Staff 119 4.4 121 3.5 259 6.0 140 117.6
Subtotal – Patient Care 2,223 82.5 2,767 80.3 3,361 78.2 1,138 51.2
Other Professional Activity
Administration 58 2.2 57 1.7 57 1.3 - 1 - 1.7
Medical Teaching 24 0.9 20 0.6 25 0.6 1 4.2
Medical Research 12 0.4 13 0.4 14 0.3 2 16.7
Other 15 0.6 19 0.6 22 0.5 7 46.7
Subtotal – Other Prof Activity 109 4.0 109 3.2 118 2.7 9 8.3
Not Classified 39 1.4 95 2.8 128 3.0 89 228.2
Inactive 323 12.0 475 13.8 693 16.1 370 114.6
Total Male Physicians 2,694 100.0 3,446 100.0 4,300 100.0 1,606 59.6
Note: Physicians in “Patient Care” refers to physicians whose principal professional activity is the provision of patient care in an office-based setting or hospital. Figures for 1997 and 2002 are for nonfederal physicians only.
Figures for 2007 include both federal and nonfederal physicians.
Physician Workforce in Nevada – 2009 Edition 14

Table 7: Female Physicians by Major Professional Activity in Nevada – 2004 to 2007
Major Professional Activity1997 2002 2007
Change – 1997
to 2007
Num ber Percent Num ber Percent Num ber Percent Num ber Percent
Patient Care
Office Based 346 70.3 610 72.7 875 67.8 529 152.9
Hospital-based Residents & Fellows 50 10.2 75 8.9 106 8.2 56 112.0
Hospital-based Physician Staff 44 8.9 42 5.0 100 7.7 56 127.3
Subtotal – Patient Care 440 92.1 727 86.7 1,081 83.7 641 145.7
Other Professional Activity
Administration 3 0.6 3 0.4 11 0.9 8 266.7
Medical Teaching 5 1.0 2 0.2 11 0.9 6 120.0
Medical Research 0 0.0 2 0.2 4 0.3 4 400.0
Other 0 0.0 0 0.0 2 0.2 2 200.0
Subtotal – Other Prof Activity 8 1.6 7 0.8 28 2.2 20 250.0
Not Classified 18 3.7 57 6.8 80 6.2 49 344.4
Inactive 26 5.3 48 5.7 102 7.9 102 292.3
Total Female Physicians 492 100.0 839 100.0 1,291 100.0 799 162.4
Note: Physicians in “Patient Care” refers to physicians whose principal professional activity is the provision of patient care in an office-based setting or hospital. Figures for 1997 and 2002 are for nonfederal physicians only.
Figures for 2007 include both federal and nonfederal physicians.
Physician Workforce in Nevada – 2009 Edition 15

Table 8: International Medical Graduates (IMGs) by Age and Gender in Nevada – 2007
Age Category
International Medical Graduates (IMGs)
Male Female Total
Number Percent Number Percent Number Percent
< 35 105 8.7 83 17.0 188 11.1
35-44 327 27.1 168 34.4 495 29.2
45-54 277 23.0 77 15.8 354 20.9
55-64 200 16.6 65 13.3 265 15.7
$ 65 296 24.6 95 19.5 391 23.1
Total IMG Physicians 1,205 100.0 488 100.0 1,693 100.0
Note: The “Total IMG Physicians” figures for 1997 and 2002 are for nonfederal physicians only. The “Total IMG Physicians” figures for 2007 include both federal and nonfederal physicians.
Physician Workforce in Nevada – 2009 Edition 16
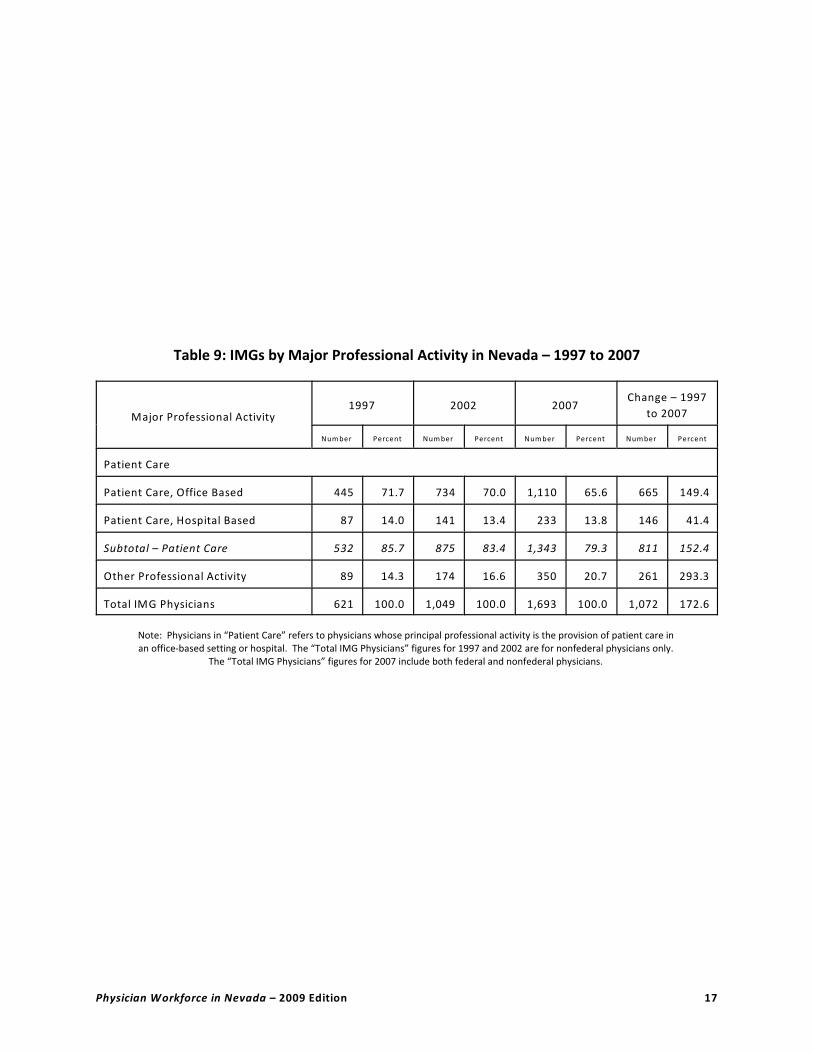
Table 9: IMGs by Major Professional Activity in Nevada – 1997 to 2007
Major Professional Activity1997 2002 2007
Change – 1997
to 2007
Num ber Percent Num ber Percent Num ber Percent Number Percent
Patient Care
Patient Care, Office Based 445 71.7 734 70.0 1,110 65.6 665 149.4
Patient Care, Hospital Based 87 14.0 141 13.4 233 13.8 146 41.4
Subtotal – Patient Care 532 85.7 875 83.4 1,343 79.3 811 152.4
Other Professional Activity 89 14.3 174 16.6 350 20.7 261 293.3
Total IMG Physicians 621 100.0 1,049 100.0 1,693 100.0 1,072 172.6
Note: Physicians in “Patient Care” refers to physicians whose principal professional activity is the provision of patient care in an office-based setting or hospital. The “Total IMG Physicians” figures for 1997 and 2002 are for nonfederal physicians only.
The “Total IMG Physicians” figures for 2007 include both federal and nonfederal physicians.
Physician Workforce in Nevada – 2009 Edition 17

Table 10: Total Physicians by Self-Designated Specialty in Nevada – 1997 to 2007
Major Specialty
Total Physicians Change – 1997
to 20071997 2002 2007
Number Percent Number Percent Number Percent Number Percent
General and Family Practice 381 12.0 484 11.3 568 10.2 187 49.1
Family Medicine 301 9.4 410 9.6 512 9.2 211 70.1
General Practice 80 2.5 74 1.7 56 1.0 - 24 - 30.0
Medical Specialties 894 28.1 1,264 29.5 1,711 30.6 817 91.4
Allergy & Immunology 15 0.5 20 0.5 16 0.3 1 6.7
Cardiovascular Disease 103 3.2 131 3.1 149 2.7 46 44.7
Dermatology 46 1.4 46 1.1 50 0.9 4 8.7
Gastroenterology 39 1.2 52 1.2 66 1.2 27 69.2
Internal Medicine 491 15.4 698 16.3 988 17.7 497 101.2
Pediatrics 164 5.1 268 6.3 376 6.7 212 129.3
Pediatric Cardiology 6 0.2 7 0.2 12 0.2 6 100.0
Pulmonary Disease 30 0.9 42 1.0 54 1.0 24 80.0
Surgical Specialties 702 22.0 833 19.4 953 17.0 251 35.8
Colon & Rectal Surgery 3 0.1 5 0.1 5 0.1 2 66.7
General Surgery 183 5.7 184 4.3 212 3.8 29 15.8
Neurological Surgery 23 0.7 25 0.6 28 0.5 5 21.7
Obstetrics & Gynecology 208 6.5 252 5.9 284 5.1 76 36.5
Ophthalmology 73 2.3 88 2.1 95 1.7 22 30.1
Orthopedic Surgery 97 3.0 112 2.6 136 2.4 39 40.2
Otolaryngology 37 1.2 47 1.1 46 0.8 9 24.3
Plastic Surgery 36 1.1 40 0.9 45 0.8 9 25.0
Thoracic Surgery 1 0.0 32 0.7 35 0.6 34 3,400.0
Urology Surgery 41 1.3 48 1.1 67 1.2 26 63.4
Other Specialties 803 25.2 1,029 24.0 1,356 24.3 553 68.9
Aerospace Medicine 4 0.1 1 0.0 2 0.0 - 2 - 50.0
Anesthesiology 200 6.3 275 6.4 365 6.5 165 82.5
Child & Adolescent Psychiatry 15 0.5 21 0.5 27 0.5 12 80.0
Physician Workforce in Nevada – 2009 Edition 18

Major Specialty
Total Physicians Change – 1997
to 20071997 2002 2007
Number Percent Number Percent Number Percent Number Percent
Other Specialties, cont.
Diagnostic Radiology 94 3.0 123 2.9 153 2.7 59 62.8
Emergency Medicine 117 3.7 149 3.5 237 4.2 120 102.6
Forensic Medicine 6 0.2 7 0.2 8 0.1 2 33.3
General Preventive Medicine 5 0.2 7 0.2 12 0.2 7 140.0
Medical Genetics 0 0.0 1 0.0 2 0.0 2 200.0
Neurology 43 1.3 51 1.2 71 1.3 28 65.1
Nuclear Medicine 0 0.0 4 0.1 3 0.1 3 300.0
Occupational Medicine 15 0.5 13 0.3 15 0.3 0 0.0
Psychiatry 111 3.5 136 3.2 182 3.3 71 64.0
Public Health & Gen Prev Med 5 0.2 6 0.1 4 0.1 - 1 - 20.0
Physical Med & Rehabilitation 28 0.9 39 0.9 59 1.1 31 110.7
Anatomic & Clinical Pathology 60 1.9 77 1.8 90 1.6 30 50.0
Radiology 36 1.1 49 1.1 54 1.0 18 50.0
Radiation Oncology 15 0.5 25 0.6 29 0.5 14 93.3
Other 28 0.9 35 0.8 28 0.5 0 0.0
Unspecified 21 0.7 10 0.2 15 0.3 - 6 - 28.6
Not Classified 57 1.8 152 3.5 208 3.7 151 264.9
Inactive 349 11.0 523 12.2 795 14.2 446 127.8
Total Physicians 3,186 100.0 4,285 100.0 5,591 100.0 2,405 75.5
Note: See Appendix A for sub-specialty classification by major specialty categories.
Physician Workforce in Nevada – 2009 Edition 19

Table 11: Total Physicians per 100,000 Population by Self-Designated Specialty in Nevada – 1997 to 2007
Major Specialty
Total Physicians per 100,000
PopulationChange – 1997 to 2007
1997 2002 2007 Number Percent
General and Family Practice 22.8 22.3 22.1 - 0.7 - 3.0
Family Medicine 18.0 18.9 20.0 1.9 10.7
General Practice 4.8 3.4 2.2 - 2.6 - 54.5
Medical Specialties 53.6 58.2 66.7 13.1 24.5
Allergy & Immunology 0.9 0.9 0.6 - 0.3 - 30.6
Cardiovascular Disease 6.2 6.0 5.8 - 0.4 - 5.9
Dermatology 2.8 2.1 1.9 - 0.8 - 29.3
Gastroenterology 2.3 2.4 2.6 0.2 10.1
Internal Medicine 29.4 32.1 38.5 9.1 30.9
Pediatrics 9.8 12.3 14.7 4.8 49.2
Pediatric Cardiology 0.4 0.3 0.5 0.1 30.1
Pulmonary Disease 1.8 1.9 2.1 0.3 17.1
Surgical Specialties 42.1 38.3 37.2 -4.9 - 11.7
Colon & Rectal Surgery 0.2 0.2 0.2 0.0 8.4
General Surgery 11.0 8.5 8.3 - 2.7 - 24.6
Neurological Surgery 1.4 1.2 1.1 - 0.3 - 20.8
Obstetrics & Gynecology 12.5 11.6 11.1 - 1.4 - 11.2
Ophthalmology 4.4 4.0 3.7 - 0.7 - 15.3
Orthopedic Surgery 5.8 5.2 5.3 - 0.5 - 8.8
Otolaryngology 2.2 2.2 1.8 - 0.4 - 19.1
Plastic Surgery 2.2 1.8 1.8 - 0.4 - 18.7
Thoracic Surgery 0.1 1.5 1.4 1.3 2,177.4
Urology Surgery 2.5 2.2 2.6 0.2 6.3
Other Specialties 48.1 47.4 52.9 4.8 9.9
Aerospace Medicine 0.2 0.0 0.1 - 0.2 - 67.5
Anesthesiology 12.0 12.7 14.2 2.2 18.7
Child & Adolescent Psychology 0.9 1.0 1.1 0.2 17.1
Physician Workforce in Nevada – 2009 Edition 20

Major Specialty
Total Physicians per 100,000
PopulationChange – 1997 to 2007
1997 2002 2007 Number Percent
Other Specialties, cont.
Diagnostic Radiology 5.6 5.7 6.0 0.3 5.9
Emergency Medicine 7.0 6.9 9.2 2.2 31.8
Forensic Medicine 0.4 0.3 0.3 0.0 - 13.2
General Prev Medicine 0.3 0.3 0.5 0.2 56.2
Medical Genetics 0.0 0.0 0.1 0.1 100.0
Neurology 2.6 2.3 2.8 0.2 7.4
Nuclear Medicine 0.0 0.2 0.1 0.1 100.0
Occupational Medicine 0.9 0.6 0.6 - 0.3 - 34.9
Psychiatry 6.7 6.3 7.1 0.4 6.7
Public Health & Gen Prev Med 0.3 0.3 0.2 - 0.1 - 47.9
Physical Med & Rehabilitation 1.7 1.8 2.3 0.6 37.1
Anatomic/Clinical Pathology 3.6 3.5 3.5 - 0.1 - 1.4
Radiology 2.2 2.3 2.1 0.2 10.7
Radiation Oncology 0.9 1.2 1.1 - 0.6 - 65.2
Other 1.7 1.6 1.1 - 0.7 - 40.1
Unspecified 1.3 0.5 0.6 0.0 0.0
Not Classified 3.4 7.0 8.1 4.7 137.4
Inactive 20.9 24.1 31.0 10.1 48.2
Total Physicians 190.9 197.2 218.0 27.1 14.2
Note: See Appendix A for sub-specialty classification by major specialty categories. Figures for 1997 and 2002 are for nonfederal physicians only. Figures for 2007 include both federal and nonfederal physicians.
Physician Workforce in Nevada – 2009 Edition 21
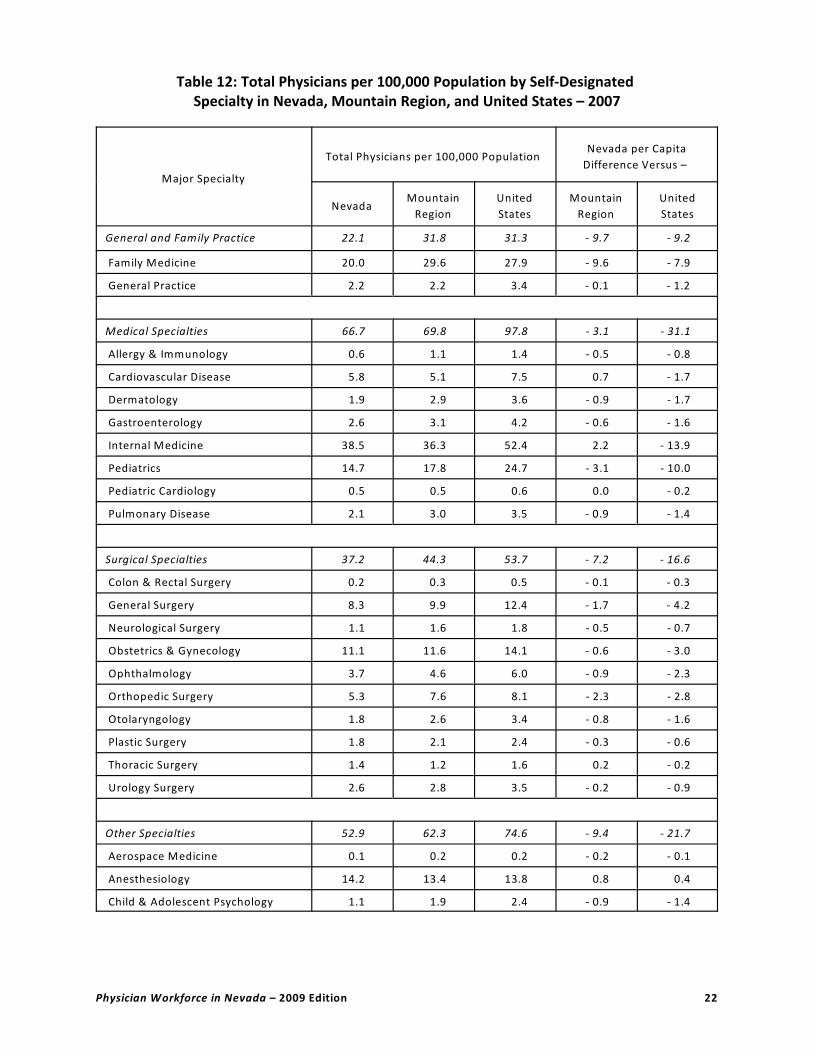
Table 12: Total Physicians per 100,000 Population by Self-Designated Specialty in Nevada, Mountain Region, and United States – 2007
Major Specialty
Total Physicians per 100,000 PopulationNevada per Capita
Difference Versus –
NevadaMountain
Region
United
States
Mountain
Region
United
States
General and Family Practice 22.1 31.8 31.3 - 9.7 - 9.2
Family Medicine 20.0 29.6 27.9 - 9.6 - 7.9
General Practice 2.2 2.2 3.4 - 0.1 - 1.2
Medical Specialties 66.7 69.8 97.8 - 3.1 - 31.1
Allergy & Immunology 0.6 1.1 1.4 - 0.5 - 0.8
Cardiovascular Disease 5.8 5.1 7.5 0.7 - 1.7
Dermatology 1.9 2.9 3.6 - 0.9 - 1.7
Gastroenterology 2.6 3.1 4.2 - 0.6 - 1.6
Internal Medicine 38.5 36.3 52.4 2.2 - 13.9
Pediatrics 14.7 17.8 24.7 - 3.1 - 10.0
Pediatric Cardiology 0.5 0.5 0.6 0.0 - 0.2
Pulmonary Disease 2.1 3.0 3.5 - 0.9 - 1.4
Surgical Specialties 37.2 44.3 53.7 - 7.2 - 16.6
Colon & Rectal Surgery 0.2 0.3 0.5 - 0.1 - 0.3
General Surgery 8.3 9.9 12.4 - 1.7 - 4.2
Neurological Surgery 1.1 1.6 1.8 - 0.5 - 0.7
Obstetrics & Gynecology 11.1 11.6 14.1 - 0.6 - 3.0
Ophthalmology 3.7 4.6 6.0 - 0.9 - 2.3
Orthopedic Surgery 5.3 7.6 8.1 - 2.3 - 2.8
Otolaryngology 1.8 2.6 3.4 - 0.8 - 1.6
Plastic Surgery 1.8 2.1 2.4 - 0.3 - 0.6
Thoracic Surgery 1.4 1.2 1.6 0.2 - 0.2
Urology Surgery 2.6 2.8 3.5 - 0.2 - 0.9
Other Specialties 52.9 62.3 74.6 - 9.4 - 21.7
Aerospace Medicine 0.1 0.2 0.2 - 0.2 - 0.1
Anesthesiology 14.2 13.4 13.8 0.8 0.4
Child & Adolescent Psychology 1.1 1.9 2.4 - 0.9 - 1.4
Physician Workforce in Nevada – 2009 Edition 22

Major Specialty
Total Physicians per 100,000 PopulationNevada per Capita
Difference Versus –
NevadaMountain
Region
United
States
Mountain
Region
United
States
Other Specialties, cont.
Diagnostic Radiology 6.0 6.9 8.3 - 0.9 - 2.3
Emergency Medicine 9.2 10.9 10.2 - 1.7 - 1.0
Forensic Medicine 0.3 0.2 0.2 0.1 0.1
General Preventive Medicine 0.5 0.6 0.7 - 0.1 - 0.3
Medical Genetics 0.1 0.1 0.2 0.0 - 0.1
Neurology 2.8 3.6 4.9 - 0.8 - 2.2
Nuclear Medicine 0.1 0.2 0.5 - 0.1 - 0.4
Occupational Medicine 0.6 0.9 0.9 - 0.3 - 0.3
Psychiatry 7.1 9.6 13.8 - 2.5 - 6.7
Public Health & Gen Prev Medicine 0.2 0.3 0.5 - 0.2 - 0.3
Physical Med & Rehabilitation 2.3 2.3 2.7 0.0 - 0.4
Anatomic/Clinical Pathology 3.5 4.6 6.3 - 1.1 - 2.8
Radiology 2.1 2.6 3.0 - 0.4 - 0.9
Radiation Oncology 1.1 1.2 1.5 - 0.1 - 0.4
Transplant Surgery 0.0 0.0 0.1 0.0 - 0.1
Other 1.1 1.5 1.8 - 0.4 - 0.7
Unspecified 0.6 1.2 2.6 - 0.6 - 2.0
Vascular Medicine 0.0 0.0 0.0 0.0 0.0
Not Classified 8.1 36.2 37.0 - 28.1 - 28.9
Inactive 31.0 10.0 17.5 21.0 13.5
Total Physicians 218.0 254.5 312.1 - 36.5 - 94.1
Note: See Appendix A for sub-specialty classification by major specialty categories. Figures for 2007 include both federal and nonfederal physicians.
Physician Workforce in Nevada – 2009 Edition 23

Table 13: Physicians in Patient Care by Self-Designated Specialty in Nevada – 1997 to 2007
Major Specialty
Physicians in Patient Care Change – 1997
to 20071997 2002 2007
Number Percent Number Percent Number Percent Number Percent
General and Family Practice 374 11.7 476 11.1 554 9.9 180 37.2
Family Medicine 296 9.3 405 9.5 501 9.0 205 69.3
General Practice 78 2.4 71 1.7 53 0.9 - 25 - 32.1
Medical Specialties 853 26.8 1224 28.6 1657 29.6 804 94.3
Allergy & Immunology 13 0.4 18 0.4 15 0.3 2 15.4
Cardiovascular Disease 100 3.1 127 3.0 144 2.6 44 44.0
Dermatology 45 1.4 45 1.1 50 0.9 5 11.1
Gastroenterology 39 1.2 51 1.2 65 1.2 26 66.7
Internal Medicine 464 14.6 674 15.7 954 17.1 490 105.6
Pediatrics 156 4.9 260 6.1 366 6.5 210 134.6
Pediatric Cardiology 6 0.2 7 0.2 12 0.2 6 100.0
Pulmonary Disease 30 0.9 42 1.0 51 0.9 21 70.0
Surgical Specialties 690 21.7 819 19.1 939 16.8 249 36.1
Colon & Rectal Surgery 3 0.1 5 0.1 5 0.1 2 66.7
General Surgery 180 5.6 182 4.2 209 3.7 29 16.1
Neurological Surgery 23 0.7 25 0.6 28 0.5 5 21.7
Obstetrics & Gynecology 204 6.4 247 5.8 277 5.0 73 35.8
Ophthalmology 71 2.2 86 2.0 94 1.7 23 32.4
Orthopedic Surgery 96 3.0 110 2.6 134 2.4 38 39.6
Otolaryngology 36 1.1 45 1.1 45 0.8 9 25.0
Plastic Surgery 36 1.1 40 0.9 45 0.8 9 25.0
Thoracic Surgery 1 0.0 31 0.7 35 0.6 34 N/A
Urology Surgery 40 1.3 48 1.1 67 1.2 27 67.5
Other Specialties 746 23.4 975 22.8 1,292 23.1 489 65.5
Aerospace Medicine 3 0.1 1 0.0 2 0.0 - 1 - 33.3
Anesthesiology 196 6.2 273 6.4 361 6.5 165 84.2
Child & Adolescent Psychology 15 0.5 21 0.5 26 0.5 11 73.3
Physician Workforce in Nevada – 2009 Edition 24

Major Specialty
Physicians in Patient Care Change – 1997
to 20071997 2002 2007
Number Percent Number Percent Number Percent Number Percent
Other Specialties, cont.
Diagnostic Radiology 92 2.9 122 2.8 150 2.7 58 63.0
Emergency Medicine 116 3.6 147 3.4 234 4.2 118 101.7
Forensic Medicine 4 0.1 5 0.1 7 0.1 3 75.0
General Preventive Medicine 3 0.1 5 0.1 11 0.2 8 266.7
Medical Genetics 0 0.0 0 0.0 1 0.0 1 100.0
Neurology 41 1.3 49 1.1 65 1.2 24 58.5
Nuclear Medicine 0 0.0 3 0.1 3 0.1 3 300.0
Occupational Medicine 11 0.3 12 0.3 9 0.2 - 2 - 18.2
Psychiatry 101 3.2 130 3.0 172 3.1 71 70.3
Public Health & Gen Prev Med 1 0.0 1 0.0 2 0.0 1 100.0
Physical Med & Rehab 28 0.9 38 0.9 57 1.0 29 103.6
Anatomic & Clinical Path 50 1.6 67 1.6 81 1.4 31 62.0
Radiology 36 1.1 46 1.1 50 0.9 14 38.9
Radiation Oncology 15 0.5 24 0.6 28 0.5 13 86.7
Transplant Surgery 0 0.0 0 0.0 0 0.0 0 0.0
Other 14 0.4 23 0.5 18 0.3 4 28.6
Unspecified 20 0.6 8 0.2 15 0.3 - 5 - 25.0
Vascular Medicine 0 0.0 0 0.0 0 0.0 0 0.0
Active MDs – Patient Care 2,663 83.6 3,494 81.5 4,442 79.4 1,779 66.8
Active MDs – Non Patient Care 117 3.7 116 2.7 146 2.6 29 24.8
Not Classified 57 1.8 152 3.5 208 3.7 151 264.9
Inactive 349 11.0 523 12.2 795 14.2 446 127.8
Total Physicians 3,186 100.0 4,285 100.0 5,591 100.0 2,405 75.5
Physician Workforce in Nevada – 2009 Edition 25

Table 14: Physicians in Patient Care per 100,000 Population by Self-Designated Specialty in Nevada – 1997 to 2007
Major Specialty
Number of Physicians in Patient Care
per 100,000 PopulationChange – 1997 to 2007
1997 2002 2007 Number Percent
General and Family Practice 22.4 21.9 21.6 - 0.8 0.0
Family Medicine 17.7 18.6 19.5 1.8 0.1
General Practice 4.7 3.3 2.1 - 2.6 - 0.6
Medical Specialties 51.1 56.3 64.6 13.5 0.3
Allergy & Immunology 0.8 0.8 0.6 - 0.2 - 1.4
Cardiovascular Disease 6.0 5.8 5.6 - 0.4 - 2.8
Dermatology 2.7 2.1 1.9 - 0.7 - 5.5
Gastroenterology 2.3 2.3 2.5 0.2 1.5
Internal Medicine 27.8 31.0 37.2 9.4 69.6
Pediatrics 9.3 12.0 14.3 4.9 36.5
Pediatric Cardiology 0.4 0.3 0.5 0.1 0.8
Pulmonary Disease 1.8 1.9 2.0 0.2 1.4
Surgical Specialties 41.3 37.7 36.6 - 4.7 - 0.1
Colon & Rectal Surgery 0.2 0.2 0.2 0.0 0.1
General Surgery 10.8 8.4 8.1 - 2.6 - 0.2
Neurological Surgery 1.4 1.2 1.1 - 0.3 - 0.2
Obstetrics & Gynecology 12.2 11.4 10.8 - 1.4 - 0.1
Ophthalmology 4.3 4.0 3.7 - 0.6 - 0.1
Orthopedic Surgery 5.8 5.1 5.2 - 0.5 - 0.1
Otolaryngology 2.2 2.1 1.8 - 0.4 - 0.2
Plastic Surgery 2.2 1.8 1.8 - 0.4 - 0.2
Thoracic Surgery 0.1 1.4 1.4 1.3 21.8
Urology Surgery 2.4 2.2 2.6 0.2 0.1
Other Specialties 44.7 44.9 50.4 5.7 0.1
Aerospace Medicine 0.2 0.0 0.1 - 0.1 - 0.6
Anesthesiology 11.7 12.6 14.1 2.3 0.2
Child & Adolescent Psychology 0.9 1.0 1.0 0.1 0.1
Physician Workforce in Nevada – 2009 Edition 26

Major Specialty
Number of Physicians in Patient Care
per 100,000 PopulationChange – 1997 to 2007
1997 2002 2007 Number Percent
Other Specialties, cont.
Diagnostic Radiology 5.5 5.6 5.8 0.3 0.1
Emergency Medicine 7.0 6.8 9.1 2.2 0.3
Forensic Medicine 0.2 0.2 0.3 0.0 0.1
General Prev Medicine 0.2 0.2 0.4 0.2 1.4
Medical Genetics 0.0 0.0 0.0 0.0 0.0
Neurology 2.5 2.3 2.5 0.1 0.0
Nuclear Medicine 0.0 0.1 0.1 0.1 0.1
Occupational Medicine 0.7 0.6 0.4 - 0.3 - 0.5
Psychiatry 6.1 6.0 6.7 0.7 0.1
Pub Health & Gen Prev Medicine 0.1 0.0 0.1 0.0 0.3
Physical Med & Rehabilitation 1.7 1.7 2.2 0.5 0.3
Anatomic/Clinical Pathology 3.0 3.1 3.2 0.2 0.1
Radiology 2.2 2.1 1.9 - 0.2 - 0.1
Radiation Oncology 0.9 1.1 1.1 0.2 0.2
Transplant Surgery 0.0 0.0 0.0 0.0 0.0
Other 0.8 1.1 0.7 - 0.1 - 0.2
Unspecified 1.2 0.4 0.6 - 0.6 - 0.5
Vascular Medicine 0.0 0.0 0.0 0.0 0.0
Not Classified 159.6 160.8 173.2 13.6 0.1
Inactive 7.0 5.3 5.7 - 1.3 - 0.2
Total Physicians 326.1 326.9 352.0 25.9 0.1
Note: See Appendix A for sub-specialty classification by major specialty categories. Physicians in “Patient Care” refers to physicians whose principal professional activity is the provision of patient care in an office-based setting or hospital.
Figures for 1997 and 2002 are for nonfederal physicians only. Figures for 2007 include both federal and nonfederal physicians.
Physician Workforce in Nevada – 2009 Edition 27

Table 15: Physicians in Patient Care per 100,000 Population by Self-Designated Specialty in Nevada, Mountain Region, and United States – 2007
Major Specialty
Physicians in Patient Care per 100,000
Population
Nevada per Capita
Difference Versus –
NevadaMountain
Region
United
States
Mountain
Region
United
States
General and Family Practice 21.6 30.7 30.1 - 9.1 - 8.5
Family Medicine 19.5 28.6 26.8 - 9.1 - 7.3
General Practice 2.1 2.1 3.3 - 0.1 - 1.2
Medical Specialties 64.6 65.8 91.6 - 1.2 - 27.0
Allergy & Immunology 0.6 1.0 1.3 - 0.4 - 0.7
Cardiovascular Disease 5.6 4.8 7.1 0.8 - 1.4
Dermatology 1.9 2.8 3.5 - 0.8 - 1.6
Gastroenterology 2.5 3.0 3.9 - 0.5 - 1.4
Internal Medicine 37.2 34.2 48.8 3.0 - 11.6
Pediatrics 14.3 16.8 23.2 - 2.5 - 9.0
Pediatric Cardiology 0.5 0.4 0.6 0.0 - 0.1
Pulmonary Disease 2.0 2.7 3.2 - 0.7 - 1.2
Surgical Specialties 36.6 43.3 52.3 - 6.7 - 15.7
Colon & Rectal Surgery 0.2 0.3 0.4 - 0.1 - 0.2
General Surgery 8.1 9.7 12.0 - 1.6 - 3.9
Neurological Surgery 1.1 1.6 1.7 - 0.5 - 0.7
Obstetrics & Gynecology 10.8 11.3 13.7 - 0.5 - 2.9
Ophthalmology 3.7 4.5 5.9 - 0.9 - 2.2
Orthopedic Surgery 5.2 7.5 8.0 - 2.2 - 2.7
Otolaryngology 1.8 2.5 3.3 - 0.7 - 1.5
Plastic Surgery 1.8 2.1 2.3 - 0.3 - 0.6
Thoracic Surgery 1.4 1.2 1.5 0.2 - 0.1
Urology Surgery 2.6 2.8 3.4 - 0.1 - 0.8
Other Specialties 50.4 48.4 55.5 2.0 - 5.2
Aerospace Medicine 0.1 0.1 0.1 0.0 0.0
Anesthesiology 14.1 13.2 13.4 0.9 0.6
Child & Adolescent Psychology 1.0 1.8 2.3 - 0.8 - 1.3
Physician Workforce in Nevada – 2009 Edition 28

Major Specialty
Physicians in Patient Care per 100,000
Population
Nevada per Capita
Difference Versus –
NevadaMountain
Region
United
States
Mountain
Region
United
States
Other Specialties, cont.
Diagnostic Radiology 5.8 6.7 8.0 - 0.8 - 2.2
Emergency Medicine 9.1 10.6 9.8 - 1.4 - 0.7
Forensic Medicine 0.3 0.2 0.2 0.1 0.1
General Prev Medicine 0.4 0.5 0.6 - 0.1 - 0.1
Medical Genetics 0.0 0.1 0.1 - 0.1 - 0.1
Neurology 2.5 3.3 4.5 - 0.7 - 1.9
Nuclear Medicine 0.1 0.2 0.4 - 0.1 - 0.3
Occupational Medicine 0.4 0.6 0.6 - 0.3 - 0.3
Psychiatry 6.7 8.9 12.7 - 2.2 - 6.0
Pub Health & Gen Prev Med 0.1 0.1 0.1 0.0 0.0
Physical Med & Rehabilitation 2.2 2.2 2.6 0.0 - 0.4
Anatomic/Clinical Pathology 3.2 4.0 5.4 - 0.8 - 2.3
Radiology 1.9 2.4 2.8 - 0.5 - 0.9
Radiation Oncology 1.1 1.2 1.5 - 0.1 - 0.4
Transplant Surgery 0.0 0.0 0.1 0.0 - 0.1
Other 0.7 0.9 1.0 - 0.2 - 0.3
Unspecified 0.6 1.2 2.5 - 0.6 - 1.9
Vascular Medicine 0.0 0.0 0.0 0.0 0.0
Active MDs – Patient Care 173.2 0.0 0.0 173.2 173.2
Active MDs – Non Patient Care 5.7 0.0 0.0 5.7 5.7
Not Classified 8.1 10.0 17.5 - 1.9 - 9.4
Inactive 31.0 36.2 37.0 - 5.2 - 6.0
Total Physicians in Patient Care 218.0 197.9 54.5 20.1 163.5
Note: See Appendix A for sub-specialty classification by major specialty categories. Physicians in “Patient Care” refers to physicians whose principal professional activity is the provision of patient care in an office-based setting or hospital.
Figures for 2007 include both federal and nonfederal physicians.
Physician Workforce in Nevada – 2009 Edition 29

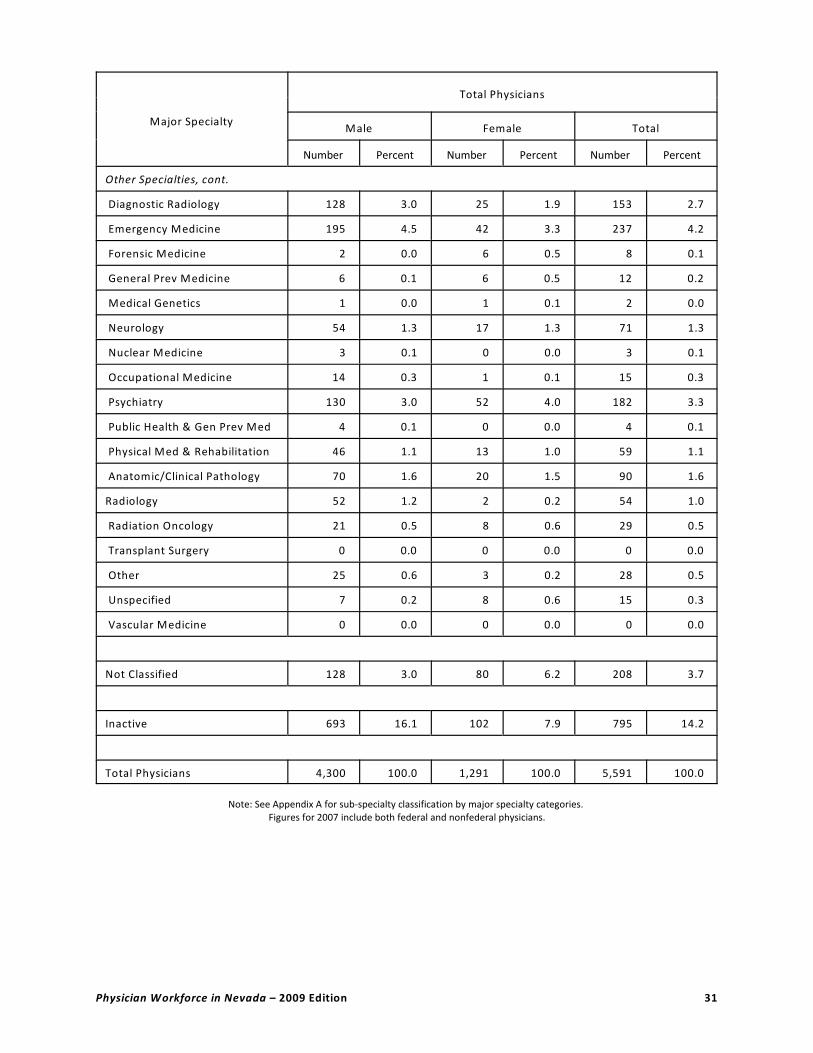
Table 16: Total Physicians by Gender and Self-Designated Specialty in Nevada – 2007
Major Specialty
Total Physicians
Male Female Total
Number Percent Number Percent Number Percent
General and Family Practice 403 9.4 165 12.8 568 10.2
Family Medicine 357 8.3 155 12.0 512 9.2
General Practice 46 1.1 10 0.8 56 1.0
Medical Specialties 1,192 27.7 519 40.2 1,711 30.6
Allergy & Immunology 13 0.3 3 0.2 16 0.3
Cardiovascular Disease 135 3.1 14 1.1 149 2.7
Dermatology 38 0.9 12 0.9 50 0.9
Gastroenterology 62 1.4 4 0.3 66 1.2
Internal Medicine 698 16.2 290 22.5 988 17.7
Pediatrics 187 4.3 189 14.6 376 6.7
Pediatric Cardiology 10 0.2 2 0.2 12 0.2
Pulmonary Disease 49 1.1 5 0.4 54 1.0
Surgical Specialties 789 18.3 164 12.7 953 17.0
Colon & Rectal Surgery 4 0.1 1 0.1 5 0.1
General Surgery 180 4.2 32 2.5 212 3.8
Neurological Surgery 26 0.6 2 0.2 28 0.5
Obstetrics & Gynecology 188 4.4 96 7.4 284 5.1
Ophthalmology 83 1.9 12 0.9 95 1.7
Orthopedic Surgery 134 3.1 2 0.2 136 2.4
Otolaryngology 42 1.0 4 0.3 46 0.8
Plastic Surgery 39 0.9 6 0.5 45 0.8
Thoracic Surgery 33 0.8 2 0.2 35 0.6
Urology Surgery 60 1.4 7 0.5 67 1.2
Other Specialties 1,095 25.5 261 20.2 1,356 24.3
Aerospace Medicine 2 0.0 0 0.0 2 0.0
Anesthesiology 324 7.5 41 3.2 365 6.5
Child & Adolescent Psychology 11 0.3 16 1.2 27 0.5
Physician Workforce in Nevada – 2009 Edition 30
Major Specialty
Total Physicians
Male Female Total
Number Percent Number Percent Number Percent
Other Specialties, cont.
Diagnostic Radiology 128 3.0 25 1.9 153 2.7
Emergency Medicine 195 4.5 42 3.3 237 4.2
Forensic Medicine 2 0.0 6 0.5 8 0.1
General Prev Medicine 6 0.1 6 0.5 12 0.2
Medical Genetics 1 0.0 1 0.1 2 0.0
Neurology 54 1.3 17 1.3 71 1.3
Nuclear Medicine 3 0.1 0 0.0 3 0.1
Occupational Medicine 14 0.3 1 0.1 15 0.3
Psychiatry 130 3.0 52 4.0 182 3.3
Public Health & Gen Prev Med 4 0.1 0 0.0 4 0.1
Physical Med & Rehabilitation 46 1.1 13 1.0 59 1.1
Anatomic/Clinical Pathology 70 1.6 20 1.5 90 1.6
Radiology 52 1.2 2 0.2 54 1.0
Radiation Oncology 21 0.5 8 0.6 29 0.5
Transplant Surgery 0 0.0 0 0.0 0 0.0
Other 25 0.6 3 0.2 28 0.5
Unspecified 7 0.2 8 0.6 15 0.3
Vascular Medicine 0 0.0 0 0.0 0 0.0
Not Classified 128 3.0 80 6.2 208 3.7
Inactive 693 16.1 102 7.9 795 14.2
Total Physicians 4,300 100.0 1,291 100.0 5,591 100.0
Note: See Appendix A for sub-specialty classification by major specialty categories. Figures for 2007 include both federal and nonfederal physicians.
Physician Workforce in Nevada – 2009 Edition 31

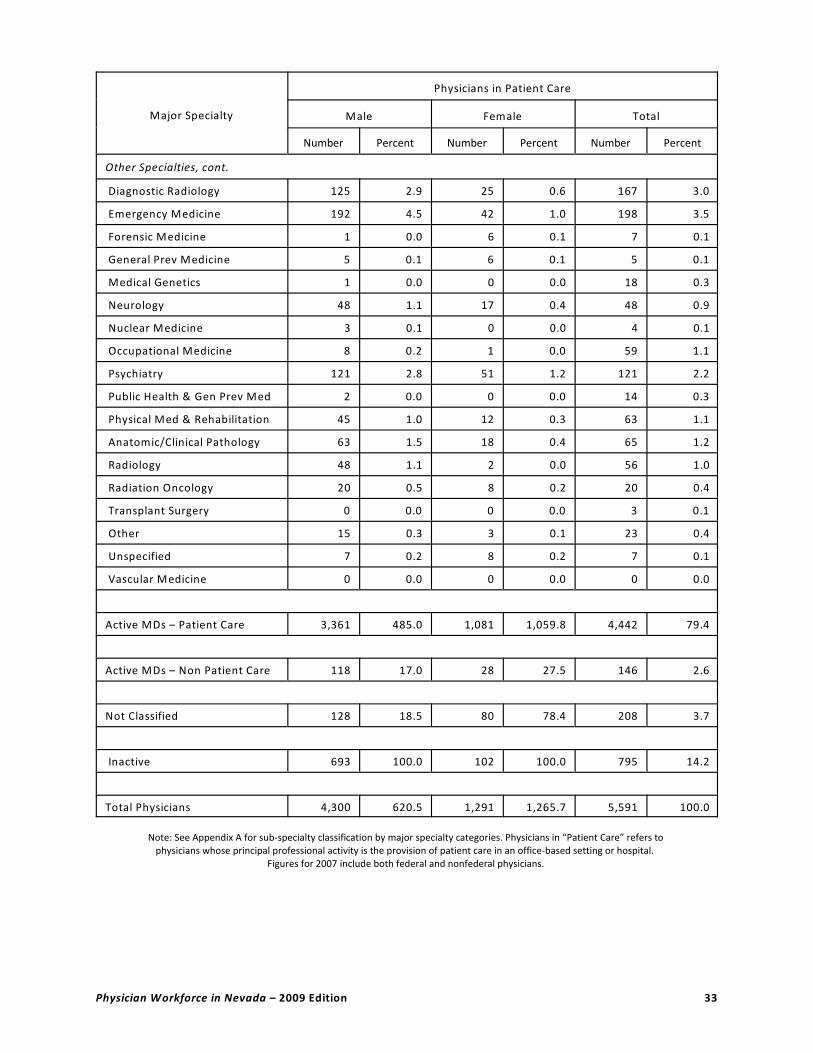
Table 17: Physicians in Patient Care by Gender and Self-Designated Specialty in Nevada – 2007
Major Specialty
Physicians in Patient Care
Male Female Total
Number Percent Number Percent Number Percent
General and Family Practice 394 9.2 160 3.7 554 9.9
Family Medicine 351 8.2 150 3.5 501 9.0
General Practice 43 1.0 0. 0.2 53 0.9
Medical Specialties 1,152 26.8 505 11.7 1,657 29.6
Allergy & Immunology 13 0.3 2 0.0 15 0.3
Cardiovascular Disease 130 3.0 14 0.3 144 2.6
Dermatology 38 0.9 12 0.3 50 0.9
Gastroenterology 61 1.4 4 0.1 65 1.2
Internal Medicine 674 15.7 280 6.5 954 17.1
Pediatrics 180 4.2 186 4.3 366 6.5
Pediatric Cardiology 10 0.2 2 0.0 12 0.2
Pulmonary Disease 46 1.1 5 0.1 51 0.9
Surgical Specialties 777 18.1 162 3.8 939 16.8
Colon & Rectal Surgery 4 0.1 1 0.0 5 0.1
General Surgery 177 4.1 32 0.7 209 3.7
Neurological Surgery 26 0.6 2 0.0 28 0.5
Obstetrics & Gynecology 183 4.3 94 2.2 277 5.0
Ophthalmology 82 1.9 12 0.3 94 1.7
Orthopedic Surgery 132 3.1 2 0.0 134 2.4
Otolaryngology 41 0.0 4 0.1 45 0.8
Plastic Surgery 39 0.9 2 0.1 45 0.8
Thoracic Surgery 33 0.8 6 0.0 35 0.6
Urology Surgery 60 1.4 7 0.2 67 1.2
Other Specialties 885 24.1 254 5.9 1,139 23.1
Aerospace Medicine 2 0.0 0 0.0 42 0.8
Anesthesiology 321 7.5 40 0.9 336 6.0
Child & Adolescent Psychology 11 0.3 15 0.3 36 0.6
Physician Workforce in Nevada – 2009 Edition 32
Major Specialty
Physicians in Patient Care
Male Female Total
Number Percent Number Percent Number Percent
Other Specialties, cont.
Diagnostic Radiology 125 2.9 25 0.6 167 3.0
Emergency Medicine 192 4.5 42 1.0 198 3.5
Forensic Medicine 1 0.0 6 0.1 7 0.1
General Prev Medicine 5 0.1 6 0.1 5 0.1
Medical Genetics 1 0.0 0 0.0 18 0.3
Neurology 48 1.1 17 0.4 48 0.9
Nuclear Medicine 3 0.1 0 0.0 4 0.1
Occupational Medicine 8 0.2 1 0.0 59 1.1
Psychiatry 121 2.8 51 1.2 121 2.2
Public Health & Gen Prev Med 2 0.0 0 0.0 14 0.3
Physical Med & Rehabilitation 45 1.0 12 0.3 63 1.1
Anatomic/Clinical Pathology 63 1.5 18 0.4 65 1.2
Radiology 48 1.1 2 0.0 56 1.0
Radiation Oncology 20 0.5 8 0.2 20 0.4
Transplant Surgery 0 0.0 0 0.0 3 0.1
Other 15 0.3 3 0.1 23 0.4
Unspecified 7 0.2 8 0.2 7 0.1
Vascular Medicine 0 0.0 0 0.0 0 0.0
Active MDs – Patient Care 3,361 485.0 1,081 1,059.8 4,442 79.4
Active MDs – Non Patient Care 118 17.0 28 27.5 146 2.6
Not Classified 128 18.5 80 78.4 208 3.7
Inactive 693 100.0 102 100.0 795 14.2
Total Physicians 4,300 620.5 1,291 1,265.7 5,591 100.0
Note: See Appendix A for sub-specialty classification by major specialty categories. Physicians in “Patient Care” refers to physicians whose principal professional activity is the provision of patient care in an office-based setting or hospital.
Figures for 2007 include both federal and nonfederal physicians.
Physician Workforce in Nevada – 2009 Edition 33

Table 18: Total Physicians by Self-Designated Primary Care Specialty in Nevada – 1997 to 2007
Specialty
Total Physicians Change – 1997
to 20071997 2002 2007
Number Percent Number Percent Number Percent Number Percent
Primary Care Specialties
Family Medicine 306 9.4 423 9.6 510 9.1 204 66.7
General Practice 80 2.5 76 1.7 56 1.0 - 24 - 30.0
Internal Medicine 405 12.4 582 13.2 768 13.7 363 89.6
Obstetrics/Gynecology 188 5.8 231 5.2 251 4.5 63 33.5
Pediatrics 138 4.2 221 5.0 292 5.2 154 111.6
Total Primary Care Physicians 1,117 34.3 1,533 34.7 1,877 33.6 760 68.0
Primary Care Subspecialties 160 4.9 241 5.5 355 6.3 195 121.9
All Other Specialties 1,574 48.3 1,957 44.3 2,356 42.1 782 49.7
Not Classified 57 1.7 152 3.4 208 3.7 151 264.9
Inactive or Address Unknown 350 10.7 534 12.1 795 14.2 445 127.1
Total Physicians 3,258 100.0 4,417 100.0 5,591 100.0 2,333 71.6
Note: See Appendix A for sub-specialty classifications.
Physician Workforce in Nevada – 2009 Edition 34
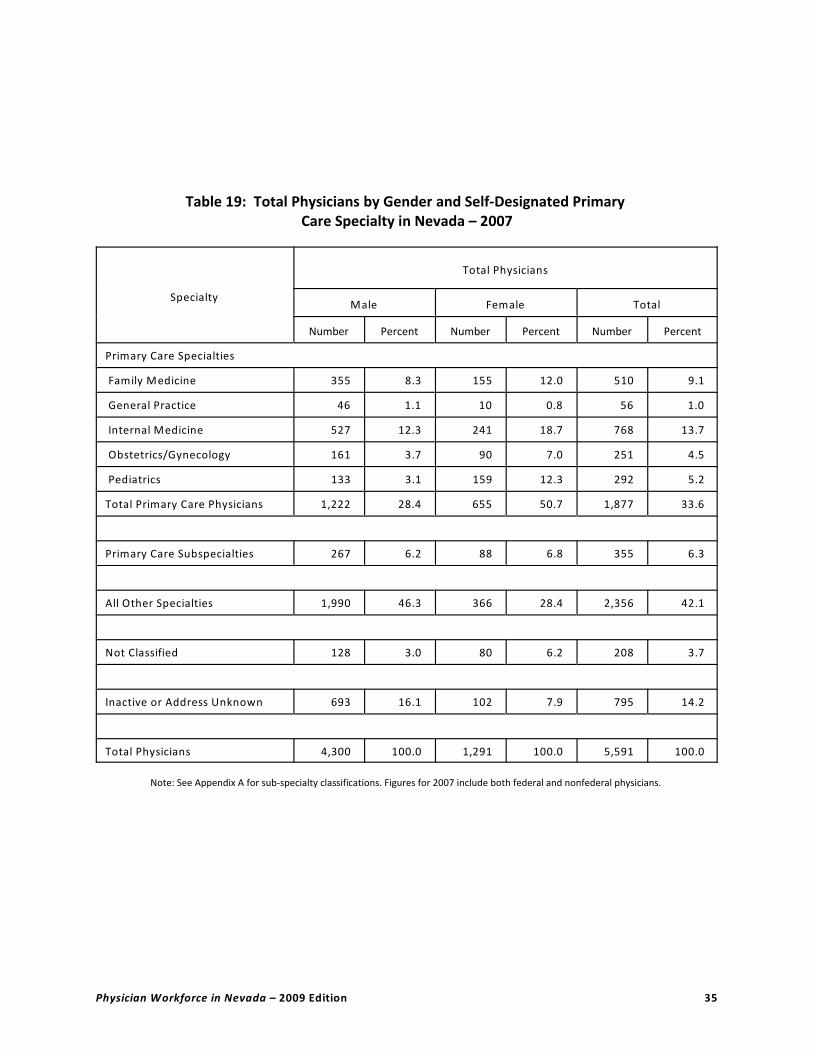
Table 19: Total Physicians by Gender and Self-Designated Primary Care Specialty in Nevada – 2007
Specialty
Total Physicians
Male Female Total
Number Percent Number Percent Number Percent
Primary Care Specialties
Family Medicine 355 8.3 155 12.0 510 9.1
General Practice 46 1.1 10 0.8 56 1.0
Internal Medicine 527 12.3 241 18.7 768 13.7
Obstetrics/Gynecology 161 3.7 90 7.0 251 4.5
Pediatrics 133 3.1 159 12.3 292 5.2
Total Primary Care Physicians 1,222 28.4 655 50.7 1,877 33.6
Primary Care Subspecialties 267 6.2 88 6.8 355 6.3
All Other Specialties 1,990 46.3 366 28.4 2,356 42.1
Not Classified 128 3.0 80 6.2 208 3.7
Inactive or Address Unknown 693 16.1 102 7.9 795 14.2
Total Physicians 4,300 100.0 1,291 100.0 5,591 100.0
Note: See Appendix A for sub-specialty classifications. Figures for 2007 include both federal and nonfederal physicians.
Physician Workforce in Nevada – 2009 Edition 35

Table 20: Total Physicians by Country of Undergraduate Medical Education and Self-Designated Primary Care Specialty in Nevada – 2007
Specialty
Total Physicians
US Medical GraduatesInternational Medical
Graduates (IMGs) Total
Number Percent Number Percent Number Percent
Primary Care Specialties
Family Medicine 355 9.1 155 9.2 510 9.1
General Practice 35 0.9 21 1.2 56 1.0
Internal Medicine 370 9.5 398 23.5 768 13.7
Obstetrics/Gynecology 213 5.5 38 2.2 251 4.5
Pediatrics 164 4.2 128 7.6 292 5.2
Total Primary Care Physicians 1,137 29.2 740 43.7 1,877 33.6
Primary Care Subspecialties 202 5.2 153 9.0 355 6.3
All Other Specialties 1,879 48.2 477 28.2 2,356 42.1
Not Classified 110 2.8 98 5.8 208 3.7
Inactive or Address Unknown 570 14.6 225 13.3 795 14.2
Total Physicians 3,898 100.0 1,693 100.0 5,591 100.0
Note: See Appendix A for sub-specialty classifications. Figures for 2007 include both federal and nonfederal physicians.
Physician Workforce in Nevada – 2009 Edition 36
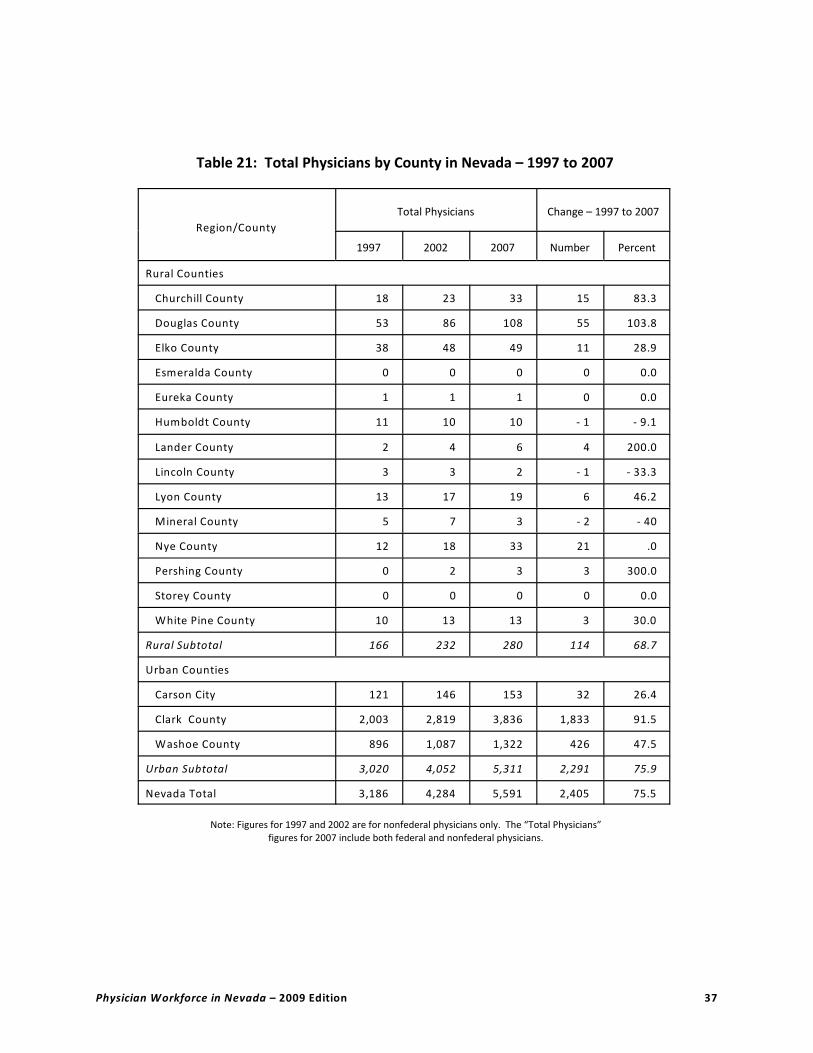
Table 21: Total Physicians by County in Nevada – 1997 to 2007
Region/County
Total Physicians Change – 1997 to 2007
1997 2002 2007 Number Percent
Rural Counties
Churchill County 18 23 33 15 83.3
Douglas County 53 86 108 55 103.8
Elko County 38 48 49 11 28.9
Esmeralda County 0 0 0 0 0.0
Eureka County 1 1 1 0 0.0
Humboldt County 11 10 10 - 1 - 9.1
Lander County 2 4 6 4 200.0
Lincoln County 3 3 2 - 1 - 33.3
Lyon County 13 17 19 6 46.2
Mineral County 5 7 3 - 2 - 40
Nye County 12 18 33 21 .0
Pershing County 0 2 3 3 300.0
Storey County 0 0 0 0 0.0
White Pine County 10 13 13 3 30.0
Rural Subtotal 166 232 280 114 68.7
Urban Counties
Carson City 121 146 153 32 26.4
Clark County 2,003 2,819 3,836 1,833 91.5
Washoe County 896 1,087 1,322 426 47.5
Urban Subtotal 3,020 4,052 5,311 2,291 75.9
Nevada Total 3,186 4,284 5,591 2,405 75.5
Note: Figures for 1997 and 2002 are for nonfederal physicians only. The “Total Physicians” figures for 2007 include both federal and nonfederal physicians.
Physician Workforce in Nevada – 2009 Edition 37
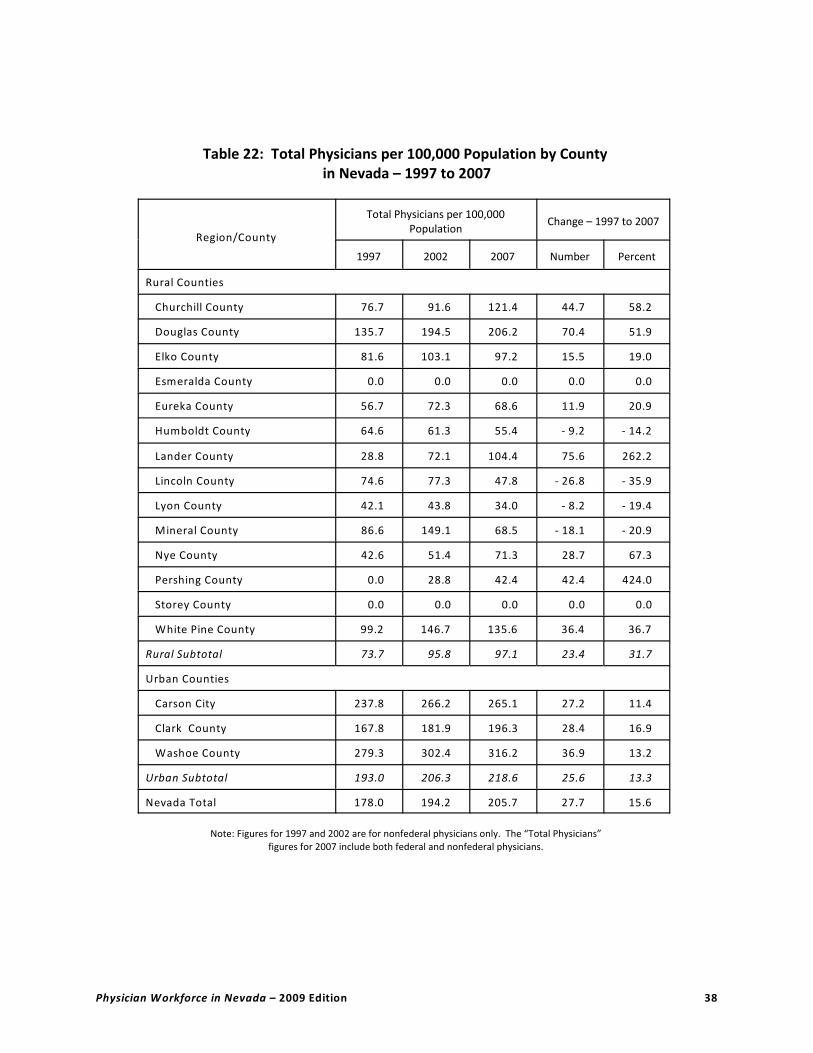
Table 22: Total Physicians per 100,000 Population by County in Nevada – 1997 to 2007
Region/County
Total Physicians per 100,000Population
Change – 1997 to 2007
1997 2002 2007 Number Percent
Rural Counties
Churchill County 76.7 91.6 121.4 44.7 58.2
Douglas County 135.7 194.5 206.2 70.4 51.9
Elko County 81.6 103.1 97.2 15.5 19.0
Esmeralda County 0.0 0.0 0.0 0.0 0.0
Eureka County 56.7 72.3 68.6 11.9 20.9
Humboldt County 64.6 61.3 55.4 - 9.2 - 14.2
Lander County 28.8 72.1 104.4 75.6 262.2
Lincoln County 74.6 77.3 47.8 - 26.8 - 35.9
Lyon County 42.1 43.8 34.0 - 8.2 - 19.4
Mineral County 86.6 149.1 68.5 - 18.1 - 20.9
Nye County 42.6 51.4 71.3 28.7 67.3
Pershing County 0.0 28.8 42.4 42.4 424.0
Storey County 0.0 0.0 0.0 0.0 0.0
White Pine County 99.2 146.7 135.6 36.4 36.7
Rural Subtotal 73.7 95.8 97.1 23.4 31.7
Urban Counties
Carson City 237.8 266.2 265.1 27.2 11.4
Clark County 167.8 181.9 196.3 28.4 16.9
Washoe County 279.3 302.4 316.2 36.9 13.2
Urban Subtotal 193.0 206.3 218.6 25.6 13.3
Nevada Total 178.0 194.2 205.7 27.7 15.6
Note: Figures for 1997 and 2002 are for nonfederal physicians only. The “Total Physicians” figures for 2007 include both federal and nonfederal physicians.
Physician Workforce in Nevada – 2009 Edition 38

Table 23: Physicians in Patient Care by County in Nevada – 1997 to 2007
Region/County
Physicians in Patient Care Change – 1997 to 2007
1997 2002 2007 Number Percent
Rural Counties
Churchill County 16 21 30 14 87.5
Douglas County 39 60 76 37 94.9
Elko County 36 41 41 5 13.9
Esmeralda County 0 0 0 0 0.0
Eureka County 1 1 1 0 0.0
Humboldt County 10 9 10 0 0.0
Lander County 2 4 6 4 200.0
Lincoln County 3 3 2 - 1 - 33.3
Lyon County 8 10 12 4 50.0
Mineral County 5 7 2 - 3 - 60.0
Nye County 12 13 23 11 91.7
Pershing County 0 1 2 2 200.0
Storey County 0 0 0 0 0.0
White Pine County 9 12 12 3 33.3
Rural Subtotal 141 182 217 76 53.9
Urban Counties
Carson City 103 127 129 26 25.2
Clark County 1,691 2,314 3,052 1,361 80.5
Washoe County 728 870 1,044 316 43.4
Urban Subtotal 2,522 3,311 4,225 1,703 67.5
Nevada Total 2,663 3,493 4,442 1,779 66.8
Note: Physicians in “Patient Care” refers to physicians whose principal professional activity is the provision of patient care in an office-based setting or hospital. Figures for 1997 and 2002 are for nonfederal
physicians only. Figures for 2007 include both federal and nonfederal physicians.
Physician Workforce in Nevada – 2009 Edition 39

Table 24: Physicians in Patient Care per 100,000 Population by County in Nevada – 1997 to 2007
Region/County
Physicians in Patient Care per 100,000Population
Change – 1997 to 2007
1997 2002 2007 Number Percent
Rural Counties
Churchill County 68.2 83.6 110.3 42.2 61.8
Douglas County 99.9 135.7 145.1 45.2 45.3
Elko County 77.3 88.0 81.3 3.9 5.1
Esmeralda County 0.0 0.0 0.0 0.0 0.0
Eureka County 56.7 72.3 68.6 11.9 20.9
Humboldt County 58.7 55.2 55.4 - 3.3 - 5.7
Lander County 28.8 72.1 104.4 75.6 262.2
Lincoln County 74.6 77.3 47.8 - 26.8 - 35.9
Lyon County 25.9 25.8 21.5 - 4.5 - 17.2
Mineral County 86.6 149.1 45.7 - 40.9 - 47.3
Nye County 42.6 37.1 49.7 7.1 16.6
Pershing County 0.0 14.4 28.3 28.3 0.1
Storey County 0.0 0.0 0.0 0.0 0.0
White Pine County 89.2 135.4 125.1 35.9 40.2
Rural Subtotal 62.6 75.2 75.3 12.7 20.2
Urban Counties
Carson City 202.6 231.6 223.5 21.0 10.4
Clark County 141.7 149.3 156.2 14.5 10.2
Washoe County 226.9 242.4 249.7 22.8 10.1
Urban Subtotal 161.1 168.6 173.9 12.7 7.9
Nevada Total 148.8 158.3 163.4 14.7 9.9
Note: Physicians in “Patient Care” refers to physicians whose principal professional activity is the provision of patient care in an office-based setting or hospital. Figures for 1997 and 2002 are for nonfederal
physicians only. Figures for 2007 include both federal and nonfederal physicians.
Physician Workforce in Nevada – 2009 Edition 40
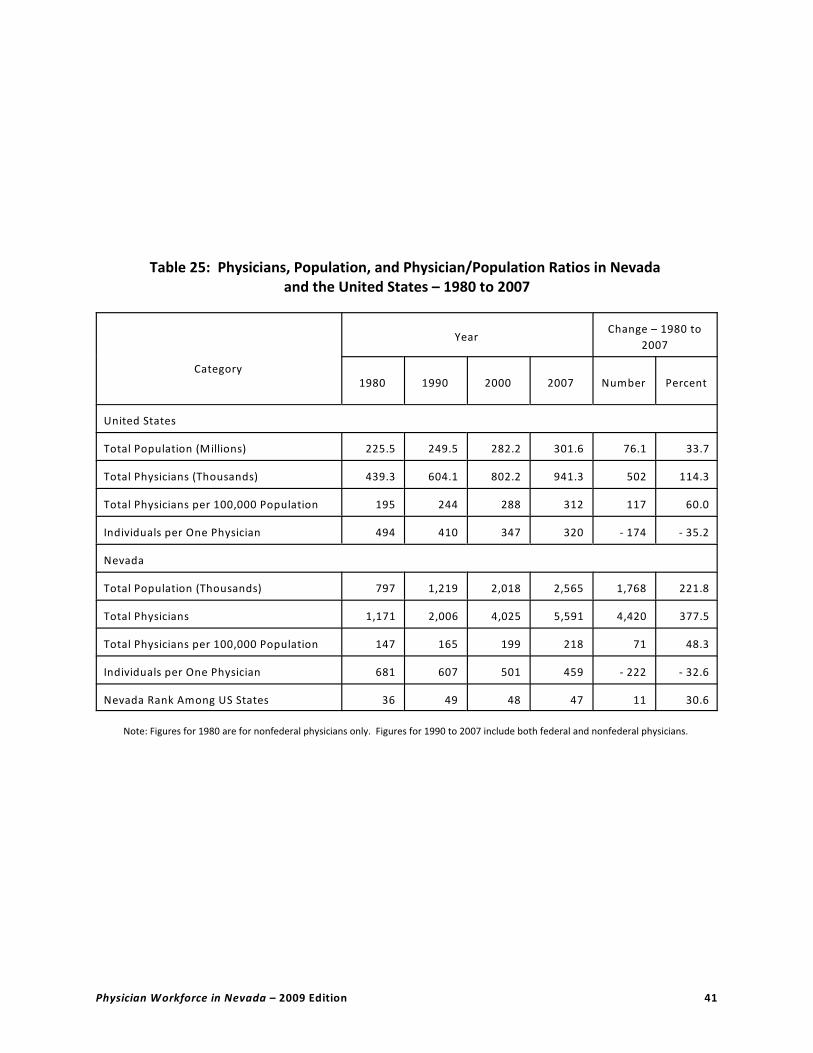
Table 25: Physicians, Population, and Physician/Population Ratios in Nevada and the United States – 1980 to 2007
Category
YearChange – 1980 to
2007
1980 1990 2000 2007 Number Percent
United States
Total Population (Millions) 225.5 249.5 282.2 301.6 76.1 33.7
Total Physicians (Thousands) 439.3 604.1 802.2 941.3 502 114.3
Total Physicians per 100,000 Population 195 244 288 312 117 60.0
Individuals per One Physician 494 410 347 320 - 174 - 35.2
Nevada
Total Population (Thousands) 797 1,219 2,018 2,565 1,768 221.8
Total Physicians 1,171 2,006 4,025 5,591 4,420 377.5
Total Physicians per 100,000 Population 147 165 199 218 71 48.3
Individuals per One Physician 681 607 501 459 - 222 - 32.6
Nevada Rank Among US States 36 49 48 47 11 30.6
Note: Figures for 1980 are for nonfederal physicians only. Figures for 1990 to 2007 include both federal and nonfederal physicians.
Physician Workforce in Nevada – 2009 Edition 41
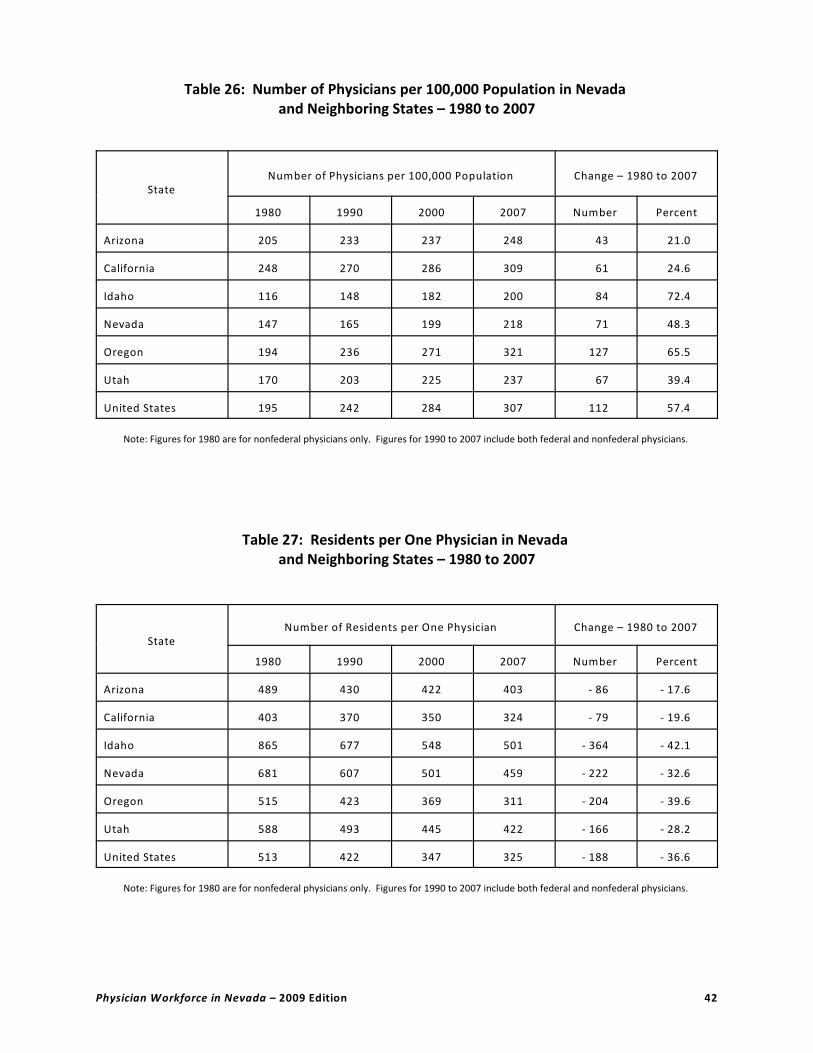
Table 26: Number of Physicians per 100,000 Population in Nevada and Neighboring States – 1980 to 2007
StateNumber of Physicians per 100,000 Population Change – 1980 to 2007
1980 1990 2000 2007 Number Percent
Arizona 205 233 237 248 43 21.0
California 248 270 286 309 61 24.6
Idaho 116 148 182 200 84 72.4
Nevada 147 165 199 218 71 48.3
Oregon 194 236 271 321 127 65.5
Utah 170 203 225 237 67 39.4
United States 195 242 284 307 112 57.4
Note: Figures for 1980 are for nonfederal physicians only. Figures for 1990 to 2007 include both federal and nonfederal physicians.
Table 27: Residents per One Physician in Nevada and Neighboring States – 1980 to 2007
StateNumber of Residents per One Physician Change – 1980 to 2007
1980 1990 2000 2007 Number Percent
Arizona 489 430 422 403 - 86 - 17.6
California 403 370 350 324 - 79 - 19.6
Idaho 865 677 548 501 - 364 - 42.1
Nevada 681 607 501 459 - 222 - 32.6
Oregon 515 423 369 311 - 204 - 39.6
Utah 588 493 445 422 - 166 - 28.2
United States 513 422 347 325 - 188 - 36.6
Note: Figures for 1980 are for nonfederal physicians only. Figures for 1990 to 2007 include both federal and nonfederal physicians.
Physician Workforce in Nevada – 2009 Edition 42

Table 28: Number of Physicians in Patient Care per 100,000 Population in Nevada and Neighboring States – 1990 to 2007
State
Number of Physicians in Patient Care per
100,000 PopulationChange – 1980 to 2007
1990 2000 2007 Number Percent
Arizona 184 176 189 5 2.7
California 219 216 236 17 7.8
Idaho 120 144 160 40 33.3
Nevada 149 159 173 24 16.1
Oregon 191 205 245 54 28.3
Utah 169 178 188 19 11.2
United States 198 230 239 41 20.7
Note: All figures include both federal and nonfederal physicians.
Table 29: Residents per One Physician in Patient Care in Nevada and Neighboring States – 1990 to 2007
State
Number of Residents per One Physician in
Patient CareChange – 1980 to 2007
1990 2000 2007 Number Percent
Arizona 545 569 528 - 17 - 3.1
California 456 462 424 - 32 - 7.0
Idaho 835 696 625 - 210 - 25.1
Nevada 671 630 578 - 93 - 13.9
Oregon 524 487 408 - 116 - 22.1
Utah 593 563 533 - 60 - 10.1
United States 505 435 418 - 87 - 17.2
Note: All figures include both federal and nonfederal physicians.
Physician Workforce in Nevada – 2009 Edition 43

Table 30: Nevada’s Rank Among US States in the Number of Total Physicians per 100,000 Population – 1980 to 2007
State
Rank in the Number of Total Physicians per 100,000 Population Change in
Rank –
1980 to
20071980 1985 1990 1995 2000 2007
Alabam a 46 46 41 41 42 42 4
Alaska 44 44 49 49 44 38 6
Arizona 12 12 19 25 36 39 - 27
Arkansas 47 47 42 43 45 45 2
California 6 6 9 11 15 18 -12
Colorado 10 10 15 16 21 21 - 11
Connecticut 5 5 5 5 5 6 - 1
Delaware 24 24 21 21 23 27 - 3
Dist. Of Colum bia 1 1 1 1 1 1 0
Florida 11 11 12 12 14 19 - 8
Georgia 35 35 36 36 37 41 - 6
Hawaii 9 9 8 10 10 8 1
Idaho 50 50 51 50 51 51 - 1
Illinois 18 18 16 14 12 17 1
Indiana 42 42 44 42 43 40 2
Iowa 45 45 43 44 47 47 - 2
Kansas 29 29 32 32 35 36 - 7
Kentucky 41 41 39 39 38 35 6
Louisiana 32 32 26 23 19 22 10
M aine 25 25 27 28 17 12 13
M aryland 3 3 2 4 3 3 0
M assachusetts 2 2 3 2 2 2 0
M ichigan 28 28 31 29 27 28 0
M innesota 14 14 14 13 11 11 3
M ississippi 51 51 50 51 50 49 2
M issouri 23 23 25 27 30 31 - 8
M ontana 40 40 38 37 33 32 8
Nebraska 34 34 37 33 29 26 8
Nevada 36 36 48 46 48 48 - 12
New Ham pshire 20 20 20 19 18 13 7
New Jersey 13 13 10 8 8 9 4
New M exico 27 27 24 30 28 29 - 2
New York 4 4 4 3 4 4 0
North Carolina 31 31 28 24 25 25 6
North Dakota 38 38 35 31 31 30 8
Ohio 22 22 23 22 24 20 2
Oklahoma 43 43 46 47 49 50 - 7
Oregon 16 16 18 18 20 14 2
Pennsylvania 15 15 11 9 9 10 5
Rhode Island 8 8 7 6 7 7 1
South Carolina 37 37 40 38 34 34 3
South Dakota 49 49 47 45 39 37 12
Tennessee 30 30 22 20 22 23 7
Texas 33 33 33 40 41 44 - 11
Utah 21 21 30 35 40 43 - 22
Verm ont 7 7 6 7 6 5 2
Virginia 19 19 17 17 13 16 3
W ashington 17 17 13 15 16 15 2
W est Virginia 39 39 34 34 32 33 6
W isconsin 26 26 29 26 26 24 2
W yom ing 48 48 45 48 46 46 2
Physician Workforce in Nevada – 2009 Edition 44

Table 31: Nevada’s Rank Among US States in the Number of Physicians in Patient Care per 100,000 Population – 1980 to 2007
State
Rank in the Number of Physicians in Patient Care per 100,000 Population Change in
Rank –
1980 to
20071980 1985 1990 1995 2000 2007
Alabam a 46 43 41 41 42 42 4
Alaska 44 48 49 48 44 38 6
Arizona 12 20 19 31 36 39 - 27
Arkansas 47 45 42 43 45 45 2
California 6 6 9 12 15 18 - 12
Colorado 10 17 15 16 21 21 - 11
Connecticut 5 5 5 5 5 6 - 1
Delaware 24 19 21 22 23 27 - 3
Dist. Of Colum bia 1 1 1 1 1 1 0
Florida 11 16 12 17 14 19 - 8
Georgia 35 33 36 32 37 41 - 6
Hawaii 9 10 8 10 10 8 1
Idaho 50 50 51 50 51 51 - 1
Illinois 18 13 16 11 12 17 1
Indiana 42 41 44 42 43 40 2
Iowa 45 46 43 45 47 47 - 2
Kansas 29 30 32 34 35 36 - 7
Kentucky 41 39 39 33 38 35 6
Louisiana 32 25 26 18 19 22 10
M aine 25 28 27 30 17 12 13
M aryland 3 4 2 4 3 3 0
M assachusetts 2 2 3 2 2 2 0
M ichigan 28 26 31 27 27 28 0
M innesota 14 12 14 13 11 11 3
M ississippi 51 51 50 51 50 49 2
M issouri 23 23 25 23 30 31 - 8
M ontana 40 42 38 40 33 32 8
Nebraska 34 38 37 29 29 26 8
Nevada 36 37 48 47 48 48 - 12
New Ham pshire 20 22 20 21 18 13 7
New Jersey 13 9 10 7 8 9 4
New M exico 27 34 24 35 28 29 - 2
New York 4 3 4 3 4 4 0
North Carolina 31 31 28 26 25 25 6
North Dakota 38 32 35 28 31 30 8
Ohio 22 21 23 20 24 20 2
Oklahoma 43 44 46 46 49 50 - 7
Oregon 16 18 18 25 20 14 2
Pennsylvania 15 11 11 8 9 10 5
Rhode Island 8 8 7 6 7 7 1
South Carolina 37 40 40 38 34 34 3
South Dakota 49 47 47 44 39 37 12
Tennessee 30 24 22 14 22 23 7
Texas 33 35 33 39 41 44 - 11
Utah 21 29 30 37 40 43 - 22
Verm ont 7 7 6 9 6 5 2
Virginia 19 15 17 15 13 16 3
W ashington 17 14 13 19 16 15 2
W est Virginia 39 36 34 36 32 33 6
W isconsin 26 27 29 24 26 24 2
W yom ing 48 49 45 49 46 46 2
Physician Workforce in Nevada – 2009 Edition 45

Table 32: Graduates of the University of Nevada School of Medicine (UNSOM) CurrentlyPracticing in the United States by Year of Graduation and Gender – 2007
Year of Graduation
UNSOM Physicians Practicing in the United States – 2007
Men Women Total
Number Percent Number Percent Number Percent
1980-1989 318 37.5 132 27.2 450 33.7
1990-1999 302 35.6 175 36.0 477 35.8
2000-Present 228 26.9 179 36.8 407 30.5
Total 848 100.0 486 100.0 1,334 100.0
Table 33: Graduates of the University of Nevada School of Medicine (UNSOM) CurrentlyPracticing in the United States by Self-Designated Primary Care Speciality – 1997 to 2007
Specialty
Total UNSOM Graduates Change – 1997
to 20071997 2002 2007
Number Percent Number Percent Number Percent Number Percent
Primary Care Specialties
Family Medicine 75 14.8 194 18.0 223 16.7 148 197.3
General Practice 6 1.2 5 0.5 6 0.4 0 0.0
Internal Medicine 85 16.8 136 12.6 155 11.6 70 82.4
Obstetrics/Gynecology 41 8.1 86 8.0 99 7.4 58 141.5
Pediatrics 59 11.7 57 5.3 69 5.2 10 16.9
Total Primary Care Physicians 266 526 478 44.3 552 41.4 286 107.5
Primary Care Subspecialties 26 5.1 42 3.9 53 4.0 27 103.8
All Other Specialties 169 33.4 494 45.8 650 48.7 481 284.6
Not Classified 18 3.6 51 4.7 63 4.7 45 250.0
Inactive or Address Unknown 27 5.3 13 1.2 16 1.2 - 11 - 40.7
Total Physicians 506 100.0 1,078 100.0 1,334 100.0 828 163.6
Physician Workforce in Nevada – 2009 Edition 46

Table 34: Osteopathic Physicians (DOs) by Gender and Age in Nevada – 2007
Age Category
Osteopathic Physicians (DO)
Male Female Total
Number Percent Number Percent Number Percent
< 35 43 10.4 23 23.0 66 12.9
35-44 133 32.3 33 33.0 166 32.4
45-54 110 26.7 34 34.0 144 28.1
55-64 71 17.2 8 8.0 79 15.4
$ 65 55 13.3 2 2.0 57 11.1
Total DO Physicians 412 100.0 100 100.0 512 100.0
Table 35: Osteopathic Physicians (DOs) by Gender and Major Professional Activity in Nevada – 2007
Major Professional Activity
Osteopathic Physicians (DO)
Male Female Total
Number Percent Number Percent Number Percent
Patient Care
Office Based 310 75.2 72 72.0 382 74.6
Hospital-based Residents & Fellows 21 5.1 13 13 34 6.6
Hospital-based Physician Staff 31 7.5 6 6 3 7.2
Subtotal – Patient Care 362 87.9 91 91 453 88.5
Other Professional Activity
Administration 5 1.2 0 0.0 5 1.0
Medical Teaching 2 0.5 1 1.0 3 0.6
Medical Research 0 0.0 0 0.0 0 0.0
Other 43 10.4 8 8.0 51 10.0
Subtotal – Other Prof Activity 50 12.1 9 9.0 59 11.5
Total DO Physicians 412 100.0 100 100.0 512 100.0
Note: Physicians in patient care refers to physicians whose principal professional activity is the provision of patient care in an office-based setting or hospital.
Physician Workforce in Nevada – 2009 Edition 47
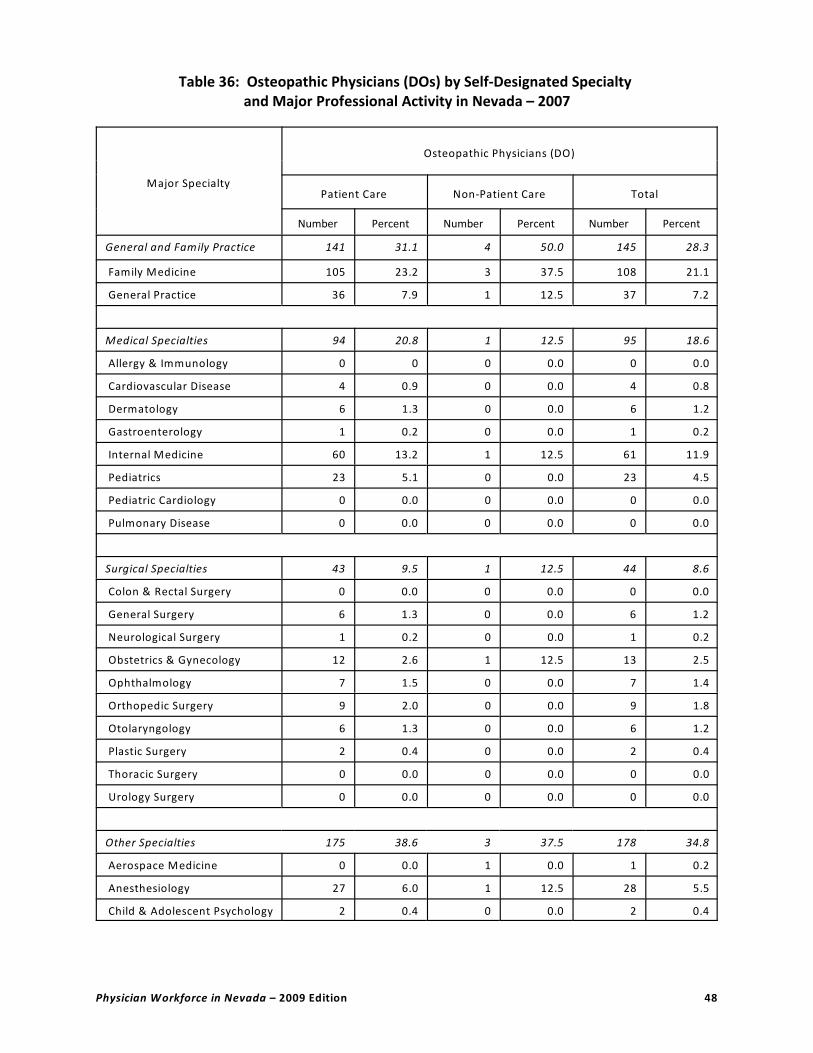
Table 36: Osteopathic Physicians (DOs) by Self-Designated Specialty and Major Professional Activity in Nevada – 2007
Major Specialty
Osteopathic Physicians (DO)
Patient Care Non-Patient Care Total
Number Percent Number Percent Number Percent
General and Family Practice 141 31.1 4 50.0 145 28.3
Family Medicine 105 23.2 3 37.5 108 21.1
General Practice 36 7.9 1 12.5 37 7.2
Medical Specialties 94 20.8 1 12.5 95 18.6
Allergy & Immunology 0 0 0 0.0 0 0.0
Cardiovascular Disease 4 0.9 0 0.0 4 0.8
Dermatology 6 1.3 0 0.0 6 1.2
Gastroenterology 1 0.2 0 0.0 1 0.2
Internal Medicine 60 13.2 1 12.5 61 11.9
Pediatrics 23 5.1 0 0.0 23 4.5
Pediatric Cardiology 0 0.0 0 0.0 0 0.0
Pulmonary Disease 0 0.0 0 0.0 0 0.0
Surgical Specialties 43 9.5 1 12.5 44 8.6
Colon & Rectal Surgery 0 0.0 0 0.0 0 0.0
General Surgery 6 1.3 0 0.0 6 1.2
Neurological Surgery 1 0.2 0 0.0 1 0.2
Obstetrics & Gynecology 12 2.6 1 12.5 13 2.5
Ophthalmology 7 1.5 0 0.0 7 1.4
Orthopedic Surgery 9 2.0 0 0.0 9 1.8
Otolaryngology 6 1.3 0 0.0 6 1.2
Plastic Surgery 2 0.4 0 0.0 2 0.4
Thoracic Surgery 0 0.0 0 0.0 0 0.0
Urology Surgery 0 0.0 0 0.0 0 0.0
Other Specialties 175 38.6 3 37.5 178 34.8
Aerospace Medicine 0 0.0 1 0.0 1 0.2
Anesthesiology 27 6.0 1 12.5 28 5.5
Child & Adolescent Psychology 2 0.4 0 0.0 2 0.4
Physician Workforce in Nevada – 2009 Edition 48
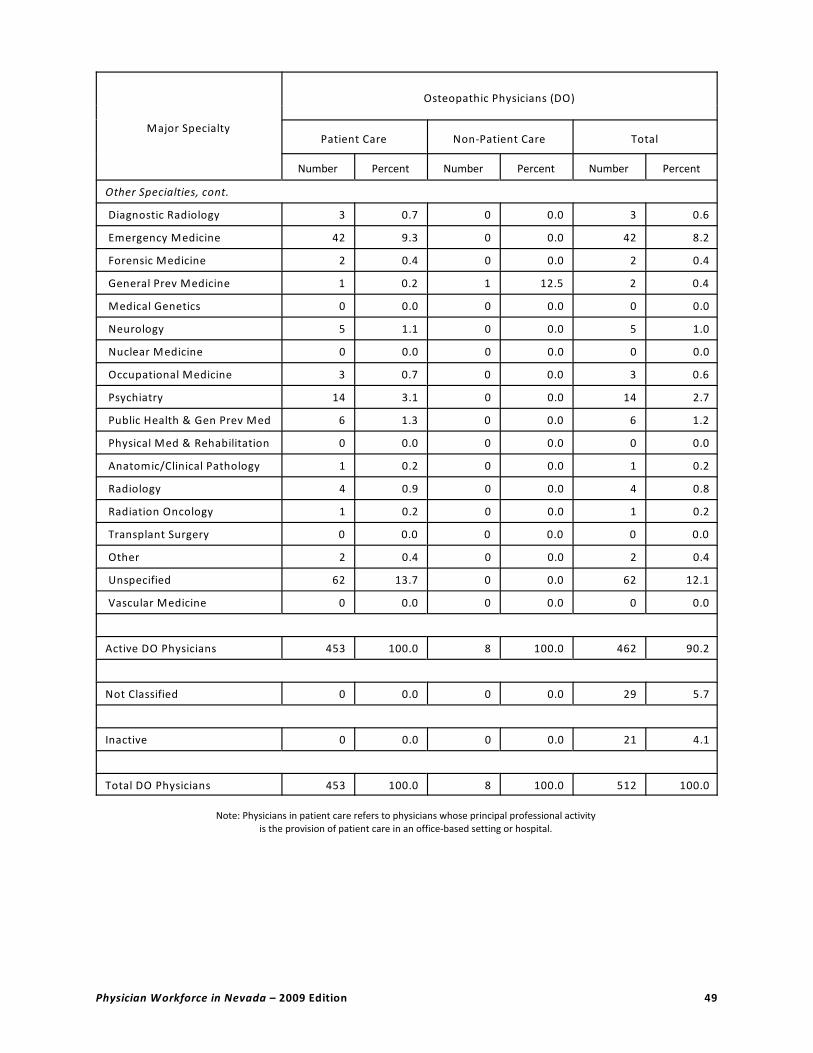
Major Specialty
Osteopathic Physicians (DO)
Patient Care Non-Patient Care Total
Number Percent Number Percent Number Percent
Other Specialties, cont.
Diagnostic Radiology 3 0.7 0 0.0 3 0.6
Emergency Medicine 42 9.3 0 0.0 42 8.2
Forensic Medicine 2 0.4 0 0.0 2 0.4
General Prev Medicine 1 0.2 1 12.5 2 0.4
Medical Genetics 0 0.0 0 0.0 0 0.0
Neurology 5 1.1 0 0.0 5 1.0
Nuclear Medicine 0 0.0 0 0.0 0 0.0
Occupational Medicine 3 0.7 0 0.0 3 0.6
Psychiatry 14 3.1 0 0.0 14 2.7
Public Health & Gen Prev Med 6 1.3 0 0.0 6 1.2
Physical Med & Rehabilitation 0 0.0 0 0.0 0 0.0
Anatomic/Clinical Pathology 1 0.2 0 0.0 1 0.2
Radiology 4 0.9 0 0.0 4 0.8
Radiation Oncology 1 0.2 0 0.0 1 0.2
Transplant Surgery 0 0.0 0 0.0 0 0.0
Other 2 0.4 0 0.0 2 0.4
Unspecified 62 13.7 0 0.0 62 12.1
Vascular Medicine 0 0.0 0 0.0 0 0.0
Active DO Physicians 453 100.0 8 100.0 462 90.2
Not Classified 0 0.0 0 0.0 29 5.7
Inactive 0 0.0 0 0.0 21 4.1
Total DO Physicians 453 100.0 8 100.0 512 100.0
Note: Physicians in patient care refers to physicians whose principal professional activity is the provision of patient care in an office-based setting or hospital.
Physician Workforce in Nevada – 2009 Edition 49

Table 37: Osteopathic Physicians (DOs) by Self-Designated Primary Care Specialty in Nevada and the United States – 2007
SpecialtyDO Physicians in Nevada DO Physicians in United States
Number Percent Number Percent
Primary Care Specialties
Family Medicine 106 20.7 14,631 23.7
General Practice 37 7.2 3,083 5.0
Internal Medicine 53 10.4 5,635 9.1
Obstetrics/Gynecology 11 2.1 2,111 3.4
Pediatrics 20 3.9 2,148 3.5
Total Primary Care DO Physicians 227 44.3 27,608 44.7
Primary Care Subspecialties 15 2.9 2,384 3.9
All Other Specialties 220 43.0 23,871 38.6
Not Classified 29 5.7 4,649 7.5
Inactive or Address Unknown 21 4.1 3,309 5.4
Total DO Physicians 512 100.0 61,821 100.0
Physician Workforce in Nevada – 2009 Edition 50

Appendix: Definitions and Explanation of Terms Used by the
American Medical Association (AMA) and the AMA
Division of Survey and Data Resources
The AMA Physician Masterfile
The Physician Workforce in Nevada: Current Characteristics and Distribution 2009 Edition
utilizes information from the American Medical Association’s (AMA) Physician Masterfile. The
Physician Masterfile is maintained by the AMA’s Division of Survey and Data Resources, and is
recognized as the definitive source of information on the physician workforce in the United
States. These reports contain historical and current data on the US physician population that
provide a basis for comparison essential for health services research, program planning, and
policy development. All of the state-level data contained in this report were derived from
annual reports generated by the AMA on physician workforce characteristics, including the
recently published Physician Characteristics and Distributions in the US, 2009 Edition, which
contains summary and detailed data on physicians in Nevada and the United States as of
December 31, 2007. The 2009 edition represents the latest in a series beginning in 1963 as the
Distribution of Physicians. This Appendix summarizes key elements of the AMA Physician
Masterfile and definitions and terms used by the AMA in the annual Physician Characteristics
and Distribution in the US reports that have been incorporated in this report.
The AMA has continued to develop a unique and comprehensive database of physician and
medical student information since the establishment of the Masterfile in 1906. Although
initially the Masterfile was primarily used by the Association as a record-keeping device for
membership and mailing purposes, today the Masterfile is widely considered to be the most
complete and extensive source of physician-related information in the United States. The
Masterfile contains current and historical data on all physicians, including members and
nonmembers of the AMA and graduates of foreign medical schools who are in the United
States and meet educational standards for recognitions as physicians. International Medical
Graduates (IMGs), who are graduates of foreign medical schools residing in the United States,
are included in the Masterfile, generally upon entry into graduate medical training programs
accredited by the Accreditation Council on Graduate Medical Education (ACGME). Included also
in the Masterfile are IMGs who have been granted a state license to practice medicine but who
may not have entered ACGME training programs. The Masterfile also includes physicians
licensed to practice in the United States but temporarily located abroad.
Physician Workforce in Nevada – 2009 Edition 51
A record is started on each individual upon entry into medical school or, the case of
international or Canadian medical graduates, upon entry into the United States. A physician’s
record includes medical school and year of graduation, sex, and birth date. As the physician’s
training and career develop, additional information is added, such as residency training, state
licensure data, and board certification. This information, which comprises the historical portion
of the Masterfile, facilitates studies of trends in geographic mobility and medical education.
In addition, the current professional activities portion of each physician’s record identifies
geographical location and current address, type of practice (Patient Care or Nonpatient Care),
specialties (primary and secondary), and present employment (solo, partnership, group
practice, medical schools, hospitals, government, and other organizations). These data are
particularly useful in staffing needs planning and research. By definition, the current portion of
the record is subject to constant change and must be updated continually through extensive
monitoring and data collection activities. Over time, the objectives, collection techniques, and
need assessments undergo regular review and change. Quality control, Masterfile expansion,
and upgrading of the information collected and analyzed continue to be the major focus of the
AMA’s Division of Survey and Data Resources.
A major source of data collection is the Census of Physicians (PPA Questionnaire), which the
AMA designed in 1968 in order to collect data under a new classification of physician activities
based on “hours worked” criteria. The PPA Questionnaire was sent every four years between
1969 and 1985 to all physicians residing in the United States, as well as to US physicians
residing temporarily overseas. Since 1985, the PPA Questionnaire has evolved into a rotating
census in which approximately one-fourth of all physicians are surveyed each year. New
methodologies are periodically tested and implemented to enhance data collection; examples
include telephone follow-ups and multi-packet mailings.
Each physician is asked to choose among the categories in each of the following items:
(1) Professional Activity – Direct Patient Care or Nonpatient Care activities (i.e., Administrative
Activities, Medical Education, Medical Research, Other Medical Activities); (2) Specialization –
primary and secondary activities; and (3) Present Employment – type of employer (i.e., Self-
Employed, Solo Practice, Two-Physician Practice, Group Practice, HMO, Medical School, Non-
Government Hospital, City/County/State Government, US Government, Locum Tenens, Other
Patient Care, and Other Nonpatient Care). All completed questionnaires are passed through a
series of computer editing procedures that assign major professional activity, specialty, and
employment classifications to each physician’s record.
Physician Workforce in Nevada – 2009 Edition 52

Over the past decade, the PPA Questionnaire has undergone continuous expansion. In addition
to the professional activity, specialty, and employment categories, the PPA Questionnaire now
includes information about office addresses, principle hospital affiliations, group affiliations,
telephone numbers, and other data. While the data collected from the PPA Questionnaire
represent a major source of information to the Masterfile, data also are obtained from several
organizations and institutions. These primary sources and the data they provide include the
following: (1) Medical schools – name, address, birth date, birthplace, school, and year of
graduation; (2) Hospitals – physicians in graduate medical training, including IMGs entering US
training; (3) Medical societies – address and membership information; (4) State licensing
agencies – licensure status of physicians; (5) Educational Commission for the Foreign Medical
Graduates (ECFMG) – IMGs who are certified or have applied for certification by the ECFMG;
(6) Surgeons general of the US government – physicians in government services; and
(7) American Board of Medical Specialties – physicians certified by American Specialty Boards
Data are also extracted from the Masterfile for use by these agencies. In addition, the
Masterfile is used by various state and county societies, publishers, and several addressing
companies.
Definitions and Explanation of Terms Used by the AMA
This section provides definitions of specific physician attributes and an explanation of terms
used by the AMA in its annual physician workforce reports and replicated in the Physician
Workforce in Nevada.
Major Professional Activity
Major professional activity (MPA) classifications are reported by physicians in the Physicians’
Practice Arrangements (PPA) questionnaire. The physician’s professional activity is shown in
the two categories of Patient Care and Nonpatient Care, the latter category being referred to
as Other Professional Activity. Patient Care activities include Office-Based practice and
Hospital-Based practice. Physicians in Residency training (including Clinical Fellows) and full-
time members of Hospitals Staffs comprise Hospital-Based practice. Other Professional Activity
includes Administration, Medical Teaching, Research, and Other Activities. The subcategory
Clinical Fellows is not longer tabulated; physicians formerly counted as Clinical Fellows are now
in the category Residents/Fellows and are tabulated as Residents.
Physician Workforce in Nevada – 2009 Edition 53

Physicians who are retired, semiretired, working part-time, temporarily not in practice, or not
active for other reasons are classified as Inactive. Physicians are categorized as Not Classified if
the AMA has not received any recent information as to their type of practice and present
employment. Following are definitions of each of the MPA categories.
• Office-Based Practice includes physicians engaged in seeing patients. Physicians may be in
solo practice, group practice, two-physician practice, or other patient care employment.
This category also includes physicians in patient services, such as those provided by
pathologists and radiologists.
• Hospital-Based Practice includes physicians employed under contract with hospitals to
provide direct patient care.
• Residents includes any physician in supervised practice of medicine among patients in a
hospital or in its outpatient departments, with continued instruction in the science and art
of medicine by the staff of the facility. This category also includes clinical fellows in
advanced training in the clinical divisions of medicine, surgery, and other specialty fields
preparing for practice in a given specialty. These physicians are engaged primarily in patient
care.
• Medical Teaching includes physicians with teaching appointments in medical schools,
hospitals, nursing schools, or other institutions of higher learning.
• Medical Research includes physicians in activities (funded or nonfunded) performed to
develop new medical knowledge, potentially leading to publication. This category also
includes physicians in research fellowship programs distinct from an accredited residency
program and those primarily engaged in nonpatient care.
• Administration includes physicians in administrative activities in a hospital, health facility,
health agency, clinic, group, or any similar organization.
• Other Activity includes physicians employed by insurance carriers, pharmaceutical
companies, corporations, voluntary organizations, medical societies, associations, grants,
foreign countries, and the like.
• Inactives include physicians who are retired, semiretired, working part-time, temporarily
not in practice, or not active for other reasons and who indicated they worked 20 hours or
less per week.
• Not Classified includes physicians who did not provide information on their type of practice
or their present employment.
Physician Workforce in Nevada – 2009 Edition 54

Self-Designated Practice Specialty
Like major professional activity, a physician’s self-designated practice specialty (SDPS) is
determined by the physician from a list of codes included with the PPA Questionnaire. A
number of tables contained in the Physician Workforce in Nevada aggregate data according to
specialties listed on the PPA Questionnaire and maintained on the Masterfile for which there is
at least one physician designating it as their area of practice. Specialty classifications based on
the 40 specialties used by the AMA for statistical purposes are listed below.
Allergy & Immunology (AI)
Allergy (A)
Allergy & Immunology/Clinical & Laboratory
Immunology (ALI)
Immunology (IG)
Aerospace Medicine (AM)
Anesthesiology (AN)
Adult Cardiothoracic Anesthesiology (ACA)
Pain Medicine (Anesthesiology) (APM)
Critical Care (Anesthesiology) (CCA)
Pain Management (PME)
Cardiovascular Disease (CD)
Child & Adolescent Psychiatry (CHP)
Colon & Rectal Surgery (CRS)
Proctology (PRO)
Dermatology (D)
Clinical & Laboratory Dermatological Immunology
(DDL)
Procedural Dermatology (PRD)
Diagnostic Radiology (DR)
Cardiothoracic Radiology (CTR)
Emergency Medicine (EM)
Sports Medicine (Emergency Medicine) (ESM)
Medical Toxicology (Emergency Medicine) (ETX)
Pediatric Emergency Medicine (Emergency
Medicine) (PE)
Urgent Care Medicine (UCM)
Underseas Medicine (Emergency Medicine) (UME)
Forensic Pathology (FOP)
Family Medicine (FM)
Adolescent Medicine for Family Practice (AMF)
Geriatric Medicine (Family Medicine) (FPG)
Sports Medicine (Family Medicine) (FSM)
Gastroenterology (GE)
General Practice (GP)
General Preventative Medicine (GPM)
Medical Toxicology (Preventative Medicine) (PTX)
Underseas Medicine (Preventative Medicine (UM)
General Surgery (GS)
Abdominal Surgery (AS)
Surgical Critical Care (Surgery) (CCS)
Craniofacial Surgery (CFS)
Dermatologic Surgery (DS)
Head & Neck Surgery (HNS)
Hand Surgery (HS)
Hand Surgery (Surgery) (HSS)
Oral & Maxillofacial Surgery (OMF)
Pediatric Cardiothoracic Surgery (PCS)
Pediatric Surgery (Surgery) (PDS)
Surgical Oncology (SO)
Trauma Surgery (TRS)
Vascular Surgery (VS)
Physician Workforce in Nevada – 2009 Edition 55

Internal Medicine (IM)
Adolescent Medicine (AMI)
Critical Care Medicine (Internal Medicine) (CCM)
Diabetes (DIA)
Endocrinology, Diabetes & Metabolism (END)
Hematology (Internal Medicine) (HEM)
Hepatology (HEP)
Hematology/Oncology (HO)
Hospitalist (HOS)
Interventional Cardiology (IC)
Cardiac Electrophysiology (ICE)
Infectious Diseases (ID)
Clinical & Laboratory Immunology (Internal
Medicine) (ILI)
Geriatric Medicine (IMG)
Sports Medicine (Internal Medicine) (ISM)
Nuclear Cardiology (NC)
Nutrition (NTR)
Medical Oncology (ON)
Rheumatology (RHU)
Sleep Medicine (Internal Medicine) (SMI)
Transplant Hepatology (Internal Medicine) (THP)
Medical Genetics (MG)
Clinical Biochemical Genetics (CBG)
Clinical Cytogenetics (CCG)
Clinical Genetics (CG)
Clinical Molecular Genetics (CMG)
Neurology (N)
Child Neurology (CHN)
Clinical Neurophysiology (CN)
Vascular Neurology (VN)
Nuclear Medicine (NM)
Neurological Surgery (NS)
Endovascular Surgical Neuroradiology (ESN)
Pediatric Surgery (Neurology) (NSP)
Obstetrics & Gynecology (OBG)
Gynecological Oncology (GO)
Gynecology (GYN)
Maternal & Fetal Medicine (MFM)
Obstetrics (OBS)
Critical Care Medicine (Obstetrics & Gynecology)
(OCC)
Reproductive Endocrinology (REN)
Occupational Medicine (OM)
Ophthalmology (OPH)
Pediatric Ophthalmology (PO)
Orthopedic Surgery (ORS)
Hand Surgery (Orthopedic Surgery) ((HSO)
Adult Reconstructive Orthopedics (OAR)
Orthopedics, Foot & Ankle (OFA)
Musculoskeletal Oncology (OMO)
Pediatric Orthopedics (OP)
Sports Medicine (Orthopedic Surgery) (OSM)
Orthopedic Surgery of the Spine (OSS)
Orthopedic Trauma (OTR)
Other Specialty (OS)
Addiction Medicine (ADM)
Pediatric Psychiatry/Child Psychiatry (CCP)
Emergency Medicine/Family Medicine (EFM)
Pediatrics/Emergency Medicine (EMP)
Epidemiology (EP)
Family Medicine/Psychiatry (FPP)
Internal Medicine/Family Medicine (IFP)
Internal Medicine/Dermatology (IMD)
Internal Medicine (Preventative Medicine) (IPM)
Legal Medicine (LM)
Internal Medicine/Medical Genetics (MDG)
Medical Management (MDM)
Internal Medicine (Emergency Medicine) (MEM)
Internal Medicine & Neurology (MN)
Internal Medicine/Psychiatry (MP)
Internal Medicine/Physical Medicine &
Rehabilitation (MPM)
Neurology/Nuclear Medicine (NNM)
Neurology/Diagnostic Radiology/Neuroradiology (NRN)
Clinical Pharmacology (PA)
Pediatrics/Dermatology (PDM)
Phlebology (PHL)
Pharmaceutical Medicine (PHM)
Palliative Medicine (PLM)
Pediatrics/Medical Genetics (PMG)
Pediatrics/Physical Medicine & Rehabilitation (PPM)
Psychiatry/Neurology (PYN)
Sleep Medicine (SME)
Otolaryngology (OTO)
Otology/Neurotology (NO)
Pediatric Otolaryngology (PDO)
Psychiatry (P)
Addiction Psychiatry (ADP)
Neurodevelopmental Disabilities (Psychiatry &
Neurology) (NDN)
Neuropsychiatry (NUP)
Forensic Psychiatry (PFP)
Pain Medicine (Psychiatry) (PPN)
Psychoanalysis (PYA)
Geriatric Psychiatry (PYG)
Psychosomatic Medicine (PYM)
Physician Workforce in Nevada – 2009 Edition 56
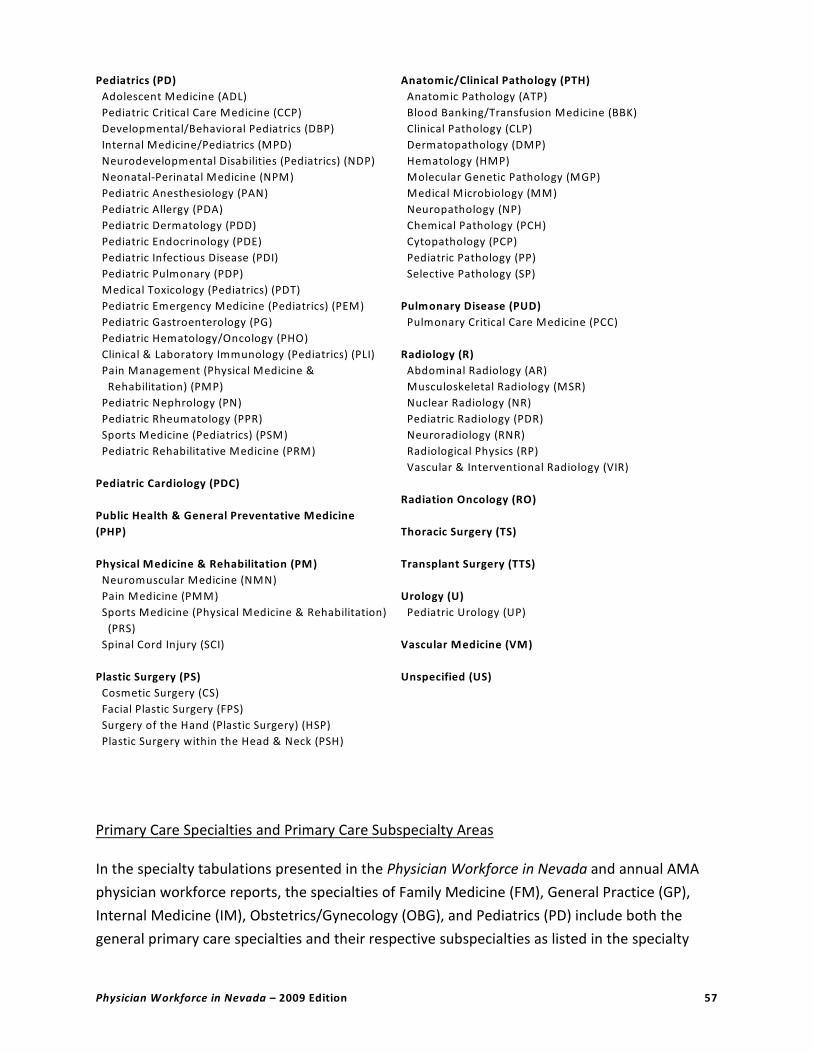
Pediatrics (PD)
Adolescent Medicine (ADL)
Pediatric Critical Care Medicine (CCP)
Developmental/Behavioral Pediatrics (DBP)
Internal Medicine/Pediatrics (MPD)
Neurodevelopmental Disabilities (Pediatrics) (NDP)
Neonatal-Perinatal Medicine (NPM)
Pediatric Anesthesiology (PAN)
Pediatric Allergy (PDA)
Pediatric Dermatology (PDD)
Pediatric Endocrinology (PDE)
Pediatric Infectious Disease (PDI)
Pediatric Pulmonary (PDP)
Medical Toxicology (Pediatrics) (PDT)
Pediatric Emergency Medicine (Pediatrics) (PEM)
Pediatric Gastroenterology (PG)
Pediatric Hematology/Oncology (PHO)
Clinical & Laboratory Immunology (Pediatrics) (PLI)
Pain Management (Physical Medicine &
Rehabilitation) (PMP)
Pediatric Nephrology (PN)
Pediatric Rheumatology (PPR)
Sports Medicine (Pediatrics) (PSM)
Pediatric Rehabilitative Medicine (PRM)
Pediatric Cardiology (PDC)
Public Health & General Preventative Medicine
(PHP)
Physical Medicine & Rehabilitation (PM)
Neuromuscular Medicine (NMN)
Pain Medicine (PMM)
Sports Medicine (Physical Medicine & Rehabilitation)
(PRS)
Spinal Cord Injury (SCI)
Plastic Surgery (PS)
Cosmetic Surgery (CS)
Facial Plastic Surgery (FPS)
Surgery of the Hand (Plastic Surgery) (HSP)
Plastic Surgery within the Head & Neck (PSH)
Anatomic/Clinical Pathology (PTH)
Anatomic Pathology (ATP)
Blood Banking/Transfusion Medicine (BBK)
Clinical Pathology (CLP)
Dermatopathology (DMP)
Hematology (HMP)
Molecular Genetic Pathology (MGP)
Medical Microbiology (MM)
Neuropathology (NP)
Chemical Pathology (PCH)
Cytopathology (PCP)
Pediatric Pathology (PP)
Selective Pathology (SP)
Pulmonary Disease (PUD)
Pulmonary Critical Care Medicine (PCC)
Radiology (R)
Abdominal Radiology (AR)
Musculoskeletal Radiology (MSR)
Nuclear Radiology (NR)
Pediatric Radiology (PDR)
Neuroradiology (RNR)
Radiological Physics (RP)
Vascular & Interventional Radiology (VIR)
Radiation Oncology (RO)
Thoracic Surgery (TS)
Transplant Surgery (TTS)
Urology (U)
Pediatric Urology (UP)
Vascular Medicine (VM)
Unspecified (US)
Primary Care Specialties and Primary Care Subspecialty Areas
In the specialty tabulations presented in the Physician Workforce in Nevada and annual AMA
physician workforce reports, the specialties of Family Medicine (FM), General Practice (GP),
Internal Medicine (IM), Obstetrics/Gynecology (OBG), and Pediatrics (PD) include both the
general primary care specialties and their respective subspecialties as listed in the specialty
Physician Workforce in Nevada – 2009 Edition 57

abbreviations appearing in the list above. However, in the tables detailing the distribution of
the primary care physician workforce, the data are presented separately for the general
primary care specialties and the primary care subspecialties, where the general primary care
specialties are Family Medicine, General Practice, Internal Medicine, Obstetrics and
Gynecology, and Pediatrics excluding the subspecialties associated with these general
specialties.
Geographic Region
In some of the tables contained in this report, physician workforce data for Nevada is
compared with data for the “Mountain Region.” States in the Mountain Region include
Arizona, Colorado, Idaho, Montana, Nevada, New Mexico, Utah, and Wyoming.
Physician Workforce in Nevada – 2009 Edition 58


Related Documents