PHYSICAL PROCESSES SHAPING GAMMA-RAY BURST X-RAYAFTERGLOW LIGHT CURVES: THEORETICAL IMPLICATIONS FROM THE SWIFT X-RAY TELESCOPE OBSERVATIONS Bing Zhang, 1 Y. Z. Fan, 1,2,3 Jaroslaw Dyks, 1,4 Shiho Kobayashi, 5,6,7 Peter Me ´sza ´ros, 5,6 David N. Burrows, 5 John A. Nousek, 5 and Neil Gehrels 8 Received 2005 August 15; accepted 2005 December 19 ABSTRACT With the successful launch of the Swift Gamma-Ray Burst Explorer, a rich trove of early X-ray afterglow data has been collected by its onboard X-Ray Telescope ( XRT). Some interesting features are emerging, including a distinct rapidly decaying component preceding the conventional afterglow component in many sources, a shallow decay component before the more ‘‘normal’’ decay component observed in a good fraction of GRBs, and X-ray flares in nearly half of the afterglows. In this paper we systematically analyze the possible physical processes that shape the properties of the early X-ray afterglow light curves and use the data to constrain various models. We suggest that the steep decay component is consistent with the tail emission of the prompt gamma-ray bursts and/or the X-ray flares. This provides strong evidence that the prompt emission and afterglow emission are likely two distinct components, supporting the internal origin of the GRB prompt emission. The shallow decay segment observed in a group of GRBs suggests that very likely the forward shock keeps being refreshed for some time. This might be caused by either a long-lived central engine, or a wide distribution of the shell Lorentz factors, or else possibly the deceleration of a Poynting flux–dominated flow. X-ray flares suggest that the GRB central engine is very likely still active after the prompt gamma-ray emission is over, but with a reduced activity at later times. In some cases, the central engine activity even extends to days after the burst triggers. Analyses of early X-ray afterglow data reveal that GRBs are indeed highly relativistic events and that early afterglow data of many bursts, starting from the beginning of the XRT observations, are consistent with the afterglow emission from an ISM environment. Subject headin gs: gamma rays: bursts — radiation mechanisms: nonthermal — shock waves 1. INTRODUCTION With the successful launch of the Swift Gamma-Ray Burst Explorer, an era of systematic, multiwavelength observations of gamma-ray burst (GRB) early afterglows has been ushered in. Very early optical/IR detections have been made with ground- based telescopes (Akerlof et al. 1999; Fox et al. 2003; Li et al. 2003a; Blake et al. 2005; Vestrand et al. 2005) before and during the initial operation of Swift. In the X-ray band, some evidence of the early afterglows has been collected earlier (e.g., Piro et al. 1998; Giblin et al. 1999; Burenin et al. 1999; Piro et al. 2005). However, it is the operation of the Swift X-Ray Telescope ( XRT) that offers the possibility to unveil the final gap between the prompt emission and the late afterglow stage. There has been widespread expectation that the early X-ray observations could answer a series of core questions in GRB studies. What is the connection between the GRB prompt emis- sion and the afterglow? Are prompt emission and afterglow both from the external shock (Me ´sza ´ros & Rees 1993; Dermer & Mitman 1999) or do they come from different locations (i.e., prompt emission from the internal shocks [Rees & Me ´sza ´ros 1994; Paczynski & Xu 1994], while the afterglow comes from the external shock [Me ´sza ´ros & Rees 1997a; Sari et al. 1998])? Does the central engine become dormant after the burst is over? What is the immediate environment of the burst, an interstellar medium ( ISM ) or a wind? Are there density clumps surrounding the GRB progenitor? What is the role of the reverse shock? What is the initial Lorentz factor of the fireball? All of these questions can be at least partially answered with the early X-ray afterglow data, sometimes in combination with the prompt gamma-ray data and the early optical/IR afterglow data. Although early afterglow light curves have been extensively modeled in the optical band (mainly driven by the observations and by the theoretical argument that the reverse shock emission com- ponent plays an important role in the optical band; e.g., Me ´sza ´ros & Rees 1997a, 1999; Sari & Piran 1999; Kobayashi 2000; Kobayashi & Zhang 2003a, 2003b; Zhang et al. 2003; Wei 2003; Wu et al. 2003; Li et al. 2003b; Fan et al. 2004a, 2005b, 2005c; Zhang & Kobayashi 2005; Nakar & Piran 2004; McMahon et al. 2004), pos- sible early X-ray afterglow signatures have been only sparsely studied (e.g., Kumar & Panaitescu 2000b; Kobayashi et al. 2005; Fan & Wei 2005). In its first 6 months of operations, the Swift XRT has already accumulated a rich collection of early afterglow features in the X-ray band. The XRT is a sensitive broadband (0.2–10 keV ) im- ager, which can be promptly slewed to GRB targets triggered by the Burst Alert Telescope ( BAT) within 1–2 minutes (Burrows et al. 2005b). It is therefore an ideal instrument to study the tran- sition between the GRB prompt emission and the very early X-ray afterglow. The following features are all detected by XRT in a good sample of bursts (for a collection of data see, e.g., 1 Department of Physics, University of Nevada, 4505 South Maryland Parkway, Las Vegas, NV 89154. 2 Purple Mountain Observatory, Chinese Academy of Science, 2 Beijing Xi Lu, Nanjing, Jiangsu 210008, China. 3 National Astronomical Observatories, Chinese Academy of Sciences, A20 Datun Road, Chaoyang Beijing 100012, China. 4 Nicolaus Copernicus Astronomical Center, Laboratory for Astrophysics I, Ul. Rabianska 8, 87-100 Torun, Poland. 5 Department of Astronomy and Astrophysics, Pennsylvania State Univer- sity, 525 Davey Laboratory, University Park, PA 16802. 6 Department of Physics, Pennsylvania State University, 104 Davey Labo- ratory, University Park, PA 16802. 7 Astrophysics Research Institute, Liverpool John Moores University, Twelve Quays House, Birkenhead CH41 1LD, UK. 8 NASA Goddard Space Flight Center, Greenbelt, MD 20771. 354 The Astrophysical Journal, 642:354–370, 2006 May 1 # 2006. The American Astronomical Society. All rights reserved. Printed in U.S.A.

Welcome message from author
This document is posted to help you gain knowledge. Please leave a comment to let me know what you think about it! Share it to your friends and learn new things together.
Transcript
PHYSICAL PROCESSES SHAPING GAMMA-RAY BURST X-RAY AFTERGLOW LIGHT CURVES:THEORETICAL IMPLICATIONS FROM THE SWIFT X-RAY TELESCOPE OBSERVATIONS
Bing Zhang,1Y. Z. Fan,
1,2,3Jaroslaw Dyks,
1,4Shiho Kobayashi,
5,6,7Peter Meszaros,
5,6
David N. Burrows,5John A. Nousek,
5and Neil Gehrels
8
Received 2005 August 15; accepted 2005 December 19
ABSTRACT
With the successful launch of the Swift Gamma-Ray Burst Explorer, a rich trove of early X-ray afterglow data hasbeen collected by its onboard X-Ray Telescope (XRT). Some interesting features are emerging, including a distinctrapidly decaying component preceding the conventional afterglow component in many sources, a shallow decaycomponent before the more ‘‘normal’’ decay component observed in a good fraction of GRBs, and X-ray flares innearly half of the afterglows. In this paper we systematically analyze the possible physical processes that shape theproperties of the early X-ray afterglow light curves and use the data to constrain various models. We suggest that thesteep decay component is consistent with the tail emission of the prompt gamma-ray bursts and/or the X-ray flares.This provides strong evidence that the prompt emission and afterglow emission are likely two distinct components,supporting the internal origin of the GRB prompt emission. The shallow decay segment observed in a group of GRBssuggests that very likely the forward shock keeps being refreshed for some time. This might be caused by either along-lived central engine, or a wide distribution of the shell Lorentz factors, or else possibly the deceleration of aPoynting flux–dominated flow. X-ray flares suggest that the GRB central engine is very likely still active after theprompt gamma-ray emission is over, but with a reduced activity at later times. In some cases, the central engineactivity even extends to days after the burst triggers. Analyses of early X-ray afterglow data reveal that GRBs areindeed highly relativistic events and that early afterglow data of many bursts, starting from the beginning of the XRTobservations, are consistent with the afterglow emission from an ISM environment.
Subject headings: gamma rays: bursts — radiation mechanisms: nonthermal — shock waves
1. INTRODUCTION
With the successful launch of the Swift Gamma-Ray BurstExplorer, an era of systematic, multiwavelength observations ofgamma-ray burst (GRB) early afterglows has been ushered in.Very early optical/IR detections have been made with ground-based telescopes (Akerlof et al. 1999; Fox et al. 2003; Li et al.2003a; Blake et al. 2005; Vestrand et al. 2005) before and duringthe initial operation of Swift. In the X-ray band, some evidence ofthe early afterglows has been collected earlier (e.g., Piro et al.1998; Giblin et al. 1999; Burenin et al. 1999; Piro et al. 2005).However, it is the operation of the Swift X-Ray Telescope (XRT)that offers the possibility to unveil the final gap between theprompt emission and the late afterglow stage.
There has been widespread expectation that the early X-rayobservations could answer a series of core questions in GRBstudies. What is the connection between the GRB prompt emis-sion and the afterglow? Are prompt emission and afterglow bothfrom the external shock (Meszaros & Rees 1993; Dermer &
Mitman 1999) or do they come from different locations (i.e.,prompt emission from the internal shocks [Rees & Meszaros1994; Paczynski & Xu 1994], while the afterglow comes fromthe external shock [Meszaros & Rees 1997a; Sari et al. 1998])?Does the central engine become dormant after the burst is over?What is the immediate environment of the burst, an interstellarmedium (ISM) or a wind? Are there density clumps surroundingthe GRB progenitor?What is the role of the reverse shock?Whatis the initial Lorentz factor of the fireball?All of these questions can be at least partially answered with
the early X-ray afterglow data, sometimes in combination withthe prompt gamma-ray data and the early optical/IR afterglowdata. Although early afterglow light curves have been extensivelymodeled in the optical band (mainly driven by the observations andby the theoretical argument that the reverse shock emission com-ponent plays an important role in the optical band; e.g.,Meszaros&Rees 1997a, 1999; Sari & Piran 1999; Kobayashi 2000; Kobayashi& Zhang 2003a, 2003b; Zhang et al. 2003; Wei 2003; Wu et al.2003; Li et al. 2003b; Fan et al. 2004a, 2005b, 2005c; Zhang &Kobayashi 2005; Nakar & Piran 2004;McMahon et al. 2004), pos-sible early X-ray afterglow signatures have been only sparselystudied (e.g., Kumar& Panaitescu 2000b; Kobayashi et al. 2005;Fan & Wei 2005).In its first 6 months of operations, the Swift XRT has already
accumulated a rich collection of early afterglow features in theX-ray band. The XRT is a sensitive broadband (0.2–10 keV) im-ager, which can be promptly slewed to GRB targets triggered bythe Burst Alert Telescope (BAT) within 1–2 minutes (Burrowset al. 2005b). It is therefore an ideal instrument to study the tran-sition between the GRB prompt emission and the very earlyX-ray afterglow. The following features are all detected by XRTin a good sample of bursts (for a collection of data see, e.g.,
1 Department of Physics, University of Nevada, 4505 South MarylandParkway, Las Vegas, NV 89154.
2 Purple Mountain Observatory, Chinese Academy of Science, 2 Beijing XiLu, Nanjing, Jiangsu 210008, China.
3 National Astronomical Observatories, Chinese Academy of Sciences, A20Datun Road, Chaoyang Beijing 100012, China.
4 Nicolaus Copernicus Astronomical Center, Laboratory for Astrophysics I,Ul. Rabianska 8, 87-100 Torun, Poland.
5 Department of Astronomy and Astrophysics, Pennsylvania State Univer-sity, 525 Davey Laboratory, University Park, PA 16802.
6 Department of Physics, Pennsylvania State University, 104 Davey Labo-ratory, University Park, PA 16802.
7 Astrophysics Research Institute, Liverpool John Moores University,Twelve Quays House, Birkenhead CH41 1LD, UK.
8 NASA Goddard Space Flight Center, Greenbelt, MD 20771.
354
The Astrophysical Journal, 642:354–370, 2006 May 1
# 2006. The American Astronomical Society. All rights reserved. Printed in U.S.A.
Chincarini et al. 2005; Nousek et al. 2006), reflecting somecommon underlying physics of GRBs:
1. In most cases (e.g., GRB 050126 and GRB 050219A), asteep decay is observed up to several hundred seconds after theburst trigger, which is followed by amore conventional, shallowerdecay (Tagliaferri et al. 2005; Goad 2006). This conclusion isdrawn by choosing the GRB trigger time as the zero time point(t0). At later times (e.g., t � t0 3T90, where T90 is the duration ofthe GRB), the afterglow decay slope d ln F�/d ln (t � t0) is essen-tially independent of the adopted t0. However, at early times (e.g.,t � t0 not much larger than T90), the measured decay slope couldbe very sensitive to the assumed t0. Tagliaferri et al. (2005) ex-plored the t0 effect and concluded that the two distinct light-curvesegments are likely intrinsic rather than due to a poor choice of t0.Furthermore, in some cases, the steep decay segment also has adifferent spectral index (e.g., for GRB 050319; Cusumano et al.2006). Usually it also connects to the spectral extrapolation of theBAT prompt emission light curve smoothly (Barthelmy et al.2005a). All of these facts indicate that the steep decay componentis a distinct new component that may be unrelated to the conven-tional afterglow component.
2. In a good fraction of GRBs (e.g., GRB 050128, Campanaet al. 2005; GRB 050315, Vaughan et al. 2006; GRB 050319,Cusumano et al. 2006; GRB 050401, De Pasquale et al. 2006), theearly X-ray afterglow is characterized by a shallow-to-‘‘normal’’transition. During the transition the spectral index is not changed.The decay slope after the break (e.g., approximately �1.2) isconsistent with the standard ISM afterglow model, while the de-cay slope before the break is usually much shallower (e.g., ap-proximately �0.5).
3. In some cases (e.g., GRB 050315; Vaughan et al. 2006), afurther steepening is detected after the normal decay phase, whichis consistent with a jet break.
4. Bright X-ray flares have been detected in the early X-raylight curves of nearly one-half of the burst population (e.g., GRB050406, GRB 050202B; Burrows et al. 2005a; Romano et al.2006; Falcone et al. 2006). In particular, the X-ray afterglow ofthe short-hard burst GRB 050724 also shows at least three flares(Barthelmy et al. 2005b). The flares typically happen hundredsof seconds after the trigger or earlier, but in some cases they oc-cur around a day after the trigger (e.g., GRB 050502B, Falconeet al. 2006; GRB 050724, Barthelmy et al. 2005b). The ampli-tudes of the flares are usually larger than the underlying after-glow component by a factor of several (e.g., a factor of 6 in GRB050406; Burrows et al. 2005a; Romano et al. 2006) but can bemuch larger (e.g., �500 in the case of GRB 050202B; Burrowset al. 2005a; Falcone et al. 2006). A similar feature was evidentfor GRB 011121 detected by BeppoSAX (Piro et al. 2005).
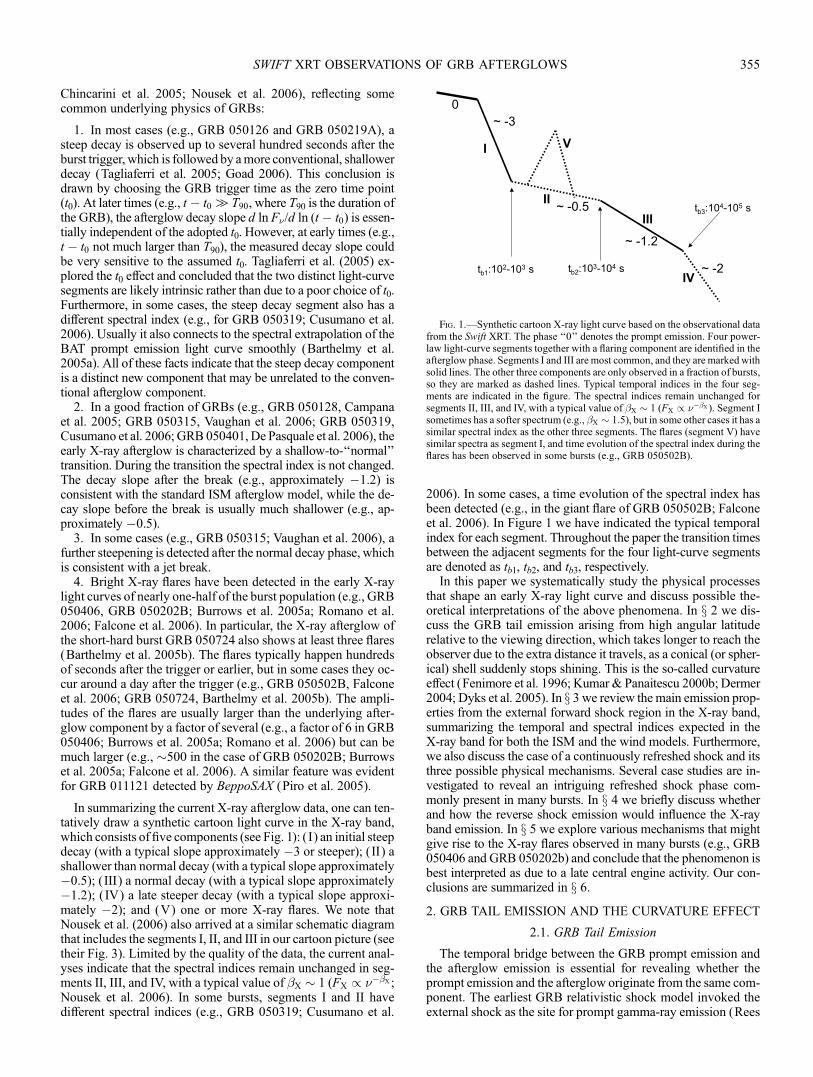
In summarizing the current X-ray afterglow data, one can ten-tatively draw a synthetic cartoon light curve in the X-ray band,which consists of five components (see Fig. 1): ( I) an initial steepdecay (with a typical slope approximately �3 or steeper); ( II) ashallower than normal decay (with a typical slope approximately�0.5); ( III) a normal decay (with a typical slope approximately�1.2); ( IV) a late steeper decay (with a typical slope approxi-mately �2); and (V) one or more X-ray flares. We note thatNousek et al. (2006) also arrived at a similar schematic diagramthat includes the segments I, II, and III in our cartoon picture (seetheir Fig. 3). Limited by the quality of the data, the current anal-yses indicate that the spectral indices remain unchanged in seg-ments II, III, and IV, with a typical value of �X � 1 (FX / ���X ;Nousek et al. 2006). In some bursts, segments I and II havedifferent spectral indices (e.g., GRB 050319; Cusumano et al.
2006). In some cases, a time evolution of the spectral index hasbeen detected (e.g., in the giant flare of GRB 050502B; Falconeet al. 2006). In Figure 1 we have indicated the typical temporalindex for each segment. Throughout the paper the transition timesbetween the adjacent segments for the four light-curve segmentsare denoted as tb1, tb2, and tb3, respectively.
In this paper we systematically study the physical processesthat shape an early X-ray light curve and discuss possible the-oretical interpretations of the above phenomena. In x 2 we dis-cuss the GRB tail emission arising from high angular latituderelative to the viewing direction, which takes longer to reach theobserver due to the extra distance it travels, as a conical (or spher-ical) shell suddenly stops shining. This is the so-called curvatureeffect (Fenimore et al. 1996; Kumar & Panaitescu 2000b; Dermer2004; Dyks et al. 2005). In x 3 we review the main emission prop-erties from the external forward shock region in the X-ray band,summarizing the temporal and spectral indices expected in theX-ray band for both the ISM and the wind models. Furthermore,we also discuss the case of a continuously refreshed shock and itsthree possible physical mechanisms. Several case studies are in-vestigated to reveal an intriguing refreshed shock phase com-monly present in many bursts. In x 4 we briefly discuss whetherand how the reverse shock emission would influence the X-rayband emission. In x 5 we explore various mechanisms that mightgive rise to the X-ray flares observed in many bursts (e.g., GRB050406 and GRB 050202b) and conclude that the phenomenon isbest interpreted as due to a late central engine activity. Our con-clusions are summarized in x 6.
2. GRB TAIL EMISSION AND THE CURVATURE EFFECT
2.1. GRB Tail Emission
The temporal bridge between the GRB prompt emission andthe afterglow emission is essential for revealing whether theprompt emission and the afterglow originate from the same com-ponent. The earliest GRB relativistic shock model invoked theexternal shock as the site for prompt gamma-ray emission (Rees
Fig. 1.—Synthetic cartoon X-ray light curve based on the observational datafrom the Swift XRT. The phase ‘‘0’’ denotes the prompt emission. Four power-law light-curve segments together with a flaring component are identified in theafterglow phase. Segments I and III are most common, and they are marked withsolid lines. The other three components are only observed in a fraction of bursts,so they are marked as dashed lines. Typical temporal indices in the four seg-ments are indicated in the figure. The spectral indices remain unchanged forsegments II, III, and IV, with a typical value of �X � 1 (FX / ���X ). Segment Isometimes has a softer spectrum (e.g., �X � 1:5), but in some other cases it has asimilar spectral index as the other three segments. The flares (segment V) havesimilar spectra as segment I, and time evolution of the spectral index during theflares has been observed in some bursts (e.g., GRB 050502B).
SWIFT XRT OBSERVATIONS OF GRB AFTERGLOWS 355
&Meszaros 1992;Meszaros &Rees 1993). The rapid variabilityobserved in many GRBs is in great contrast with the intuitiveexpectations in the external shock model, which generally pre-dicts a smooth burst temporal profile, and it has been argued thatthe radiative efficiency is too low for the model so that a muchlarger energy budget is required (Sari & Piran 1997). Dermer &Mitman (1999, 2004) argued that if the GRB ambient mediumis sufficiently clumpy, an external shock GRB model could re-produce the observed variability with a high-energy efficiency.Within such a picture, the prompt emission and the aftergloworiginate from the same component (i.e., the external shock), andit is expected that the two emission components are likely smoothlyconnected in the early phase.
On the other hand, it is now commonly believed that GRBprompt emission originates from some ‘‘internal processes,’’ i.e.,the gamma rays are emitted before the fireball is decelerated bythe ambient medium. The most widely discussed model is the in-ternal shock model (Rees & Meszaros 1994; Paczynski & Xu1994; Kobayashi et al. 1997; Daigne & Mochkovitch 1998; Fanet al. 2004b). Alternatively, the internal emission may be causedby dissipation of strongmagnetic fields (e.g., Drenkhahn& Spruit2002) or Comptonization of the photospheric emission (Rees &Meszaros 2005). Within such scenarios, there exist two distincttemporal episodes dominated by the prompt emission and theafterglow, respectively, since the latter is emitted at a much largerdistance from the central engine when the fireball is decelerated.Generally one should expect a flux contrast between these twoepisodes.
Before the Swift era, no solid observation was available tofinally differentiate both scenarios, and evidence in favor of eachscenario had been collected (for a review see, e.g., Zhang &Meszaros 2004). It is one of the major tasks of Swift to pin downthe emission site of the GRB prompt emission.
If the prompt emission and the afterglow arise from differentemission sites, as is expected in the internal shock (or similar)scenario, and if the prompt emission flux level ismuch higher thanthe afterglow emission flux level, one expects to see a steeply de-caying light curve during the transition from the prompt emissionphase to the afterglow phase. Such a steep decay is due to the so-called curvature effect (e.g., Kumar & Panaitescu 2000b; Dermer2004; Dyks et al. 2005; Panaitescu et al. 2006). In principle, suchan effect also applies to the tail emission of the X-ray flares(Burrows et al. 2005a). Hereafter we generally define such anemission component as ‘‘GRB tail emission.’’
2.2. Curvature Effect
2.2.1. The Simplest Case
For a conical jet with an opening angle �j, emission from thesame radius Rcr but from different viewing latitudes � (� < �j)would reach the observer at different times. Even if the emissionis turned off instantaneously, due to the propagation effect theobserver would receive the emitted photons at the angle � at t ¼(1þ z)(Rcr/c)(�
2/2). Such a tail emission thus lasts for a durationof
ttail ¼ 1þ zð Þ Rcr=cð Þ �2j =2� �
’ 330 sð ÞRcr�
2j
1013 cm rad2
!1þ z
2
� �ð1Þ
if the line of sight is not too close to the jet edge.We consider the simplest case of a jet moving with a constant
bulk Lorentz factor � (or a constant velocity v). The electrons are
shock heated up to a radius Rcr, beyond which no fresh shockedelectrons are injected, and the already heated electrons cool rap-idly. The comoving emission frequency �0 is boosted to � ¼ D� 0
in the observer’s frame, where D ¼ ½�(1� v cos �/c)��1is the
Doppler factor, which is D � 2� for �T1/� and D � 2/(��2)for �3 1/�. Since t / �2, one gets D / t�1 for �31/�.The observed flux F� is related to the comoving surface bright-
ness L0� 0 by
F� / L0� 0D2 / � 0ð Þ��D2 / ���D2þ� / ���t�2��; ð2Þ
where � is the observed spectral index around the observed fre-quency �, and the last proportionality is valid for 1/�T� < �j.With the standard convention F� / ���t��, one has the well-known result for the curvature effect (e.g., Kumar & Panaitescu2000b; Dermer 2004; Fan & Wei 2005; Dyks et al. 2005;Panaitescu et al. 2006)
� ¼ 2þ �: ð3Þ
2.2.2. Emission from a Decelerating Fireball
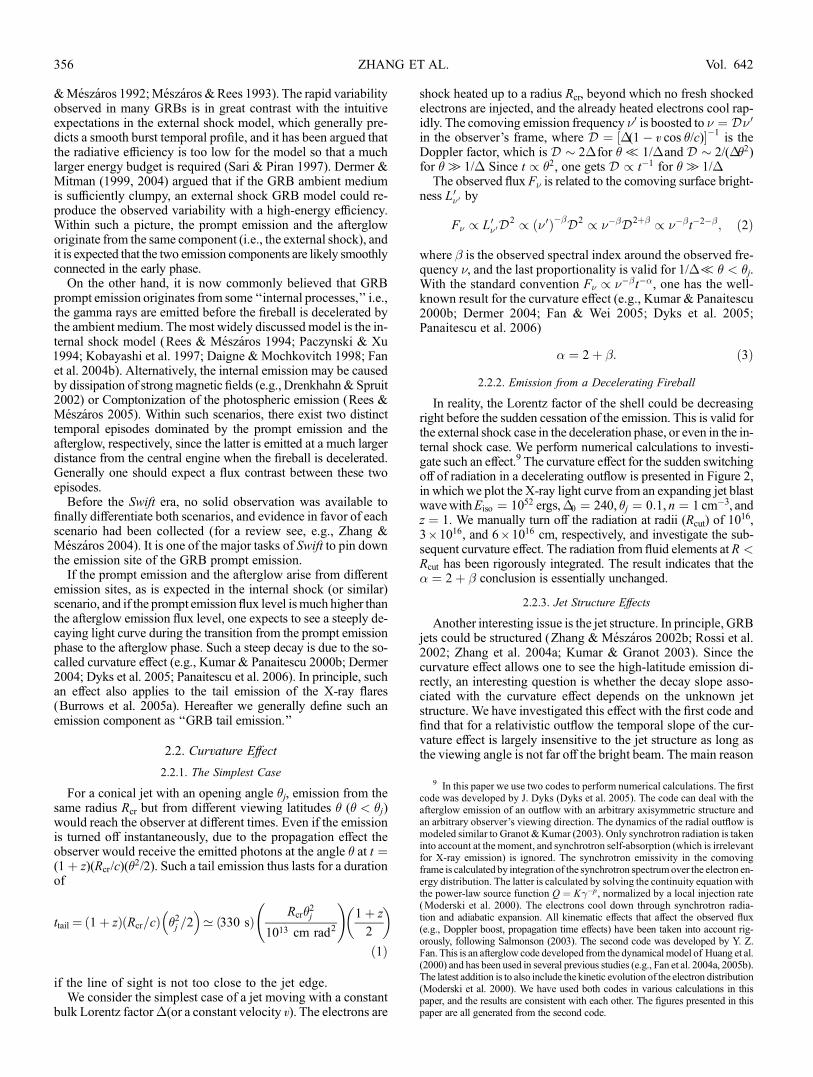
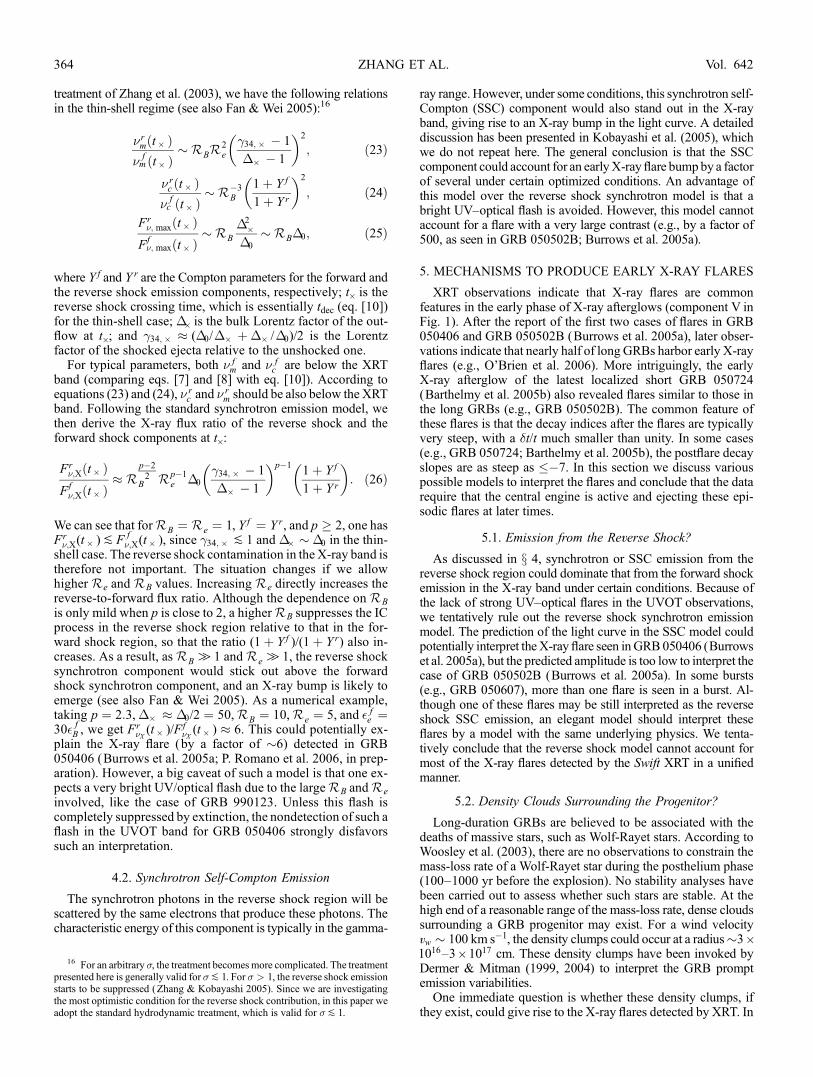
In reality, the Lorentz factor of the shell could be decreasingright before the sudden cessation of the emission. This is valid forthe external shock case in the deceleration phase, or even in the in-ternal shock case. We perform numerical calculations to investi-gate such an effect.9 The curvature effect for the sudden switchingoff of radiation in a decelerating outflow is presented in Figure 2,in which we plot the X-ray light curve from an expanding jet blastwavewithEiso ¼ 1052 ergs,�0 ¼ 240, �j ¼ 0:1, n ¼ 1 cm�3, andz ¼ 1. We manually turn off the radiation at radii (Rcut) of 10
16,3 ; 1016, and 6 ; 1016 cm, respectively, and investigate the sub-sequent curvature effect. The radiation from fluid elements at R <Rcut has been rigorously integrated. The result indicates that the� ¼ 2þ � conclusion is essentially unchanged.
2.2.3. Jet Structure Effects
Another interesting issue is the jet structure. In principle, GRBjets could be structured (Zhang & Meszaros 2002b; Rossi et al.2002; Zhang et al. 2004a; Kumar & Granot 2003). Since thecurvature effect allows one to see the high-latitude emission di-rectly, an interesting question is whether the decay slope asso-ciated with the curvature effect depends on the unknown jetstructure. We have investigated this effect with the first code andfind that for a relativistic outflow the temporal slope of the cur-vature effect is largely insensitive to the jet structure as long asthe viewing angle is not far off the bright beam. The main reason
9 In this paper we use two codes to perform numerical calculations. The firstcode was developed by J. Dyks (Dyks et al. 2005). The code can deal with theafterglow emission of an outflow with an arbitrary axisymmetric structure andan arbitrary observer’s viewing direction. The dynamics of the radial outflow ismodeled similar to Granot &Kumar (2003). Only synchrotron radiation is takeninto account at the moment, and synchrotron self-absorption (which is irrelevantfor X-ray emission) is ignored. The synchrotron emissivity in the comovingframe is calculated by integration of the synchrotron spectrumover the electron en-ergy distribution. The latter is calculated by solving the continuity equation withthe power-law source function Q ¼ K��p, normalized by a local injection rate(Moderski et al. 2000). The electrons cool down through synchrotron radia-tion and adiabatic expansion. All kinematic effects that affect the observed flux(e.g., Doppler boost, propagation time effects) have been taken into account rig-orously, following Salmonson (2003). The second code was developed by Y. Z.Fan. This is an afterglow code developed from the dynamical model of Huang et al.(2000) and has been used in several previous studies (e.g., Fan et al. 2004a, 2005b).The latest addition is to also include the kinetic evolution of the electron distribution(Moderski et al. 2000). We have used both codes in various calculations in thispaper, and the results are consistent with each other. The figures presented in thispaper are all generated from the second code.
ZHANG ET AL.356 Vol. 642
is that the decrease of flux because of the curvature effect occurson a much shorter timescale than that for the jet structure to takeeffect. For a spectral index�� ( f� / ���), the flux decreases bym orders of magnitude after a time of tcrv ¼ 10m/(2þ� )tcr, where tcris the observer time at which the curvature effect began. For atypical � � 1, the flux drops by 1 order of magnitude after a shorttime tcrv � 2tcr. A drop of 3 orders of magnitude occurs in nomore than a decade in time. On the other hand, the observer canperceive the switch-off of emissivity at an angle �measured fromthe line of sight at a time t� ’ ½1þ (��)2�tcr. One can see that thestructure of the outflowmust have a typical angular scale smallerthan 3/� in order to affect the observed flux before 10tcr. For� > 102, the parameters of the outflow would have to varystrongly on a scale smaller than 1�. Nonetheless, the effect of thejet structure would start to play a noticeable role if the line ofsight is outside the bright beam. Detailed calculations are pre-sented elsewhere (Dyks et al. 2005).
2.2.4. Factors Leading to Deviations from the � ¼ 2þ � Relation
Almost all of the Swift XRT early afterglow light curves arecategorized by a steep decay component followed by a morenormal decaying afterglow light curve (Tagliaferri et al. 2005;Nousek et al. 2006; see segment I in Fig. 1). In most of thesecases, the measured �- and �-values in this rapidly decayingcomponent are close to the � ¼ 2þ � relation but do not matchcompletely. This does not invalidate the curvature effect inter-pretation, however, since in principle the following factorswould lead to deviations from the simple � ¼ 2þ � law:
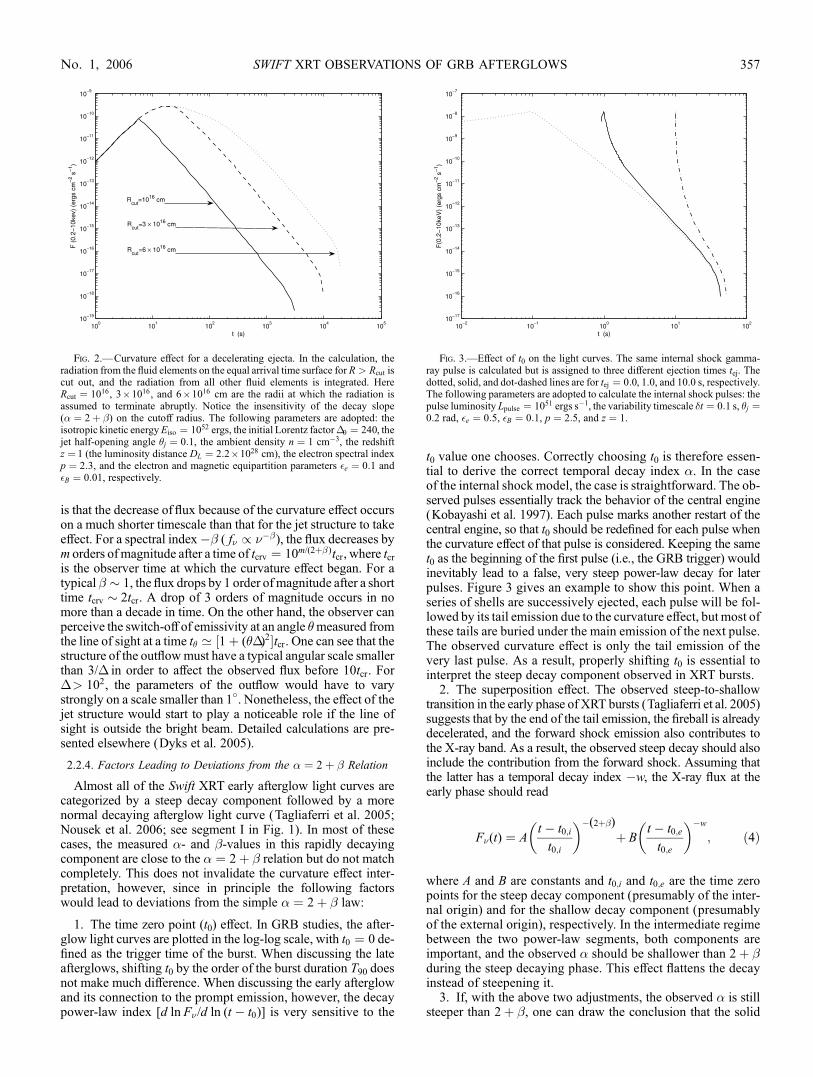
1. The time zero point (t0) effect. In GRB studies, the after-glow light curves are plotted in the log-log scale, with t0 ¼ 0 de-fined as the trigger time of the burst. When discussing the lateafterglows, shifting t0 by the order of the burst duration T90 doesnot make much difference. When discussing the early afterglowand its connection to the prompt emission, however, the decaypower-law index [d ln F� /d ln (t � t0)] is very sensitive to the
t0 value one chooses. Correctly choosing t0 is therefore essen-tial to derive the correct temporal decay index �. In the caseof the internal shock model, the case is straightforward. The ob-served pulses essentially track the behavior of the central engine(Kobayashi et al. 1997). Each pulse marks another restart of thecentral engine, so that t0 should be redefined for each pulse whenthe curvature effect of that pulse is considered. Keeping the samet0 as the beginning of the first pulse (i.e., the GRB trigger) wouldinevitably lead to a false, very steep power-law decay for laterpulses. Figure 3 gives an example to show this point. When aseries of shells are successively ejected, each pulse will be fol-lowed by its tail emission due to the curvature effect, but most ofthese tails are buried under the main emission of the next pulse.The observed curvature effect is only the tail emission of thevery last pulse. As a result, properly shifting t0 is essential tointerpret the steep decay component observed in XRT bursts.
2. The superposition effect. The observed steep-to-shallowtransition in the early phase of XRT bursts (Tagliaferri et al. 2005)suggests that by the end of the tail emission, the fireball is alreadydecelerated, and the forward shock emission also contributes tothe X-ray band. As a result, the observed steep decay should alsoinclude the contribution from the forward shock. Assuming thatthe latter has a temporal decay index �w, the X-ray flux at theearly phase should read
F�(t) ¼ At � t0;i
t0;i
� ��(2þ�)
þ Bt � t0;e
t0;e
� ��w
; ð4Þ
where A and B are constants and t0;i and t0;e are the time zeropoints for the steep decay component (presumably of the inter-nal origin) and for the shallow decay component (presumablyof the external origin), respectively. In the intermediate regimebetween the two power-law segments, both components areimportant, and the observed � should be shallower than 2þ �during the steep decaying phase. This effect flattens the decayinstead of steepening it.
3. If, with the above two adjustments, the observed � is stillsteeper than 2þ �, one can draw the conclusion that the solid
Fig. 3.—Effect of t0 on the light curves. The same internal shock gamma-ray pulse is calculated but is assigned to three different ejection times tej. Thedotted, solid, and dot-dashed lines are for tej ¼ 0:0, 1.0, and 10.0 s, respectively.The following parameters are adopted to calculate the internal shock pulses: thepulse luminosity Lpulse ¼ 1051 ergs s�1, the variability timescale �t ¼ 0:1 s, �j ¼0:2 rad, �e ¼ 0:5, �B ¼ 0:1, p ¼ 2:5, and z ¼ 1.
Fig. 2.—Curvature effect for a decelerating ejecta. In the calculation, theradiation from the fluid elements on the equal arrival time surface for R > Rcut iscut out, and the radiation from all other fluid elements is integrated. HereRcut ¼ 1016, 3 ; 1016, and 6 ; 1016 cm are the radii at which the radiation isassumed to terminate abruptly. Notice the insensitivity of the decay slope(� ¼ 2þ �) on the cutoff radius. The following parameters are adopted: theisotropic kinetic energyEiso ¼ 1052 ergs, the initial Lorentz factor�0 ¼ 240, thejet half-opening angle �j ¼ 0:1, the ambient density n ¼ 1 cm�3, the redshiftz ¼ 1 (the luminosity distance DL ¼ 2:2 ; 1028 cm), the electron spectral indexp ¼ 2:3, and the electron and magnetic equipartition parameters �e ¼ 0:1 and�B ¼ 0:01, respectively.
SWIFT XRT OBSERVATIONS OF GRB AFTERGLOWS 357No. 1, 2006
angle of the emitting region is comparable to or smaller than 1/�.This would correspond to a patchy shell (Kumar & Piran 2000b)or a minijet (Yamazaki et al. 2004). A caveat on such an inter-pretation is that the probability for the line of sight sitting right ontop of such a very narrow patch/minijet is very small. As a result,this model cannot interpret an effect that seems to be a generalproperty of X-ray afterglows.
4. If, with the first two adjustments, the observed � is flatterthan 2þ � but is still much steeper than that expected from aforward shock model, there could be two possibilities. One isthat the emission is still from the internal dissipation of energybut the emission in the observational band does not cease abruptly.This is relevant when the observational band is below the coolingfrequency. The adiabatic cooling therefore gives a decay slope of�(1þ 3�/2) rather than�(2þ �) (e.g., Sari&Piran 1999; Zhanget al. 2003). The second possibility is that one is looking at astructured jet (Zhang &Meszaros 2002b; Rossi et al. 2002), withthe line of sight significantly off-axis. The curvature effect in sucha configuration typically gives a flatter decay slope than 2þ �(Dyks et al. 2005). This is particularly relevant for X-ray–richGRBs or X-ray flashes for which a large viewing angle is usuallyexpected (Zhang et al. 2004a; Yamazaki et al. 2004). Further anal-yses of XRT data suggest that at least in some GRBs, the decayslope is shallower than 2þ � (O’Brien et al. 2006). The abovetwo possibilities are in particular relevant for these bursts.
We suggest that most of the rapid-decay light curves observedby the SwiftXRTmay be interpreted as GRB (or X-ray flare) tailemission through the curvature effect, with the first two adjust-ments discussed above. In order to test this hypothesis, after thesubmission of this paper we have performed more detailed dataanalyses on a large sample of XRT bursts (Liang et al. 2006). Byassuming that the decay slope should be 2þ �, we search theappropriate t0 that allows such an assumption to be satisfied. It isfound that t0 is usually at the beginning of the last pulse (for thesteep decay following the prompt emission) or at the beginningof the X-ray flare (for steep decay following flares). This factstrongly suggests that the curvature effect is likely to be the cor-rect interpretation and at the same time lends strong support to theinternal origin of the prompt emission and X-ray flares (see xx 2.3and 5.7 for the arguments in favor of the internal models for bothcomponents).
Another potential test of the curvature effect is to search for acorrelation between the spectral peak energy (Epk) and the flux atthe peak (Fpk; Dermer 2004). This requires a well-measured Epk
in the XRT band. In most cases, the XRT spectrum is consistentwith a single power law. More detailed analyses on future brightX-ray flares are desirable to perform such a test.
2.3. Theoretical Implications
The current Swift XRT observations of the early rapid-to-shallow decay transition of the X-ray light curves (Tagliaferri et al.2005), when interpreted as the curvature effect, have profound im-plications for the understanding of the GRB phenomenon:
1. It gives a direct observational proof that the GRB promptemission very likely comes from a different site than the after-glow emission. This suggests that the emission either comes fromthe internal shocks due to the collisions among many engine-ejected shells (Rees &Meszaros 1994; Paczynski & Xu 1994) oris due to magnetic or other dissipation processes at a radiussmaller than the fireball deceleration radius (e.g., Drenkhahn &Spruit 2002; Rees & Meszaros 2005). In both scenarios, the en-ergy dissipation region is well inside the region where the de-celeration of the whole fireball occurs.
2. An interesting fact is that in most cases, after the promptemission, the X-ray emission level (that spectrally extrapolatedfrom the BAT data) drops by several orders ofmagnitude (throughthe curvature effect, in our interpretation) before ‘‘landing’’ on theafterglow emission level. One could roughly estimate the expected‘‘drop-off.’’ The flux level in the XRT band during the promptphase could be roughly estimated as F
prompt�;X / (E�;iso/T90)
(EXRT/Ep)�þ2, where E�;iso is the isotropic energy of the emitted
gamma rays, T90 is the duration of the burst, EXRT � 5 keV is thetypical energy in the XRT band, Ep � 100 keV is the typical peakenergy in the GRB spectrum, and � � �1 is the low-energy spec-tral index for a Band spectrum (Band et al. 1993). Assuming thattheX-ray band for the afterglow emission is above both the typicalsynchrotron frequency �m and the cooling frequency �c (which isusually the case for the ISMmodel; see eqs. [7] and [8]), the X-rayafterglowflux level can be estimated as (e.g., Freedman&Waxman2001) F
ag�;X / �eEiso/t, where Eiso is the isotropic energy of the
afterglow kinetic energy and �e is the electron equipartition param-eter in the shock.10 The flux contrast can be estimated as
Fprompt�;X
Fag�;X
� E�;iso
Eiso
� �t
T90
� �(EXRT=Ep)
�þ2
�e
� �: ð5Þ
For typical parameters, one has (EXRT/Ep)�þ2 � 0:05 and �e �
0:1, so that the term in square brackets isP1. Although t > T90would generally suggest that F
prompt�;X should be higher than F
ag�;X,
the large contrast between the two components observed in manybursts is usually not accounted for unless E�;iso is (much) largerthan Eiso. This refers to a very high apparent GRB radiation effi-ciency, even higher than the one estimated using the late X-rayafterglow data (Lloyd-Ronning&Zhang 2004).11 The commonlyinvoked internal shock model predicts a low-emission efficiency(e.g., Panaitescu et al. 1999; Kumar 1999). Understanding such ahigh apparent radiation efficiency is therefore desirable (see, e.g.,Beloborodov 2000; Kobayashi & Sari 2001).3. The common steep-to-shallow transition feature indicates
that the fireball has already been decelerated at the time when theGRB tail emission fades. Otherwise, one would see an initiallyrising light curve peaking at the fireball deceleration time. Thisfact alone sets a lower limit to the initial Lorentz factor of thefireball, since the deceleration time tdec must be earlier than thetransition time tb1. The numerical expression is
�0 � 125E�;iso;52
��n
� �1=8
t�3=8b1;2
1þ z
2
� �3=8
; ð6Þ
where E�;iso is the isotropic gamma-ray energy (which is an ob-servable if the redshift z is known) and �� ¼ E�;iso/Eiso is a con-version factor between the isotropic afterglow energy Eiso andE�;iso. Throughout the paper, the convention Qx ¼ Q/10x isadopted in cgs units. Applying the method to the bursts withmeasured z (Chincarini et al. 2005), we get the lower limits of�0 for several bursts (Table 1). Given the weak dependence onthe unknown parameters [i.e., (��n)
�1/8], we conclude that thedata suggest that GRBs are highly relativistic events with typ-ical Lorentz factors higher than 100. This is an independentmethod, as compared with previous ones using the high-energy
10 When the synchrotron self-Compton process dominates the cooling, thediscussion could be more complicated.
11 This could be attributed to the shallow decay injection phase (segment IIin Fig. 1) as discussed in x 3.2. Because of the injection, the effective Eiso inthe early epochs is smaller than that in the later epochs. As a result, a largerFprompt�;X � F
ag�;X contrast is expected.
ZHANG ET AL.358 Vol. 642
spectrum (e.g., Baring &Harding 1997; Lithwick & Sari 2001),the reverse shock data (Sari & Piran 1999; Wang et al. 2000;Zhang et al. 2003), and the superluminal expansion of the radioafterglow source image (Waxman et al. 1998).
3. FORWARD SHOCK EMISSION
After the rapid fading of the GRB tail emission, usually theforward shock emission component gives the main contributionto the early X-ray afterglow light curves. The light-curve shapedepends on the density profile of the ambient medium (i.e., ISMor wind). In the ‘‘standard’’ case (i.e., adiabatic evolution withprompt injection of energy), the fireball energy is essentially con-stant during the deceleration phase. The bulk Lorentz factor � /R�3/2 for the ISM case and� / R�1/2 for the wind case.When thebulk Lorentz factor � is larger than ��1
j , where �j is the jet open-ing angle (or the viewing angle of a structured jet), the system issimply determined by the ratio of the isotropic afterglow energyEiso and the ambient density n (or the A parameter in the windmodel). Such a normal decay phase corresponds to segment III inthe synthetic light curve (Fig. 1). When � becomes smaller than��1j , the light curve steepens because of the combination of the jetedge effect and the possible sideways expansion effect (Rhoads1999; Sari et al. 1999; Panaitescu & Meszaros 1999). The bulkLorentz factor decreases exponentially with radius. This is knownas a ‘‘jet break,’’ and the postbreak segment corresponds to seg-ment IV in Figure 1.
During the early evolution of the fireball, the forward shockmay be continuously refreshed with additional energy. This couldbe because of either a continuous operation of the central engine(Dai & Lu 1998a; Zhang & Meszaros 2001; Dai 2004), or apower-law distribution of the Lorentz factors in the ejecta thatresults in slower ejecta catching up with the decelerated fireball atlater times (Rees&Meszaros 1998; Panaitescu et al. 1998;Kumar& Piran 2000a; Sari & Meszaros 2000; Zhang & Meszaros2002a), or the transferring of the Poynting flux energy to themedium when a Poynting flux–dominated flow is decelerated(e.g., Zhang & Kobayashi 2005). The canonical XRT light curve(Fig. 1) indeed shows a shallow decay phase (segment II), whichwe argue is due to continuous energy injection.
3.1. Standard Afterglow Models
For the convenience of the later discussion, we summarize thestandard early forward shock X-ray afterglow properties asfollows:
1. The ISM model (e.g., Sari et al. 1998).—The typical syn-chrotron frequency and the cooling frequency are �m ¼ (6:5 ;1014 Hz)�1/2B;�2�
2e;�1E
1/252 t
�3/23 ½(1þ z)/2�1/2 and �c¼ (2:5 ; 1016 Hz)
(1þ Y )�2��3/2B;�2E
�1/252 n�1t�1/2
3 ½(1þ z)/2��1/2, respectively, where
E is the isotropic kinetic energy of the fireball, n is the ISM den-sity, �e and �B are shock equipartition parameters for electronsand magnetic fields, respectively, Y is the energy ratio betweenthe inverse Compton component and the synchrotron component,z is the redshift, and t is the observer’s time. Both frequenciesdecrease with time. The time interval for �m and �c to cross theXRT energy band (0.5–10 keV) from above can be expressed as
tm ¼ (4 30 s)�1=3B;�2�
4=3e;�1E
1=352
1þ z
2
� �1=3
; ð7Þ
tc ¼ (0:1 40 s)(1þ Y )�4��3B;�2E
�152 n
�2 1þ z
2
� ��1
: ð8Þ
The epoch when the fireball switches from fast cooling (�c < �m)to slow cooling (�c > �m) is defined by requiring �m ¼ �c, whichreads
tmc ¼ (26 s) 1þ Yð Þ2�2B;�2�2e;�1E52n
1þ z
2
� �: ð9Þ
For comparison, the time when the fireball is decelerated (thin-shell case) is given by
tdec ¼3E
4nmpc2�20
!1=31
2�20c
¼ (180 s) E52=nð Þ1=3��8=30;2
1þ z
2
� �; ð10Þ
where �0 is the initial Lorentz factor of the fireball. We can seethat for typical parameters, the XRT band is already in theregime of �X > max (�m; �c) when deceleration starts. Also,the blast wave evolution has usually entered the slow coolingregime where the radiative losses are not important.12 Under suchconditions, the temporal index is13 �X ¼ (3p� 2)/4 � 1:15, andthe spectral index is �X ¼ p/2 � 1:1 (photon index 2.1). The rela-tion between the two indices is �X ¼ (3�X � 1)/2. In view that tcis very sensitive to �B, one can still get the regime �m < �X < �c if�B,�2 is small (say, around 0.1). In such a case,�X ¼ 3( p� 1)/4 �0:9, �X ¼ ( p� 1)/2 � 0:6, and �X ¼ (3/2)�X. The above twocases have been commonly observed in early X-ray afterglowsof many Swift bursts (e.g., segment III in Fig. 1), suggesting thatthe fireball shock model can successfully interpret the generalproperties of GRB afterglows and that most GRBs are born in aconstant-densitymedium. This conclusion is consistent with pre-vious analyses (Panaitescu & Kumar 2002; Yost et al. 2003).
2. The wind model (e.g., Chevalier & Li 2000).—The typicalsynchrotron frequency and the cooling frequency are �m ¼ (1:3 ;1015 Hz)�1/2B;�2�
2e;�1E
1/252 t
�3/23 ½(1þ z)/2�1/2 (notice that �m in the
wind case has the same parameter dependencies as the ISM casebut is larger by a factor of �2; e.g., Dai & Lu 1998b) and �c ¼(6:8 ; 1012 Hz)(1þ Y )�2��3/2
B;�2E1/252A�2� t1/23 ½(1þ z)/2��3/2, where
A� ¼ (MW /4VW )/(5 ; 1011 g cm�1) is the typical wind param-eter, MW is the mass-loss rate, and VW is the wind velocity. Adistinguishing property of the wind model is that �c increases
TABLE 1
Constraints on the Initial Lorentz Factors of Several GRBs
GRB z
tb1(s) E�;iso;52
a �0
050126...................... 1.290b �110 0.77 >120(��n)�1/8
050315...................... 1.949c �400 2.77 >100(��n)�1/8
050319...................... 3.240d �400 5.12 >120(��n)�1/8
050401...................... 2.900e �130 27.49 >220(��n)�1/8
a Chincarini et al. (2005).b Berger et al. (2005).c Kelson & Berger (2005).d Fynbo et al. (2005a).e Fynbo et al. (2005b).
12 In certain parameter regimes, the condition tdec < tmc could be satisfied,and in the temporal regime t < tmc, the blast wave is in the fast cooling (�c < �m)domain, so the radiative loss could affect the blast wave dynamics (e.g., Bottcher& Dermer 2000; Wu et al. 2005).
13 Here and below, the convention F�(X) / t��X���X is adopted since in theX-ray band both the temporal and the spectral indices are negative. Also p ¼ 2:2is adopted for typical numerical values.
SWIFT XRT OBSERVATIONS OF GRB AFTERGLOWS 359No. 1, 2006
with time. Similarly, the time interval for �m to cross the XRTband from above is
tm ¼ 6:6 49 sð Þ�1=3B;�2�4=3e;�1E
1=352
1þ z
2
� �1=3
; ð11Þ
and the time interval for �c to cross the band from below is
tc ¼ 3:1 ; 1011 1:2 ; 1014 s� �
1þ Yð Þ4�3B;�2E�152 A
4�
1þ z
2
� �3
¼ 0:3 120 sð Þ 1þ Yð Þ4�3B;�2E�152 A
4�;�3
1þ z
2
� �3
: ð12Þ
The critical time for the fast-slow cooling transition is
tmc ¼ 1:4 ; 104 s� �
1þ Yð Þ�e;�1�B;�2A�
¼ 14 sð Þ 1þ Yð Þ�e;�1�B;�2A�;�3: ð13Þ
The deceleration time is essentially the duration of the burst,i.e., tdec � T ¼ (20 s)T1:3, since for typical parameters the windmodel is the so-called thick-shell case (e.g., Chevalier & Li2000; Kobayashi & Zhang 2003b). For a typical wind param-eter A� � 1, the X-ray light curve is very simple. For t < tm, onehas �c < �X < �m, so that �X ¼ 1
4, �X ¼ 1
2, and �X ¼ (1�
�X)/2. When t > tm, during most of the observational time ofinterest, one has �X > max (�m; �c), so that�X ¼ (3p� 2)/2 �1:15, �X ¼ p/2 ¼ 1:1 (photon index 2.1), and �X ¼ (3�X�1)/2. The switching between the fast cooling and slow coolingregimes does not influence the temporal and spectral indices inthe X-ray band. Only whenA� < 0:01, i.e., tc falls into the rangeof observational interest, does a new temporal/spectral domainappear.When t > tc, one has �m < �X < �c,�X ¼ (3p� 1)/4 �1:4, �X ¼ ( p� 1)/2 � 0:6 (photon index 1.6), and�X ¼ (3�X þ1)/2. Such a feature has been used to interpret GRB 050128(Campana et al. 2005).14 If A� is not much smaller than unity,the blast wave is in the fast cooling regime, and radiative lossescould be substantial (Bottcher & Dermer 2000). A detailedanalysis has been presented in Wu et al. (2005).
3. The jet model (e.g., Rhoads 1999; Sari et al. 1999).—Afterthe jet break, the temporal decay index is predicted to be�X ¼ p.This is derived by assuming significant sideways expansion.This result is independent of whether the X-ray band is below orabove �c andwhether themedium is an ISMor a stellar wind. Forthe latter, the timescale for the light curve to achieve the as-ymptotic �p index is typically longer than that in the ISM case(e.g., Kumar & Panaitescu 2000a; Gou et al. 2001).
All of the above discussions apply for the case of p > 2. Forp < 2, the case could be different. Dai & Cheng (2001) proposedone scenario to deal with the case of p < 2, while Panaitescu &Kumar (2002) extended the treatment of the p > 2 case to thep < 2 regime.
3.2. Refreshed Shock Models
If there is significant continuous energy injection into thefireball during the deceleration phase, the forward shock keepsbeing ‘‘refreshed,’’ so that it decelerates less rapidly than in thestandard case. The bulk Lorentz factor of the fireball decays moreslowly than � / R�3/2 (� / R�1/2) for the ISM (wind) case.
There are three possible physical origins for the refreshedshocks:
1. The central engine itself is longer lasting, e.g., behaving as
L tð Þ ¼ L0 t=tbð Þ�q: ð14Þ
The dynamical evolution and the radiation signature of such asystem have been discussed in detail in Zhang & Meszaros(2001). A specific model for such an injection case, i.e., theenergy injection from the initial spin-down from a millisecondpulsar (preferably a millisecond magnetar), was discussed inthat paper and earlier in Dai & Lu (1998a). In such a specificmodel, q ¼ 0 is required according to the spin-down law. Alter-natively, the continued engine activity could be due to continuedinfall onto a central black hole, resulting in the time dependenceequation (14).15 In general, for an adiabatic fireball, the injectionwould modify the blast wave dynamics as long as q < 1 (Zhang& Meszaros 2001). The energy in the fireball increases with timeas Eiso / t1�q, so that
� / R� 2þqð Þ=2 2�qð Þ / t� 2þqð Þ=8; R / t 2�qð Þ=4; ð15Þ� / R�q=2 2�qð Þ / t�q=4; R / t 2�qð Þ=2; ð16Þ
for the ISM and wind models, respectively. It is then straight-forward to work out the temporal indices for various temporalregimes.The ISM model.—The typical synchrotron frequency �m /
�2�eB / �4 / t�(2þq)/2, the synchrotron cooling frequency�c / ��1B�3t�2 / ��4t�2 / t(q�2)/2, and the peak flux densityF�;max / NeB� / t1�q, where B / � is the comoving magneticfield strength, �e / � is the typical electron Lorentz factor in theshocked region, and Ne / R3 is the total number of the emittingelectrons. The temporal indices � for various spectral regimesand their relationships with the spectral indices �(�) are listed inTable 2.The wind model.—In the wind case, the ambient density is
n / R�2, where R is the radial distance of the shock front to thecentral source. The typical synchrotron frequency �m / �2�eB /�3B / t�(2þq)=2, the synchrotron cooling frequency �c / ��1
B�3t�2 / ��4t�2 / t (2�q)/2, and the peak flux density F�;max /NeB� / �2 / t�q/2, where B / �R�1 is the comovingmagneticfield strength andNe / R is the total number of emitting electrons.The temporal indices � for various spectral regimes and theirrelationships with the spectral indices �(�) are listed in Table 2.In order for the central engine to continuously feed the blast
wave, the Lorentz factor of the continuous flow must be (much)larger than that of the blast wave. It could be a Poynting flux–dominated flow. This is not difficult to satisfy since the blastwave keeps decelerating. There could be a reverse shock prop-agating into the continuous ejecta, but the radiation signature ofthe reverse shock is typically not in the X-ray band (e.g., Zhang& Meszaros 2001).2. The central engine activity may be brief (e.g., as brief as the
prompt emission itself ), but at the end of the prompt phase, theejecta has a range of Lorentz factors, e.g., the amount of ejectedmass moving with Lorentz factors greater than � is (Rees &Meszaros 1998; Panaitescu et al. 1998; Sari & Meszaros 2000)
M (>�) / ��s: ð17Þ14 As discussed in x 3.2, after collecting more data, we now believe that the
shallow-to-normal decay observed in GRB 050128 is more likely due to thetransition from the energy injection phase to the standard phase (without injection).
15 The black hole torus system typically hasq ¼ 5=3 at later times (MacFadyenet al. 2001; Janiuk et al. 2004), which has no effect on the blast wave evolution.
ZHANG ET AL.360 Vol. 642
The total energy in the fireball increases as Eiso / �1�s /�1�s, so that
� / R�3= 1þsð Þ / t�3= 7þsð Þ; R / t 1þsð Þ= 7þsð Þ; ð18Þ� / R�1= 1þsð Þ / t�1= 3þsð Þ; R / t 1þsð Þ= 3þsð Þ; ð19Þ
for the ISM and wind models, respectively. One can then workout the temporal decay indices in various spectral regimes (e.g.,Rees & Meszaros 1998; Sari & Meszaros 2000). Alternatively,for each s-value, one can find an effective q-value that mimicsthe s effect, or vice versa. This gives
s ¼ 10� 7q
2þ q; q ¼ 10� 2s
7þ s; ð20Þ
s ¼ 4� 3q
q; q ¼ 4
3þ s; ð21Þ
for the ISM and wind models, respectively. In Table 2, the ex-plicit s dependencies are not listed, but they could be inferredfrom equations (20) and (21).
In this second scenario, the central engine need not last long.All of the material could be ejected promptly. The continuousinjection is due to the different velocities of the ejecta. Initially asthe blast wave moves with high speed, the slower ejecta lag be-hind and have no effect on the blast wave evolution. They laterprogressively pile up onto the blast wave as the latter decelerates.Only when s > 1 does one expect a change in the fireball dy-namics. This corresponds to q < 1. For q ¼ 0:5, one gets s ¼2:6 for the ISM case and s ¼ 5 for the wind case.
3. The energy injection is also brief, but the outflow has a sig-nificant fraction of Poynting flux (e.g., Usov 1992; Thompson1994; Meszaros & Rees 1997b; Lyutikov & Blandford 2003). As-signing a parameter for the outflow, which is the ratio betweenthe Poynting flux and baryonic kinetic energy flux, Zhang &Kobayashi (2005) modeled the reverse shock emission fromejecta with an arbitrary -value. They found that during the cross-ing of the reverse shock, the Poynting energy is not transferred tothe ambient medium. The Poynting energy (roughly by a factor of) is expected to be transferred to the medium (and hence, to theafterglow emission) after the reverse shock disappears. Zhang &Kobayashi (2005) suggest that the transfer is delayed with respect
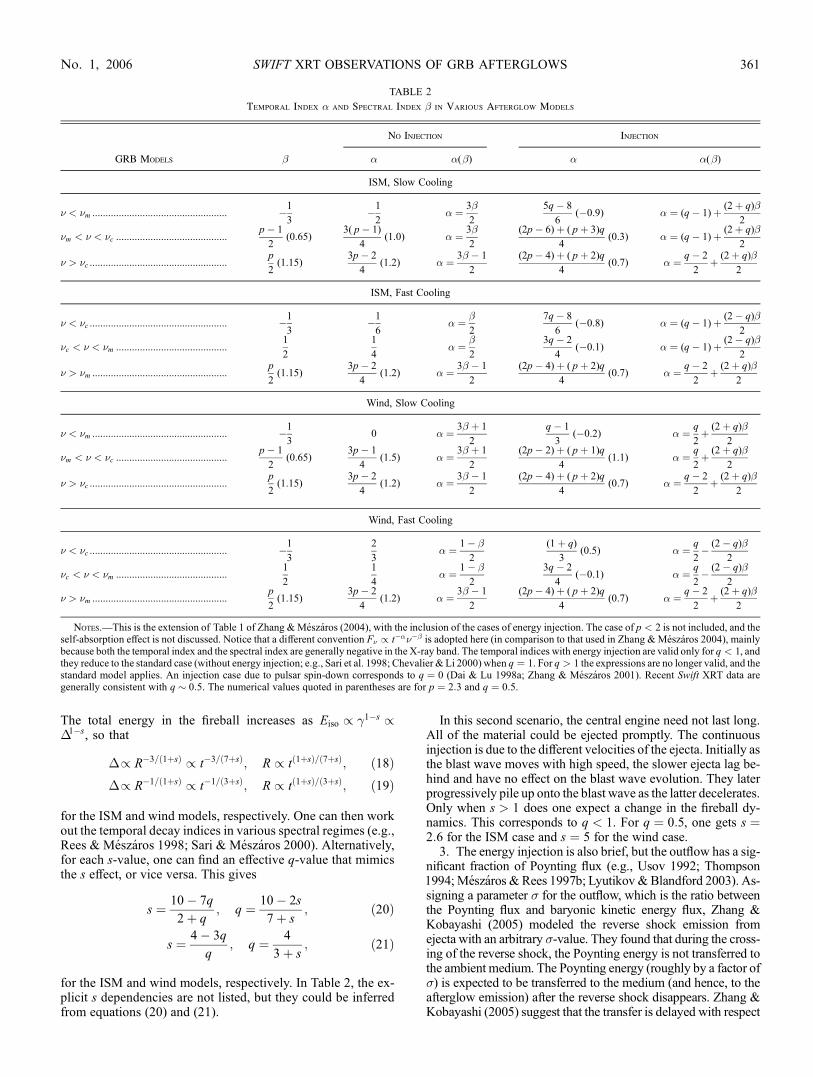
TABLE 2
Temporal Index � and Spectral Index � in Various Afterglow Models
No Injection Injection
GRB Models � � �(�) � �(�)
ISM, Slow Cooling
� < �m ................................................... �1
3�1
2� ¼ 3�
2
5q� 8
6(�0.9) � ¼ (q� 1)þ (2þ q)�
2
�m < � < �c ..........................................p� 1
2(0.65)
3( p� 1)
4(1.0) � ¼ 3�
2
(2p� 6)þ ( pþ 3)q
4(0.3) � ¼ (q� 1)þ (2þ q)�
2
� > �c ....................................................p
2(1.15)
3p� 2
4(1.2) � ¼ 3� � 1
2
(2p� 4)þ ( pþ 2)q
4(0.7) � ¼ q� 2
2þ (2þ q)�
2
ISM, Fast Cooling
� < �c .................................................... �1
3�1
6� ¼ �
2
7q� 8
6(�0.8) � ¼ (q� 1)þ (2� q)�
2
�c < � < �m ..........................................1
2
1
4� ¼ �
2
3q� 2
4(�0.1) � ¼ (q� 1)þ (2� q)�
2
� > �m ...................................................p
2(1.15)
3p� 2
4(1.2) � ¼ 3� � 1
2
(2p� 4)þ ( pþ 2)q
4(0.7) � ¼ q� 2
2þ (2þ q)�
2
Wind, Slow Cooling
� < �m ................................................... �1
30 � ¼ 3� þ 1
2
q� 1
3(�0.2) � ¼ q
2þ (2þ q)�
2
�m < � < �c ..........................................p� 1
2(0.65)
3p� 1
4(1.5) � ¼ 3� þ 1
2
(2p� 2)þ ( pþ 1)q
4(1.1) � ¼ q
2þ (2þ q)�
2
� > �c ....................................................p
2(1.15)
3p� 2
4(1.2) � ¼ 3� � 1
2
(2p� 4)þ ( pþ 2)q
4(0.7) � ¼ q� 2
2þ (2þ q)�
2
Wind, Fast Cooling
� < �c .................................................... �1
3
2
3� ¼ 1� �
2
(1þ q)
3(0.5) � ¼ q
2� (2� q)�
2
�c < � < �m ..........................................1
2
1
4� ¼ 1� �
2
3q� 2
4(�0.1) � ¼ q
2� (2� q)�
2
� > �m ...................................................p
2(1.15)
3p� 2
4(1.2) � ¼ 3� � 1
2
(2p� 4)þ ( pþ 2)q
4(0.7) � ¼ q� 2
2þ (2þ q)�
2
Notes.—This is the extension of Table 1 of Zhang &Meszaros (2004), with the inclusion of the cases of energy injection. The case of p < 2 is not included, and theself-absorption effect is not discussed. Notice that a different convention F� / t����� is adopted here (in comparison to that used in Zhang &Meszaros 2004), mainlybecause both the temporal index and the spectral index are generally negative in the X-ray band. The temporal indices with energy injection are valid only for q < 1, andthey reduce to the standard case (without energy injection; e.g., Sari et al. 1998; Chevalier & Li 2000) when q ¼ 1. For q > 1 the expressions are no longer valid, and thestandard model applies. An injection case due to pulsar spin-down corresponds to q ¼ 0 (Dai & Lu 1998a; Zhang & Meszaros 2001). Recent Swift XRT data aregenerally consistent with q � 0:5. The numerical values quoted in parentheses are for p ¼ 2:3 and q ¼ 0:5.
SWIFT XRT OBSERVATIONS OF GRB AFTERGLOWS 361No. 1, 2006
to the traditional case of ¼ 0. The energy transfer process, how-ever, is poorly studied so that one does not have a handy conver-sion relation with the q-value derived in the first scenario.
3.3. Case Studies
In this subsection we discuss several Swift GRBs with well-monitored early afterglow data detected by XRT. The notationsfor the break times and the temporal slopes are per those markedin Figure 1.
GRB 050128 (Campana et al. 2005).—The light curve can befitted by a broken power law with the break time at tb2 ¼1472þ300
�290 s. The temporal decay indices before and after the breakare�2 ¼ 0:27þ0:12
�0:10 and�3 ¼ 1:30þ0:13�0:18, respectively. The spectral
indices before and after the break are essentially unchanged, i.e.,�2 � 0:59 � 0:08 and �3 ¼ 0:79 � 0:11. Campana et al. (2005)discussed two interpretations.A jet model requires a very flat elec-tron spectral index, i.e., p � 1:3, aswell as a change of the spectraldomain before and after the jet break. Alternatively, the data maybe accommodated in a wind model, but one has to assume threeswitches of the spectral regimes during the observational gap from400 to about 4000 s. So neither explanation is completely satisfac-tory. By comparing the predicted indices in Table 2, the observa-tion may be well interpreted within the ISM model with an initialcontinuous energy injection episode. The segment after the breakis consistent with a standard ISM model for �m < �X < �c, withp � 2:6. The light curve before the break, on the other hand, isconsistentwith an injectionmodelwith p � 2:2 and q � 0:5 in thesame spectral regime. The break time is naturally related to thecessation of the injection process, and a slight change of electronspectral index (from 2.2 to 2.6) is required. From the beginning ofthe observation (100 s) to tb2, the total energy is increased by afactor of (1472/100)(1�0:5) � 3:8.
GRB 050315 (Vaughan et al. 2006).—After a steep decay(�1 ¼ 5:2þ0:5
�0:4) up to tb1 ¼ 308 s, the light curve shows a flat‘‘plateau’’ with a temporal index of �2 ¼ 0:06þ0:08
�0:13. It then turnsto �3 ¼ 0:71 � 0:04 at tb2 ¼ 1:2þ0:5
�0:3 ; 104 s. Finally, there is a
third break at tb3 ¼ 2:5þ1:1�0:3 ; 10
5 s, after which the temporal de-cay index is �4 ¼ 2:0þ1:7
�0:3. So this burst displays all four seg-
ments presented in Figure 1. The spectral indices in segments II,III, and IVare essentially constant, i.e., �2 ¼ 0:73 � 0:11, �3 ¼0:79 � 0:13, and �4 ¼ 0:7þ0:5
�0:3, respectively. Segment III is con-sistent with an ISM model with �X > �c and p ¼ 1:6, since inthis model � ¼ p/2 ¼ 0:8, � ¼ (3p� 2)/4 ¼ 0:7, in perfectagreement with the data. The third temporal break tb3 is consis-tent with a jet break. According to Dai & Cheng (2001), the post-break temporal index for p < 2 is � ¼ ( pþ 6)/4 ¼ 1:9, which isalso consistent with the observed �4. The plateau between tb1 andtb2 is then due to an energy injection in the same ISM model(�X > �c), with p � 1:5 and q � 0:35. The total injected energy isincreased by a factor of (12;000/308)(1�0:35) � 11.
GRB 050319 (Cusumano et al. 2006).—After a steep decay(�1 ¼ 5:53 � 0:67) up to tb1 ¼ 384 � 22 s, the light curveshows a shallow decay with a temporal index of �2 ¼ 0:54 �0:04. It steepens to �3 ¼ 1:14 � 0:2 at tb2 ¼ (2:60 � 0:70) ;104 s. The spectral indices in segments II and III are �2 ¼0:69 � 0:06 and �3 ¼ 0:8 � 0:08, respectively. Again segmentIII is well consistent with an ISM model for �m < �X < �c withp ¼ 2:6, which gives � ¼ ( p� 1)/2 ¼ 0:8 and � ¼ (3/2)� ¼1:2, in excellent agreement with the data. Interpreting segment II(the shallow decay phase) as the energy injection phase, for thesame ISMmodel (�m < �X < �c), one gets p � 2:4 and q � 0:6.The total injected energy is increased by a factor of (26;000/384)
(1�0:6) � 5:4. The UVOT observations are also consistentwith such a picture (Mason et al. 2006).
GRB 050401 (De Pasquale et al. 2006).—The early X-raylight curve is consistent with a broken power law, with �2 ¼0:63 � 0:02, �3 ¼ 1:41 � 0:1, and tb2 ¼ 4480þ520
�440 s. The spec-tral indices before and after the break are all consistent with �2 ��3 ¼ 0:90 � 0:03. The �-� relation does not fit into a simplep < 2 jet model. On the other hand, the energy injection modelgives a natural interpretation. After the break, the light curve isconsistent with an ISM model for �m < �X < �c with p ¼ 2:8.Before the break, it is consistent with the same model with q ¼0:5. The total injected energy is increased by a factor of >(4480/200)
(1�0:5) � 4:7.The injection signature is also inferred in other bursts such as
GRB 050117 (Hill et al. 2006) and XRF 050416 (Sakamoto et al.2006), where similar conclusions could be drawn. The injectionmodel is supported by an independent study of Panaitescu et al.(2006).
3.4. Theoretical Implications
The following conclusions could be drawn from the abovecase studies:
1. A common feature of the early X-ray afterglow light curvesis a well-defined temporal steepening break. A crucial observa-tional fact is that there is essentially no spectral variation beforeand after the break. This suggests that the break is of hydrody-namic origin rather than due to the crossing of some typical fre-quencies of the synchrotron spectrum in the band. It is worthmentioning that a light-curve transition similar to the transitionbetween segments II and III is expected in a radiative fireball (e.g.,Bottcher & Dermer 2000; see, e.g., Figs. 1 and 2 of Wu et al.2005). However, that transition is due to the crossing of �m in theobservational band. One therefore expects a large spectral varia-tion before and after the break, which is inconsistent with the data.Another straightforward interpretation would be a jet break, butthere are three reasons against such an interpretation. First, in all ofthe cases, p < 2 has to be assumed. This is in stark contrast to thelate jet breaks observed in the optical band, which typically havep > 2. Furthermore, the �-� relation predicted in the jet model isusually not satisfied. Second, the postbreak�-� relation is usuallysatisfied in a standard slow cooling ISM model, with the X-rayband either below or above the cooling frequency. In such a sense,this segment is quite normal. Third, in some cases (e.g., GRB050315), another steepening break is observed after this normalsegment, which is consistent with the jet break interpretation.Since only one break could be attributed to a jet break, the‘‘shallow-to-normal’’ break must be due to something else.2. A natural interpretation of the shallow decay phase is to
attribute it to a continuous energy injection, so that the forwardshock is ‘‘refreshed.’’ Three possibilities exist to account for therefreshed shock effect (x 3.2): a long-lived central engine withprogressively reduced activities, an instantaneous injection witha steep power-law distribution of the shell Lorentz factors, andthe deceleration of an instantaneously injected highly magne-tized (high ) flow. In terms of afterglow properties, these pos-sibilities are degenerate (e.g., the connection between q and s)and cannot be differentiated. In principle, the first scenario maygive rise to additional observational signatures (e.g., Rees &Meszaros 2000; Gao & Wei 2004, 2005), which may be used todifferentiate the model from the others.3. Two interesting characteristics during the injection phase
are that the injection process is rather smooth and that the ef-fective q-value is around 0.5. This gives interesting constraintson the possible physical mechanisms. (1) For the scenario of acontinuously injecting central engine (Zhang & Meszaros 2001),
ZHANG ET AL.362 Vol. 642
the central engine luminosity must vary with time smoothly. Thisis in contrast to the conventional GRB central engine that injectsenergy erratically to allow the observed rapid variability in thelight curves. This usually requires two different energy compo-nents, i.e., one ‘‘hot’’ fireball component that leads to the promptemission and a ‘‘cold’’ Poynting flux component that gives to thesmooth injection. A natural Poynting flux component is due to thespin-down of a newborn millisecond pulsar (Dai & Lu 1998a;Zhang &Meszaros 2001). However, a straightforward predictionfrom such a model is q ¼ 0, not consistent with q � 0:5 inferredfrom the observations. Modifications to the simplest model areneeded. Alternatively, the system may be a long-lived black holetorus system with a reducing accretion rate. However, at latertimes the long-term central engine power corresponds to q ¼ 5/3(MacFadyen et al. 2001; Janiuk et al. 2004), too steep to give aninteresting injection signature. It is worth mentioning that in thecollapsar simulations (MacFadyen et al. 2001), an extended flatinjection episode sometimes lasts for �1000 s, which could po-tentially interpret the short injection phase of some bursts, but it isdifficult to account for some other bursts whose injection phase ismuch longer. (2) For the scenario of a power-law distribution ofLorentz factors (Rees & Meszaros 1998), one should require thata smooth distribution of Lorentz factors is produced after the in-ternal shock phase. In the internal shock model, slow shells areindeed expected to follow the fast shells, but they tend to be dis-crete and give rise to bumpy light curves (e.g., Kumar & Piran2000b) especially when the contribution from the reverse shockis taken into account (Zhang & Meszaros 2002a). It is also un-clear how an effective q � 0:5 is expected. (3) Deceleration of apromptly ejected Poynting flux–dominated flow (e.g., Zhang &Kobayashi 2005) naturally gives a smooth injection signatureobserved. Above case studies indicate that the injected energy isby a factor of several to 10.Within such a picture, the unknown -value is about several to 10. However, it is unclear how long thedelay would be and whether one can account for the shallowdecay with q � 0:5 extending for 104 s. More detailed theoreticalmodeling is needed to test this hypothesis.
4. Any model needs to interpret the sudden cessation of theinjection at tb2. This time has different meanings within the threescenarios discussed above. (1) Within the long-lived central en-gine model, this is simply the epoch when the injection processceases. In the pulsar injection model, there is a well-defined timefor injection to become insignificant (Dai & Lu 1998a; Zhang &Meszaros 2001), but within a black hole torus injection model,such a time is not straightforwardly defined. (2) In the varyingLorentz factor scenario, this time corresponds to a cutoff of theLorentz factor distribution at the low end below which the dis-tribution index s is flatter than 1 so that they are energeticallyunimportant. This lowest Lorentz factor is defined by
�m ¼ 23Eiso;52
n
� �1=8
t�3=8b2;4
1þ z
2
� �3=8
: ð22Þ
A successful model must be able to address a well-defined �m inthis model. (3) Within the Poynting flux injection model, a well-defined time cutoff is expected, which corresponds to the epochwhen all of the Poynting energy is transferred to the blast wave. Ifthe shallow decay is indeed due to Poynting energy transfer, thecutoff time (tb2) could be roughly defined by the parameterthrough � (tb2/tdec)
(1�q), where tdec is the conventional decel-eration time defined by Eiso/(1þ ), when only a fraction of(1 þ )�1 energy is transferred to the ISM (Zhang&Kobayashi2005).
5. Althoughwe have not tried hard to rule out a windmodel in-terpretation, the case studies discussed above suggest that the earlyafterglow data are consistent with an ISMmodel for essentially allof the bursts. This conclusion also applies to other well-studiedSwift bursts (e.g., GRB 050525a; Blustin et al. 2006). This result isintriguing given that long GRBs are associated with the death ofmassive stars, from which a strong wind is expected. Previousanalyses using late-time afterglow data (e.g., Panaitescu & Kumar2002; Yost et al. 2003) have also suggested that most afterglowdata are consistent with an ISMmodel rather than a windmodel. Inorder to accommodate the data, it has been suggested that the windparameter may be small so that at a late enough time the blast waveis already propagating in an ISM (e.g., Chevalier et al. 2004). TheSwift results push the ISMmodel to even earlier epochs (essentiallyright after the deceleration) and indicate the need for a reinvestiga-tion of the problem. The epoch shortly before the deaths ofmassivestars is not well studied (Woosley et al. 2003). One possibility isthat the stellar wind ceases some time before the star collapses.Careful analyses of early afterglows of a large sample of longGRBs may shed light on the final stage of massive star evolution.
4. REVERSE SHOCK EMISSION
4.1. Synchrotron Emission
It is generally believed that a short-lived reverse shock existsduring the intial deceleration of the fireball and gives interestingemission signatures in the early afterglow phase. Given the sameinternal energy in both the forward-shocked and the reverse-shocked regions, the typical synchrotron frequency for the re-verse shock emission is typically much lower than that in theforward shock region, since the ejecta is much denser than themedium.While the early forward shock synchrotron emission peaksin X-rays at early times, the reverse shock synchrotron emissionusually peaks in the optical/IR band or even lower (e.g.,Meszaros& Rees 1997a; Sari & Piran 1999; Kobayashi 2000; Zhang et al.2003; Zhang&Kobayashi 2005). This model has been successfulin interpreting the early optical emission from GRB 990123(Akerlof et al. 1999; Sari & Piran 1999; Meszaros & Rees 1999),GRB 021211 (Fox et al. 2003; Li et al. 2003a; Wei 2003), andGRB 041219a (Blake et al. 2005; Vestrand et al. 2005; Fan et al.2005c). As a result, it is expected that the reverse shock compo-nent has a negligible contribution in the X-ray band.
In the above argument, it has been assumed that the shock pa-rameters (�e, �B, and p) are the same in both shocks. In reality thismight not be the case. In particular, the GRB outflow may itselfcarry a dynamically important magnetic field component (orPoynting flux). This magnetic field would be shock compressedand amplified, giving a larger effective �B (Fan et al. 2004a,2004b; Zhang & Kobayashi 2005). Since the medium is gen-erally not magnetized, it is natural to expect different �B values inboth regions, and a parameterRB � (�B; r/�B; f )
2 has been used inthe reverse shock analysis. It has been found that RB is indeedlarger than unity for GRB 990123 and GRB 021211 (Zhang et al.2003; Fan et al. 2002; Kumar & Panaitescu 2003; Panaitescu &Kumar 2004; McMahon et al. 2004). Hereafter the subscripts/superscripts ‘‘f ’’ and ‘‘r’’ represent the forward shock and thereverse shock, respectively. According to Zhang & Kobayashi(2005), the case of GRB 990123 corresponds to the most opti-mized case with � 1, so that RB is the largest.
More generally, �e and p may also vary in both shocks. Fanet al. (2002) performed a detailed fit to the GRB 990123 dataand obtained �re ¼ 4:7� fe and � rB ¼ 400� f
B . A general treatmenttherefore requires that we introduce one more parameter, i.e.,Re¼½( pr�2)/( pr�1)�/½( p f �2)/( p f �1)�(�re/� fe ). Following the
SWIFT XRT OBSERVATIONS OF GRB AFTERGLOWS 363No. 1, 2006
treatment of Zhang et al. (2003), we have the following relationsin the thin-shell regime (see also Fan & Wei 2005):16
� rm t ;ð Þ
� fm t ;ð Þ
� RBR2e
�34; ; � 1
� ; � 1
� �2
; ð23Þ
� rc t ;ð Þ
� fc t ;ð Þ
�R�3B
1þ Y f
1þ Y r
� �2
; ð24Þ
Fr�; max t ;ð Þ
Ff�; max t ;ð Þ
�RB
�2;
�0
�RB�0; ð25Þ
where Y f and Y r are the Compton parameters for the forward andthe reverse shock emission components, respectively; t; is thereverse shock crossing time, which is essentially tdec (eq. [10])for the thin-shell case; �; is the bulk Lorentz factor of the out-flow at t;; and �34; ; (�0/� ; þ � ; /�0)/2 is the Lorentzfactor of the shocked ejecta relative to the unshocked one.
For typical parameters, both � fm and � f
c are below the XRTband (comparing eqs. [7] and [8] with eq. [10]). According toequations (23) and (24), � r
c and �rm should be also below the XRT
band. Following the standard synchrotron emission model, wethen derive the X-ray flux ratio of the reverse shock and theforward shock components at t;:
Fr�;X t ;ð Þ
Ff�;X t ;ð Þ
Rp�22
B Rp�1e �0
�34; ; � 1
� ; � 1
� �p�11þ Y f
1þ Y r
� �: ð26Þ
We can see that forRB ¼ Re ¼ 1, Y f ¼ Y r, and p � 2, one hasFr�;X(t ; )P F
f�;X(t ; ), since �34; ; P 1 and � ; � �0 in the thin-
shell case. The reverse shock contamination in the X-ray band istherefore not important. The situation changes if we allowhigher Re and RB values. Increasing Re directly increases thereverse-to-forward flux ratio. Although the dependence on RB
is only mild when p is close to 2, a higherRB suppresses the ICprocess in the reverse shock region relative to that in the for-ward shock region, so that the ratio (1þ Y f )/(1þ Y r) also in-creases. As a result, asRB 31 andRe 31, the reverse shocksynchrotron component would stick out above the forwardshock synchrotron component, and an X-ray bump is likely toemerge (see also Fan & Wei 2005). As a numerical example,taking p ¼ 2:3, � ; �0/2 ¼ 50,RB ¼ 10,Re ¼ 5, and � f
e ¼30� f
B , we get Fr�X(t ; )/F
f�X(t ; ) 6. This could potentially ex-
plain the X-ray flare (by a factor of �6) detected in GRB050406 (Burrows et al. 2005a; P. Romano et al. 2006, in prep-aration). However, a big caveat of such a model is that one ex-pects a very bright UV/optical flash due to the largeRB andRe
involved, like the case of GRB 990123. Unless this flash iscompletely suppressed by extinction, the nondetection of such aflash in the UVOT band for GRB 050406 strongly disfavorssuch an interpretation.
4.2. Synchrotron Self-Compton Emission
The synchrotron photons in the reverse shock region will bescattered by the same electrons that produce these photons. Thecharacteristic energy of this component is typically in the gamma-
ray range. However, under some conditions, this synchrotron self-Compton (SSC) component would also stand out in the X-rayband, giving rise to an X-ray bump in the light curve. A detaileddiscussion has been presented in Kobayashi et al. (2005), whichwe do not repeat here. The general conclusion is that the SSCcomponent could account for an earlyX-ray flare bumpby a factorof several under certain optimized conditions. An advantage ofthis model over the reverse shock synchrotron model is that abright UV–optical flash is avoided. However, this model cannotaccount for a flare with a very large contrast (e.g., by a factor of500, as seen in GRB 050502B; Burrows et al. 2005a).
5. MECHANISMS TO PRODUCE EARLY X-RAY FLARES
XRT observations indicate that X-ray flares are commonfeatures in the early phase of X-ray afterglows (component V inFig. 1). After the report of the first two cases of flares in GRB050406 and GRB 050502B (Burrows et al. 2005a), later obser-vations indicate that nearly half of long GRBs harbor early X-rayflares (e.g., O’Brien et al. 2006). More intriguingly, the earlyX-ray afterglow of the latest localized short GRB 050724(Barthelmy et al. 2005b) also revealed flares similar to those inthe long GRBs (e.g., GRB 050502B). The common feature ofthese flares is that the decay indices after the flares are typicallyvery steep, with a �t/t much smaller than unity. In some cases(e.g., GRB 050724; Barthelmy et al. 2005b), the postflare decayslopes are as steep as �7. In this section we discuss variouspossible models to interpret the flares and conclude that the datarequire that the central engine is active and ejecting these epi-sodic flares at later times.
5.1. Emission from the Reverse Shock?
As discussed in x 4, synchrotron or SSC emission from thereverse shock region could dominate that from the forward shockemission in the X-ray band under certain conditions. Because ofthe lack of strong UV–optical flares in the UVOT observations,we tentatively rule out the reverse shock synchrotron emissionmodel. The prediction of the light curve in the SSC model couldpotentially interpret the X-ray flare seen inGRB050406 (Burrowset al. 2005a), but the predicted amplitude is too low to interpret thecase of GRB 050502B (Burrows et al. 2005a). In some bursts(e.g., GRB 050607), more than one flare is seen in a burst. Al-though one of these flares may be still interpreted as the reverseshock SSC emission, an elegant model should interpret theseflares by a model with the same underlying physics. We tenta-tively conclude that the reverse shock model cannot account formost of the X-ray flares detected by the Swift XRT in a unifiedmanner.
5.2. Density Clouds Surrounding the Progenitor?
Long-duration GRBs are believed to be associated with thedeaths of massive stars, such as Wolf-Rayet stars. According toWoosley et al. (2003), there are no observations to constrain themass-loss rate of a Wolf-Rayet star during the posthelium phase(100–1000 yr before the explosion). No stability analyses havebeen carried out to assess whether such stars are stable. At thehigh end of a reasonable range of the mass-loss rate, dense cloudssurrounding a GRB progenitor may exist. For a wind velocityvw � 100 km s�1, the density clumps could occur at a radius�3 ;1016–3 ; 1017 cm. These density clumps have been invoked byDermer & Mitman (1999, 2004) to interpret the GRB promptemission variabilities.One immediate question is whether these density clumps, if
they exist, could give rise to the X-ray flares detected by XRT. In
16 For an arbitrary , the treatment becomesmore complicated. The treatmentpresented here is generally valid for P 1. For > 1, the reverse shock emissionstarts to be suppressed (Zhang & Kobayashi 2005). Since we are investigatingthe most optimistic condition for the reverse shock contribution, in this paper weadopt the standard hydrodynamic treatment, which is valid for P 1.
ZHANG ET AL.364 Vol. 642
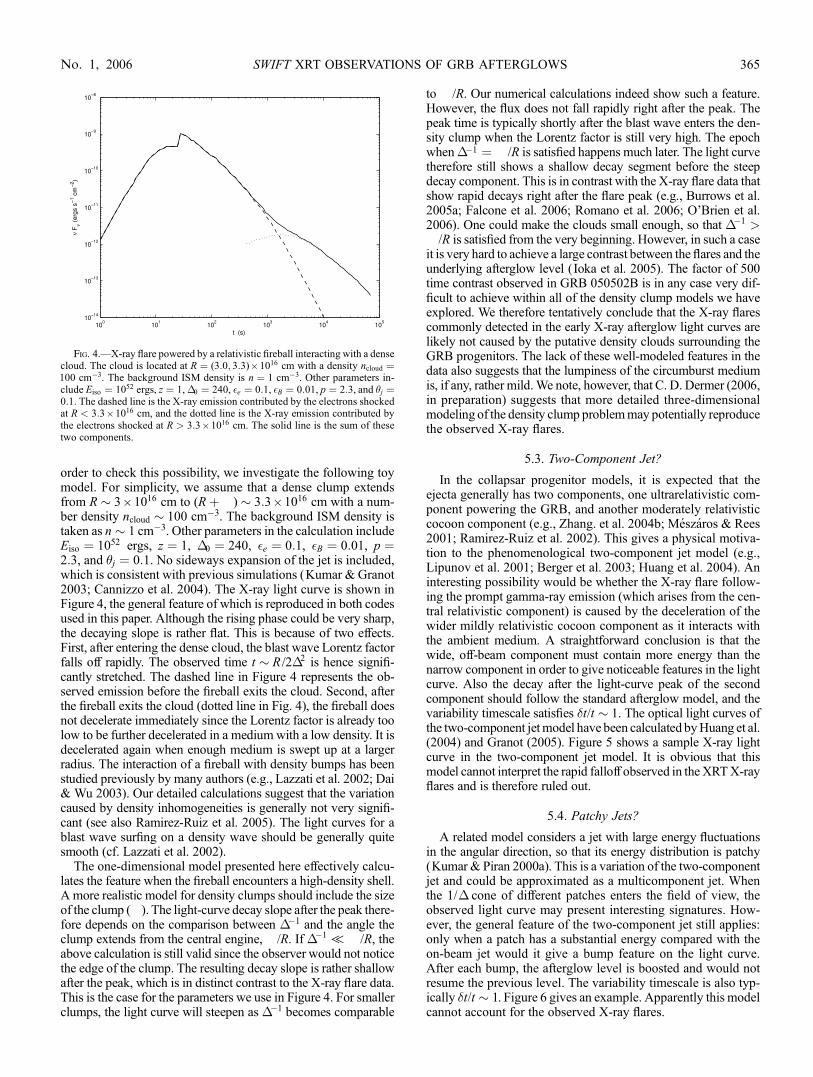
order to check this possibility, we investigate the following toymodel. For simplicity, we assume that a dense clump extendsfrom R � 3 ; 1016 cm to (Rþ�) � 3:3 ; 1016 cm with a num-ber density ncloud � 100 cm�3. The background ISM density istaken as n � 1 cm�3. Other parameters in the calculation includeEiso ¼ 1052 ergs, z ¼ 1, �0 ¼ 240, �e ¼ 0:1, �B ¼ 0:01, p ¼2:3, and �j ¼ 0:1. No sideways expansion of the jet is included,which is consistent with previous simulations (Kumar & Granot2003; Cannizzo et al. 2004). The X-ray light curve is shown inFigure 4, the general feature of which is reproduced in both codesused in this paper. Although the rising phase could be very sharp,the decaying slope is rather flat. This is because of two effects.First, after entering the dense cloud, the blast wave Lorentz factorfalls off rapidly. The observed time t � R /2�2 is hence signifi-cantly stretched. The dashed line in Figure 4 represents the ob-served emission before the fireball exits the cloud. Second, afterthe fireball exits the cloud (dotted line in Fig. 4), the fireball doesnot decelerate immediately since the Lorentz factor is already toolow to be further decelerated in a medium with a low density. It isdecelerated again when enough medium is swept up at a largerradius. The interaction of a fireball with density bumps has beenstudied previously by many authors (e.g., Lazzati et al. 2002; Dai& Wu 2003). Our detailed calculations suggest that the variationcaused by density inhomogeneities is generally not very signifi-cant (see also Ramirez-Ruiz et al. 2005). The light curves for ablast wave surfing on a density wave should be generally quitesmooth (cf. Lazzati et al. 2002).
The one-dimensional model presented here effectively calcu-lates the feature when the fireball encounters a high-density shell.A more realistic model for density clumps should include the sizeof the clump (�). The light-curve decay slope after the peak there-fore depends on the comparison between ��1 and the angle theclump extends from the central engine, �/R. If ��1T� /R, theabove calculation is still valid since the observer would not noticethe edge of the clump. The resulting decay slope is rather shallowafter the peak, which is in distinct contrast to the X-ray flare data.This is the case for the parameters we use in Figure 4. For smallerclumps, the light curve will steepen as ��1 becomes comparable
to � /R. Our numerical calculations indeed show such a feature.However, the flux does not fall rapidly right after the peak. Thepeak time is typically shortly after the blast wave enters the den-sity clump when the Lorentz factor is still very high. The epochwhen ��1 ¼ � /R is satisfied happens much later. The light curvetherefore still shows a shallow decay segment before the steepdecay component. This is in contrast with the X-ray flare data thatshow rapid decays right after the flare peak (e.g., Burrows et al.2005a; Falcone et al. 2006; Romano et al. 2006; O’Brien et al.2006). One could make the clouds small enough, so that ��1 >� /R is satisfied from the very beginning. However, in such a caseit is very hard to achieve a large contrast between the flares and theunderlying afterglow level (Ioka et al. 2005). The factor of 500time contrast observed in GRB 050502B is in any case very dif-ficult to achieve within all of the density clump models we haveexplored. We therefore tentatively conclude that the X-ray flarescommonly detected in the early X-ray afterglow light curves arelikely not caused by the putative density clouds surrounding theGRB progenitors. The lack of these well-modeled features in thedata also suggests that the lumpiness of the circumburst mediumis, if any, rather mild.We note, however, that C. D. Dermer (2006,in preparation) suggests that more detailed three-dimensionalmodeling of the density clump problemmay potentially reproducethe observed X-ray flares.
5.3. Two-Component Jet?
In the collapsar progenitor models, it is expected that theejecta generally has two components, one ultrarelativistic com-ponent powering the GRB, and another moderately relativisticcocoon component (e.g., Zhang. et al. 2004b; Meszaros & Rees2001; Ramirez-Ruiz et al. 2002). This gives a physical motiva-tion to the phenomenological two-component jet model (e.g.,Lipunov et al. 2001; Berger et al. 2003; Huang et al. 2004). Aninteresting possibility would be whether the X-ray flare follow-ing the prompt gamma-ray emission (which arises from the cen-tral relativistic component) is caused by the deceleration of thewider mildly relativistic cocoon component as it interacts withthe ambient medium. A straightforward conclusion is that thewide, off-beam component must contain more energy than thenarrow component in order to give noticeable features in the lightcurve. Also the decay after the light-curve peak of the secondcomponent should follow the standard afterglow model, and thevariability timescale satisfies �t/t � 1. The optical light curves ofthe two-component jetmodel have been calculated byHuang et al.(2004) and Granot (2005). Figure 5 shows a sample X-ray lightcurve in the two-component jet model. It is obvious that thismodel cannot interpret the rapid falloff observed in the XRTX-rayflares and is therefore ruled out.
5.4. Patchy Jets?
A related model considers a jet with large energy fluctuationsin the angular direction, so that its energy distribution is patchy(Kumar & Piran 2000a). This is a variation of the two-componentjet and could be approximated as a multicomponent jet. Whenthe 1/� cone of different patches enters the field of view, theobserved light curve may present interesting signatures. How-ever, the general feature of the two-component jet still applies:only when a patch has a substantial energy compared with theon-beam jet would it give a bump feature on the light curve.After each bump, the afterglow level is boosted and would notresume the previous level. The variability timescale is also typ-ically �t/t � 1. Figure 6 gives an example. Apparently this modelcannot account for the observed X-ray flares.
Fig. 4.—X-ray flare powered by a relativistic fireball interacting with a densecloud. The cloud is located at R ¼ (3:0; 3:3) ; 1016 cm with a density ncloud ¼100 cm�3. The background ISM density is n ¼ 1 cm�3. Other parameters in-clude Eiso ¼ 1052 ergs, z ¼ 1, �0 ¼ 240, �e ¼ 0:1, �B ¼ 0:01, p ¼ 2:3, and �j ¼0:1. The dashed line is the X-ray emission contributed by the electrons shockedat R < 3:3 ; 1016 cm, and the dotted line is the X-ray emission contributed bythe electrons shocked at R > 3:3 ; 1016 cm. The solid line is the sum of thesetwo components.
SWIFT XRT OBSERVATIONS OF GRB AFTERGLOWS 365No. 1, 2006
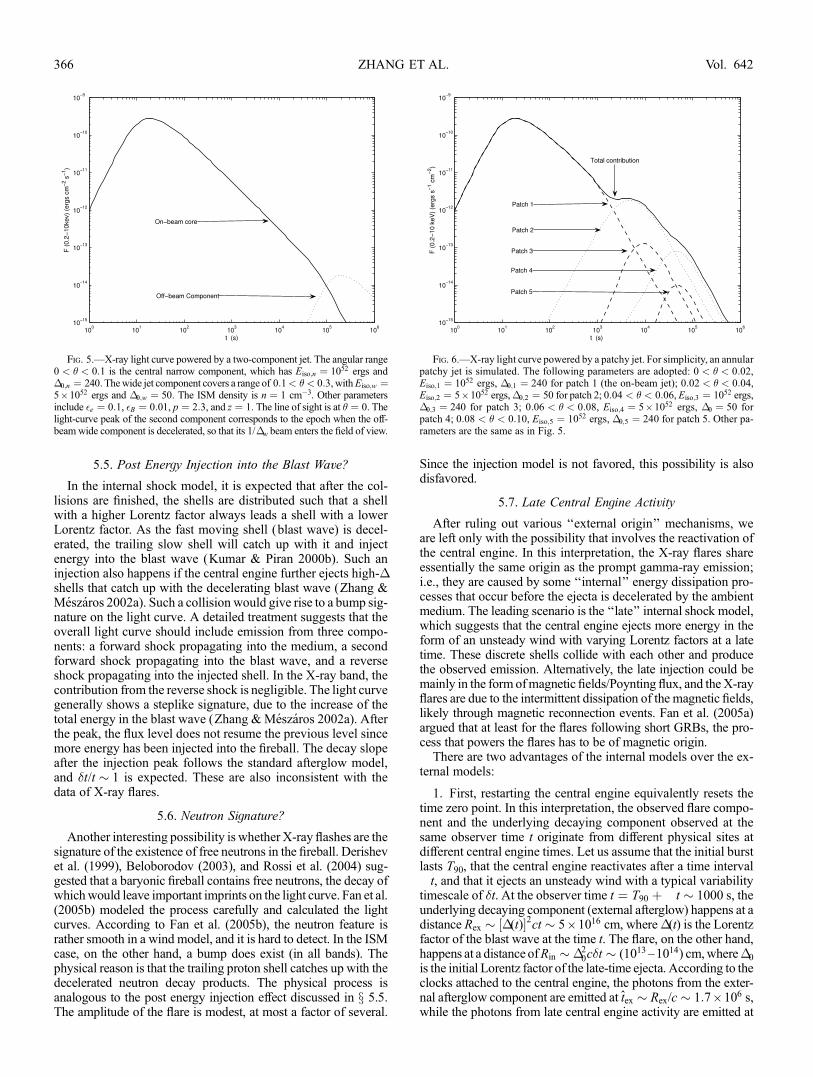
5.5. Post Energy Injection into the Blast Wave?
In the internal shock model, it is expected that after the col-lisions are finished, the shells are distributed such that a shellwith a higher Lorentz factor always leads a shell with a lowerLorentz factor. As the fast moving shell (blast wave) is decel-erated, the trailing slow shell will catch up with it and injectenergy into the blast wave (Kumar & Piran 2000b). Such aninjection also happens if the central engine further ejects high-�shells that catch up with the decelerating blast wave (Zhang &Meszaros 2002a). Such a collision would give rise to a bump sig-nature on the light curve. A detailed treatment suggests that theoverall light curve should include emission from three compo-nents: a forward shock propagating into the medium, a secondforward shock propagating into the blast wave, and a reverseshock propagating into the injected shell. In the X-ray band, thecontribution from the reverse shock is negligible. The light curvegenerally shows a steplike signature, due to the increase of thetotal energy in the blast wave (Zhang &Meszaros 2002a). Afterthe peak, the flux level does not resume the previous level sincemore energy has been injected into the fireball. The decay slopeafter the injection peak follows the standard afterglow model,and �t/t � 1 is expected. These are also inconsistent with thedata of X-ray flares.
5.6. Neutron Signature?
Another interesting possibility is whether X-ray flashes are thesignature of the existence of free neutrons in the fireball. Derishevet al. (1999), Beloborodov (2003), and Rossi et al. (2004) sug-gested that a baryonic fireball contains free neutrons, the decay ofwhichwould leave important imprints on the light curve. Fan et al.(2005b) modeled the process carefully and calculated the lightcurves. According to Fan et al. (2005b), the neutron feature israther smooth in a wind model, and it is hard to detect. In the ISMcase, on the other hand, a bump does exist (in all bands). Thephysical reason is that the trailing proton shell catches up with thedecelerated neutron decay products. The physical process isanalogous to the post energy injection effect discussed in x 5.5.The amplitude of the flare is modest, at most a factor of several.
Since the injection model is not favored, this possibility is alsodisfavored.
5.7. Late Central Engine Activity
After ruling out various ‘‘external origin’’ mechanisms, weare left only with the possibility that involves the reactivation ofthe central engine. In this interpretation, the X-ray flares shareessentially the same origin as the prompt gamma-ray emission;i.e., they are caused by some ‘‘internal’’ energy dissipation pro-cesses that occur before the ejecta is decelerated by the ambientmedium. The leading scenario is the ‘‘late’’ internal shock model,which suggests that the central engine ejects more energy in theform of an unsteady wind with varying Lorentz factors at a latetime. These discrete shells collide with each other and producethe observed emission. Alternatively, the late injection could bemainly in the form ofmagnetic fields/Poynting flux, and the X-rayflares are due to the intermittent dissipation of the magnetic fields,likely through magnetic reconnection events. Fan et al. (2005a)argued that at least for the flares following short GRBs, the pro-cess that powers the flares has to be of magnetic origin.There are two advantages of the internal models over the ex-
ternal models:
1. First, restarting the central engine equivalently resets thetime zero point. In this interpretation, the observed flare compo-nent and the underlying decaying component observed at thesame observer time t originate from different physical sites atdifferent central engine times. Let us assume that the initial burstlasts T90, that the central engine reactivates after a time interval�t, and that it ejects an unsteady wind with a typical variabilitytimescale of �t. At the observer time t ¼ T90 þ�t � 1000 s, theunderlying decaying component (external afterglow) happens at adistance Rex � ½�(t)�2ct � 5 ; 1016 cm, where �(t) is the Lorentzfactor of the blast wave at the time t. The flare, on the other hand,happens at a distance ofRin � �2
0c�t � (1013 1014) cm,where�0
is the initial Lorentz factor of the late-time ejecta. According to theclocks attached to the central engine, the photons from the exter-nal afterglow component are emitted at tex � Rex/c � 1:7 ; 106 s,while the photons from late central engine activity are emitted at
Fig. 6.—X-ray light curve powered by a patchy jet. For simplicity, an annularpatchy jet is simulated. The following parameters are adopted: 0 < � < 0:02,Eiso;1 ¼ 1052 ergs, �0;1 ¼ 240 for patch 1 (the on-beam jet); 0:02 < � < 0:04,Eiso;2 ¼ 5 ; 1052 ergs, �0;2 ¼ 50 for patch 2; 0:04 < � < 0:06,Eiso;3 ¼ 1052 ergs,�0;3 ¼ 240 for patch 3; 0:06 < � < 0:08, Eiso;4 ¼ 5 ; 1052 ergs, �0 ¼ 50 forpatch 4; 0:08 < � < 0:10, Eiso;5 ¼ 1052 ergs, �0;5 ¼ 240 for patch 5. Other pa-rameters are the same as in Fig. 5.
Fig. 5.—X-ray light curve powered by a two-component jet. The angular range0 < � < 0:1 is the central narrow component, which has Eiso;n ¼ 1052 ergs and�0;n ¼ 240. Thewide jet component covers a range of 0:1< � < 0:3, withEiso;w ¼5 ; 1052 ergs and �0;w ¼ 50. The ISM density is n ¼ 1 cm�3. Other parametersinclude �e ¼ 0:1, �B ¼ 0:01, p ¼ 2:3, and z ¼ 1. The line of sight is at � ¼ 0. Thelight-curve peak of the second component corresponds to the epoch when the off-beam wide component is decelerated, so that its 1/�w beam enters the field of view.
ZHANG ET AL.366 Vol. 642
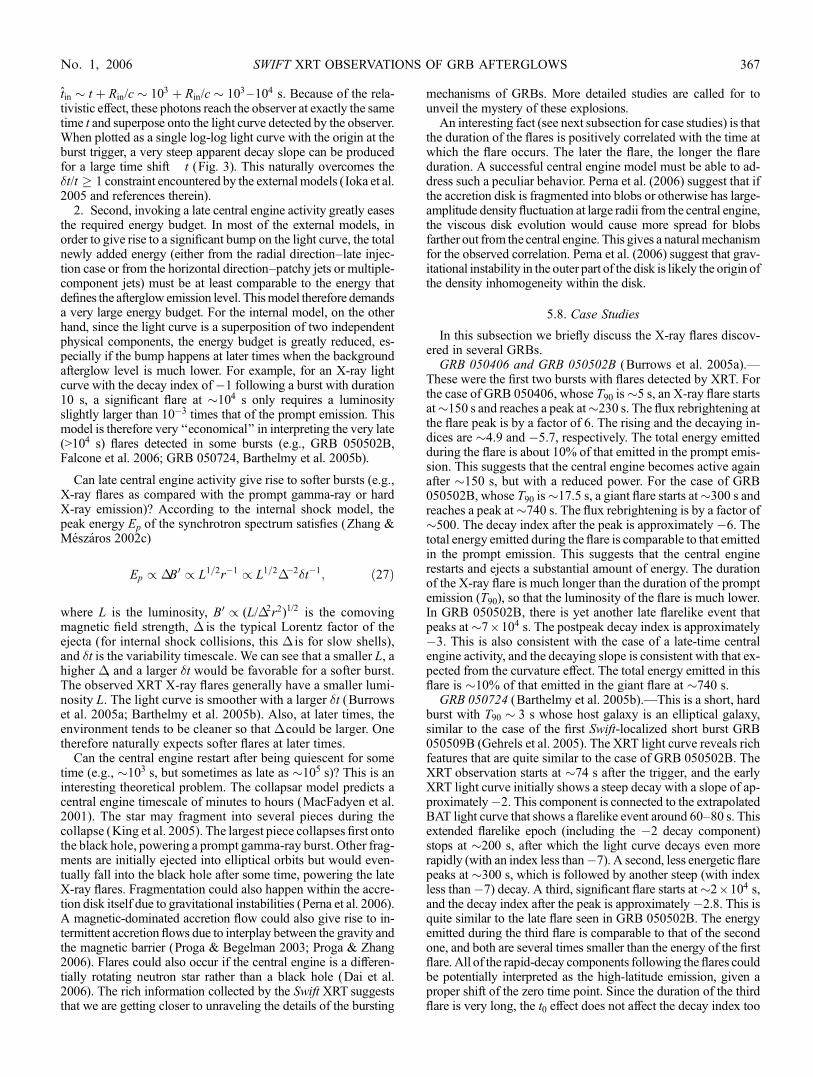
tin � t þ Rin/c � 103 þ Rin/c � 103 104 s. Because of the rela-tivistic effect, these photons reach the observer at exactly the sametime t and superpose onto the light curve detected by the observer.When plotted as a single log-log light curve with the origin at theburst trigger, a very steep apparent decay slope can be producedfor a large time shift �t (Fig. 3). This naturally overcomes the�t/t � 1 constraint encountered by the externalmodels (Ioka et al.2005 and references therein).
2. Second, invoking a late central engine activity greatly easesthe required energy budget. In most of the external models, inorder to give rise to a significant bump on the light curve, the totalnewly added energy (either from the radial direction–late injec-tion case or from the horizontal direction–patchy jets or multiple-component jets) must be at least comparable to the energy thatdefines the afterglow emission level. Thismodel therefore demandsa very large energy budget. For the internal model, on the otherhand, since the light curve is a superposition of two independentphysical components, the energy budget is greatly reduced, es-pecially if the bump happens at later times when the backgroundafterglow level is much lower. For example, for an X-ray lightcurve with the decay index of�1 following a burst with duration10 s, a significant flare at �104 s only requires a luminosityslightly larger than 10�3 times that of the prompt emission. Thismodel is therefore very ‘‘economical’’ in interpreting the very late(>104 s) flares detected in some bursts (e.g., GRB 050502B,Falcone et al. 2006; GRB 050724, Barthelmy et al. 2005b).
Can late central engine activity give rise to softer bursts (e.g.,X-ray flares as compared with the prompt gamma-ray or hardX-ray emission)? According to the internal shock model, thepeak energy Ep of the synchrotron spectrum satisfies (Zhang &Meszaros 2002c)
Ep / �B0 / L1=2r�1 / L1=2��2�t�1; ð27Þ
where L is the luminosity, B0 / (L/�2r2)1/2 is the comovingmagnetic field strength, � is the typical Lorentz factor of theejecta (for internal shock collisions, this � is for slow shells),and �t is the variability timescale. We can see that a smaller L, ahigher �, and a larger �t would be favorable for a softer burst.The observed XRT X-ray flares generally have a smaller lumi-nosity L. The light curve is smoother with a larger �t (Burrowset al. 2005a; Barthelmy et al. 2005b). Also, at later times, theenvironment tends to be cleaner so that � could be larger. Onetherefore naturally expects softer flares at later times.
Can the central engine restart after being quiescent for sometime (e.g., �103 s, but sometimes as late as �105 s)? This is aninteresting theoretical problem. The collapsar model predicts acentral engine timescale of minutes to hours (MacFadyen et al.2001). The star may fragment into several pieces during thecollapse (King et al. 2005). The largest piece collapses first ontothe black hole, powering a prompt gamma-ray burst. Other frag-ments are initially ejected into elliptical orbits but would even-tually fall into the black hole after some time, powering the lateX-ray flares. Fragmentation could also happen within the accre-tion disk itself due to gravitational instabilities (Perna et al. 2006).A magnetic-dominated accretion flow could also give rise to in-termittent accretion flows due to interplay between the gravity andthe magnetic barrier (Proga & Begelman 2003; Proga & Zhang2006). Flares could also occur if the central engine is a differen-tially rotating neutron star rather than a black hole (Dai et al.2006). The rich information collected by the Swift XRT suggeststhat we are getting closer to unraveling the details of the bursting
mechanisms of GRBs. More detailed studies are called for tounveil the mystery of these explosions.
An interesting fact (see next subsection for case studies) is thatthe duration of the flares is positively correlated with the time atwhich the flare occurs. The later the flare, the longer the flareduration. A successful central engine model must be able to ad-dress such a peculiar behavior. Perna et al. (2006) suggest that ifthe accretion disk is fragmented into blobs or otherwise has large-amplitude density fluctuation at large radii from the central engine,the viscous disk evolution would cause more spread for blobsfarther out from the central engine. This gives a naturalmechanismfor the observed correlation. Perna et al. (2006) suggest that grav-itational instability in the outer part of the disk is likely the origin ofthe density inhomogeneity within the disk.
5.8. Case Studies
In this subsection we briefly discuss the X-ray flares discov-ered in several GRBs.
GRB 050406 and GRB 050502B (Burrows et al. 2005a).—These were the first two bursts with flares detected by XRT. Forthe case of GRB 050406, whose T90 is�5 s, an X-ray flare startsat�150 s and reaches a peak at�230 s. The flux rebrightening atthe flare peak is by a factor of 6. The rising and the decaying in-dices are �4.9 and �5.7, respectively. The total energy emittedduring the flare is about 10% of that emitted in the prompt emis-sion. This suggests that the central engine becomes active againafter �150 s, but with a reduced power. For the case of GRB050502B, whose T90 is�17.5 s, a giant flare starts at�300 s andreaches a peak at�740 s. The flux rebrightening is by a factor of�500. The decay index after the peak is approximately �6. Thetotal energy emitted during the flare is comparable to that emittedin the prompt emission. This suggests that the central enginerestarts and ejects a substantial amount of energy. The durationof the X-ray flare is much longer than the duration of the promptemission (T90), so that the luminosity of the flare is much lower.In GRB 050502B, there is yet another late flarelike event thatpeaks at�7 ; 104 s. The postpeak decay index is approximately�3. This is also consistent with the case of a late-time centralengine activity, and the decaying slope is consistent with that ex-pected from the curvature effect. The total energy emitted in thisflare is �10% of that emitted in the giant flare at �740 s.
GRB 050724 (Barthelmy et al. 2005b).—This is a short, hardburst with T90 � 3 s whose host galaxy is an elliptical galaxy,similar to the case of the first Swift-localized short burst GRB050509B (Gehrels et al. 2005). The XRT light curve reveals richfeatures that are quite similar to the case of GRB 050502B. TheXRT observation starts at �74 s after the trigger, and the earlyXRT light curve initially shows a steep decay with a slope of ap-proximately�2. This component is connected to the extrapolatedBAT light curve that shows a flarelike event around 60–80 s. Thisextended flarelike epoch (including the �2 decay component)stops at �200 s, after which the light curve decays even morerapidly (with an index less than�7). A second, less energetic flarepeaks at �300 s, which is followed by another steep (with indexless than�7) decay. A third, significant flare starts at�2 ; 104 s,and the decay index after the peak is approximately�2.8. This isquite similar to the late flare seen in GRB 050502B. The energyemitted during the third flare is comparable to that of the secondone, and both are several times smaller than the energy of the firstflare. All of the rapid-decay components following the flares couldbe potentially interpreted as the high-latitude emission, given aproper shift of the zero time point. Since the duration of the thirdflare is very long, the t0 effect does not affect the decay index too
SWIFT XRT OBSERVATIONS OF GRB AFTERGLOWS 367No. 1, 2006
much. This is why the decay index �2.8 is quite normal, i.e.,consistent with the�2� � prediction. The earlier steeper decays(e.g., less than�7) are all preceded by flares with a sharp increas-ing phase. Shifting t0 in these cases would lead to significant flat-tening of the decaying index, which could be still consistent withthe high-latitude emission. All of these discussions also apply tothe case of GRB 050502B.17
GRB 011121 (Piro et al. 2005).—This BeppoSAX burst alsoindicated a flarelike event around �270 s. Piro et al. (2005) in-terpreted the X-ray bump as the onset of the afterglow phase. Inview of the fact that X-ray flares are commonly detected in Swiftbursts, it is natural to speculate that the event is also an X-ray flarecaused by late central engine activity. Fan & Wei (2005) havesuggested the late central engine activity and performed a detailedcase study on this event.
6. CONCLUSIONS
During the past several months, the SwiftXRT has collected arich sample of early X-ray afterglow data. This, for the first time,allows us to peer at the final temporal gap left by the previousobservations and to explore many interesting questions of GRBphysics. In this paper we have systematically investigated variouspossible physical processes that could give interesting contribu-tions to the early X-ray afterglow observations. This includes thetail emission of the prompt gamma-ray emission, both the forwardshock and the reverse shock emission components, refreshedshocks, post energy injection, medium-density clumps near theburst, angular inhomogeneities of the fireball, an emission com-ponent due to the presence of free neutrons, and emission from latecentral engine activity. We discuss how the above processes mightleave interesting signatures on the earlyX-ray afterglow light curves.
Based on the XRT data collected so far, we summarize thesalient features and suggest a tentative synthetic light curve forthe X-ray afterglow light curves. As shown in Figure 1, the syn-thetic light curve includes five components: (I) an intial steep de-cay component; (II) a shallower than normal decay component;(III) a ‘‘normal’’ decay component; (IV) a post–jet break com-ponent; and (V) X-ray flares. Components I and III appear in al-most all of the bursts. The other three components also commonlyappear in some bursts. Flares have been detected in nearly half ofthe XRT early light curves, and the shallow decay segment hasalso been discovered in a good fraction of Swift GRBs. We there-fore believe that they represent some common underlying physicsfor GRBs. After comparing datawith various physicalmodels, wetentatively draw the following conclusions:
1. The rapid decay component (Tagliaferri et al. 2005) com-monly observed in the very early afterglow phase (which usuallyhas a different spectral slope than the late shallow decay compo-nents) is very likely the tail emission of the prompt gamma-raybursts or of the early X-ray flares. Allowing proper shifting of thetime zero point and considering the contribution of the under-lying forward shock emission, we speculate that essentially allof the steep decay cases could be understood in terms of the‘‘curvature effect’’ of the high-latitude emission as the emissionceases abruptly. More detailed data analyses (Liang et al. 2006)support such a speculation.
2. The transition between the prompt emission and the after-glow emission appears to be universally represented by a rapiddecay followed by a shallower decay, indicating that the GRB
emission site is very likely different from the afterglow site andthat the apparent gamma-ray efficiency is very high.3. In a good fraction of GRBs (e.g., GRB 050128, GRB
050315, GRB 050319, GRB 050401; Campana et al. 2005;Vaughan et al. 2006; Cusumano et al. 2006; De Pasquale et al.2006), a clear temporal break exists in the earlyX-ray light curves.There is no obvious spectral index change across the break. Thetemporal decay index before the break is very flat, while that afterthe break is quite normal, i.e., is consistent with the standard after-glow model for a fireball with constant energy expanding into anISM. We suggest that these breaks are likely not ‘‘jet breaks.’’Rather, they mark the cessation of an early continuous energy in-jection phase during which the external shock is refreshed. Wesuggest three possible physical mechanisms for the refreshedshocks, i.e., a long-lived central engine with a decaying luminos-ity, a power-law distribution of the shell Lorentz factors before de-celeration begins, and the deceleration of a high- flow. Furtherstudies are needed to better understand this phase.4. In the normal phase, the data for many bursts are consistent
with an ISM rather than a wind medium. This has important im-plications for understanding the massive star progenitors of longGRBs, including their late evolution stage shortly before explosion.5. Given that most of the shallow-to-normal transitions are
due to the cessation of the refreshed shock phase, the cases with awell-identified jet break are not very common. Nonetheless, jetbreaks are likely identified in some bursts, e.g., GRB 050315(Vaughan et al. 2006), GRB 050525A (Blustin et al. 2006), XRF050416 (Sakamoto et al. 2006), and some others.6. The X-ray flares detected in nearly half of the Swift bursts
are most likely due to late central engine activity, which results ininternal shocks (or similar energy dissipation events) at latertimes. It seems to us that there is no evidence for the existence ofdensity clumps in the GRB neighborhood, and there is no sup-port for strong angular inhomogeneities (e.g., two-componentjet, patchy jets) for the GRB fireball. However, their existence isnot ruled out.7. The similar light curves for some long GRBs (e.g., GRB
050502B; Burrows et al. 2005a) and some short GRBs (e.g.,GRB 050724; Barthelmy et al. 2005b) indicate that differentprogenitor systems may share some similarities in the centralengine. This might be caused by the same underlying physicsthat controls the hyperaccreting accretion disk, a common agentin charge of both types of systems (Perna et al. 2006).
The Swift XRT is still rapidly accumulating data on the earlyX-ray afterglows. More careful statistical analyses of these X-raydata, as well as more detailed case studies, also including low-frequency data collected by UVOT and other ground-based tele-scopes, would greatly improve our knowledge about GRBpromptemission and afterglows, advancing the quest for the final answersto the core questions in the study of GRBs.
We thank the referee for helpful comments. B. Z. acknowl-edges useful discussions with T. Abel, P. Armitage,M. Begelman,Z. G. Dai, C. D. Dermer, B. Dingus, C. Fryer, L. J. Gou, J. Granot,A. Heger, D. Lazzati, A. Panaitescu, R. Perna, D. Proga,S. Woosley, X. Y. Wang, X. F. Wu, and W. Zhang on varioustopics covered in this paper. This work is supported by NASANNG05GB67G,NNG05GH91G (for B. Z.), NNG05GH92G (forB. Z., S. K., and P. M.), Eberly Research Funds of Penn State, andby the Center for Gravitational Wave Physics under grants PHY-01-14375 (for S. K.), NSF AST 0307376 and NASA NAG5-13286 (for P. M.), and NASA NAS5-00136 (D. B. and J. N.).
17 After submitting this paper, detailed data analyses (Liang et al. 2006) con-firm these speculations. The late flares in both GRB050724 and GRB050502B areconsistent with the hypothesis that they are due to late-time central engine activity.
ZHANG ET AL.368 Vol. 642
REFERENCES
Akerlof, C., et al. 1999, Nature, 398, 400Band, D., et al. 1993, ApJ, 413, 281Baring, M. G., & Harding, A. K. 1997, ApJ, 491, 663Barthelmy, S., et al. 2005a, ApJ, 635, L133———. 2005b, Nature, 438, 994Beloborodov, A. M. 2000, ApJ, 539, L25———. 2003, ApJ, 585, L19Berger, E., Cenko, S. B., & Kulkarni, S. 2005, GCN Circ. 3088, http://gcn.gsfc.nasa.gov/gcn/gcn3/3088.gcn3
Berger, E., et al. 2003, Nature, 426, 154Blake, C. H., et al. 2005, Nature, 435, 181Blustin, A. J., et al. 2006, ApJ, 637, 901Bottcher, M., & Dermer, C. D. 2000, ApJ, 532, 281Burenin, R. A., et al. 1999, A&A, 344, L53Burrows, D. N., et al. 2005a, Science, 309, 1833———. 2005b, Space Sci. Rev., 120, 165Campana, S., et al. 2005, ApJ, 625, L23Cannizzo, J. K., Gehrels, N., & Vishniac, E. T. 2004, ApJ, 601, 380Chevalier, R. A., & Li, Z.-Y. 2000, ApJ, 536, 195Chevalier, R. A., Li, Z.-Y., & Fransson, C. 2004, ApJ, 606, 369Chincarini, G., et al. 2005, ApJ, submitted (astro-ph/0506453)Cusumano, G., et al. 2006, ApJ, 639, 316Dai, Z. G. 2004, ApJ, 606, 1000Dai, Z. G., & Cheng, K. S. 2001, ApJ, 558, L109Dai, Z. G., & Lu, T. 1998a, A&A, 333, L87———. 1998b, MNRAS, 298, 87Dai, Z. G., Wang, X. Y., Wu, X. F., & Zhang, B. 2006, Science, 311, 1127Dai, Z. G., & Wu, X. F. 2003, ApJ, 591, L21Daigne, F., & Mochkovitch, R. 1998, MNRAS, 296, 275De Pasquale, M., et al. 2006, MNRAS, 365, 1031Derishev, E. V., Kocharovsky, V. V., & Kocharovsky, Vl. V. 1999, ApJ, 521, 640Dermer, C. 2004, ApJ, 614, 284Dermer, C., & Mitman, K. E. 1999, ApJ, 513, L5———. 2004, in ASP Conf. Ser. 312, Third Rome Workshop on Gamma-RayBursts in the Afterglow Era, ed. M. Feroci et al. (San Francisco: ASP), 301
Drenkhahn, G., & Spruit, H. C. 2002, A&A, 391, 1141Dyks, J., Zhang, B., & Fan, Y. Z. 2005, ApJ, submitted (astro-ph /0511699)Falcone, A., et al. 2006, ApJ, 641, 1010Fan, Y. Z., Dai, Z. G., Huang, Y. F., & Lu, T. 2002, Chinese J. Astron.Astrophys., 2, 449
Fan, Y. Z., & Wei, D. M. 2005, MNRAS, 364, L42Fan, Y. Z., Wei, D. M., & Wang, C. F. 2004a, A&A, 424, 477Fan, Y. Z., Wei, D. M., & Zhang, B. 2004b, MNRAS, 354, 1031Fan, Y. Z., Zhang, B., & Proga, D. 2005a, ApJ, 635, L129Fan, Y. Z., Zhang, B., & Wei, D. M. 2005b, ApJ, 628, 298———. 2005c, ApJ, 628, L25Fenimore, E. E., Madras, C. D., & Nayakshin, S. 1996, ApJ, 473, 998Fox, D., et al. 2003, ApJ, 586, L5Freedman, D. L., & Waxman, E. 2001, ApJ, 547, 922Fynbo, J. P. U., Hjorth, J., Jensen, B. L., Jakobsson, P., Moller, P., & Naranen,J. 2005a, GCN Circ. 3136, http://gcn.gsfc.nasa.gov/gcn/gcn3/3136.gcn3
Fynbo, J. P. U., et al. 2005b, GCN Circ. 3176, http://gcn.gsfc.nasa.gov/gcn/gcn3/3176.gcn3
Gao, W. H., & Wei, D. M. 2004, ApJ, 604, 312———. 2005, ApJ, 628, 853Gehrels, N., et al. 2005, Nature, 437, 851Giblin, T. W., et al. 1999, ApJ, 524, L47Goad, M. 2006, A&A, in press (astro-ph/0511751)Gou, L. J., Dai, Z. G., Huang, Y. F., & Lu, T. 2001, A&A, 368, 464Granot, J. 2005, ApJ, 631, 1022Granot, J., & Kumar, P. 2003, ApJ, 591, 1086Hill, J., et al. 2006, ApJ, 639, 303Huang, Y. F., Gou, L. J., Dai, Z. G., & Lu, T. 2000, ApJ, 543, 90Huang, Y. F., Wu, X. F., Dai, Z. G., Ma, H. T., & Lu, T. 2004, ApJ, 605, 300Ioka, K., Kobayashi, S., & Zhang, B. 2005, ApJ, 631, 429Janiuk, A., Perna, R., Di Matteo, T., & Czerny, B. 2004, MNRAS, 355, 950Kelson, D., & Berger, E. 2005, GCN Circ. 3100, http://gcn.gsfc.nasa.gov/gcn/gcn3/3100.gcn3
King, A., O’Brien, P. T., Goad, M. R., Osborne, J., Olsson, E., & Page, K.2005, ApJ, 630, L113
Kobayashi, S. 2000, ApJ, 545, 807Kobayashi, S., Piran, T., & Sari, R. 1997, ApJ, 490, 92Kobayashi, S., & Sari, R. 2001, ApJ, 551, 934Kobayashi, S., & Zhang, B. 2003a, ApJ, 582, L75———. 2003b, ApJ, 597, 455
Kobayashi, S., Zhang, B., Meszaros, P., & Burrows, D. N. 2005, ApJ, sub-mitted (astro-ph/0506157)
Kumar, P. 1999, ApJ, 523, L113Kumar, P., & Granot, J. 2003, ApJ, 591, 1075Kumar, P., & Panaitescu, A. 2000a, ApJ, 541, L9———. 2000b, ApJ, 541, L51———. 2003, MNRAS, 346, 905Kumar, P., & Piran, T. 2000a, ApJ, 532, 286———. 2000b, ApJ, 535, 152Lazzati, D., et al. 2002, A&A, 396, L5Li, W. D., Filippenko, A. V., Chornock, R., & Jha, S. 2003a, ApJ, 586, L9Li, Z., Dai, Z. G., Lu, T., & Song, L. M. 2003b, ApJ, 599, 380Liang, E. W., et al. 2006, ApJ, submitted (astro-ph/0602142)Lipunov, V. M., Postnov, K. A., & Prokhorov, M. E. 2001, Astron. Rep., 45, 236Lithwick, Y., & Sari, R. 2001, ApJ, 555, 540Lloyd-Ronning, N. M., & Zhang, B. 2004, ApJ, 613, 477Lyutikov, M., & Blandford, R. D. 2003, MNRAS, submitted (astro-ph/0312347)
MacFadyen, A. I., Woosley, S. E., & Heger, A. 2001, ApJ, 550, 410Mason, K. O., et al. 2006, ApJ, 639, 311McMahon, E., Kumar, P., & Panaitescu, A. 2004, MNRAS, 354, 915Meszaros, P., & Rees, M. J. 1993, ApJ, 405, 278———. 1997a, ApJ, 476, 232———. 1997b, ApJ, 482, L29———. 1999, MNRAS, 306, L39———. 2001, ApJ, 556, L37Moderski, R., Sikora, M., & Bulik, T. 2000, ApJ, 529, 151Nakar, E., & Piran, T. 2004, MNRAS, 353, 647Nousek, J., et al. 2006, ApJ, 642, 389O’Brien, P., et al. 2006, ApJ, submitted (astro-ph/0601125)Paczynski, B., & Xu, G. 1994, ApJ, 427, 708Panaitescu, A., & Kumar, P. 2002, ApJ, 571, 779———. 2004, MNRAS, 353, 511Panaitescu, A., & Meszaros, P. 1999, ApJ, 526, 707Panaitescu, A., Meszaros, P., Gehrels, N., Burrows, D., & Nousek, J. 2006,MNRAS, in press (astro-ph/0508340)
Panaitescu, A., Meszaros, P., & Rees, M. J. 1998, ApJ, 503, 314Panaitescu, A., Spada, M., & Meszaros, P. 1999, ApJ, 522, L105Perna, R., Armitage, P. J., & Zhang, B. 2006, ApJ, 636, L29Piro, L., et al. 1998, A&A, 331, L41———. 2005, ApJ, 623, 314Proga, D., & Begelman, M. 2003, ApJ, 592, 767Proga, D., & Zhang, B. 2006, ApJ, submitted (astro-ph/0601272)Ramirez-Ruiz, E., Celotti, A., & Rees, M. J. 2002, MNRAS, 337, 1349Ramirez-Ruiz, E., Garcia-Segura, G., Salmonson, J. D., & Perez-Rendon, B.2005, ApJ, 631, 435
Rees, M. J., & Meszaros, P. 1992, MNRAS, 258, 41P———. 1994, ApJ, 430, L93———. 1998, ApJ, 496, L1———. 2000, ApJ, 545, L73———. 2005, ApJ, 628, 847Rhoads, J. E. 1999, ApJ, 525, 737Romano, P., et al. 2006, A&A, submitted (astro-ph/0602497)Rossi, E., Beloborodov, A. M., & Rees, M. J. 2004, in AIP Conf. Proc. 727,Gamma-Ray Bursts: 30 Years of Discovery, ed. E. E. Fenimore & M. Galassi(New York: AIP), 198
Rossi, E., Lazzati, D., & Rees, M. J. 2002, MNRAS, 332, 945Sakamoto, T., et al. 2006, ApJ, 636, L73Salmonson, J. D. 2003, ApJ, 592, 1002Sari, R., & Meszaros, P. 2000, ApJ, 535, L33Sari, R., & Piran, T. 1997, ApJ, 485, 270———. 1999, ApJ, 517, L109Sari, R., Piran, T., & Halpern, J. P. 1999, ApJ, 519, L17Sari, P., Piran, T., & Narayan, R. 1998, ApJ, 497, L17Tagliaferri, G., et al. 2005, Nature, 436, 985Thompson, C. 1994, MNRAS, 270, 480Usov, V. V. 1992, Nature, 357, 472Vaughan, S., et al. 2006, ApJ, 638, 920Vestrand, W. T., et al. 2005, Nature, 435, 178Wang, X. Y., Dai, Z. G., & Lu, T. 2000, MNRAS, 319, 1159Waxman, E., Kulkarni, S. R., & Frail, D. 1998, ApJ, 497, 288Wei, D. M. 2003, A&A, 402, L9Woosley, S. E., Zhang,W.,&Heger, A. 2003, inAIPConf. Proc. 662, Gamma-RayBurst and Afterglow Astronomy 2001, ed. G. R. Ricker & R. K. Vanderspek(New York: AIP), 185
SWIFT XRT OBSERVATIONS OF GRB AFTERGLOWS 369No. 1, 2006

Wu, X. F., Dai, Z. G., Huang, Y. F., & Lu, T. 2003, MNRAS, 342, 1131———. 2005, ApJ, 619, 968Yamazaki, R., Ioka, K., & Nakamura, T. 2004, ApJ, 607, L103Yost, S., Harrison, F. A., Sari, R., & Frail, D. A. 2003, ApJ, 597, 459Zhang, B., Dai, X., Lloyd-Ronning, N. M., & Meszaros, P. 2004a, ApJ, 601,L119
Zhang, B., & Kobayashi, S. 2005, ApJ, 628, 315
Zhang, B., Kobayashi, S., & Meszaros, P. 2003, ApJ, 595, 950Zhang, B., & Meszaros, P. 2001, ApJ, 552, L35———. 2002a, ApJ, 566, 712———. 2002b, ApJ, 571, 876———. 2002c, ApJ, 581, 1236———. 2004, Int. J. Mod. Phys. A, 19, 2385Zhang, W., Woosley, S. E., & Heger, A. 2004b, ApJ, 608, 365
ZHANG ET AL.370
Related Documents