Utah State University Utah State University DigitalCommons@USU DigitalCommons@USU International Symposium on Hydraulic Structures May 16th, 2:35 PM Physical Model Study of Spilling and Energy Dissipation Physical Model Study of Spilling and Energy Dissipation Arrangements of Malana Dam, Kullu, India Arrangements of Malana Dam, Kullu, India Z. Ahmad zulfi[email protected] Follow this and additional works at: https://digitalcommons.usu.edu/ishs Recommended Citation Recommended Citation Ahmad, Z. (2018). Physical Model Study of Spilling and Energy Dissipation Arrangements of Malana Dam, Kullu, India. Daniel Bung, Blake Tullis, 7th IAHR International Symposium on Hydraulic Structures, Aachen, Germany, 15-18 May. doi: 10.15142/T35934 (978-0-692-13277-7). This Event is brought to you for free and open access by the Conferences and Events at DigitalCommons@USU. It has been accepted for inclusion in International Symposium on Hydraulic Structures by an authorized administrator of DigitalCommons@USU. For more information, please contact [email protected].

Welcome message from author
This document is posted to help you gain knowledge. Please leave a comment to let me know what you think about it! Share it to your friends and learn new things together.
Transcript

Utah State University Utah State University
DigitalCommons@USU DigitalCommons@USU
International Symposium on Hydraulic Structures
May 16th, 2:35 PM
Physical Model Study of Spilling and Energy Dissipation Physical Model Study of Spilling and Energy Dissipation
Arrangements of Malana Dam, Kullu, India Arrangements of Malana Dam, Kullu, India
Z. Ahmad [email protected]
Follow this and additional works at: https://digitalcommons.usu.edu/ishs
Recommended Citation Recommended Citation Ahmad, Z. (2018). Physical Model Study of Spilling and Energy Dissipation Arrangements of Malana Dam, Kullu, India. Daniel Bung, Blake Tullis, 7th IAHR International Symposium on Hydraulic Structures, Aachen, Germany, 15-18 May. doi: 10.15142/T35934 (978-0-692-13277-7).
This Event is brought to you for free and open access by the Conferences and Events at DigitalCommons@USU. It has been accepted for inclusion in International Symposium on Hydraulic Structures by an authorized administrator of DigitalCommons@USU. For more information, please contact [email protected].

7th International Symposium on Hydraulic Structures Aachen, Germany, 15-18May 2018
ISBN: 978-0-692-13277-7 DOI: 10.15142/T35934
Physical Model Study of Spilling and Energy Dissipation Arrangements of Malana Dam,
Kullu, India
Z. Ahmad1 1Indian Institute of Technology Roorkee, Roorkee, India
E-mail: [email protected]
Abstract: Physical model study of spilling arrangement of the dam of Malana-II hydroelectric project has been carried out to
ensure the safety of the dam. The discharging capacity of the under sluice spillways and an overflow spillway has been studied
under their individual and joint operations. Cavitation index of the flow over the spillway surface has also been estimated to ensure
cavitation free flow. Initial proposal of provision of flip bucket for energy dissipation of flow through overflow spillway has been
replaced by hydraulic jump type stilling basin by pooling the water by a submerged weir. The discharging capacity of joint
operation of both the under sluice spillways was lower than the summation of discharges under their operation in isolation, which
can be attributed to interference of their zone of influence at inlet. Negligible cavitation was found in the flow of overflow spillway.
Flow onwards to the toe of the overflow spillway was chaotic and full of strong cross-currents. The flip bucket was also not
performing well due to rise in depth of flow and mixed directional flow as a result of cross-currents upstream of the bucket. For
the facilitation of energy dissipation, flip bucket arrangement was replaced with hydraulic jump type stilling basin by pooling the
water with provision of a submerged broad crested weir with steps downstream of the weir. Knowledge gathered from this model
study shall be useful for the design of such type of the structures in future.
Keywords: Dam, overflow spillway, under sluice spillway, physical modelling, stilling basin, cavitation.
1. Introduction
Malana-II Hydro Electric Project (HEP) is a run-of-the-river scheme on the Malana River in the Kullu district of
Himachal Pradesh, India. It utilizes a gross head of about 626 m and generates 100 MW of power. A concrete dam
with top level of 2545 m is constructed across the Malana River. Two under sluice type spillways of total discharging
capacity of around 788.18 m3/s at maximum water level (MWL) of 2545 m are provided to spill the flood water. The
estimated probable maximum flood (PMF) discharge is 650 m3/s.
On tripping of both units of the project on 24th August 2013, water level in the reservoir which was initially at
minimum drawdown level of 2528 m starts rising. The project authorities tried to open the radial gates of under sluice
spillways; however, they could not be raised. As a result, the reservoir level rose and overtopping of the dam happened,
which continued for about 4 hours. No major damage to the dam was reported; however, to ensure safety of the dam
in future, an overflow spillway in the Dam was put into plan so that water can safely pass under in an inoperative
condition of one gate, which can be attributed to emergency situation for mechanical and human failure. The proposed
overflow spillway consisted of seven bays - six bays of 6.25 m wide and one bay of 4.5 m wide by converting the
existing non-overflow blocks into overflow blocks with spillway crest at El. 2543.0 m. Plan and section of the existing
dam are shown in Figure 1, while the modified plan layout of the dam, incorporating overflow spillway, is shown in
Figure 2.
It was felt that various important features of the proposed spillway need to be examined through physical model studies
for hydraulic efficiencies with respect to discharging capacity, efficient energy dissipation without any erosion at toe,
and right bank having a road for safety of the dam in particular before its implementation.
The following were the objectives of the model study:
a) Construction of the spillway model to a scale of 1:40 invoking the Froude number similarity.
b) Determination of discharging capacity of the spillways under different operating conditions.
c) Downstream pressure distribution –cavitation formations, if any.
d) Energy dissipation of flow through the spillway.
The present study deals with model studies of the spilling arrangement of the Malana-II hydroelectric project in the
respect of discharging capacity, energy dissipation, and cavitation, if any.
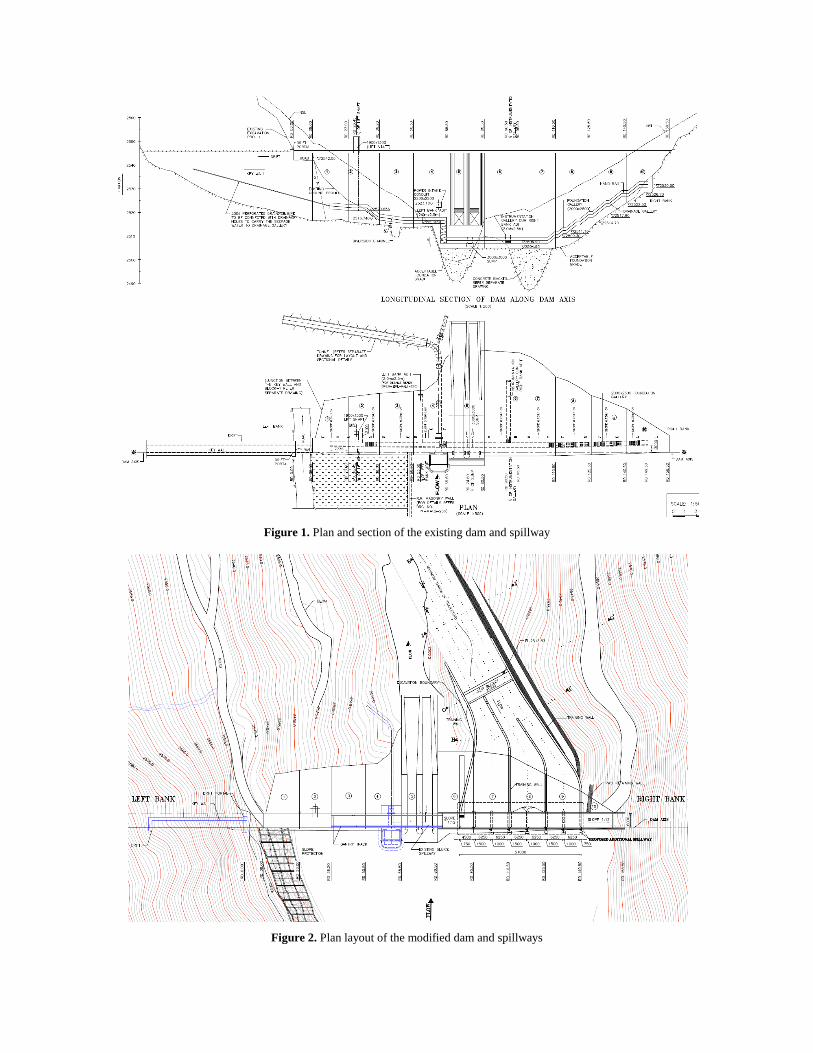
Figure 1. Plan and section of the existing dam and spillway
Figure 2. Plan layout of the modified dam and spillways

2. Set Up of the Model
A comprehensive and geometrically similar model of the Malana-II hydroelectric project dam and its spillways was
built to a scale of 1:40, invoking the Froude number similarity for studying the discharging capacity of the spillways,
cavitation over surface of the spillways, and energy dissipation downstream of the spillways. Available cross-sections
along with contour maps were used to replicate the river in the model. Even though cross-section was available up to
50 m upstream of the dam only, the extent of the reservoir was reproduced more to control the entry of foreign
eddies/disturbances into the spillways and to minimize the effect of limited size of the reservoir on the hydraulics of
the spillways (Noval et al., 2010).
The two under sluice spillways which have crest levels at 2514.5 m and sized at 4 m × 5.5 m were modeled. Plan and
section of the under sluice spillways are shown in Figure 3. The profiles of the upstream surface, downstream surface,
and surface of the breast wall were reproduced in the model. Radial gate, which seat was at a level of 2514.19 m and
trunnion at 2521.0 m, was installed. An overflow spillway which was consisting of 6 bays each of clear bay width of
6.25 m and one bay of clear bay width of 4.5 m was also constructed, and the crest was kept at a level of 2543.0 m.
Total bay width of the overflow spillway including pier and abutment thickness was 51 m. Profile of the overflow
spillway including its crest and downstream glacis was constructed along with two training walls and flip bucket.
Section f-f' of the overflow spillway is shown in Figure 4 for illustration. Some photographs of the constructed model
are shown in Figures 5 and 6.
Spilling part of the model, i.e., under sluice spillway, stilling basin, overflow spillway, and flip bucket were
constructed in cement mortar making inner surface smooth with neat cement layer. Shingles of size 20 mm to 50 mm
were laid on the bed of the channel downstream of the section T-T over a length of 100 cm to keep it mobile for
comparing depth of scour as an indicator of the energy dissipation under different flow combinations (Ahmad, 2010).
Seven pressure points were provided on the profile of the left under sluice at its center line to measure piezo-metric
head, so that cavitation index can be computed. Such pressure points were located at distances of x = -3 m, 0 m, 8 m,
16 m, 24 m, 32 m, and 43.4 m from the dam axis (x=0). Seven pressure points were also provided on the surface of
the overflow spillway in the middle of the sections D-D' and E-E' at distances of x = 0, 1.8 m, 4.8 m, 10 m, 15.6 m,
25.4 m, and 30.6 m from the dam axis (x=0).
3. Model Study on the Initial Proposal
For the determination of discharging capacity of the spillways, cavitation on the surface of the spillways, if any and
energy dissipation of the flow downstream of the spillways, the model was performed under the following different
operating conditions of the spillways
(a) Both the under sluice spillways opened,
(b) Only left under sluice spillway opened,
(c) Only right under sluice spillway opened,
(d) Only flow overflow spillway operational,
(e) Left under sluice spillway and overflow spillway operational, and
(f) Right under sluice spillway and overflow spillway operational
3.1. Discharging Capacity
a) Both the under sluice spillways opened: The model was run under the full gate opening of the both the under sluice
spillways under different water levels in the reservoir while closing the overflow spillway by polystyrene. Discharge
passing through the spillways was measured for different water levels in the reservoir.
The discharging capacity of both the under sluice spillways with their full gate opening is shown in Figure 7.
At maximum water level of 2545 m, both the under sluice spillways passed 892.5 m3/s, which is much higher than the
estimated PMF of 650 m3/s. The passing discharge at reservoir level of 2543 m was 857.8 m3/s, which is also higher
than the PMF. PMF discharge passed at reservoir level of 2532.75 m. Noted that under the non-opening of the gate of
either of the under sluice spillways due to human and/or mechanical fault, the PMF discharge will not pass through
one under sluice spillway. The discharging capacity of the left and right under sluice spillways with their full gate
opening operated in isolation is shown in Figure 8.

Figure 3. Plan and section of the under sluice spillways

Figure 4. Section f-f' of the overflow spillway
Figure 5. Upstream view of the model Figure 6. Downstream view of the model
b) Only left or right under sluice spillway opened: The model was run under the full gate opening of left or right under
sluice spillway under different water levels in the reservoir. The overflow spillway was closed by polystyrene.
Discharge passing through the spillway was measured for different water levels in the reservoir. At maximum water
level of 2545 m, left under sluice spillway passed 460.43 m3/s which is higher than half of the passed discharge of
892.5 m3/s under opening of both the under sluice spillways. The passing discharge at reservoir level of 2543 m was
446.26 m3/s. At maximum water level of 2545 m, right under sluice spillway passed 439.99 m3/s which is lower than
half of the passed discharge of 892.5 m3/s under opening of both the under sluice spillways. The passing discharge at
reservoir level of 2543 m was 423.90 m3/s.

Figure 7. Discharging capacity of both the under sluice Figure 8. Discharging capacity of left and right under sluice
spillways with their full gate opening spillways with their full gate opening operated in isolation
It is apparent that under the full gate opening, discharging capacity of the left or right under sluice spillway is not
adequate to pass the PMF discharge of 650 m3/s, which necessitates provision of over flow spillway.
It is apparent from Figure 8 that the discharging capacity of the left under sluice spillway is higher than the right under
sluice spillway even though opening of both the spillways is 4 m × 5.5 m and ogee profile is the same. It is to be noted
that the width of bucket part of the left spillway is higher than the right spillway, but this may not be a reason of higher
discharging capacity of the left spillway as the flow downstream of the ogee is supercritical (Chanson, 2004; French,
1985). This shall be attributed to the influence of the presence of the solid boundary at the entrance of both the
spillways (Hussain et al., 2013 and 2014). As the presence of the solid boundary near the inlet of the right spillway
is higher than the left spillway, the former discharging capacity is about 5 % lower than the latter one.
c) Only overflow spillway operations: The model was run for flow through over flow spillway under different
water levels in the reservoir. The gates of both the under sluice spillways were closed. The discharges passed through
the overflow spillway at different reservoir levels are shown in Figure 9. It may be noted that at the maximum water
level of 2545 m, the overflow spillway passed 273.63 m3/s while the passing discharge at reservoir level of 2544 m
was 162 m3/s.
d) Left or right under sluice spillway and overflow spillway operations: The model was run for full gate opening of
the left or right under sluice spillway and flow through over flow spillway under different water levels in the reservoir
while the gate of the right under sluice spillway was closed. Discharge passing through left under sluice spillway and
overflow spillway was measured for different water levels in the reservoir.
The combined discharging capacity of the left and right under sluice spillway and overflow spillway is shown in
Figure 10. At maximum water level of 2545 m, both the left and right under sluice spillway and overflow spillway
jointly pass discharge more than the PMF. As evident from Figure 10, the combined discharging capacity of the left
under sluice spillway and overflow spillway is higher than the right under sluice spillway and overflow spillway,
which can be attributed to the pronounce presence of the solid boundary near the inlet of the right under sluice spillway.
Further, it may be noted that the discharging capacity of the joint operation of one under sluice spillway and overflow
spillway is less than the arithmetic sum of the discharges passing through the under sluice spillway and overflow
spillway individually. Lowering in the discharging capacity under joint operation of the under sluice and overflow
spillway is attributed to reduction in influence zone of the each inlet.
The model study on the existing under sluice spillway and the proposed overflow spillway reveals that the discharging
capacity of joint operation of both the under sluice spillways is much higher than the PMF discharge. Further,
discharging capacity of either of the under sluice spillways and proposed overflow spillway pass jointly discharge
higher than the PMF discharge.

Figure 9. Discharging capacity of the overflow spillway
Figure 10. Combined discharging capacity of the left under sluice spillway and overflow spillway
3.2. Cavitation
Cavitation index of the flow over surface of under sluice spillway and overflow spillway at the pressure points for
different operation of the spillways and different discharges were calculated using measured pressure at the pressure
points and flow velocity with the following equation (USBER, 2011; IS 6934, 1998):
gV 2
P-PPindex Cavitation
2
voba +=
Where Pa = Atmospheric pressure (10.3 m of water head); Pob = Observed pressure in m of water head; Pv = Water
vapor pressure (0.24 m of water head at 200 C); and V = Flow velocity (m/s), which was measured using Pitot tube.
As the computed cavitation index at all the pressure points are higher than 0.30, thus, as per IS code 12804:2004, the
flow over the spillway surface will not be subjected to cavitation (Wood, 1991). The ogee profiles of the existing
under sluice spillways and the proposed overflow are in order from the cavitation considerations.
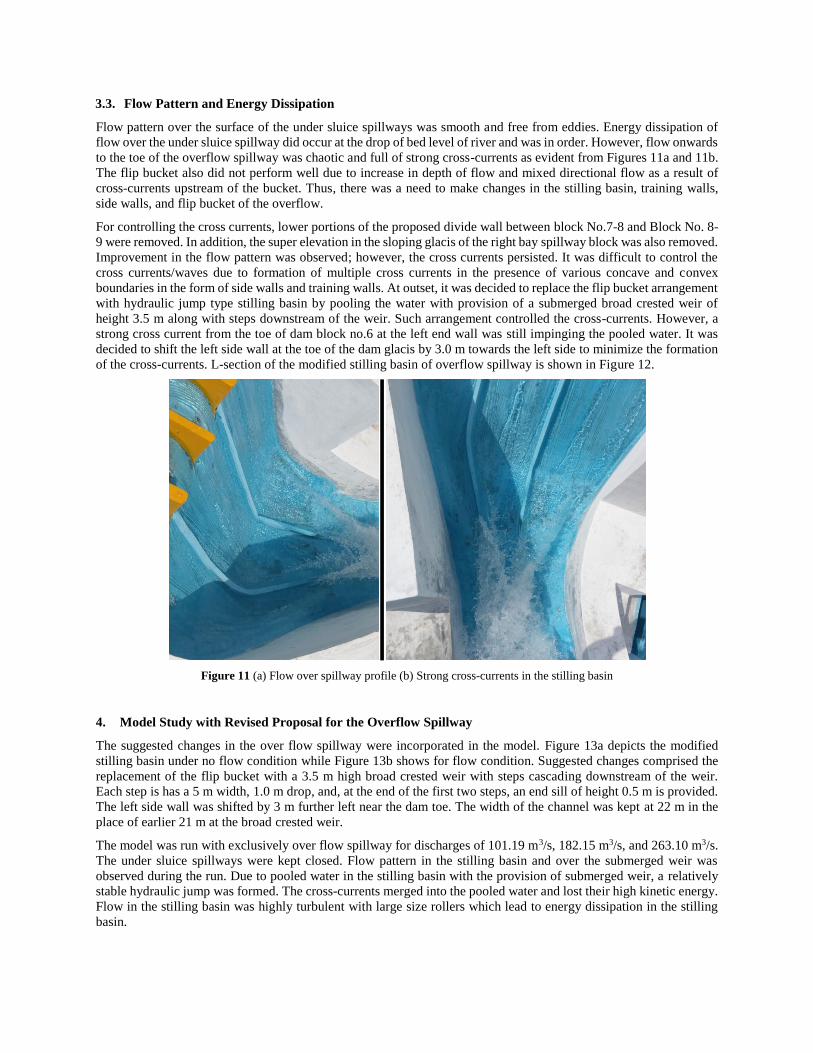
3.3. Flow Pattern and Energy Dissipation
Flow pattern over the surface of the under sluice spillways was smooth and free from eddies. Energy dissipation of
flow over the under sluice spillway did occur at the drop of bed level of river and was in order. However, flow onwards
to the toe of the overflow spillway was chaotic and full of strong cross-currents as evident from Figures 11a and 11b.
The flip bucket also did not perform well due to increase in depth of flow and mixed directional flow as a result of
cross-currents upstream of the bucket. Thus, there was a need to make changes in the stilling basin, training walls,
side walls, and flip bucket of the overflow.
For controlling the cross currents, lower portions of the proposed divide wall between block No.7-8 and Block No. 8-
9 were removed. In addition, the super elevation in the sloping glacis of the right bay spillway block was also removed.
Improvement in the flow pattern was observed; however, the cross currents persisted. It was difficult to control the
cross currents/waves due to formation of multiple cross currents in the presence of various concave and convex
boundaries in the form of side walls and training walls. At outset, it was decided to replace the flip bucket arrangement
with hydraulic jump type stilling basin by pooling the water with provision of a submerged broad crested weir of
height 3.5 m along with steps downstream of the weir. Such arrangement controlled the cross-currents. However, a
strong cross current from the toe of dam block no.6 at the left end wall was still impinging the pooled water. It was
decided to shift the left side wall at the toe of the dam glacis by 3.0 m towards the left side to minimize the formation
of the cross-currents. L-section of the modified stilling basin of overflow spillway is shown in Figure 12.
Figure 11 (a) Flow over spillway profile (b) Strong cross-currents in the stilling basin
4. Model Study with Revised Proposal for the Overflow Spillway
The suggested changes in the over flow spillway were incorporated in the model. Figure 13a depicts the modified
stilling basin under no flow condition while Figure 13b shows for flow condition. Suggested changes comprised the
replacement of the flip bucket with a 3.5 m high broad crested weir with steps cascading downstream of the weir.
Each step is has a 5 m width, 1.0 m drop, and, at the end of the first two steps, an end sill of height 0.5 m is provided.
The left side wall was shifted by 3 m further left near the dam toe. The width of the channel was kept at 22 m in the
place of earlier 21 m at the broad crested weir.
The model was run with exclusively over flow spillway for discharges of 101.19 m3/s, 182.15 m3/s, and 263.10 m3/s.
The under sluice spillways were kept closed. Flow pattern in the stilling basin and over the submerged weir was
observed during the run. Due to pooled water in the stilling basin with the provision of submerged weir, a relatively
stable hydraulic jump was formed. The cross-currents merged into the pooled water and lost their high kinetic energy.
Flow in the stilling basin was highly turbulent with large size rollers which lead to energy dissipation in the stilling
basin.

Figure 12. L-section of the modified stilling basin of the overflow spillway
Figure 13. Modified stilling basin under a) no flow condition; b) flow condition
Flow over the submerged weir was almost uniformly distributed across the width of the channel and was falling onto
each step downstream of the weir. Overall, flow in the stilling basin and over the submerged weir was favorable from
the hydraulic considerations.
Water levels along the right and left side walls were measured under changed scenarios. Initial and modified bed levels
and water level for different discharges along right side wall were measured. It may be noted that from the distance
of 12 m to 52 m from the face of the dam, the revised bed level was lower than the previous bed level. The maximum
observed water level observed in the stilling basin was 2521.8 m. Modified bed levels and the water level for different
discharges along the left side wall were also measured. The maximum water level observed in the stilling basin was
2521 m.
5. Conclusions
Following conclusions have been derived from the model study:
▪ The discharging capacity of joint operation of both the under sluice spillways is much higher than the PMF
discharge. Further, discharging capacity of either of the under sluice spillways and proposed over flow
spillway pass discharge higher than the PMF.

▪ The ogee profiles of the existing under sluice spillways and the proposed overflow are in order from the
cavitation considerations.
▪ Flow onwards to the toe of the overflow spillway was chaotic and full of strong cross-currents. The flip
bucket was also not performing well due to rise in depth of flow and mixed directional flow as a result of
cross-currents upstream of the bucket.
▪ The flip bucket arrangement was replaced with a hydraulic jump type stilling basin by pooling the water with
the provision of a submerged broad crested weir of the height 3.5 m, along with steps downstream of the
weir. The left side wall at the toe of the dam glacis was also shifted by 3.0 m towards the left side to minimize
the formation of the cross-currents. The width of the channel was kept at 22 m in the place of the previous
21 m at the broad crested weir.
▪ The model was run exclusively with overflow spillway for different discharges. Flow pattern in the stilling
basin and over the submerged weir was observed during the run. Due to pooled water in the stilling basin
with the provision of submerged weir, a relatively drowned hydraulic jump was formed. The cross-currents
merged into the pooled water and lost their high kinetic energy. Flow in the stilling basin was highly turbulent
with large size rollers which lead to energy dissipation in the stilling basin.
▪ From this model study, it is concluded that a) a stilling basin for flip bucket shall be designed in such a way
that approaching supercritical flow should be free from the cross-currents to have sound flip bucket action.
Layout of the side walls, divide walls, etc. should be designed accordingly, b) in the case of multiple
intakes/under sluices, operation of one will affect the discharging capacity of the other if not placed
sufficiently apart.
6. References
Ahmad, Z. (2010). Physical model study for spillway of NAFRA Hydro Electric Project, Sew Nafra Power
Corporation Private Limited, 6-3-871, Snehalata, Greenlands Road, Begumet, Hyderabad.
Chanson, H. (2004). The Hydraulics of Open Channel Flow: An Introduction. Elsevier, New York.
Noval, P., Guinot, V., Jeffrey, A., and Reeve, D.E., (2010). Hydraulic Modelling - an Introduction: Priniciples,
Methods and Applications. CRC Press, New York.
French, R.H. (1985). Open Channel Hydraulics, McGraw-Hill, New York.
Hussain, S., Hussain, A., Ahmad, Z. (2013). "Discharge characteristics of orifice type spillways." Hydro International
-2013 conference, IIT Madras, 835-843.
Hussain, S., Hussain, A. and Ahmad, Z. (2014). "Discharge characteristics of orifice spillway under oblique approach
flow." J. Flow Measurement and Instrumentation, Elsevier, Cambridge, United Kingdom, 39, 9-18.
IS 12804:2004. Criteria for estimation of aeration demand for spillway and outlet structures. BIS, Manak Bhavan,
New Delhi.
IS 6934:1998. Hydraulic design of high ogee overflow spillways-recommendations. BIS, Manak Bhavan, New Delhi.
Peterka, A.J. (1984). Hydraulic Design of Stilling Basins and Energy Dissipators. Eng. Monograph No. 25, USBR.
USBR (2011). Design of small dams. A water Resources Technical Publication, USBR.
Wood, I.R. (1991). Air Entrainment in Free-Surface Flows, A.A. Balkema, Rottordam.
Related Documents