Physical model for reset state of Ta 2 O 5 /TiO 2 stacked ReRAM Y. Sakotsubo, M. Terai, S. Kotsuji, T. Sakamoto and H. Hada Device Platforms Res. Labs., NEC Corporation, 1120 Shimokuzawa, Sagamihara, 229-1198 Japan Phone: +81-42-771-2294, Fax: +81-42-771-2481, E-mail: [email protected] Abstract- We investigated the conduction mechanism of a Ta 2 O 5 /TiO 2 stacked resistance random access memory (ReRAM) and found that high reset state resistance can be attributed to tunnel barriers induced in the filament, since single-electron tunneling phenomena were observed at low temperatures and the resistance depended only slightly on temperature. We also found that most of the reset state resistance was induced by the tunnel barrier on the TiO 2 -side, which is preferably formed by anodic oxidation. This resistance was 1,000 times larger than that induced by other tunnel barriers. We found that variations in the resistance were caused by variations in the tunnel barrier width. Keywords: ReRAM, TiO 2 , conduction mechanism, tunnel barrier, single electron tunneling, switching mechanism Introduction Resistance random access memories (ReRAMs) are a promising candidate for use as next-generation nonvolatile memories because of their superior scalability [1]. However, physical models for the resistance change in ReRAMs are still in the development stage. It is commonly considered that resistance change mechanisms can be classified into two types, i.e., “interface type” and “filament type” [2], depending on resistance change materials. Recently, highly resistive states (reset states) achieved in an interface type ReRAM revealed that segregated oxygen atoms at the anode/oxide interface contribute to switching from a low resistance state to a high resistance state [3]. In contrast to interface type ReRAMs, analytical studies on filament type ReRAMs have not yet produced any major breakthroughs or improvements on current devices, while their conduction mechanism and reliability have been discussed in terms of their electrical properties [4, 5]. In this paper, we discuss conduction and resistance change mechanisms of a Ta 2 O 5 /TiO 2 -stacked filament type ReRAM [6] through the use of low temperature electrical measurement and simulation results. We demonstrate that the formation of tunnel barriers is essential for reset operations. Experimental A 1T1R-type ReRAM with a stack comprising a 10 nm thick Ta 2 O 5 layer and a 3 nm thick TiO 2 layer was prepared (Fig. 1). The ReRAM-stack asymmetry leads to high read disturb immunity because anodic oxidation occurs, presumably in the TiO 2 layer, resulting in a bipolar switching mode [6]. The Ta 2 O 5 layer plays an oxygen reservoir role in the stack. Figure 2 shows the process flow of our use of reactive sputtering to form the ultra-thin TiO 2 layer in the ReRAM module. Figure 3 shows the dc switching characteristic of the ReRAM with a control transistor (1T1R). At first, “Forming” operation was applied to the samples to create a filament in the stack. For the “Forming” and “Set” operations (Fig. 3), we applied a positive voltage to the top electrode (V T.E. ) and the gate electrodes (V gate ). In Fig. 3, a bias voltage of 2.5 V was applied to the gate. The resistance in set state (low resistivity state) was controlled by saturation current (I sat ) of the transistor. For the “Reset” operation (Fig. 3), we applied a negative voltage to the top electrode without any control by the transistor. Results and Discussion Properties of Initial and Set states Figure 4 shows typical I-V curves of the initial state (before forming), set state, and reset state for the ReRAM module. The I-V curve in the initial state is consistent with the Poole-Frenkel formula (Fig. 5), meaning that the conduction mechanism of the initial state is a hopping caused by impurities or defects in Ta 2 O 5 or TiO 2 [7, 8]. On the other hand, the current of the set state shows the type of ohmic behavior that is induced by a metallic filament (Fig. 6) [9]. Conduction mechanism of Reset state To ascertain the conduction mechanism of the reset state, we measured the I-V characteristic at low temperatures (4.5~300K) (Fig. 7). As shown in the figure, the I-V curve for any temperature showed a symmetric nonlinear property. In addition, I-V characteristics below 90K were found to have kink structures at -0.23, -0.10, 0.08, and 0.30 V. A kink structure originates from a single-electron tunneling via two or more tunnel barriers (Fig. 8). A tunnel barrier can be characterized by tunnel resistance and capacitance in Amman’s model [10]. In this model, the tunneling probability is set to be constant for the sake of simplicity. We simulated I-V curves with the model (Fig. 9). In Fig. 8, R 1(2) and C 1(2) represent tunnel resistance and capacitance of the top (bottom) side tunnel barrier 1(2), respectively. When R 1 +R 2 =3 Gohm, R 1 /R 2 >>1000, C 1 =0.304 aF, and C 2 =0.904 aF, the kink structure of the simulated I-V curves well matched the experimental results shown in Fig.7. The temperature dependence of the simulated resistance also agreed with the experimental data (Fig. 10). A large (>>1000) R 1 /R 2 ratio means that the resistance of top side tunnel barrier 1 mainly determines the resistance in the reset state. Moreover, the nonlinearity of the I-V characteristic can be explained by considering the energy dependence of the tunnel probability. For simplicity’s sake, we used WKB approximation with a single rectangular tunnel barrier for the simulation of symmetric nonlinear characteristics (Fig. 11) [11]. Resistance variation mechanism of Reset states Figure 12 shows I-V curves in reset states having various resistance levels. The currents were normalized with the current at 0.5 V. Resistance in reset states ranges over several orders of magnitude. Here, we discuss the origin of the variation. A tunnel resistance depends on its barrier height and width. Figure 13 shows the results we obtained in calculating the I-V characteristics by changing the barrier height or barrier width. The currents were normalized at 0.5 V. While an increase in the tunnel barrier width leads to increased nonlinearity (Fig.13a), an increase in the tunnel barrier height leads to decreased nonlinearity (Fig.13b). The nonlinearity trend shown in Fig. 13(b) agreed well with the experimental data shown in Fig. 14. Therefore, it is clear that the variation in the tunnel barrier width contributes to the resistance variation (Fig.15). In addition, it is estimated that the tunnel barrier height is between 0.5 eV and 1.0 eV (dashed lines in Fig.14). We speculate that these values correspond to the energy of the difference between the oxygen vacancy level in the filament and the conduction band-edge in TiO 2 [9]. Major site of variation in resistance From analyzing the kink structures on the I-V curve at low temperature, we found that the major site of variation in the tunnel barrier width is not located at the interface between the bottom electrode and the TiO 2 layer. It is highly possible that it lies at the interface between the Ta 2 O 5 and TiO 2 layers because oxygen ions are supplied from the former. Conclusion We discussed the conduction and resistance change mechanisms of filament type ReRAMs through the use of electrical measurement and simulation results. It was clarified that the resistance changes when two or more tunnel barriers are formed in the filament. Tunneling resistance of the major barrier, which is highly likely to exist at the Ta 2 O 5 /TiO 2 interface, was more than 1,000 times larger than that of the other barrier. It was also found that the resistance in the reset state depends on the width of the tunnel barrier. A physical model we constructed during this study enabled us to design the materials of a ReRAM module and to construct a reliability model. Acknowledgement We would like to express our sincere thanks to Dr. Yasunobu Nakamura and Dr. Shinji Fujieda for the useful advice and consultation they provided during this study. References- [1] I. G. Baek, et al. IEDM Tech.Dig. , p. 587, (2004), [2] A. Sawa, Material Today, Vol.11, p.28, (2008), [3] Z. Wei, et al., IEDM Tech. Dig., p.291, (2008), [4] A. Odagawa, et al. PRB, Vol.70, p.224403, (2004), [5] K. M. Kim, et al., APL, Vol.91, p.012907, (2007), [6] M.Terai, et al., IRPS Tech. Dig., p.134, (2009), [7] E. Atanassova, et al., Microelectronics Reliability, Vol.42, p.157, (2002), [8] H.-J. Kim, et al., Thin Solid Films, Vol.446, p.124, (2004), [9] E. Cho et al., PRB, Vol.73, p.193202, (2006), [10] M.Amman et al. PRB, Vol.43, p.1146, (1991), [11] J. Davies, “The physics of low-dimensional Semiconductors”, Cambridge University Press, (1997) -1204- Extended Abstracts of the 2009 International Conference on Solid State Devices and Materials, Sendai, 2009, pp1204-1205 G-7-2

Welcome message from author
This document is posted to help you gain knowledge. Please leave a comment to let me know what you think about it! Share it to your friends and learn new things together.
Transcript
Physical model for reset state of Ta2O5/TiO2 stacked ReRAM Y. Sakotsubo, M. Terai, S. Kotsuji, T. Sakamoto and H. Hada
Device Platforms Res. Labs., NEC Corporation, 1120 Shimokuzawa, Sagamihara, 229-1198 Japan Phone: +81-42-771-2294, Fax: +81-42-771-2481, E-mail: [email protected]
Abstract- We investigated the conduction mechanism of a Ta2O5/TiO2 stacked resistance random access memory (ReRAM) and found that high reset state resistance can be attributed to tunnel barriers induced in the filament, since single-electron tunneling phenomena were observed at low temperatures and the resistance depended only slightly on temperature. We also found that most of the reset state resistance was induced by the tunnel barrier on the TiO2-side, which is preferably formed by anodic oxidation. This resistance was 1,000 times larger than that induced by other tunnel barriers. We found that variations in the resistance were caused by variations in the tunnel barrier width. Keywords: ReRAM, TiO2, conduction mechanism, tunnel barrier, single electron tunneling, switching mechanism Introduction
Resistance random access memories (ReRAMs) are a promising candidate for use as next-generation nonvolatile memories because of their superior scalability [1]. However, physical models for the resistance change in ReRAMs are still in the development stage. It is commonly considered that resistance change mechanisms can be classified into two types, i.e., “interface type” and “filament type” [2], depending on resistance change materials. Recently, highly resistive states (reset states) achieved in an interface type ReRAM revealed that segregated oxygen atoms at the anode/oxide interface contribute to switching from a low resistance state to a high resistance state [3]. In contrast to interface type ReRAMs, analytical studies on filament type ReRAMs have not yet produced any major breakthroughs or improvements on current devices, while their conduction mechanism and reliability have been discussed in terms of their electrical properties [4, 5].
In this paper, we discuss conduction and resistance change mechanisms of a Ta2O5/TiO2-stacked filament type ReRAM [6] through the use of low temperature electrical measurement and simulation results. We demonstrate that the formation of tunnel barriers is essential for reset operations. Experimental A 1T1R-type ReRAM with a stack comprising a 10 nm thick
Ta2O5 layer and a 3 nm thick TiO2 layer was prepared (Fig. 1). The ReRAM-stack asymmetry leads to high read disturb immunity because anodic oxidation occurs, presumably in the TiO2 layer, resulting in a bipolar switching mode [6]. The Ta2O5 layer plays an oxygen reservoir role in the stack. Figure 2 shows the process flow of our use of reactive sputtering to form the ultra-thin TiO2 layer in the ReRAM module.
Figure 3 shows the dc switching characteristic of the ReRAM with a control transistor (1T1R). At first, “Forming” operation was applied to the samples to create a filament in the stack. For the “Forming” and “Set” operations (Fig. 3), we applied a positive voltage to the top electrode (VT.E.) and the gate electrodes (Vgate). In Fig. 3, a bias voltage of 2.5 V was applied to the gate. The resistance in set state (low resistivity state) was controlled by saturation current (Isat) of the transistor. For the “Reset” operation (Fig. 3), we applied a negative voltage to the top electrode without any control by the transistor. Results and Discussion Properties of Initial and Set states
Figure 4 shows typical I-V curves of the initial state (before forming), set state, and reset state for the ReRAM module. The I-V curve in the initial state is consistent with the Poole-Frenkel formula (Fig. 5), meaning that the conduction mechanism of the initial state is a hopping caused by impurities or defects in Ta2O5 or TiO2 [7, 8]. On the other hand, the current of the set state shows the type of ohmic behavior that is induced by a metallic filament (Fig. 6) [9]. Conduction mechanism of Reset state
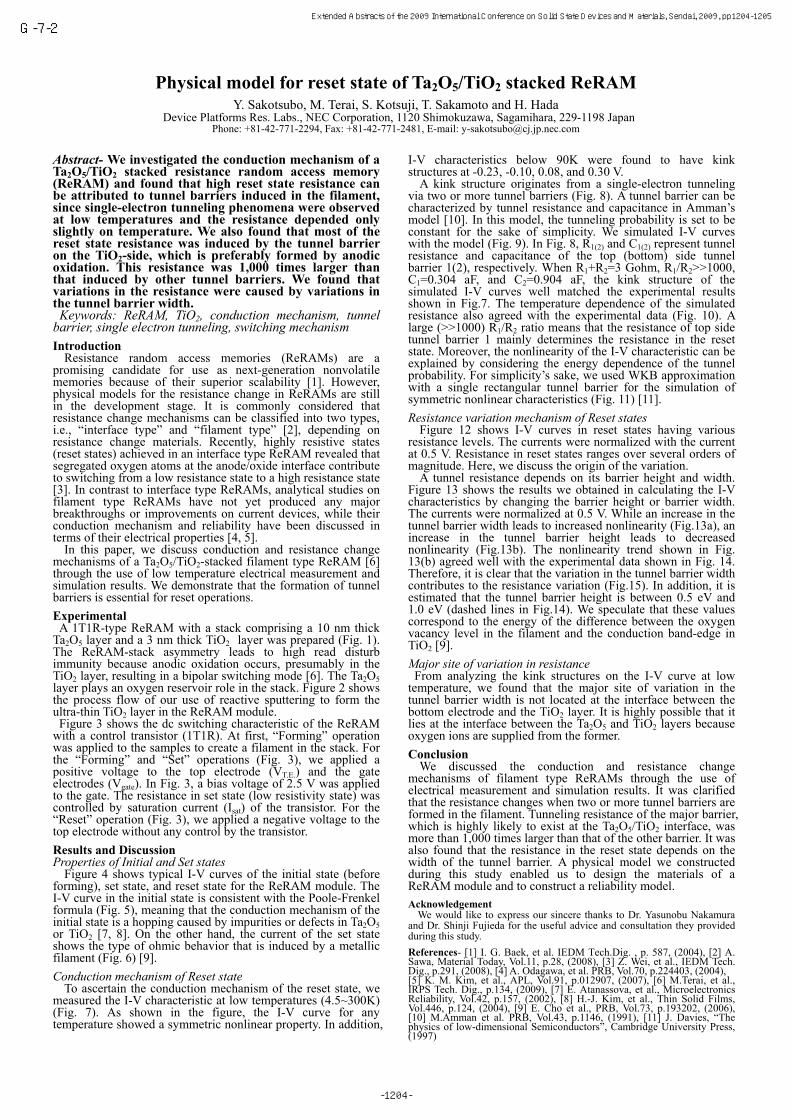
To ascertain the conduction mechanism of the reset state, we measured the I-V characteristic at low temperatures (4.5~300K) (Fig. 7). As shown in the figure, the I-V curve for any temperature showed a symmetric nonlinear property. In addition,
I-V characteristics below 90K were found to have kink structures at -0.23, -0.10, 0.08, and 0.30 V.
A kink structure originates from a single-electron tunneling via two or more tunnel barriers (Fig. 8). A tunnel barrier can be characterized by tunnel resistance and capacitance in Amman’s model [10]. In this model, the tunneling probability is set to be constant for the sake of simplicity. We simulated I-V curves with the model (Fig. 9). In Fig. 8, R1(2) and C1(2) represent tunnel resistance and capacitance of the top (bottom) side tunnel barrier 1(2), respectively. When R1+R2=3 Gohm, R1/R2>>1000, C1=0.304 aF, and C2=0.904 aF, the kink structure of the simulated I-V curves well matched the experimental results shown in Fig.7. The temperature dependence of the simulated resistance also agreed with the experimental data (Fig. 10). A large (>>1000) R1/R2 ratio means that the resistance of top side tunnel barrier 1 mainly determines the resistance in the reset state. Moreover, the nonlinearity of the I-V characteristic can be explained by considering the energy dependence of the tunnel probability. For simplicity’s sake, we used WKB approximation with a single rectangular tunnel barrier for the simulation of symmetric nonlinear characteristics (Fig. 11) [11]. Resistance variation mechanism of Reset states
Figure 12 shows I-V curves in reset states having various resistance levels. The currents were normalized with the current at 0.5 V. Resistance in reset states ranges over several orders of magnitude. Here, we discuss the origin of the variation.
A tunnel resistance depends on its barrier height and width. Figure 13 shows the results we obtained in calculating the I-V characteristics by changing the barrier height or barrier width. The currents were normalized at 0.5 V. While an increase in the tunnel barrier width leads to increased nonlinearity (Fig.13a), an increase in the tunnel barrier height leads to decreased nonlinearity (Fig.13b). The nonlinearity trend shown in Fig. 13(b) agreed well with the experimental data shown in Fig. 14. Therefore, it is clear that the variation in the tunnel barrier width contributes to the resistance variation (Fig.15). In addition, it is estimated that the tunnel barrier height is between 0.5 eV and 1.0 eV (dashed lines in Fig.14). We speculate that these values correspond to the energy of the difference between the oxygen vacancy level in the filament and the conduction band-edge in TiO2 [9]. Major site of variation in resistance From analyzing the kink structures on the I-V curve at low
temperature, we found that the major site of variation in the tunnel barrier width is not located at the interface between the bottom electrode and the TiO2 layer. It is highly possible that it lies at the interface between the Ta2O5 and TiO2 layers because oxygen ions are supplied from the former. Conclusion
We discussed the conduction and resistance change mechanisms of filament type ReRAMs through the use of electrical measurement and simulation results. It was clarified that the resistance changes when two or more tunnel barriers are formed in the filament. Tunneling resistance of the major barrier, which is highly likely to exist at the Ta2O5/TiO2 interface, was more than 1,000 times larger than that of the other barrier. It was also found that the resistance in the reset state depends on the width of the tunnel barrier. A physical model we constructed during this study enabled us to design the materials of a ReRAM module and to construct a reliability model. Acknowledgement
We would like to express our sincere thanks to Dr. Yasunobu Nakamura and Dr. Shinji Fujieda for the useful advice and consultation they provided during this study. References- [1] I. G. Baek, et al. IEDM Tech.Dig. , p. 587, (2004), [2] A. Sawa, Material Today, Vol.11, p.28, (2008), [3] Z. Wei, et al., IEDM Tech. Dig., p.291, (2008), [4] A. Odagawa, et al. PRB, Vol.70, p.224403, (2004), [5] K. M. Kim, et al., APL, Vol.91, p.012907, (2007), [6] M.Terai, et al., IRPS Tech. Dig., p.134, (2009), [7] E. Atanassova, et al., Microelectronics Reliability, Vol.42, p.157, (2002), [8] H.-J. Kim, et al., Thin Solid Films, Vol.446, p.124, (2004), [9] E. Cho et al., PRB, Vol.73, p.193202, (2006), [10] M.Amman et al. PRB, Vol.43, p.1146, (1991), [11] J. Davies, “The physics of low-dimensional Semiconductors”, Cambridge University Press, (1997)
-1204-
Extended Abstracts of the 2009 International Conference on Solid State Devices and Materials, Sendai, 2009, pp1204-1205
G-7-2

BH:0.5eV
BH:1.0eV
1
1.5
2
2.5
3
101 103 105 107 109
n
Resistance (arb. unit)
Φ: 0.5 eV
Φ: 1.0 eV
Cal.
0
20
40
0 50 100 150 200 250Resistance (arb. uni
t)
1000/T (1000/K)
0
20
40
0.10V
0.12V
0.14V
0.16V
0.18V
0.20V
0.22V
0.24V
Fig.10 Temperature dependencies of the resistance estimated at the difference bias voltages (top: Exp. data, bottom: Simulation [10])
Fig.9 Simulated I-V and <N>-V characteristics obtained using the double tunnel barrier model (T(E)=T0). “<N>” is the number of average excess electrons in the island between double tunnel barriers.
-0.1
0
0.1
-0.4 -0.2 0 0.2 0.4
4.5K6.5K12K20K40K60K90K140K200K300K
Curr
ent
(nA)
Voltage (V)
-1
0
1
<N>
-0.01
0
0.01
-0.1 0 0.1
Cal.
Cal.
Fig.7 Temperature dependencies of the reset state I-V characteristic
-0.4
-0.2
0
0.2
0.4
-0.4 -0.2 0 0.2 0.4
4.5K6.5K12K20K40K60K90K140K200K300K
Curr
ent
(nA)
Voltage (V)
-0.1 0 0.1
e/C1
e/C2
Exp.
-0.002
-0.001
0
0.001
0.002
-0.4 -0.2 0 0.2 0.4
Curre
nt (
A)
Voltage (V)Fig.6 I-V characteristic in set state. Inset shows a schematic energy diagram of the set state.
Conduction band
Valence band
Impurity band
T.E.B.E.Switching layer
Conduction band
Valence band
Impurity band
T.E.B.E.Switching layer
Exp.
Fig.15 Schematic energy diagrams of the resistance variation: (a) Set state. (b, c) Reset state (d1<d2)
Conduction band
Valence band
T.E.B.E.Switching layer
Impurity band
Conduction band
Valence band
T.E.B.E.Switching layer
Impurity band
Conduction band
Valence band
T.E.B.E.
d1
Conduction band
Valence band
T.E.B.E.
d1 d2
Φ
Conduction band
Valence band
T.E.B.E.
d2
Φ
Conduction band
Valence band
T.E.B.E.
(a) (b) (c)
Fig.11 Nonlinear I-V characteristic simulated by the single tunnel barrier model (T(E): WKB approximation [11])
-1
-0.5
0
0.5
1
-0.4 -0.2 0 0.2 0.4
Current (arb. unit)
Voltage (V)
x
E Tunnel barrier I
T.E. sideB.E. side
eV
Φ : 1.0eV
d : 1.0nm
Φ
d
-1
-0.5
0
0.5
1
-0.4 -0.2 0 0.2 0.4
Current (arb. unit)
Voltage (V)
x
E Tunnel barrier I
T.E. sideB.E. side
x
E Tunnel barrier I
T.E. sideB.E. side
eVeV
Φ : 1.0eV
d : 1.0nm
Φ
d
Cal.
Exp.
x
E
Tunnel barrier IITunnel barrier I
T.E. sideB.E. side
x
E
Tunnel barrier IITunnel barrier I
T.E. sideB.E. side
Fig.8 Energy diagram of the double tunnel barrier model and junction parameters [10]
(R1,C1)(R2,C2)
Fig.1 Schematic and TEM image of the 1T1R device [6]
Ru
Ru
T.E.
B.E.
Ta2O5
TiO2
VGate
VT.E.
VS
V T.E. <0(Reset)
V T.E. >0(Set)
TiO2
Ta2O5
Ru
Ru
Ru
Ru
T.E.
B.E.
Ta2O5
TiO2
VGate
VT.E.
VS
V T.E. <0(Reset)
V T.E. >0(Set)
T.E.
B.E.
Ta2O5
TiO2
VGate
VT.E.
VS
V T.E. <0(Reset)
V T.E. >0(Set)
TiO2
Ta2O5
Exp.
Bottom electrode
TiO2 reactivesputter (300 oC)
Ta2O5 PVD (350 C)
Top electrode
Ru PVD (RT)
o
Ru PVD (RT)
Fig.2 ReRAM module process flow [6]
ReRAMmodule
0 1 2 310-1310-1210-1110-1010-910-810-710-610-510-4
V (V)
I(A)
Set
Reset
Initial
Reset state:after reset operation
Set state:after forming or set operation
Initial state:before forming
T.E.
B.E.
0 1 2 310-1310-1210-1110-1010-910-810-710-610-510-4
V (V)
I(A)
Set
Reset
Initial
0 1 2 310-1310-1210-1110-1010-910-810-710-610-510-4
V (V)
I(A)
Set
Reset
Initial
0 1 2 310-1310-1210-1110-1010-910-810-710-610-510-4
V (V)
I(A)
Set
Reset
Initial
Reset state:after reset operation
Set state:after forming or set operation
Initial state:before forming
T.E.
B.E.
T.E.
B.E.
Fig.4 I-V curves of “initial”, “set”and “reset” states for the ReRAMmodule
Exp.
Fig.3 Typical dc switching characteristics for the 1T1R-type ReRAM
0 2 4
-100
0
100
VT.E. (V)
I T.E.
(μA)
Reset
FormingSet
Isat
0 2 4
-100
0
100
VT.E. (V)
I T.E.
(μA)
Reset
FormingSet
Isat
Fig.12 I-V characteristics of the reset state having various resistance levels
10-3
10-2
10-1
100
10-3 10-2 10-1 100
Curre
nt (
arb.
unit)
Voltage (V)
n=1
n=3
Reset states
Set states
Exp.
1
1.5
2
2.5
3
101 103 105 107 109
n
Resistance (arb. unit)
Fig.5 I-V characteristics in initial state (P-F plots). Inset shows a schematic energy diagram of the initial state.
10-8
10-7
10-6
10-5
10-4
10-3
10-2
10-1
100
10000 20000 30000
J(A/
m2)/
E(V/m)
E1/2((V/m)1/2)
P-F PlotP-F plot
10-8
10-7
10-6
10-5
10-4
10-3
10-2
10-1
100
10000 20000 30000
J(A/
m2)/
E(V/m)
E1/2((V/m)1/2)
P-F PlotP-F plot
Conduction band
Valence band
Impurity states
T.E.B.E.Switching layer
Conduction band
Valence band
Impurity states
T.E.B.E.Switching layer
Exp.
Cal.
(b)
Fig.14 Nonlinearities of the I-V reset states’ characteristics. Open circles show experimental data. Dashed lines show simulation results: (a) Set state, (b, c) Reset states
(a)
(b)
(c)
Fig.13 Tunnel barrier shape dependencies of the I-V characteristic. We define the nonlinearity “n” as I=αVn (between 0.4V and 0.5V), where α is the proportional constant. (a) Barrier height dependencies, (b) Barrier width dependencies
10-3
10-2
10-1
100
0.001 0.01 0.1 1
0.5eV1.0eV1.5eV2.0eVCu
rrent (arb. unit)
Voltage (V)
d: 1.0 nm
Φ : 2.0 eV
Φ : 0.5 eV
10-3
10-2
10-1
100
0.001 0.01 0.1 1
0.5eV1.0eV1.5eV2.0eVCu
rrent (arb. unit)
Voltage (V)
d: 1.0 nm
Φ : 2.0 eV
Φ : 0.5 eV
Cal.(a)
10-3
10-2
10-1
100
0.001 0.01 0.1 1
0.2nm0.4nm0.6nm0.8nm1.0nm1.2nm1.4nm1.6nm1.8nm2.0nmC
urrent (arb. unit
)
Voltage (V)
d: 2.0 nm
Φ: 0.5 eV
d: 0.2 nm
10-3
10-2
10-1
100
0.001 0.01 0.1 1
0.2nm0.4nm0.6nm0.8nm1.0nm1.2nm1.4nm1.6nm1.8nm2.0nmC
urrent (arb. unit
)
Voltage (V)
d: 2.0 nm
Φ: 0.5 eV
d: 0.2 nm
BH:0.5eV
BH:1.0eV
1
1.5
2
2.5
3
101 103 105 107 109
n
Resistance (arb. unit)
Φ: 0.5 eV
Φ: 1.0 eV
Cal.
0
20
40
0 50 100 150 200 250Resistance (arb. uni
t)
1000/T (1000/K)
0
20
40
0.10V
0.12V
0.14V
0.16V
0.18V
0.20V
0.22V
0.24V
Fig.10 Temperature dependencies of the resistance estimated at the difference bias voltages (top: Exp. data, bottom: Simulation [10])
Fig.9 Simulated I-V and <N>-V characteristics obtained using the double tunnel barrier model (T(E)=T0). “<N>” is the number of average excess electrons in the island between double tunnel barriers.
-0.1
0
0.1
-0.4 -0.2 0 0.2 0.4
4.5K6.5K12K20K40K60K90K140K200K300K
Curr
ent
(nA)
Voltage (V)
-1
0
1
<N>
-0.01
0
0.01
-0.1 0 0.1
Cal.
Cal.
0
20
40
0 50 100 150 200 250Resistance (arb. uni
t)
1000/T (1000/K)
0
20
40
0.10V
0.12V
0.14V
0.16V
0.18V
0.20V
0.22V
0.24V
Fig.10 Temperature dependencies of the resistance estimated at the difference bias voltages (top: Exp. data, bottom: Simulation [10])
0
20
40
0 50 100 150 200 250Resistance (arb. uni
t)
1000/T (1000/K)
0
20
40
0.10V
0.12V
0.14V
0.16V
0.18V
0.20V
0.22V
0.24V
Fig.10 Temperature dependencies of the resistance estimated at the difference bias voltages (top: Exp. data, bottom: Simulation [10])
Fig.9 Simulated I-V and <N>-V characteristics obtained using the double tunnel barrier model (T(E)=T0). “<N>” is the number of average excess electrons in the island between double tunnel barriers.
-0.1
0
0.1
-0.4 -0.2 0 0.2 0.4
4.5K6.5K12K20K40K60K90K140K200K300K
Curr
ent
(nA)
Voltage (V)
-1
0
1
<N>
-0.01
0
0.01
-0.1 0 0.1
Cal.
Cal.
Fig.7 Temperature dependencies of the reset state I-V characteristic
-0.4
-0.2
0
0.2
0.4
-0.4 -0.2 0 0.2 0.4
4.5K6.5K12K20K40K60K90K140K200K300K
Curr
ent
(nA)
Voltage (V)
-0.1 0 0.1
e/C1
e/C2
Exp.
Fig.7 Temperature dependencies of the reset state I-V characteristic
-0.4
-0.2
0
0.2
0.4
-0.4 -0.2 0 0.2 0.4
4.5K6.5K12K20K40K60K90K140K200K300K
Curr
ent
(nA)
Voltage (V)
-0.1 0 0.1
e/C1
e/C2
Exp.
-0.002
-0.001
0
0.001
0.002
-0.4 -0.2 0 0.2 0.4
Curre
nt (
A)
Voltage (V)Fig.6 I-V characteristic in set state. Inset shows a schematic energy diagram of the set state.
Conduction band
Valence band
Impurity band
T.E.B.E.Switching layer
Conduction band
Valence band
Impurity band
T.E.B.E.Switching layer
Exp.
Fig.15 Schematic energy diagrams of the resistance variation: (a) Set state. (b, c) Reset state (d1<d2)
Conduction band
Valence band
T.E.B.E.Switching layer
Impurity band
Conduction band
Valence band
T.E.B.E.Switching layer
Impurity band
Conduction band
Valence band
T.E.B.E.
d1
Conduction band
Valence band
T.E.B.E.
d1 d2
Φ
Conduction band
Valence band
T.E.B.E.
d2
Φ
Conduction band
Valence band
T.E.B.E.
(a) (b) (c)
Fig.11 Nonlinear I-V characteristic simulated by the single tunnel barrier model (T(E): WKB approximation [11])
-1
-0.5
0
0.5
1
-0.4 -0.2 0 0.2 0.4
Current (arb. unit)
Voltage (V)
x
E Tunnel barrier I
T.E. sideB.E. side
eV
Φ : 1.0eV
d : 1.0nm
Φ
d
-1
-0.5
0
0.5
1
-0.4 -0.2 0 0.2 0.4
Current (arb. unit)
Voltage (V)
x
E Tunnel barrier I
T.E. sideB.E. side
x
E Tunnel barrier I
T.E. sideB.E. side
eVeV
Φ : 1.0eV
d : 1.0nm
Φ
d
Cal.
-1
-0.5
0
0.5
1
-0.4 -0.2 0 0.2 0.4
Current (arb. unit)
Voltage (V)
x
E Tunnel barrier I
T.E. sideB.E. side
eV
Φ : 1.0eV
d : 1.0nm
Φ
d
-1
-0.5
0
0.5
1
-0.4 -0.2 0 0.2 0.4
Current (arb. unit)
Voltage (V)
x
E Tunnel barrier I
T.E. sideB.E. side
x
E Tunnel barrier I
T.E. sideB.E. side
eVeV
Φ : 1.0eV
d : 1.0nm
Φ
d
Cal.
Exp.
x
E
Tunnel barrier IITunnel barrier I
T.E. sideB.E. side
x
E
Tunnel barrier IITunnel barrier I
T.E. sideB.E. side
Fig.8 Energy diagram of the double tunnel barrier model and junction parameters [10]
(R1,C1)(R2,C2)
Exp.
x
E
Tunnel barrier IITunnel barrier I
T.E. sideB.E. side
x
E
Tunnel barrier IITunnel barrier I
T.E. sideB.E. side
Fig.8 Energy diagram of the double tunnel barrier model and junction parameters [10]
x
E
Tunnel barrier IITunnel barrier I
T.E. sideB.E. side
x
E
Tunnel barrier IITunnel barrier I
T.E. sideB.E. side
Fig.8 Energy diagram of the double tunnel barrier model and junction parameters [10]
(R1,C1)(R2,C2)
Fig.1 Schematic and TEM image of the 1T1R device [6]
Ru
Ru
T.E.
B.E.
Ta2O5
TiO2
VGate
VT.E.
VS
V T.E. <0(Reset)
V T.E. >0(Set)
TiO2
Ta2O5
Ru
Ru
Ru
Ru
T.E.
B.E.
Ta2O5
TiO2
VGate
VT.E.
VS
V T.E. <0(Reset)
V T.E. >0(Set)
T.E.
B.E.
Ta2O5
TiO2
VGate
VT.E.
VS
V T.E. <0(Reset)
V T.E. >0(Set)
TiO2
Ta2O5
Exp.
Bottom electrode
TiO2 reactivesputter (300 oC)
Ta2O5 PVD (350 C)
Top electrode
Ru PVD (RT)
o
Ru PVD (RT)
Fig.2 ReRAM module process flow [6]
ReRAMmodule
Fig.1 Schematic and TEM image of the 1T1R device [6]
Ru
Ru
T.E.
B.E.
Ta2O5
TiO2
VGate
VT.E.
VS
V T.E. <0(Reset)
V T.E. >0(Set)
TiO2
Ta2O5
Ru
Ru
Ru
Ru
T.E.
B.E.
Ta2O5
TiO2
VGate
VT.E.
VS
V T.E. <0(Reset)
V T.E. >0(Set)
T.E.
B.E.
Ta2O5
TiO2
VGate
VT.E.
VS
V T.E. <0(Reset)
V T.E. >0(Set)
TiO2
Ta2O5
Exp.
Bottom electrode
TiO2 reactivesputter (300 oC)
Ta2O5 PVD (350 C)
Top electrode
Ru PVD (RT)
o
Ru PVD (RT)
Bottom electrode
TiO2 reactivesputter (300 oC)
Ta2O5 PVD (350 C)
Top electrode
Ru PVD (RT)
o
Ru PVD (RT)
Fig.2 ReRAM module process flow [6]
ReRAMmodule
0 1 2 310-1310-1210-1110-1010-910-810-710-610-510-4
V (V)
I(A)
Set
Reset
Initial
Reset state:after reset operation
Set state:after forming or set operation
Initial state:before forming
T.E.
B.E.
0 1 2 310-1310-1210-1110-1010-910-810-710-610-510-4
V (V)
I(A)
Set
Reset
Initial
0 1 2 310-1310-1210-1110-1010-910-810-710-610-510-4
V (V)
I(A)
Set
Reset
Initial
0 1 2 310-1310-1210-1110-1010-910-810-710-610-510-4
V (V)
I(A)
Set
Reset
Initial
Reset state:after reset operation
Set state:after forming or set operation
Initial state:before forming
T.E.
B.E.
T.E.
B.E.
Fig.4 I-V curves of “initial”, “set”and “reset” states for the ReRAMmodule
Exp.
Fig.3 Typical dc switching characteristics for the 1T1R-type ReRAM
0 2 4
-100
0
100
VT.E. (V)
I T.E.
(μA)
Reset
FormingSet
Isat
0 2 4
-100
0
100
VT.E. (V)
I T.E.
(μA)
Reset
FormingSet
Isat
0 1 2 310-1310-1210-1110-1010-910-810-710-610-510-4
V (V)
I(A)
Set
Reset
Initial
Reset state:after reset operation
Set state:after forming or set operation
Initial state:before forming
T.E.
B.E.
0 1 2 310-1310-1210-1110-1010-910-810-710-610-510-4
V (V)
I(A)
Set
Reset
Initial
0 1 2 310-1310-1210-1110-1010-910-810-710-610-510-4
V (V)
I(A)
Set
Reset
Initial
0 1 2 310-1310-1210-1110-1010-910-810-710-610-510-4
V (V)
I(A)
Set
Reset
Initial
Reset state:after reset operation
Set state:after forming or set operation
Initial state:before forming
T.E.
B.E.
T.E.
B.E.
Fig.4 I-V curves of “initial”, “set”and “reset” states for the ReRAMmodule
Exp.
0 1 2 310-1310-1210-1110-1010-910-810-710-610-510-4
V (V)
I(A)
Set
Reset
Initial
Reset state:after reset operation
Set state:after forming or set operation
Initial state:before forming
T.E.
B.E.
0 1 2 310-1310-1210-1110-1010-910-810-710-610-510-4
V (V)
I(A)
Set
Reset
Initial
0 1 2 310-1310-1210-1110-1010-910-810-710-610-510-4
V (V)
I(A)
Set
Reset
Initial
0 1 2 310-1310-1210-1110-1010-910-810-710-610-510-4
V (V)
I(A)
Set
Reset
Initial
Reset state:after reset operation
Set state:after forming or set operation
Initial state:before forming
T.E.
B.E.
T.E.
B.E.
Fig.4 I-V curves of “initial”, “set”and “reset” states for the ReRAMmodule
Exp.
Fig.3 Typical dc switching characteristics for the 1T1R-type ReRAM
0 2 4
-100
0
100
VT.E. (V)
I T.E.
(μA)
Reset
FormingSet
Isat
0 2 4
-100
0
100
VT.E. (V)
I T.E.
(μA)
Reset
FormingSet
Isat
Fig.3 Typical dc switching characteristics for the 1T1R-type ReRAM
0 2 4
-100
0
100
VT.E. (V)
I T.E.
(μA)
Reset
FormingSet
Isat
0 2 4
-100
0
100
VT.E. (V)
I T.E.
(μA)
Reset
FormingSet
Isat
Fig.12 I-V characteristics of the reset state having various resistance levels
10-3
10-2
10-1
100
10-3 10-2 10-1 100
Curre
nt (
arb.
unit)
Voltage (V)
n=1
n=3
Reset states
Set states
Exp.
1
1.5
2
2.5
3
101 103 105 107 109
n
Resistance (arb. unit)
Fig.12 I-V characteristics of the reset state having various resistance levels
10-3
10-2
10-1
100
10-3 10-2 10-1 100
Curre
nt (
arb.
unit)
Voltage (V)
n=1
n=3
Reset states
Set states
10-3
10-2
10-1
100
10-3 10-2 10-1 100
Curre
nt (
arb.
unit)
Voltage (V)
n=1
n=3
Reset statesReset states
Set statesSet states
Exp.
1
1.5
2
2.5
3
101 103 105 107 109
n
Resistance (arb. unit)
Fig.5 I-V characteristics in initial state (P-F plots). Inset shows a schematic energy diagram of the initial state.
10-8
10-7
10-6
10-5
10-4
10-3
10-2
10-1
100
10000 20000 30000
J(A/
m2)/
E(V/m)
E1/2((V/m)1/2)
P-F PlotP-F plot
10-8
10-7
10-6
10-5
10-4
10-3
10-2
10-1
100
10000 20000 30000
J(A/
m2)/
E(V/m)
E1/2((V/m)1/2)
P-F PlotP-F plot
Conduction band
Valence band
Impurity states
T.E.B.E.Switching layer
Conduction band
Valence band
Impurity states
T.E.B.E.Switching layer
Exp.
Cal.
(b)
Fig.14 Nonlinearities of the I-V reset states’ characteristics. Open circles show experimental data. Dashed lines show simulation results: (a) Set state, (b, c) Reset states
(a)
(b)
(c)
Fig.13 Tunnel barrier shape dependencies of the I-V characteristic. We define the nonlinearity “n” as I=αVn (between 0.4V and 0.5V), where α is the proportional constant. (a) Barrier height dependencies, (b) Barrier width dependencies
10-3
10-2
10-1
100
0.001 0.01 0.1 1
0.5eV1.0eV1.5eV2.0eVCu
rrent (arb. unit)
Voltage (V)
d: 1.0 nm
Φ : 2.0 eV
Φ : 0.5 eV
10-3
10-2
10-1
100
0.001 0.01 0.1 1
0.5eV1.0eV1.5eV2.0eVCu
rrent (arb. unit)
Voltage (V)
d: 1.0 nm
Φ : 2.0 eV
Φ : 0.5 eV
Cal.(a)
10-3
10-2
10-1
100
0.001 0.01 0.1 1
0.2nm0.4nm0.6nm0.8nm1.0nm1.2nm1.4nm1.6nm1.8nm2.0nmC
urrent (arb. unit
)
Voltage (V)
d: 2.0 nm
Φ: 0.5 eV
d: 0.2 nm
10-3
10-2
10-1
100
0.001 0.01 0.1 1
0.2nm0.4nm0.6nm0.8nm1.0nm1.2nm1.4nm1.6nm1.8nm2.0nmC
urrent (arb. unit
)
Voltage (V)
d: 2.0 nm
Φ: 0.5 eV
d: 0.2 nm
Fig.13 Tunnel barrier shape dependencies of the I-V characteristic. We define the nonlinearity “n” as I=αVn (between 0.4V and 0.5V), where α is the proportional constant. (a) Barrier height dependencies, (b) Barrier width dependencies
10-3
10-2
10-1
100
0.001 0.01 0.1 1
0.5eV1.0eV1.5eV2.0eVCu
rrent (arb. unit)
Voltage (V)
d: 1.0 nm
Φ : 2.0 eV
Φ : 0.5 eV
10-3
10-2
10-1
100
0.001 0.01 0.1 1
0.5eV1.0eV1.5eV2.0eVCu
rrent (arb. unit)
Voltage (V)
d: 1.0 nm
Φ : 2.0 eV
Φ : 0.5 eV
Cal.(a)
10-3
10-2
10-1
100
0.001 0.01 0.1 1
0.5eV1.0eV1.5eV2.0eVCu
rrent (arb. unit)
Voltage (V)
d: 1.0 nm
Φ : 2.0 eV
Φ : 0.5 eV
10-3
10-2
10-1
100
0.001 0.01 0.1 1
0.5eV1.0eV1.5eV2.0eVCu
rrent (arb. unit)
Voltage (V)
d: 1.0 nm
Φ : 2.0 eV
Φ : 0.5 eV
Cal.(a)
10-3
10-2
10-1
100
0.001 0.01 0.1 1
0.2nm0.4nm0.6nm0.8nm1.0nm1.2nm1.4nm1.6nm1.8nm2.0nmC
urrent (arb. unit
)
Voltage (V)
d: 2.0 nm
Φ: 0.5 eV
d: 0.2 nm
10-3
10-2
10-1
100
0.001 0.01 0.1 1
0.2nm0.4nm0.6nm0.8nm1.0nm1.2nm1.4nm1.6nm1.8nm2.0nmC
urrent (arb. unit
)
Voltage (V)
d: 2.0 nm
Φ: 0.5 eV
d: 0.2 nm
10-3
10-2
10-1
100
0.001 0.01 0.1 1
0.2nm0.4nm0.6nm0.8nm1.0nm1.2nm1.4nm1.6nm1.8nm2.0nmC
urrent (arb. unit
)
Voltage (V)
d: 2.0 nm
Φ: 0.5 eV
d: 0.2 nm
10-3
10-2
10-1
100
0.001 0.01 0.1 1
0.2nm0.4nm0.6nm0.8nm1.0nm1.2nm1.4nm1.6nm1.8nm2.0nmC
urrent (arb. unit
)
Voltage (V)
d: 2.0 nm
Φ: 0.5 eV
d: 0.2 nm
-1205-
Related Documents