Geophys. J. R. astr. Soc. (1984) 79,469-488 Physical links between crustal deformation, seismic moment and seismic hazard for regions of varying seismicity 1 an G . MainNatural Environment Research Council, British Geological Survey, Murchison House, West Mains Road, Edinburgh EH9 3LA, and University of Edinburgh, Department of Geophysics, James Clerk Maxwell Building, Mayfield Road, Edinburgh EH9 3JZ, Scotland Paul w . Burt on Natural Environment Research Council, British Geological Survey, Murchison House, West Mains Road, Edinburgh EH9 3LA Received 1984 March 8 ; in original form 1984 January 13 Summary. Seismic moment release rates Mo inferred from a Weibull frequency-magnitude distribution and its extreme value equivalent are compared with observation. The seismotectonically diverse regions studied all exhibit the curvature of a loglinear frequency magnitude plot associated with applying a maximum magnitude to earthquake recurrence statistics. The inferred seismic moment release rates are consistent with available crustal deformation data within uncertainties resulting from the line fit and in magni- tude determination. The uncertainties for the regions studied (Southern California, the New Madrid seismic zone, the Central and Eastern Mediter- ranean and mainland UK) vary from at worst an order of magnitude down to a factor of 2 or 3. This agreement can be used to justify the extrapolation of frequency- magnitude statistics beyond the historical and instrumental era in seismic hazard studies as a test of the stationarity of short-term statistics against long-term effects. A striking example of a bimodal seismicity distribution is observed in the New Madrid zone. This can be interpreted as being due to the superposition of two distinct seismogenic source types observed in the area. A quantitative analysis of the separate orders of seismicity observed in the frequency- magnitude statistics - comparing the different maximum magnitudes and inferred seismic moment release rates with those observed - supports this hypothesis. Superposition of many such seismogenic sources can explain the linearity observed in global frequency versus seismic moment magnitude statistics. Introduction The incorporation of crustal deformation into analyses of seismic hazard has given useful insight into probabilities of the largest events associated with long time periods. By linking at Edinburgh University on July 28, 2015 http://gji.oxfordjournals.org/ Downloaded from

Welcome message from author
This document is posted to help you gain knowledge. Please leave a comment to let me know what you think about it! Share it to your friends and learn new things together.
Transcript
Geophys. J. R. astr. Soc. (1984) 79,469-488
Physical links between crustal deformation, seismic moment and seismic hazard for regions of varying seismicity
1 an G . M a i n N a t u r a l Environment Research Council, British Geological Survey, Murchison House, West Mains Road, Edinburgh EH9 3LA, and University of Edinburgh, Department of Geophysics, James Clerk Maxwell Building, Mayfield Road, Edinburgh EH9 3JZ, Scotland
Paul w . Burt on Natural Environment Research Council, British Geological Survey, Murchison House, West Mains Road, Edinburgh EH9 3LA
Received 1984 March 8; in original form 1984 January 13
Summary. Seismic moment release rates Mo inferred from a Weibull frequency-magnitude distribution and its extreme value equivalent are compared with observation. The seismotectonically diverse regions studied all exhibit the curvature of a loglinear frequency magnitude plot associated with applying a maximum magnitude to earthquake recurrence statistics. The inferred seismic moment release rates are consistent with available crustal deformation data within uncertainties resulting from the line fit and in magni- tude determination. The uncertainties for the regions studied (Southern California, the New Madrid seismic zone, the Central and Eastern Mediter- ranean and mainland UK) vary from at worst an order of magnitude down to a factor of 2 or 3.
This agreement can be used to justify the extrapolation of frequency- magnitude statistics beyond the historical and instrumental era in seismic hazard studies as a test of the stationarity of short-term statistics against long-term effects.
A striking example of a bimodal seismicity distribution is observed in the New Madrid zone. This can be interpreted as being due to the superposition of two distinct seismogenic source types observed in the area. A quantitative analysis of the separate orders of seismicity observed in the frequency- magnitude statistics - comparing the different maximum magnitudes and inferred seismic moment release rates with those observed - supports this hypothesis. Superposition of many such seismogenic sources can explain the linearity observed in global frequency versus seismic moment magnitude statistics.
Introduction
The incorporation of crustal deformation into analyses of seismic hazard has given useful insight into probabilities of the largest events associated with long time periods. By linking
at Edinburgh U
niversity on July 28, 2015http://gji.oxfordjournals.org/
Dow
nloaded from

470
the observed statistical magnitude occurrence with a physical parameter - seismic moment - a means is provided to test an extrapolation from short-term historical and instrumental reports against an average of crustal deformation observed over geological time. Examples of observed deformation would come from plate tectonic models, from observed rates of slip along faults which break the surface, or from geodetically determined strain rates in more complex tectonic regions. Some knowledge of the dimensions of the fault zone (extent and depth) and appropriate elastic constants are required to convert slip or strain rates to seismic moment. This information also places deterministic constraints on an important parameter in any seismicity distribution - the largest earthquake consistent with the finite breaking strength of the Earth and the finite extent of the fault zone.
In previous work on this subject (e.g. Anderson 1979; Papastamatiou 1980) this largest earthquake specifies a truncation of the two parametered Gutenberg-Richter frequency relation (equation 2 below) in order to avoid problems such as an infinite rate of strain energy release (Knopoff & Kagan 1977). This effectively introduces a third parameter to the assessment of seismic hazard, and is consistent with the simple geometric seismicity model of Kanamori & Anderson (1 975).
A more complex model of seismicity (Caputo 1977), which includes the effect of variable and limited stress drop as well as source dimension shows that such arbitrary and sudden truncation is not physically valid, and rather that we might expect a gradual roll-off both in the number density and the cumulative frequency asymptotic to a maximum earthquake at zero probability. (Incidentally the model also requires a similar roll-off at very small magnitudes.) This roll-off appears as curvature on a log-linear frequency-magnitude plot. For the cumulative form, such curvature has been observed in the laboratory by Burridge Sr Knopoff (1967) and King (1975) for earthquake models, and also in a theoretical model by Kuznetsova, Shumilana & Zavialov (198 l), which considered inhomogeneities along a fault. This behaviour has already been observed in seismicity distributions around the world - for example by Botti, Pasquale & Anghinolfi (1980) in the Western Alps, Burton et al. (1 982) in Turkey, Makjanik (1 980) in Yugoslavia, Makropoulos (1978) in Greece and by Cosentino & Luzio (1976). There is also experimental evidence that the distribution of microfracture events in stressed San Marco gabbro also shows curvature asymptotic to a maximum size at low frequencies (Scholz 1968). Analogous curved distributions have been observed elsewhere in nature, for example in the yield strength and fatigue life of steel (Weibulll95 l) , and are commonly used in meteorological analysis (Jenkinson 1955).
The Weibull distribution can be usefully extended to analyse preferentially the largest events associated with curvature because of its simple form. The largest events in this case consist of a subset of the frequency distribution - namely the largest value in any unit time interval. This distribution of extreme values has been used in seismic hazard analysis (Burton 1979) and also in order to assign a maximum magnitude to events on a global basis (Yegulalp & Kuo 1974). There follows a discussion on crustal deformation compatible with curvature in both the cumulative frequency distribution and that of the extreme values, with appli- cation to different tectonic regimes,
I. G. Main and P. W. Burton
Curved cumulative frequency distributions
The most commonly used seismicity distribution is the log-linear Gutenberg-Richter law
l o g N ( x 2 m)=a-bm (1)
where N is the number of times a magnitude m is equalled or exceeded and a and b are regionally varying positive constants. (The symbol m is used in the theoretical discussion for
at Edinburgh U
niversity on July 28, 2015http://gji.oxfordjournals.org/
Dow
nloaded from
Physical links between crustal deformation and seismic hazard 47 1
a general magnitude in order to avoid confusion with the seismic moment Mo. Elsewhere M L , M,, M, and mb have their usual meanings.) b is commonly observed to be close to 1 in accordance with the geometrical model of Kanamori & Anderson (1975). If we define a number density distributiQn n = -dN/dm and rearrange (1) then
b’= b In 10
p = b’ loa. n(m) = p exp(-b‘m);
Caputo’s (1977) model introduces a third parameter to the distribution at high magni- tudes, above m2 say, and defines a maximum value for m via the relation
n(m)=pexp(-b‘m)- q ( 3 ) where p , b’ and q can be related to constants specifying the distribution of fault dimension and stress drop, and to maximum values of these parameters. The model also indicates that b = 1. Equation (3) is therefore a simple generalization of (2), or we can regard (2) as the limit in which q + 0 or the equivalent maximum magnitude (w) tends to infinity, since 4 = p exp(-b‘w).
Jenkinson’s (1 955) general solution for a cumulative frequency distribution related to the extreme values takes the form
N(X > m) = [(w - m)/(w - u ) ] ” ~
and is equivalent to the Weibull distribution for positive, non-zero h. w is the maximum magnitude, u < w is a characteristic value associated with unit time, and h < 1 is a measure of the curvature of the distribution. As h-+O (4) reduces to the form (l)(Gumbel1958). This form of the distribution in (4) is chosen as the most convenient for the present work. In both cases curvature in N and n asymptotic to a maximum value is reflected by three para- meters, rather than the two of (1).
An alternative attempt to limit the distribution is to define N(m) = 0 at a finite maximum magnitude, given a normalized form of (2). The form, after Cosentino & Luzio (1976) is the truncated Gutenberg-Richter law
exp(-b’m)- exp(-b’w)
exp(-b’u) - exp(-b’w) N(x > m) =
where w and u are defined as in the Jenkinson notation and b‘ = b In 10. In this case the number density distribution n(m) is not curved although the cumulative frequency is (Bith 1981a), so there is a philosophical difference between ( 5 ) and the forms (3) and (4). Finally, the effects of both a lower and an upper bound to earthquake occurrence can be combined in the single equation
P(m) = (1 - K ) + K exp [b’(m -rno)] (6)
where P is the fraction of earthquakes greater than m, K is { 1 - exp[-b’(w-mo)]} -’ and mo, w are lower and upper bounds to the seismicity distribution (Cornell & Vanmarcke 1969). Normally the effects of a lower bound on earthquake statistics are negligible and can be safely ignored. The relationship of this form of the seismicity distribution to crustal deformation rates was analysed by Papastamatiou (1980) directly in terms of seismic moment.
In summary, the inclusion of a third parameter which limits the seismicity distribution gives a more general form than the open-ended Gutenberg-Richter law, and in a form in common use outside seismology. The main parameterizations are outlined above, although
at Edinburgh U
niversity on July 28, 2015http://gji.oxfordjournals.org/
Dow
nloaded from
472
others are possible, but in the present work the form used will be that of (4), because this form allows us to compare both the initial distribution ( N ) and the extreme value distri- bution (P) discussed below.
I. G. Main and P. W. Burton
Extreme value distributions
The theory of extreme values has been covered extensively by Gumbel (1958). For our purpose the most important relation is
P ( x Q rn) = exp [ - N ( x > m)] (7)
where P is a probability of non-exceedance in unit time of a magnitude m - or alternatively that m is an extreme value. This relation follows from a Poissonian assumption that different events are unrelated, in the limit as the total number of events analysed + 00. A derivation of the form of N (and hence P) consistent with certain assumptions pertinent to the extreme values gave equation (4). The form of this distribution which reflects an upper bounded magnitude is defined as Gumbel’s third distribution of extreme values:
P(X Q m) = exp {- [(w-m)/(w-u)] ’’‘I ( 8 )
where 0 < h < 1, u < w as for the Weibull distribution. Knopoff & Kagan (1 977) have objected to the use of extreme value statistics of the first
type (related to equation 1) because methods which analyse the whole data set in this case generally give more accurate results in earthquake statistics. However, the curvature consis- tent with Caputo’s physical model is usually emphasized to a greater degree in the extreme value case for a type three distribution because it deals preferentially with the largest events where such curvature is to be expected. Gumbel’s third distribution of extreme values may well be the best available method of extrapolating to earthquake occurrence at low proba- bilities from an existing catalogue of events, particularly when it is incomplete, although where possible the predictions should be checked against known physical parameters such as slip rate. The theoretical means of carrying this out is derived in the next section.
Crustal deformation
The measure of crustal deformation is taken to be the seismic moment Mo. This can be related to slip rates (S) on individual faults, or strain rates ( e ) over a more diffuse area by the equations
Mo = H A S (9)
Mo = 2 . 5 / ~ V t .
where I-( is the rigidity modulus, A is the area of slip and Vis the crustal volume of the zone of deformation. Equation (10) is derived in Papastamatiou (1980).
Two models are used to estimate the rate of crustal deformation, following from (1) the cumulative frequency of occurrence (whole process) and (11) from the extreme value probabilities (part process).
M O D E L I
An average value for the rate of release of seismic moment is given by integration over the range (0, MOU) where Mow is the largest moment which might be released in a single event
at Edinburgh U
niversity on July 28, 2015http://gji.oxfordjournals.org/
Dow
nloaded from
Physical links between crustal deformation and seismic hazard 473
for a particular region
J O
n(Mo)dMo is the number of earthquakes occurring in an interval dMo per unit time with n = -dN/dMo. N is given by the cumulative frequency relationship, but is normally expressed in terms of magnitude, since moment is still a fairly rare observational parameter. To convert between the two we may use the relationship
Mo(m) = 1 0 ~ + ~ ~ (12)
where B = 3/2 for the M, scale follows from Kanamori & Anderson’s (1975) theoretical considerations on fault geometry as well as from empirical fits to available data. The most recent work on this conversion from seismic moment, M o , to seismic moment magnitude, M,, indicates the following values for A and related stress drops Aa:
interplate events = 16.1, Ao = 30 bar
intraplate events = 15.7, A o = 76 bar
average value = 15.85, Ao = 52 bar
California = 15.83
(from Singh & Havskov 1980).
shown from (1 1) and (1 2) that By an appropriate change of variables, and using (4) to define n(m) = -dN/dm, it can be
- where Mo and u are expressed per unit time interval, and p = B In 10. I‘ is the usual symbol for the Gamma function.
M O D E L 11
Forming a probabilistic expectation value
( Mo ) = IOMo MO p (Mo) dM0
where
P ( X G Mo) = rM0 p ( X ) dX J O
is the extreme value distribution following from the normalized probability density p . After a suitable change of variables involving (8) and (1 2)
In the present work this equation is evaluated numerically. Thus in both models the seismic moment release per unit time interval is expressed as a
fraction of the maximum moment Mow, for all values of (w, u, h) consistent with a
at Edinburgh U
niversity on July 28, 2015http://gji.oxfordjournals.org/
Dow
nloaded from

474
Gumbel's third extreme value distribution and its initial Weibull distribution. We can a h show that ( Mo >/Mo < 1 for appropriate values of the parameters and if (7) holds.
In evaluating parameters of the distribution (8) the unit time interval must sometimes be taken to be i yr rather than annually, in order to reduce problems associated with intervals devoid of any recorded events. If this is the case u and A are appropriate for this scale, and we can convert to annual rates via
I. G. Main and P. W. Burton
where ( M o >i is the seismic moment released per i yr. (13) and (15) then define the rate of release of seismic moment in terms of the
statistically determined parameters (w, u , A) - the link to the physical process of strain or slip rates being represented by the terms Mow and 0.
-
U N C E R T A I N T I E S I N ni,, ( M o ) ~ ~ ~ M~~
Because (w, u, A) are subject to (often large) statistical error we have to allow for this in predictions of Mo. This can be done by the equation
-
which represents a complete covariance error in (A&,> and ko respectively. p i , i takes on values (w, u, A) and ujj is the statistically determined covariance error in these parameters. The covariance matrix E is defined by
as in Burton (1979). This is the most complete method of allowing for error, because in general the parameters w and h are dependent on each other. A large w leads to less curva- ture (lower A) and vice versa. This manifests itself in a negative contribution from u&h,
or a reduction in the error compared to the variance method (a sum of the diagonal elements
The uncertainty in w is often unusually large (Burton 1979), and in many cases may be reduced where limitations on stress drop (usually in the range 1 < Ao < 100 bar), fault dimension and fault type place an upper bound on Mow through the general expression
U;).
where C is a dimensionless constant which depends on the type of fault, and I,,, is the maximum fault dimension (Kanamori & Anderson 1975). Alternatively we may use this value to compare Mow obtained by I,,, and Aomax with statistically determined values of w via (1 2).
Saturation
It is well known that curvature of the form (3), (4) or (5) may be artificially present for magnitudes above M s = 7.5 to 8.0 because of instrumental saturation of the magnitude scale (Howell 1981). Chinnery & North (1975) have shown that when M s values are
at Edinburgh U
niversity on July 28, 2015http://gji.oxfordjournals.org/
Dow
nloaded from

Physical links between crustal deformation and seismic hazard .-____
I
u
t
I
0 t-
3
at Edinburgh U
niversity on July 28, 2015http://gji.oxfordjournals.org/
Dow
nloaded from
476 I. G. MainandP. W. Burton x)’
36w
36930’
30’
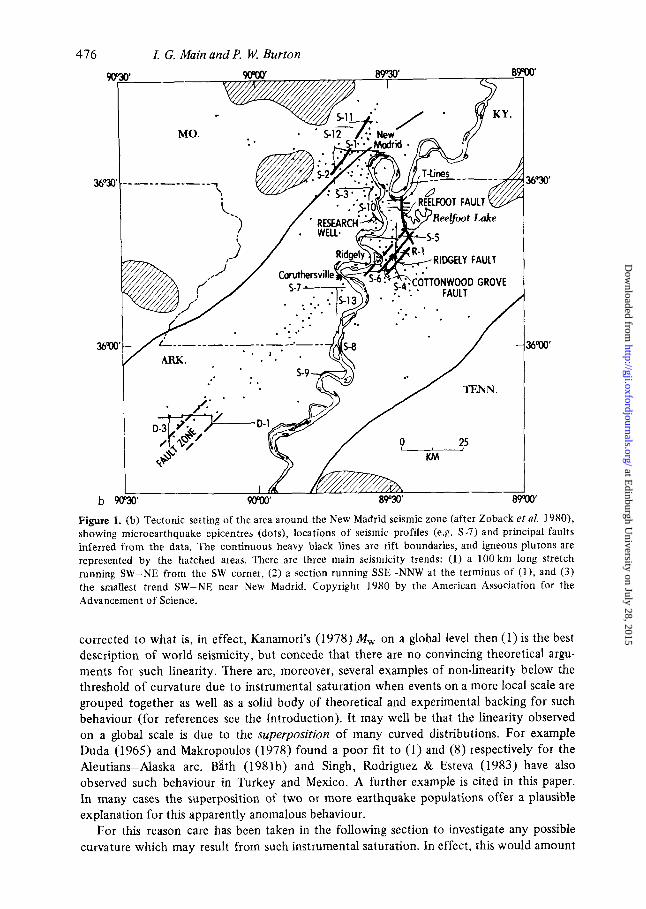
Figure 1. (b) Tectonic setting of the area around the New Madrid seismic zone (after Zoback et al. 1980), showing microearthquake epicentres (dots), locations of seismic profiles (e.g. S-7) and principal faults inferred from the data. The continuous heavy black lines are rift boundaries, and igneous plutons are represented by the hatched areas. There are three main seismicity trends: (1) a 100 km long stretch running SW-NE from the SW corner, (2) a section running S S E - ” W at the terminus of (l), and (3) the smallest trend SW-NE near New Madrid. Copyright 1980 by the American Association for the Advancement of Science.
corrected to what is, in effect, Kanamori’s (1978) M, on a global level then (1) is the best description of world seismicity, but concede that there are no convincing theoretical argu- ments for such linearity. There are, moreover, several examples of non-linearity below the threshold of curvature due to instrumental saturation when events on a more local scale are grouped together as well as a solid body of theoretical and experimental backing for such behaviour (for references see the Introduction). It may well be that the linearity observed on a global scale is due to the superposition of many curved distributions. For example Duda (1965) and Makropoulos (1978) found a poor fit to (1) and (8) respectively for the Aleutians-Alaska arc. B8th (1981b) and Singh, Rodriguez & Esteva (1983) have also observed such behaviour in Turkey and Mexico. A further example is cited in this paper. In many cases the superposition of two or more earthquake populations offer a plausible explanation for this apparently anomalous behaviour.
For this reason care has been taken in the following section to investigate any possible curvature which may result from such instrumental saturation. In effect, this would amount
at Edinburgh U
niversity on July 28, 2015http://gji.oxfordjournals.org/
Dow
nloaded from
Physical links between crustal deformation and seismic hazard 477 to using Chinnery & North’s (1975) empirical method for converting from M s to a seismic moment magnitude, Mw - a much more meaningful description of the ‘size’ of the seismic source. For the areas considered in the present work this turns out to be unnecessary.
It is not even clear that such correction is always appropriate, since Kanamori’s (1977) tabulation of Ms/Mw for large events shows that Ms is commonly greater than M , for large events - the opposite effect of that of saturation. This anomaly may be ironed out as more data become available, but can be partially included in the method of line fitting by assuming an uncertainty in each magnitude value of the same order as any saturation
T i m e
za 8 2
1 9aa 1980 1900 1980 1900 i 9 8 a
5-6-65 6.6- 7.5 7.6 - Figure 2 - (a)
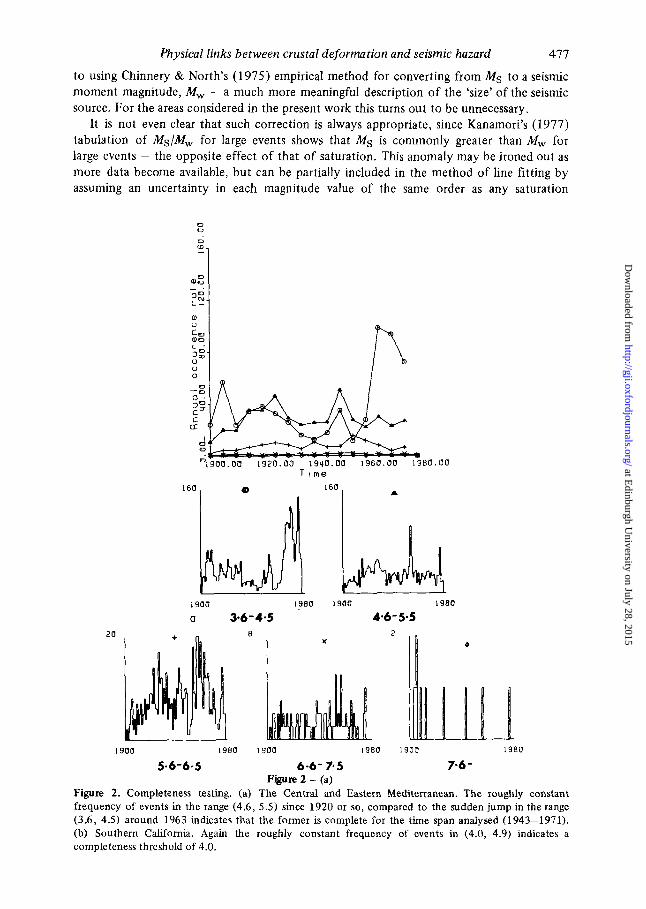
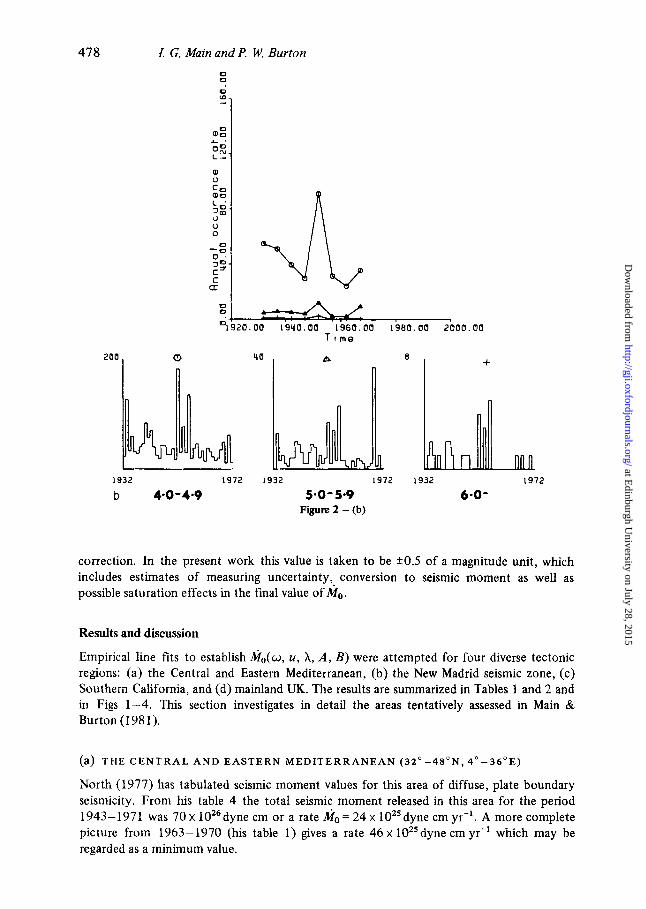
Figure 2. Completeness testing. (a) The Central and Eastern Mediterranean. The roughly constant frequency of events in the range (4.6, 5.5) since 1920 or so, compared to the sudden jump in the range (3.6, 4.5) around 1963 indicates that the former is complete for the time span analysed (1943-1971). (b) Southern California. Again the roughly constant frequency of events in (4.0, 4.9) indicates a completeness threshold of 4.0.
at Edinburgh U
niversity on July 28, 2015http://gji.oxfordjournals.org/
Dow
nloaded from
4 7 8 €. G. Main and P. W. Burton 0 0
I
1932 1972
b 4.0 -4.9
ua T I me
P
1932 1972
5.0- 5.9 Figure 2 - (b)
8 +
1932 1972
6.0-
correction. In the present work this value is taken to be k0.5 of a magnitude unit, which includes estimates of measuring uncertainty, conversion to seismic moment as well as possible saturation effects in the final value of Mo.
Results and discussion
Empirical line fits to establish &(w, u, A, A , B ) were attempted for four diverse tectonic regions: (a) the Central and Eastern Mediterranean, (b) the New Madrid seismic zone, (c) Southern California, and (d) mainland UK. The results are summarized in Tables I and 2 and in Figs 1-4. This section investigates in detail the areas tentatively assessed in Main & Burton (1 98 1).
(a) T H E C E N T R A L A N D E A S T E R N M E D I T E R R A N E A N ( 3 2 0 - 4 s 0 ~ , 4 ° - - 3 6 0 ~ )
North (1977) has tabulated seismic moment values for t h s area of diffuse, plate boundary seismicity. From his table 4 the total seismic moment released in this area for the period 1943-1971 was 70 x 1OZ6dyne cm or a rate ni0= 24 x 102’dyne cm yr-’. A more complete picture from 1963-1970 (his table 1) gives a rate 46 x 10”dyne cm yr-’ which may be regarded as a minimum value.
at Edinburgh U
niversity on July 28, 2015http://gji.oxfordjournals.org/
Dow
nloaded from

Physical links between crustal deformation and seismic hazard 479
A seismicity map of the area concerned is given in Fig. 1 (a) and an excellent summary of the complex geo-tectonic setting is given in Horvath & Berckhemer (1982). The histograms of Fig. 2(a) show that the catalogue used (Burton 1978) is complete for the time range analysed (1943-1971) above mag 4.5. The range (3.6, 4.5) is not complete - as can be
.. 0
N 9
b - C u m u l a t i v e Frequency p l o t OF the New Madrid area.
0 Recent + historical doto. 0 ..
0
-9 E
e
-D
z -0
0.. - 8
0 0
N
0
m 1j.w i o n u:so 6:ao 7:so 9.c
Magnitude Me Mognitude m b 0
(0 3
0 0
N
0 0 - . " - 'c t s -0
0 0
I - 0
N 3
C-Cumulative frequency p l o ! of Soubhern CaliFornia for 1932- 1972 Ms>U. 0
\
'3.50 U.50 5.50 6.50 7.50 I Magnitude Me
50
Figure. 3. Cumulative frequency line fits to the distributionN(m) = [ ( w - m)/(w - u)] ' ' ' . The parameters and their covariance error matrices are given in Table 1. (a) The Central and Eastern Mediterranean. In this case there seems to be a high autocorrelation error - there being a systematic trend in the positioning of the data points relative to the line. It would be difficult to justify a linear fit of the form (1) in this case, the curvature being so marked at high magnitudes. (b) The New Madrid area. Here the most success- ful fit was obtained by splitting the magnitude range into two segments - above and below 5, and fitting the line separately. The New Madrid events were repositioned at average repeat times T = 650 years ( N = l /T). (c) Southern California. In this case the line fit seriously underestimates the occurrence rate of the largest events which have occurred. A line fit of the form (1) would in this case give a better fit at these magnitudes, but again there seems to be some evidence of a bimodal distribution, the ranges meeting at M L = 6.7 or SO.
at Edinburgh U
niversity on July 28, 2015http://gji.oxfordjournals.org/
Dow
nloaded from
480 L G. Main and P. W. Burton
a - T h e Mediterronean area f o r 19U3-1971
, , , , 0
3-2.aa a.aa 2.aa u.aa 6 . aa E
b - N e w Madrid f o r 1810-1975 -In[-lnPI
"-2.m a;aa 2; aa 4'. aa 6: 130 I -In [-lnP1
c - Soubhern Colifornio F o r 1932-1972
2. aa u.OO 6.00 1 -In [ - l n P 1
, aa
aa
aa
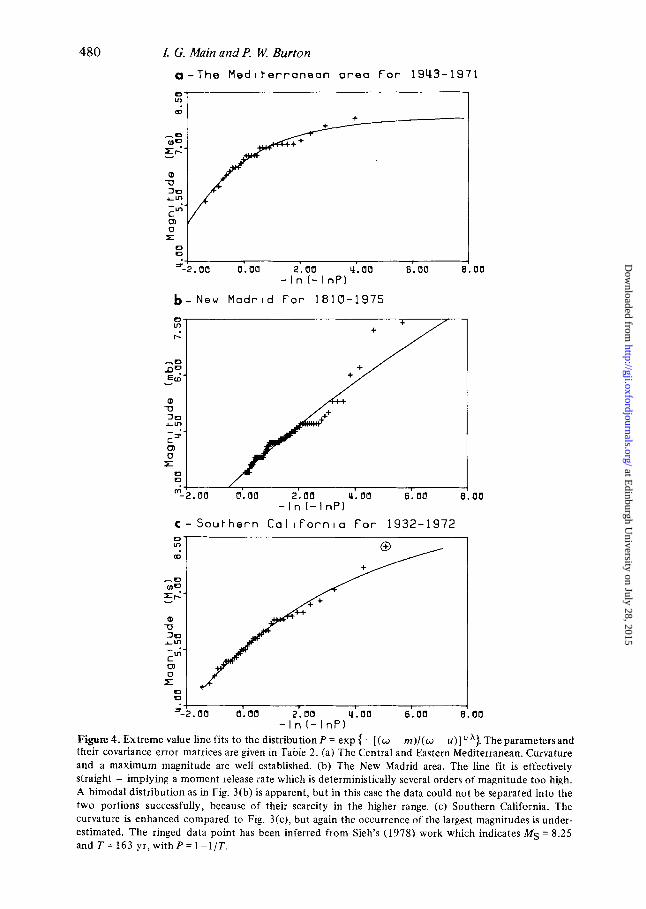
Figure 4. Extreme value line fits to the distributionp = exp {- [(w - rn)/(w - u ) ] The parameter sand their covariance error matrices are given in Table 2. (a) The Central and Eastern Mediterranean. Curvature and a maximum magnitude are well established. (b) The New Madrid area. The line fit is effectively straight - implying a moment release rate which is deterministically several orders of magnitude too high. A bimodal distribution as in Fig. 3(b) is apparent, but in this case the data could not be separated into the two portions successfully, because of their scarcity in the higher range. (c) Southern California. The curvature is enhanced compared to Fig. 3(c), but again the occurrence of the largest magnitudes is under- estimated. The ringed data point has been inferred from Sieh's (1978) work which indicates M S = 8.25 a n d T = l 6 3 y r , w i t h P = l - l / T .
at Edinburgh U
niversity on July 28, 2015http://gji.oxfordjournals.org/
Dow
nloaded from

Tabl
e 1.
Mom
ent r
elea
se ra
tes
pred
icte
d by
cum
ulat
ive
freq
uenc
y lin
e fi
ts to
N(m
) = [
(w -m
)/(w
- u
)]””
(mod
el I
and
Fig.
3).
Are
a*
Para
met
ers
Cov
aria
nce
erro
r (a,
u, A
) m
atri
x E
(a)
(8.1
6,6.
80,
0.25
1)
Ms
(b)
Ran
ge
(7.8
1, -
23.4
, (5
.0,7
.5)
0.68
0)
(b)
Ran
ge
(5.6
1,3.
63,
(2.5
,5.0
) 0.
263)
md
(9.2
6,6.
00,
0.12
6)
MSI
ML
0.85
5 -0
.031
-0
.119
1.43
71
.1
-0.7
52
1 .oo
-0.0
84
-0.1
54
9.54
-0
.304
-0
.340
-0.0
31
0.01
8 0.
008
71.1
41
79.0
-4
2.5
- 0.
084
0.01
9 0.
015
0.30
4 0.
026
0.01
2
-0.1
19
0.00
8 0.
018
-0.7
52
0.43
7
-0.1
54
0.01
5 0.
025
-42.
5
-0.3
40
0.01
2 0.
012
Loca
l val
ues
forA
, B
k, (w
, u, A
, A, B
) x l
oz5 d
yne
cm y
r-’
16.0
1.5
87 +
110
~
48
15.5
8 1.
5 1.
2 +
12
- 1
.1
15.5
8 1.
5 4.
0 +
23.5
- 3
.4
(x
io
-4
)
15.8
3 1.
5 8
+ 26
-6
*Are
as a
re:
(a) t
he C
entr
al a
nd E
aste
rn M
edite
rran
ean,
(b)
the
New
Mad
rid
seis
mic
zon
e, a
nd (
c) S
outh
ern
Cal
ifor
nia.
t R
efer
to
text
for
mb/
Ms c
onve
rsio
n.
5 ?r
M, ob
serv
ed o
r es
timat
ed
5 X
lo2’
dyne
cm y
r-’
> 46
= 0.
6
a-
cb s 9
= 16
P z
at Edinburgh University on July 28, 2015http://gji.oxfordjournals.org/Downloaded from

Tab
le 2
. M
omen
t rel
ease
rate
s pr
edic
ted
by e
xtre
me
valu
e lin
e fi
ts to
P(m
) = e
xp [
-(w
-m
)/(w
-u)]
'/*
(mod
el I1
and
Fig
. 4).
i$
i%
Are
a*
Para
met
ers
Cov
aria
nce e
rror
Lo
cal v
alue
s ni,
(w, u
, A, A
, B)
ko
obse
rved
or
estim
ated
"3
' (w
, u,
mat
rix
E fo
r A, B
X
lo2'
dyne
cm y
r"
X lo
2' dy
ne cm
yr-
' fa
.%
3
fa
(4
(7.8
4,6.
64,
0.48
4 -0
.044
-0
.200
0.
435)
- 0.
044
0.01
4 0.
021
16.0
1.
5 43
'26
3 4
6 -0
.200
0.
021
0.09
3 - 1
6 r
Ms
(b)
Ran
ge
(19.
4, 3
.36,
11
23.0
0 (3
.0,7
.5)
0.04
2)
2.54
m
i -3
.20
-
2.54
-3
.20
0.01
3 -0
.007
15
.58
1.5
-
-0.0
07
0.00
9 3 0.
6
(9.1
1,5.
46,
3.70
-0
.062
-0
.219
0.
182)
-0
.062
0.
008
0.00
4 15
.83
1.5
8.5
+ 16
.2
- 16 M
SIM
L -0
.219
0.
004
0.01
3 -5
.6
(5.4
6,4.
58,
0.59
) -
4
0.19
0 -0
.026
-0
.134
-0
.026
0.
015
0.02
6 15
.7
1.5
2.2
+ 1.
0 -0
.134
0.
026
0.11
3 -0
.7
(~1
0-3
)
s 3
4 (x
10-
3)
5 3
*Are
as a
re:
(a) t
he C
entr
al a
nd E
aste
rn M
edite
rran
ean,
(b)
the
New
Mad
rid s
eism
ic z
one,
(c)
Sou
ther
n C
alif
orni
a, a
nd (d
) m
ainl
and
UK
. +R
efer
to te
xt f
or m
blM
, con
vers
ion.
at Edinburgh University on July 28, 2015http://gji.oxfordjournals.org/Downloaded from

Physical links between crustal deformation and seismic hazard 483
inferred from the sudden jump in the number of events reported on introduction of the WWSSN network in 1963. Fig. 3(a) shows the cumulative frequency line fit t o these data and Fig. 4(a) the Gumbel plot, both of whose parameters were calculated using the method described in Burton (1979). The parameters and covariance errors (which include an allowance for k0.5 uncertainty in the magnitude measurement) can be seen in Tables 1 and 2. Note that in some cases the actual values of (w, u, A) for N and P differ slightly as expected by Makjanik (1980).
To convert to moment release rates we refer to North's table 4 again, where we find for this area that an average stress drop is 38 bar. This converts to A = 16.0 using Singh & Havskov's (1980) formulation, and with B = 1 .S leads to a good linear fit to North's (1974) fig. 4, right up to the highest magnitudes. This last point indicates that there appears to be no instrumental saturation effect.
Both predictions of the moment release rates agree with that expected to within a factor 2 or so, which is in both cases within the expected uncertainty. This consistency, where we have reasonable error in (a, u, h) and some knowledge of a local stress drop or A value shows that the model proposed is quantitatively adequate well within the limits of statistical uncertainty.
Further inspection of this uncertainty shows the following relative effects of the three Gumbel parameters
acko) a M 0 ) a M 0 ) a m . au . ah
=1.3:1:1.8 _ _ _ . - . -
This result shows that u is the best-determined parameter and that w and h have a dominant effect on the total uncertainty in this case. This effect is tempered by their interdependence already discussed above, and highlights the need to include the off-diagonal elements of the covariance error matrix in any attempt to quantify an error in (ni, ).
Finally, note from the tables that the error in CMo ) is less than that for Go (60 per cent compared with 126 per cent).
The comments of the last three paragraphs were all found to apply qualitatively to the following areas of study, the actual values being quoted in this subsection for illustration only.
(b) T H E N E W MADRID SEISMIC Z O N E (35 ' -37ON, 89 ' -90 .5OW)
This area of mid-plate seismicity has received much attention in recent years for reasons both practical and theoretical. Zoback et QZ. (1980) summarized the available geological and geophysical data, and concluded that the area consists of three main seismic trends (see Fig. 1 b), set in a reactivated graben structure. Why the seismicity should largely follow the axis of the graben is not clear.
Practical interest is stimulated by the possibility of a repeat of the 18 1 1-1 8 12 sequence of major events (mb 7.1-7.4) in an area of relatively low seismic attenuation and high population density, and theoretical interest comes from the breakdown of the classical theory of rigid plate tectonics. Because the seismicity trends are situated in a zone primarily of EW compression (Zoback & Zoback 1980) we would expect right lateral strike-slip motion along the trends (1) and ( 3 ) of Fig. 2(b) and thrust on section ( 2 ) . Russ (1981) showed that this is borne out to a large extent by the few fault plane solutions available, and
at Edinburgh U
niversity on July 28, 2015http://gji.oxfordjournals.org/
Dow
nloaded from
484
that section (2) may result from reactivated dip-slip faulting. Together with Schilt & Reilinger (1 98 l), he also indicates that such evidence as there is favours 5 mm yr-' of uplift occurring in and around the northern part of the active zone. There is some evidence that some of this motion is taken up by aseismic creep since earthquakes in Schilt & Reilinger (1981) did not produce enough movement to account for all of the uplift detected in a later levelling survey.
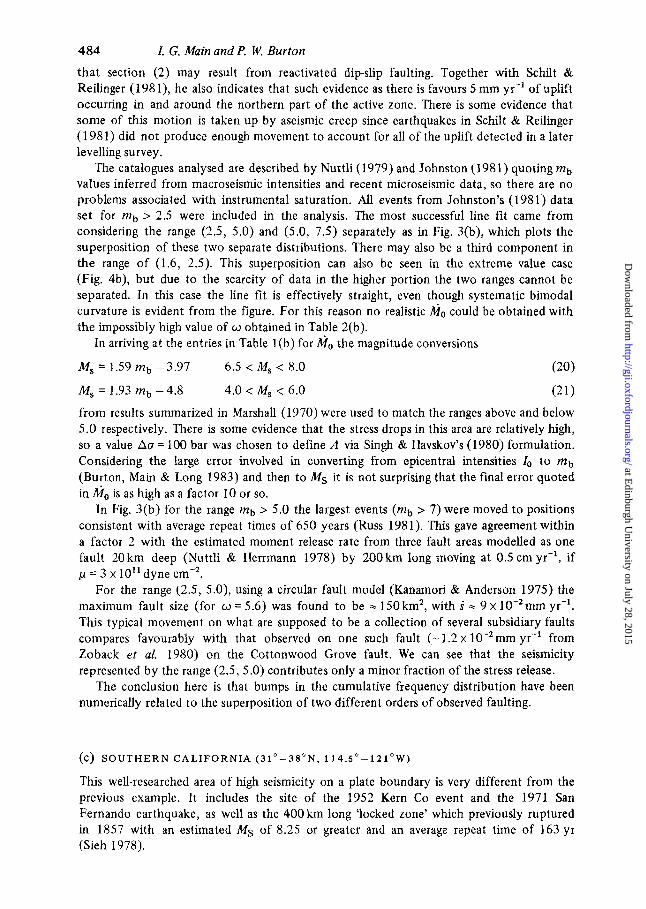
The catalogues analysed are described by Nuttli (1979) and Johnston (1981) quoting mb values inferred from macroseismic intensities and recent microseismic data, so there are no problems associated with instrumental saturation. All events from Johnston's (198 1) data set for mb > 2.5 were included in the analysis. The most successful line fit came from considering the range (2.5, 5.0) and (5.0, 7.5) separately as in Fig. 3(b), which plots the superposition of these two separate distributions. There may also be a third component in the range of (1.6, 2.5). This superposition can also be seen in the extreme value case (Fig. 4b), but due to the scarcity of data in the higher portion the two ranges cannot be separated. In this case the line fit is effectively straight, even though systematic bimodal curvature is evident from the figure. For this reason no realistic Mo could be obtained with the impossibly high value of w obtained in Table 2(b).
1: G. Main and P. W. Burton
In arriving at the entries in Table l(b) for Mo the magnitude conversions
Ms = 1.59 mb - 3.97 6.5 < Ms < 8.0 (20)
M, = 1.93 mb -4.8 4.0 < Ms < 6.0
from results summarized in Marshall (1970) were used to match the ranges above and below 5.0 respectively. There is some evidence that the stress drops in this area are relatively high, so a value Aa = 100 bar was chosen to define A via Singh & Havskov's (1980) formulation. Considering the large error involved in converting from epicentral intensities 1, to mb (Burton, Main & Long 1983) and then to M s it is not surprising that the final error quoted in Mo is as high as a factor 10 or so.
In Fig. 3(b) for the range mb > 5.0 the largest events (mb > 7) were moved to positions consistent with average repeat times of 650 years (Russ 1981). This gave agreement within a factor 2 with the estimated moment release rate from three fault areas modelled as one fault 20 km deep (Nuttli & Herrmann 1978) by 200km long moving at 0.5 cm yr-', if p = 3 x 1O"dyne cm-'.
For the range (2.5, 5.0), using a circular fault model (Kanamori & Anderson 1975) the maximum fault size (for w = 5.6) was found to be = 150 km', with S = 9 x 10-'mm yr-'. This typical movement on what are supposed to be a collection of several subsidiary faults compares favourably with that observed on one such fault (- 1.2 x 10⁻²mm yr-l from Zoback et al. 1980) on the Cottonwood Grove fault. We can see that the seismicity represented by the range (2.5, 5.0) contributes only a minor fraction of the stress release.
The conclusion here is that bumps in the cumulative frequency distribution have been numerically related to the superposition of two different orders of observed faulting.
(C) S O U T H E R N C A L I F O R N I A ( 3 1 ° - 3 S 0 N , 1 14.5°-1210W)
This well-researched area of high seismicity on a plate boundary is very different from the previous example. It includes the site of the 1952 Kern Co event and the 1971 San Fernando earthquake, as well as the 400 km long 'locked zone' which previously ruptured in 1857 with an estimated M s of 8.25 or greater and an average repeat time of 163 yr (Sieh 1978).
at Edinburgh U
niversity on July 28, 2015http://gji.oxfordjournals.org/
Dow
nloaded from
Physical links between crustal deformation and seismic hazard 485
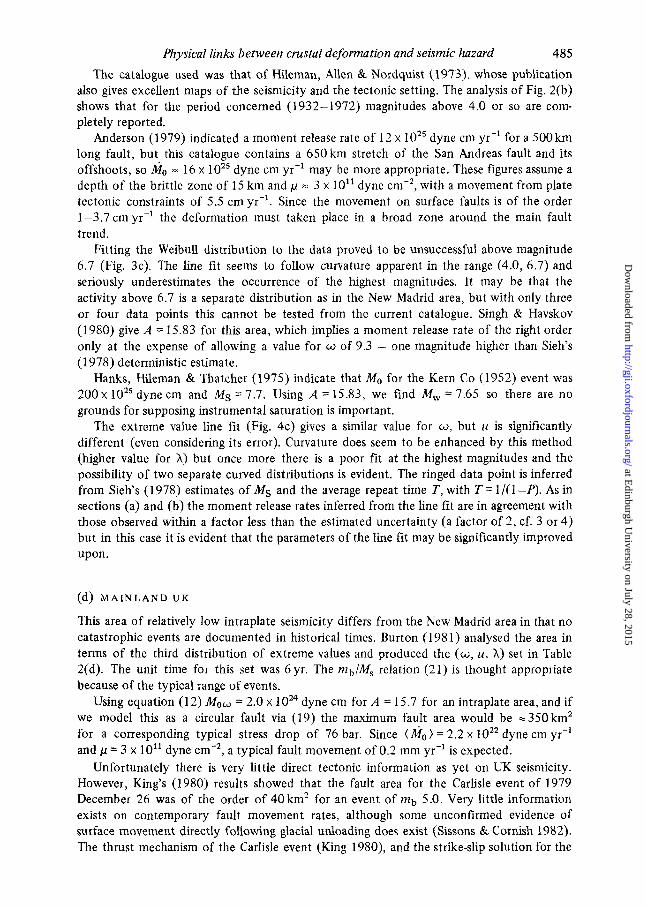
The catalogue used was that of Hileman, Allen & Nordquist (1973), whose publication also gives excellent maps of the seismicity and the tectonic setting. The analysis of Fig. 2(b) shows that for the period concerned (1932-1972) magnitudes above 4.0 or so are com- pletely reported.
dyne cm yr-' for a 500 km long fault, but this catalogue contains a 650 km stretch of the San Andreas fault and its offshoots, so &lo = 16 x dyne cm yr-' may be more appropriate. These figures assume a depth of the brittle zone of 15 km and p = 3 x 10'' dyne cm-2, with a movement from plate tectonic constraints of 5.5 cm yr-'. Since the movement on surface faults is of the order 1-3.7 cm yr-' the deformation must taken place in a broad zone around the main fault trend.
Fitting the Weibull distribution to the data proved to be unsuccessful above magnitude 6.7 (Fig. 3c). The line fit seems to follow curvature apparent in the range (4.0, 6.7) and seriously underestimates the occurrence of the highest magnitudes. It may be that the activity above 6.7 is a separate distribution as in the New Madrid area, but with only three or four data points this cannot be tested from the current catalogue. Singh & Havskov (1980) give A = 15.83 for this area, which implies a moment release rate of the right order only at the expense of allowing a value for w of 9.3 - one magnitude higher than Sieh's (1 978) deterministic estimate.
Hanks, Hileman & Thatcher (1975) indicate that Mo for the Kern Co (1952) event was 200 x loz5 dyne cm and MS = 7.7. Using A = 15.83, we find M, = 7.65 so there are no grounds for supposing instrumental saturation is important.
The extreme value line fit (Fig. 4c) gives a similar value for w, but z i is significantly different (even considering its error). Curvature does seem to be enhanced by this method (higher value for A) but once more there is a poor fit at the highest magnitudes and the possibility of two separate curved distributions is evident. The ringed data point is inferred from Sieh's (1 978) estimates of MS and the average repeat time T, with T = 1 /( 1 -P). As in sections (a) and (b) the moment release rates inferred from the line fit are in agreement with those observed within a factor less than the estimated uncertainty (a factor of 2, cf. 3 or 4) but in this case it is evident that the parameters of the line fit may be significantly improved upon.
Anderson (1979) indicated a moment release rate of 12 x
(d) M A I N L A N D U K
This area of relatively low intraplate seismicity differs from the New Madrid area in that no catastrophic events are documented in historical times. Burton (1981) analysed the area in terms of the third distribution of extreme values and produced the (a, u , A) set in Table 2(d). The unit time for this set was 6yr . The mb/Ms relation (21) is thought appropriate because of the typical range of events.
Using equation (12) Mow = 2.0 x dyne cm for A = 15.7 for an intraplate area, and if we model this as a circular fault via (19) the maximum fault area would be =350km2 for a corresponding typical stress drop of 76 bar. Since (&lo) = 2.2 x 10z2 dyne cm yr-' and p = 3 x 10" dyne cm-', a typical fault movement of 0.2 mm yr-' is expected.
Unfortunately there is very little direct tectonic information as yet on UK seismicity. However, King's (1980) results showed that the fault area for the Carlisle event of 1979 December 26 was of the order of 40 km2 for an event of mb 5.0. Very little information exists on contemporary fault movement rates, although some unconfirmed evidence of surface movement directly following glacial unloading does exist (Sissons & Cornish 1982). The thrust mechanism of the Carlisle event (King 1980), and the strike-slip solution for the
at Edinburgh U
niversity on July 28, 2015http://gji.oxfordjournals.org/
Dow
nloaded from

486 I. G. Main and P. W. Burton
Kintail earthquake swarm of 1974 (AssumGao 1981) are both compatible with compressive intraplate tectonics.
King (1980) assumes Ao = 30 bar might be appropriate for the UK. In this case A = 16.1, Mow = 5.13 x 1OZ4dyne cm, the maximum fault area = 1200 km’, S = 0.06 mm yr-’. King’s results are consistent in themselves, but if Ao = 30 bar, we should expect fault planes of an order higher than those which have been observed so far. A more realistic picture might be to interpret the maximum fault area as representing a sum of several smaller faults of the order of tens of km’, moving at rates = 0.1 mm yr-’. This speculative interpretation is compatible with the spread of UK seismicity around small, localized centres such as at Comrie and in pockets in the north-west of England and South Wales, and the absence of catastrophic events such as in the New Madrid area.
A deterministic estimate of the movement between the sinking south of England and the relative uplift consistent with glacial unloading of the north of England and Scotland is 1.5 mm yr-’ (Rossiter 1972). If the depth of the UK seismogenii zone is -5 km, and its width is modelled as of the order 200km, then A ‘;. 1000km2 and M0 = 3 . 4 ~ lOZ3dyne cm yr-’. This area favours King’s choice of Ao and comparison of the values of and ( Mo ) indicate that over 90 per cent of the observed movement occurs aseismically.
Conclusion
In most cases where moment release rates were available the distributions N and P success- fully modelled both the observed curvature at high magnitudes and the predicted moment release rates from models I and 11. The exceptions tended to be in areas where there was evidence that the distribution was bimodal - being most striking in the New Madrid area (Fig. 4b).
Careful quantitative comparison of ni, _+ S n i , can be used as a method of distinguishing areas where the line fit is deficient at the higher magnitudes. Incorporation of deterministic values for the maximum magnitude (from seismicity trends or geological zoning), and geological estimates of their average repeat times will also improve the quality of the line fit at these magnitudes as better quality data become available.
Typical uncertainties in Mo were found to be a factor of 2-4 or so, with the Gumbel estimates giving slightly lower uncertainties, and agreement within this range with observed moment release rates from (1) a short-term catalogue for an internal consistency check in the Mediterranean and ( 2 ) long-term geological estimates in Southern California is encouraging.
A serious drawback of the distribution used is that n ( o ) = O . For a cyclic input and release of strain energy we might expect n ( w ) to be some non-zero value, implying a repeat time T = l/N(m) which is not infinite as m -+ o. Work is currently progressing in this area to generalize (2) to allow curvature in the density distribution without requiring n ( w ) = 0. This will imply a less severe curvature at magnitudes just below w, and thereby offset the under- estimation of observed occurrence rates to which the Weibull and Gumbel’s third distri- bution seems to be prone.
Acknowledgments
This work was supported by the Natural Environment Research Council and is published with the approval of the Director of the British Geological Survey (NERC). We are also indebted to Dr Arch Johnstone of the Tennessee Earthquake Information Centre for providing the cumulative frequency data used to plot Fig. 3(b).
at Edinburgh U
niversity on July 28, 2015http://gji.oxfordjournals.org/
Dow
nloaded from
Physical links between crustal deformation and seismic hazard 487
References
Assumqao, M., 1981. The NW Scotland swarm of 1974, Geophys. J. R. astr. Soc., 67,577-586. Anderson, J . G. , 1979. Estimating the seismicity from geological structure for seismic risk studies, Bull.
B%th, M., 1981a. Earthquake magnitude - recent research and current trends, Earth Sci. Rev., 17,
B%th. M.. 1981b. Earthquake recurrence of a particular type, Pageoph, 119, 1063-1076. Botti, L. G., Pasquaie, V. & Anghinolfi, M., 1980. A new general frequency-magnitude relationship
Pageoph, 119, 196-206. Burridge, R. & Knopoff, L., 1967. Model and theoretical seismicity, Buff. seism. Soc. Am., 57,
341-371. Burton, P. W., 1978. The IGS file of seismic activity and its use for hazard assessment, Seism. Bull.
Inst. geol. Sci., No. 6 , HMSO, London. Burton, P. W., 1979. Seismic risk in Southern Europe through to India examined using Gumbel's third
distribution of extreme values, Geophys. J. R. astr. SOC., 59, 249-280. Burton, P. W., 1981. Variation in seismic risk parameters in Britain, Proc. 2nd in?. Symp. Anal. Seismi-
city and Seismic Hazard. Vol. 2, pp. 495-530, Liblice, Czechoslovakia, May 18-23, Academia, Prague.
Burton, P W., McGonigle, R. W., Makropoulos, K. C. & Ucer, S. B., 1982. Preliminary studies of seismic risk in Turkey, and the occurrence of upper bounded and other large earthquake magnitudes, Proc. int. Symp. Earthquake Prediction in the North Anatolian Fault Zone, Istanbul, Turkey, 1980 March 31-April 5, in Multidisciplinary Approach to Earthquake Production, pp. 143-172, eds Mete Isikara, A. & Vogel, Andreas, Braunschweig, Wiesbaden, Vieweg.
Burton P. W., Main, I. G. & Long, R. E., 1983. Perceptible earthquakes in the central and eastern U.S., Bull. seism. Soc. Am., 73,497-518.
Caputo, M., 1977. A mechanical model for the statistics of earthquakes, magnitude, moment and fault distribution, Bull. seism. SOC. Am., 67,849-861.
Chinnery, M. A. & North, K. G., 1975. The frequency of very large earthquakes, Science, 190, 1197- 1198.
Cornell, A. & Vanmarcke, E,, 1969. The major influences on seismic risk, Proc. 4th W.C.E.E., Santiago, Chile.
Cosentino, P. & Luzio, D., 1976. A generalisation of the frequency magnitude relation in the hypothesis of a maximum regional magnitude, Annali Geophis., 4,3-8.
Duda, S . J., 1965. Secular seismic energy release in the Circum-Pacific Belt, Tectonophys., 2, 409-452. Gumbel, E., 1958. Statistics of Extremes, Columbia University Press, New York. Hanks, T. C., Hileman, J. A. & Thatcher, W., 1975. Seismic moments of the larger earthquakes of the
Southern California region, Bull. geol. Soc. Am., 86,1131-1139. Hileman, J. A., Allen, C. R. & Nordquist, J. M., 1973. Seismicity of the Southern California region 1st
Jan. 1932 to 31st Dec. 1972, Contr. Div. Geol. planet. Sci., Calif: Inst. Techn., No. 2385. Horvarth, F. & Berckhemer, H., 1982. Mediterranean back-arc basins, Alp. Med. Geol. Ser., 7, 141-173. Howell, B. F., (Jr), 1981. On the saturation of earthquake magnitude, Bull. seism. Soc. Am., 71, 1401-
1422. Jenkinson, A. I*. , 1955. The frequency distribution of the annual maximum or minimum values of
meteorological elements, Q. JIR. met Soc., 87, 158-171. Johnston, A. C., 1981. On the use of the frequency-magnitude relation in earthquake risk assessment,
Proc. Conf: Earthquakes and Earthquake Engineering - the Eastern US. , pp. 161-181, Vol. I , ed. Beavers, J., Ann Arbor Science Ltd., the Butterworth group.
Kanamori, H., 1977. The energy release in great earthquakes,J. geophys. Res., 82. 2981-2987. Kanamori, H., 1978. Quantification of earthquakes, Nature, 271,411-414. Kanamori, H. & Anderson, D. L., 1975. Theoretical bases of some empirical relations in seismology,
King, C., 1975. Model seismicity and faulting parameters, Bull. seism. Soc. Am., 65, 245-259. King, G., 1980. A fault plane solution for the Carlisle earthquake, 26 December 1979, Nature, 286,
Knopoff, L. & Kagan, Y., 1977. Analysis of the theory of extremes as applied to earthquake problems,
Kuznetsova, K. I., Shumilina, L. S. & Zavialov, A. D., 1981. The physical sense of the magnitude-
seism SOC. Am., 69, 135-158.
315-398.
Bull. seism. SOC. Am., 65, 1073-1095.
142-143.
J. geophys. Res., 82,5647-5657.
at Edinburgh U
niversity on July 28, 2015http://gji.oxfordjournals.org/
Dow
nloaded from
488 I. G. Main and P. W. Burton frequency relation, Proc. 2nd int. Symp. Analysis of Seismicity and on Seismic Hazard, Vol. 1, pp. 27-46. Liblice, Czechoslovakia, 1981 May 18-29, Academia, Prague.
Main, I. G. & Burton, P. W., 1981. Rates of crustal deformation inferred from seismic moment and Gumbel’s third distribution of extreme values, Proc, ConJ Earthquakes and Earthquake Engineering - the Eastern US., Vol. 2, pp. 937-951. ed. Beavers, J., Ann Arbor Science Ltd, the Butterworth group.
Makjanik, B., 1980. On the frequency distribution of earthquake magnitude and intensity, Bull. seism. SOC. A m . , 70,2253-2260.
Makropoulos, K. C., 1978. The statistics of large earthquake magnitude and an evaluation of Greek Seismicity, PhD thesis, University of Edinburgh.
Marshall, P. D., 1970. Aspects of the spectral differences between earthquakes and underground explo- sions, Geophys. J. R. astr. SOC., 20, 397-416.
North, R. G., 1974. Seismic slip rates in the Mediterranean and Middle East, Nature, 252, 560-563. North, R. G., 1977. Seismic moment, source dimensions and stresses associated with earthquakes in the
Nuttli, 0. W., 1979. Seismicity of the Central United States, Geol. Soc. Am. Rev. Engrg. Geol., IV, 67-93. Nuttli, 0. W. & Herrmann, B., 1978. Creditable earthquakes for the central U.S, State of the art for
assessing earthquake hazards in the US., US. Army Engrng. Wat. Ways Exp. Station, Rep. 12, paper S- 73-1.
Papastamatiou, D., 1980. Incorporation of crustal deformation to seismic hazard analysis, Bull. seism. SOC. A m . , 70,1321-1335.
Rossiter, J. R., 1972. Sea level observations and their secular variation, Phil. Trans. R. SOC., 272, 131- 139.
Russ, D. P., 1981. Model for assessing earthquake potential and fault activity in the New Madrid seismic zone, Proc. Con$ Earthquakes and Earthquake Engineering - the Eastern U.S., Vol. 1, pp. 309- 335, ed. Beavers, J., Ann Arbor Science Ltd, the Butterworth group.
Schilt, F. S. & Reilinger, R. E., 1981. Evidence for contemporary vertical fault displacement near the New Madrid zone, Bull. seism. SOC. Am., 71, 1933-1942.
Scholz, C. H., 1968. The frequency-magnitude relation of microfracturing in rock and its relation to earthquakes, Bull. seism SOC. Am., 58, 399-415.
Sieh, K. E., 1978. Prehistoric large earthquakes produced by slip on the San Andreas fault at Pallet Creek, California, J. geophys. Res., 83, 3907-3939.
Singh, S. K. & Havskov, J., 1980. On moment magnitude scale, Bull. seism. SOC. Am., 70, 379-383. Singh, S. K., Rodriguez, M. & Esteva, L., 1983. Statistics of small earthquakes and frequency of
occurrence of large earthquakes along the Mexican subduction zone, Bull. seism. Soc. Am., 73, 1779-1796.
Sissons, J . B. & Cornish, R., 1982. Rapid localised glacio-isostatic uplift at Glen Roy, Scotland, Nature, 297, 213-214.
Weibull, W., 1951. A statistical distribution function of wide applicability,J. appl. Mech., 18,293-297. Yegulalp, T. M. & Kuo, J. T., 1974. Statistical prediction of the occurrence of maximum magnitude
Zoback, M. D., Hamilton, R. M., Crone, A. J., Russ, D. P., McKeown, F. A. & Brockman, S. R., 1980.
Zoback, M. L. & Zoback, M., 1980. State of stress in the conterminous United States, J. geophys. Rex,
Mediterranean and Middle East, Geophys. J. R. astr. SOC., 48, 137-162.
earthquakes, Bull. seism. SOC. Am., 64, 393-414.
Recurrent intraplate tectonism in the New Madrid seismic zone, Science, 209, 971-976.
85,6113-6159.
at Edinburgh U
niversity on July 28, 2015http://gji.oxfordjournals.org/
Dow
nloaded from
Related Documents