Physical Assembly Mapper: A Model-driven Optimization Tool for QoS-enabled Component Middleware Vanderbilt University Nashville, Tennessee Institute for Software Integrated Systems RTAS 2008, April 22, 2008 Krishnakumar Balasubramanian, Douglas C. Schmidt {kitty,schmidt}@dre.vanderbilt.e du (presented by Aniruddha Gokhale)

Welcome message from author
This document is posted to help you gain knowledge. Please leave a comment to let me know what you think about it! Share it to your friends and learn new things together.
Transcript

Physical Assembly Mapper:A Model-driven Optimization Tool for QoS-enabled Component Middleware
Vanderbilt University Nashville, Tennessee
Institute for Software Integrated Systems
RTAS 2008, April 22, 2008
Krishnakumar Balasubramanian, Douglas C.
Schmidt{kitty,schmidt}@dre.vanderbilt.edu(presented by Aniruddha Gokhale)
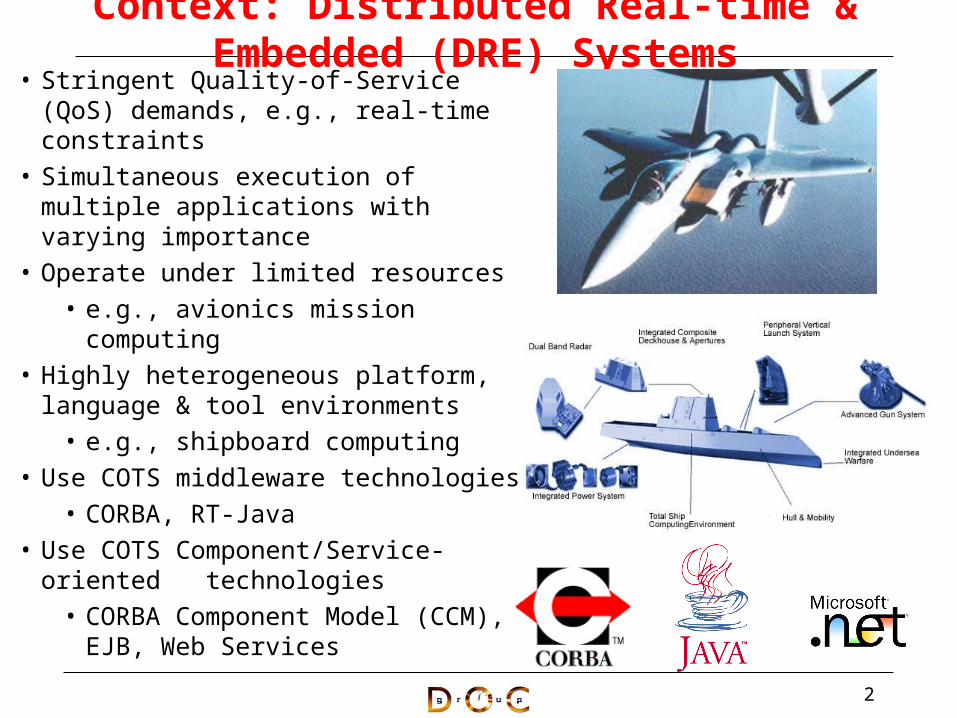
Context: Distributed Real-time & Embedded (DRE) Systems• Stringent Quality-of-Service (QoS)
demands, e.g., real-time constraints• Simultaneous execution of multiple
applications with varying importance • Operate under limited resources
• e.g., avionics mission computing• Highly heterogeneous platform, language
& tool environments• e.g., shipboard computing
• Use COTS middleware technologies• CORBA, RT-Java
• Use COTS Component/Service-oriented technologies
• CORBA Component Model (CCM), EJB, Web Services
2
3
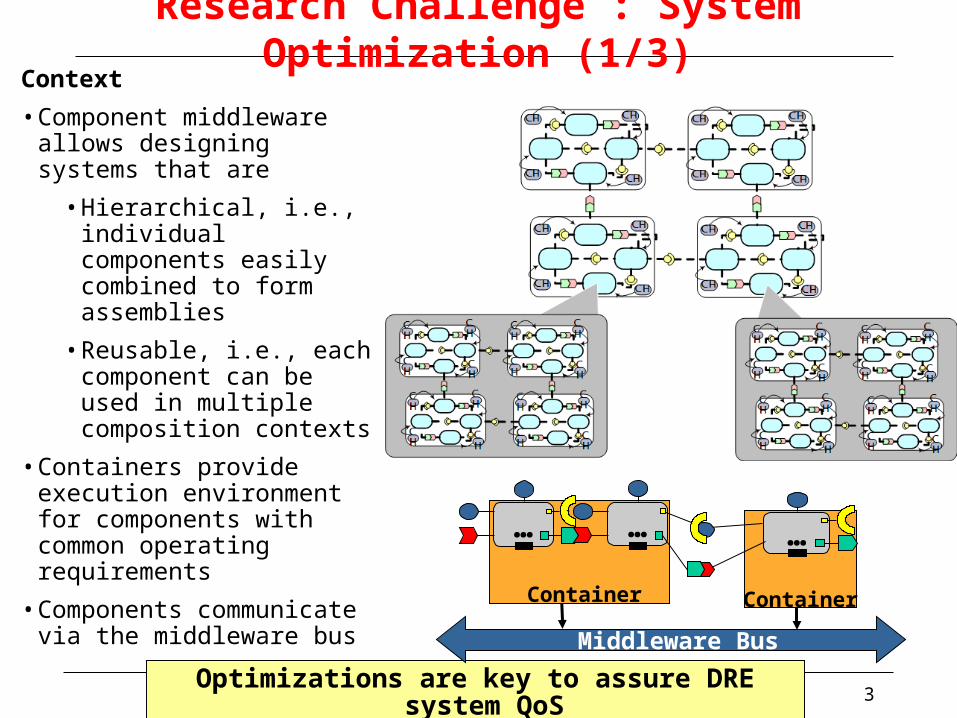
Research Challenge : System Optimization (1/3)Context
• Component middleware allows designing systems that are
• Hierarchical, i.e., individual components easily combined to form assemblies
• Reusable, i.e., each component can be used in multiple composition contexts
• Containers provide execution environment for components with common operating requirements
• Components communicate via the middleware bus
Optimizations are key to assure DRE system QoS
Middleware Bus
Container
…
Container
… …

4
Research Challenge: System Optimization (2/3)Current state of optimizations:
• Collocated method invocations
• Optimize the (de-)marshaling costs by exploiting locality
• Specialization of request path by exploiting protocol properties
• Caching, Compression, various encoding schemes
• Reducing communication costs
• Moving data closer to the consumers by replication
• Reflection-based approaches
• Choosing appropriate alternate implementations at run-time

6
Research Challenge : System Optimization (3/3)Problem
• Systems with large number of components tend to exhibit
• Footprint overhead due to auxiliary middleware infrastructure in certain composition contexts
• e.g., component factories/ contexts when the components are collocated
• Latency overhead due to sub-optimal configuration of middleware
• e.g., latency between components placed in different containers
Node Application
Container
CHCH
CHCH
CHCH
CHCH
CHCH
CHCH
CHCH
CHCH
CH
Receptacle
Facet
Event Sink
Event SourceComponent Home
Component Assembly
Component Remote Invocation
Collocated Invocation
Creates
Need additional optimizations to component middleware

9
Node Application
Container
CHCH
CHCH
CHCH
CHCH
CHCH
CHCH
CHCH
CHCH
CH
Receptacle
Facet
Event Sink
Event SourceComponent Home
Component Assembly
Component Remote Invocation
Collocated Invocation
Creates
Composition overhead in large-scale systems
• Blind adherence to platform semantics
• Inefficient middleware glue code generation per component
• Examples:
• Creation of a factory object & component context per component
• Increase in overhead with increase in number of components
Component System Optimizations: Unresolved Challenges

Solution Approach: Deployment-time Fusion• New class of optimization
techniques – deployment-time fusion
• Merges multiple elements, e.g., components, QoS policies, into a semantically equivalent element
• Differences in fusion techniques
• Type of elements fused
• Scope of fusion
• Rules governing fusion
• e.g., Component Fusion
• Merges multiple components into a single component subject to fusion constraints
10
Deployment-Time Fusion
Component
Required Interface Provided Interface Event SinkEvent Source
Physical Assembly
Collocation Group Application AssemblyDeployment Plan

Intuition behind Deployment-time Fusion Soln• If n = no. of candidate elements
for fusion, k = no. of elements resulting from fusion, savings due to fusion will be (n – k ) / n
• Best case if k = 1, i.e., fusion creates a single element
• Given an undirected graph
G = (V,E) (fusion graph)
• V = {Candidate elements}
• E = {(u,v) | u, v are elements and CanMerge (u, v) is true}
• Finding largest set of elements that can be fused together = Finding maximum clique in G
• Well-known NP-Complete problem
13

Deployment-time Fusion Approach• Enumerate all maximal cliques
• NP-Hard; O(3n/3) time complexity• Our approach
• Use modified Bron-Kerbosch (BK) algorithm to enumerate maximal cliques
• Fastest known algorithm• Use domain-specific heuristics
• Stop enumeration after first maximal clique
• Remove vertices & repeat (safe due to characteristics of BK)
• Only use elements which occur equal number of times as candidates (for component fusion only)
14
Maximum Clique
Maximal Clique
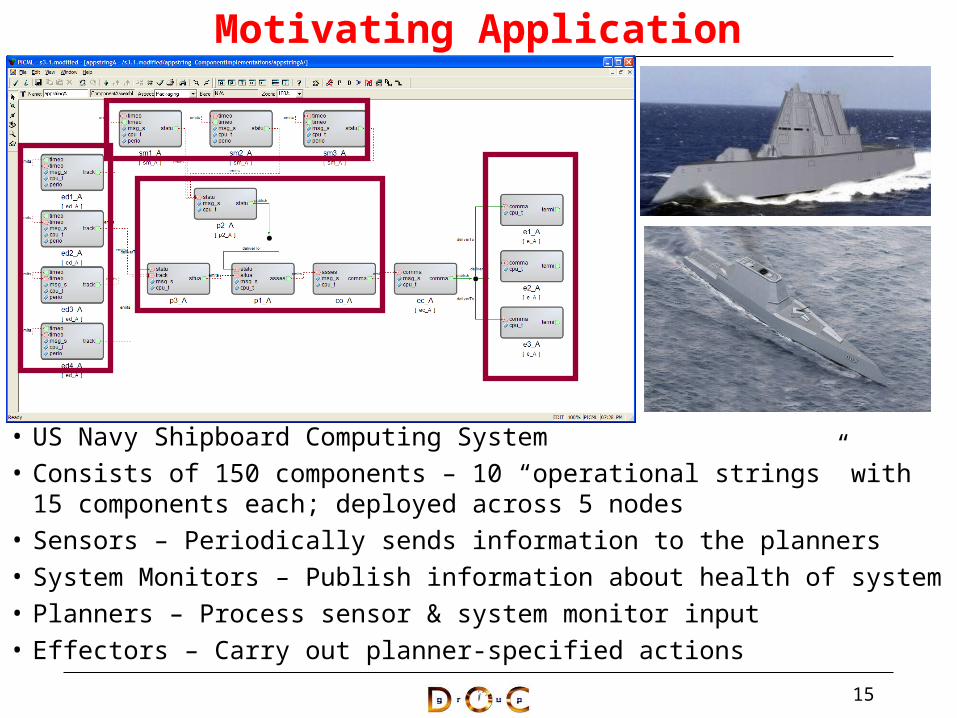
Motivating Application
• US Navy Shipboard Computing System• Consists of 150 components – 10 “operational strings” with 15 components
each; deployed across 5 nodes• Sensors – Periodically sends information to the planners• System Monitors – Publish information about health of system• Planners – Process sensor & system monitor input• Effectors – Carry out planner-specified actions
15

Component Fusion Algorithms (1/2)• Two variants for component
fusion• Local Component Fusion• Global Component Fusion
• Local Component Fusion• Operates at the scope of a
single deployment plan• Input
• Set of components deployed into each collocation group on every node of a single deployment plan
• Output• Physical assemblies • Modified assembly &
deployment plan22

Component Fusion Algorithms (2/2)• Global Component Fusion
• Operates at the scope of all deployment plans of a single application
• Set of components that are fused together spans multiple deployment plans
• Merges the individual deployment plans into a unified deployment plan
23
Global Component Fusion
Component
Required Interface Provided Interface Event SinkEvent Source
Physical Assembly
Collocation Group Application AssemblyDeployment Plan

Key Artifact of Component Fusion: Physical Assembly
25
• Physical Assembly
• Created from the set of components that are deployed within a single process of a target node
• Subject to various constraints, e.g.,
• No two ports of the set of components should have the same name
• No changes to individual component implementations
• Physical Assembly indistinguishable to external clients
• All valid operations on individual components are still valid

Prototype Implementation
26
PICMLmodel
CH CH
CHCH
OS KERNEL
OS I/O Subsystem
Network Interfaces
MIDDLEWARE
Physical Assembly Mapper
Deployment Plan
Configuration Files
CH
Required Interface
Provided Interface
Event Sink
Event SourceComponent Home
Component Assembly
Component Invocation
Creates
CH
CH
CH
CH
CH
CH
CH
CH
CH CH
CHCH
• Physical Assembly Mapper (PAM)
• Uses the application model as the input
• Exploits knowledge of platform semantics to rewrite the input model to a functionally equivalent output model
• Generates middleware glue-code
• Generates deployment configuration files
• Operates just before deployment
• Can be viewed as a “deployment-time compiler optimizer”
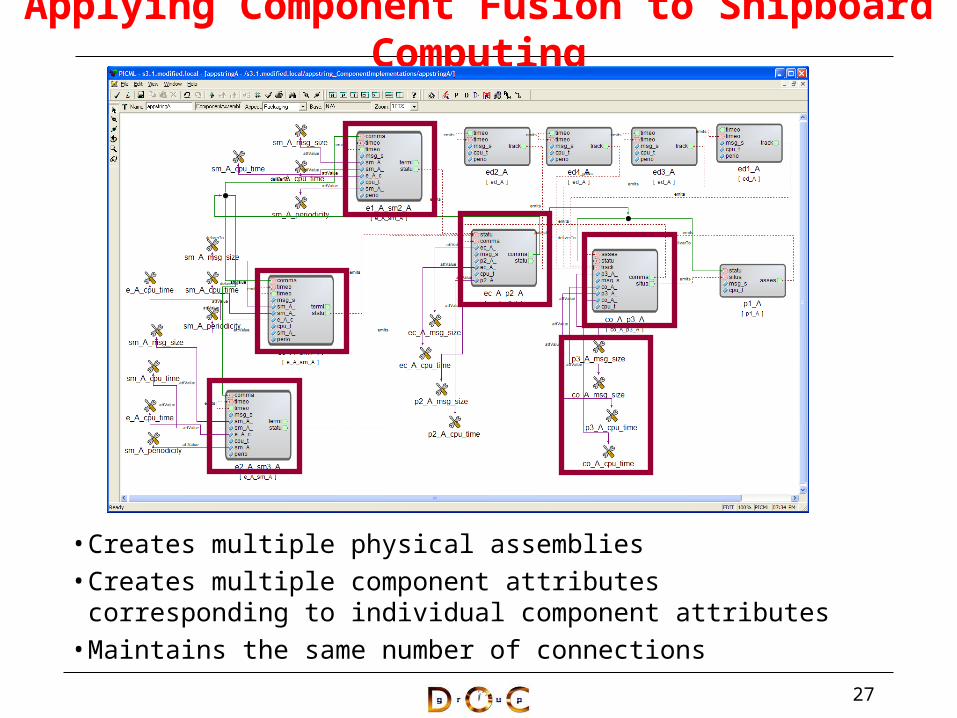
Applying Component Fusion to Shipboard Computing
• Creates multiple physical assemblies• Creates multiple component attributes corresponding to individual
component attributes• Maintains the same number of connections
27

Footprint Experiments Setup• Experiments were conducted
using ISISlab• Five nodes running Windows
XP SP2• CIAO Version 0.5.10 used as
baseline for comparison• Two kinds of footprint
measurements• Static – Code & Static
Data• Dynamic – Heap Memory
used • Use vadump.exe to take a
snapshot of working set of process hosting components
• Measure number of private & shareable pages
28

Footprint Results (1/2)
29
Node Specific Static Footprint
Node Specific Dynamic Footprint
Total Static Footprint Total Dynamic Footprint31% reduction
49% reduction
18% reduction
45% reduction
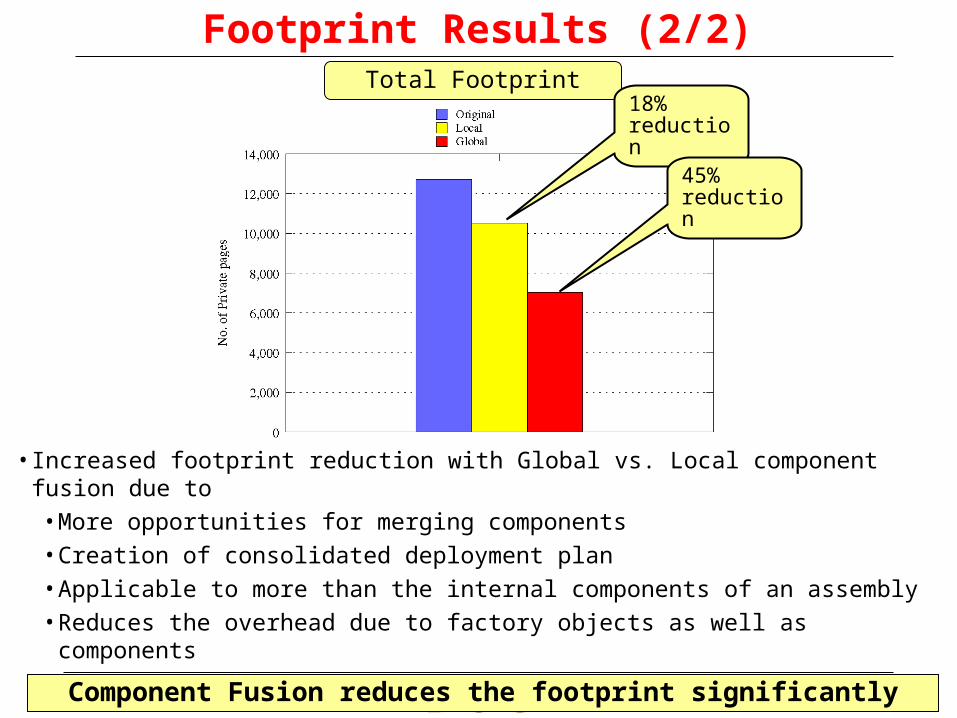
Footprint Results (2/2)
• Increased footprint reduction with Global vs. Local component fusion due to• More opportunities for merging components• Creation of consolidated deployment plan• Applicable to more than the internal components of an assembly• Reduces the overhead due to factory objects as well as components
30Component Fusion reduces the footprint significantly
Total Footprint18% reduction
45% reduction

Concluding Remarks
34Tools can be downloaded from www.dre.vanderbilt.edu/CoSMIC/
• Our research • Describes a model-driven
approach to deployment-time optimizations
• Two algorithms• Local and Global
component fusion • Implemented via the
Physical Assembly Mapper (PAM)
• PAM’s deployment-time optimization techniques
• Resulted in a 45% decrease in footprint compared to conventional middleware technologies

Thank you!
35
Related Documents