Phylogeography of the snakeskin chiton Sypharochiton pelliserpentis (Mollusca: Polyplacophora) around New Zealand: are seasonal near-shore upwelling events a dynamic barrier to gene flow? ANDREW J. VEALE 1 * and SHANE D. LAVERY 1,2 1 Leigh Marine Laboratory, University of Auckland, Auckland, New Zealand 2 Molecular Ecology and Evolution Laboratory, School of Biological Sciences, University of Auckland, Auckland, New Zealand Received 20 March 2011; revised 30 May 2011; accepted for publication 31 May 2011We present a phylogeographic study of the New Zealand and Australian intertidal chiton Sypharochiton pelliserpentis that was conducted to ascertain levels of population connectivity and to investigate the effect of previously hypothesized general phylogeographic boundaries. The analysis incorporated both cytochrome oxidase subunit 1 sequence data (approximately 700 bp) and RFLP data from 29 populations around New Zealand, and from one Australian population, for a total of N = 472. The major population structure observed was a strong disjunction between northern and southern populations (FST = 0.47), with the genetic breaks located at Cloudy/Clifford Bay and Farewell Spit, at the northern tip of the South Island. This finding corresponds with a common phylogeographic barrier observed in a number of other marine invertebrates, highlighting its significance and ubiquity. A third barrier to gene flow was identified between Spirits Bay and Ahipara, around the northern tip of the North Island. All three of these areas that exhibit significant population disjunctions have strong near-shore upwelling along with water current movement offshore, and these features are prevalent during the time of year when S. pelliserpentis spawns. That these seasonal hydrographic patterns contribute to the population structuring of S. pelliserpentis is supported by comparison with other phylogeographic studies of marine invertebrates, where the strength of this barrier seems to correlate with spawning season. © 2011 The Linnean Society of London, Biological Journal of the Linnean Society, 2011, 104, 552–563. ADDITIONAL KEYWORDS: benthic – biogeography – connectivity – larval dispersal – marine. INTRODUCTION There is growing evidence that widespread marine organisms are often more genetically structured than expected given their high dispersal potential and the apparent lack of dispersal barriers within marine systems (Palumbi, 1997; Benzie, 1999; Riginos & Nachman, 2001). Phylogeographic studies integrate genetic and geographic data and, by linking these with studies of hydrology, larval behaviour and historical events, we have recently begun to understand the processes that constitute barriers to dispersal in the marine environment. One significant physical pheno- menon in the oceans correlated with phylogeographic disjunction is near-shore cold-water upwelling (Bowen et al., 2001; Lessios, Kessing & Pearse, 2001; Sponer & Roy, 2002). Two causative mechanisms have been pro- posed for this – that cold-water upwelling may trans- port larvae offshore (Harris, 1990) or, alternatively, that the cold-water upwelling may directly impact upon the survival of larvae (Menge et al., 2003). Near- shore upwelling is often linked to local currents and wind patterns and therefore may be seasonal in nature. Seasonal patterns that alter upwelling inten- sity and duration, along with current direction and *Corresponding author. Current address: Biodiversity, Biosecurity and Conservation, School of Biological Sciences, University of Auckland, New Zealand. E-mail: [email protected] Biological Journal of the Linnean Society, 2011, 104, 552–563. With 8 figures © 2011 The Linnean Society of London, Biological Journal of the Linnean Society, 2011, 104, 552–563 552

Welcome message from author
This document is posted to help you gain knowledge. Please leave a comment to let me know what you think about it! Share it to your friends and learn new things together.
Transcript
Phylogeography of the snakeskin chiton Sypharochitonpelliserpentis (Mollusca: Polyplacophora) around NewZealand: are seasonal near-shore upwelling events adynamic barrier to gene flow?
ANDREW J. VEALE1* and SHANE D. LAVERY1,2
1Leigh Marine Laboratory, University of Auckland, Auckland, New Zealand2Molecular Ecology and Evolution Laboratory, School of Biological Sciences, University of Auckland,Auckland, New Zealand
Received 20 March 2011; revised 30 May 2011; accepted for publication 31 May 2011bij_1743 552..563
We present a phylogeographic study of the New Zealand and Australian intertidal chiton Sypharochiton pelliserpentisthat was conducted to ascertain levels of population connectivity and to investigate the effect of previouslyhypothesized general phylogeographic boundaries. The analysis incorporated both cytochrome oxidase subunit 1sequence data (approximately 700 bp) and RFLP data from 29 populations around New Zealand, and from oneAustralian population, for a total of N = 472. The major population structure observed was a strong disjunctionbetween northern and southern populations (FST = 0.47), with the genetic breaks located at Cloudy/Clifford Bay andFarewell Spit, at the northern tip of the South Island. This finding corresponds with a common phylogeographicbarrier observed in a number of other marine invertebrates, highlighting its significance and ubiquity. A third barrierto gene flow was identified between Spirits Bay and Ahipara, around the northern tip of the North Island. All threeof these areas that exhibit significant population disjunctions have strong near-shore upwelling along with watercurrent movement offshore, and these features are prevalent during the time of year when S. pelliserpentis spawns.That these seasonal hydrographic patterns contribute to the population structuring of S. pelliserpentis is supportedby comparison with other phylogeographic studies of marine invertebrates, where the strength of this barrier seemsto correlate with spawning season. © 2011 The Linnean Society of London, Biological Journal of the LinneanSociety, 2011, 104, 552–563.
ADDITIONAL KEYWORDS: benthic – biogeography – connectivity – larval dispersal – marine.
INTRODUCTION
There is growing evidence that widespread marineorganisms are often more genetically structured thanexpected given their high dispersal potential and theapparent lack of dispersal barriers within marinesystems (Palumbi, 1997; Benzie, 1999; Riginos &Nachman, 2001). Phylogeographic studies integrategenetic and geographic data and, by linking these withstudies of hydrology, larval behaviour and historical
events, we have recently begun to understand theprocesses that constitute barriers to dispersal in themarine environment. One significant physical pheno-menon in the oceans correlated with phylogeographicdisjunction is near-shore cold-water upwelling (Bowenet al., 2001; Lessios, Kessing & Pearse, 2001; Sponer &Roy, 2002). Two causative mechanisms have been pro-posed for this – that cold-water upwelling may trans-port larvae offshore (Harris, 1990) or, alternatively,that the cold-water upwelling may directly impactupon the survival of larvae (Menge et al., 2003). Near-shore upwelling is often linked to local currents andwind patterns and therefore may be seasonal innature. Seasonal patterns that alter upwelling inten-sity and duration, along with current direction and
*Corresponding author. Current address: Biodiversity,Biosecurity and Conservation, School of Biological Sciences,University of Auckland, New Zealand. E-mail:[email protected]
Biological Journal of the Linnean Society, 2011, 104, 552–563. With 8 figures
© 2011 The Linnean Society of London, Biological Journal of the Linnean Society, 2011, 104, 552–563552
eddy formation, have the potential to create a ‘seasonaldynamic filter’ to gene flow, which would affect organ-isms that spawn at separate times of the year differ-ently (Hohenlohe, 2004; Baums, Paris & Cherubin,2006).
Within the New Zealand coastal environment, puta-tive dispersal barriers have been proposed on bothcoasts south of Greater Cook Strait, with a north/southsplit in population structure observed in a number ofwide-ranging studies (reviewed in Ross et al., 2009).These dispersal barriers were first suggested in astudy of the green-lipped mussel Perna canaliculus,with the proposed causative agent being the combina-tion of present day near-shore current systems andwind-induced upwelling events (Apte & Gardner,2002). This putative dispersal barrier has since beeninvestigated using the cushion star Patriella regularis(Ayers & Waters, 2005) and three limpet species in thegenus Cellana (Goldstien, Schiel & Gemmell, 2006),which all show some degree of major population sub-division around this region. Despite these subsequentstudies, a precise position of these barriers on eachcoast is still uncertain, attributable to the differingsampling regimes around the hypothetical disjunctionpoints. The hydrological factors that cause this dis-junction are similarly uncertain. It has been arguedthat the phylogeographic pattern displayed by theseorganisms is more likely the result of incipient allo-patric speciation as a result of habitat fragmentationrather than intermittent upwelling events (Goldstienet al., 2006). Nonetheless, comparative phylogeo-graphic studies in a range of taxa with varying life-history strategies are needed to come to meaningfulconclusions about the process of population subdivi-sion in this hydrologically complex region.
The snakeskin chiton (Sypharochiton pelliserpentis)is one of the most common and widespread of allshore molluscs of New Zealand (Knox, 1953). It has acountrywide distribution – including the ChathamIslands 800 km east of the main islands (Suter, 1913;Dell, 1951; Powell, 1979) and is common on mostrocky shores (Iredale & Hull, 1932). Its distributionalso extends to eastern Australia, where it is foundon the coasts of Tasmania, Victoria and New SouthWales. It has been assumed to have a 1- to 4-daypelagic larval phase (Pearse, 1979). Sypharochitonpelliserpentis is often extremely numerous on NewZealand shores, reaching densities of 228 m–2, and ithas been shown to occupy a wide range of shore levelswherever there is a solid substrate available – frominner estuaries to high-energy surf beaches (Boyle,1970). These features mean that S. pelliserpentis isideal for a wide-ranging and comprehensive phylogeo-graphic study to address questions posed by previousstudies. Here, we use mtDNA cytochrome oxidasesubunit 1 (COI) sequences and RFLPs to investi-
gate the phylogeography of S. pelliserpentis in NewZealand. Specifically, we examined the presence andlocation of the hypothesized dispersive barrier aroundGreater Cook Strait, with the aim to identify othermajor barriers to dispersal around New Zealand.
MATERIAL AND METHODSSPECIMEN COLLECTION
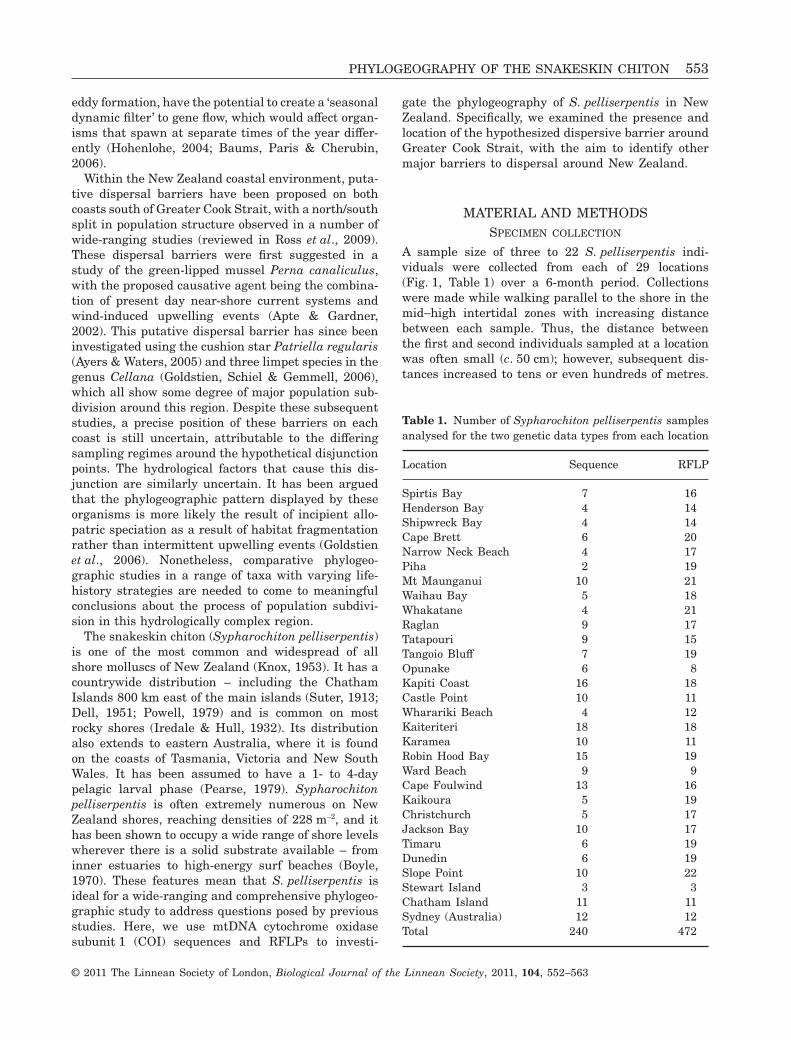
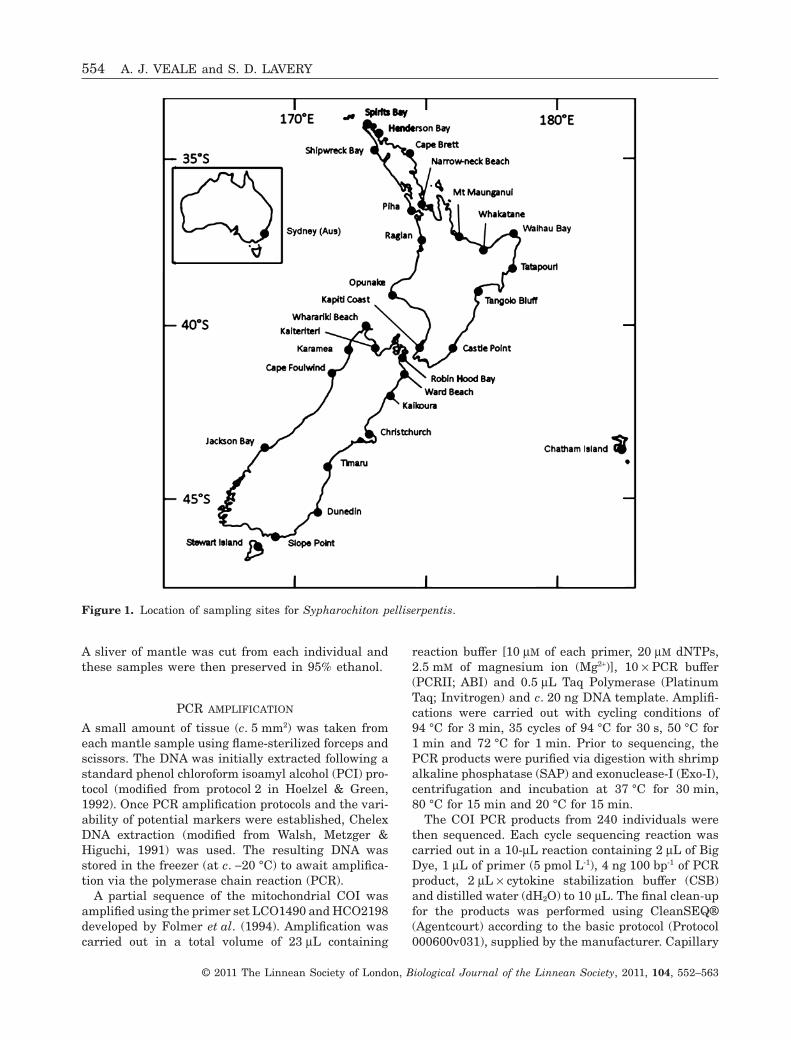
A sample size of three to 22 S. pelliserpentis indi-viduals were collected from each of 29 locations(Fig. 1, Table 1) over a 6-month period. Collectionswere made while walking parallel to the shore in themid-high intertidal zones with increasing distancebetween each sample. Thus, the distance betweenthe first and second individuals sampled at a locationwas often small (c. 50 cm); however, subsequent dis-tances increased to tens or even hundreds of metres.
Table 1. Number of Sypharochiton pelliserpentis samplesanalysed for the two genetic data types from each location
Location Sequence RFLP
Spirtis Bay 7 16Henderson Bay 4 14Shipwreck Bay 4 14Cape Brett 6 20Narrow Neck Beach 4 17Piha 2 19Mt Maunganui 10 21Waihau Bay 5 18Whakatane 4 21Raglan 9 17Tatapouri 9 15Tangoio Bluff 7 19Opunake 6 8Kapiti Coast 16 18Castle Point 10 11Wharariki Beach 4 12Kaiteriteri 18 18Karamea 10 11Robin Hood Bay 15 19Ward Beach 9 9Cape Foulwind 13 16Kaikoura 5 19Christchurch 5 17Jackson Bay 10 17Timaru 6 19Dunedin 6 19Slope Point 10 22Stewart Island 3 3Chatham Island 11 11Sydney (Australia) 12 12Total 240 472
PHYLOGEOGRAPHY OF THE SNAKESKIN CHITON 553
© 2011 The Linnean Society of London, Biological Journal of the Linnean Society, 2011, 104, 552–563
A sliver of mantle was cut from each individual andthese samples were then preserved in 95% ethanol.
PCR AMPLIFICATION
A small amount of tissue (c. 5 mm2) was taken fromeach mantle sample using flame-sterilized forceps andscissors. The DNA was initially extracted following astandard phenol chloroform isoamyl alcohol (PCI) pro-tocol (modified from protocol 2 in Hoelzel & Green,1992). Once PCR amplification protocols and the vari-ability of potential markers were established, ChelexDNA extraction (modified from Walsh, Metzger &Higuchi, 1991) was used. The resulting DNA wasstored in the freezer (at c. -20 °C) to await amplifica-tion via the polymerase chain reaction (PCR).
A partial sequence of the mitochondrial COI wasamplified using the primer set LCO1490 and HCO2198developed by Folmer et al. (1994). Amplification wascarried out in a total volume of 23 mL containing
reaction buffer [10 mM of each primer, 20 mM dNTPs,2.5 mM of magnesium ion (Mg2+)], 10 ¥ PCR buffer(PCRII; ABI) and 0.5 mL Taq Polymerase (PlatinumTaq; Invitrogen) and c. 20 ng DNA template. Amplifi-cations were carried out with cycling conditions of94 °C for 3 min, 35 cycles of 94 °C for 30 s, 50 °C for1 min and 72 °C for 1 min. Prior to sequencing, thePCR products were purified via digestion with shrimpalkaline phosphatase (SAP) and exonuclease-I (Exo-I),centrifugation and incubation at 37 °C for 30 min,80 °C for 15 min and 20 °C for 15 min.
The COI PCR products from 240 individuals werethen sequenced. Each cycle sequencing reaction wascarried out in a 10-mL reaction containing 2 mL of BigDye, 1 mL of primer (5 pmol L-1), 4 ng 100 bp-1 of PCRproduct, 2 mL ¥ cytokine stabilization buffer (CSB)and distilled water (dH2O) to 10 mL. The final clean-upfor the products was performed using CleanSEQ®(Agentcourt) according to the basic protocol (Protocol000600v031), supplied by the manufacturer. Capillary
Figure 1. Location of sampling sites for Sypharochiton pelliserpentis.
554 A. J. VEALE and S. D. LAVERY
© 2011 The Linnean Society of London, Biological Journal of the Linnean Society, 2011, 104, 552–563
separation and analysis was performed using anautomated ABI prism 3130XL capillary sequencerfollowing the basic ABI cycle sequencing protocol.
RESTRICTION ENZYME DIGESTS
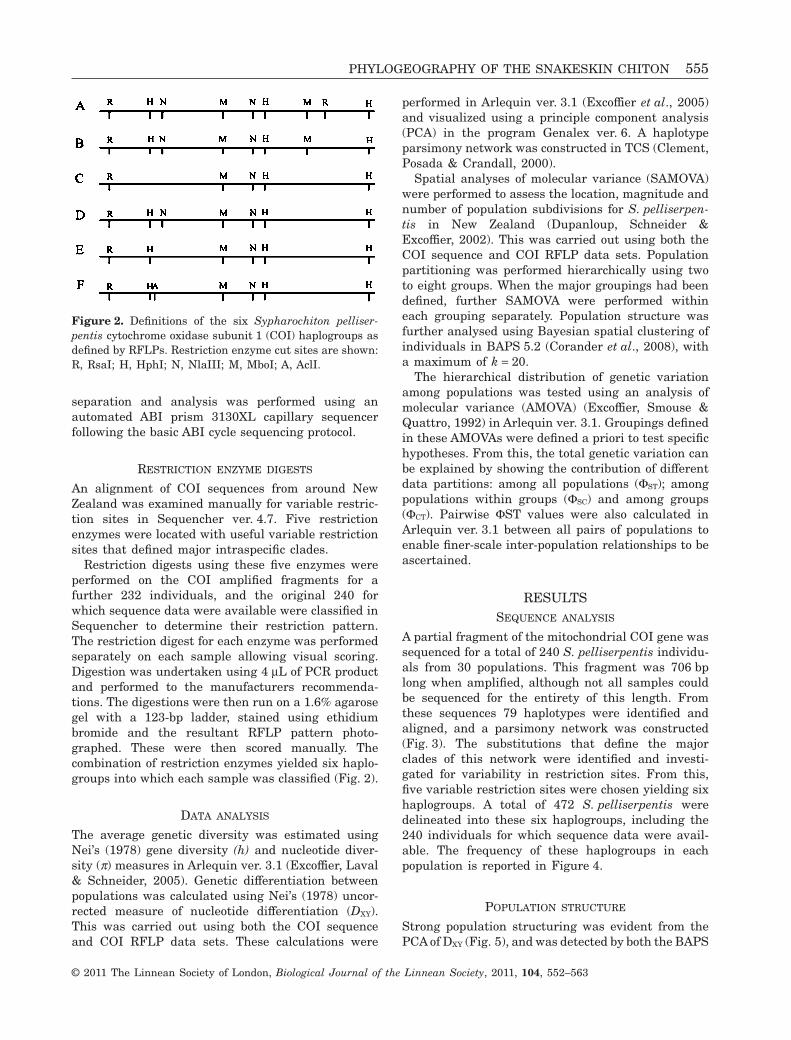
An alignment of COI sequences from around NewZealand was examined manually for variable restric-tion sites in Sequencher ver. 4.7. Five restrictionenzymes were located with useful variable restrictionsites that defined major intraspecific clades.
Restriction digests using these five enzymes wereperformed on the COI amplified fragments for afurther 232 individuals, and the original 240 forwhich sequence data were available were classified inSequencher to determine their restriction pattern.The restriction digest for each enzyme was performedseparately on each sample allowing visual scoring.Digestion was undertaken using 4 mL of PCR productand performed to the manufacturers recommenda-tions. The digestions were then run on a 1.6% agarosegel with a 123-bp ladder, stained using ethidiumbromide and the resultant RFLP pattern photo-graphed. These were then scored manually. Thecombination of restriction enzymes yielded six haplo-groups into which each sample was classified (Fig. 2).
DATA ANALYSIS
The average genetic diversity was estimated usingNei’s (1978) gene diversity (h) and nucleotide diver-sity (p) measures in Arlequin ver. 3.1 (Excoffier, Laval& Schneider, 2005). Genetic differentiation betweenpopulations was calculated using Nei’s (1978) uncor-rected measure of nucleotide differentiation (DXY).This was carried out using both the COI sequenceand COI RFLP data sets. These calculations were
performed in Arlequin ver. 3.1 (Excoffier et al., 2005)and visualized using a principle component analysis(PCA) in the program Genalex ver. 6. A haplotypeparsimony network was constructed in TCS (Clement,Posada & Crandall, 2000).
Spatial analyses of molecular variance (SAMOVA)were performed to assess the location, magnitude andnumber of population subdivisions for S. pelliserpen-tis in New Zealand (Dupanloup, Schneider &Excoffier, 2002). This was carried out using both theCOI sequence and COI RFLP data sets. Populationpartitioning was performed hierarchically using twoto eight groups. When the major groupings had beendefined, further SAMOVA were performed withineach grouping separately. Population structure wasfurther analysed using Bayesian spatial clustering ofindividuals in BAPS 5.2 (Corander et al., 2008), witha maximum of k = 20.
The hierarchical distribution of genetic variationamong populations was tested using an analysis ofmolecular variance (AMOVA) (Excoffier, Smouse &Quattro, 1992) in Arlequin ver. 3.1. Groupings definedin these AMOVAs were defined a priori to test specifichypotheses. From this, the total genetic variation canbe explained by showing the contribution of differentdata partitions: among all populations (FST); amongpopulations within groups (FSC) and among groups(FCT). Pairwise FST values were also calculated inArlequin ver. 3.1 between all pairs of populations toenable finer-scale inter-population relationships to beascertained.
RESULTSSEQUENCE ANALYSIS
A partial fragment of the mitochondrial COI gene wassequenced for a total of 240 S. pelliserpentis individu-als from 30 populations. This fragment was 706 bplong when amplified, although not all samples couldbe sequenced for the entirety of this length. Fromthese sequences 79 haplotypes were identified andaligned, and a parsimony network was constructed(Fig. 3). The substitutions that define the majorclades of this network were identified and investi-gated for variability in restriction sites. From this,five variable restriction sites were chosen yielding sixhaplogroups. A total of 472 S. pelliserpentis weredelineated into these six haplogroups, including the240 individuals for which sequence data were avail-able. The frequency of these haplogroups in eachpopulation is reported in Figure 4.
POPULATION STRUCTURE
Strong population structuring was evident from thePCA of DXY (Fig. 5), and was detected by both the BAPS
Figure 2. Definitions of the six Sypharochiton pelliser-pentis cytochrome oxidase subunit 1 (COI) haplogroups asdefined by RFLPs. Restriction enzyme cut sites are shown:R, RsaI; H, HphI; N, NlaIII; M, MboI; A, AclI.
PHYLOGEOGRAPHY OF THE SNAKESKIN CHITON 555
© 2011 The Linnean Society of London, Biological Journal of the Linnean Society, 2011, 104, 552–563
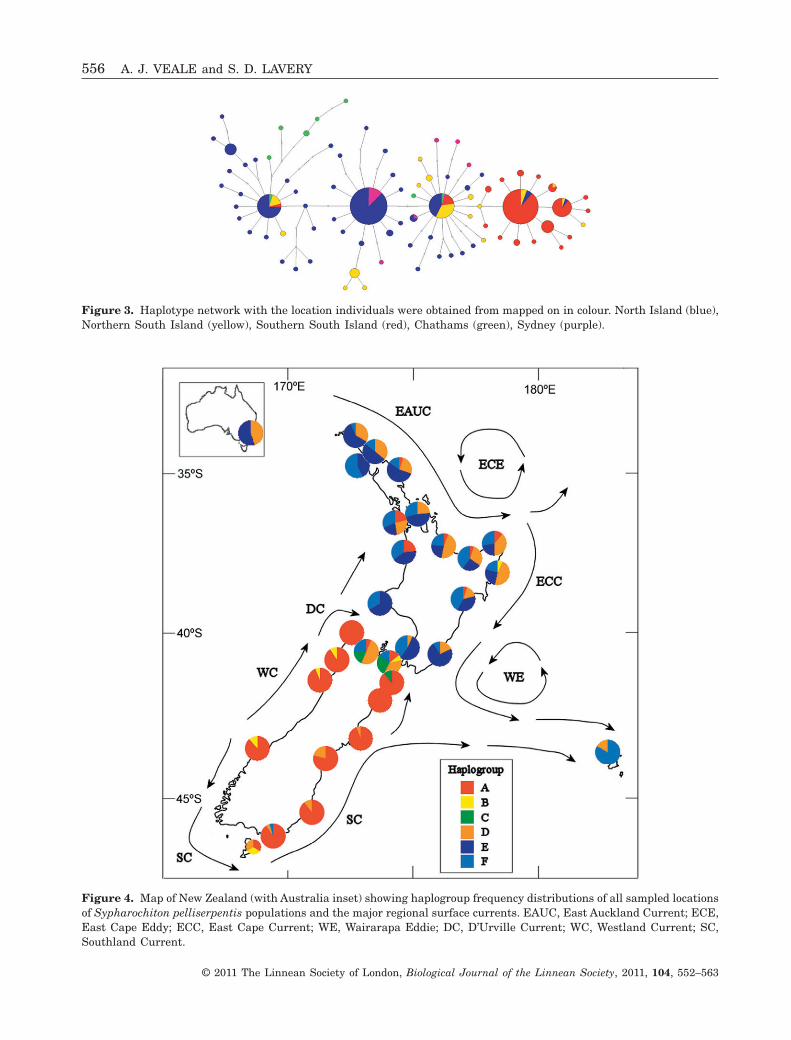
Figure 3. Haplotype network with the location individuals were obtained from mapped on in colour. North Island (blue),Northern South Island (yellow), Southern South Island (red), Chathams (green), Sydney (purple).
Figure 4. Map of New Zealand (with Australia inset) showing haplogroup frequency distributions of all sampled locationsof Sypharochiton pelliserpentis populations and the major regional surface currents. EAUC, East Auckland Current; ECE,East Cape Eddy; ECC, East Cape Current; WE, Wairarapa Eddie; DC, D’Urville Current; WC, Westland Current; SC,Southland Current.
556 A. J. VEALE and S. D. LAVERY
© 2011 The Linnean Society of London, Biological Journal of the Linnean Society, 2011, 104, 552–563
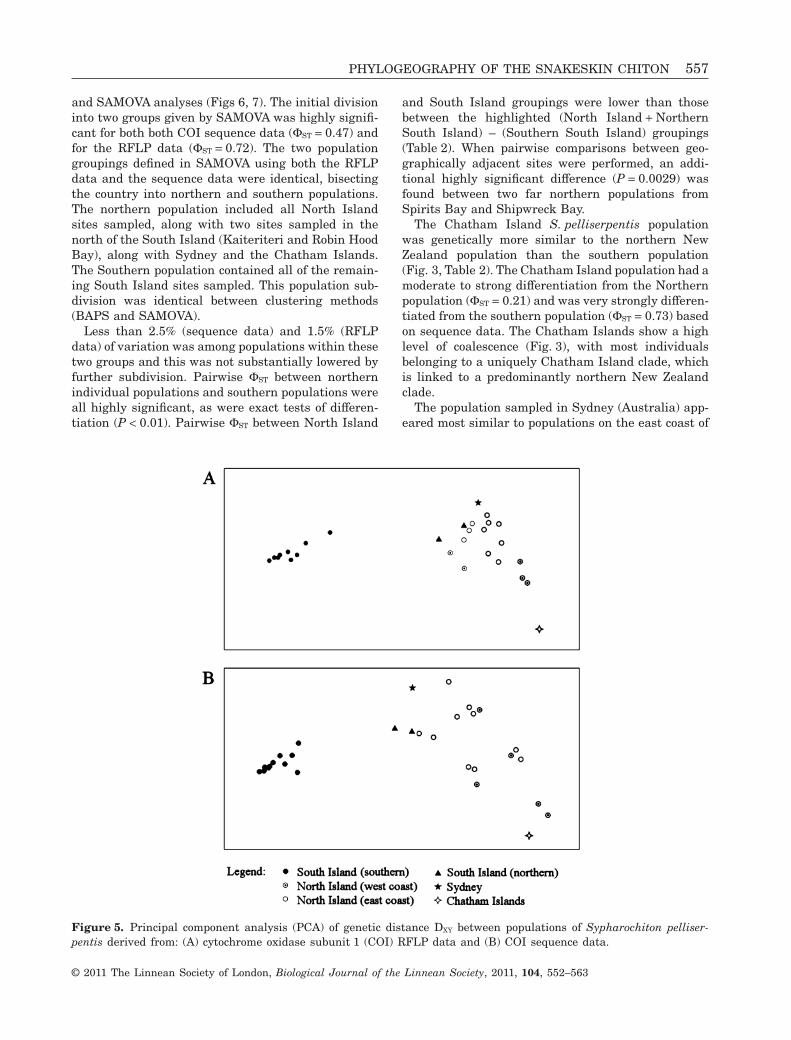
and SAMOVA analyses (Figs 6, 7). The initial divisioninto two groups given by SAMOVA was highly signifi-cant for both both COI sequence data (FST = 0.47) andfor the RFLP data (FST = 0.72). The two populationgroupings defined in SAMOVA using both the RFLPdata and the sequence data were identical, bisectingthe country into northern and southern populations.The northern population included all North Islandsites sampled, along with two sites sampled in thenorth of the South Island (Kaiteriteri and Robin HoodBay), along with Sydney and the Chatham Islands.The Southern population contained all of the remain-ing South Island sites sampled. This population sub-division was identical between clustering methods(BAPS and SAMOVA).
Less than 2.5% (sequence data) and 1.5% (RFLPdata) of variation was among populations within thesetwo groups and this was not substantially lowered byfurther subdivision. Pairwise FST between northernindividual populations and southern populations wereall highly significant, as were exact tests of differen-tiation (P < 0.01). Pairwise FST between North Island
and South Island groupings were lower than thosebetween the highlighted (North Island + NorthernSouth Island) – (Southern South Island) groupings(Table 2). When pairwise comparisons between geo-graphically adjacent sites were performed, an addi-tional highly significant difference (P = 0.0029) wasfound between two far northern populations fromSpirits Bay and Shipwreck Bay.
The Chatham Island S. pelliserpentis populationwas genetically more similar to the northern NewZealand population than the southern population(Fig. 3, Table 2). The Chatham Island population had amoderate to strong differentiation from the Northernpopulation (FST = 0.21) and was very strongly differen-tiated from the southern population (FST = 0.73) basedon sequence data. The Chatham Islands show a highlevel of coalescence (Fig. 3), with most individualsbelonging to a uniquely Chatham Island clade, whichis linked to a predominantly northern New Zealandclade.
The population sampled in Sydney (Australia) app-eared most similar to populations on the east coast of
Figure 5. Principal component analysis (PCA) of genetic distance DXY between populations of Sypharochiton pelliser-pentis derived from: (A) cytochrome oxidase subunit 1 (COI) RFLP data and (B) COI sequence data.
PHYLOGEOGRAPHY OF THE SNAKESKIN CHITON 557
© 2011 The Linnean Society of London, Biological Journal of the Linnean Society, 2011, 104, 552–563
the North Island, with a low to moderate FST betweenit and the northern population overall (Table 2).
Haplotype diversity (h) and nucleotide diversity (p)were calculated for each of these populations (north-ern and southern) separately (Table 3). These werehighly significantly lower in the southern population(P < 0.001).
DISCUSSIONPOPULATION STRUCTURE
The primary feature of phylogeographic structuringin Sypharochiton pelliserpentis around New Zealandis the strong disjunction between northern and south-ern populations. This disjunction is very significantand does not occur between the two islands; ratherpopulations in the north of the South Island (Kaiteri-teri and Robin Hood Bay) are clearly linked to theNorth Island populations. Unlike the previous organ-isms studied in this area, a unique haplogroup was
seen in the Greater Cook Strait area for the S. pell-iserpentis populations in the northern South Island.This indicates that perhaps this area has an unevendirection of recruitment – it may be a recruitmentsink. Thus, while it may receive some level of recruit-ment from the North Island, it does not contributerecruits back.
It is possible that there is some level of morphologi-cal separation of the northern and southern popula-tions. Johns (1960) noted a latitudinal cline in thefrequency of a completely black second valve S. pellis-erpentis, from 30% in Wanganui up to 90% in StewartIsland. Johns surveyed very few populations and his
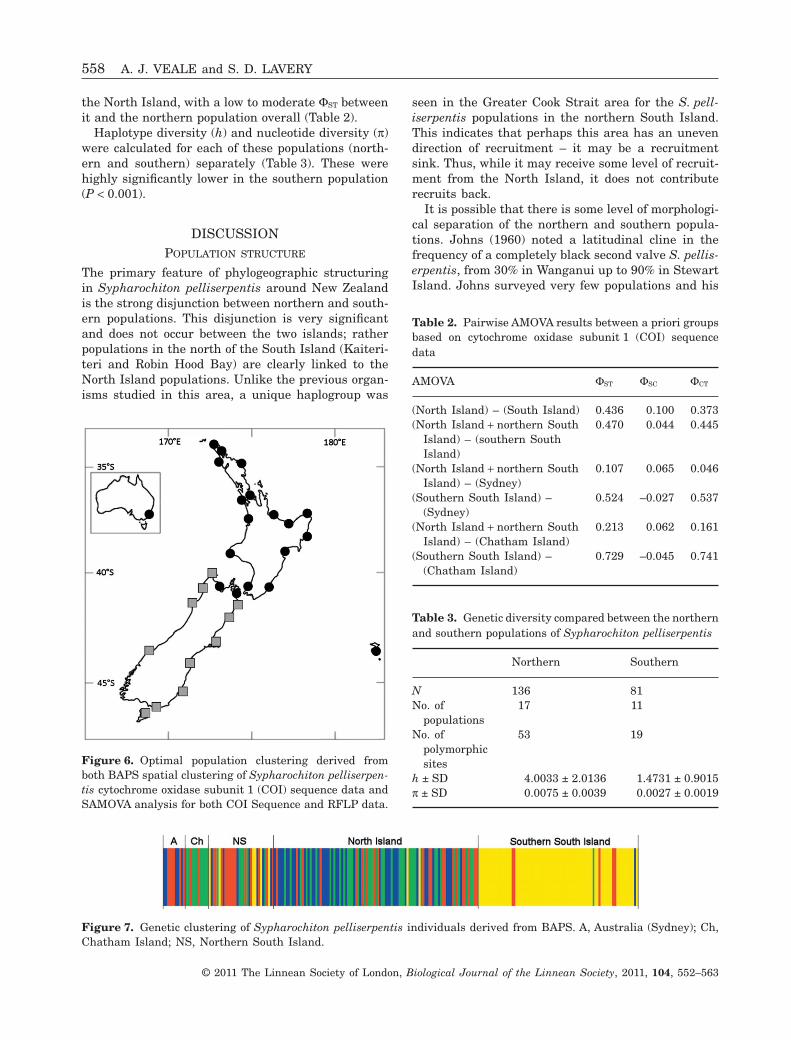
Figure 6. Optimal population clustering derived fromboth BAPS spatial clustering of Sypharochiton pelliserpen-tis cytochrome oxidase subunit 1 (COI) sequence data andSAMOVA analysis for both COI Sequence and RFLP data.
Figure 7. Genetic clustering of Sypharochiton pelliserpentis individuals derived from BAPS. A, Australia (Sydney); Ch,Chatham Island; NS, Northern South Island.
Table 2. Pairwise AMOVA results between a priori groupsbased on cytochrome oxidase subunit 1 (COI) sequencedata
AMOVA FST FSC FCT
(North Island) – (South Island) 0.436 0.100 0.373(North Island + northern South
Island) – (southern SouthIsland)
0.470 0.044 0.445
(North Island + northern SouthIsland) – (Sydney)
0.107 0.065 0.046
(Southern South Island) –(Sydney)
0.524 –0.027 0.537
(North Island + northern SouthIsland) – (Chatham Island)
0.213 0.062 0.161
(Southern South Island) –(Chatham Island)
0.729 –0.045 0.741
Table 3. Genetic diversity compared between the northernand southern populations of Sypharochiton pelliserpentis
Northern Southern
N 136 81No. of
populations17 11
No. ofpolymorphicsites
53 19
h ± SD 4.0033 ± 2.0136 1.4731 ± 0.9015p ± SD 0.0075 ± 0.0039 0.0027 ± 0.0019
558 A. J. VEALE and S. D. LAVERY
© 2011 The Linnean Society of London, Biological Journal of the Linnean Society, 2011, 104, 552–563
results could equally be interpreted as being caused bydistinct north/south morphological groupings ofS. pelliserpentis. A future avenue of investigationwould be to determine if this trait does show a latitu-dinal cline in frequency or, alternatively, if the fre-quency of this trait is correlated to northern andsouthern populations.
The high level of coalescence seen in the ChathamIslands population of S. pelliserpentis and the phylo-genetic position of this clade indicates that theChatham Island population was founded by a smallnumber of recruits from the northern mainland popu-lation a significant length of time ago, and thatcurrent gene flow between the Chatham Islands andthe mainland New Zealand is minimal if present. It isworth noting that the sister taxa to S. pelliserpentis –Sypharochiton sinclari – which has been confirmed assignificantly genetically distinct and a separatespecies (Veale, 2007) is not present in the ChathamIslands (Powell, 1979), despite the spawning time andlarval characteristics of these two species being con-sidered identical (Johns, 1960).
The fact that the S. pelliserpentis from Sydneyharbour closely match the populations from the eastcoast of the North Island of New Zealand is surpris-ing, given their assumed 1- to 4-day pelagic larvalduration (Pearse, 1979) and the strong populationsubdivision present around New Zealand. More studyis needed into S. pelliserpentis population structurearound south-eastern Australia to elucidate thisconnection.
PHYLOGEOGRAPHIC CONCORDANCE
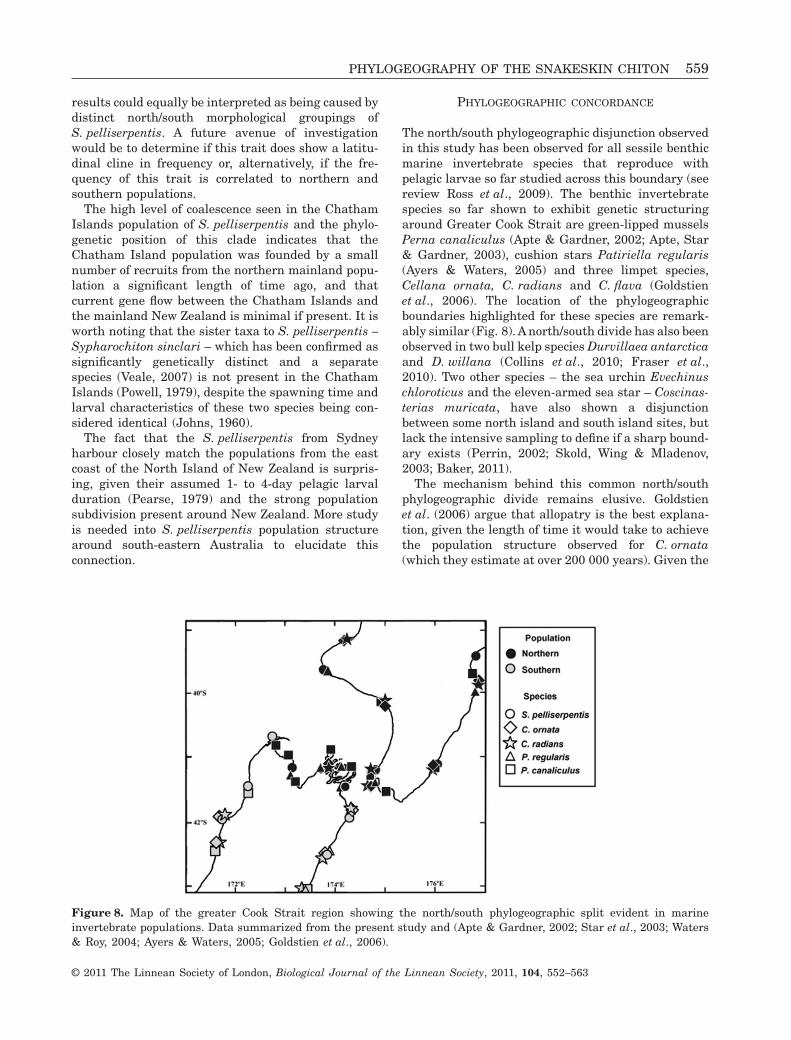
The north/south phylogeographic disjunction observedin this study has been observed for all sessile benthicmarine invertebrate species that reproduce withpelagic larvae so far studied across this boundary (seereview Ross et al., 2009). The benthic invertebratespecies so far shown to exhibit genetic structuringaround Greater Cook Strait are green-lipped musselsPerna canaliculus (Apte & Gardner, 2002; Apte, Star& Gardner, 2003), cushion stars Patiriella regularis(Ayers & Waters, 2005) and three limpet species,Cellana ornata, C. radians and C. flava (Goldstienet al., 2006). The location of the phylogeographicboundaries highlighted for these species are remark-ably similar (Fig. 8). A north/south divide has also beenobserved in two bull kelp species Durvillaea antarcticaand D. willana (Collins et al., 2010; Fraser et al.,2010). Two other species – the sea urchin Evechinuschloroticus and the eleven-armed sea star – Coscinas-terias muricata, have also shown a disjunctionbetween some north island and south island sites, butlack the intensive sampling to define if a sharp bound-ary exists (Perrin, 2002; Skold, Wing & Mladenov,2003; Baker, 2011).
The mechanism behind this common north/southphylogeographic divide remains elusive. Goldstienet al. (2006) argue that allopatry is the best explana-tion, given the length of time it would take to achievethe population structure observed for C. ornata(which they estimate at over 200 000 years). Given the
Figure 8. Map of the greater Cook Strait region showing the north/south phylogeographic split evident in marineinvertebrate populations. Data summarized from the present study and (Apte & Gardner, 2002; Star et al., 2003; Waters& Roy, 2004; Ayers & Waters, 2005; Goldstien et al., 2006).
PHYLOGEOGRAPHY OF THE SNAKESKIN CHITON 559
© 2011 The Linnean Society of London, Biological Journal of the Linnean Society, 2011, 104, 552–563
higher-level population structure evident in S. pellis-erpentis, this species similarly has an old populationdivergence. The fact that this phylogeographic bound-ary is so ubiquitous appears to imply that modernhydrology continues to impact on population connec-tivity in this region – and helps maintain more ancientpopulation subdivision. Looking at the temporal phy-logeographic concordance, along with the hydrology ofthese areas may help determine what factors areaffecting population connectivity.
While no firm conclusions can be drawn with a smallnumber of species, there is a possible correlationbetween spawning period and population connectivityfor species in this region. Both species (S. pelliserpentisand C. ornata) that exhibit very strong genetic north/south structure spawn at the same time of year, inMarch (Johns, 1960; Dunmore & Schiel, 2000), whilethe other species with moderate genetic structuringeither spawn in spring – P. canaliculus and P. regularis(Pike, 1970; Byrne & Barker, 1991) – or have multiplespawning events – C. radians (Creese & Ballantine,1983). A hypothesis of seasonal variability in barrierstrength has been proposed elsewhere at the PointConception phylogeographic barrier (Hohenlohe, 2004)and at Mona Passage in the Caribbean (Baums et al.,2006). Baums and colleagues describe this hypothesisas a ‘dynamic filter’ rather than a boundary, allowingdispersion only during limited periods of the year. Toinvestigate this hypothesis further, additional studiesof organisms across central New Zealand, with varyingspawning periods will be necessary.
The locations of the common phylogeographic dis-junctions (Cloudy/Clifford Bay and Farewell Spit) atthe southern limits of the Greater Cook Strait regionare sites of complex hydrography, including a strongtidal movement and mixing, turbulence, eddies andupwelling. The specific hydrological features founda-tional to the dispersive barrier proposed by Apte &Gardner (2002), Apte et al. (2003), and re-invoked byAyers & Waters (2005), were seasonal, wind-relatedupwellings and this appears to fit well with the theoryof a seasonal dynamic filter to dispersion present inthese areas.
Along Farewell Spit, intense inshore upwelling andwater movement offshore occurs (Garner, 1954, 1959;Stanton 1971, 1973; Moore et al., 1990; Bradford-Grieve, Murdoch & Chapman, 1993). Bradford-Grieveet al. (1993) noted specifically that this is a persistentsummer feature of this area. The effects of thisupwelling plume on the movement and distribution ofplankton was explored by Bradford-Grieve et al.(1993), where it was found that the upwelling plumeadvected inshore and coastal zooplankton offshore –which has the potential to disrupt larval dispersalacross this area. The Cloudy Bay/Clifford Bay areaalso has a complex three-dimensional hydrology with
numerous and changeable currents. This area too hasregular upwelling and seasonal current movement.Upwelling has been noted consistently on the easternside of the Narrows in Cloudy and Clifford Bays(Heath 1971, 1972; Bowman et al., 1983; Barnes,1985; Bradford et al., 1986; Murdoch, Quanguo &McCrone, 1990). Heath (1972) observed that, whilethe surface flow at Kaikoura was consistently north-wards, it varied seasonally at Cape Campbell, movingoffshore, with offshore currents likely to occur mainlyfrom December to March.
Along with the significant barriers on each coast atthe top of the South Island, a third significant barrierto dispersal was highlighted between Spirits Bay andShipwreck Bay in the far north of the North Island.Pairwise FSTs at this location were as significant asthose located at Farewell Spit and Cloudy/Clifford Bay.At this location, seasonal offshore currents and upwell-ings are prevalent and could likewise be the cause ofthe observed phylogeographic disjunction. A northerlyoffshore flow is predominant in this area duringsummer (Brodie, 1960; Stanton, 1973). Along with this,a strong near-shore cold upwelling is also regularlyobserved (Garner, 1959, 1961, 1970; Stanton, 1969;Stanton & Hill, 1972; Stanton, 1973; Roberts & Paul,1978; Ridgway, 1980). Both Garner (1961) and Stanton(1973) noted that the upwelling region off CapeReinga became particularly pronounced during thelate summer months, with upwelling persistent andcentred just to the east of Cape Reinga – matchingthe location of the genetic disjunction observed andspawning period for S. pelliserpentis.
CONCLUSION
A significant phylogeographic disjunction wasobserved for populations of the intertidal chitonS. pelliserpentis around New Zealand around GreaterCook Strait. This disjunction, which does not separatethe North and South Islands, but rather occurs atFarewell Spit and Cloudy Bay and appears to be ageneral feature of sessile benthic marine invertebratespecies over this area – having been observed now in awide range of taxa. This study highlights the ubiquityand significance of this common phylogeographic dis-junction. Because of the complex nature of the historyand hydrology of the area, further research is neededto help determine its causes. For S. pelliserpentis, allthree of the areas exhibiting significant populationdisjunctions have strong near-shore upwelling andcurrent movement offshore, and these are preval-ent during the period of year the S. pelliserpentisspawns. That these seasonal hydrographic patternsare causative in maintaining the population struc-turing of S. pelliserpentis is tentatively supported
560 A. J. VEALE and S. D. LAVERY
© 2011 The Linnean Society of London, Biological Journal of the Linnean Society, 2011, 104, 552–563
by comparison with other phylogeographic studies ofmarine invertebrates that seem to vary with spawningseason.
ACKNOWLEDGEMENTS
We wish to thank Carol, Andy and Robert Veale, DavidRotherham and Parvati Prema for their assistance inobtaining samples. We thank all the technicians andstaff in the molecular ecology lab UoA. We also wish tothank Prof. Dianne Gleeson and Josie Galbraith fortheir comments on the draft manuscript.
REFERENCES
Apte S, Gardner JPA. 2002. Population genetic subdivisionin the New Zealand greenshell mussel (Perna canaliculus)inferred from single-strand conformation polymorphismanalysis of mitochondrial DNA. Molecular Ecology 11: 1617–1628.
Apte S, Star B, Gardner JPA. 2003. A comparison of geneticdiversity between cultured and wild populations, and a testfor genetic introgression in the New Zealand greenshellmussel Perna canaliculus (Gmelin 1791). Aquaculture 219:193–220.
Ayers KL, Waters JM. 2005. Marine biogeographic disjunc-tion in central New Zealand. Marine Biology 147: 1045–1052.
Baker MM. 2011. Estimates of population connectivity in theNew Zealand endemic sea urchin (Evechinus chloroticus).Unpublished MSc thesis, University of Auckland, Auckland,New Zealand.
Barnes EJ. 1985. Eastern Cook Strait region circulationinferred from satellite-derived, sea-surface, temperaturedata. New Zealand Journal of Marine and FreshwaterResearch 19: 405–411.
Baums IB, Paris CB, Cherubin LM. 2006. A bio-oceanographic filter to larval dispersal in a reef-buildingcoral. Limnology and Oceanography 51: 1969–1981.
Benzie JAH. 1999. Genetic structure of coral reef organisms:ghosts of dispersal past. American Zoologist 39: 131–145.
Bowen BW, Bass AL, Rocha LA, Grant WS, RobertsonDR. 2001. Phylogeography of the trumpetfishes (Aulosto-mus): ring species complex on a global scale. Evolution 55:1029–1039.
Bowman MJ, Kibblewhite AC, Murtagh RA, ChiswellSM, Sanderson BG. 1983. Circulation and mixing inGreater Cook Strait, New Zealand. Oceanologica Acta 6:383–391.
Boyle PR. 1970. Aspects of the ecology of a littoral chiton,Sypharochiton pelliserpentis (Mollusca: Polyplacophora).New Zealand Journal of Marine and Freshwater Research 4:364–384.
Bradford JM, Lapennas PP, Murtagh RA, Chang FH,Wilkinson V. 1986. Factors controlling summer phy-toplankton production in greater Cook Strait, New Zealand.New Zealand Journal of Marine and Freshwater Research20: 253–279.
Bradford-Grieve JM, Murdoch RC, Chapman BE. 1993.Composition of macrozooplankton assemblages associatedwith the formation and decay of pulses within an upwellingplume in greater Cook Strait, New Zealand. New ZealandJournal of Marine and Freshwater Research 27: 1–22.
Brodie JW. 1960. Coastal surface currents around NewZealand. New Zealand Journal of Geology and Geophysics 3:235–252.
Byrne M, Barker MF. 1991. Embryogenesis and larvaldevelopment of the asteroid Patiriella regularis viewed bylight and scanning microscopy. Biological Bulletin 180: 332–345.
Clement MD, Posada D, Crandall KA. 2000. TCS: a com-puter program to estimate gene genealogies. MolecularEcology 9: 1657–1660.
Collins C, Fraser C, Ashcroft A, Waters J. 2010. Asymmet-ric dispersal of southern bull-kelp (Durvillaea antarctica)adults in coastal New Zealand: testing an oceanographichypothesis. Molecular Ecology 19: 4572–4580.
Corander J, Marttinen P, Sirén J, Tang J. 2008.Enhanced Bayesian modelling in BAPS software for learn-ing genetic structures of populations. BMC Bioinformatics9: 539.
Creese RG, Ballantine WJ. 1983. An assessment of breed-ing in the intertidal limpet, Cellana radians (Gmelin).Journal of Experimental Marine Biology and Ecology 67:43–59.
Dell WH. 1951. Key to the common chitons of New Zealand.Tuatara 4: 4–12.
Dunmore RA, Schiel DR. 2000. Reproduction in the inter-tidal limpet Cellana ornata in southern New Zealand. NewZealand Journal of Marine and Freshwater Research 34:653–660.
Dupanloup I, Schneider S, Excoffier L. 2002. A simulatedannealing approach to define the genetic structure of popu-lations. Molecular Ecology 11: 2571–2581.
Excoffier L, Smouse PE, Quattro JM. 1992. Analysis ofmolecular variance inferred from metric distances amongDNA haplotypes: application to human mitochondria1 DNArestriction data. Genetics 131: 479–491.
Excoffier L, Laval G, Schneider S. 2005. Arlequin ver. 3.0:an integrated software package for population geneticanalysis. Evolutionary Bioinformatics Online 1: 47–50.
Folmer O, Black M, Hoeh W, Lutz R, Vrijenhoek R. 1994.DNA primers for amplification of mitochondrial cyto-chrome c oxidase subunit I from diverse metazoan inverte-brates. Molecular Marine Biology and Biotechnology 3:294–299.
Fraser C, Winter D, Spencer H, Waters J. 2010. Multigenephylogeny of the southern bull-kelp genus Durvillaea(Phaeophyceae: Fucales). Molecular Phylogenetics andEvolution 57: 1301–1311.
Garner DM. 1954. Sea surface temperature in the SouthWest Pacific Ocean from 1949 to 1952. New ZealandJournal of Science and Technology Series B 36: 285–230.
Garner DM. 1959. The subtropical convergence in NewZealand surface waters. New Zealand Journal of Geologyand Geophysics 2: 315–337.
PHYLOGEOGRAPHY OF THE SNAKESKIN CHITON 561
© 2011 The Linnean Society of London, Biological Journal of the Linnean Society, 2011, 104, 552–563
Garner DM. 1961. Hydrology of New Zealand coastal waters,1955. New Zealand Department of Scientific and IndustrialResearch Bulletin: 138.
Garner DM. 1970. Hydrological studies in the New Zealandregion 1966 and 1967. Oceanic hydrology north-west of NewZealand. Hydrology of the north-east Tasman Sea. NewZealand Department of Scientific and Industrial ResearchBulletin. 202: 49.
Goldstien SJ, Schiel DR, Gemmell NJ. 2006. Comparativephylogeography of coastal limpets across a marine disjunc-tion in New Zealand. Molecular Ecology 15: 3259–3268.
Harris TFW. 1990. Greater Cook Strait: form and flow.Gordon DP (ed). Wellington, New Zealand: DSIR Marineand Freshwater, 1–212.
Heath RA. 1971. Hydrology and circulation in central andsouthern Cook Strait, New Zealand. New Zealand Journalof Marine and Freshwater Research 5: 178–199.
Heath RA. 1972. Wind-derived water motion off the eastcoast of New Zealand. New Zealand Journal of Marine andFreshwater Research 6: 352–364.
Hoelzel AR, Green A. 1992. Analysis of population levelvariation by sequencing PCR-amplified DNA. In: AR H, ed.Molecular genetic analysis of populations: a practicalapproach. Oxford: Oxford University Press, 159–187.
Hohenlohe P. 2004. Limits to gene flow in marine animalswith planktonic larvae: models of Littorina species aroundPoint Conception, California. Biological Journal of theLinnean Society 82: 169–187.
Iredale T, Hull AFB. 1932. The Loricates of the NeozealanicRegion. Australian Journal of Zoology 7: 119–164.
Johns PM. 1960. Chiton pelliserpentis (Mollusca,Amphineura). A study in the taxonomy of a species inrelation to its breeding biology and ecology. MSc, Universityof Canterbury.
Knox GA. 1953. The intertidal ecology of Taylor’s Mistake.Transactions of the Royal Society of New Zealand 81: 189–220.
Lessios HA, Kessing BD, Pearse JS. 2001. Populationstructure and speciation in tropical seas: global phylogeog-raphy of the sea urchin Diadema. Evolution 55: 955–975.
Menge BA, Lubchenco J, Bracken MES, Chan F, FoleyMM, Freidenburg TL, Gaines SD, Hudson G, Krenz C,Leslie H, Menge DNL, Russell R, Webster MS. 2003.Coastal oceanography sets the pace of rocky intertidal com-munity dynamics. Proceedings of the National Academy ofSciences of the United States of America 100: 12229–12234.
Moore MI, Shirtcliffe TGL, Cole AG, Viner AB, BaldwinR, Chapman B. 1990. Dynamics of the Cape Farewellupwelling plume, New Zealand. New Zealand Journal ofMarine and Freshwater Research 24: 555–568.
Murdoch RC, Quanguo R, McCrone A. 1990. Distributionof hoki (Macruronus novaezelandiae) eggs and larvae inrelation to hydrography in eastern Cook Strait, September1987. New Zealand Journal of Marine and FreshwaterResearch 24: 529–539.
Nei M. 1978. Estimation of average heterozygosity andgenetic distance from a small number of individuals. Genet-ics 89: 583–590.
Palumbi SR. 1997. Molecular biogeography of the Pacific.Coral Reefs 16: S47–S52.
Pearse JS. 1979. Polyplocophora. In: Pearse JS, Giese AC, eds.Reproduction of Marine Invertebrates, Vol. 5, Molluscs: pele-cypods and lesser classes. London: Academic Press, 27–85.
Perrin C. 2002. Mechanisms of evolution in the sea urchinEvechinus chlorolicus and the sea star Coscinasterias muri-cata: the effect of fiord hydrography and environment ontwo marine invertebrates with high dispersal potentialfound in New Zealand. PhD, University of Otago.
Pike RB. 1970. Report on mussel farming and mussel bio-logy for the Fishing Industry Board. FIB, FIB TechnicalReport no. 71.1. Fishing Industrial Board, Wellington, NewZealand.
Powell AWB. 1979. New Zealand mollusca. marine, land andfreshwater shells, Vol. Auckland: William Collins PublishersLtd.
Ridgway NM. 1980. Hydrological conditions and circulationoff the west coast of the North Island, New Zealand. NewZealand Journal of Marine and Freshwater Research 14:155–167.
Riginos C, Nachman MW. 2001. Population subdivision inmarine environments: the contributions of biogeography,geographical distance and discontinuous habitat to geneticdifferentiation in a blennioid fish, Axoclinus nigricaudus.Molecular Ecology 10: 1439–1453.
Roberts PE, Paul LJ. 1978. Seasonal hydrological changesin continental shelf waters off the west coast, North Island,New Zealand, and comments on fish distributions. NewZealand Journal of Marine and Freshwater Research 12:323–339.
Ross PM, Hogg ID, Pilditch CA, Lundquist CJ. 2009.Phylogeography of New Zealand’s costal benthos. NewZealand Journal of Marine and Freshwater Research 43:1009–1027.
Skold M, Wing SR, Mladenov PV. 2003. Genetic subdivi-sion of a sea star with high dispersal capability in relationto physical barriers in a fjordic seascape. Marine Ecology–Progress Series 250: 163–174.
Sponer R, Roy MS. 2002. Phylogeographic analysis of thebrooding brittle star Amphipholis squamata (Echinoder-mata) along the coast of New Zealand reveals high crypticgenetic variation and cryptic dispersal potential. Evolution56: 1954–1967.
Stanton BR. 1969. Hydrological observations across theTropical Convergence north of New Zealand. New ZealandJournal of Marine and Freshwater Research 3: 124–146.
Stanton BR. 1971. Hydrology of the Karamea Bight, NewZealand. New Zealand Journal of Marine and FreshwaterResearch 5: 141–163.
Stanton BR. 1973. Hydrological investigations aroundnorthern New Zealand. New Zealand Journal of Marine andFreshwater Research 7: 85–110.
Stanton BR, Hill PJ. 1972. Topographic influence on thewinter mid-Tasman Convergence. New Zealand Journal ofMarine and Freshwater Research 6: 645–648.
Star B, Apte S, Gardner JPA. 2003. Pronounced geneticstructuring among populations of the greenshell mussel
562 A. J. VEALE and S. D. LAVERY
© 2011 The Linnean Society of London, Biological Journal of the Linnean Society, 2011, 104, 552–563
Perna canaliculus (Gmelin, 1791) revealed by analysis ofRandomly Amplified Polymorphic DNA. Marine EcologyProgress Series 249: 171–182.
Suter H. 1913. Manual of New Zealand mollusca, Vol 1.Wellington: Government Printer.
Veale AJ. 2007. Phylogeography of two intertidal benthicmarine invertebrates around New Zealand: the waratahanemone (Actinia tenebrosa) and the snakeskin chiton
(Sypharochiton pelliserpentis). Unpublished MSc thesis,University of Auckland, Auckland, New Zealand.
Walsh S, Metzger D, Higuchi R. 1991. Chelex 100 as amedium for simple extraction of DNA for PCR-based typingfrom forensic material. BioTechniques 10: 506–513.
Waters JM, Roy MS. 2004. Phylogeography of a high-dispersal New Zealand sea-star: does upwelling blockgene-flow? Molecular Ecology 13: 2797–2806.
PHYLOGEOGRAPHY OF THE SNAKESKIN CHITON 563
© 2011 The Linnean Society of London, Biological Journal of the Linnean Society, 2011, 104, 552–563
Related Documents


![Josep Cerdà [chiton] Zeicani](https://static.cupdf.com/doc/110x72/568c4aa31a28ab491698fa91/josep-cerda-chiton-zeicani.jpg)