Phylogeography and demographic inference in Nacella (Patinigera) concinna (Strebel, 1908) in the western Antarctic Peninsula Claudio A. Gonza ´ lez-Wevar a,n , Bruno David b , Elie Poulin a a Instituto de Ecologı ´a y Biodiversidad (IEB), Departamento de Ciencias Ecolo ´gicas, Facultad de Ciencias, Universidad de Chile, Santiago, Chile b Laboratoire Bioge´osciences, CNRS, Centre des Sciences de la Terre, Universite´ de Bourgogne, Dijon, France article info Article history: Received 18 May 2010 Accepted 18 May 2010 Available online 8 June 2010 Keywords: Southern Ocean Antarctica Nacella concinna COI Genetic structure Median-joining network Elliptic Fourier analysis Bottleneck effect Founder effect abstract Endemic to Antarctic ecosystems, the limpet Nacella (Patinigera) concinna (Strebel, 1908) is an abundant and dominant marine benthic invertebrate of the intertidal and shallow subtidal zone. In order to examine the phylogeographic pattern and historical demography of the species along the western Antarctic Peninsula, we amplified 663 bp of the mitochondrial DNA cytochrome oxidase subunit I of 161 N. concinna specimens from five localities, as well as two specimens from South Georgia and Sub-Antarctic Marion Island. As two different morphotypes, one characterized by an elevated shell in the intertidal and the other by a flat one in the subtidal, have been recurrently reported for this species, we also compared intertidal and subtidal samples from two localities of King George Island (Admiralty and Fildes Bay) through geometric morphometric and genetic analyses. As a result, elliptic Fourier analyses on shell shape morphology detected highly significant differences between intertidal and subtidal morphotypes. In contrast, mtDNA analyses between these morphotypes did not detect statistical differences between them and support the hypothesis that subtidal and intertidal N. concinna forms correspond to be the same population unit. Genetic analyses depicted low levels of haplotypic and nucleotide diversity in N. concinna in all localities. Among populations, comparisons did not detect any genetic structure, supporting the existence of a single genetic unit along the western Antarctic Peninsula. A marked L-shaped distribution of pairwise differences and significant negative Tajima’s D and Fu’s F S indices suggest the existence of a recent demographic expansion of this species. Time estimations corrected by the ‘‘time dependency of molecular rate’’ hypothesis for this demographic event (7,500–22,000 years ago) fit well with the last glacial–interglacial transition period. Low levels of genetic diversity in N. concinna could reflect the dramatic effect of glacial periods on population sizes, especially in Antarctic species with narrow bathymetric ranges. Genetic similarities between South Georgia and Antarctic samples, as well as between Nacella delesserti (Philippi, 1849) and N. concinna (Strebel, 1908) fell within the range of intraspecific variation. The genetic proximity between sub-Antarctic N. delesserti and the Antarctic limpet could be explained through north-eastward long-distance dispersion events during the late Pleistocene. & 2010 Elsevier Ltd. All rights reserved. 1. Introduction Antarctica is considered to be an island continent isolated from other regions of the Southern hemisphere by geographic distance, water currents and extreme environmental conditions such as low temperatures, the presence of ice and exceptional seasonality (Crame, 1999; Clarke et al., 2004, 2005; Strugnell and Linse, 2005). The current biodiversity in Antarctica has resulted from different biogeographic and evolutionary processes operating over this continent since the Mesozoic (Zachos et al., 2001; Brandt, 2005; Brandt et al., 2007; Rogers, 2007). Marginal and extreme environments are thought to enhance the evolution of novel species through habitat fragmentation and strong selective pressure, thus driving the appearance and establishment of new taxa. In the particular case of Antarctica, this situation may have been favored by the elimination of competitors and predators, as well as by the stimulation of adaptation and speciation processes in survivors (Crame, 1999; Strugnell and Linse, 2005). It is also interesting to note how the progressive isolation of this continent has led to a drastic extinction of plants and animals in the terrestrial realm (Clarke and Crame, 1989; Convey et al., 2008). In the Antarctic Ocean, similar changes are marked by the reduction of several key benthic groups, which are abundant and dominant in adjacent sub-Antarctic regions, such as brachyuran Contents lists available at ScienceDirect journal homepage: www.elsevier.com/locate/dsr2 Deep-Sea Research II 0967-0645/$ - see front matter & 2010 Elsevier Ltd. All rights reserved. doi:10.1016/j.dsr2.2010.05.026 n Corresponding author. E-mail address: [email protected] (C.A. Gonza ´ lez-Wevar). Deep-Sea Research II 58 (2011) 220–229

Welcome message from author
This document is posted to help you gain knowledge. Please leave a comment to let me know what you think about it! Share it to your friends and learn new things together.
Transcript
Deep-Sea Research II 58 (2011) 220–229
Contents lists available at ScienceDirect
Deep-Sea Research II
0967-06
doi:10.1
n Corr
E-m
journal homepage: www.elsevier.com/locate/dsr2
Phylogeography and demographic inference in Nacella (Patinigera) concinna(Strebel, 1908) in the western Antarctic Peninsula
Claudio A. Gonzalez-Wevar a,n, Bruno David b, Elie Poulin a
a Instituto de Ecologıa y Biodiversidad (IEB), Departamento de Ciencias Ecologicas, Facultad de Ciencias, Universidad de Chile, Santiago, Chileb Laboratoire Biogeosciences, CNRS, Centre des Sciences de la Terre, Universite de Bourgogne, Dijon, France
a r t i c l e i n f o
Article history:
Received 18 May 2010
Accepted 18 May 2010Available online 8 June 2010
Keywords:
Southern Ocean
Antarctica
Nacella concinna
COI
Genetic structure
Median-joining network
Elliptic Fourier analysis
Bottleneck effect
Founder effect
45/$ - see front matter & 2010 Elsevier Ltd. A
016/j.dsr2.2010.05.026
esponding author.
ail address: [email protected] (C.A. Gonzale
a b s t r a c t
Endemic to Antarctic ecosystems, the limpet Nacella (Patinigera) concinna (Strebel, 1908) is an abundant
and dominant marine benthic invertebrate of the intertidal and shallow subtidal zone. In order to
examine the phylogeographic pattern and historical demography of the species along the western
Antarctic Peninsula, we amplified 663 bp of the mitochondrial DNA cytochrome oxidase subunit I of
161 N. concinna specimens from five localities, as well as two specimens from South Georgia and
Sub-Antarctic Marion Island. As two different morphotypes, one characterized by an elevated shell in
the intertidal and the other by a flat one in the subtidal, have been recurrently reported for this species,
we also compared intertidal and subtidal samples from two localities of King George Island (Admiralty
and Fildes Bay) through geometric morphometric and genetic analyses. As a result, elliptic Fourier
analyses on shell shape morphology detected highly significant differences between intertidal and
subtidal morphotypes. In contrast, mtDNA analyses between these morphotypes did not detect
statistical differences between them and support the hypothesis that subtidal and intertidal N. concinna
forms correspond to be the same population unit.
Genetic analyses depicted low levels of haplotypic and nucleotide diversity in N. concinna in all
localities. Among populations, comparisons did not detect any genetic structure, supporting the
existence of a single genetic unit along the western Antarctic Peninsula. A marked L-shaped distribution
of pairwise differences and significant negative Tajima’s D and Fu’s FS indices suggest the existence of a
recent demographic expansion of this species. Time estimations corrected by the ‘‘time dependency of
molecular rate’’ hypothesis for this demographic event (7,500–22,000 years ago) fit well with the last
glacial–interglacial transition period. Low levels of genetic diversity in N. concinna could reflect the
dramatic effect of glacial periods on population sizes, especially in Antarctic species with narrow
bathymetric ranges.
Genetic similarities between South Georgia and Antarctic samples, as well as between Nacella
delesserti (Philippi, 1849) and N. concinna (Strebel, 1908) fell within the range of intraspecific variation.
The genetic proximity between sub-Antarctic N. delesserti and the Antarctic limpet could be explained
through north-eastward long-distance dispersion events during the late Pleistocene.
& 2010 Elsevier Ltd. All rights reserved.
1. Introduction
Antarctica is considered to be an island continent isolated fromother regions of the Southern hemisphere by geographic distance,water currents and extreme environmental conditions such aslow temperatures, the presence of ice and exceptional seasonality(Crame, 1999; Clarke et al., 2004, 2005; Strugnell and Linse, 2005).The current biodiversity in Antarctica has resulted from differentbiogeographic and evolutionary processes operating over thiscontinent since the Mesozoic (Zachos et al., 2001; Brandt, 2005;
ll rights reserved.
z-Wevar).
Brandt et al., 2007; Rogers, 2007). Marginal and extremeenvironments are thought to enhance the evolution of novelspecies through habitat fragmentation and strong selectivepressure, thus driving the appearance and establishment of newtaxa. In the particular case of Antarctica, this situation may havebeen favored by the elimination of competitors and predators, aswell as by the stimulation of adaptation and speciation processesin survivors (Crame, 1999; Strugnell and Linse, 2005).
It is also interesting to note how the progressive isolation ofthis continent has led to a drastic extinction of plants and animalsin the terrestrial realm (Clarke and Crame, 1989; Convey et al.,2008). In the Antarctic Ocean, similar changes are marked by thereduction of several key benthic groups, which are abundant anddominant in adjacent sub-Antarctic regions, such as brachyuran
C.A. Gonzalez-Wevar et al. / Deep-Sea Research II 58 (2011) 220–229 221
crabs, lobsters, cartilaginous and non-notothenoid fishes.Nevertheless, other groups like sponges, bryozoans, sea spiders,echinoderms, amphipods and isopods are abounding and diverse,indicating that the continent’s isolation and climatic changes havenot impeded their success (Crame, 1999; Arntz and Rıos, 1999;Gray, 2001; Clarke et al., 2004). Nearshore benthic assemblages inAntarctica are diverse and with high standing stocks (Clarke andJohnston, 2003; Bowden, 2005). In fact, the modern Antarcticbenthic fauna includes more than 4000 species and comprise asignificant part of Earth’s biodiversity (Clarke et al., 2004; Guttet al., 2004; Peck et al., 2005). Many of these species are foundonly in this continent and endemism may reach over 90% for somegroups of Antarctic invertebrates (Clarke and Johnston, 2003). Themarked changes in the diversity of invertebrate groups overthe last 40 Myr indicate that Antarctica offers good insight intomacro-evolutionary processes, especially the relationshipbetween speciation and extinction (Strugnell and Linse, 2005).At the same time, this particular region presents opportunities forstudying life-history adaptations in slow growing benthic speciesthat persist in habitats with high seasonality and frequent naturaldisturbance (Bowden, 2005).
Members of the genus Nacella Schumacher, 1817 (Nacellidae:Patellogastropoda) are exclusive inhabitants of the Antarctic–Sub-Antarctic ecosystems (Powell, 1973). Currently, the genus iscomposed of 15 nominal species distributed in several regions ofthe Southern Ocean, like the Antarctic Peninsula, the Magellanprovince, the Kerguelen province and the Antipodean province inSouthern New Zealand (Powell, 1973; Valdovinos and Ruth,2005). Recent phylogenetic studies indicate that the origin ofNacella relates to the Middle Miocene Climatic Transition(�14 Ma), long after the separation of the Southern OceanContinents, like Antarctica and South America (Gonzalez-Wevaret al., 2010). Molecular analyses using two mitochondrial markers(COI and CytB) suggest that the diversification of the genus can bedivided into two main phases: a first gradual appearance ofNacella in different biogeographic regions like Antarctica, SouthAmerica and the Kerguelen Province, between 9.0–5.0 Ma; asecond diversification stage characterized by a rapid morpholo-gical and ecological radiation of the genus in the MagellanicProvince during the Pleistocene (�2.0–0.4 Ma; Gonzalez-Wevaret al., 2010).
In Antarctica, the true limpet N. concinna (Strebel, 1908) is oneof the most conspicuous and dominant marine benthic macro-invertebrates (Walker, 1972; Picken, 1980; Picken and Allan,1983; Peck and Veal, 2001). The species is distributed along theAntarctic Peninsula and its adjacent island systems, like thePalmer Archipelago, Seymour and Paulet Island, along the islandsof the Scotia Arc (South Georgia Island, South Orkney Islands andSouth Shetland Islands) and Bouvet Island (Powell, 1973). It is avery common species in the nearshore of the West Antarcticenvironment with a mean population density of 124�21 m�2 onSigny Island (Picken, 1980). The species inhabits a bathymetricrange from the intertidal zone down to 110 m, where it mainlygrazes on microphytobenthos and microalgae (Picken, 1980;Davenport, 1988; Brethes et al., 1994). Like many Antarcticmarine organisms, N. concinna is also described as a long-livedorganism, reaching shell lengths of �41 mm in 21 years, andsome specimens have even lived up to more than 70 years(Picken, 1980). N. concinna is a dioecious species with externalfertilization and broadcast spawners with pelagic larvae. Unu-sually for a patellogastropod, N. concinna forms spawning clustersof 3–35 individuals for up to seven days during the spring bloomperiod (Picken and Allan, 1983; Stanwell-Smith and Clarke, 1998).
The species was originally described as Patella polaris duringthe XVII century and Strebel (1908) distinguished two differentforms, namely, a shallow water morph named Patinella polaris and
a deeper water one called P. polaris var. concinna. Later, Powell(1973) recognized no differences between these forms and re-named both N. concinna, within the subgenus Patinigera. Walker(1972) and Picken (1980) recorded different bathymetric migra-tion patterns between these intertidal and subtidal forms, withthe first one migrating vertically on a seasonal mode as a responseto decreasing temperatures and ice formation while the secondone remains far below the low tide level all year. The elevatedintertidal shape allows higher water volume retention offering anadvantage towards avoiding desiccation, to extreme temperatureranges and hypoxia conditions. According to Nolan (1991) thisform also favors colonizing the intertidal over the sublittoral formhighly preferred by predators. Beaumont and Wei (1991)performed a morphological and genetic study on the species. Inthat study, morphological differences were corroborated and thesubtidal group showed larger height/length ratios compared tothe intertidal one. Morphological and genetic studies using fiveallozymic polymorphic loci (Es-1, Icd, Gpi, Pgm-1 and Got-1) inspecimens of both sub-populations indicate that these forms aregenetically identical, without evidence of any structure betweenthem. On other hand, morphology showed significant differencesin shell shape, suggesting that morphological variation in thisspecies results from environmentally induced phenotypic plasti-city (Beaumont and Wei, 1991). Recent morphometric andmolecular studies using ISSR-PCR markers in three localitiesalong the Antarctic Peninsula confirmed the morphologicaldifferences between intertidal and subtidal forms. At the sametime, the molecular markers also detected significant geneticdifferences between these forms, indicating that they couldcorrespond to different populations with low levels of gene flow(de Aranzamendi et al., 2008).
Despite the marked interest in the ecology, colonization,physiology, life history and evolution of Antarctic marine fauna,only a limited number of studies have examined genetic diversitypatterns in these organisms. Molecular studies in euphausiids andnothotheniidae fishes have showed that these groups exhibit highlevels of genetic differences in the Southern Ocean (Bargelloniet al., 2000). Nucleotide sequence data from mitochondrial geneshave revealed high levels of genetic structure and crypticspeciation in the crinoid Promachocrinus kerguelenensis
(Wilson et al., 2007). A recent molecular study in nudibranchDoris kerguelenensis showed high levels of genetic diversity in thisspecies, pointing towards recent explosive radiation (Wilson et al.,2009). In a study on the Antarctic silverfish Pleuragramma
antarcticum, Zane et al. (2006), we identified high levels ofpolymorphism. In spite of the high levels of genetic diversity, theauthors detected no association between localities and a weakpopulation structure in the species.
In order to examine the evolutionary history of N. concinna inthe Antarctic Peninsula, we reconstructed intraspecific phylogeo-graphic relationships along the Antarctic Peninsula and analyzedpatterns of haplotype frequencies in the species. For this, we usedDNA sequences from the mitochondrial cytochrome oxidasesubunit I gene. Mitochondrial genetic markers, and especiallyCOI, have been successfully used to obtain a first insight intopopulations’ demographic histories (Zane et al., 2006; Wilsonet al., 2007; Mahon et al., 2008). The distribution of N. concinna inAntarctica is restricted to ice-free zones; its narrow bathymetricrange and reproduction mode with free-living larvae makes thisspecies a suitable model to study the effect of Pleistoceneglaciations on the demography of Antarctic species. We includedsubtidal and intertidal specimens from two localities, so as todetermine the degree of genetic divergence among these differentmorphologies. In these samples, we also conducted geometricmorphometric analyses to determine the presence of morpholo-gical differences between these groups.
C.A. Gonzalez-Wevar et al. / Deep-Sea Research II 58 (2011) 220–229222
2. Material and methods
2.1. Sampling, DNA extraction, PCR amplifications and alignment
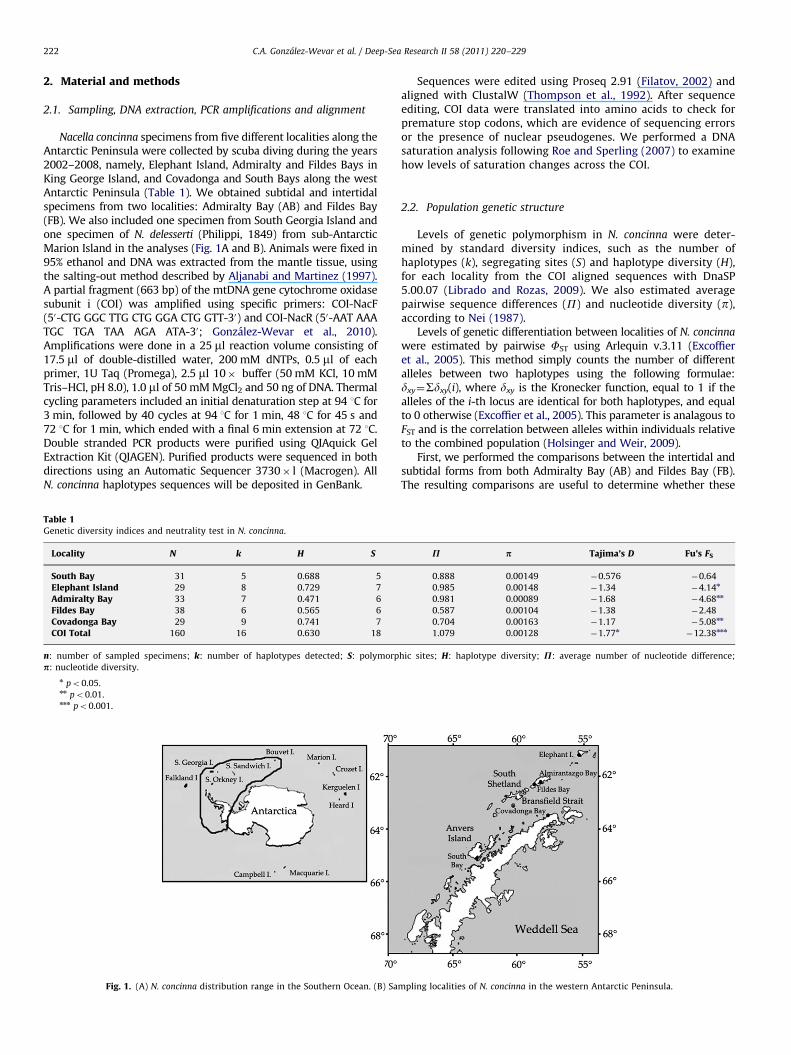
Nacella concinna specimens from five different localities along theAntarctic Peninsula were collected by scuba diving during the years2002–2008, namely, Elephant Island, Admiralty and Fildes Bays inKing George Island, and Covadonga and South Bays along the westAntarctic Peninsula (Table 1). We obtained subtidal and intertidalspecimens from two localities: Admiralty Bay (AB) and Fildes Bay(FB). We also included one specimen from South Georgia Island andone specimen of N. delesserti (Philippi, 1849) from sub-AntarcticMarion Island in the analyses (Fig. 1A and B). Animals were fixed in95% ethanol and DNA was extracted from the mantle tissue, usingthe salting-out method described by Aljanabi and Martinez (1997).A partial fragment (663 bp) of the mtDNA gene cytochrome oxidasesubunit i (COI) was amplified using specific primers: COI-NacF(50-CTG GGC TTG CTG GGA CTG GTT-30) and COI-NacR (50-AAT AAATGC TGA TAA AGA ATA-30; Gonzalez-Wevar et al., 2010).Amplifications were done in a 25 ml reaction volume consisting of17.5 ml of double-distilled water, 200 mM dNTPs, 0.5 ml of eachprimer, 1U Taq (Promega), 2.5 ml 10� buffer (50 mM KCl, 10 mMTris–HCl, pH 8.0), 1.0 ml of 50 mM MgCl2 and 50 ng of DNA. Thermalcycling parameters included an initial denaturation step at 94 1C for3 min, followed by 40 cycles at 94 1C for 1 min, 48 1C for 45 s and72 1C for 1 min, which ended with a final 6 min extension at 72 1C.Double stranded PCR products were purified using QIAquick GelExtraction Kit (QIAGEN). Purified products were sequenced in bothdirections using an Automatic Sequencer 3730� l (Macrogen). AllN. concinna haplotypes sequences will be deposited in GenBank.
Table 1Genetic diversity indices and neutrality test in N. concinna.
Locality N k H S
South Bay 31 5 0.688 5
Elephant Island 29 8 0.729 7
Admiralty Bay 33 7 0.471 6
Fildes Bay 38 6 0.565 6
Covadonga Bay 29 9 0.741 7
COI Total 160 16 0.630 18
n: number of sampled specimens; k: number of haplotypes detected; S: polymorp
p: nucleotide diversity.
n po0.05.nn po0.01.nnn po0.001.
Fig. 1. (A) N. concinna distribution range in the Southern Ocean. (B) Sa
Sequences were edited using Proseq 2.91 (Filatov, 2002) andaligned with ClustalW (Thompson et al., 1992). After sequenceediting, COI data were translated into amino acids to check forpremature stop codons, which are evidence of sequencing errorsor the presence of nuclear pseudogenes. We performed a DNAsaturation analysis following Roe and Sperling (2007) to examinehow levels of saturation changes across the COI.
2.2. Population genetic structure
Levels of genetic polymorphism in N. concinna were deter-mined by standard diversity indices, such as the number ofhaplotypes (k), segregating sites (S) and haplotype diversity (H),for each locality from the COI aligned sequences with DnaSP5.00.07 (Librado and Rozas, 2009). We also estimated averagepairwise sequence differences (P) and nucleotide diversity (p),according to Nei (1987).
Levels of genetic differentiation between localities of N. concinna
were estimated by pairwise FST using Arlequin v.3.11 (Excoffieret al., 2005). This method simply counts the number of differentalleles between two haplotypes using the following formulae:dxy¼Sdxy(i), where dxy is the Kronecker function, equal to 1 if thealleles of the i-th locus are identical for both haplotypes, and equalto 0 otherwise (Excoffier et al., 2005). This parameter is analagous toFST and is the correlation between alleles within individuals relativeto the combined population (Holsinger and Weir, 2009).
First, we performed the comparisons between the intertidal andsubtidal forms from both Admiralty Bay (AB) and Fildes Bay (FB).The resulting comparisons are useful to determine whether these
P p Tajima’s D Fu’s FS
0.888 0.00149 �0.576 �0.64
0.985 0.00148 �1.34 �4.14n
0.981 0.00089 �1.68 �4.68nn
0.587 0.00104 �1.38 �2.48
0.704 0.00163 �1.17 �5.08nn
1.079 0.00128 �1.77n�12.38nnn
hic sites; H: haplotype diversity; P: average number of nucleotide difference;
mpling localities of N. concinna in the western Antarctic Peninsula.
C.A. Gonzalez-Wevar et al. / Deep-Sea Research II 58 (2011) 220–229 223
morphologies correspond to identical genetic units or if they shouldbe considered in further analyses as separate sub-samples. Second,we performed pairwise FST comparisons among all sampledlocalities. In parallel to this analysis we determined the averagenumber of nucleotide differences between localities using DnaSP.
We used the program SAMOVA v.1 (SAMOVA, Spatial Analysisof Molecular Variance, Dupanloup et al., 2002) to define thenumber and composition of geographically homogeneous,maximally differentiated groups of populations. This method isbased on a simulated annealing procedure that aims to maximizethe proportion of total genetic variance due to differences amonggroups of populations and minimizing the variance portionamong populations within groups. Differentiation indices FST
(among populations), FSC (among populations within groups) andFCT (among groups) were tested through haplotype permutation(Excoffier et al., 2005).
2.3. Population historical inference
Genealogical relationships among N. concinna localities weredetermined using haplotype networks constructed with themedian-joining algorithm in Network v.4.5.1.0 (Rohl, 2002). Thismethod allows simple reconstruction of phylogenies, based onintraspecific molecular data like mitochondrial DNA variation,which often are complicated to analyze, especially when dealingwith large sample sizes and with small genetic divergence amongindividuals (Bandelt et al., 1999; Posada and Crandall, 2001).To determine past demographic changes in N. concinna, Tajima’sD and Fu’s FS tests were calculated using DnaSP to evaluate theassumption of selective neutrality of mtDNA sequences andpopulation mutation-drift equilibrium. Significant negative valuesfor these tests are evidence of excess of rare polymorphisms in apopulation, indicating either recent demographic expansion orpositive selection. We constructed a mismatch distribution of theCOI sequence data to compare it to the Poisson expectation forconstant and varying population sizes (Slatkin and Hudson, 1991).The rapid population growth model proposed by Rogers andHarpending (1992) rests on the estimation of three parameters: tthe date of growth/decline measured in units of mutationaltime (t¼2 mt where t¼time in years and m¼mutation rateper sequence per year); initial theta yi¼2Niu (before the popula-tion growth/decline); and final theta yf¼2Nfu (after populationgrowth/decline). The demographic expansion parameters wereestimated using the nonlinear least square approach, describedby Schneider and Excoffier (1999) implemented in Arlequin.Finally, by using Fluctuate v.1.44 (Kuhner et al., 1998) we co-estimated the y parameter and population growth rate g fromN. concinna COI sequences through Metropolis-Hastings sampling.This method takes a set of aligned DNA sequences as input anduses them to make maximum likelihood estimates of y and g.Theta is defined as 4 times the effective population size of themutational rate in a diploid organism, or 2 times the effectivepopulation size of the mutational rate on a haploid at present time.Parameter g corresponds to the exponential growth or decline rateof the population. Positive values for this parameter indicategrowth while negative ones imply decline (Kuhner et al., 1998).
2.4. Geometric morphometrics analyses
Shell shape variation between subtidal and intertidalN. concinna specimens from AB and FB was measured usingoutline analyses based on the elliptic Fourier analysis (EFA).Outlines were drawn from digital photographs and correspondedto a two dimensional projection of the lateral shape of the shells.We included adult specimens (44 cm) in all morphometric
analyses. Elliptic Fourier transformations were done using theSHAPE software (Iwata and Ukai, 2002). Elliptic Fourier descrip-tors (EFDs) can be used to delineate any kind of form and havebeen effectively applied to the evaluation of various biologicalshapes in plants and animals (Iwata and Ukai, 2002). This methodis based on the separate Fourier decompositions of the incre-mental changes of the x- and y-coordinates, as a function of thecumulative length along the outline (Renaud and Michaux, 2003,2007). The ChainCoder module extracted the contours of theobjects from digital images and stores the relevant information aschain codes. Then, the module Chc2Nef provided the normalizedEFD from the chain-coded contour, and coefficients of EFD werecalculated by discrete Fourier transformation following Kuhl andGiardina (1982). These coefficients were subsequently normalizedto be invariant with respect to size, rotation and starting point,with a procedure based on the ellipse of the first harmonic. Withthe PrinComp module, we performed the principal componentsanalyses on the variance–covariance matrix of the EFDs coeffi-cients. Principal components’ analysis is effective for summariz-ing the information regarding the variation contained in thesecoefficients (Rohlf and Archie, 1984), which were estimated usingPAST v.1.77 (Hammer et al., 2001). Finally, multivariate analysesof variance (MANOVA) were performed with PAST in order toevaluate the importance of between-group differentiation relativeto within-group variation. A test for significance of morphologydifferences (Wilk’s lambda test) is also provided and Hottelingpairwise comparisons, Bonferroni corrected and uncorrected,were also performed using PAST to determine differencesbetween morphologies and localities.
3. Results
3.1. Molecular genetics
The N. concinna COI sequence data set comprised 161specimens and consisted of 663 nucleotide positions. A singlespecimen of N. delesserti from Marion Island was added to the dataset for comparisons. No indels or stop codons were detected, asexpected for coding regions, and they also were not saturated inthe third codon position. Only one amino acid substitution wasdetected, out of a possibility of 220, in the entire COI data set(translated using the invertebrate mitochondrial table; Kumaret al., 2004). A third position transversion (T–G) generated anamino acid change from isoleucine to methonine (both aminoacids are type D with hydrophobic side chain). The Antarcticlimpet exhibited low levels of genetic diversity along theAntarctic Peninsula; only 15 characters (2.2%) were variable and8 of them (1.2%) were parsimoniously informative. Sequenceswere adenine and thymine (A–T) rich (61.6%), compared to meanguanine and cytocine (G–C) content (39.4%). Genetic diversityindices, like the number of polymorphic sites, haplotype diversityand nucleotide diversity (Table 1), were low but comparable toother molecular studies in Antarctic marine invertebrates (Dıaz,2008; Hunter and Halanych, 2008; Mahon et al., 2008; Thornhillet al., 2008; Dıaz et al., 2011).
Pairwise FST comparisons between intertidal and subtidalN. concinna from the Admiralty and Fildes Bays (Table 2) showedno significant difference. From this point, for both Fildes andAdmiralty, we considered intertidal and subtidal samples assimilar and pooled these samples for further genetic analyses.
The new pairwise FST calculated among all five localities alongSouth Shetland and the western Antarctic Peninsula showed nosignificant difference, except for the comparison betweenElephant Island and Admiralty Bay (P¼0.049). In general,Admiralty Bay exhibited higher values for FST. General FST
C.A. Gonzalez-Wevar et al. / Deep-Sea Research II 58 (2011) 220–229224
comparisons evidenced an absence of genetic structure amongN. concinna along 800 km in the South Shetland region andWestern Antarctic Peninsula.
The average number of nucleotide differences betweenpopulations was very low and ranged between 0.647 and 1.039.The highest value was recorded between the southernmostlocality South Bay and Covadonga Bay in Continental AntarcticPeninsula. The average differences between the most distantlocalities (South Bay/Elephant Island) was 0.973, while the lowestvalue (0.581) was recorded between intertidal and subtidal sub-samples from Admiralty Bay (Tables 2 and 3). SAMOVA analysiscorroborated FST pairwise estimations and did not recover spatialstructure in N. concinna. However, the first partition separatedAdmiralty Bay from the rest of the localities, even thoughvariances (FCT) among groups explained a small amount of thevariance (0.90%), while differences (FST) within the populationsexplained 99.11% of such.
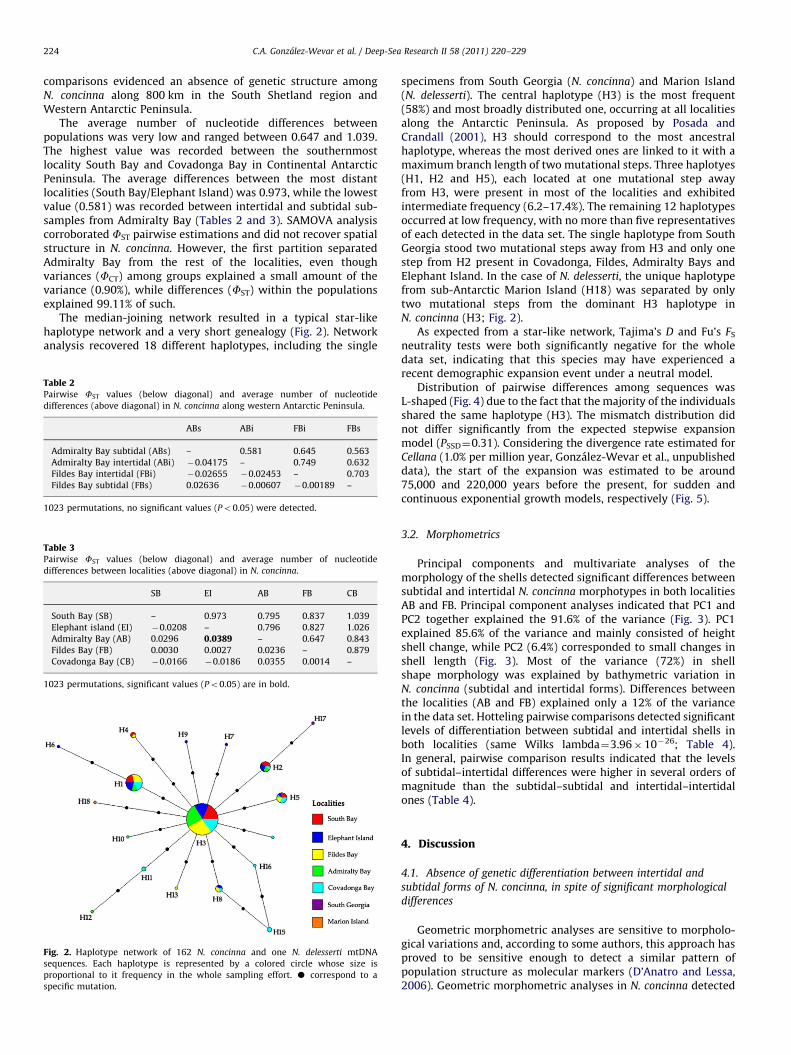
The median-joining network resulted in a typical star-likehaplotype network and a very short genealogy (Fig. 2). Networkanalysis recovered 18 different haplotypes, including the single
Table 2Pairwise FST values (below diagonal) and average number of nucleotide
differences (above diagonal) in N. concinna along western Antarctic Peninsula.
ABs ABi FBi FBs
Admiralty Bay subtidal (ABs) – 0.581 0.645 0.563
Admiralty Bay intertidal (ABi) �0.04175 – 0.749 0.632
Fildes Bay intertidal (FBi) �0.02655 �0.02453 – 0.703
Fildes Bay subtidal (FBs) 0.02636 �0.00607 �0.00189 –
1023 permutations, no significant values (Po0.05) were detected.
Table 3Pairwise FST values (below diagonal) and average number of nucleotide
differences between localities (above diagonal) in N. concinna.
SB EI AB FB CB
South Bay (SB) – 0.973 0.795 0.837 1.039
Elephant island (EI) �0.0208 – 0.796 0.827 1.026
Admiralty Bay (AB) 0.0296 0.0389 – 0.647 0.843
Fildes Bay (FB) 0.0030 0.0027 0.0236 – 0.879
Covadonga Bay (CB) �0.0166 �0.0186 0.0355 0.0014 –
1023 permutations, significant values (Po0.05) are in bold.
Fig. 2. Haplotype network of 162 N. concinna and one N. delesserti mtDNA
sequences. Each haplotype is represented by a colored circle whose size is
proportional to it frequency in the whole sampling effort. K correspond to a
specific mutation.
specimens from South Georgia (N. concinna) and Marion Island(N. delesserti). The central haplotype (H3) is the most frequent(58%) and most broadly distributed one, occurring at all localitiesalong the Antarctic Peninsula. As proposed by Posada andCrandall (2001), H3 should correspond to the most ancestralhaplotype, whereas the most derived ones are linked to it with amaximum branch length of two mutational steps. Three haplotyes(H1, H2 and H5), each located at one mutational step awayfrom H3, were present in most of the localities and exhibitedintermediate frequency (6.2–17.4%). The remaining 12 haplotypesoccurred at low frequency, with no more than five representativesof each detected in the data set. The single haplotype from SouthGeorgia stood two mutational steps away from H3 and only onestep from H2 present in Covadonga, Fildes, Admiralty Bays andElephant Island. In the case of N. delesserti, the unique haplotypefrom sub-Antarctic Marion Island (H18) was separated by onlytwo mutational steps from the dominant H3 haplotype inN. concinna (H3; Fig. 2).
As expected from a star-like network, Tajima’s D and Fu’s FS
neutrality tests were both significantly negative for the wholedata set, indicating that this species may have experienced arecent demographic expansion event under a neutral model.
Distribution of pairwise differences among sequences wasL-shaped (Fig. 4) due to the fact that the majority of the individualsshared the same haplotype (H3). The mismatch distribution didnot differ significantly from the expected stepwise expansionmodel (PSSD¼0.31). Considering the divergence rate estimated forCellana (1.0% per million year, Gonzalez-Wevar et al., unpublisheddata), the start of the expansion was estimated to be around75,000 and 220,000 years before the present, for sudden andcontinuous exponential growth models, respectively (Fig. 5).
3.2. Morphometrics
Principal components and multivariate analyses of themorphology of the shells detected significant differences betweensubtidal and intertidal N. concinna morphotypes in both localitiesAB and FB. Principal component analyses indicated that PC1 andPC2 together explained the 91.6% of the variance (Fig. 3). PC1explained 85.6% of the variance and mainly consisted of heightshell change, while PC2 (6.4%) corresponded to small changes inshell length (Fig. 3). Most of the variance (72%) in shellshape morphology was explained by bathymetric variation inN. concinna (subtidal and intertidal forms). Differences betweenthe localities (AB and FB) explained only a 12% of the variancein the data set. Hotteling pairwise comparisons detected significantlevels of differentiation between subtidal and intertidal shells inboth localities (same Wilks lambda¼3.96�10�26; Table 4).In general, pairwise comparison results indicated that the levelsof subtidal–intertidal differences were higher in several orders ofmagnitude than the subtidal–subtidal and intertidal–intertidalones (Table 4).
4. Discussion
4.1. Absence of genetic differentiation between intertidal and
subtidal forms of N. concinna, in spite of significant morphological
differences
Geometric morphometric analyses are sensitive to morpholo-gical variations and, according to some authors, this approach hasproved to be sensitive enough to detect a similar pattern ofpopulation structure as molecular markers (D’Anatro and Lessa,2006). Geometric morphometric analyses in N. concinna detected
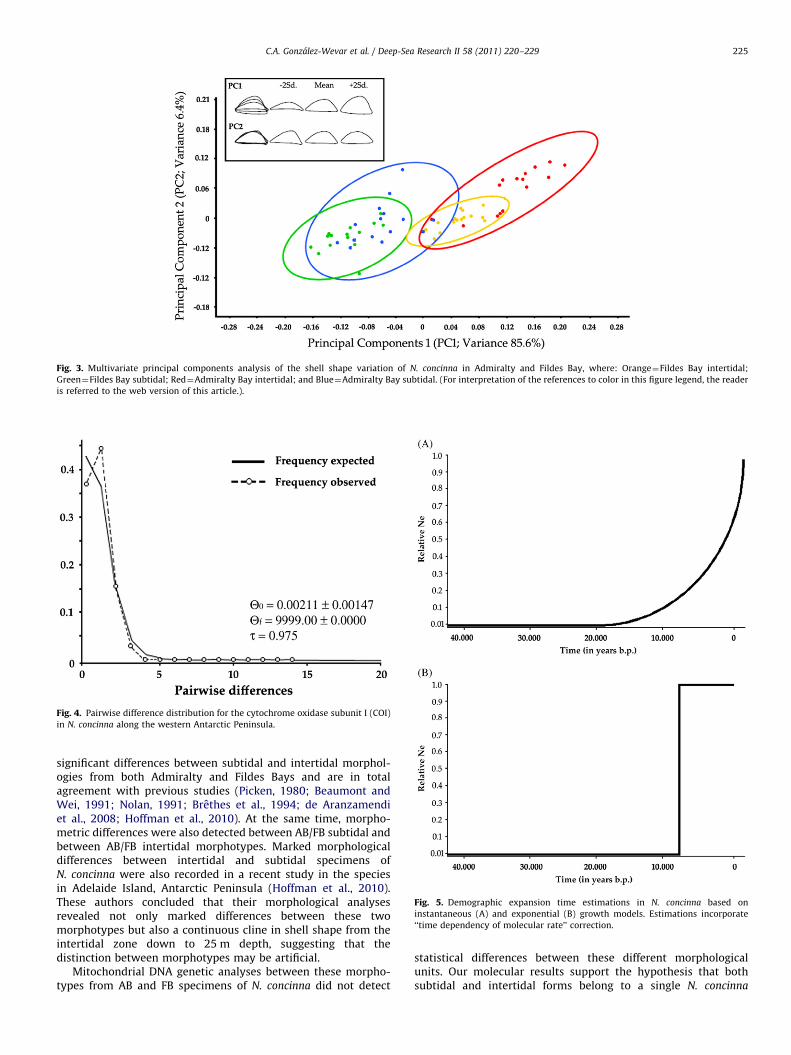
Fig. 3. Multivariate principal components analysis of the shell shape variation of N. concinna in Admiralty and Fildes Bay, where: Orange¼Fildes Bay intertidal;
Green¼Fildes Bay subtidal; Red¼Admiralty Bay intertidal; and Blue¼Admiralty Bay subtidal. (For interpretation of the references to color in this figure legend, the reader
is referred to the web version of this article.).
Fig. 4. Pairwise difference distribution for the cytochrome oxidase subunit I (COI)
in N. concinna along the western Antarctic Peninsula.
Fig. 5. Demographic expansion time estimations in N. concinna based on
instantaneous (A) and exponential (B) growth models. Estimations incorporate
‘‘time dependency of molecular rate’’ correction.
C.A. Gonzalez-Wevar et al. / Deep-Sea Research II 58 (2011) 220–229 225
significant differences between subtidal and intertidal morphol-ogies from both Admiralty and Fildes Bays and are in totalagreement with previous studies (Picken, 1980; Beaumont andWei, 1991; Nolan, 1991; Brethes et al., 1994; de Aranzamendiet al., 2008; Hoffman et al., 2010). At the same time, morpho-metric differences were also detected between AB/FB subtidal andbetween AB/FB intertidal morphotypes. Marked morphologicaldifferences between intertidal and subtidal specimens ofN. concinna were also recorded in a recent study in the speciesin Adelaide Island, Antarctic Peninsula (Hoffman et al., 2010).These authors concluded that their morphological analysesrevealed not only marked differences between these twomorphotypes but also a continuous cline in shell shape from theintertidal zone down to 25 m depth, suggesting that thedistinction between morphotypes may be artificial.
Mitochondrial DNA genetic analyses between these morpho-types from AB and FB specimens of N. concinna did not detect
statistical differences between these different morphologicalunits. Our molecular results support the hypothesis that bothsubtidal and intertidal forms belong to a single N. concinna
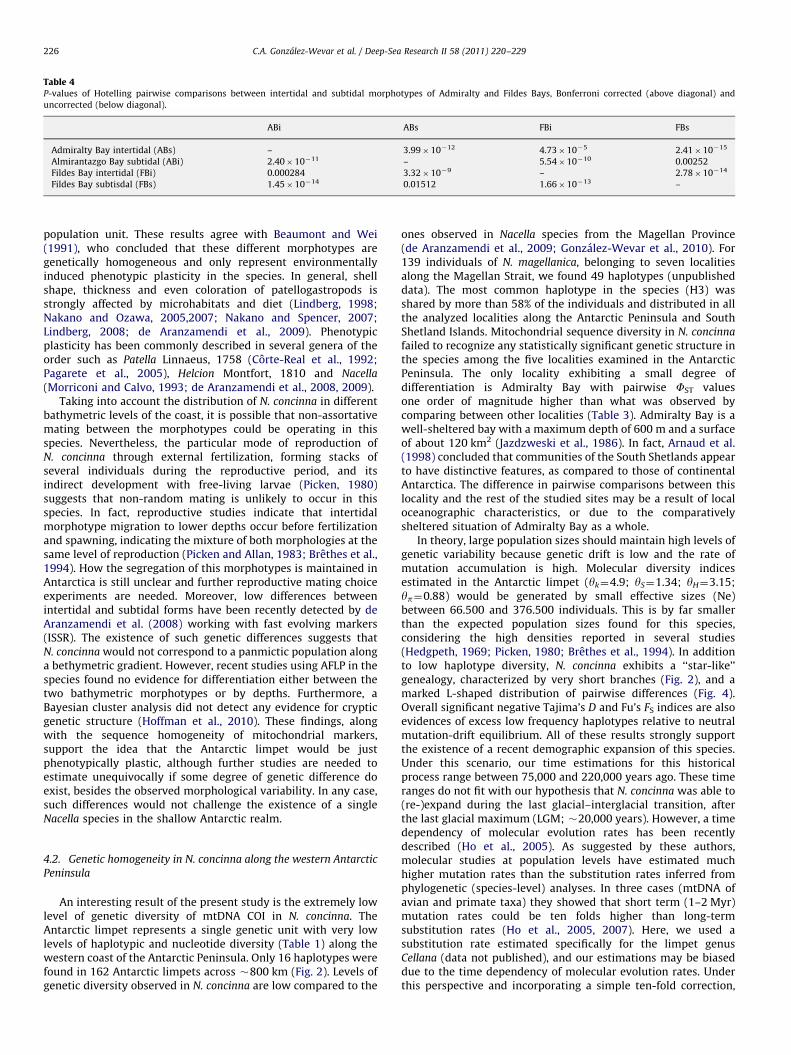
Table 4P-values of Hotelling pairwise comparisons between intertidal and subtidal morphotypes of Admiralty and Fildes Bays, Bonferroni corrected (above diagonal) and
uncorrected (below diagonal).
ABi ABs FBi FBs
Admiralty Bay intertidal (ABs) – 3.99�10�12 4.73�10�5 2.41�10�15
Almirantazgo Bay subtidal (ABi) 2.40�10�11 – 5.54�10�10 0.00252
Fildes Bay intertidal (FBi) 0.000284 3.32�10�9 – 2.78�10�14
Fildes Bay subtisdal (FBs) 1.45�10�14 0.01512 1.66�10�13 –
C.A. Gonzalez-Wevar et al. / Deep-Sea Research II 58 (2011) 220–229226
population unit. These results agree with Beaumont and Wei(1991), who concluded that these different morphotypes aregenetically homogeneous and only represent environmentallyinduced phenotypic plasticity in the species. In general, shellshape, thickness and even coloration of patellogastropods isstrongly affected by microhabitats and diet (Lindberg, 1998;Nakano and Ozawa, 2005,2007; Nakano and Spencer, 2007;Lindberg, 2008; de Aranzamendi et al., 2009). Phenotypicplasticity has been commonly described in several genera of theorder such as Patella Linnaeus, 1758 (Corte-Real et al., 1992;Pagarete et al., 2005), Helcion Montfort, 1810 and Nacella
(Morriconi and Calvo, 1993; de Aranzamendi et al., 2008, 2009).Taking into account the distribution of N. concinna in different
bathymetric levels of the coast, it is possible that non-assortativemating between the morphotypes could be operating in thisspecies. Nevertheless, the particular mode of reproduction ofN. concinna through external fertilization, forming stacks ofseveral individuals during the reproductive period, and itsindirect development with free-living larvae (Picken, 1980)suggests that non-random mating is unlikely to occur in thisspecies. In fact, reproductive studies indicate that intertidalmorphotype migration to lower depths occur before fertilizationand spawning, indicating the mixture of both morphologies at thesame level of reproduction (Picken and Allan, 1983; Brethes et al.,1994). How the segregation of this morphotypes is maintained inAntarctica is still unclear and further reproductive mating choiceexperiments are needed. Moreover, low differences betweenintertidal and subtidal forms have been recently detected by deAranzamendi et al. (2008) working with fast evolving markers(ISSR). The existence of such genetic differences suggests thatN. concinna would not correspond to a panmictic population alonga bethymetric gradient. However, recent studies using AFLP in thespecies found no evidence for differentiation either between thetwo bathymetric morphotypes or by depths. Furthermore, aBayesian cluster analysis did not detect any evidence for crypticgenetic structure (Hoffman et al., 2010). These findings, alongwith the sequence homogeneity of mitochondrial markers,support the idea that the Antarctic limpet would be justphenotypically plastic, although further studies are needed toestimate unequivocally if some degree of genetic difference doexist, besides the observed morphological variability. In any case,such differences would not challenge the existence of a singleNacella species in the shallow Antarctic realm.
4.2. Genetic homogeneity in N. concinna along the western Antarctic
Peninsula
An interesting result of the present study is the extremely lowlevel of genetic diversity of mtDNA COI in N. concinna. TheAntarctic limpet represents a single genetic unit with very lowlevels of haplotypic and nucleotide diversity (Table 1) along thewestern coast of the Antarctic Peninsula. Only 16 haplotypes werefound in 162 Antarctic limpets across �800 km (Fig. 2). Levels ofgenetic diversity observed in N. concinna are low compared to the
ones observed in Nacella species from the Magellan Province(de Aranzamendi et al., 2009; Gonzalez-Wevar et al., 2010). For139 individuals of N. magellanica, belonging to seven localitiesalong the Magellan Strait, we found 49 haplotypes (unpublisheddata). The most common haplotype in the species (H3) wasshared by more than 58% of the individuals and distributed in allthe analyzed localities along the Antarctic Peninsula and SouthShetland Islands. Mitochondrial sequence diversity in N. concinna
failed to recognize any statistically significant genetic structure inthe species among the five localities examined in the AntarcticPeninsula. The only locality exhibiting a small degree ofdifferentiation is Admiralty Bay with pairwise FST valuesone order of magnitude higher than what was observed bycomparing between other localities (Table 3). Admiralty Bay is awell-sheltered bay with a maximum depth of 600 m and a surfaceof about 120 km2 (Jazdzweski et al., 1986). In fact, Arnaud et al.(1998) concluded that communities of the South Shetlands appearto have distinctive features, as compared to those of continentalAntarctica. The difference in pairwise comparisons between thislocality and the rest of the studied sites may be a result of localoceanographic characteristics, or due to the comparativelysheltered situation of Admiralty Bay as a whole.
In theory, large population sizes should maintain high levels ofgenetic variability because genetic drift is low and the rate ofmutation accumulation is high. Molecular diversity indicesestimated in the Antarctic limpet (yk¼4.9; yS¼1.34; yH¼3.15;yp¼0.88) would be generated by small effective sizes (Ne)between 66.500 and 376.500 individuals. This is by far smallerthan the expected population sizes found for this species,considering the high densities reported in several studies(Hedgpeth, 1969; Picken, 1980; Brethes et al., 1994). In additionto low haplotype diversity, N. concinna exhibits a ‘‘star-like’’genealogy, characterized by very short branches (Fig. 2), and amarked L-shaped distribution of pairwise differences (Fig. 4).Overall significant negative Tajima’s D and Fu’s FS indices are alsoevidences of excess low frequency haplotypes relative to neutralmutation-drift equilibrium. All of these results strongly supportthe existence of a recent demographic expansion of this species.Under this scenario, our time estimations for this historicalprocess range between 75,000 and 220,000 years ago. These timeranges do not fit with our hypothesis that N. concinna was able to(re-)expand during the last glacial–interglacial transition, afterthe last glacial maximum (LGM; �20,000 years). However, a timedependency of molecular evolution rates has been recentlydescribed (Ho et al., 2005). As suggested by these authors,molecular studies at population levels have estimated muchhigher mutation rates than the substitution rates inferred fromphylogenetic (species-level) analyses. In three cases (mtDNA ofavian and primate taxa) they showed that short term (1–2 Myr)mutation rates could be ten folds higher than long-termsubstitution rates (Ho et al., 2005, 2007). Here, we used asubstitution rate estimated specifically for the limpet genusCellana (data not published), and our estimations may be biaseddue to the time dependency of molecular evolution rates. Underthis perspective and incorporating a simple ten-fold correction,
C.A. Gonzalez-Wevar et al. / Deep-Sea Research II 58 (2011) 220–229 227
our time estimations (7,500–22,000 years ago) would fit to thelast glacial–interglacial transition period.
Low levels of genetic diversity detected in N. concinna couldreflect a dramatic effect of glacial periods on population size andeven on the persistence of the species along the AntarcticPeninsula. If we consider that N. concinna has a narrowbathymetric range (0–110 m), the extension of an ice sheet overthe main part of the Antarctic continental shelf during glacialperiods should have drastically reduced its habitat to isolatedrefugia in ice-free areas (Poulin et al., 2002; Thatje et al., 2005).Another possibility could be that N. concinna migrated northwardduring glaciations and returned to a southern distribution duringinterglacial periods. This is suggested by genetic closeness amongNacella samples from the Antarctic Peninsula, South Georgia andMarion Island. In this case, bottleneck and further founder effectsmay be plausible explanations for low diversity and genetichomogeneity detected in the Antarctic limpet. Our resultscontrasts with other studies on Antarctic marine benthicinvertebrates that shows high levels of genetic diversity(Mahon et al., 2008; Thornhill et al., 2008; Krabbe et al., 2009;Wilson et al., 2009). However, most of these species exhibit alarge bathymetric range that could prevent such drasticdemographic impact during the recurrent Pleistocene glacialand interglacial cycles (Brey et al., 1996). Within this scenario,we could expect that the degree of genetic diversity in Antarcticbenthic invertebrates would be positively related to theirbathymetric range.
4.3. Genetic cohesiveness between sub-Antarctic N. delesserti and
Antarctic N. concinna
The low levels of genetic differences between N. delesserti andN. concinna do not agree with other phylogenetic studies in thegenus. Genetic similarities detected between these differenttaxonomic units are very low and within the range of intraspecificvariation of other nacellid species (Goldstien et al., 2006; Birdet al., 2007). Recently, Gonzalez-Wevar et al. (2010) haveanalyzed different Nacella species from Antarctica, South Americaand Kerguelen Province and have recovered deep moleculardivergences among sub-Antarctic and Antarctic species withoutevidence of recent long-distance gene flow events. For example,Antarctic N. concinna and the Magellanic species of the genusexhibited much higher levels of genetic divergence (8.5%) thanthat observed between the former and Marion Island’sN. delesserti (0.32%). At the same time, the species N. macquariensis
and N. kerguelenensis collected from the Sub-Antarctic HeardIsland (Kerguelen Province) also showed similar levels of geneticdivergence (7.70%) between them (Gonzalez-Wevar et al., 2010).As mentioned above, N. delesserti is a sub-Antarctic endemicspecies from Marion Island. Interestingly, the origin of this island,located �5500 km away from the Antarctic Peninsula, is veryrecent (450,000 years; Chown et al., 2008). Therefore, the geneticproximity between N. delesserti and N. concinna could beexplained through north-eastward long-distance dispersal eventsduring the late Pleistocene, through the Circumpolar AntarcticCurrent. According to Beaumont and Wei (1991), N. concinna
could be transported by drifting masses of algae, which supportsthe hypothesis that poses long-distance dispersion betweenAntarctica and Marion Island hypothesis. Phenotypic plasticity,as described in this and other studies, on N. concinna and otherNacella species from the Magellan Strait (Powell, 1973; Morriconiand Calvo, 1993; Valdovinos and Ruth, 2005; de Aranzamendiet al., 2008, 2009; Hoffman et al., 2010; Gonzalez-Wevar et al.,2010) could have enhanced morphological differentiation ofN. delesserti in Marion Island, and this could explain the described
differences between this species and the Antarctic limpet (Powell,1973). Because of the late Pleistocene origin of Marion Island, COIsequences as well as other mitochondrial and nuclear DNA genes(data not published) could not provide adequate resolutions todistinguish whether these two morphotypes correspond todifferent species. More individuals and localities of MarionIsland’s N. delesserti and faster evolving molecular markers areneeded in order to offer a better explanation of this last finding.
Acknowledgments
We are grateful to the following people and museums for thehelp in field work, data analyses and for contributing specimensto this study: Tomoyuki Nakano, Hamish Spencer, Cesar Cardenas,Christian Ibanez, Ceridwen Fraser; Museo Nacional de HistoriaNatural Chile, Santiago, Chile, Australian Museum, Sydney, andNational Museum of Nature and Science, Tokyo.
This study was supported by the Grants INACH B_01_07,Conicyt Ph.D. and thesis grants nos D-21060218, 24090009 andIDEAWILD to C.G., and by the projects P05-002 ICM and PFB 023(Institute of Ecology and Biodiversity, Universidad de Chile), andINACH 02-02, 13-05 and ECOS C06B02 to E.P. Thank is alsoextended to international programs CAML, EBA-SCAR andPROSUL-Brazil for encouraging and supporting the Antarcticresearch in evolution. This is CAML contribution #41.
References
Aljanabi, S.M., Martinez, I., 1997. Universal and rapid salt-extraction of highquality genomic DNA for PCR-based techniques. Nucleic Acids Research 25,4692–4693.
Arnaud, P.M., Lopez, C.M., Olaso, I., Ramil, F., Ramos-Espla, A.A., Ramos, A., 1998.Semi-quantitative study of macrobenthic fauna in the region of the SouthShetland Islands and the Antarctic Peninsula. Polar Biology 19, 160–166.
Arntz, W.E., Rıos, C., 1999. Magellan-Antarctic: ecosystems that drifted apart.Scientia Marina 63 (S1), 1–518.
Bargelloni, L., Zane, L., Derome, N., Lecointre, G., Patarnello, T., 2000. Molecularzoogeography of Antarctic euphausiids and notothenioids: from speciesphylogenies to intraspecific patterns of genetic variation. Antarctic Science12, 259–268.
Bandelt, H.-J., Forster, P., Rohl, A., 1999. Median-joining networks for inferringintraspecific phylogenies. Molecular Biology and Evolution 16, 37–48.
Beaumont, A.R., Wei, J.H.C., 1991. Morphological and genetic variation in theAntarctic limpet Nacella concinna (Strebel, 1908). Journal of Molluscan Studies57, 443–450.
Bird, C.E., Holland, B.S., Bowen, B.W., Toonen, R.J., 2007. Contrasting phylogeo-graphy in three endemic Hawaiian limpets (Cellana spp.) with similar lifehistories. Molecular Ecology 16, 3173–3186.
Bowden, D.A., 2005. Seasonality of recruitment in Antarctic sessile marinebenthos. Marine Ecology Progress Series 297, 101–118.
Brandt, A., 2005. Evolution of Antarctic biodiversity in the context of the past: theimportance of the Southern Ocean deep sea. Antarctic Science 17, 509–521.
Brandt, A., De Broyer, C., De Mesel, I., Ellingsen, E., Gooday, A.J., Hilbig, B., Linse, K.,Tyler, P.A., 2007. The biodiversity of the deep Southern Ocean benthos.Phylosophical Transactions of the Royal Society of London B: Biological Science362, 39–66.
Brethes, J.-C., Ferreyra, G., de la Vega, S., 1994. Distribution, growth andreproduction of the limpet Nacella (Patinigera) concinna (Strebel, 1908) inrelation to potential food availability, in Esperanza Bay (Antarctic Peninsula).Polar Biology 14, 161–170.
Brey, T., Dahm, C., Gorny, M., Klage, M., Stiller, M., Arntz, W.E., 1996. Do Antarcticmarine benthic invertebrates show an extended level of eurybathy? AntarcticScience 8 3–6.
Chown, S.L., Lee, J.E., Shaw, J.D., 2008. Conservation of Southern Ocean Islands:invertebrates as exemplars. Journal of Insect Conservation 12, 277–291.
Clarke, A., Crame, J., 1989. The origin of the Southern Ocean marine fauna. In:Crame, J.A. (Ed.), Origins and Evolution of the Antarctic Biota, 47. GeologicalSociety Special Publication, pp. 253–268.
Clarke, A., Johnston, N.M., 2003. Antarctic marine benthic diversity. Oceanographyand Marine Biology: An Annual Review 41, 47–114.
Clarke, A., Aronson, R.B., Crame, J.A., Gili, J.-M., Blake, D.B., 2004. Evolution anddiversity of the benthic fauna of the Southern Ocean continental shelf.Antarctic Science 16, 559–568.
Clarke, A., Barnes, D.K.A., Hodgson, D.A., 2005. How isolated is Antarctica? Trendsin Ecology & Evolution 20 1–3.

C.A. Gonzalez-Wevar et al. / Deep-Sea Research II 58 (2011) 220–229228
Convey, P., Gibson, J.A.E., Hillenbrand, C.-D., Hodgson, D.A., Pugh, P.J.A., Smellie, J.L.,Stevens, M.I., 2008. Antarctic terrestrial life—challenging the history of thefrozen continent. Biological Review 83, 103–117.
Corte-Real, H.B.S.M., Hawkins, S.J., Thorpe, J.P., 1992. Genetic confirmation thatintertidal and subtidal morphs of Patella ulyssiponensis aspera Roding(Mollusca: Gastropoda: Patellidae) are conspecific. Arquipelago 10, 55–66.
Crame, J.A., 1999. An evolutionary perspective on marine faunal connectionbetween southernmost South America and Antarctica. Scientia Marina 63,1–14.
D’Anatro, A.D., Lessa, E.P., 2006. Geometric morphometric analysis of geographicvariation in the Rıo Negro tuco-tuco, Ctenomys rionegrensis. MammalianBiology 71, 288–298.
Davenport, J., 1988. Tenacity of the Antarctic limpet Nacella concinna. Journal ofMolluscan Studies 54, 355–356.
de Aranzamendi, M.C., Sahade, R., Tatian, M., Chiappero, B., 2008. Geneticdifferentiation between morphotypes in the Antarctic limpet Nacella concinnaas revealed by inter-simple sequence repeat markers. Marine Biology 154,875–885.
de Aranzamendi, M.C., Gardenal, C., Martin, J.P., Bastidas, R., 2009. Limpets of thegenus Nacella (Patellogatropoda) from the Southwestern Atlantic: speciesidentification based on molecular data. Journal of Molluscan Studies 75,241–251.
Dıaz, A.D., 2008. Origen y evolucion de la fauna marina bentonica antartica:diversidad genetica y divergencia molecular entre especies congenericas deEchinoidea de Antartica y Sudamerica. Tesis de Magıster. Universidad de Chile,Santiago, Chile. 65 pp (unpublished).
Dıaz, A.D., Feral, J.-P., David, B., Sauc�ede, T., Poulin, E., 2011. Evolutionary pathwaysamong shallow and deep sea echinoids of the genus Sterechinus in theSouthern Ocean. Deep-Sea Research II 58 (1–2), 205–211.
Dupanloup, I., Schneider, S., Excoffier, L., 2002. A simulated annealing approach todefine the genetic structure of populations. Molecular Ecology 11,2571–2581.
Excoffier, L., Laval, G., Schneider, S., 2005. Arlequin ver. 3.0: an integrated softwarepackage for population genetics data analysis. Evolution Bioinformatics Online1, 47–50.
Filatov, D.A., 2002. PROSEQ: a software for preparation and evolutionary analysisof DNA sequence data sets. Molecular Ecology Notes 2, 621–624.
Goldstien, S.J., Schiel, D.R., Gemmel, N.J., 2006. Comparative phylogeography ofcoastal limpet across a marine disjunction in New Zealand. Molecular Ecology15, 3259–3268.
Gonzalez-Wevar, C.A., Nakano, T., Canete, J.I., Poulin, E., 2010. Molecularphylogeny and historical biogeography of Nacella (Patellogastropoda:Nacellidae) in the Southern Ocean. Molecular Phylogenetics and Evolution56, 115–124.
Gray, J.S., 2001. Antarctic marine benthic biodiversity in a world-wide latitudinalcontext. Polar Biology 24, 633–641.
Gutt, J., Sirenko, B., Smirnov, I.S., Arntz, W.E., 2004. How many macrozoobenthic-species might inhabit the Antarctic shelf? Antarctic Science 16 11–16.
Hammer, Ø., Harper, D.A.T., Ryan, P.D., 2001. PAST: paleontological statisticssoftware package for education and data analysis. Paleontologia Electronica 1,1–9.
Hedgpeth, J.W., 1969. Preliminary observations of life between tidemarks atPalmer Station, 64145’S. Antarctic Journal of the United States 4, 106–107.
Ho, S.Y.W., Phillips, M.J., Cooper, A., Drummond, A.J., 2005. Time dependency ofmolecular rate estimated and systematic overestimation of recent divergencetimes. Molecular Biology and Evolution 22, 1561–1568.
Ho, S.Y.W., Shapiro, B., Phyllips, M.J., Cooper, A., Drummond, A.J., 2007. Evidencefor time dependency of molecular rate estimates. Systematic Biology 56,517–522.
Hoffman, J.I., Peck, L.S., Hillyard, G., Zieritz, A., Clark, M.S., 2010. No evidence forgenetic differentiation between Antarctic limpet Nacella concinna morpho-types. Marine Biology 157 10.1007/s00227-009-1360-5.
Holsinger, K.E., Weir, B.S., 2009. Genetics in geographically structured populations:defining, estimating and interpreting FST. Nature Reviews Genetics 10, 639–650.
Hunter, R.L., Halanych, K.M., 2008. Evaluating connectivity in the brooding brittlestar Astrotoma agassizzi across the Drake Passage in the Southern Ocean.Journal of Heredity 99, 137–148.
Iwata, H., Ukai, Y., 2002. SHAPE: a computer program package for quantitativeevaluation of biological shapes based on elliptic Fourier descriptors. Journal ofHeredity 93, 384–385.
Jazdzweski, K., Jurasz, W., Presler, E., Sicinski, J., 1986. Abundance and biomassestimates of the benthic fauna in Admiralty Bay, King George Island, SouthShetland Islands. Polar Biology 6, 5–16.
Krabbe, K., Leese, F., Mayer, C., Tollrian, R., Held, C., 2009. Cryptic mitochondriallineages in the widespread pycnogonid Colossendeis megalonyx Hoek, 1881from Antarctic and Subantarctic waters. Polar Biology 33, 281–292.
Kuhl, F.P., Giardina, C.R., 1982. Elliptic Fourier features of a closed contour.Comparative Graphic Image Process 18, 236–258.
Kuhner, M.K., Yamato, J., Felsenstein, J., 1998. Maximum likelihood estimation ofpopulation growth rates based on the coalescent. Genetics 149, 429–434.
Kumar, S., Tamura, K., Nei, M., 2004. MEGA3: integrated software for molecularevolutionary genetics analysis and sequence alignment. Briefings in Bioinfor-matics 5, 150–163.
Librado, P., Rozas, J., 2009. DnaSP v5: a software for comprehensive analysis ofDNA polymorphism data. Bioinformatics 25, 1451–1452.
Lindberg, D.R., 1998. The Patellogastropoda. Malacological Reviews (4), 35–63.
Lindberg, D.R., 2008. The Patellogastropoda. In: Ponder, W.F., Lindberg, D.R. (Eds.),Phylogeny and Evolution of the Mollusca. University of California Press, pp.271–296.
Mahon, A.R., Arango, C.P., Halanych, K.M., 2008. Genetic diversity of Nymphon(Arthropoda: Pignogonida: Nymphonidae) along the Antarctic Peninsulawith focus on Nymphon australe Hodgson 1902. Marine Biology 155, 315–323.
Morriconi, E., Calvo, J., 1993. Influencia ambiental sobre el crecimiento alometricode la valva en Nacella (Patinigera) deaurata (Gmelin, 1791) del Canal Beagle,Argentina. Malacologıa 35, 135–140.
Nakano, T., Ozawa, T., 2005. Systematic revision of Patelloida pygmaea (Dunker,1860) (Gastropoda: Lottiidae), with a description of a new species. Journal ofMolluscan Studies 71, 357–370.
Nakano, T., Ozawa, T., 2007. Worldwide phylogeography of limpets of the orderPatellogastropoda: molecular, morphological and palaentological evidence.Journal of Molluscan Studies 73, 79–99.
Nakano, T., Spencer, H.G., 2007. Simultaneous polyphenism and cryptic species inan intertidal limpet from New Zealand. Molecular Phylogenetics and Evolution45, 470–479.
Nei, M., 1987. Molecular Evolutionary Genetics. Columbia University PressNew York.
Nolan, C.P., 1991. Size, shape and shell morphology in the Antarctic limpet Nacellaconcinna at Signy Island, South Orkney Islands. Journal of Molluscan Studies57, 225–238.
Pagarete, A.J.P., Costa, M.J., Brito, C., 2005. Genetic conspecifity in two habitatmorphs of the limpet Patella candei gomesii Drouet (Mollusca: Gastropoda:Patellidae) reinforces limpet morphological plasticity. JYI 12 (5).
Peck, L., Veal, R., 2001. Feeding, metabolism and growth in the Antarctic limpet,Nacella concinna (Strebel, 1908). Marine Biology 138, 553–560.
Peck, L., Clark, M.S., Clarke, A., Cockell, C.S., Convey, P., Detrich, I.I.I.H.W.,Fraser, K.P.P., Johnston, I.A., Methe, B.A., Murray, A.E., Romisch, K., Rogers,A.D., 2005. Genomics: applications to Antarctic ecosystems. Polar Biology 28,251–265.
Picken, G.B., 1980. The distribution, growth, and reproduction of the Antarcticlimpet Nacella (Patinigera) concinna (Strebel, 1908). Journal of ExperimentalMarine Biology and Ecology 42, 71–85.
Picken, G.B., Allan, D., 1983. Unique spawning behaviour by the Antarctic limpetNacella (Patinigera) concinna (Strebel, 1908). Journal of Experimental MarineBiology and Ecology 71, 283–287.
Posada, D., Crandall, K.A., 2001. Intraspecific phylogenetics: trees grafting intonetworks. Trends in Ecology & Evolution 16, 37–45.
Poulin, E., Palma, A., Feral, J.-P., 2002. Evolutionary versus ecologicalsuccess in Antarctic benthic invertebrates. Trends in Ecology & Evolution 17,218–222.
Powell, A.W.R., 1973. The Patellid Limpets of the World (Patellidae). In: Abbot, R.T.(Ed.), Indo-Pacific-Mollusca, vol. 3. The Department of Mollusks, Greenville,pp. 75–206.
Renaud, S., Michaux, J.R., 2003. Adaptative latitudinal trends in the mandible shapeof Apodemus wood mice. Journal of Biogeography 30, 1617–1628.
Renaud, S., Michaux, J.R., 2007. Mandibles and molars of the wood mouseApodemus sylvaticus (L): integrated latitudinal pattern and mosaic insularevolution. Journal of Biogeography 34, 339–355.
Roe, A.D., Sperling, F.A.H., 2007. Patterns of evolution of mitochondrial cytochromeoxidase I and II DNA and implications for DNA barcoding. MolecularPhylogenetics and Evolution 44, 325–345.
Rogers, A.R., 2007. Evolution and biodiversity of Antarctic organisms: a molecularperspective. Philosophical Transactions of the Royal Society of London B:Biological Science 362, 2191–2214.
Rogers, A.R., Harpending, H.C., 1992. Population growth makes waves in thedistribution of pairwise genetic differences. Molecular Biology 9, 552–569.
Rohl, A., 2002. Network, netw3111.exe downloaded from the web site. /www.fluxus-engineering.comS.
Rohlf, F.J., Archie, J.W., 1984. A comparison of Fourier methods for the descriptionof wing shape in mosquitoes (Ritera culicidae). Systematic Zoology 33,302–317.
Schneider, S., Excoffier, L., 1999. Estimation of past demographic parametersfrom the distribution of pairwise differences when the mutation ratesvary among sites. Application to human mitochondrial DNA. Genetics 152,1079–1089.
Slatkin, M., Hudson, R.R., 1991. Pairwise comparisons of mitochondrial DNAsequences in stable and exponentially growing populations. Genetics 129,555–562.
Stanwell-Smith, D., Clarke, A., 1998. The timing of reproduction in theAntarctic limpet Nacella concinna (Strebel, 1908) (Patellidae) at Signy Island,in relation to environmental variables. Journal of Molluscan Studies 64,123–127.
Strugnell, J.M., Linse, K., 2005. Evolution of the Antarctic marine fauna: what canDNA and fossil tell us?. In: Cooper, A.K., Raymond, C.R., et al. (Eds.), Antarctica:A keystone in a Changing World—Online Proceedings of the 10th ISAES. USGSOpen-File Report 2007-1047, Extended Abstracts 079, 4pp.
Thatje, S., Hillenbrand, C.-D., Larter, R., 2005. On the origin of Antarcticmarine benthic community structure. Trends in Ecology & Evolution 20,534–540.
Thompson, J.D., Higgins, D.G., Gibson, T.J., 1992. Clustal W: improving thesensitivity of progressive multiple sequence alignment through sequenceweighting, position specific gap penalties, and weight matrix choice. NucleicAcids Research 22, 4673–4680.
C.A. Gonzalez-Wevar et al. / Deep-Sea Research II 58 (2011) 220–229 229
Thornhill, D.J., Mahon, A.R., Norenburg, J.L., Halanych, K.M., 2008. Open-oceanbarriers to dispersal: a test case with the Antarctic Polar Front and the ribbonworm Parbolasia corrugatus (Nemertea: Lineidae). Molecular Ecology 17,5104–5117.
Valdovinos, C., Ruth, M., 2005. Nacellidae limpets of the southern end of SouthAmerica: taxonomy and distribution. Revista Chilena de Historia Natural 78,497–517.
Walker, A.J.M., 1972. Introduction to the ecology of the Antarctic limpet Patinigerapolaris (Hombron and Jaquinot) at Signy Island, South Orkney Island. BritishAntarctic Survey Bulletin 28, 49–69.
Wilson, N.G., Hunter, R.L., Lockhart, S.J., Halanych, K.M., 2007. Multiple lineagesand absence of panmixia in the ‘‘circumpolar’’ crinoid Promachocrinus
kerguelenensis from the Atlantic sector of Antarctica. Marine Biology 152,895–904.
Wilson, N.G., Schrold, M., Halanych, K.M., 2009. Ocean barriers and glaciation:evidence for explosive radiation of mitochondrial lineages in the Antarctic seaslug Doris kerguelenensis (Mollusca, Nudibranchia). Molecular Ecology 18,965–984.
Zane, L., Marcato, S., Bargelloni, L., Bortolotto, E., Papetti, C., Simonato, M., Varotto,V., Patarnello, T., 2006. Demographic history and population structure of theAntarctic silverfish Pleurogramma antarticum. Molecular Ecology 15,4499–4511.
Zachos, J., Pagani, M., Sloan, L., Thomas, E., Billups, K., 2001. Trends, rhythms, andaberrations on global climate 65 Ma to present. Science 292, 686–693.
Related Documents