Molecular Phylogenetics and Evolution 43 (2007) 1076–1095 www.elsevier.com/locate/ympev 1055-7903/$ - see front matter © 2006 Elsevier Inc. All rights reserved. doi:10.1016/j.ympev.2006.10.003 Phylogeny of the Procyonidae (Mammalia: Carnivora): Molecules, morphology and the Great American Interchange Klaus-Peter KoepXi a,¤ , Matthew E. Gompper b , Eduardo Eizirik c , Cheuk-Chung Ho a , Leif Linden a , Jesus E. Maldonado d , Robert K. Wayne a a Department of Ecology and Evolutionary Biology, University of California, Los Angeles, CA 90095-1606, USA b Department of Fisheries and Wildlife Sciences, University of Missouri, Colombia, MO 65211, USA c Faculdade de Biociencias, PUCRS, Av. Ipiranga, 6681, Predio 12, Porto Alegre, RS 90619-900, Brazil d Smithsonian Institution, NMNH/NZP—Genetic Program, 3001 Connecticut Avenue NW, Washington, DC 20008, USA Received 10 June 2006; revised 22 September 2006; accepted 2 October 2006 Available online 11 October 2006 Abstract The Procyonidae (Mammalia: Carnivora) have played a central role in resolving the controversial systematics of the giant and red pandas, but phylogenetic relationships of species within the family itself have received much less attention. Cladistic analyses of morpho- logical characters conducted during the last two decades have resulted in topologies that group ecologically and morphologically similar taxa together. SpeciWcally, the highly arboreal and frugivorous kinkajou (Potos Xavus) and olingos (Bassaricyon) deWne one clade, whereas the more terrestrial and omnivorous coatis (Nasua), raccoons (Procyon), and ringtails (Bassariscus) deWne another clade, with the similar-sized Nasua and Procyon joined as sister taxa in this latter group. These relationships, however, have not been tested with molecu- lar sequence data. We examined procyonid phylogenetics based on combined data from nine nuclear and two mitochondrial gene seg- ments totaling 6534 bp. We were able to fully resolve relationships within the family with strongly supported and congruent results from maximum parsimony, maximum likelihood, minimum evolution, and Bayesian analyses. We identiWed three distinct lineages within the family: a (Nasua, Bassaricyon) clade, a (Bassariscus, Procyon) clade, and a Potos lineage, the last of which is sister to the other two clades. These Wndings, which are in strong disagreement with prior fossil and morphology-based assessments of procyonid relationships, reem- phasize the morphological and ecological Xexibility of these taxa. In particular, morphological similarities between unrelated genera pos- sibly reXect convergence associated with similar lifestyles and diets rather than ancestry. Furthermore, incongruence between the molecular supermatrix and a morphological character matrix comprised mostly of dental characters [Baskin, J.A., 2004. Bassariscus and Probassariscus (Mammalia, Carnivora, Procyonidae) from the early Barstovian (Middle Miocene). J. Vert. Paleo. 24, 709–720] may be due to non-independence among atomized dental characters that does not take into account the high developmental genetic correlation of these characters. Finally, molecular divergence dating analyses using a relaxed molecular clock approach suggest that intergeneric and intrageneric splits in the Procyonidae mostly occurred in the Miocene. The inferred divergence times for intrageneric splits for several genera whose ranges are bisected by the Panamanian Isthmus is signiWcant because they suggest diversiWcation well precedes the Great American Interchange, which has long been considered a primary underlying mechanism for procyonid evolution. © 2006 Elsevier Inc. All rights reserved. Keywords: Procyonidae; Carnivora; Molecular phylogeny; Great American Interchange; Biogeography; Molecules versus morphology 1. Introduction The Procyonidae is one of the 11 traditional families of the mammalian order Carnivora. The family consists of 14 extant species in six genera (Wozencraft, 2005) that are geo- graphically distributed across the Americas and includes * Corresponding author. Fax: +1 310 206 3987. E-mail address: [email protected] (K.-P. KoepXi).

Welcome message from author
This document is posted to help you gain knowledge. Please leave a comment to let me know what you think about it! Share it to your friends and learn new things together.
Transcript
Molecular Phylogenetics and Evolution 43 (2007) 1076–1095www.elsevier.com/locate/ympev
Phylogeny of the Procyonidae (Mammalia: Carnivora): Molecules, morphology and the Great American Interchange
Klaus-Peter KoepXi a,¤, Matthew E. Gompper b, Eduardo Eizirik c, Cheuk-Chung Ho a, Leif Linden a, Jesus E. Maldonado d, Robert K. Wayne a
a Department of Ecology and Evolutionary Biology, University of California, Los Angeles, CA 90095-1606, USAb Department of Fisheries and Wildlife Sciences, University of Missouri, Colombia, MO 65211, USA
c Faculdade de Biociencias, PUCRS, Av. Ipiranga, 6681, Predio 12, Porto Alegre, RS 90619-900, Brazild Smithsonian Institution, NMNH/NZP—Genetic Program, 3001 Connecticut Avenue NW, Washington, DC 20008, USA
Received 10 June 2006; revised 22 September 2006; accepted 2 October 2006Available online 11 October 2006
Abstract
The Procyonidae (Mammalia: Carnivora) have played a central role in resolving the controversial systematics of the giant and redpandas, but phylogenetic relationships of species within the family itself have received much less attention. Cladistic analyses of morpho-logical characters conducted during the last two decades have resulted in topologies that group ecologically and morphologically similartaxa together. SpeciWcally, the highly arboreal and frugivorous kinkajou (Potos Xavus) and olingos (Bassaricyon) deWne one clade,whereas the more terrestrial and omnivorous coatis (Nasua), raccoons (Procyon), and ringtails (Bassariscus) deWne another clade, with thesimilar-sized Nasua and Procyon joined as sister taxa in this latter group. These relationships, however, have not been tested with molecu-lar sequence data. We examined procyonid phylogenetics based on combined data from nine nuclear and two mitochondrial gene seg-ments totaling 6534 bp. We were able to fully resolve relationships within the family with strongly supported and congruent results frommaximum parsimony, maximum likelihood, minimum evolution, and Bayesian analyses. We identiWed three distinct lineages within thefamily: a (Nasua, Bassaricyon) clade, a (Bassariscus, Procyon) clade, and a Potos lineage, the last of which is sister to the other two clades.These Wndings, which are in strong disagreement with prior fossil and morphology-based assessments of procyonid relationships, reem-phasize the morphological and ecological Xexibility of these taxa. In particular, morphological similarities between unrelated genera pos-sibly reXect convergence associated with similar lifestyles and diets rather than ancestry. Furthermore, incongruence between themolecular supermatrix and a morphological character matrix comprised mostly of dental characters [Baskin, J.A., 2004. Bassariscus andProbassariscus (Mammalia, Carnivora, Procyonidae) from the early Barstovian (Middle Miocene). J. Vert. Paleo. 24, 709–720] may be dueto non-independence among atomized dental characters that does not take into account the high developmental genetic correlation ofthese characters. Finally, molecular divergence dating analyses using a relaxed molecular clock approach suggest that intergeneric andintrageneric splits in the Procyonidae mostly occurred in the Miocene. The inferred divergence times for intrageneric splits for severalgenera whose ranges are bisected by the Panamanian Isthmus is signiWcant because they suggest diversiWcation well precedes the GreatAmerican Interchange, which has long been considered a primary underlying mechanism for procyonid evolution.© 2006 Elsevier Inc. All rights reserved.
Keywords: Procyonidae; Carnivora; Molecular phylogeny; Great American Interchange; Biogeography; Molecules versus morphology
* Corresponding author. Fax: +1 310 206 3987.E-mail address: [email protected] (K.-P. KoepXi).
1055-7903/$ - see front matter © 2006 Elsevier Inc. All rights reserved.doi:10.1016/j.ympev.2006.10.003
1. Introduction
The Procyonidae is one of the 11 traditional families ofthe mammalian order Carnivora. The family consists of 14extant species in six genera (Wozencraft, 2005) that are geo-graphically distributed across the Americas and includes
K.-P. KoepXi et al. / Molecular Phylogenetics and Evolution 43 (2007) 1076–1095 1077
highly arboreal tropical frugivores (olingos [Bassaricyon spp.]and the prehensile-tailed kinkajou [Potos Xavus]) and terres-trial to arboreal omnivores found across a diversity of habi-tats (ringtail and cacomistle [Bassariscus spp.]; coatis [Nasuaspp. and Nasuella olivacea]; and raccoons [Procyon spp.])(ZeveloV, 2002; Nowak, 2005). As a result of their diets andin contrast to many other species in the Carnivora, most pro-cyonids are characterized by having hypocarnivorous denti-tions. Coat patterns among the species are diverse, withNasua, Procyon and Bassariscus having striking tail annula-tions and masks, while in Bassaricyon and Potos such mark-ings are either reduced or lacking altogether.
Systematic relationships of the extant Procyonidae havereceived a great deal of indirect study. As pivotal subjects inthe long-running controversy over placement of giant andred pandas (Ailuropoda and Ailurus), procyonids became theperennial outgroup or ingroup (O’Brien et al., 1985, 1991;Mayr, 1986; Tagle et al., 1986; Goldman et al., 1989; Zhangand Shi, 1991; Hashimoto et al., 1993; Pecon Slattery andO’Brien, 1995). Yet these studies did not directly examinerelationships within the Procyonidae and earlier direct stud-ies of procyonid interrelationships, based on overall similar-ity of various anatomical features, yielded conXicting results.For example, Gill (1872) and Hollister (1916) excluded ring-tails (Bassariscus spp.) from the family, whereas McGrew(1938) adamantly included them. Pocock (1921) concludedthat procyonid genera probably shared a common ancestor,but placed each genus in its own subfamily because of theirmorphological dissimilarites. Davis (1941) and Segall (1943)both questioned the placement of Potos within procyonids.Story (1951) examined the pattern of the carotid arteries andtheir branches in Procyon lotor and other procyonid taxaand used these patterns to infer relationships among genera,with Procyon and Nasua being most similar.
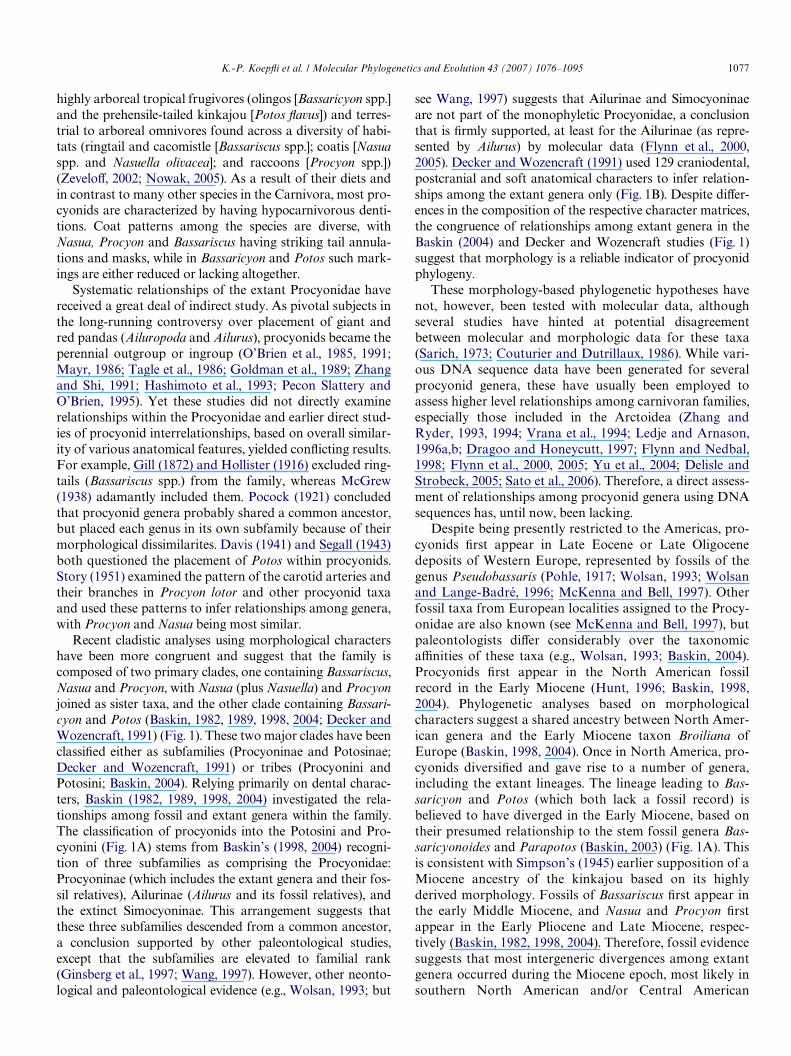
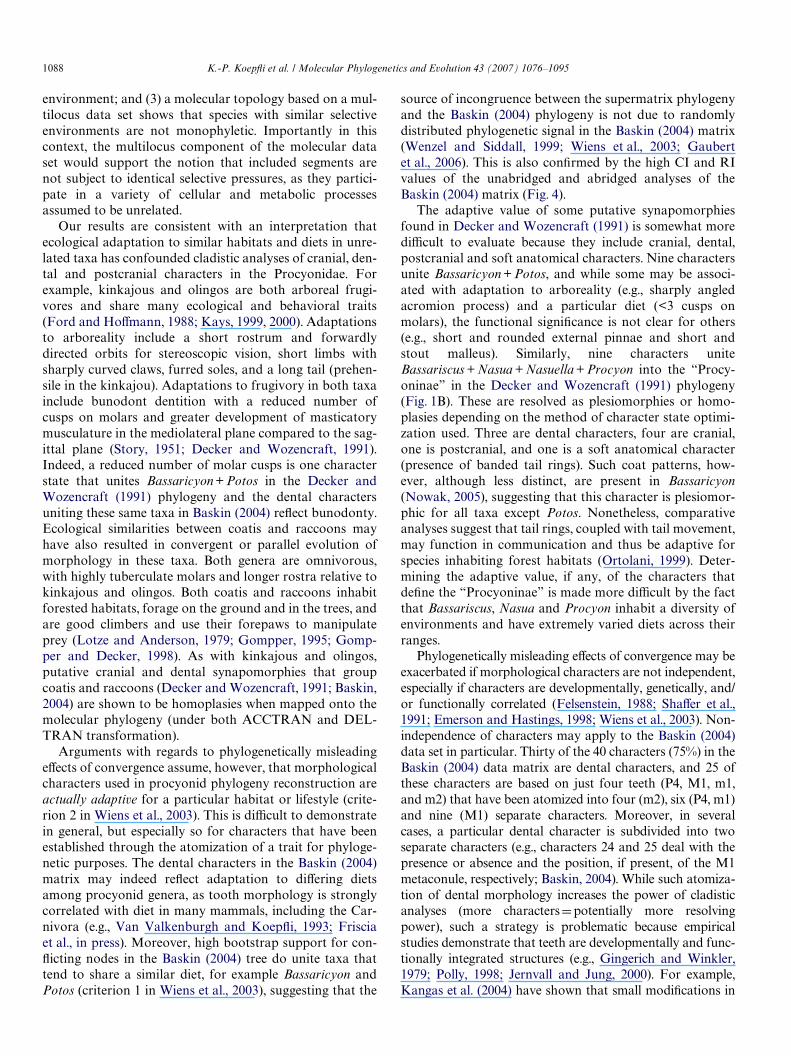
Recent cladistic analyses using morphological charactershave been more congruent and suggest that the family iscomposed of two primary clades, one containing Bassariscus,Nasua and Procyon, with Nasua (plus Nasuella) and Procyonjoined as sister taxa, and the other clade containing Bassari-cyon and Potos (Baskin, 1982, 1989, 1998, 2004; Decker andWozencraft, 1991) (Fig. 1). These two major clades have beenclassiWed either as subfamilies (Procyoninae and Potosinae;Decker and Wozencraft, 1991) or tribes (Procyonini andPotosini; Baskin, 2004). Relying primarily on dental charac-ters, Baskin (1982, 1989, 1998, 2004) investigated the rela-tionships among fossil and extant genera within the family.The classiWcation of procyonids into the Potosini and Pro-cyonini (Fig. 1A) stems from Baskin’s (1998, 2004) recogni-tion of three subfamilies as comprising the Procyonidae:Procyoninae (which includes the extant genera and their fos-sil relatives), Ailurinae (Ailurus and its fossil relatives), andthe extinct Simocyoninae. This arrangement suggests thatthese three subfamilies descended from a common ancestor,a conclusion supported by other paleontological studies,except that the subfamilies are elevated to familial rank(Ginsberg et al., 1997; Wang, 1997). However, other neonto-logical and paleontological evidence (e.g., Wolsan, 1993; but
see Wang, 1997) suggests that Ailurinae and Simocyoninaeare not part of the monophyletic Procyonidae, a conclusionthat is Wrmly supported, at least for the Ailurinae (as repre-sented by Ailurus) by molecular data (Flynn et al., 2000,2005). Decker and Wozencraft (1991) used 129 craniodental,postcranial and soft anatomical characters to infer relation-ships among the extant genera only (Fig. 1B). Despite diVer-ences in the composition of the respective character matrices,the congruence of relationships among extant genera in theBaskin (2004) and Decker and Wozencraft studies (Fig. 1)suggest that morphology is a reliable indicator of procyonidphylogeny.
These morphology-based phylogenetic hypotheses havenot, however, been tested with molecular data, althoughseveral studies have hinted at potential disagreementbetween molecular and morphologic data for these taxa(Sarich, 1973; Couturier and Dutrillaux, 1986). While vari-ous DNA sequence data have been generated for severalprocyonid genera, these have usually been employed toassess higher level relationships among carnivoran families,especially those included in the Arctoidea (Zhang andRyder, 1993, 1994; Vrana et al., 1994; Ledje and Arnason,1996a,b; Dragoo and Honeycutt, 1997; Flynn and Nedbal,1998; Flynn et al., 2000, 2005; Yu et al., 2004; Delisle andStrobeck, 2005; Sato et al., 2006). Therefore, a direct assess-ment of relationships among procyonid genera using DNAsequences has, until now, been lacking.
Despite being presently restricted to the Americas, pro-cyonids Wrst appear in Late Eocene or Late Oligocenedeposits of Western Europe, represented by fossils of thegenus Pseudobassaris (Pohle, 1917; Wolsan, 1993; Wolsanand Lange-Badré, 1996; McKenna and Bell, 1997). Otherfossil taxa from European localities assigned to the Procy-onidae are also known (see McKenna and Bell, 1997), butpaleontologists diVer considerably over the taxonomicaYnities of these taxa (e.g., Wolsan, 1993; Baskin, 2004).Procyonids Wrst appear in the North American fossilrecord in the Early Miocene (Hunt, 1996; Baskin, 1998,2004). Phylogenetic analyses based on morphologicalcharacters suggest a shared ancestry between North Amer-ican genera and the Early Miocene taxon Broiliana ofEurope (Baskin, 1998, 2004). Once in North America, pro-cyonids diversiWed and gave rise to a number of genera,including the extant lineages. The lineage leading to Bas-saricyon and Potos (which both lack a fossil record) isbelieved to have diverged in the Early Miocene, based ontheir presumed relationship to the stem fossil genera Bas-saricyonoides and Parapotos (Baskin, 2003) (Fig. 1A). Thisis consistent with Simpson’s (1945) earlier supposition of aMiocene ancestry of the kinkajou based on its highlyderived morphology. Fossils of Bassariscus Wrst appear inthe early Middle Miocene, and Nasua and Procyon Wrstappear in the Early Pliocene and Late Miocene, respec-tively (Baskin, 1982, 1998, 2004). Therefore, fossil evidencesuggests that most intergeneric divergences among extantgenera occurred during the Miocene epoch, most likely insouthern North American and/or Central American
1078 K.-P. KoepXi et al. / Molecular Phylogenetics and Evolution 43 (2007) 1076–1095
subtropical and/or tropical forests (Simpson, 1945; Hershko-vitz, 1972; Baskin, 1982, 1998; Webb, 1985). A well-resolvedmolecular phylogeny of the Procyonidae, combined with reli-able estimates of divergence times, can be used to examinetemporal patterns of diversiWcation in this group, allowingcomparisons with inferences based on the fossil record.
The timing of intrageneric divergences is less well under-stood, particularly with regard to species distributed inSouth America. This is primarily due to either the completelack of a fossil record for some species [e.g., Wve species ofBassaricyon, although these may represent just one species(Poglayen-Neuwall and Poglayen-Neuwall, 1965; Nowak,2005)] or the fragmentary record for other species (e.g.,
Nasua spp. and Procyon spp.). Regarding the latter, fossilsof Nasua and Procyon from South America are Wrstrecorded in Early to Late Pleistocene deposits (Berta et al.,1978; Marshall et al., 1984). Therefore, a large temporal andspatial gap exists between the time and place Nasua andProcyon Wrst appear in North America (Late Miocene andEarly Pliocene, respectively [ca. 5.3 mya for this boundary])and the time they Wrst appear in South America (Early toLate Pleistocene, 1.5–0.1 mya). Intriguingly, however, cur-rent geographic ranges of Bassaricyon, Nasua, Procyon, andPotos are bisected by the Isthmus of Panama. The Isthmusrose above sea level ca. 3–2.5 mya in the Late Pliocene,forming a landbridge between North and South America
Fig. 1. Phylogenetic hypotheses of Procyonidae derived from morphologic cladistic analyses. (A) Phylogeny of fossil and extant genera from Baskin, 2004.Amphictis is the outgroup. Extinct genera are denoted by a cross (9). Geographical origins of fossil taxa are indicated in parentheses. EU, Europe; NA,North America; SA, South America. (B) Phylogeny of extant genera only from Decker and Wozencraft, 1991. Proposed tribal (A) or subfamilial (B) aYl-iations are shown at right.
K.-P. KoepXi et al. / Molecular Phylogenetics and Evolution 43 (2007) 1076–1095 1079
that facilitated one of the major biological events of lateCenozoic history, the Great American Interchange (Mar-shall et al., 1979, 1982; Marshall, 1985; Webb, 1985, 1997;Marshall and Sempere, 1993; Coates and Obando, 1996).Ranges of putative sister species within Nasua, Procyon,and possibly Bassaricyon overlap on or meet near the Isth-mus of Panama, suggesting that current procyonid diversityand biogeography may have been inXuenced by formationof the Panamanian landbridge. Whether the rise of the Isth-mus of Panama played a role in intrageneric speciationevents of procyonids can be tested by comparing moleculardivergence times of the species involved with the well-deWned geochronology of the formation and closure of thePanamanian landbridge (e.g., Marshall et al., 1979; Mar-shall, 1985; Marshall and Sempere, 1993).
Here, we present sequence data from two mitochondrialand nine nuclear gene segments to examine phylogeneticsand divergence dating of the Procyonidae from a molecularperspective. Our primary aims are to: (1) critically evaluaterelationships among genera within the family, (2) assesscongruence between phylogenetic hypotheses generatedfrom the present molecular study and previous cladisticmorphological studies, and (3) estimate the relative diver-gence times of genera as well as sister species. The latterissue is particularly interesting in the context of betterunderstanding the biogeographic history of the family andthe potentially pivotal role that the rise of the Isthmus ofPanama may have had on the radiation of procyonids.
2. Materials and methods
2.1. Taxonomic sampling
Our study includes nine species in the Procyonidae, rep-resenting all genera except Nasuella (Table 1). Numerouslines of evidence suggest that Mustelidae (badgers, martens,
otters, and weasels) is sister group to Procyonidae (e.g., deJong, 1986; Flynn et al., 1988, 2000, 2005; Sato et al., 2006).Therefore, we used Wve species from the Mustelidae as out-groups (Table 1). Our sampling of taxa does not include thered panda (Ailurus fulgens) because recent studies based onboth mitochondrial and nuclear DNA sequences haveshown that this taxon diverged prior to divergence ofProcyonidae and Mustelidae (Flynn and Nedbal, 1998;Flynn et al., 2000, 2005; Yu et al., 2004) and most likely rep-resents a monotypic lineage within the newly deWnedMusteloidea (Flynn et al., 2005; Sato et al., 2006).
2.2. Laboratory methods
Total genomic DNA was extracted from tissue samplesusing a commercial kit (QIAamp DNA Mini Kit). We usedthe polymerase chain reaction (PCR) to amplify segmentscontaining exon sequences or exon plus intron sequencesfrom nine nuclear loci and two coding regions from themitochondrial genome (Table 2). AmpliWcation reactionand cycling conditions for all loci, and puriWcation of PCRproducts, followed KoepXi and Wayne (2003). PCR prod-ucts were cycle sequenced using PCR primers and CEQDye Terminator Cycle Sequencing Quick Start Kit (Beck-man Coulter). Sequencing reactions were precipitated fol-lowing the manufacturer’s protocol and products weresequenced on a CEQ2000XL automated capillarysequencer (Beckman Coulter). Electropherograms werechecked for accuracy and edited using Sequencher 3.1(Gene Codes Corporation). We were unable to amplifyRAG2 sequence from Bassariscus sumichrasti, and questionmarks were used to represent missing data for this taxon.Seven previously generated CHRNA1 and two CYTbsequences were from KoepXi and Wayne (2003) and fourCYTb sequences were from KoepXi and Wayne (1998)(Appendix A). Newly generated sequences were deposited
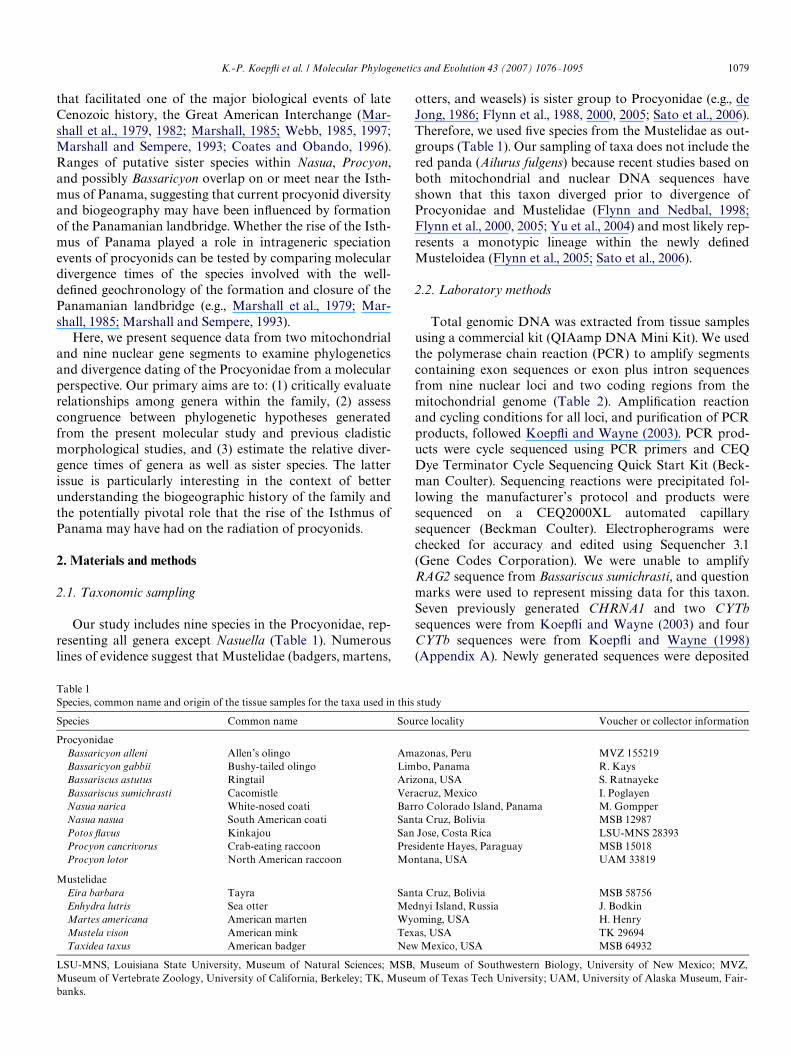
Table 1Species, common name and origin of the tissue samples for the taxa used in this study
LSU-MNS, Louisiana State University, Museum of Natural Sciences; MSB, Museum of Southwestern Biology, University of New Mexico; MVZ,Museum of Vertebrate Zoology, University of California, Berkeley; TK, Museum of Texas Tech University; UAM, University of Alaska Museum, Fair-banks.
Species Common name Source locality Voucher or collector information
ProcyonidaeBassaricyon alleni Allen’s olingo Amazonas, Peru MVZ 155219Bassaricyon gabbii Bushy-tailed olingo Limbo, Panama R. KaysBassariscus astutus Ringtail Arizona, USA S. RatnayekeBassariscus sumichrasti Cacomistle Veracruz, Mexico I. PoglayenNasua narica White-nosed coati Barro Colorado Island, Panama M. GompperNasua nasua South American coati Santa Cruz, Bolivia MSB 12987Potos Xavus Kinkajou San Jose, Costa Rica LSU-MNS 28393Procyon cancrivorus Crab-eating raccoon Presidente Hayes, Paraguay MSB 15018Procyon lotor North American raccoon Montana, USA UAM 33819
MustelidaeEira barbara Tayra Santa Cruz, Bolivia MSB 58756Enhydra lutris Sea otter Mednyi Island, Russia J. BodkinMartes americana American marten Wyoming, USA H. HenryMustela vison American mink Texas, USA TK 29694Taxidea taxus American badger New Mexico, USA MSB 64932
1080 K.-P. KoepXi et al. / Molecular Phylogenetics and Evolution 43 (2007) 1076–1095
in GenBank under the following accession numbers:DQ660167–DQ660306 (Appendix A).
2.3. Phylogenetic analyses
Mitochondrial and nuclear gene sequences were manu-ally aligned and alignments for all loci were unambiguous.Three nuclear loci (APOB, CHRNA1 and WT1) containedinsertions and/or deletions (indels) 1–16 bp in length thatnecessitated introduction of gaps into alignments of thesesegments.
We reconstructed phylogenetic trees from three diVerentpartitions and concatenations of data: (1) nine combinednuclear gene segments; (2) two combined mitochondrialgene segments; and (3) combined nuclear and mitochon-drial segments (hereafter referred to as the supermatrix).Maximum parsimony (MP), maximum likelihood (ML),and minimum evolution (ME) trees were estimated usingPAUP¤ (SwoVord, 2002), while Bayesian inference (BI) wasconducted using MrBayes 3 (Ronquist and Huelsenbeck,2003). Concatenations of mitochondrial and nuclear genesegments were analyzed with MP, ML, and ME methodsonly, whereas the supermatrix was analyzed with all fourtree reconstruction methods. For MP analyses, all nucleo-
tide sites were equally weighted and gaps were coded aspresent or absent (1 or 0), regardless of length, to utilizepotential phylogenetic signal contained by indels (Barriel,1994). For ME and ML analyses, gaps were coded as miss-ing and we used Modeltest 3.7 (Posada and Crandall, 1998)to estimate the best-Wtting model and parameters of DNAevolution (ML) or distance measure (ME) for each datapartition. In both MP and ML analyses, we employed heu-ristic searches with 100 replicates of a random stepwiseaddition and tree bisection–reconnection branch swapping(TBR) algorithm. ME analyses utilized heuristic searcheswith starting trees obtained via neighbor-joining and TBRbranch swapping. Nodal support was assessed by bootstrapresampling, with 1000 (MP and ME) or 500 (ML) pseu-doreplicates using the same heuristic search conditionslisted above (except that only Wve replicates of randomstepwise addition were used in ML). For BI, gaps weretreated as missing and the best-Wtting model of DNA evo-lution selected by Modeltest 3.7 for the supermatrix wasused for the likelihood function component of Bayes’ rule.We used uniform default priors for model parameters,which were estimated as part of the Markov Chain MonteCarlo (MCMC) analyses. MCMC analyses were run for3.0£106 generations, with each Markov chain started from
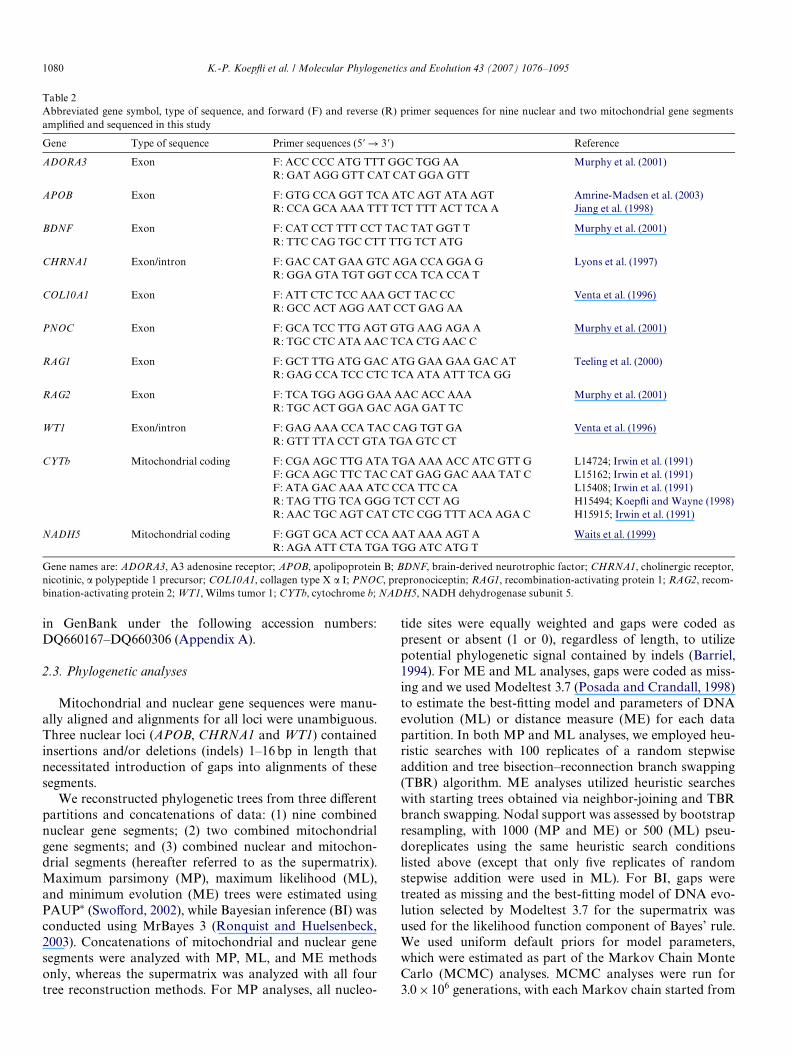
Table 2Abbreviated gene symbol, type of sequence, and forward (F) and reverse (R) primer sequences for nine nuclear and two mitochondrial gene segmentsampliWed and sequenced in this study
Gene names are: ADORA3, A3 adenosine receptor; APOB, apolipoprotein B; BDNF, brain-derived neurotrophic factor; CHRNA1, cholinergic receptor,nicotinic, � polypeptide 1 precursor; COL10A1, collagen type X � I; PNOC, prepronociceptin; RAG1, recombination-activating protein 1; RAG2, recom-bination-activating protein 2; WT1, Wilms tumor 1; CYTb, cytochrome b; NADH5, NADH dehydrogenase subunit 5.
Gene Type of sequence Primer sequences (5� ! 3�) Reference
ADORA3 Exon F: ACC CCC ATG TTT GGC TGG AA Murphy et al. (2001)R: GAT AGG GTT CAT CAT GGA GTT
APOB Exon F: GTG CCA GGT TCA ATC AGT ATA AGT Amrine-Madsen et al. (2003)R: CCA GCA AAA TTT TCT TTT ACT TCA A Jiang et al. (1998)
BDNF Exon F: CAT CCT TTT CCT TAC TAT GGT T Murphy et al. (2001)R: TTC CAG TGC CTT TTG TCT ATG
CHRNA1 Exon/intron F: GAC CAT GAA GTC AGA CCA GGA G Lyons et al. (1997)R: GGA GTA TGT GGT CCA TCA CCA T
COL10A1 Exon F: ATT CTC TCC AAA GCT TAC CC Venta et al. (1996)R: GCC ACT AGG AAT CCT GAG AA
PNOC Exon F: GCA TCC TTG AGT GTG AAG AGA A Murphy et al. (2001)R: TGC CTC ATA AAC TCA CTG AAC C
RAG1 Exon F: GCT TTG ATG GAC ATG GAA GAA GAC AT Teeling et al. (2000)R: GAG CCA TCC CTC TCA ATA ATT TCA GG
RAG2 Exon F: TCA TGG AGG GAA AAC ACC AAA Murphy et al. (2001)R: TGC ACT GGA GAC AGA GAT TC
WT1 Exon/intron F: GAG AAA CCA TAC CAG TGT GA Venta et al. (1996)R: GTT TTA CCT GTA TGA GTC CT
CYTb Mitochondrial coding F: CGA AGC TTG ATA TGA AAA ACC ATC GTT G L14724; Irwin et al. (1991)F: GCA AGC TTC TAC CAT GAG GAC AAA TAT C L15162; Irwin et al. (1991)F: ATA GAC AAA ATC CCA TTC CA L15408; Irwin et al. (1991)R: TAG TTG TCA GGG TCT CCT AG H15494; KoepXi and Wayne (1998)R: AAC TGC AGT CAT CTC CGG TTT ACA AGA C H15915; Irwin et al. (1991)
NADH5 Mitochondrial coding F: GGT GCA ACT CCA AAT AAA AGT A Waits et al. (1999)R: AGA ATT CTA TGA TGG ATC ATG T
K.-P. KoepXi et al. / Molecular Phylogenetics and Evolution 43 (2007) 1076–1095 1081
a random tree and from which trees were sampled every100 generations, using one cold and three heated chains.We used the program Tracer v1.3 (Rambaut et al., 2003) tocheck that chains had mixed well and to verify that conver-gence of log-likelihood scores and model parameters hadreached a stationary distribution, after discarding 300,000generations as burn-in. Two separate MCMC runs wereperformed to ensure consistency of stationary distributionsof likelihood values and parameter estimates between runs.Mean posterior estimates and 95% highest posterior densi-ties of likelihood scores and model parameters for the tworuns were calculated using Tracer v1.3. Clade credibilityvalues were estimated after discarding the Wrst 3000 trees(following a burn-in of 300,000 generations) from each run.
2.4. Assessing congruence between molecular and morphological phylogenies
We used several approaches to assess congruencebetween the phylogeny based on the molecular supermatrixand those estimated with morphological data matrices ofDecker and Wozencraft (1991) and Baskin (2004). First, wecompared the topology derived from MP analysis (as wellas topologies derived from the model-based methods) ofthe molecular supermatrix with the original maximum par-simony topologies from the two morphological studies(Fig. 1).
Second, we evaluated levels of bootstrap support fornodes in the molecular and morphological phylogenetichypotheses to assess whether congruence or incongruencewas signiWcant or insigniWcant among data sets. Bootstrapanalyses of the most parsimonious trees were not per-formed in either the Decker and Wozencraft (1991) orBaskin (2004) studies. This test was conducted to rule outthe possibility that any incongruence was caused by weaklysupported nodes in one or both data sets, which would sug-gest an undersampling of characters as the cause of incon-gruence rather than any real character conXict per se (Hillisand Wiens, 2000). We were unable to obtain the originaldata matrix from the Decker and Wozencraft (1991) (D.Decker, pers. comm.) and could, therefore, not evaluatebootstrap support for nodes recovered in their recon-structed phylogeny. Congruence between the supermatrixphylogeny and the phylogeny from Decker and Wozencraft(1991) was, therefore, assessed by comparison to their pub-lished phylogeny alone (Fig. 2 in Decker and Wozencraft,1991). For the 18 taxa (17 ingroup, 1 outgroup) in theBaskin (2004) data set, 39 of the 40 characters in the datamatrix were coded as ordered as in the original study. Max-imum parsimony bootstrap analysis of this matrix was per-formed using 1000 bootstrap pseudoreplicates with branchand bound search and the “farthest” taxon addition optionin PAUP¤ (SwoVord, 2002). We also adjusted the Baskin(2004) data matrix so that it matched our matrix withrespect to generic representation by excluding all extinctgenera except Amphictis, which was used to root the tree.We then used the abridged Baskin (2004) matrix to recon-
struct maximum parsimony trees (with 39 ordered and oneunordered characters) and to perform bootstrap analysisusing the same search conditions and settings as those usedwith the unabridged data matrix.
Third, to exclude the possibility that any incongruencebetween the supermatrix topology and that derived fromthe abridged Baskin (2004) matrix was due to the use ofdiVerent outgroups (e.g., Hillis and Wiens, 2000), we recon-structed unrooted maximum parsimony networks from thetwo data matrices. For these analyses, one representativespecies of each genus was chosen from the supermatrix tomake taxon representation of the supermatrix equal to theabridged Baskin (2004) matrix (Wve taxa total). Exhaustivesearches were performed with both data matrices sepa-rately and combined using PAUP¤. We used 1000 bootstrappseudoreplicates with branch and bound search and “far-thest” taxon addition option to evaluate nodal support forunrooted trees. The combined analysis was used to infer themost parsimonious network that had the greatest congru-ence among molecular and morphological characters in thecontext of total evidence (Kluge, 1989). For the combinedanalyses, we quantiWed the Bremer support (Bremer, 1988)and partitioned Bremer support (PBS) of nodes inunrooted trees using TreeRot 2.0 (Sorenson, 1998).
Finally, MacClade 4.0 (Maddison et al., 2000) was usedto map putative synapomorphies from the Decker andWozencraft (1991) and Baskin (2004) studies onto themolecular supermatrix topology using the simple parsi-mony criterion with accelerated (ACCTRAN) and delayed(DELTRAN) transformation in order to evaluate ancestralcharacter states and derivation based on the moleculartopology. ACCTRAN maximizes character state reversalswhereas DELTRAN maximizes parallelism of characterstates (SwoVord and Maddison, 1987; Maddison et al.,2000).
2.5. Estimation of divergence times
Divergence time estimates were performed using thewell-supported optimal topology obtained with the molecu-lar supermatrix (see Section 3), using the Relaxed Molecu-lar Clock approach developed by Thorne et al. (1998) andKishino et al. (2001). This topology and the DNA superma-trix data set were used with the program estbranches toobtain estimates of branch lengths and a matrix of rate var-iance–covariance. The estbranches output was used to inferdivergence dates with the program divtime5b, with 1.0£ 106
generations run after 100,000 generations of burn-in. Sev-enteen independent runs of divtime5b were performed toassess convergence of posterior distribution estimates withvarying root age priors (see below) and fossil constraintcombinations. Final runs used four conservative fossil cali-brations drawn from McKenna and Bell (1997) to con-strain node times: (i) 1.8 mya as a minimum age for theorigin of Procyon (applied to node F in Fig. 3); (ii) 3.6 myaas a minimum age for the origin of Nasua (node E in Fig. 3);(iii) 11.2mya as a minimum age of crown Procyonidae (node
1082 K.-P. KoepXi et al. / Molecular Phylogenetics and Evolution 43 (2007) 1076–1095
H), based on a fossil assigned to Bassariscus, and allowedhere to be a stem taxon in that lineage (see Section 4); and(iv) 37 mya as an upper bound for the age of crown Procy-onidae (node H), based on the putative stem taxa Pseudo-bassaris and Amphictis occurring in the Late Eocene andEarly Oligocene, respectively. We set the mean of the priordistribution for the ingroup root age at 24 mya (based onthe Early Miocene taxon Broiliana, proposed to be the ear-liest fossil procyonine—McKenna and Bell (1997); Baskin(1982, 1989, 1998, 2004)) and tested the impact of this priorvalue on the posterior distribution of nodal ages by varyingit in both directions in seven independent runs.
3. Results
3.1. Phylogenetic estimates
The length of the supermatrix alignment was 6534 bp(including gaps). The 11 gene segments contributed the fol-lowing number of nucleotide sites to the supermatrix:ADORA3 (376), APOB (935), BDNF (548), CHRNA1(376), COL10A1 (326), PNOC (287), RAG1 (1071), RAG2(468), WT1 (712), CYTb (1140), NADH5 (295). When gapswere coded following Barriel (1994), the length of the align-ment was reduced to 6491 bp. The concatenated mitochon-drial data set (CYTb and NADH5) contained 677 variablecharacters, of which 525 were parsimony-informative, whilethe concatenated nuclear data set (with coded gaps) con-tained 743 variable characters, of which 426 were parsi-mony-informative (Table 3). Best-Wtting models of DNAsubstitution were identiWed by Akaike Information Criteria(AIC) in Modeltest 3.7 (Posada and Crandall, 1998; Posadaand Buckley, 2004) for the three data partitions (Table 3).The general time reversible model (Tavare, 1986; Yang,1994), with among-site rate variation approximated via a
gamma distribution and a proportion of invariable sites(GTR+G+I), was selected as the best-Wtting model of DNAsubstitution for the supermatrix partition. This model wasemployed in the ML, ME (as the distance correction mea-sure) and BI supermatrix analyses.
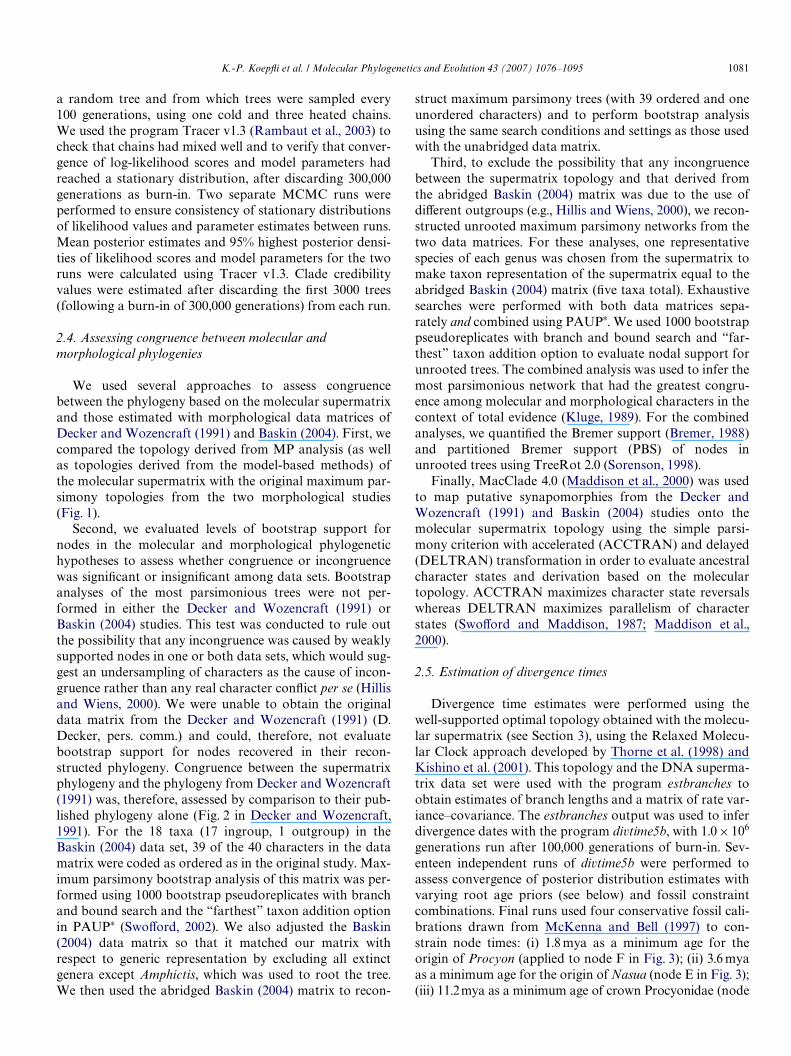
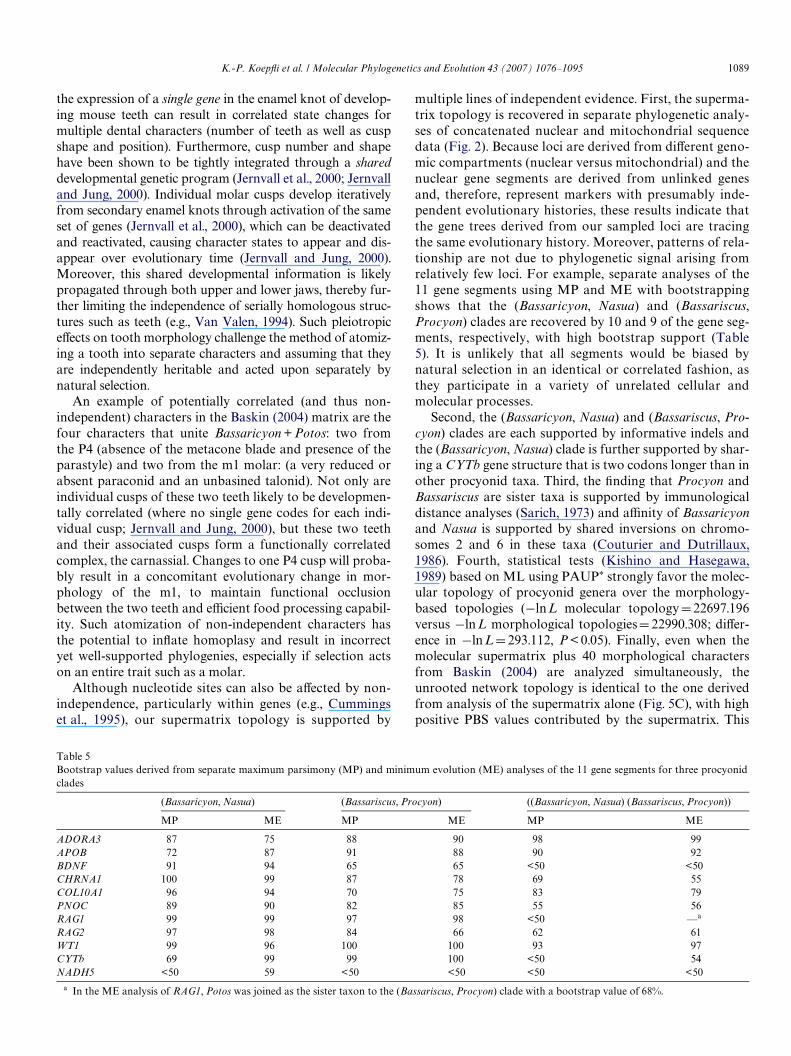
Topologies estimated from MP, ML, and ME analyses ofconcatenated nuclear data and from ML and ME analyses ofthe concatenated mitochondrial data were identical (Fig. 2).In the MP analysis of concatenated mitochondrial data,Potos was resolved as the sister lineage to the Bassariscusplus Procyon clade, but this relationship had <50% bootstrapsupport (results not shown). Otherwise, topology of the MPtree from the mitochondrial data was congruent with thatbased on the concatenated nuclear data. Relationshipsamong procyonids received 100% bootstrap support by allthree methods of analysis for the concatenated nuclear data(Fig. 2B). All but two nodes also had high bootstrap supportin most analyses of the concatenated mitochondrial data,although MP bootstrap values tended to be lower than val-ues from ML and ME (Fig. 2A). There were no signiWcantlyconXicting nodes between the concatenated mitochondrialand nuclear gene partitions, using a value of 770% as thecriterion for signiWcant bootstrap conXict/support (e.g., Hillisand Bull, 1993; Flynn and Nedbal, 1998). Therefore, we com-bined these partitions into a single supermatrix.
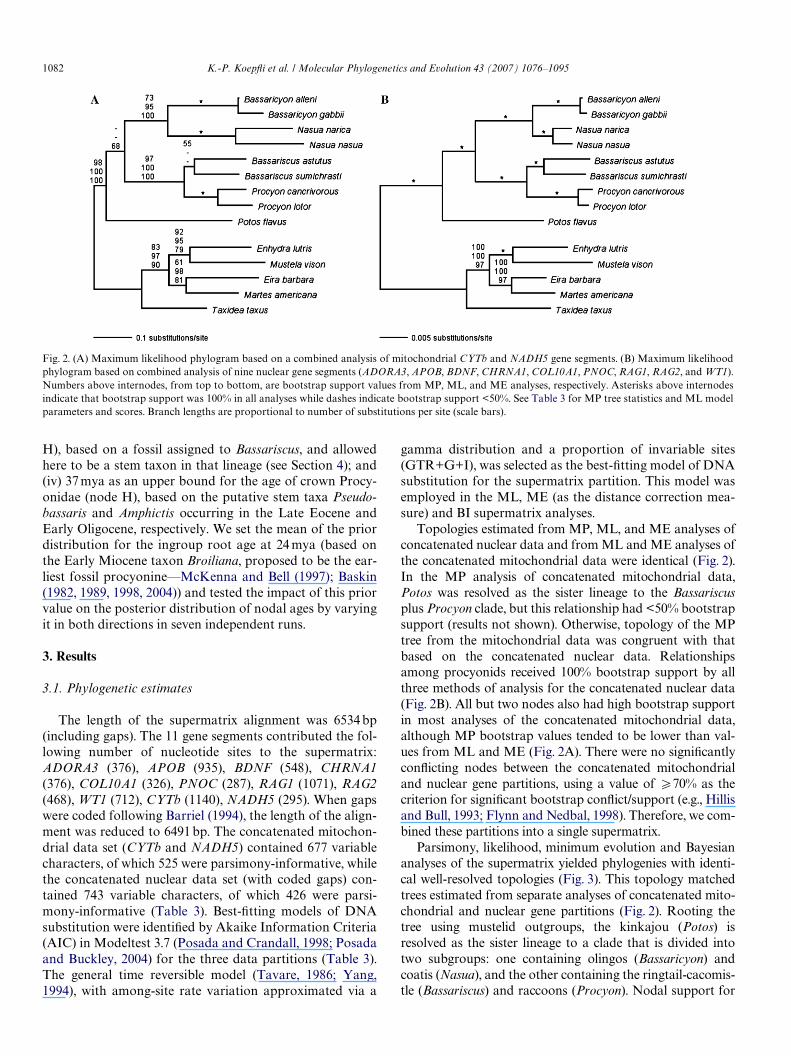
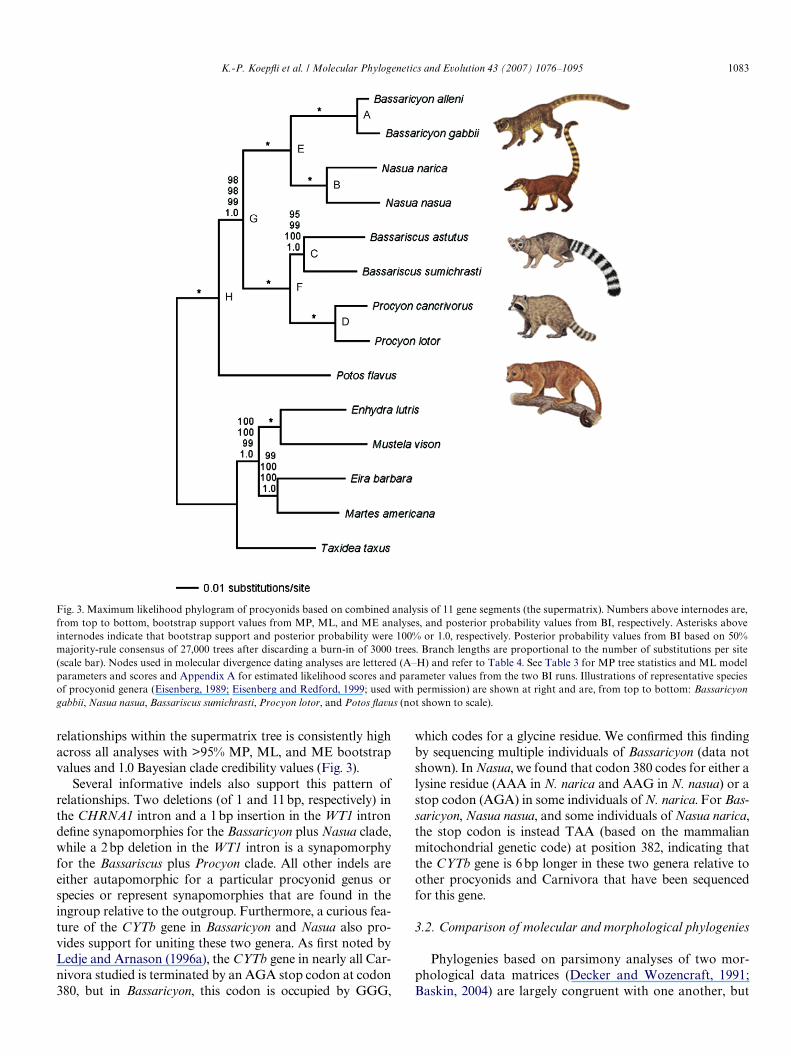
Parsimony, likelihood, minimum evolution and Bayesiananalyses of the supermatrix yielded phylogenies with identi-cal well-resolved topologies (Fig. 3). This topology matchedtrees estimated from separate analyses of concatenated mito-chondrial and nuclear gene partitions (Fig. 2). Rooting thetree using mustelid outgroups, the kinkajou (Potos) isresolved as the sister lineage to a clade that is divided intotwo subgroups: one containing olingos (Bassaricyon) andcoatis (Nasua), and the other containing the ringtail-cacomis-tle (Bassariscus) and raccoons (Procyon). Nodal support for
Fig. 2. (A) Maximum likelihood phylogram based on a combined analysis of mitochondrial CYTb and NADH5 gene segments. (B) Maximum likelihoodphylogram based on combined analysis of nine nuclear gene segments (ADORA3, APOB, BDNF, CHRNA1, COL10A1, PNOC, RAG1, RAG2, and WT1).Numbers above internodes, from top to bottom, are bootstrap support values from MP, ML, and ME analyses, respectively. Asterisks above internodesindicate that bootstrap support was 100% in all analyses while dashes indicate bootstrap support <50%. See Table 3 for MP tree statistics and ML modelparameters and scores. Branch lengths are proportional to number of substitutions per site (scale bars).
K.-P. KoepXi et al. / Molecular Phylogenetics and Evolution 43 (2007) 1076–1095 1083
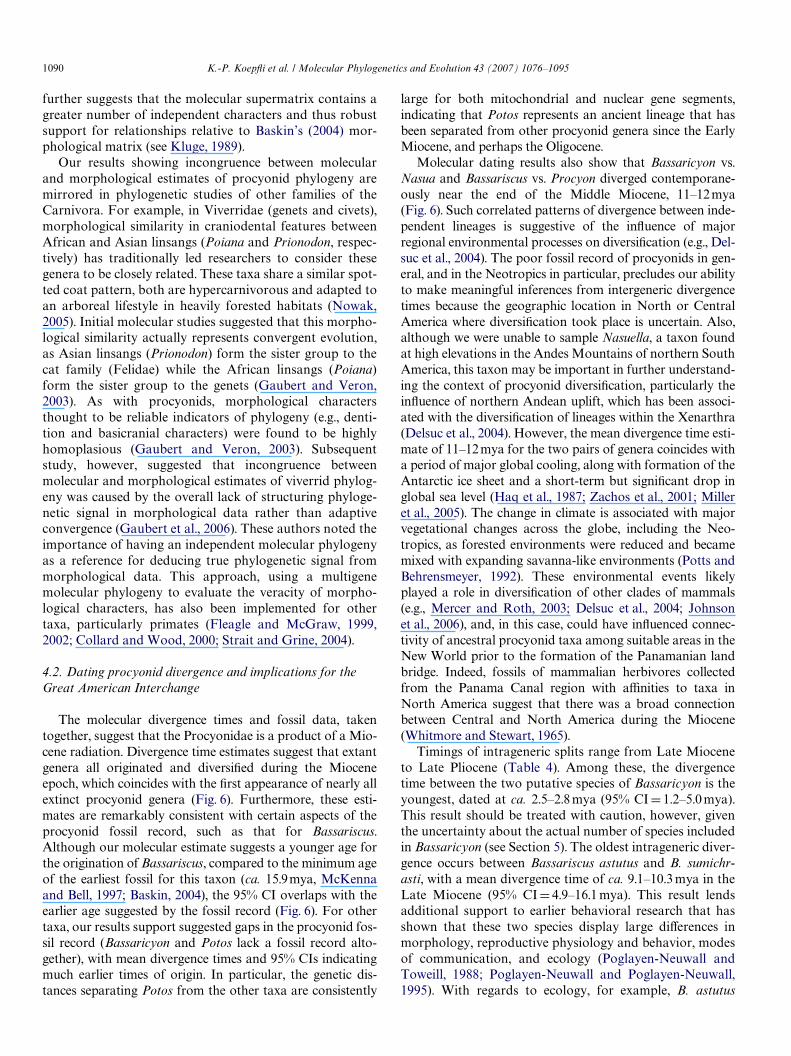
relationships within the supermatrix tree is consistently highacross all analyses with >95% MP, ML, and ME bootstrapvalues and 1.0 Bayesian clade credibility values (Fig. 3).
Several informative indels also support this pattern ofrelationships. Two deletions (of 1 and 11 bp, respectively) inthe CHRNA1 intron and a 1 bp insertion in the WT1 introndeWne synapomorphies for the Bassaricyon plus Nasua clade,while a 2 bp deletion in the WT1 intron is a synapomorphyfor the Bassariscus plus Procyon clade. All other indels areeither autapomorphic for a particular procyonid genus orspecies or represent synapomorphies that are found in theingroup relative to the outgroup. Furthermore, a curious fea-ture of the CYTb gene in Bassaricyon and Nasua also pro-vides support for uniting these two genera. As Wrst noted byLedje and Arnason (1996a), the CYTb gene in nearly all Car-nivora studied is terminated by an AGA stop codon at codon380, but in Bassaricyon, this codon is occupied by GGG,
which codes for a glycine residue. We conWrmed this Wndingby sequencing multiple individuals of Bassaricyon (data notshown). In Nasua, we found that codon 380 codes for either alysine residue (AAA in N. narica and AAG in N. nasua) or astop codon (AGA) in some individuals of N. narica. For Bas-saricyon, Nasua nasua, and some individuals of Nasua narica,the stop codon is instead TAA (based on the mammalianmitochondrial genetic code) at position 382, indicating thatthe CYTb gene is 6 bp longer in these two genera relative toother procyonids and Carnivora that have been sequencedfor this gene.
3.2. Comparison of molecular and morphological phylogenies
Phylogenies based on parsimony analyses of two mor-phological data matrices (Decker and Wozencraft, 1991;Baskin, 2004) are largely congruent with one another, but
Fig. 3. Maximum likelihood phylogram of procyonids based on combined analysis of 11 gene segments (the supermatrix). Numbers above internodes are,from top to bottom, bootstrap support values from MP, ML, and ME analyses, and posterior probability values from BI, respectively. Asterisks aboveinternodes indicate that bootstrap support and posterior probability were 100% or 1.0, respectively. Posterior probability values from BI based on 50%majority-rule consensus of 27,000 trees after discarding a burn-in of 3000 trees. Branch lengths are proportional to the number of substitutions per site(scale bar). Nodes used in molecular divergence dating analyses are lettered (A–H) and refer to Table 4. See Table 3 for MP tree statistics and ML modelparameters and scores and Appendix A for estimated likelihood scores and parameter values from the two BI runs. Illustrations of representative speciesof procyonid genera (Eisenberg, 1989; Eisenberg and Redford, 1999; used with permission) are shown at right and are, from top to bottom: Bassaricyongabbii, Nasua nasua, Bassariscus sumichrasti, Procyon lotor, and Potos Xavus (not shown to scale).
1084 K.-P. KoepXi et al. / Molecular Phylogenetics and Evolution 43 (2007) 1076–1095
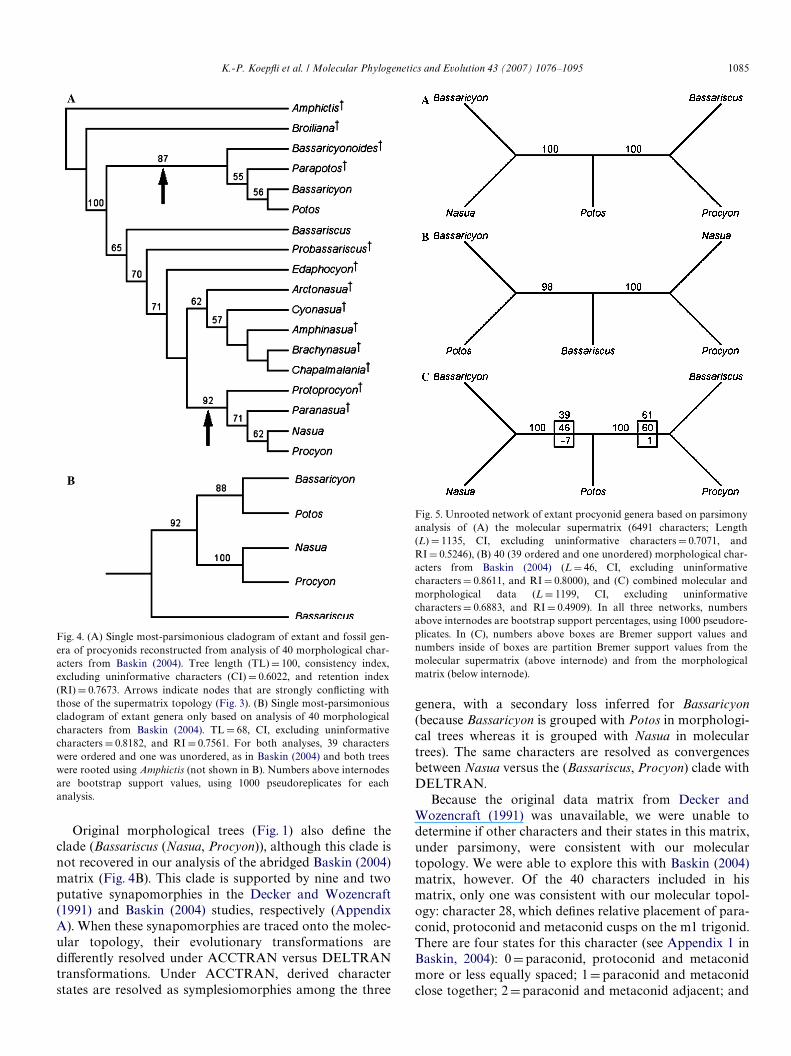
are highly incongruent with phylogenies derived from threemolecular data partitions (compare Fig. 1 with Figs. 2 and3). In both morphological trees, Nasua is sister to Procyonand Bassaricyon is sister to Potos. Bassariscus is resolved assister to the ((Nasua, Nasuella) Procyon) clade in theDecker and Wozencraft (1991) tree and in the originalBaskin (2004) tree that includes both fossil and extant taxa.Bootstrap analysis of the MP tree using the unabridgedBaskin (2004) matrix reveals that clades containingBassaricyon + Potos and Nasua + Procyon are strongly sup-ported (87 and 92% bootstrap values, respectively, Fig. 4A).However, sister-group relationships of these genera withrespect to fossil genera within each clade are only weaklysupported (Fig. 4A). In the analysis of the abridged Baskin(2004) matrix, Bassariscus is resolved as the sister lineage tothe (Bassaricyon, Potos) and (Nasua, Procyon) clades(Fig. 4B). Thus, for the abridged matrix, placement of Bass-ariscus (and character states that deWne this taxon) is sensi-tive to whether fossil taxa are included (Baskin, 2004;Fig. 4A) or excluded (present study, Fig. 4B). Nonetheless,bootstrap support values for nodes from the abridgedBaskin (2004) matrix are all relatively high, with 88 and100% for the (Bassaricyon, Potos) clade and (Nasua, Pro-cyon) clades, respectively (Fig. 4B).
Unrooted parsimony analyses, with taxon samplingrestricted to representatives of Wve extant genera, alsoresulted in highly incongruent topologies between themolecular supermatrix and morphological matrix fromBaskin (2004) (Figs. 5A and B). Discordance betweenunrooted networks was signiWcant, with nearly 100% MPbootstrap support for completely diVerent relationships.
For example, while the molecular supermatrix joinedNasua with Bassaricyon with 100% bootstrap support, theBaskin (2004) matrix joined Nasua with Procyon, alsowith 100% bootstrap support. When we combined the twodata sets into a single matrix, the unrooted parsimonynetwork topology was identical to the one recovered byanalysis of the supermatrix alone, also with high boot-strap support (Fig. 5C). Bremer support values for thetwo internal nodes were high (Fig. 5C). PBS analysisshowed that the supermatrix contributed a substantialvalue to the total Bremer support at the two nodes, whilethe morphological matrix contributed either high nega-tive support (Bassaricyon, Nasua) or minimal positivesupport (Bassariscus, Procyon). The combined unrootedanalysis suggests that phylogenetic signal derived frommorphological data either conXicts with or provides littlesupport for relationships based upon the molecularsupermatrix.
Putative synapomorphies that deWne the (Bassaricyon,Potos) and (Nasua, Procyon) clades in the two morphologi-cal studies are all resolved as convergences (homoplasies)when they are traced onto the molecular topology usingMacClade 4.0 (Maddison et al., 2000) with both accelerated(ACCTRAN) and delayed (DELTRAN) transformation(Appendix A). The (Bassaricyon, Potos) clade is supportedby nine and four putative synapomorphies in Decker andWozencraft (1991) and Baskin (2004), respectively (Appen-dix A). The (Nasua, Procyon) clade is supported by Wve syn-apomorphies in Decker and Wozencraft (1991) (which alsoincludes Nasuella as part of this clade) and 10 synapomor-phies in Baskin (2004).
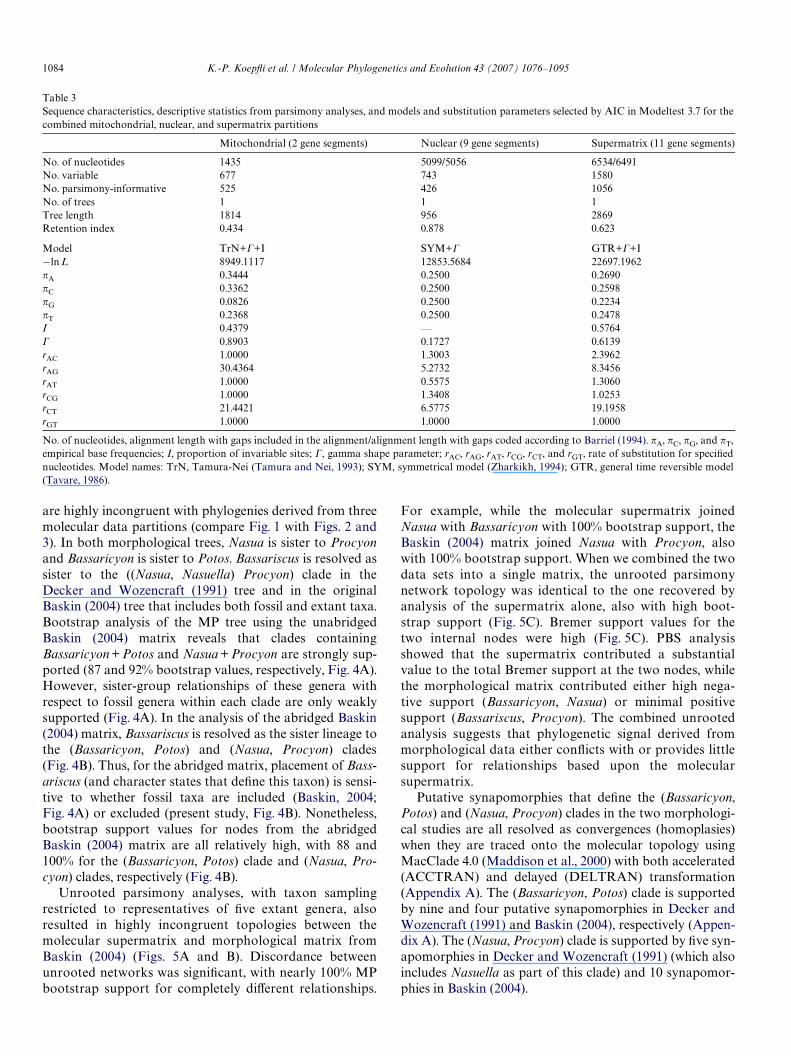
Table 3Sequence characteristics, descriptive statistics from parsimony analyses, and models and substitution parameters selected by AIC in Modeltest 3.7 for thecombined mitochondrial, nuclear, and supermatrix partitions
No. of nucleotides, alignment length with gaps included in the alignment/alignment length with gaps coded according to Barriel (1994). �A, �C, �G, and �T,empirical base frequencies; I, proportion of invariable sites; �, gamma shape parameter; rAC, rAG, rAT, rCG, rCT, and rGT, rate of substitution for speciWednucleotides. Model names: TrN, Tamura-Nei (Tamura and Nei, 1993); SYM, symmetrical model (Zharkikh, 1994); GTR, general time reversible model(Tavare, 1986).
Mitochondrial (2 gene segments) Nuclear (9 gene segments) Supermatrix (11 gene segments)
No. of nucleotides 1435 5099/5056 6534/6491No. variable 677 743 1580No. parsimony-informative 525 426 1056No. of trees 1 1 1Tree length 1814 956 2869Retention index 0.434 0.878 0.623
Model TrN+�+I SYM+� GTR+�+I¡ln L 8949.1117 12853.5684 22697.1962�A 0.3444 0.2500 0.2690�C 0.3362 0.2500 0.2598�G 0.0826 0.2500 0.2234�T 0.2368 0.2500 0.2478I 0.4379 — 0.5764� 0.8903 0.1727 0.6139rAC 1.0000 1.3003 2.3962rAG 30.4364 5.2732 8.3456rAT 1.0000 0.5575 1.3060rCG 1.0000 1.3408 1.0253rCT 21.4421 6.5775 19.1958rGT 1.0000 1.0000 1.0000
K.-P. KoepXi et al. / Molecular Phylogenetics and Evolution 43 (2007) 1076–1095 1085
Original morphological trees (Fig. 1) also deWne theclade (Bassariscus (Nasua, Procyon)), although this clade isnot recovered in our analysis of the abridged Baskin (2004)matrix (Fig. 4B). This clade is supported by nine and twoputative synapomorphies in the Decker and Wozencraft(1991) and Baskin (2004) studies, respectively (AppendixA). When these synapomorphies are traced onto the molec-ular topology, their evolutionary transformations arediVerently resolved under ACCTRAN versus DELTRANtransformations. Under ACCTRAN, derived characterstates are resolved as symplesiomorphies among the three
Fig. 4. (A) Single most-parsimonious cladogram of extant and fossil gen-era of procyonids reconstructed from analysis of 40 morphological char-acters from Baskin (2004). Tree length (TL)D 100, consistency index,excluding uninformative characters (CI) D 0.6022, and retention index(RI) D 0.7673. Arrows indicate nodes that are strongly conXicting withthose of the supermatrix topology (Fig. 3). (B) Single most-parsimoniouscladogram of extant genera only based on analysis of 40 morphologicalcharacters from Baskin (2004). TL D 68, CI, excluding uninformativecharacters D 0.8182, and RI D 0.7561. For both analyses, 39 characterswere ordered and one was unordered, as in Baskin (2004) and both treeswere rooted using Amphictis (not shown in B). Numbers above internodesare bootstrap support values, using 1000 pseudoreplicates for eachanalysis.
genera, with a secondary loss inferred for Bassaricyon(because Bassaricyon is grouped with Potos in morphologi-cal trees whereas it is grouped with Nasua in moleculartrees). The same characters are resolved as convergencesbetween Nasua versus the (Bassariscus, Procyon) clade withDELTRAN.
Because the original data matrix from Decker andWozencraft (1991) was unavailable, we were unable todetermine if other characters and their states in this matrix,under parsimony, were consistent with our moleculartopology. We were able to explore this with Baskin (2004)matrix, however. Of the 40 characters included in hismatrix, only one was consistent with our molecular topol-ogy: character 28, which deWnes relative placement of para-conid, protoconid and metaconid cusps on the m1 trigonid.There are four states for this character (see Appendix 1 inBaskin, 2004): 0Dparaconid, protoconid and metaconidmore or less equally spaced; 1Dparaconid and metaconidclose together; 2Dparaconid and metaconid adjacent; and
Fig. 5. Unrooted network of extant procyonid genera based on parsimonyanalysis of (A) the molecular supermatrix (6491 characters; Length(L) D 1135, CI, excluding uninformative characters D 0.7071, andRI D 0.5246), (B) 40 (39 ordered and one unordered) morphological char-acters from Baskin (2004) (L D 46, CI, excluding uninformativecharacters D 0.8611, and RI D 0.8000), and (C) combined molecular andmorphological data (L D 1199, CI, excluding uninformativecharacters D 0.6883, and RI D 0.4909). In all three networks, numbersabove internodes are bootstrap support percentages, using 1000 pseudore-plicates. In (C), numbers above boxes are Bremer support values andnumbers inside of boxes are partition Bremer support values from themolecular supermatrix (above internode) and from the morphologicalmatrix (below internode).
1086 K.-P. KoepXi et al. / Molecular Phylogenetics and Evolution 43 (2007) 1076–1095
3Dparaconid blade-like, anteriorly placed. State 3 isinferred to be plesiomorphic, as this is the state coded forAmphictis (the outgroup). State 1 unites the (Bassariscus,Procyon) clade whereas state 2 unites the (Bassaricyon,Nasua) clade. However, character 28 is coded as a “?” forPotos, which renders interpretation of the state transforma-tions for this character equivocal for the other two clades inthe molecular tree.
3.3. Divergence time estimates
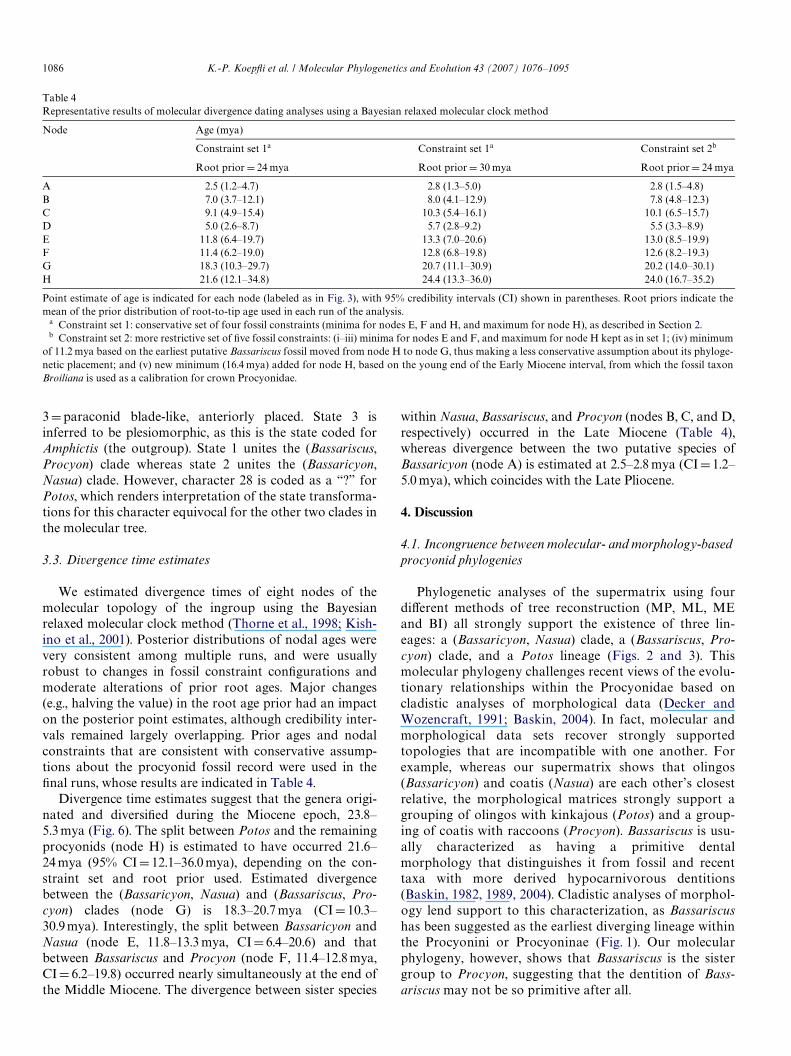
We estimated divergence times of eight nodes of themolecular topology of the ingroup using the Bayesianrelaxed molecular clock method (Thorne et al., 1998; Kish-ino et al., 2001). Posterior distributions of nodal ages werevery consistent among multiple runs, and were usuallyrobust to changes in fossil constraint conWgurations andmoderate alterations of prior root ages. Major changes(e.g., halving the value) in the root age prior had an impacton the posterior point estimates, although credibility inter-vals remained largely overlapping. Prior ages and nodalconstraints that are consistent with conservative assump-tions about the procyonid fossil record were used in theWnal runs, whose results are indicated in Table 4.
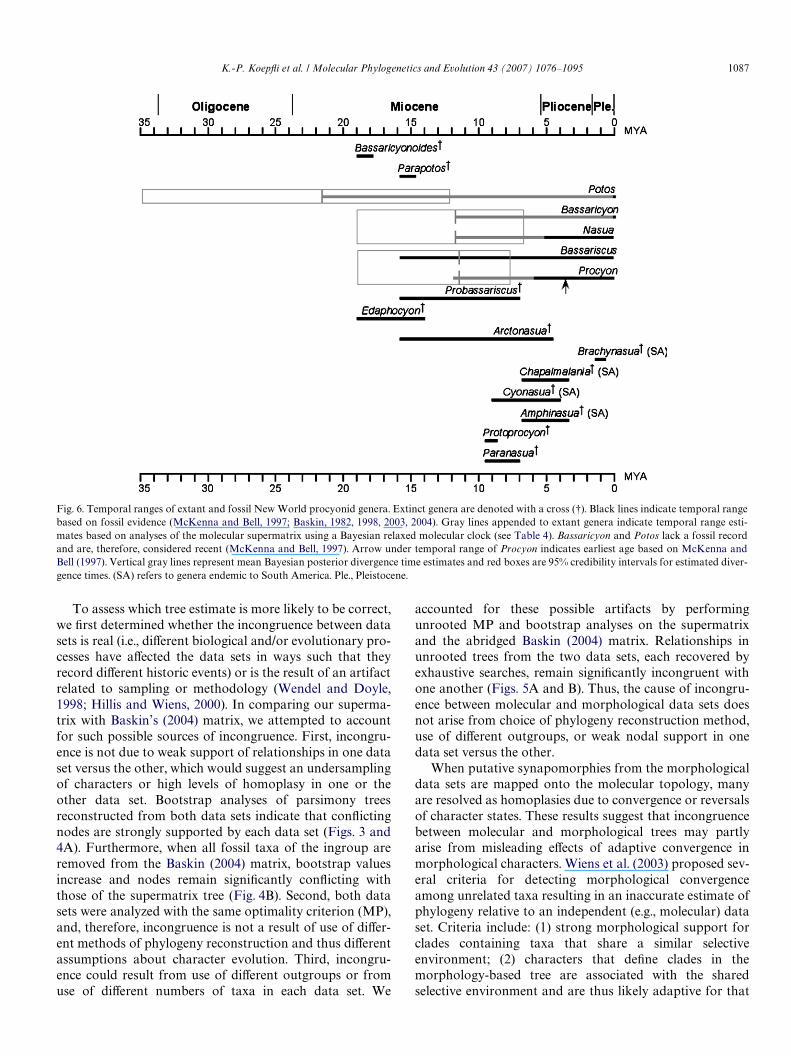
Divergence time estimates suggest that the genera origi-nated and diversiWed during the Miocene epoch, 23.8–5.3 mya (Fig. 6). The split between Potos and the remainingprocyonids (node H) is estimated to have occurred 21.6–24 mya (95% CID 12.1–36.0 mya), depending on the con-straint set and root prior used. Estimated divergencebetween the (Bassaricyon, Nasua) and (Bassariscus, Pro-cyon) clades (node G) is 18.3–20.7 mya (CID10.3–30.9 mya). Interestingly, the split between Bassaricyon andNasua (node E, 11.8–13.3 mya, CID6.4–20.6) and thatbetween Bassariscus and Procyon (node F, 11.4–12.8 mya,CID 6.2–19.8) occurred nearly simultaneously at the end ofthe Middle Miocene. The divergence between sister species
within Nasua, Bassariscus, and Procyon (nodes B, C, and D,respectively) occurred in the Late Miocene (Table 4),whereas divergence between the two putative species ofBassaricyon (node A) is estimated at 2.5–2.8 mya (CID1.2–5.0 mya), which coincides with the Late Pliocene.
4. Discussion
4.1. Incongruence between molecular- and morphology-based procyonid phylogenies
Phylogenetic analyses of the supermatrix using fourdiVerent methods of tree reconstruction (MP, ML, MEand BI) all strongly support the existence of three lin-eages: a (Bassaricyon, Nasua) clade, a (Bassariscus, Pro-cyon) clade, and a Potos lineage (Figs. 2 and 3). Thismolecular phylogeny challenges recent views of the evolu-tionary relationships within the Procyonidae based oncladistic analyses of morphological data (Decker andWozencraft, 1991; Baskin, 2004). In fact, molecular andmorphological data sets recover strongly supportedtopologies that are incompatible with one another. Forexample, whereas our supermatrix shows that olingos(Bassaricyon) and coatis (Nasua) are each other’s closestrelative, the morphological matrices strongly support agrouping of olingos with kinkajous (Potos) and a group-ing of coatis with raccoons (Procyon). Bassariscus is usu-ally characterized as having a primitive dentalmorphology that distinguishes it from fossil and recenttaxa with more derived hypocarnivorous dentitions(Baskin, 1982, 1989, 2004). Cladistic analyses of morphol-ogy lend support to this characterization, as Bassariscushas been suggested as the earliest diverging lineage withinthe Procyonini or Procyoninae (Fig. 1). Our molecularphylogeny, however, shows that Bassariscus is the sistergroup to Procyon, suggesting that the dentition of Bass-ariscus may not be so primitive after all.
Table 4Representative results of molecular divergence dating analyses using a Bayesian relaxed molecular clock method
Point estimate of age is indicated for each node (labeled as in Fig. 3), with 95% credibility intervals (CI) shown in parentheses. Root priors indicate themean of the prior distribution of root-to-tip age used in each run of the analysis.
a Constraint set 1: conservative set of four fossil constraints (minima for nodes E, F and H, and maximum for node H), as described in Section 2.b Constraint set 2: more restrictive set of Wve fossil constraints: (i–iii) minima for nodes E and F, and maximum for node H kept as in set 1; (iv) minimum
of 11.2 mya based on the earliest putative Bassariscus fossil moved from node H to node G, thus making a less conservative assumption about its phyloge-netic placement; and (v) new minimum (16.4 mya) added for node H, based on the young end of the Early Miocene interval, from which the fossil taxonBroiliana is used as a calibration for crown Procyonidae.
Node Age (mya)
Constraint set 1a Constraint set 1a Constraint set 2b
Root prior D 24 mya Root prior D 30 mya Root prior D 24 mya
A 2.5 (1.2–4.7) 2.8 (1.3–5.0) 2.8 (1.5–4.8)B 7.0 (3.7–12.1) 8.0 (4.1–12.9) 7.8 (4.8–12.3)C 9.1 (4.9–15.4) 10.3 (5.4–16.1) 10.1 (6.5–15.7)D 5.0 (2.6–8.7) 5.7 (2.8–9.2) 5.5 (3.3–8.9)E 11.8 (6.4–19.7) 13.3 (7.0–20.6) 13.0 (8.5–19.9)F 11.4 (6.2–19.0) 12.8 (6.8–19.8) 12.6 (8.2–19.3)G 18.3 (10.3–29.7) 20.7 (11.1–30.9) 20.2 (14.0–30.1)H 21.6 (12.1–34.8) 24.4 (13.3–36.0) 24.0 (16.7–35.2)
K.-P. KoepXi et al. / Molecular Phylogenetics and Evolution 43 (2007) 1076–1095 1087
To assess which tree estimate is more likely to be correct,we Wrst determined whether the incongruence between datasets is real (i.e., diVerent biological and/or evolutionary pro-cesses have aVected the data sets in ways such that theyrecord diVerent historic events) or is the result of an artifactrelated to sampling or methodology (Wendel and Doyle,1998; Hillis and Wiens, 2000). In comparing our superma-trix with Baskin’s (2004) matrix, we attempted to accountfor such possible sources of incongruence. First, incongru-ence is not due to weak support of relationships in one dataset versus the other, which would suggest an undersamplingof characters or high levels of homoplasy in one or theother data set. Bootstrap analyses of parsimony treesreconstructed from both data sets indicate that conXictingnodes are strongly supported by each data set (Figs. 3 and4A). Furthermore, when all fossil taxa of the ingroup areremoved from the Baskin (2004) matrix, bootstrap valuesincrease and nodes remain signiWcantly conXicting withthose of the supermatrix tree (Fig. 4B). Second, both datasets were analyzed with the same optimality criterion (MP),and, therefore, incongruence is not a result of use of diVer-ent methods of phylogeny reconstruction and thus diVerentassumptions about character evolution. Third, incongru-ence could result from use of diVerent outgroups or fromuse of diVerent numbers of taxa in each data set. We
accounted for these possible artifacts by performingunrooted MP and bootstrap analyses on the supermatrixand the abridged Baskin (2004) matrix. Relationships inunrooted trees from the two data sets, each recovered byexhaustive searches, remain signiWcantly incongruent withone another (Figs. 5A and B). Thus, the cause of incongru-ence between molecular and morphological data sets doesnot arise from choice of phylogeny reconstruction method,use of diVerent outgroups, or weak nodal support in onedata set versus the other.
When putative synapomorphies from the morphologicaldata sets are mapped onto the molecular topology, manyare resolved as homoplasies due to convergence or reversalsof character states. These results suggest that incongruencebetween molecular and morphological trees may partlyarise from misleading eVects of adaptive convergence inmorphological characters. Wiens et al. (2003) proposed sev-eral criteria for detecting morphological convergenceamong unrelated taxa resulting in an inaccurate estimate ofphylogeny relative to an independent (e.g., molecular) dataset. Criteria include: (1) strong morphological support forclades containing taxa that share a similar selectiveenvironment; (2) characters that deWne clades in themorphology-based tree are associated with the sharedselective environment and are thus likely adaptive for that
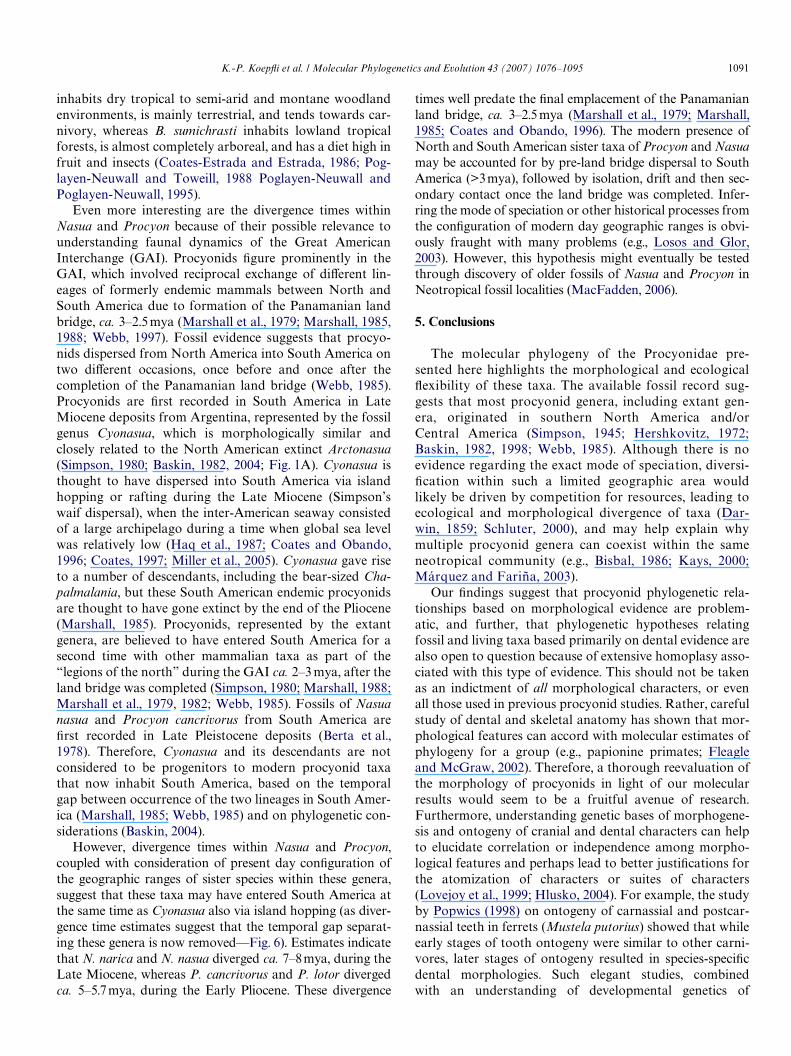
Fig. 6. Temporal ranges of extant and fossil New World procyonid genera. Extinct genera are denoted with a cross (9). Black lines indicate temporal rangebased on fossil evidence (McKenna and Bell, 1997; Baskin, 1982, 1998, 2003, 2004). Gray lines appended to extant genera indicate temporal range esti-mates based on analyses of the molecular supermatrix using a Bayesian relaxed molecular clock (see Table 4). Bassaricyon and Potos lack a fossil recordand are, therefore, considered recent (McKenna and Bell, 1997). Arrow under temporal range of Procyon indicates earliest age based on McKenna andBell (1997). Vertical gray lines represent mean Bayesian posterior divergence time estimates and red boxes are 95% credibility intervals for estimated diver-gence times. (SA) refers to genera endemic to South America. Ple., Pleistocene.
1088 K.-P. KoepXi et al. / Molecular Phylogenetics and Evolution 43 (2007) 1076–1095
environment; and (3) a molecular topology based on a mul-tilocus data set shows that species with similar selectiveenvironments are not monophyletic. Importantly in thiscontext, the multilocus component of the molecular dataset would support the notion that included segments arenot subject to identical selective pressures, as they partici-pate in a variety of cellular and metabolic processesassumed to be unrelated.
Our results are consistent with an interpretation thatecological adaptation to similar habitats and diets in unre-lated taxa has confounded cladistic analyses of cranial, den-tal and postcranial characters in the Procyonidae. Forexample, kinkajous and olingos are both arboreal frugi-vores and share many ecological and behavioral traits(Ford and HoVmann, 1988; Kays, 1999, 2000). Adaptationsto arboreality include a short rostrum and forwardlydirected orbits for stereoscopic vision, short limbs withsharply curved claws, furred soles, and a long tail (prehen-sile in the kinkajou). Adaptations to frugivory in both taxainclude bunodont dentition with a reduced number ofcusps on molars and greater development of masticatorymusculature in the mediolateral plane compared to the sag-ittal plane (Story, 1951; Decker and Wozencraft, 1991).Indeed, a reduced number of molar cusps is one characterstate that unites Bassaricyon + Potos in the Decker andWozencraft (1991) phylogeny and the dental charactersuniting these same taxa in Baskin (2004) reXect bunodonty.Ecological similarities between coatis and raccoons mayhave also resulted in convergent or parallel evolution ofmorphology in these taxa. Both genera are omnivorous,with highly tuberculate molars and longer rostra relative tokinkajous and olingos. Both coatis and raccoons inhabitforested habitats, forage on the ground and in the trees, andare good climbers and use their forepaws to manipulateprey (Lotze and Anderson, 1979; Gompper, 1995; Gomp-per and Decker, 1998). As with kinkajous and olingos,putative cranial and dental synapomorphies that groupcoatis and raccoons (Decker and Wozencraft, 1991; Baskin,2004) are shown to be homoplasies when mapped onto themolecular phylogeny (under both ACCTRAN and DEL-TRAN transformation).
Arguments with regards to phylogenetically misleadingeVects of convergence assume, however, that morphologicalcharacters used in procyonid phylogeny reconstruction areactually adaptive for a particular habitat or lifestyle (crite-rion 2 in Wiens et al., 2003). This is diYcult to demonstratein general, but especially so for characters that have beenestablished through the atomization of a trait for phyloge-netic purposes. The dental characters in the Baskin (2004)matrix may indeed reXect adaptation to diVering dietsamong procyonid genera, as tooth morphology is stronglycorrelated with diet in many mammals, including the Car-nivora (e.g., Van Valkenburgh and KoepXi, 1993; Frisciaet al., in press). Moreover, high bootstrap support for con-Xicting nodes in the Baskin (2004) tree do unite taxa thattend to share a similar diet, for example Bassaricyon andPotos (criterion 1 in Wiens et al., 2003), suggesting that the
source of incongruence between the supermatrix phylogenyand the Baskin (2004) phylogeny is not due to randomlydistributed phylogenetic signal in the Baskin (2004) matrix(Wenzel and Siddall, 1999; Wiens et al., 2003; Gaubertet al., 2006). This is also conWrmed by the high CI and RIvalues of the unabridged and abridged analyses of theBaskin (2004) matrix (Fig. 4).
The adaptive value of some putative synapomorphiesfound in Decker and Wozencraft (1991) is somewhat morediYcult to evaluate because they include cranial, dental,postcranial and soft anatomical characters. Nine charactersunite Bassaricyon + Potos, and while some may be associ-ated with adaptation to arboreality (e.g., sharply angledacromion process) and a particular diet (<3 cusps onmolars), the functional signiWcance is not clear for others(e.g., short and rounded external pinnae and short andstout malleus). Similarly, nine characters uniteBassariscus + Nasua + Nasuella + Procyon into the “Procy-oninae” in the Decker and Wozencraft (1991) phylogeny(Fig. 1B). These are resolved as plesiomorphies or homo-plasies depending on the method of character state optimi-zation used. Three are dental characters, four are cranial,one is postcranial, and one is a soft anatomical character(presence of banded tail rings). Such coat patterns, how-ever, although less distinct, are present in Bassaricyon(Nowak, 2005), suggesting that this character is plesiomor-phic for all taxa except Potos. Nonetheless, comparativeanalyses suggest that tail rings, coupled with tail movement,may function in communication and thus be adaptive forspecies inhabiting forest habitats (Ortolani, 1999). Deter-mining the adaptive value, if any, of the characters thatdeWne the “Procyoninae” is made more diYcult by the factthat Bassariscus, Nasua and Procyon inhabit a diversity ofenvironments and have extremely varied diets across theirranges.
Phylogenetically misleading eVects of convergence may beexacerbated if morphological characters are not independent,especially if characters are developmentally, genetically, and/or functionally correlated (Felsenstein, 1988; ShaVer et al.,1991; Emerson and Hastings, 1998; Wiens et al., 2003). Non-independence of characters may apply to the Baskin (2004)data set in particular. Thirty of the 40 characters (75%) in theBaskin (2004) data matrix are dental characters, and 25 ofthese characters are based on just four teeth (P4, M1, m1,and m2) that have been atomized into four (m2), six (P4, m1)and nine (M1) separate characters. Moreover, in severalcases, a particular dental character is subdivided into twoseparate characters (e.g., characters 24 and 25 deal with thepresence or absence and the position, if present, of the M1metaconule, respectively; Baskin, 2004). While such atomiza-tion of dental morphology increases the power of cladisticanalyses (more charactersDpotentially more resolvingpower), such a strategy is problematic because empiricalstudies demonstrate that teeth are developmentally and func-tionally integrated structures (e.g., Gingerich and Winkler,1979; Polly, 1998; Jernvall and Jung, 2000). For example,Kangas et al. (2004) have shown that small modiWcations in
K.-P. KoepXi et al. / Molecular Phylogenetics and Evolution 43 (2007) 1076–1095 1089
the expression of a single gene in the enamel knot of develop-ing mouse teeth can result in correlated state changes formultiple dental characters (number of teeth as well as cuspshape and position). Furthermore, cusp number and shapehave been shown to be tightly integrated through a shareddevelopmental genetic program (Jernvall et al., 2000; Jernvalland Jung, 2000). Individual molar cusps develop iterativelyfrom secondary enamel knots through activation of the sameset of genes (Jernvall et al., 2000), which can be deactivatedand reactivated, causing character states to appear and dis-appear over evolutionary time (Jernvall and Jung, 2000).Moreover, this shared developmental information is likelypropagated through both upper and lower jaws, thereby fur-ther limiting the independence of serially homologous struc-tures such as teeth (e.g., Van Valen, 1994). Such pleiotropiceVects on tooth morphology challenge the method of atomiz-ing a tooth into separate characters and assuming that theyare independently heritable and acted upon separately bynatural selection.
An example of potentially correlated (and thus non-independent) characters in the Baskin (2004) matrix are thefour characters that unite Bassaricyon + Potos: two fromthe P4 (absence of the metacone blade and presence of theparastyle) and two from the m1 molar: (a very reduced orabsent paraconid and an unbasined talonid). Not only areindividual cusps of these two teeth likely to be developmen-tally correlated (where no single gene codes for each indi-vidual cusp; Jernvall and Jung, 2000), but these two teethand their associated cusps form a functionally correlatedcomplex, the carnassial. Changes to one P4 cusp will proba-bly result in a concomitant evolutionary change in mor-phology of the m1, to maintain functional occlusionbetween the two teeth and eYcient food processing capabil-ity. Such atomization of non-independent characters hasthe potential to inXate homoplasy and result in incorrectyet well-supported phylogenies, especially if selection actson an entire trait such as a molar.
Although nucleotide sites can also be aVected by non-independence, particularly within genes (e.g., Cummingset al., 1995), our supermatrix topology is supported by
multiple lines of independent evidence. First, the superma-trix topology is recovered in separate phylogenetic analy-ses of concatenated nuclear and mitochondrial sequencedata (Fig. 2). Because loci are derived from diVerent geno-mic compartments (nuclear versus mitochondrial) and thenuclear gene segments are derived from unlinked genesand, therefore, represent markers with presumably inde-pendent evolutionary histories, these results indicate thatthe gene trees derived from our sampled loci are tracingthe same evolutionary history. Moreover, patterns of rela-tionship are not due to phylogenetic signal arising fromrelatively few loci. For example, separate analyses of the11 gene segments using MP and ME with bootstrappingshows that the (Bassaricyon, Nasua) and (Bassariscus,Procyon) clades are recovered by 10 and 9 of the gene seg-ments, respectively, with high bootstrap support (Table5). It is unlikely that all segments would be biased bynatural selection in an identical or correlated fashion, asthey participate in a variety of unrelated cellular andmolecular processes.
Second, the (Bassaricyon, Nasua) and (Bassariscus, Pro-cyon) clades are each supported by informative indels andthe (Bassaricyon, Nasua) clade is further supported by shar-ing a CYTb gene structure that is two codons longer than inother procyonid taxa. Third, the Wnding that Procyon andBassariscus are sister taxa is supported by immunologicaldistance analyses (Sarich, 1973) and aYnity of Bassaricyonand Nasua is supported by shared inversions on chromo-somes 2 and 6 in these taxa (Couturier and Dutrillaux,1986). Fourth, statistical tests (Kishino and Hasegawa,1989) based on ML using PAUP¤ strongly favor the molec-ular topology of procyonid genera over the morphology-based topologies (¡lnL molecular topologyD22697.196versus ¡ln L morphological topologiesD 22990.308; diVer-ence in ¡ln LD293.112, P < 0.05). Finally, even when themolecular supermatrix plus 40 morphological charactersfrom Baskin (2004) are analyzed simultaneously, theunrooted network topology is identical to the one derivedfrom analysis of the supermatrix alone (Fig. 5C), with highpositive PBS values contributed by the supermatrix. This
Table 5Bootstrap values derived from separate maximum parsimony (MP) and minimum evolution (ME) analyses of the 11 gene segments for three procyonidclades
a In the ME analysis of RAG1, Potos was joined as the sister taxon to the (Bassariscus, Procyon) clade with a bootstrap value of 68%.
(Bassaricyon, Nasua) (Bassariscus, Procyon) ((Bassaricyon, Nasua) (Bassariscus, Procyon))
MP ME MP ME MP ME
ADORA3 87 75 88 90 98 99APOB 72 87 91 88 90 92BDNF 91 94 65 65 <50 <50CHRNA1 100 99 87 78 69 55COL10A1 96 94 70 75 83 79PNOC 89 90 82 85 55 56RAG1 99 99 97 98 <50 —a
RAG2 97 98 84 66 62 61WT1 99 96 100 100 93 97CYTb 69 99 99 100 <50 54NADH5 <50 59 <50 <50 <50 <50
1090 K.-P. KoepXi et al. / Molecular Phylogenetics and Evolution 43 (2007) 1076–1095
further suggests that the molecular supermatrix contains agreater number of independent characters and thus robustsupport for relationships relative to Baskin’s (2004) mor-phological matrix (see Kluge, 1989).
Our results showing incongruence between molecularand morphological estimates of procyonid phylogeny aremirrored in phylogenetic studies of other families of theCarnivora. For example, in Viverridae (genets and civets),morphological similarity in craniodental features betweenAfrican and Asian linsangs (Poiana and Prionodon, respec-tively) has traditionally led researchers to consider thesegenera to be closely related. These taxa share a similar spot-ted coat pattern, both are hypercarnivorous and adapted toan arboreal lifestyle in heavily forested habitats (Nowak,2005). Initial molecular studies suggested that this morpho-logical similarity actually represents convergent evolution,as Asian linsangs (Prionodon) form the sister group to thecat family (Felidae) while the African linsangs (Poiana)form the sister group to the genets (Gaubert and Veron,2003). As with procyonids, morphological charactersthought to be reliable indicators of phylogeny (e.g., denti-tion and basicranial characters) were found to be highlyhomoplasious (Gaubert and Veron, 2003). Subsequentstudy, however, suggested that incongruence betweenmolecular and morphological estimates of viverrid phylog-eny was caused by the overall lack of structuring phyloge-netic signal in morphological data rather than adaptiveconvergence (Gaubert et al., 2006). These authors noted theimportance of having an independent molecular phylogenyas a reference for deducing true phylogenetic signal frommorphological data. This approach, using a multigenemolecular phylogeny to evaluate the veracity of morpho-logical characters, has also been implemented for othertaxa, particularly primates (Fleagle and McGraw, 1999,2002; Collard and Wood, 2000; Strait and Grine, 2004).
4.2. Dating procyonid divergence and implications for the Great American Interchange
The molecular divergence times and fossil data, takentogether, suggest that the Procyonidae is a product of a Mio-cene radiation. Divergence time estimates suggest that extantgenera all originated and diversiWed during the Mioceneepoch, which coincides with the Wrst appearance of nearly allextinct procyonid genera (Fig. 6). Furthermore, these esti-mates are remarkably consistent with certain aspects of theprocyonid fossil record, such as that for Bassariscus.Although our molecular estimate suggests a younger age forthe origination of Bassariscus, compared to the minimum ageof the earliest fossil for this taxon (ca. 15.9mya, McKennaand Bell, 1997; Baskin, 2004), the 95% CI overlaps with theearlier age suggested by the fossil record (Fig. 6). For othertaxa, our results support suggested gaps in the procyonid fos-sil record (Bassaricyon and Potos lack a fossil record alto-gether), with mean divergence times and 95% CIs indicatingmuch earlier times of origin. In particular, the genetic dis-tances separating Potos from the other taxa are consistently
large for both mitochondrial and nuclear gene segments,indicating that Potos represents an ancient lineage that hasbeen separated from other procyonid genera since the EarlyMiocene, and perhaps the Oligocene.
Molecular dating results also show that Bassaricyon vs.Nasua and Bassariscus vs. Procyon diverged contemporane-ously near the end of the Middle Miocene, 11–12 mya(Fig. 6). Such correlated patterns of divergence between inde-pendent lineages is suggestive of the inXuence of majorregional environmental processes on diversiWcation (e.g., Del-suc et al., 2004). The poor fossil record of procyonids in gen-eral, and in the Neotropics in particular, precludes our abilityto make meaningful inferences from intergeneric divergencetimes because the geographic location in North or CentralAmerica where diversiWcation took place is uncertain. Also,although we were unable to sample Nasuella, a taxon foundat high elevations in the Andes Mountains of northern SouthAmerica, this taxon may be important in further understand-ing the context of procyonid diversiWcation, particularly theinXuence of northern Andean uplift, which has been associ-ated with the diversiWcation of lineages within the Xenarthra(Delsuc et al., 2004). However, the mean divergence time esti-mate of 11–12 mya for the two pairs of genera coincides witha period of major global cooling, along with formation of theAntarctic ice sheet and a short-term but signiWcant drop inglobal sea level (Haq et al., 1987; Zachos et al., 2001; Milleret al., 2005). The change in climate is associated with majorvegetational changes across the globe, including the Neo-tropics, as forested environments were reduced and becamemixed with expanding savanna-like environments (Potts andBehrensmeyer, 1992). These environmental events likelyplayed a role in diversiWcation of other clades of mammals(e.g., Mercer and Roth, 2003; Delsuc et al., 2004; Johnsonet al., 2006), and, in this case, could have inXuenced connec-tivity of ancestral procyonid taxa among suitable areas in theNew World prior to the formation of the Panamanian landbridge. Indeed, fossils of mammalian herbivores collectedfrom the Panama Canal region with aYnities to taxa inNorth America suggest that there was a broad connectionbetween Central and North America during the Miocene(Whitmore and Stewart, 1965).
Timings of intrageneric splits range from Late Mioceneto Late Pliocene (Table 4). Among these, the divergencetime between the two putative species of Bassaricyon is theyoungest, dated at ca. 2.5–2.8 mya (95% CID 1.2–5.0 mya).This result should be treated with caution, however, giventhe uncertainty about the actual number of species includedin Bassaricyon (see Section 5). The oldest intrageneric diver-gence occurs between Bassariscus astutus and B. sumichr-asti, with a mean divergence time of ca. 9.1–10.3 mya in theLate Miocene (95% CID 4.9–16.1 mya). This result lendsadditional support to earlier behavioral research that hasshown that these two species display large diVerences inmorphology, reproductive physiology and behavior, modesof communication, and ecology (Poglayen-Neuwall andToweill, 1988; Poglayen-Neuwall and Poglayen-Neuwall,1995). With regards to ecology, for example, B. astutus
K.-P. KoepXi et al. / Molecular Phylogenetics and Evolution 43 (2007) 1076–1095 1091
inhabits dry tropical to semi-arid and montane woodlandenvironments, is mainly terrestrial, and tends towards car-nivory, whereas B. sumichrasti inhabits lowland tropicalforests, is almost completely arboreal, and has a diet high infruit and insects (Coates-Estrada and Estrada, 1986; Pog-layen-Neuwall and Toweill, 1988 Poglayen-Neuwall andPoglayen-Neuwall, 1995).
Even more interesting are the divergence times withinNasua and Procyon because of their possible relevance tounderstanding faunal dynamics of the Great AmericanInterchange (GAI). Procyonids Wgure prominently in theGAI, which involved reciprocal exchange of diVerent lin-eages of formerly endemic mammals between North andSouth America due to formation of the Panamanian landbridge, ca. 3–2.5 mya (Marshall et al., 1979; Marshall, 1985,1988; Webb, 1997). Fossil evidence suggests that procyo-nids dispersed from North America into South America ontwo diVerent occasions, once before and once after thecompletion of the Panamanian land bridge (Webb, 1985).Procyonids are Wrst recorded in South America in LateMiocene deposits from Argentina, represented by the fossilgenus Cyonasua, which is morphologically similar andclosely related to the North American extinct Arctonasua(Simpson, 1980; Baskin, 1982, 2004; Fig. 1A). Cyonasua isthought to have dispersed into South America via islandhopping or rafting during the Late Miocene (Simpson’swaif dispersal), when the inter-American seaway consistedof a large archipelago during a time when global sea levelwas relatively low (Haq et al., 1987; Coates and Obando,1996; Coates, 1997; Miller et al., 2005). Cyonasua gave riseto a number of descendants, including the bear-sized Cha-palmalania, but these South American endemic procyonidsare thought to have gone extinct by the end of the Pliocene(Marshall, 1985). Procyonids, represented by the extantgenera, are believed to have entered South America for asecond time with other mammalian taxa as part of the“legions of the north” during the GAI ca. 2–3 mya, after theland bridge was completed (Simpson, 1980; Marshall, 1988;Marshall et al., 1979, 1982; Webb, 1985). Fossils of Nasuanasua and Procyon cancrivorus from South America areWrst recorded in Late Pleistocene deposits (Berta et al.,1978). Therefore, Cyonasua and its descendants are notconsidered to be progenitors to modern procyonid taxathat now inhabit South America, based on the temporalgap between occurrence of the two lineages in South Amer-ica (Marshall, 1985; Webb, 1985) and on phylogenetic con-siderations (Baskin, 2004).
However, divergence times within Nasua and Procyon,coupled with consideration of present day conWguration ofthe geographic ranges of sister species within these genera,suggest that these taxa may have entered South America atthe same time as Cyonasua also via island hopping (as diver-gence time estimates suggest that the temporal gap separat-ing these genera is now removed—Fig. 6). Estimates indicatethat N. narica and N. nasua diverged ca. 7–8mya, during theLate Miocene, whereas P. cancrivorus and P. lotor divergedca. 5–5.7 mya, during the Early Pliocene. These divergence
times well predate the Wnal emplacement of the Panamanianland bridge, ca. 3–2.5 mya (Marshall et al., 1979; Marshall,1985; Coates and Obando, 1996). The modern presence ofNorth and South American sister taxa of Procyon and Nasuamay be accounted for by pre-land bridge dispersal to SouthAmerica (>3mya), followed by isolation, drift and then sec-ondary contact once the land bridge was completed. Infer-ring the mode of speciation or other historical processes fromthe conWguration of modern day geographic ranges is obvi-ously fraught with many problems (e.g., Losos and Glor,2003). However, this hypothesis might eventually be testedthrough discovery of older fossils of Nasua and Procyon inNeotropical fossil localities (MacFadden, 2006).
5. Conclusions
The molecular phylogeny of the Procyonidae pre-sented here highlights the morphological and ecologicalXexibility of these taxa. The available fossil record sug-gests that most procyonid genera, including extant gen-era, originated in southern North America and/orCentral America (Simpson, 1945; Hershkovitz, 1972;Baskin, 1982, 1998; Webb, 1985). Although there is noevidence regarding the exact mode of speciation, diversi-Wcation within such a limited geographic area wouldlikely be driven by competition for resources, leading toecological and morphological divergence of taxa (Dar-win, 1859; Schluter, 2000), and may help explain whymultiple procyonid genera can coexist within the sameneotropical community (e.g., Bisbal, 1986; Kays, 2000;Márquez and Fariña, 2003).
Our Wndings suggest that procyonid phylogenetic rela-tionships based on morphological evidence are problem-atic, and further, that phylogenetic hypotheses relatingfossil and living taxa based primarily on dental evidence arealso open to question because of extensive homoplasy asso-ciated with this type of evidence. This should not be takenas an indictment of all morphological characters, or evenall those used in previous procyonid studies. Rather, carefulstudy of dental and skeletal anatomy has shown that mor-phological features can accord with molecular estimates ofphylogeny for a group (e.g., papionine primates; Fleagleand McGraw, 2002). Therefore, a thorough reevaluation ofthe morphology of procyonids in light of our molecularresults would seem to be a fruitful avenue of research.Furthermore, understanding genetic bases of morphogene-sis and ontogeny of cranial and dental characters can helpto elucidate correlation or independence among morpho-logical features and perhaps lead to better justiWcations forthe atomization of characters or suites of characters(Lovejoy et al., 1999; Hlusko, 2004). For example, the studyby Popwics (1998) on ontogeny of carnassial and postcar-nassial teeth in ferrets (Mustela putorius) showed that whileearly stages of tooth ontogeny were similar to other carni-vores, later stages of ontogeny resulted in species-speciWcdental morphologies. Such elegant studies, combinedwith an understanding of developmental genetics of
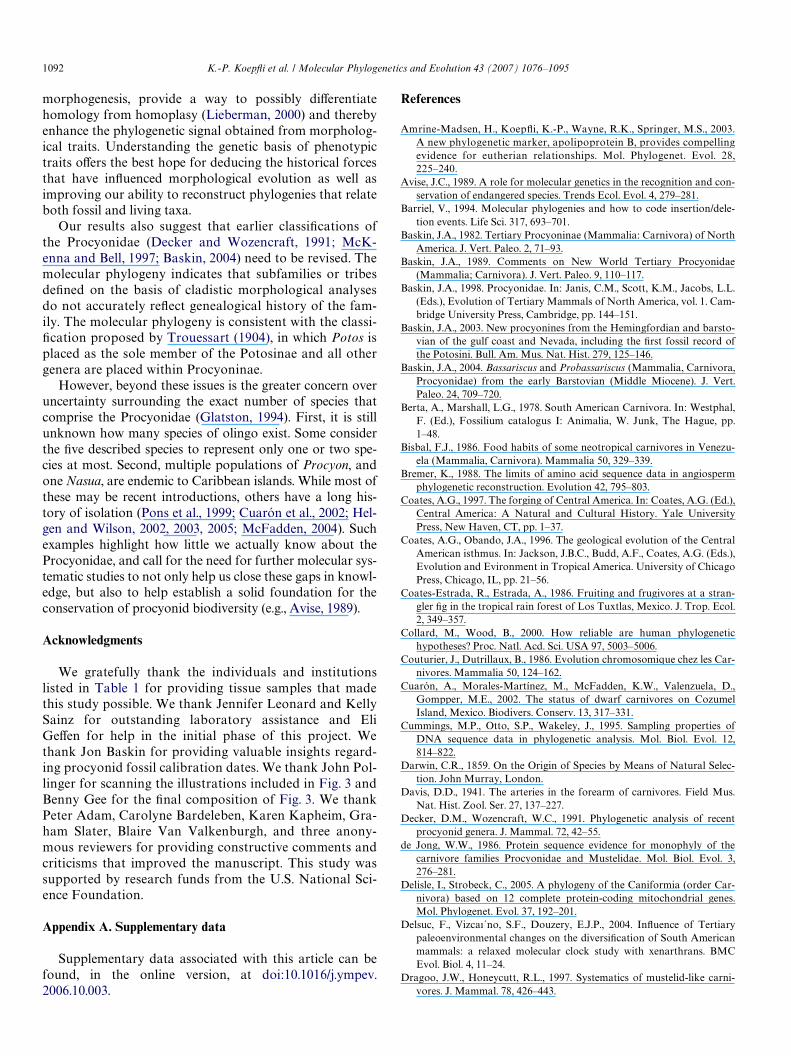
1092 K.-P. KoepXi et al. / Molecular Phylogenetics and Evolution 43 (2007) 1076–1095
morphogenesis, provide a way to possibly diVerentiatehomology from homoplasy (Lieberman, 2000) and therebyenhance the phylogenetic signal obtained from morpholog-ical traits. Understanding the genetic basis of phenotypictraits oVers the best hope for deducing the historical forcesthat have inXuenced morphological evolution as well asimproving our ability to reconstruct phylogenies that relateboth fossil and living taxa.
Our results also suggest that earlier classiWcations ofthe Procyonidae (Decker and Wozencraft, 1991; McK-enna and Bell, 1997; Baskin, 2004) need to be revised. Themolecular phylogeny indicates that subfamilies or tribesdeWned on the basis of cladistic morphological analysesdo not accurately reXect genealogical history of the fam-ily. The molecular phylogeny is consistent with the classi-Wcation proposed by Trouessart (1904), in which Potos isplaced as the sole member of the Potosinae and all othergenera are placed within Procyoninae.
However, beyond these issues is the greater concern overuncertainty surrounding the exact number of species thatcomprise the Procyonidae (Glatston, 1994). First, it is stillunknown how many species of olingo exist. Some considerthe Wve described species to represent only one or two spe-cies at most. Second, multiple populations of Procyon, andone Nasua, are endemic to Caribbean islands. While most ofthese may be recent introductions, others have a long his-tory of isolation (Pons et al., 1999; Cuarón et al., 2002; Hel-gen and Wilson, 2002, 2003, 2005; McFadden, 2004). Suchexamples highlight how little we actually know about theProcyonidae, and call for the need for further molecular sys-tematic studies to not only help us close these gaps in knowl-edge, but also to help establish a solid foundation for theconservation of procyonid biodiversity (e.g., Avise, 1989).
Acknowledgments
We gratefully thank the individuals and institutionslisted in Table 1 for providing tissue samples that madethis study possible. We thank Jennifer Leonard and KellySainz for outstanding laboratory assistance and EliGeVen for help in the initial phase of this project. Wethank Jon Baskin for providing valuable insights regard-ing procyonid fossil calibration dates. We thank John Pol-linger for scanning the illustrations included in Fig. 3 andBenny Gee for the Wnal composition of Fig. 3. We thankPeter Adam, Carolyne Bardeleben, Karen Kapheim, Gra-ham Slater, Blaire Van Valkenburgh, and three anony-mous reviewers for providing constructive comments andcriticisms that improved the manuscript. This study wassupported by research funds from the U.S. National Sci-ence Foundation.
Appendix A. Supplementary data
Supplementary data associated with this article can befound, in the online version, at doi:10.1016/j.ympev.2006.10.003.
References
Amrine-Madsen, H., KoepXi, K.-P., Wayne, R.K., Springer, M.S., 2003.A new phylogenetic marker, apolipoprotein B, provides compellingevidence for eutherian relationships. Mol. Phylogenet. Evol. 28,225–240.
Avise, J.C., 1989. A role for molecular genetics in the recognition and con-servation of endangered species. Trends Ecol. Evol. 4, 279–281.
Barriel, V., 1994. Molecular phylogenies and how to code insertion/dele-tion events. Life Sci. 317, 693–701.
Baskin, J.A., 1982. Tertiary Procyoninae (Mammalia: Carnivora) of NorthAmerica. J. Vert. Paleo. 2, 71–93.
Baskin, J.A., 1989. Comments on New World Tertiary Procyonidae(Mammalia; Carnivora). J. Vert. Paleo. 9, 110–117.
Baskin, J.A., 1998. Procyonidae. In: Janis, C.M., Scott, K.M., Jacobs, L.L.(Eds.), Evolution of Tertiary Mammals of North America, vol. 1. Cam-bridge University Press, Cambridge, pp. 144–151.
Baskin, J.A., 2003. New procyonines from the Hemingfordian and barsto-vian of the gulf coast and Nevada, including the Wrst fossil record ofthe Potosini. Bull. Am. Mus. Nat. Hist. 279, 125–146.
Baskin, J.A., 2004. Bassariscus and Probassariscus (Mammalia, Carnivora,Procyonidae) from the early Barstovian (Middle Miocene). J. Vert.Paleo. 24, 709–720.
Berta, A., Marshall, L.G., 1978. South American Carnivora. In: Westphal,F. (Ed.), Fossilium catalogus I: Animalia, W. Junk, The Hague, pp.1–48.
Bisbal, F.J., 1986. Food habits of some neotropical carnivores in Venezu-ela (Mammalia, Carnivora). Mammalia 50, 329–339.
Bremer, K., 1988. The limits of amino acid sequence data in angiospermphylogenetic reconstruction. Evolution 42, 795–803.
Coates, A.G., 1997. The forging of Central America. In: Coates, A.G. (Ed.),Central America: A Natural and Cultural History. Yale UniversityPress, New Haven, CT, pp. 1–37.
Coates, A.G., Obando, J.A., 1996. The geological evolution of the CentralAmerican isthmus. In: Jackson, J.B.C., Budd, A.F., Coates, A.G. (Eds.),Evolution and Evironment in Tropical America. University of ChicagoPress, Chicago, IL, pp. 21–56.
Coates-Estrada, R., Estrada, A., 1986. Fruiting and frugivores at a stran-gler Wg in the tropical rain forest of Los Tuxtlas, Mexico. J. Trop. Ecol.2, 349–357.
Collard, M., Wood, B., 2000. How reliable are human phylogenetichypotheses? Proc. Natl. Acd. Sci. USA 97, 5003–5006.
Couturier, J., Dutrillaux, B., 1986. Evolution chromosomique chez les Car-nivores. Mammalia 50, 124–162.
Cuarón, A., Morales-Martínez, M., McFadden, K.W., Valenzuela, D.,Gompper, M.E., 2002. The status of dwarf carnivores on CozumelIsland, Mexico. Biodivers. Conserv. 13, 317–331.
Cummings, M.P., Otto, S.P., Wakeley, J., 1995. Sampling properties ofDNA sequence data in phylogenetic analysis. Mol. Biol. Evol. 12,814–822.
Darwin, C.R., 1859. On the Origin of Species by Means of Natural Selec-tion. John Murray, London.
Davis, D.D., 1941. The arteries in the forearm of carnivores. Field Mus.Nat. Hist. Zool. Ser. 27, 137–227.
Decker, D.M., Wozencraft, W.C., 1991. Phylogenetic analysis of recentprocyonid genera. J. Mammal. 72, 42–55.
de Jong, W.W., 1986. Protein sequence evidence for monophyly of thecarnivore families Procyonidae and Mustelidae. Mol. Biol. Evol. 3,276–281.
Delisle, I., Strobeck, C., 2005. A phylogeny of the Caniformia (order Car-nivora) based on 12 complete protein-coding mitochondrial genes.Mol. Phylogenet. Evol. 37, 192–201.
Delsuc, F., Vizca´no, S.F., Douzery, E.J.P., 2004. InXuence of Tertiarypaleoenvironmental changes on the diversiWcation of South Americanmammals: a relaxed molecular clock study with xenarthrans. BMCEvol. Biol. 4, 11–24.
Dragoo, J.W., Honeycutt, R.L., 1997. Systematics of mustelid-like carni-vores. J. Mammal. 78, 426–443.
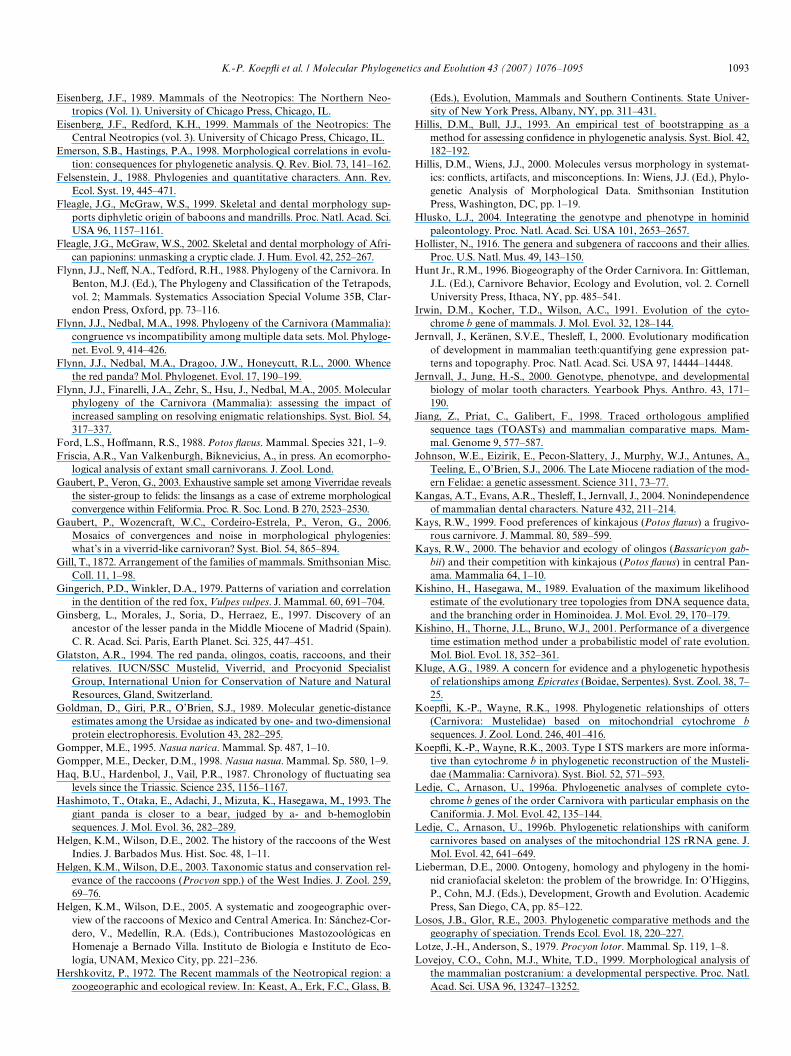
K.-P. KoepXi et al. / Molecular Phylogenetics and Evolution 43 (2007) 1076–1095 1093
Eisenberg, J.F., 1989. Mammals of the Neotropics: The Northern Neo-tropics (Vol. 1). University of Chicago Press, Chicago, IL.
Eisenberg, J.F., Redford, K.H., 1999. Mammals of the Neotropics: TheCentral Neotropics (vol. 3). University of Chicago Press, Chicago, IL.
Emerson, S.B., Hastings, P.A., 1998. Morphological correlations in evolu-tion: consequences for phylogenetic analysis. Q. Rev. Biol. 73, 141–162.
Felsenstein, J., 1988. Phylogenies and quantitative characters. Ann. Rev.Ecol. Syst. 19, 445–471.
Fleagle, J.G., McGraw, W.S., 1999. Skeletal and dental morphology sup-ports diphyletic origin of baboons and mandrills. Proc. Natl. Acad. Sci.USA 96, 1157–1161.
Fleagle, J.G., McGraw, W.S., 2002. Skeletal and dental morphology of Afri-can papionins: unmasking a cryptic clade. J. Hum. Evol. 42, 252–267.
Flynn, J.J., NeV, N.A., Tedford, R.H., 1988. Phylogeny of the Carnivora. InBenton, M.J. (Ed.), The Phylogeny and ClassiWcation of the Tetrapods,vol. 2; Mammals. Systematics Association Special Volume 35B, Clar-endon Press, Oxford, pp. 73–116.
Flynn, J.J., Nedbal, M.A., 1998. Phylogeny of the Carnivora (Mammalia):congruence vs incompatibility among multiple data sets. Mol. Phyloge-net. Evol. 9, 414–426.
Flynn, J.J., Nedbal, M.A., Dragoo, J.W., Honeycutt, R.L., 2000. Whencethe red panda? Mol. Phylogenet. Evol. 17, 190–199.
Flynn, J.J., Finarelli, J.A., Zehr, S., Hsu, J., Nedbal, M.A., 2005. Molecularphylogeny of the Carnivora (Mammalia): assessing the impact ofincreased sampling on resolving enigmatic relationships. Syst. Biol. 54,317–337.
Ford, L.S., HoVmann, R.S., 1988. Potos Xavus. Mammal. Species 321, 1–9.Friscia, A.R., Van Valkenburgh, Biknevicius, A., in press. An ecomorpho-
logical analysis of extant small carnivorans. J. Zool. Lond.Gaubert, P., Veron, G., 2003. Exhaustive sample set among Viverridae reveals
the sister-group to felids: the linsangs as a case of extreme morphologicalconvergence within Feliformia. Proc. R. Soc. Lond. B 270, 2523–2530.
Gaubert, P., Wozencraft, W.C., Cordeiro-Estrela, P., Veron, G., 2006.Mosaics of convergences and noise in morphological phylogenies:what’s in a viverrid-like carnivoran? Syst. Biol. 54, 865–894.
Gill, T., 1872. Arrangement of the families of mammals. Smithsonian Misc.Coll. 11, 1–98.
Gingerich, P.D., Winkler, D.A., 1979. Patterns of variation and correlationin the dentition of the red fox, Vulpes vulpes. J. Mammal. 60, 691–704.
Ginsberg, L., Morales, J., Soria, D., Herraez, E., 1997. Discovery of anancestor of the lesser panda in the Middle Miocene of Madrid (Spain).C. R. Acad. Sci. Paris, Earth Planet. Sci. 325, 447–451.
Glatston, A.R., 1994. The red panda, olingos, coatis, raccoons, and theirrelatives. IUCN/SSC Mustelid, Viverrid, and Procyonid SpecialistGroup, International Union for Conservation of Nature and NaturalResources, Gland, Switzerland.
Goldman, D., Giri, P.R., O’Brien, S.J., 1989. Molecular genetic-distanceestimates among the Ursidae as indicated by one- and two-dimensionalprotein electrophoresis. Evolution 43, 282–295.
Gompper, M.E., 1995. Nasua narica. Mammal. Sp. 487, 1–10.Gompper, M.E., Decker, D.M., 1998. Nasua nasua. Mammal. Sp. 580, 1–9.Haq, B.U., Hardenbol, J., Vail, P.R., 1987. Chronology of Xuctuating sea
levels since the Triassic. Science 235, 1156–1167.Hashimoto, T., Otaka, E., Adachi, J., Mizuta, K., Hasegawa, M., 1993. The
giant panda is closer to a bear, judged by a- and b-hemoglobinsequences. J. Mol. Evol. 36, 282–289.
Helgen, K.M., Wilson, D.E., 2002. The history of the raccoons of the WestIndies. J. Barbados Mus. Hist. Soc. 48, 1–11.
Helgen, K.M., Wilson, D.E., 2003. Taxonomic status and conservation rel-evance of the raccoons (Procyon spp.) of the West Indies. J. Zool. 259,69–76.
Helgen, K.M., Wilson, D.E., 2005. A systematic and zoogeographic over-view of the raccoons of Mexico and Central America. In: Sánchez-Cor-dero, V., Medellín, R.A. (Eds.), Contribuciones Mastozoológicas enHomenaje a Bernado Villa. Instituto de Biología e Instituto de Eco-logía, UNAM, Mexico City, pp. 221–236.
Hershkovitz, P., 1972. The Recent mammals of the Neotropical region: azoogeographic and ecological review. In: Keast, A., Erk, F.C., Glass, B.
(Eds.), Evolution, Mammals and Southern Continents. State Univer-sity of New York Press, Albany, NY, pp. 311–431.
Hillis, D.M., Bull, J.J., 1993. An empirical test of bootstrapping as amethod for assessing conWdence in phylogenetic analysis. Syst. Biol. 42,182–192.
Hillis, D.M., Wiens, J.J., 2000. Molecules versus morphology in systemat-ics: conXicts, artifacts, and misconceptions. In: Wiens, J.J. (Ed.), Phylo-genetic Analysis of Morphological Data. Smithsonian InstitutionPress, Washington, DC, pp. 1–19.
Hlusko, L.J., 2004. Integrating the genotype and phenotype in hominidpaleontology. Proc. Natl. Acad. Sci. USA 101, 2653–2657.
Hollister, N., 1916. The genera and subgenera of raccoons and their allies.Proc. U.S. Natl. Mus. 49, 143–150.
Hunt Jr., R.M., 1996. Biogeography of the Order Carnivora. In: Gittleman,J.L. (Ed.), Carnivore Behavior, Ecology and Evolution, vol. 2. CornellUniversity Press, Ithaca, NY, pp. 485–541.
Irwin, D.M., Kocher, T.D., Wilson, A.C., 1991. Evolution of the cyto-chrome b gene of mammals. J. Mol. Evol. 32, 128–144.
Jernvall, J., Keränen, S.V.E., ThesleV, I., 2000. Evolutionary modiWcationof development in mammalian teeth:quantifying gene expression pat-terns and topography. Proc. Natl. Acad. Sci. USA 97, 14444–14448.
Jernvall, J., Jung, H.-S., 2000. Genotype, phenotype, and developmentalbiology of molar tooth characters. Yearbook Phys. Anthro. 43, 171–190.
Jiang, Z., Priat, C., Galibert, F., 1998. Traced orthologous ampliWedsequence tags (TOASTs) and mammalian comparative maps. Mam-mal. Genome 9, 577–587.
Johnson, W.E., Eizirik, E., Pecon-Slattery, J., Murphy, W.J., Antunes, A.,Teeling, E., O’Brien, S.J., 2006. The Late Miocene radiation of the mod-ern Felidae: a genetic assessment. Science 311, 73–77.
Kangas, A.T., Evans, A.R., ThesleV, I., Jernvall, J., 2004. Nonindependenceof mammalian dental characters. Nature 432, 211–214.
Kays, R.W., 1999. Food preferences of kinkajous (Potos Xavus) a frugivo-rous carnivore. J. Mammal. 80, 589–599.
Kays, R.W., 2000. The behavior and ecology of olingos (Bassaricyon gab-bii) and their competition with kinkajous (Potos Xavus) in central Pan-ama. Mammalia 64, 1–10.
Kishino, H., Hasegawa, M., 1989. Evaluation of the maximum likelihoodestimate of the evolutionary tree topologies from DNA sequence data,and the branching order in Hominoidea. J. Mol. Evol. 29, 170–179.
Kishino, H., Thorne, J.L., Bruno, W.J., 2001. Performance of a divergencetime estimation method under a probabilistic model of rate evolution.Mol. Biol. Evol. 18, 352–361.
Kluge, A.G., 1989. A concern for evidence and a phylogenetic hypothesisof relationships among Epicrates (Boidae, Serpentes). Syst. Zool. 38, 7–25.
KoepXi, K.-P., Wayne, R.K., 1998. Phylogenetic relationships of otters(Carnivora: Mustelidae) based on mitochondrial cytochrome bsequences. J. Zool. Lond. 246, 401–416.
KoepXi, K.-P., Wayne, R.K., 2003. Type I STS markers are more informa-tive than cytochrome b in phylogenetic reconstruction of the Musteli-dae (Mammalia: Carnivora). Syst. Biol. 52, 571–593.
Ledje, C., Arnason, U., 1996a. Phylogenetic analyses of complete cyto-chrome b genes of the order Carnivora with particular emphasis on theCaniformia. J. Mol. Evol. 42, 135–144.
Ledje, C., Arnason, U., 1996b. Phylogenetic relationships with caniformcarnivores based on analyses of the mitochondrial 12S rRNA gene. J.Mol. Evol. 42, 641–649.
Lieberman, D.E., 2000. Ontogeny, homology and phylogeny in the homi-nid craniofacial skeleton: the problem of the browridge. In: O’Higgins,P., Cohn, M.J. (Eds.), Development, Growth and Evolution. AcademicPress, San Diego, CA, pp. 85–122.
Losos, J.B., Glor, R.E., 2003. Phylogenetic comparative methods and thegeography of speciation. Trends Ecol. Evol. 18, 220–227.
Lotze, J.-H., Anderson, S., 1979. Procyon lotor. Mammal. Sp. 119, 1–8.Lovejoy, C.O., Cohn, M.J., White, T.D., 1999. Morphological analysis of
the mammalian postcranium: a developmental perspective. Proc. Natl.Acad. Sci. USA 96, 13247–13252.
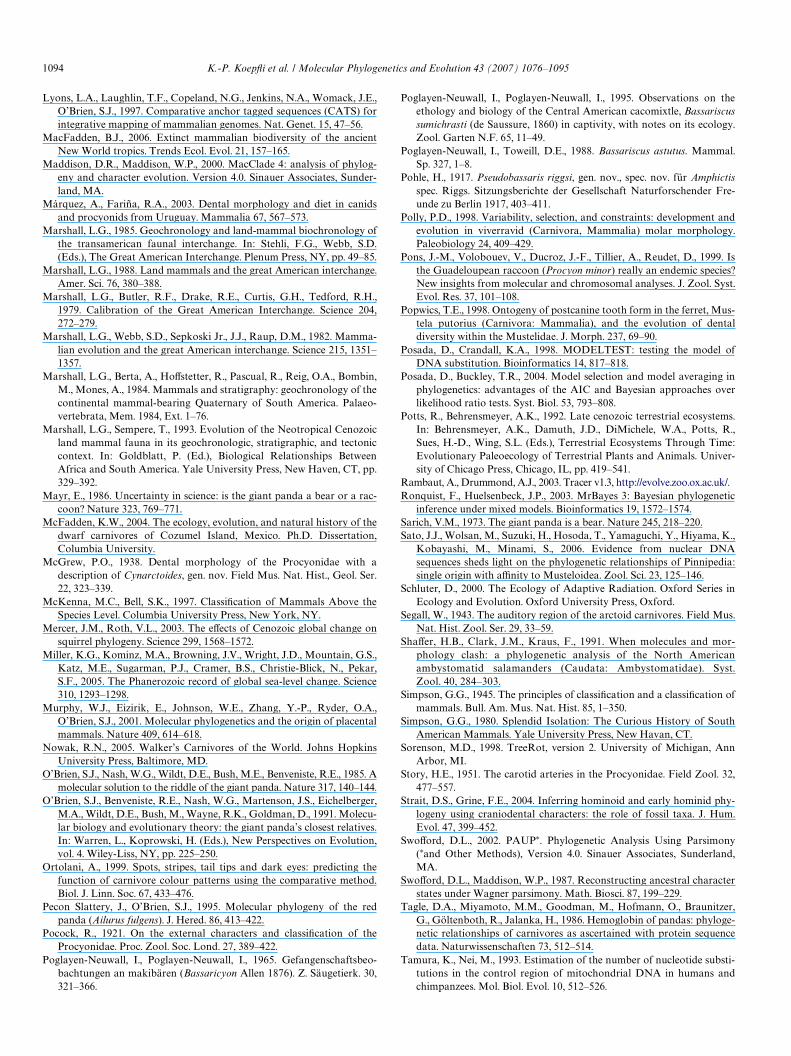
1094 K.-P. KoepXi et al. / Molecular Phylogenetics and Evolution 43 (2007) 1076–1095
Lyons, L.A., Laughlin, T.F., Copeland, N.G., Jenkins, N.A., Womack, J.E.,O’Brien, S.J., 1997. Comparative anchor tagged sequences (CATS) forintegrative mapping of mammalian genomes. Nat. Genet. 15, 47–56.
MacFadden, B.J., 2006. Extinct mammalian biodiversity of the ancientNew World tropics. Trends Ecol. Evol. 21, 157–165.
Maddison, D.R., Maddison, W.P., 2000. MacClade 4: analysis of phylog-eny and character evolution. Version 4.0. Sinauer Associates, Sunder-land, MA.
Márquez, A., Fariña, R.A., 2003. Dental morphology and diet in canidsand procyonids from Uruguay. Mammalia 67, 567–573.
Marshall, L.G., 1985. Geochronology and land-mammal biochronology ofthe transamerican faunal interchange. In: Stehli, F.G., Webb, S.D.(Eds.), The Great American Interchange. Plenum Press, NY, pp. 49–85.
Marshall, L.G., 1988. Land mammals and the great American interchange.Amer. Sci. 76, 380–388.
Marshall, L.G., Butler, R.F., Drake, R.E., Curtis, G.H., Tedford, R.H.,1979. Calibration of the Great American Interchange. Science 204,272–279.
Marshall, L.G., Webb, S.D., Sepkoski Jr., J.J., Raup, D.M., 1982. Mamma-lian evolution and the great American interchange. Science 215, 1351–1357.
Marshall, L.G., Berta, A., HoVstetter, R., Pascual, R., Reig, O.A., Bombin,M., Mones, A., 1984. Mammals and stratigraphy: geochronology of thecontinental mammal-bearing Quaternary of South America. Palaeo-vertebrata, Mem. 1984, Ext. 1–76.
Marshall, L.G., Sempere, T., 1993. Evolution of the Neotropical Cenozoicland mammal fauna in its geochronologic, stratigraphic, and tectoniccontext. In: Goldblatt, P. (Ed.), Biological Relationships BetweenAfrica and South America. Yale University Press, New Haven, CT, pp.329–392.
Mayr, E., 1986. Uncertainty in science: is the giant panda a bear or a rac-coon? Nature 323, 769–771.
McFadden, K.W., 2004. The ecology, evolution, and natural history of thedwarf carnivores of Cozumel Island, Mexico. Ph.D. Dissertation,Columbia University.
McGrew, P.O., 1938. Dental morphology of the Procyonidae with adescription of Cynarctoides, gen. nov. Field Mus. Nat. Hist., Geol. Ser.22, 323–339.
McKenna, M.C., Bell, S.K., 1997. ClassiWcation of Mammals Above theSpecies Level. Columbia University Press, New York, NY.
Mercer, J.M., Roth, V.L., 2003. The eVects of Cenozoic global change onsquirrel phylogeny. Science 299, 1568–1572.
Miller, K.G., Kominz, M.A., Browning, J.V., Wright, J.D., Mountain, G.S.,Katz, M.E., Sugarman, P.J., Cramer, B.S., Christie-Blick, N., Pekar,S.F., 2005. The Phanerozoic record of global sea-level change. Science310, 1293–1298.
Murphy, W.J., Eizirik, E., Johnson, W.E., Zhang, Y.-P., Ryder, O.A.,O’Brien, S.J., 2001. Molecular phylogenetics and the origin of placentalmammals. Nature 409, 614–618.
Nowak, R.N., 2005. Walker’s Carnivores of the World. Johns HopkinsUniversity Press, Baltimore, MD.
O’Brien, S.J., Nash, W.G., Wildt, D.E., Bush, M.E., Benveniste, R.E., 1985. Amolecular solution to the riddle of the giant panda. Nature 317, 140–144.
O’Brien, S.J., Benveniste, R.E., Nash, W.G., Martenson, J.S., Eichelberger,M.A., Wildt, D.E., Bush, M., Wayne, R.K., Goldman, D., 1991. Molecu-lar biology and evolutionary theory: the giant panda’s closest relatives.In: Warren, L., Koprowski, H. (Eds.), New Perspectives on Evolution,vol. 4. Wiley-Liss, NY, pp. 225–250.
Ortolani, A., 1999. Spots, stripes, tail tips and dark eyes: predicting thefunction of carnivore colour patterns using the comparative method.Biol. J. Linn. Soc. 67, 433–476.
Pecon Slattery, J., O’Brien, S.J., 1995. Molecular phylogeny of the redpanda (Ailurus fulgens). J. Hered. 86, 413–422.
Pocock, R., 1921. On the external characters and classiWcation of theProcyonidae. Proc. Zool. Soc. Lond. 27, 389–422.
Poglayen-Neuwall, I., Poglayen-Neuwall, I., 1965. Gefangenschaftsbeo-bachtungen an makibären (Bassaricyon Allen 1876). Z. Säugetierk. 30,321–366.
Poglayen-Neuwall, I., Poglayen-Neuwall, I., 1995. Observations on theethology and biology of the Central American cacomixtle, Bassariscussumichrasti (de Saussure, 1860) in captivity, with notes on its ecology.Zool. Garten N.F. 65, 11–49.
Poglayen-Neuwall, I., Toweill, D.E., 1988. Bassariscus astutus. Mammal.Sp. 327, 1–8.
Pohle, H., 1917. Pseudobassaris riggsi, gen. nov., spec. nov. für Amphictisspec. Riggs. Sitzungsberichte der Gesellschaft Naturforschender Fre-unde zu Berlin 1917, 403–411.
Polly, P.D., 1998. Variability, selection, and constraints: development andevolution in viverravid (Carnivora, Mammalia) molar morphology.Paleobiology 24, 409–429.
Pons, J.-M., Volobouev, V., Ducroz, J.-F., Tillier, A., Reudet, D., 1999. Isthe Guadeloupean raccoon (Procyon minor) really an endemic species?New insights from molecular and chromosomal analyses. J. Zool. Syst.Evol. Res. 37, 101–108.
Popwics, T.E., 1998. Ontogeny of postcanine tooth form in the ferret, Mus-tela putorius (Carnivora: Mammalia), and the evolution of dentaldiversity within the Mustelidae. J. Morph. 237, 69–90.
Posada, D., Crandall, K.A., 1998. MODELTEST: testing the model ofDNA substitution. Bioinformatics 14, 817–818.
Posada, D., Buckley, T.R., 2004. Model selection and model averaging inphylogenetics: advantages of the AIC and Bayesian approaches overlikelihood ratio tests. Syst. Biol. 53, 793–808.
Potts, R., Behrensmeyer, A.K., 1992. Late cenozoic terrestrial ecosystems.In: Behrensmeyer, A.K., Damuth, J.D., DiMichele, W.A., Potts, R.,Sues, H.-D., Wing, S.L. (Eds.), Terrestrial Ecosystems Through Time:Evolutionary Paleoecology of Terrestrial Plants and Animals. Univer-sity of Chicago Press, Chicago, IL, pp. 419–541.
Rambaut, A., Drummond, A.J., 2003. Tracer v1.3, http://evolve.zoo.ox.ac.uk/.Ronquist, F., Huelsenbeck, J.P., 2003. MrBayes 3: Bayesian phylogenetic
inference under mixed models. Bioinformatics 19, 1572–1574.Sarich, V.M., 1973. The giant panda is a bear. Nature 245, 218–220.Sato, J.J., Wolsan, M., Suzuki, H., Hosoda, T., Yamaguchi, Y., Hiyama, K.,
Kobayashi, M., Minami, S., 2006. Evidence from nuclear DNAsequences sheds light on the phylogenetic relationships of Pinnipedia:single origin with aYnity to Musteloidea. Zool. Sci. 23, 125–146.
Schluter, D., 2000. The Ecology of Adaptive Radiation. Oxford Series inEcology and Evolution. Oxford University Press, Oxford.
Segall, W., 1943. The auditory region of the arctoid carnivores. Field Mus.Nat. Hist. Zool. Ser. 29, 33–59.
ShaVer, H.B., Clark, J.M., Kraus, F., 1991. When molecules and mor-phology clash: a phylogenetic analysis of the North Americanambystomatid salamanders (Caudata: Ambystomatidae). Syst.Zool. 40, 284–303.
Simpson, G.G., 1945. The principles of classiWcation and a classiWcation ofmammals. Bull. Am. Mus. Nat. Hist. 85, 1–350.
Simpson, G.G., 1980. Splendid Isolation: The Curious History of SouthAmerican Mammals. Yale University Press, New Havan, CT.
Sorenson, M.D., 1998. TreeRot, version 2. University of Michigan, AnnArbor, MI.
Story, H.E., 1951. The carotid arteries in the Procyonidae. Field Zool. 32,477–557.
Strait, D.S., Grine, F.E., 2004. Inferring hominoid and early hominid phy-logeny using craniodental characters: the role of fossil taxa. J. Hum.Evol. 47, 399–452.
SwoVord, D.L., 2002. PAUP¤. Phylogenetic Analysis Using Parsimony(¤and Other Methods), Version 4.0. Sinauer Associates, Sunderland,MA.
SwoVord, D.L., Maddison, W.P., 1987. Reconstructing ancestral characterstates under Wagner parsimony. Math. Biosci. 87, 199–229.
Tagle, D.A., Miyamoto, M.M., Goodman, M., Hofmann, O., Braunitzer,G., Göltenboth, R., Jalanka, H., 1986. Hemoglobin of pandas: phyloge-netic relationships of carnivores as ascertained with protein sequencedata. Naturwissenschaften 73, 512–514.
Tamura, K., Nei, M., 1993. Estimation of the number of nucleotide substi-tutions in the control region of mitochondrial DNA in humans andchimpanzees. Mol. Biol. Evol. 10, 512–526.
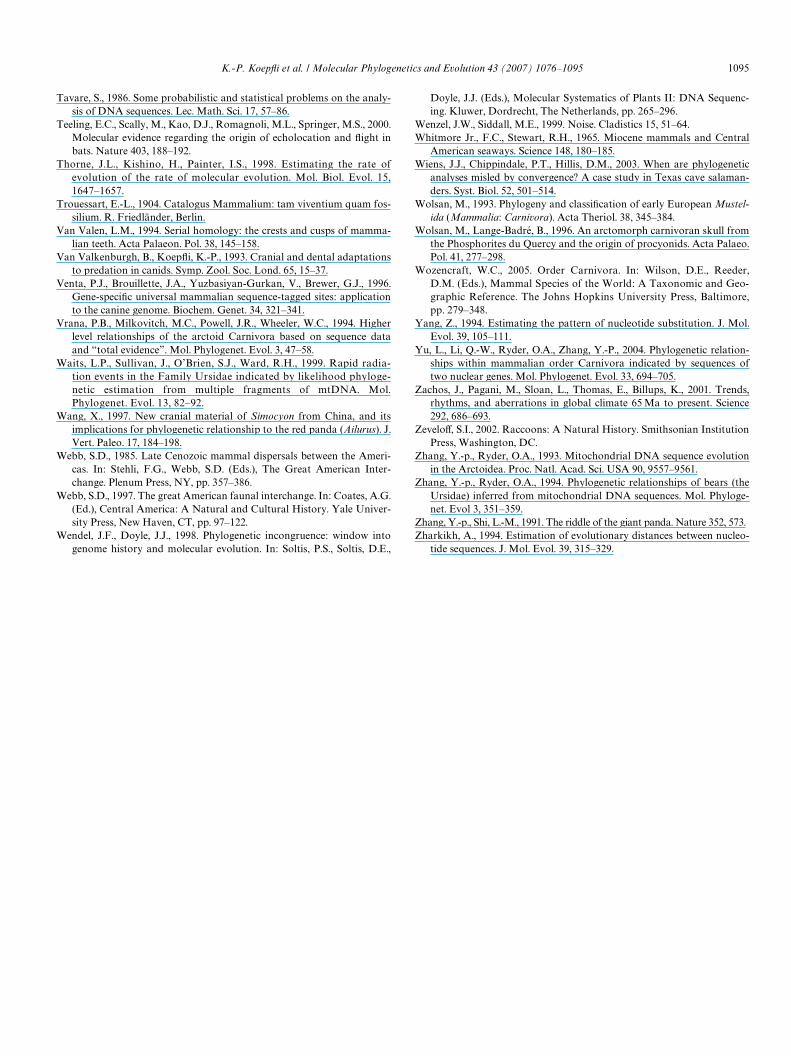
K.-P. KoepXi et al. / Molecular Phylogenetics and Evolution 43 (2007) 1076–1095 1095
Tavare, S., 1986. Some probabilistic and statistical problems on the analy-sis of DNA sequences. Lec. Math. Sci. 17, 57–86.
Teeling, E.C., Scally, M., Kao, D.J., Romagnoli, M.L., Springer, M.S., 2000.Molecular evidence regarding the origin of echolocation and Xight inbats. Nature 403, 188–192.
Thorne, J.L., Kishino, H., Painter, I.S., 1998. Estimating the rate ofevolution of the rate of molecular evolution. Mol. Biol. Evol. 15,1647–1657.
Trouessart, E.-L., 1904. Catalogus Mammalium: tam viventium quam fos-silium. R. Friedländer, Berlin.
Van Valen, L.M., 1994. Serial homology: the crests and cusps of mamma-lian teeth. Acta Palaeon. Pol. 38, 145–158.
Van Valkenburgh, B., KoepXi, K.-P., 1993. Cranial and dental adaptationsto predation in canids. Symp. Zool. Soc. Lond. 65, 15–37.
Venta, P.J., Brouillette, J.A., Yuzbasiyan-Gurkan, V., Brewer, G.J., 1996.Gene-speciWc universal mammalian sequence-tagged sites: applicationto the canine genome. Biochem. Genet. 34, 321–341.
Vrana, P.B., Milkovitch, M.C., Powell, J.R., Wheeler, W.C., 1994. Higherlevel relationships of the arctoid Carnivora based on sequence dataand “total evidence”. Mol. Phylogenet. Evol. 3, 47–58.
Waits, L.P., Sullivan, J., O’Brien, S.J., Ward, R.H., 1999. Rapid radia-tion events in the Family Ursidae indicated by likelihood phyloge-netic estimation from multiple fragments of mtDNA. Mol.Phylogenet. Evol. 13, 82–92.
Wang, X., 1997. New cranial material of Simocyon from China, and itsimplications for phylogenetic relationship to the red panda (Ailurus). J.Vert. Paleo. 17, 184–198.
Webb, S.D., 1985. Late Cenozoic mammal dispersals between the Ameri-cas. In: Stehli, F.G., Webb, S.D. (Eds.), The Great American Inter-change. Plenum Press, NY, pp. 357–386.
Webb, S.D., 1997. The great American faunal interchange. In: Coates, A.G.(Ed.), Central America: A Natural and Cultural History. Yale Univer-sity Press, New Haven, CT, pp. 97–122.
Wendel, J.F., Doyle, J.J., 1998. Phylogenetic incongruence: window intogenome history and molecular evolution. In: Soltis, P.S., Soltis, D.E.,
Doyle, J.J. (Eds.), Molecular Systematics of Plants II: DNA Sequenc-ing. Kluwer, Dordrecht, The Netherlands, pp. 265–296.
Wenzel, J.W., Siddall, M.E., 1999. Noise. Cladistics 15, 51–64.Whitmore Jr., F.C., Stewart, R.H., 1965. Miocene mammals and Central
American seaways. Science 148, 180–185.Wiens, J.J., Chippindale, P.T., Hillis, D.M., 2003. When are phylogenetic
analyses misled by convergence? A case study in Texas cave salaman-ders. Syst. Biol. 52, 501–514.
Wolsan, M., 1993. Phylogeny and classiWcation of early European Mustel-ida (Mammalia: Carnivora). Acta Theriol. 38, 345–384.
Wolsan, M., Lange-Badré, B., 1996. An arctomorph carnivoran skull fromthe Phosphorites du Quercy and the origin of procyonids. Acta Palaeo.Pol. 41, 277–298.
Wozencraft, W.C., 2005. Order Carnivora. In: Wilson, D.E., Reeder,D.M. (Eds.), Mammal Species of the World: A Taxonomic and Geo-graphic Reference. The Johns Hopkins University Press, Baltimore,pp. 279–348.
Yang, Z., 1994. Estimating the pattern of nucleotide substitution. J. Mol.Evol. 39, 105–111.
Yu, L., Li, Q.-W., Ryder, O.A., Zhang, Y.-P., 2004. Phylogenetic relation-ships within mammalian order Carnivora indicated by sequences oftwo nuclear genes. Mol. Phylogenet. Evol. 33, 694–705.
Zachos, J., Pagani, M., Sloan, L., Thomas, E., Billups, K., 2001. Trends,rhythms, and aberrations in global climate 65 Ma to present. Science292, 686–693.
ZeveloV, S.I., 2002. Raccoons: A Natural History. Smithsonian InstitutionPress, Washington, DC.
Zhang, Y.-p., Ryder, O.A., 1993. Mitochondrial DNA sequence evolutionin the Arctoidea. Proc. Natl. Acad. Sci. USA 90, 9557–9561.
Zhang, Y.-p., Ryder, O.A., 1994. Phylogenetic relationships of bears (theUrsidae) inferred from mitochondrial DNA sequences. Mol. Phyloge-net. Evol 3, 351–359.
Zhang, Y.-p., Shi, L.-M., 1991. The riddle of the giant panda. Nature 352, 573.Zharkikh, A., 1994. Estimation of evolutionary distances between nucleo-
tide sequences. J. Mol. Evol. 39, 315–329.
Related Documents