1 4 – Synthesis and Analysis of Complex Waves; Fourier spectra Many physical systems (such as music instruments) allow existence of a particular set of standing waves with the frequency spectrum consisting of the fundamental (minimal allowed) frequency f 1 and the overtones or harmonics f n that are multiples of f 1 , that is, f n = nf 1 , n=2,3,…The amplitudes of the harmonics A n depend on how exactly the system is excited (plucking a guitar string at the middle or near an end). The sound emitted by the system and registered by our ears is thus a complex wave (or, more precisely, a complex oscillation ), or just signal, that has the general form 1 1 1 period with periodic ), 2 sin( ) ( max f T t f A t W n n n n n = + = ∑ = ϕ π Plots of W(t) that can look complicated are called wave forms . The maximal number of harmonics n max is actually infinite but we can take a finite number of harmonics to synthesize a complex wave. The phases ϕ n influence the wave form a lot, visually, but the human ear is insensitive to them (the psychoacoustical Ohm‘s law). What the ear hears is the fundamental frequency (even if it is missing in the wave form, A 1 =0!) and the amplitudes A n that determine the sound quality or timbre . Complex waves

Welcome message from author
This document is posted to help you gain knowledge. Please leave a comment to let me know what you think about it! Share it to your friends and learn new things together.
Transcript
1
4 – Synthesis and Analysis of Complex Waves;Fourier spectra
Many physical systems (such as music instruments) allow existence of a particular set of standingwaves with the frequency spectrum consisting of the fundamental (minimal allowed) frequency f1and the overtones or harmonics fn that are multiples of f1, that is, fn = n f1, n=2,3,…The amplitudesof the harmonics An depend on how exactly the system is excited (plucking a guitar string at themiddle or near an end). The sound emitted by the system and registered by our ears is thus a complex wave (or, more precisely, a complex oscillation), or just signal, that has the general form
11
1 period with periodic ),2sin()(
max
fTtfAtW nn
n
nn =+=∑
=
ϕπ
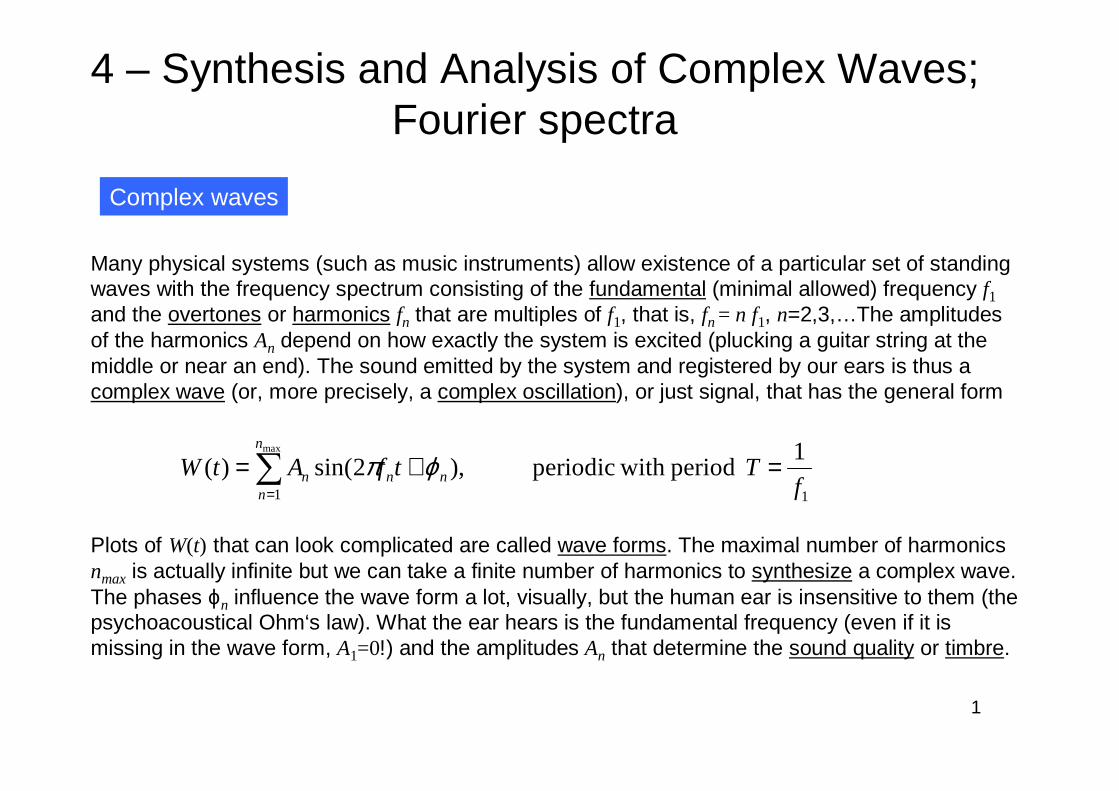
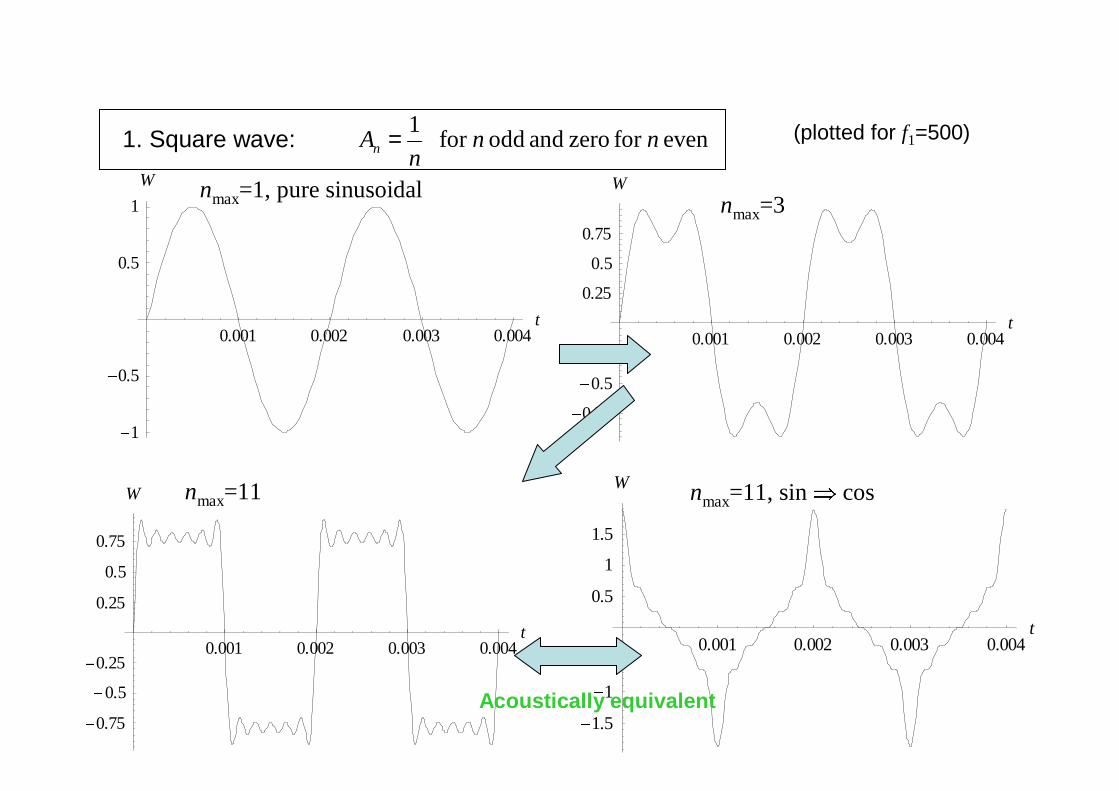
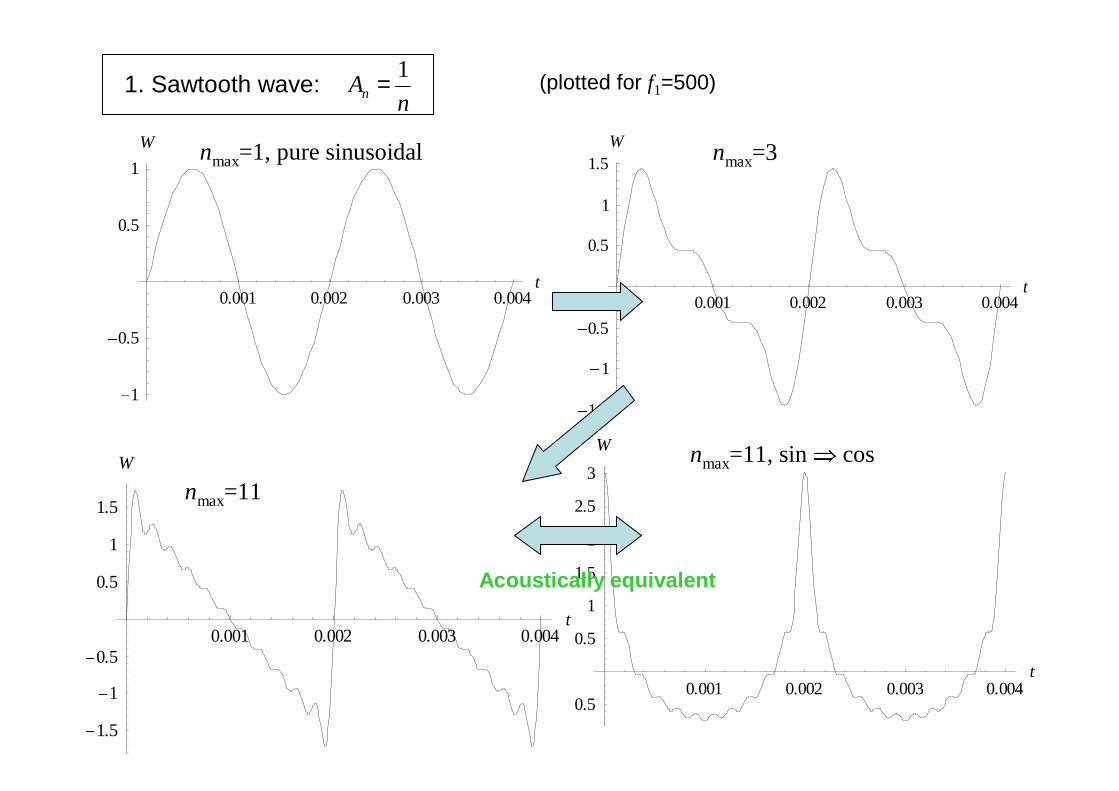
Plots of W(t) that can look complicated are called wave forms. The maximal number of harmonicsnmax is actually infinite but we can take a finite number of harmonics to synthesize a complex wave. The phases ϕn influence the wave form a lot, visually, but the human ear is insensitive to them (thepsychoacoustical Ohm‘s law). What the ear hears is the fundamental frequency (even if it ismissing in the wave form, A1=0!) and the amplitudes An that determine the sound quality or timbre.
Complex waves

2
0.001 0.002 0.003 0.004t
�0.75
� 0.5
�0.25
0.25
0.5
0.75
W
0.001 0.002 0.003 0.004t
�1
�0.5
0.5
1
W
0.001 0.002 0.003 0.004t
�1
�0.5
0.5
1
W
0.001 0.002 0.003 0.004t
�1
�0.5
0.5
1
W
Examples of synthesis of complex waves
1. Triangular wave: even for zero and odd for 1
2nn
nAn =
nmax=1, pure sinusoidalnmax=3
nmax=11 nmax=11, cos � sin
(plotted for f1=500)
Acoustically equivalent
3
0.001 0.002 0.003 0.004t
�1.5
�1
�0.5
0.5
1
1.5
W
0.001 0.002 0.003 0.004t
�0.75
�0.5
�0.25
0.25
0.5
0.75
W
0.001 0.002 0.003 0.004t
�0.75
�0.5
�0.25
0.25
0.5
0.75
W
0.001 0.002 0.003 0.004t
�1
�0.5
0.5
1
W
1. Square wave: even for zero and odd for 1
nnn
An =
nmax=1, pure sinusoidalnmax=3
nmax=11 nmax=11, sin � cos
(plotted for f1=500)
Acoustically equivalent
4
0.001 0.002 0.003 0.004t
�1.5
�1
�0.5
0.5
1
1.5W
0.001 0.002 0.003 0.004t
�0.5
0.5
1
1.5
2
2.5
3
W
0.001 0.002 0.003 0.004t
�1.5
�1
�0.5
0.5
1
1.5
W
0.001 0.002 0.003 0.004t
�1
�0.5
0.5
1
W
1. Sawtooth wave: 1
nAn =
nmax=1, pure sinusoidal nmax=3
nmax=11
nmax=11, sin � cos
(plotted for f1=500)
Acoustically equivalent
5
0.001 0.002 0.003 0.004t
�7.5
�5
�2.5
2.5
5
7.5
W
0.001 0.002 0.003 0.004t
�2
2
4
6
8
10
W
0.001 0.002 0.003 0.004t
�1
1
2
3
W
0.001 0.002 0.003 0.004t
�1
�0.5
0.5
1
W
1. Pulse train: 1=nA
nmax=1, pure sinusoidal nmax=3
nmax=11
nmax=11, cos � sin
(plotted for f1=500)
Acoustically equivalent

6
The set of the amplitudes An of a signal (complex wave) is called the Fourier spectrum of the signal. For a periodic signal the Fourier spectrum can be plotted as a series of spikes at the frequencies fn
with the hights proportional to the corresponding amplitudes An.
Fourier spectrum
1000 2000 3000 4000f
5
10
15
20
A
Here is the Fourier spectrum of a square wave. One can see the fundamental frequency f1=500 Hz and odd overtones at 1500 Hz, 2500 Hz, 3500 Hz, etc. Even overtones at 1000 Hz, etc. are absent for the square wave.

7
If the amplitudes An of the complex wave are known, as was the cases above, it is straightforwardto plot its Fourier spectrum. In many cases, to the contrary, the structure of a complex wave isunknown from the beginning, and the problem is to find of which simple harmonic waves thiscomplex wave is composed, that is, what are An.in the formula on p.1. Mathematics tells us that anyperiodic wave can be represented as a sum of a fundamental wave and overtones, and the wholewave can be written in a form similar to that on p.1. There is a mathematical method called Fouriertransformation to obtain the coefficients An, that is, the Fourier spectrum of a signal, from the waveform that can be, say, obtained experimentally, like the recorded sound of a music instrument.
Fourier transformation
Wave form Fourier spectrumFourier transformation
8
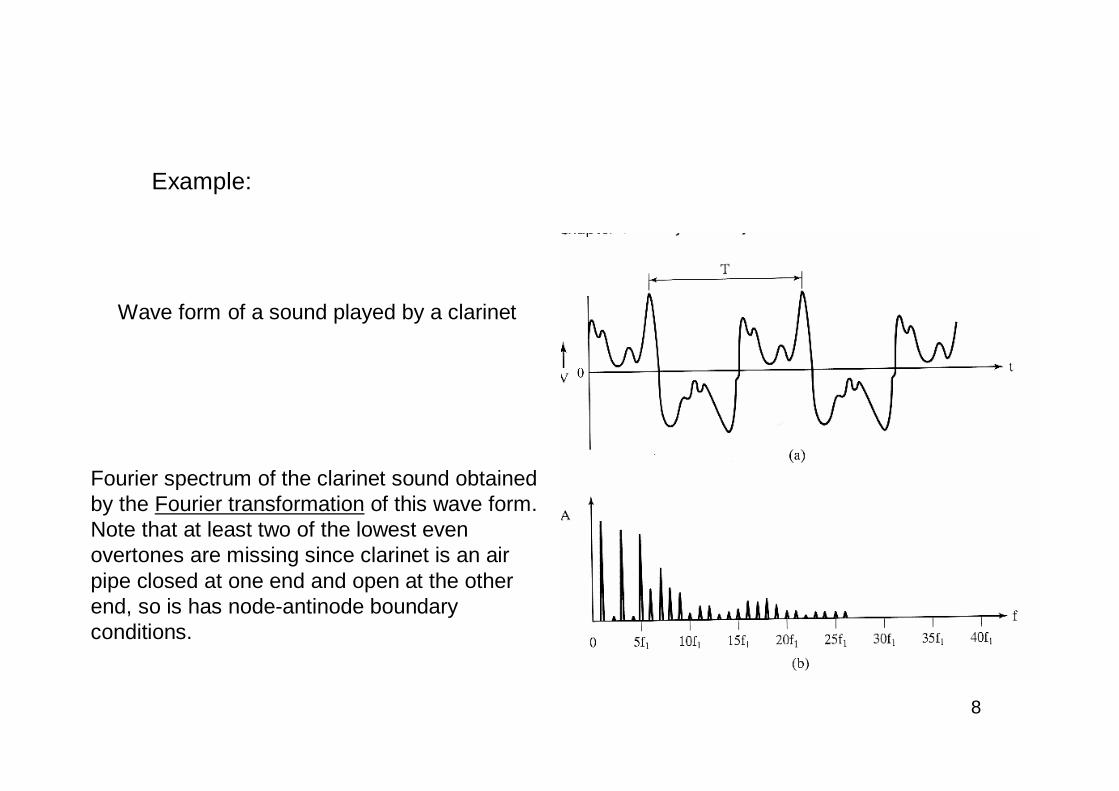
Wave form of a sound played by a clarinet
Fourier spectrum of the clarinet sound obtainedby the Fourier transformation of this wave form. Note that at least two of the lowest evenovertones are missing since clarinet is an airpipe closed at one end and open at the otherend, so is has node-antinode boundaryconditions.
Example:

9
Properties of Fourier spectra
• Fourier spectrum of periodic signals consist of regularly-spaced spikes corresponding to thefundamental and overtones. This is a discrete Fourier spectrum• Fourier spectrum of a superposition of different periodic signals (such as several notes playedat the same time) also consists of spikes, that is, it is discrete. However, these spikes are notequally spaced. Still, one can figure out which spikes correspond to each note, and the spikescorresponding to a given note are equidistant. Obviously a superposition of two signals gives a superposition of two Fourier spectra• If too many different notes sound at the same time, there are too many sets of spikes in theFourier spectrum so that the spikes merge together and the Fourier spectrum becomes a continuous function. This also happens in the case of nonperiodic (nonmusical) signals, such as noises.
Limited usefulness of the Fourier spectra:
Analyzing Fourier spectra of sounds, one can distinguish different music instruments fromeach other. However, it is impossible to distinguish a good violinist playing a good violin froma bad violinins playing a bad violin. For this task, human ear is much better suited than theanalysis of wave forms and Fourier spectra.
10
Formantes
Formante is a part of a Fourier spectrum (a group of harmonics) that is emphesized with respectto the surrounding parts of the spectrum. That is, the harmonics within a formante have a larger amplitudes than others. An example is the formante in the clarinet‘s sound between 15f1 and 20f1. Formantes render the sound of a music instrument and voice a special character. In particular, good singers (even bassos) have formantes at high frequencies that make themaudible through the orchestral part. Also formantes are responsible for formation of different vowels in the speech. As a characteristic of overtons, formantes are responsible for the soundquality, of course.
Sound quality
Simple harmonic oscillation sounds plain. Real sounds including musical sounds have morecharacter due to the overtones present in them. These overtones define the sound quality ortimbre of the sound. Other factors such as the attack and decay affect the perception of thesound no less than the overtones. If one combines the attack played by one instrument with a subsequent sustained sound played by another instrument, the listener can be easily confusedinto thinking that also the sustained sound belongs to the first instrument.
11
Spectrograms
Real sounds, even music sounds, are not strictly periodic. Music sounds have an attack (beginning) and the decay transient, different for different instruments. Also there are superpositions of different sounds, beginning and ending at different moments of time. This makes a problem for definingFourier spectra. Fourier transformation of strictly periodic signals uses only one period, there is no additional information in other parts of the signal. In the case of signals that are nonperiodic or notstrictly periodic, one cannot use just one period. (It is even not defined for a sum of signals withdifferent periods.) Instead, one has to do Fourier transformation using a period of time longer thanone period. In particular, for complex signals that are stable over a significant time interval (such as a sustained sound of an orchestra), the longer the time interval used for making the Fouriertransformation, the more accurate are the Fourier spectra, the spikes are better resolved from eachother.
If a complex signal significantly changes with time (some notes stop, other begin, or different vowels and consonants follow each other in speech), one has to make a compromise choosing thetime interval ∆t for the Fourier transformation. What is done is that for any time t one makes a Fourier transformation using a time interval ∆t centered at t. The resulting Fourier spectrumdepends on the frequency f, as the standard Fourier spectrum, but also on the time t. To representthis function of two variables graphically, one uses 3d plots that are called spectrograms. Usuallyspectrogramms use a gray-scale or color coding of the intensity with t at the horizontal axis and f at the vertical axis (see next page).
12
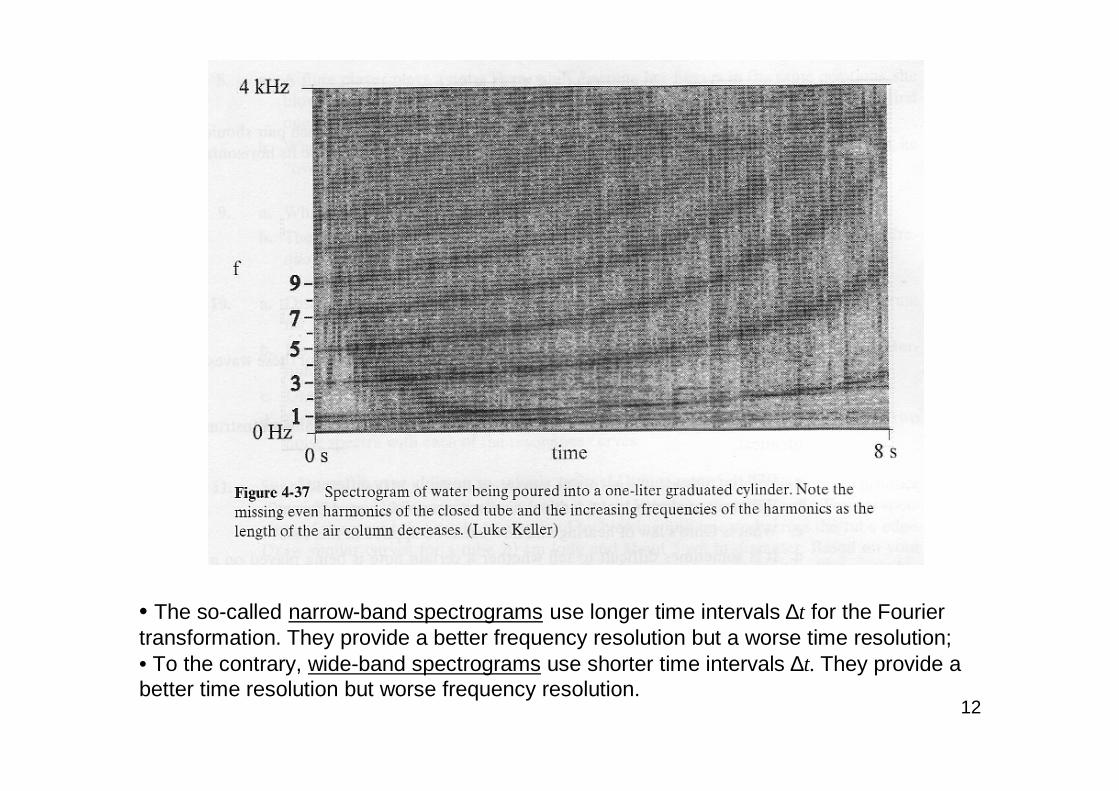
• The so-called narrow-band spectrograms use longer time intervals ∆t for the Fouriertransformation. They provide a better frequency resolution but a worse time resolution;• To the contrary, wide-band spectrograms use shorter time intervals ∆t. They provide a better time resolution but worse frequency resolution.
13
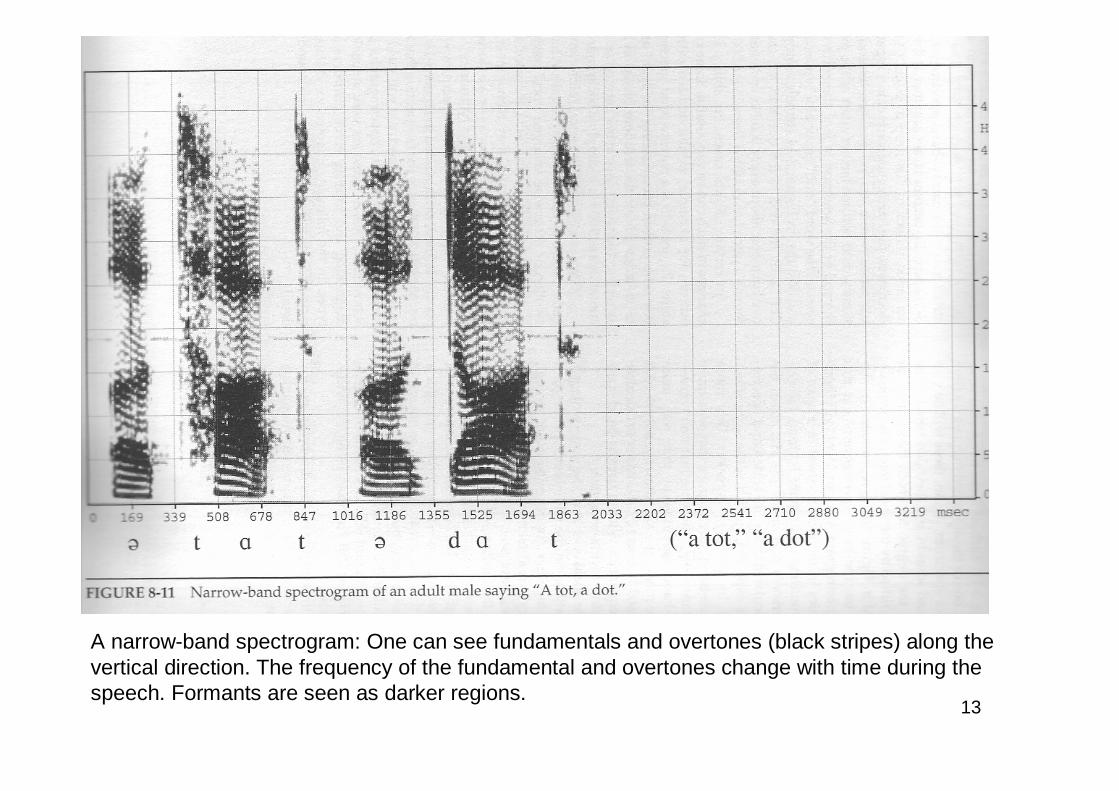
A narrow-band spectrogram: One can see fundamentals and overtones (black stripes) along thevertical direction. The frequency of the fundamental and overtones change with time during thespeech. Formants are seen as darker regions.

14
A wide-band spectrogram: One can see formants but the overtones are not resolved. Verticalstriations represent individual glottal pulses.
Related Documents