Photovoltaic arrays in German municipalities Dipl.-Ing. Markus Bauer IHK Zetis GmbH, Germany

Photovoltaic arrays in German municipalities Dipl.-Ing. Markus Bauer IHK Zetis GmbH, Germany.
Dec 18, 2015
Welcome message from author
This document is posted to help you gain knowledge. Please leave a comment to let me know what you think about it! Share it to your friends and learn new things together.
Transcript
Photovoltaic arrays inGerman municipalities
Dipl.-Ing. Markus Bauer
IHK Zetis GmbH, Germany
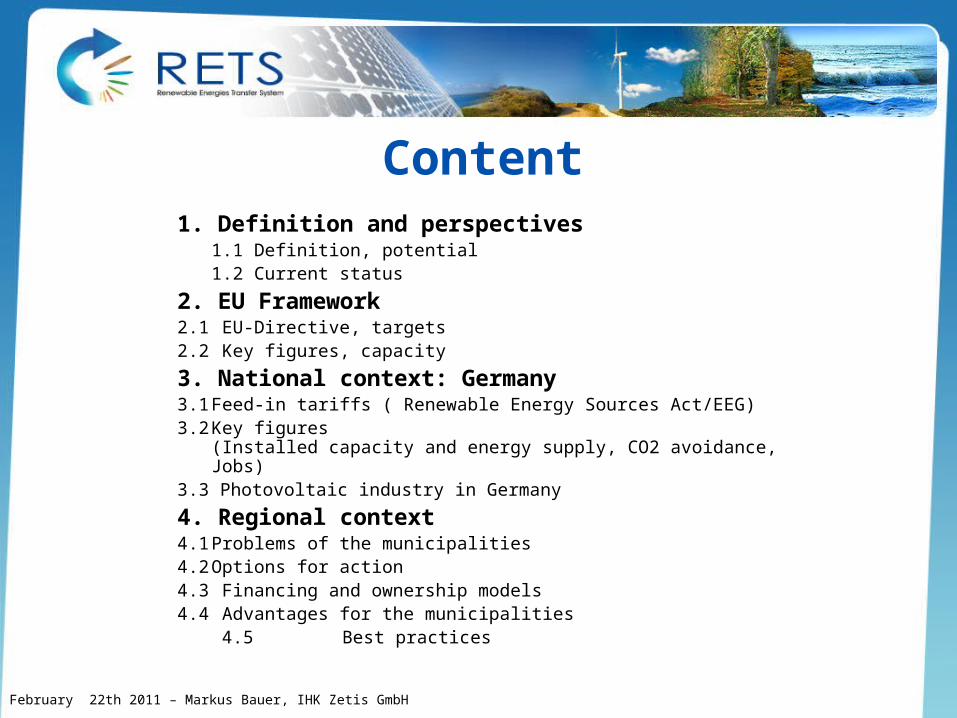
Content1. Definition and perspectives
1.1 Definition, potential1.2 Current status
2. EU Framework2.1 EU-Directive, targets2.2 Key figures, capacity
3. National context: Germany3.1 Feed-in tariffs ( Renewable Energy Sources Act/EEG)3.2 Key figures
(Installed capacity and energy supply, CO2 avoidance, Jobs)3.3 Photovoltaic industry in Germany
4. Regional context4.1 Problems of the municipalities4.2 Options for action4.3 Financing and ownership models4.4 Advantages for the municipalities
4.5 Best practices
February 22th 2011 – Markus Bauer, IHK Zetis GmbH
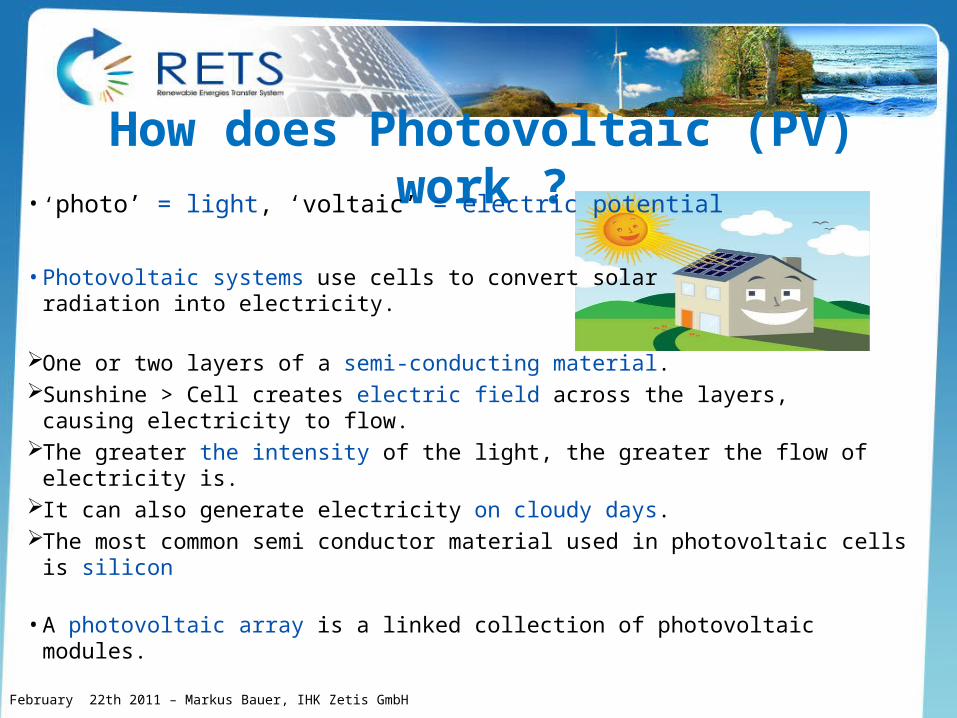
How does Photovoltaic (PV) work ?• ‘photo’ = light, ‘voltaic’ = electric potential
• Photovoltaic systems use cells to convert solarradiation into electricity.
One or two layers of a semi-conducting material. Sunshine > Cell creates electric field across the layers,
causing electricity to flow. The greater the intensity of the light, the greater the flow of electricity is.It can also generate electricity on cloudy days.The most common semi conductor material used in photovoltaic cells is silicon
• A photovoltaic array is a linked collection of photovoltaic modules.
February 22th 2011 – Markus Bauer, IHK Zetis GmbH
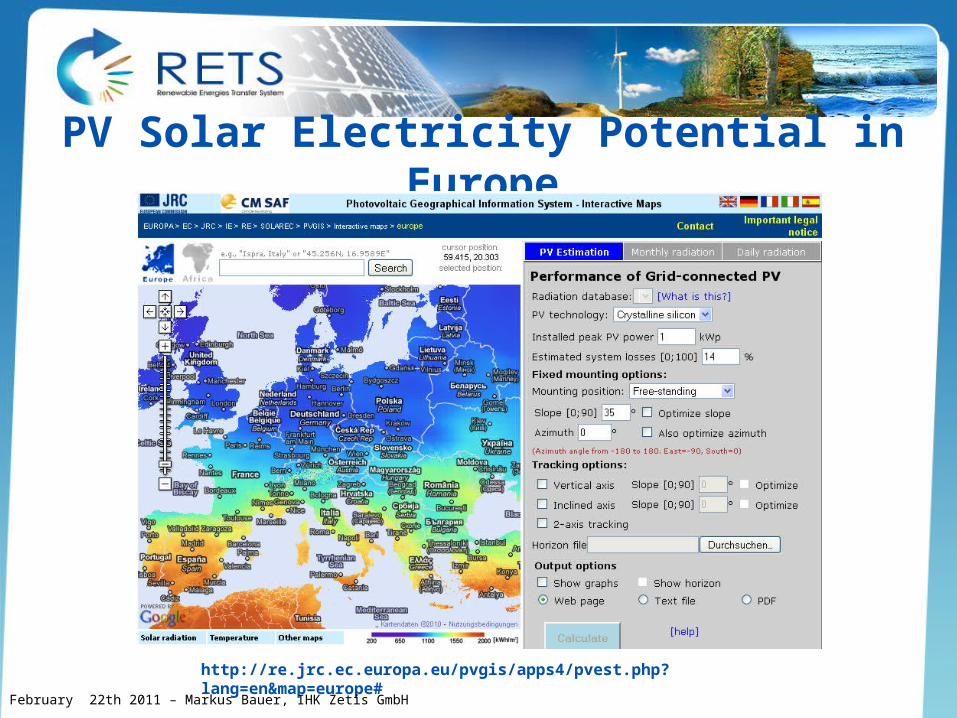
PV Solar Electricity Potential in Europe
http://re.jrc.ec.europa.eu/pvgis/apps4/pvest.php?lang=en&map=europe#
February 22th 2011 – Markus Bauer, IHK Zetis GmbH
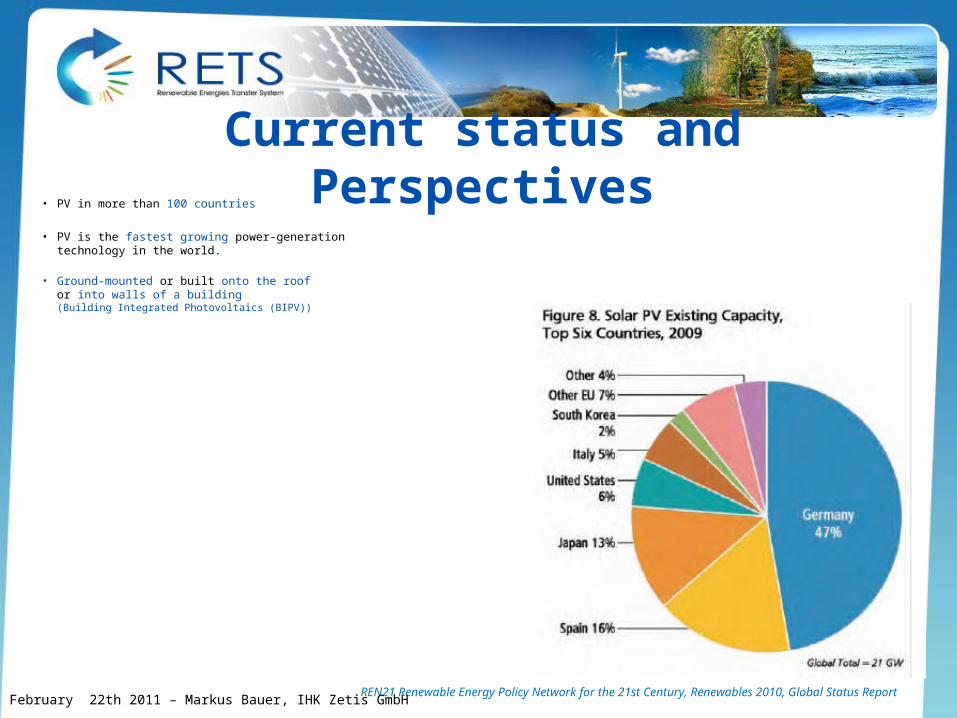
Current status and Perspectives• PV in more than 100 countries
• PV is the fastest growing power-generationtechnology in the world.
• Ground-mounted or built onto the roofor into walls of a building(Building Integrated Photovoltaics (BIPV))
REN21 Renewable Energy Policy Network for the 21st Century, Renewables 2010, Global Status ReportFebruary 22th 2011 – Markus Bauer, IHK Zetis GmbH
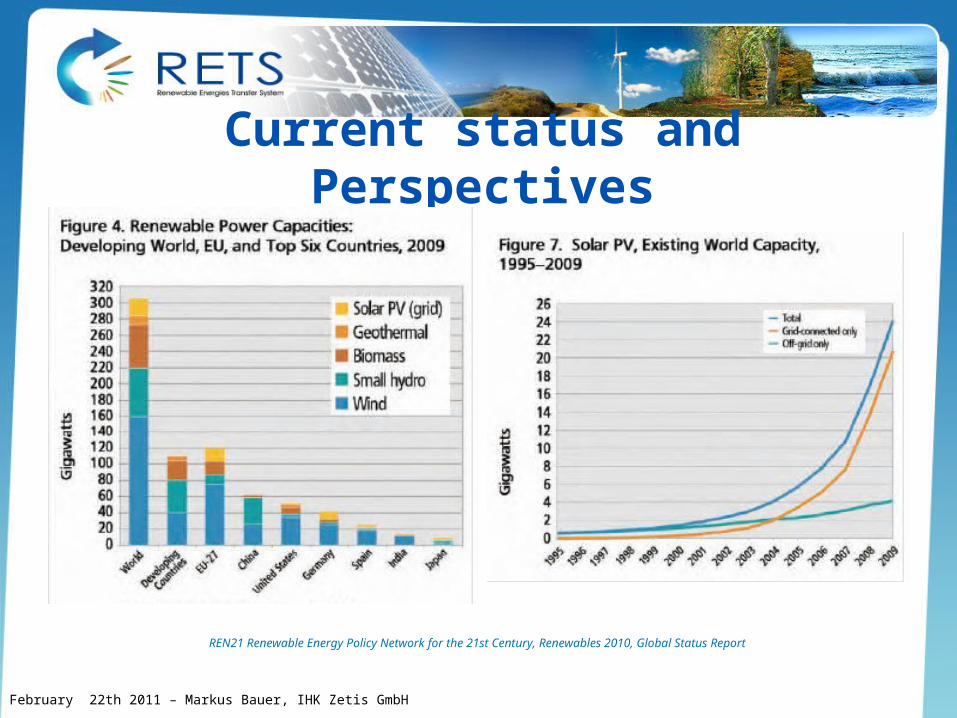
Current status and Perspectives
REN21 Renewable Energy Policy Network for the 21st Century, Renewables 2010, Global Status Report
February 22th 2011 – Markus Bauer, IHK Zetis GmbH
2. EU Policy on energy fromRenewable Energy Sources
February 22th 2011 – Markus Bauer, IHK Zetis GmbH
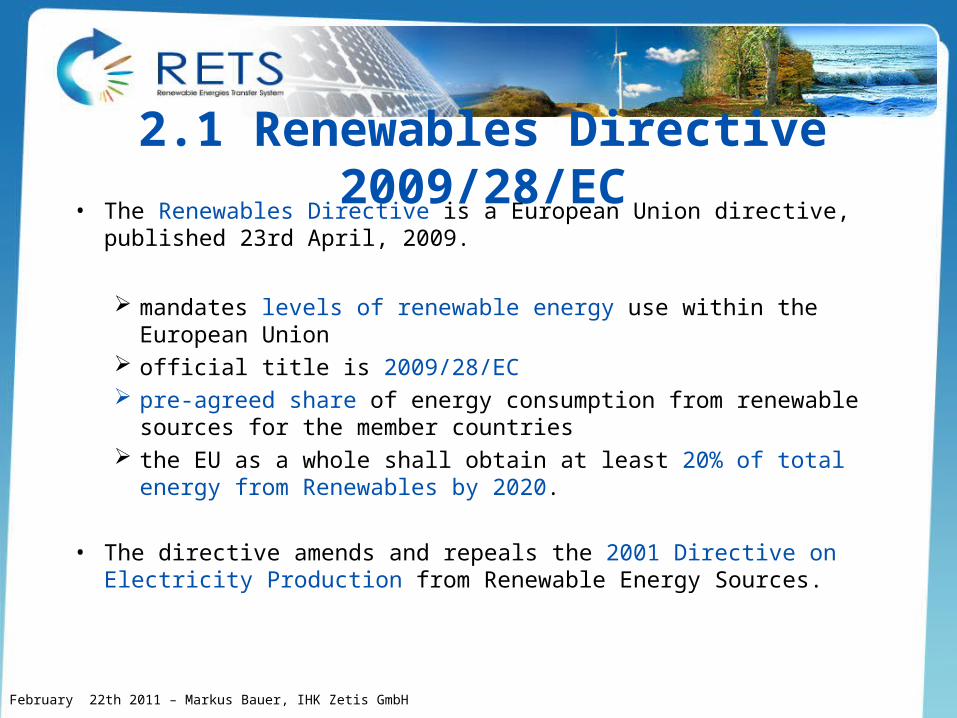
2.1 Renewables Directive 2009/28/EC• The Renewables Directive is a European Union directive,
published 23rd April, 2009.
mandates levels of renewable energy use within the European Union
official title is 2009/28/EC pre-agreed share of energy consumption from renewable
sources for the member countries the EU as a whole shall obtain at least 20% of total energy from
Renewables by 2020.
• The directive amends and repeals the 2001 Directive on Electricity Production from Renewable Energy Sources.
February 22th 2011 – Markus Bauer, IHK Zetis GmbH
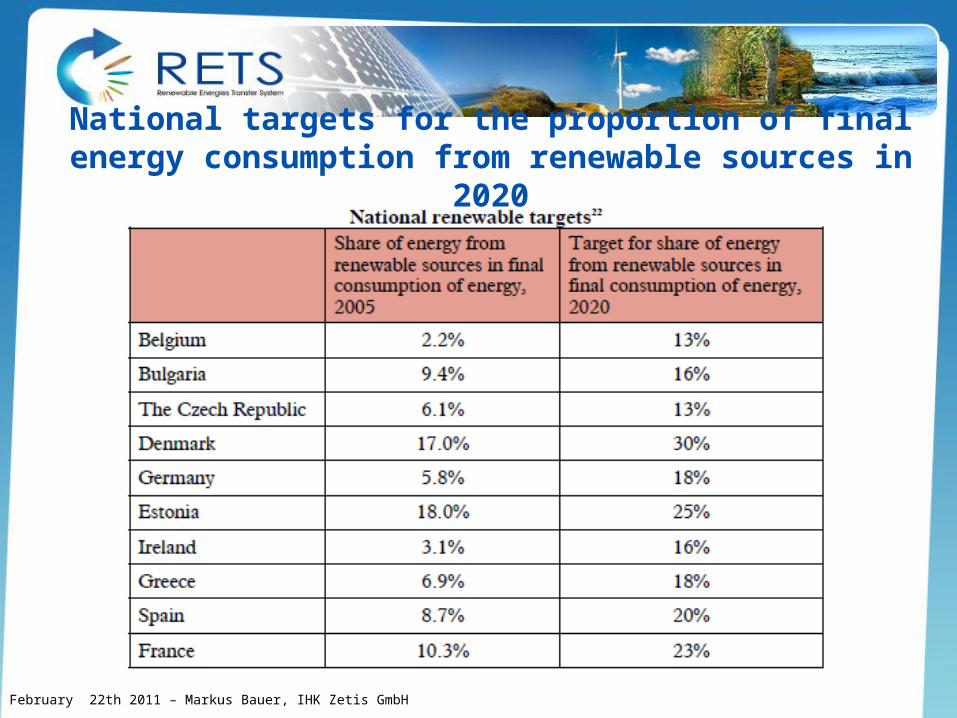
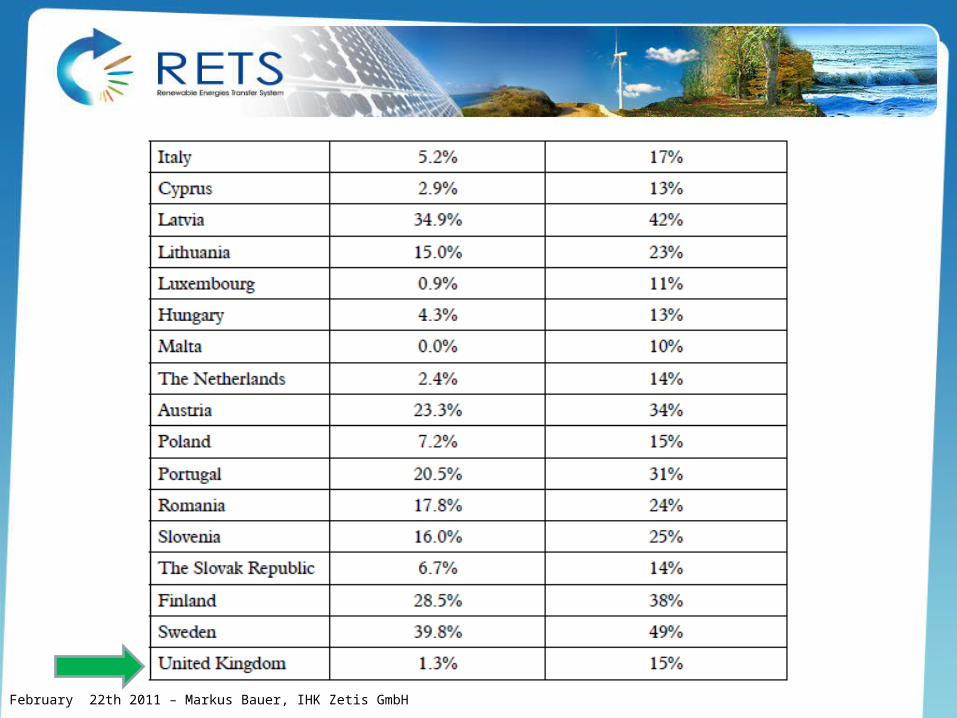
National targets for the proportion of final energy consumption from renewable sources in 2020
February 22th 2011 – Markus Bauer, IHK Zetis GmbH
February 22th 2011 – Markus Bauer, IHK Zetis GmbH
3. German context
An adequate mechanism to develop grid-connectedPhotovoltaic markets
• The European photovoltaic market has been pulled by the successful development of the German market.
• The revision of the Renewable Energy Sources Act (Feed-in-tariff law) in 2003 has confirmed the leadership of Germany with 80% of the European market share.
• It offers customers an attractive price for selling their produced electricity to the utility grid.
3.1 Feed-In Tariff - Renewable Energy Sources Act / EEG
February 22th 2011 – Markus Bauer, IHK Zetis GmbH
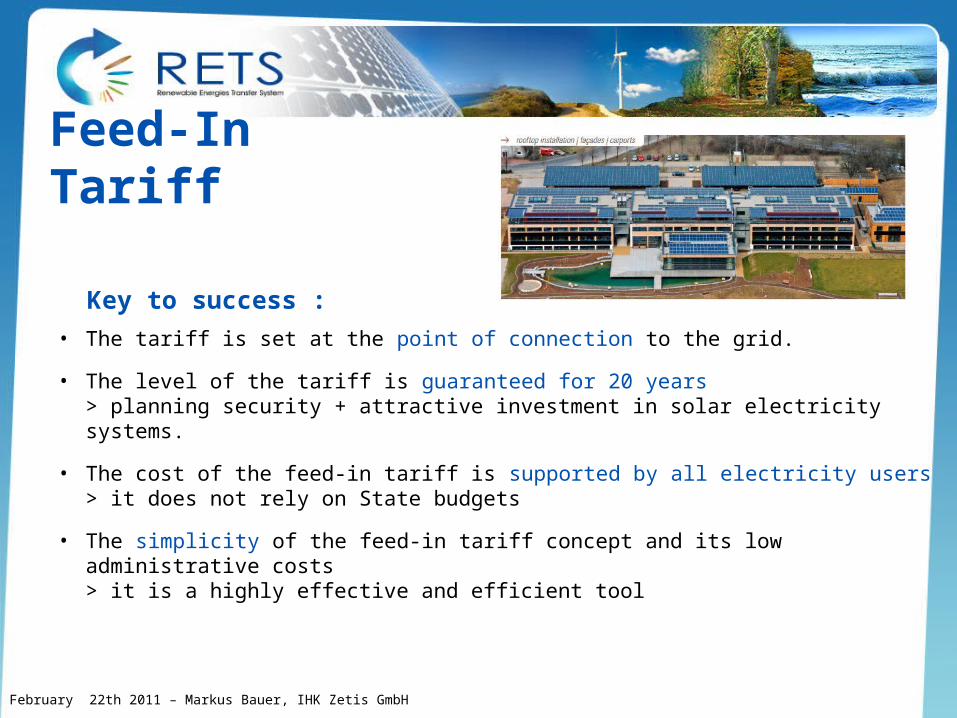
Feed-In Tariff
Key to success :
• The tariff is set at the point of connection to the grid.
• The level of the tariff is guaranteed for 20 years> planning security + attractive investment in solar electricity systems.
• The cost of the feed-in tariff is supported by all electricity users> it does not rely on State budgets
• The simplicity of the feed-in tariff concept and its lowadministrative costs> it is a highly effective and efficient tool
February 22th 2011 – Markus Bauer, IHK Zetis GmbH
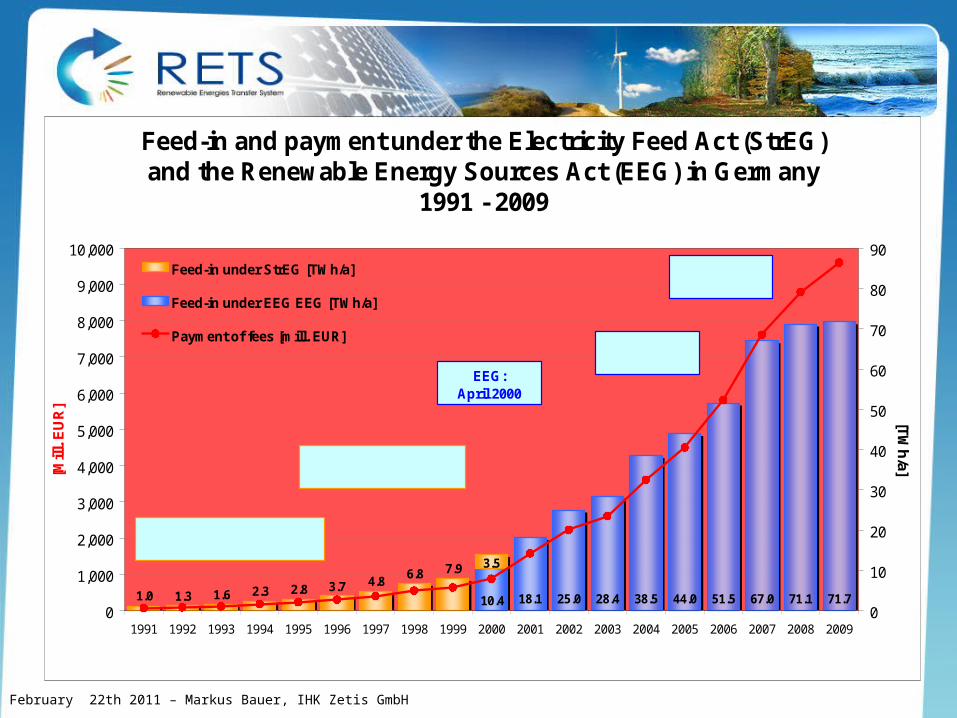
Feed-in and payment under the Electricity Feed Act (StrEG) and the Renewable Energy Sources Act (EEG) in Germany
1991 - 2009
44.0 51.5 67.0 71.1 71.738.518.1 28.425.010.4
7.96.84.8
3.5
3.72.82.31.61.31.00
1,000
2,000
3,000
4,000
5,000
6,000
7,000
8,000
9,000
10,000
1991 1992 1993 1994 1995 1996 1997 1998 1999 2000 2001 2002 2003 2004 2005 2006 2007 2008 2009
[Mill
. EU
R]
0
10
20
30
40
50
60
70
80
90
[TW
h/a]
Feed-in under StrEG [TWh/a]
Feed-in under EEG EEG [TWh/a]
Payment of fees [mill. EUR]
EEG: April 2000
StrEG: January 1991 - March 2000
EEG:August 2004
13.9
EEG:January 2009
StrEG: Act on the Sale of Electricity to the Grid; BauGB: Construction Code; EEG: Renewable Energy Sources Act;Source: BMU-KI III 1 according to Working Group on Renewable Energies-Statistics (AGEE-Stat); Image: BMU / Christoph Edelhoff; all figures provisional
Amendment to BauGB: November 1997
February 22th 2011 – Markus Bauer, IHK Zetis GmbH
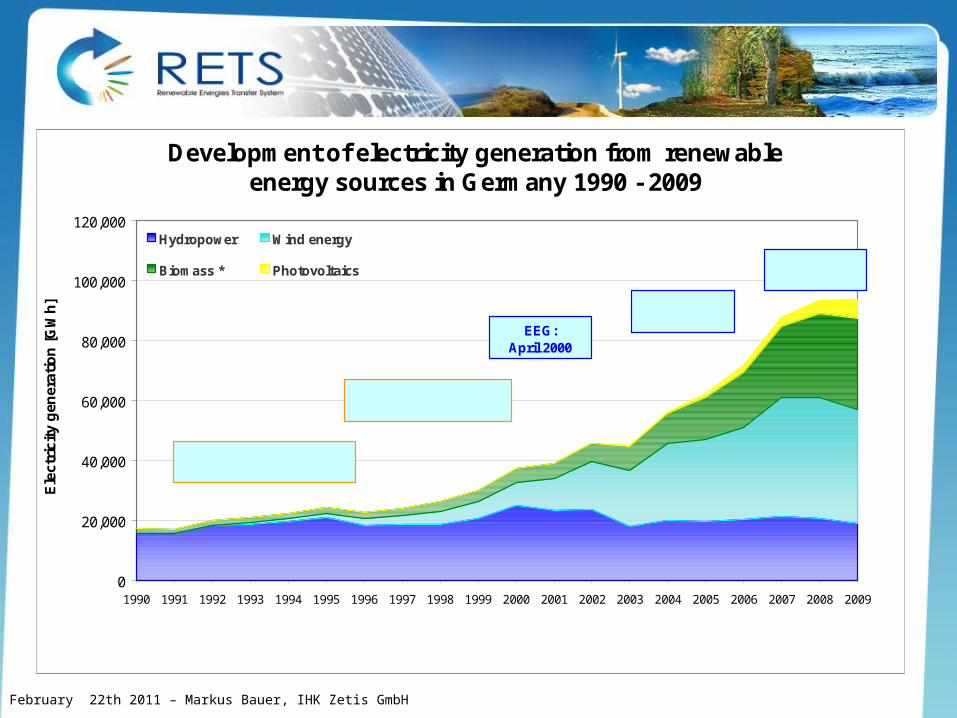
Development of electricity generation from renewable energy sources in Germany 1990 - 2009
0
20,000
40,000
60,000
80,000
100,000
120,000
1990 1991 1992 1993 1994 1995 1996 1997 1998 1999 2000 2001 2002 2003 2004 2005 2006 2007 2008 2009
Ele
ctri
city
gen
erat
ion
[G
Wh
]
Hydropower Wind energy
Biomass * Photovoltaics
EEG:April 2000
EEG:August 2004
StrEG:January 1991 - March 2000
EEG:January 2009
Amendment to BauGB:November 1997
* Solid, liquid, gaseous biomass, biogenic share of waste, landfill and sewage gas; Electricity from geothermal energy is not presented due to the negligible quantities of electricity produced; StrEG: Act on the Sale of Electricity to the Grid; BauGB: Construction Code; EEG: Renewable
Energy Sources Act; Source: BMU-KI III 1 according to Working Group on Renewable Energies-Statistics (AGEE-Stat); Image: BMU / Christoph Edelhoff; all figures provisional
February 22th 2011 – Markus Bauer, IHK Zetis GmbH
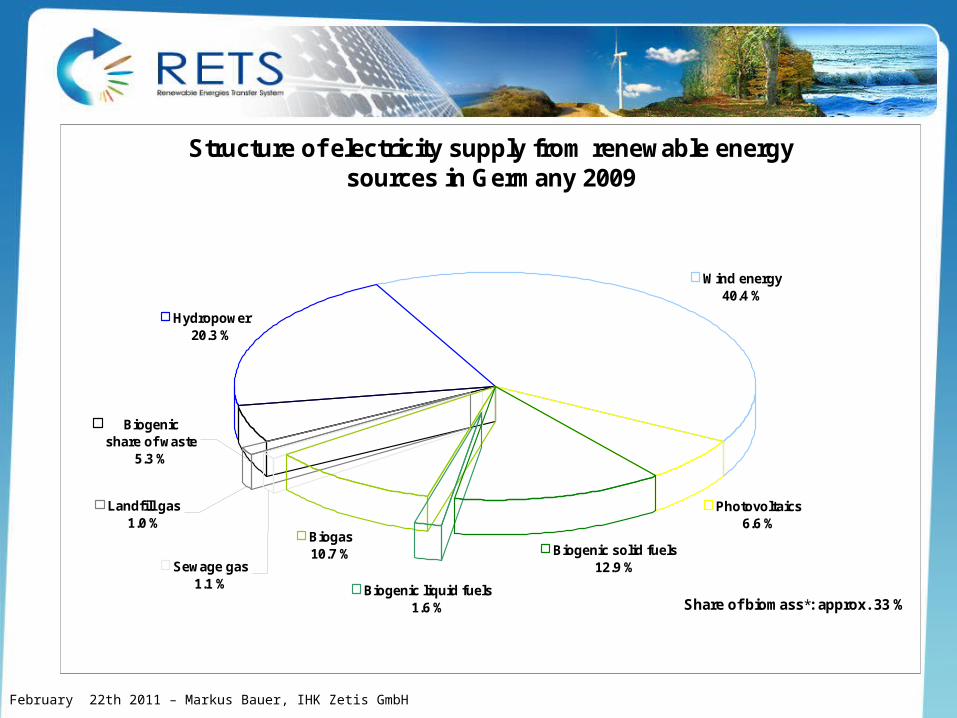
Structure of electricity supply from renewable energy sources in Germany 2009
Hydropower20.3 %
Photovoltaics6.6 %
Landfill gas1.0 %
Biogenic share of waste
5.3 %
Biogenic liquid fuels1.6 %
Biogenic solid fuels12.9 %
Biogas10.7 %
Sewage gas1.1 %
Wind energy40.4 %
Share of biomass*: approx. 33 %
Total: 93.5 TWh
* Solid, liquid, gaseous biomass, biogenic share of waste, landfill and sewage gas; Deviations in the totals are due to rounding;Source: BMU-KI III 1 according to Working Group on Renewable Energies-Statistics (AGEE-Stat); all figures provisional
February 22th 2011 – Markus Bauer, IHK Zetis GmbH
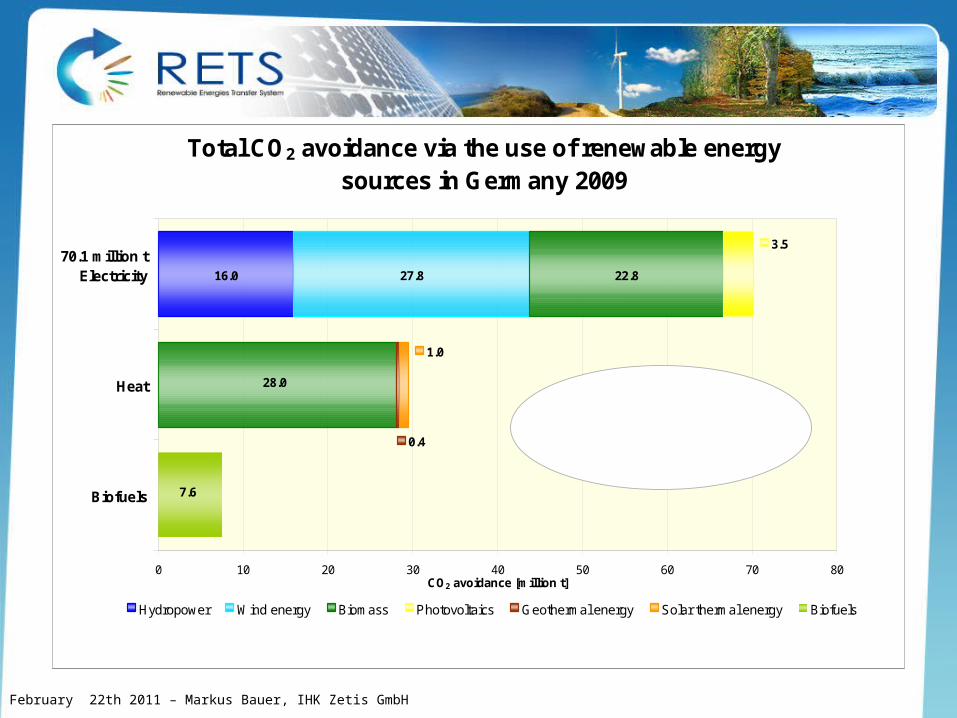
Total CO2 avoidance via the use of renewable energy sources in Germany 2009
16.0 27.8 22.8
28.0
3.5
0.4
1.0
7.6
0 10 20 30 40 50 60 70 80
Biofuels
Heat
Electricity
CO2 avoidance [million t]
Hydropower Wind energy Biomass Photovoltaics Geothermal energy Solar thermal energy Biofuels
70.1 million t
29.4 million t
7.6 million t
EEG: Renewable Energy Sources Act; Deviations in the totals are due to rounding; Source: UBA according to Working Group on Renewable Energies-Statistics (AGEE-Stat); Image: H. G. Oed; all figures provisional
Total: approx. 107 million t CO2,
from this approx. 52 million t CO2
by EEG quantity of electricity recompensed
February 22th 2011 – Markus Bauer, IHK Zetis GmbH
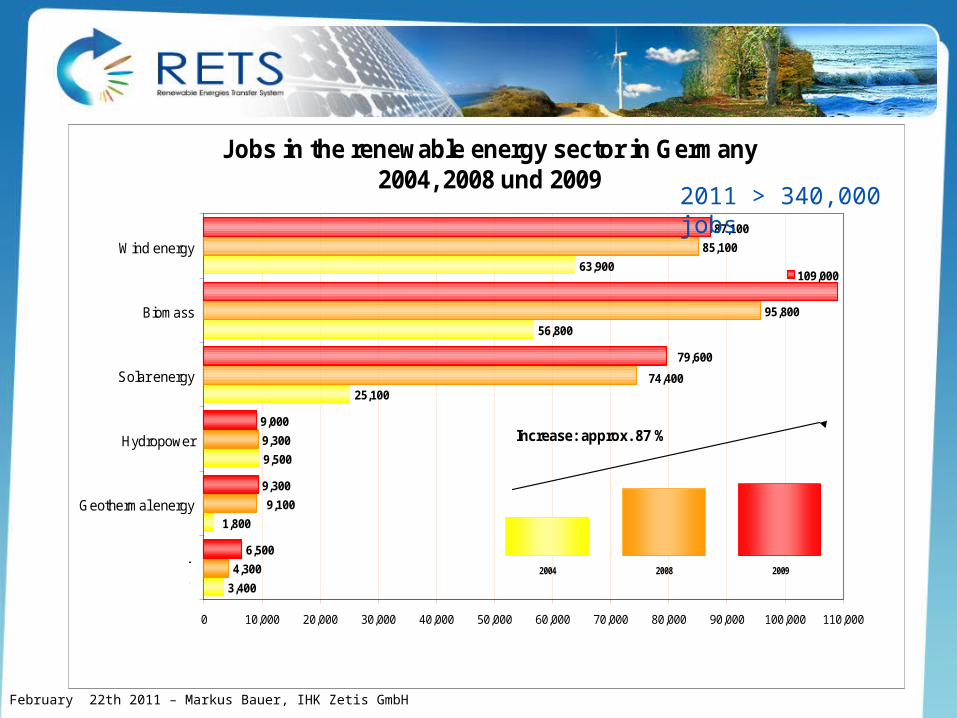
Jobs in the renewable energy sector in Germany 2004, 2008 und 2009
3,400
9,500
56,800
63,900
4,300
9,300
95,800
85,100
6,500
9,300
9,000
87,100
25,100
1,800
74,400
9,100
109,000
79,600
0 10,000 20,000 30,000 40,000 50,000 60,000 70,000 80,000 90,000 100,000 110,000
Geothermal energy
Hydropower
Solar energy
Biomass
Wind energy
Increase: approx. 87 %
Public / non-profit - sector jobs
Figures for 2008 and 2009 are provisional estimate;Source: BMU-KI III Projekt "Gross employment from renewable energy in Germany in the year 2009, a first estimate"; Image: BMU / Christoph Busse / transit
2004 2008 2009
160,500employments
278,000employments
300,500employments
February 22th 2011 – Markus Bauer, IHK Zetis GmbH
2011 > 340,000 jobs
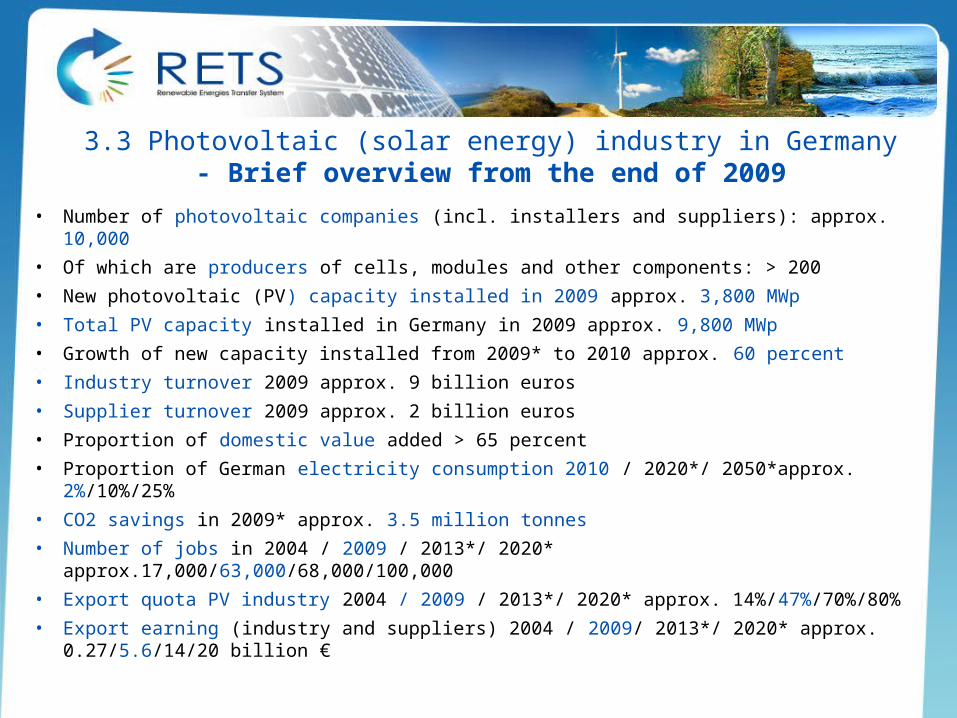
3.3 Photovoltaic (solar energy) industry in Germany - Brief overview from the end of 2009
• Number of photovoltaic companies (incl. installers and suppliers): approx. 10,000
• Of which are producers of cells, modules and other components: > 200
• New photovoltaic (PV) capacity installed in 2009 approx. 3,800 MWp
• Total PV capacity installed in Germany in 2009 approx. 9,800 MWp
• Growth of new capacity installed from 2009* to 2010 approx. 60 percent
• Industry turnover 2009 approx. 9 billion euros
• Supplier turnover 2009 approx. 2 billion euros
• Proportion of domestic value added > 65 percent
• Proportion of German electricity consumption 2010 / 2020*/ 2050*approx. 2%/10%/25%
• CO2 savings in 2009* approx. 3.5 million tonnes
• Number of jobs in 2004 / 2009 / 2013*/ 2020* approx.17,000/63,000/68,000/100,000
• Export quota PV industry 2004 / 2009 / 2013*/ 2020* approx. 14%/47%/70%/80%
• Export earning (industry and suppliers) 2004 / 2009/ 2013*/ 2020* approx. 0.27/5.6/14/20 billion €
4. Regional context
4.1 Problems of the municipalities• Political majorities• Public acceptance• Municipal budgets• Higher administrations / authorities > Veto• Lack of competence• Unclear ownership structure• Time frame
February 22th 2011 – Markus Bauer, IHK Zetis GmbH
4.2 Options for action> direct influence:• Urban land use planning and land consolidation planning /
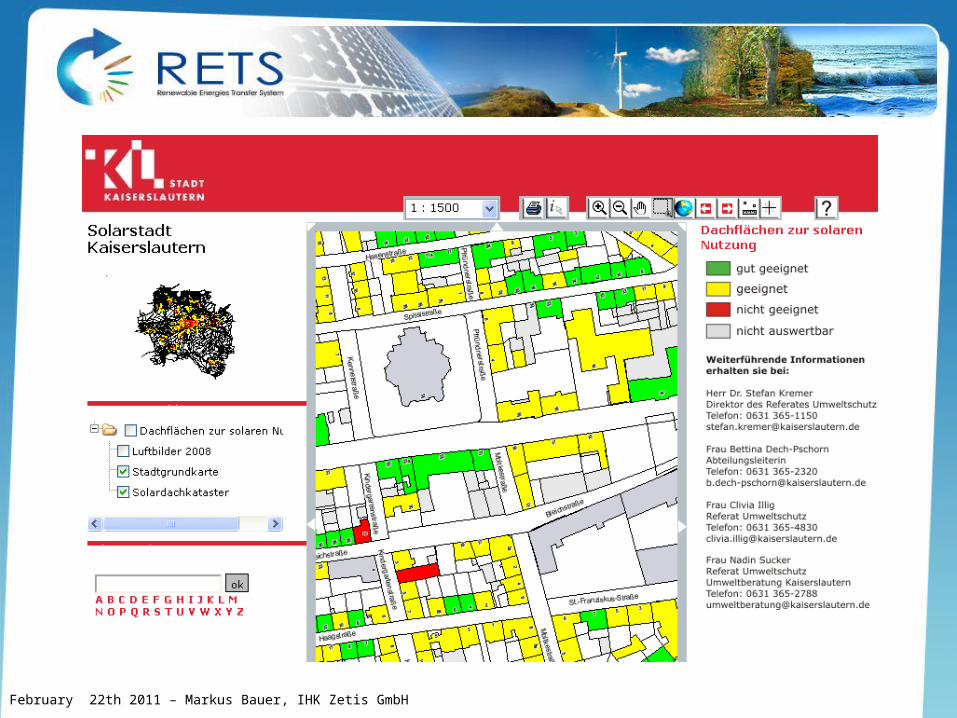
building law• Construction and operation of own PV systems• Solar Roof Exchange Markets/ register
> indirect influence• Citizens advice on technical issues
and support programs• Local promotion / aid• Local Public Relations
February 22th 2011 – Markus Bauer, IHK Zetis GmbH
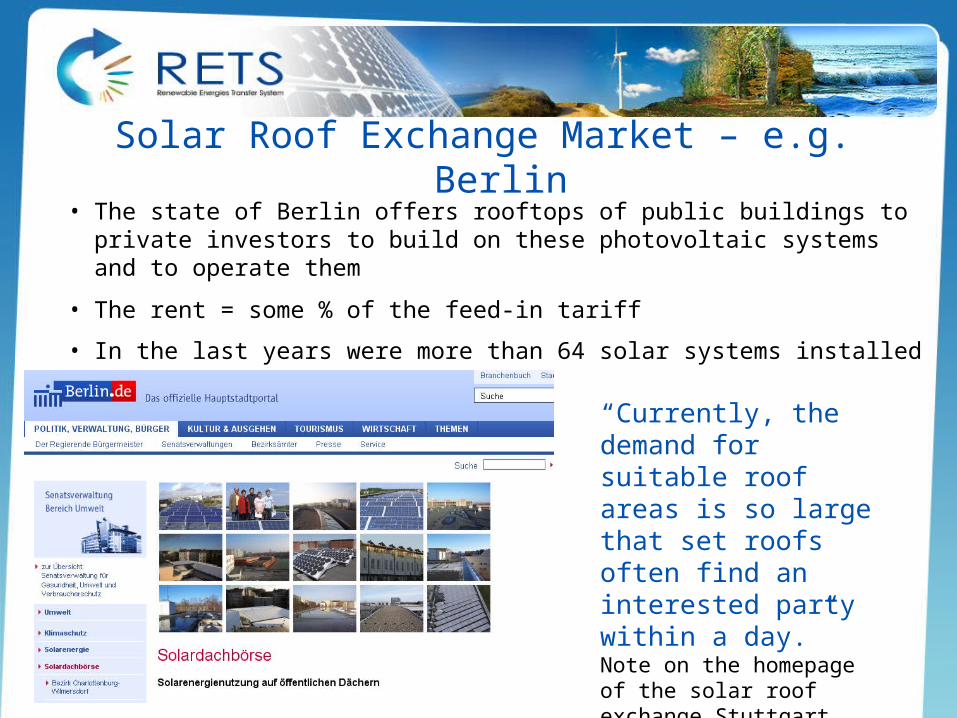
Solar Roof Exchange Market – e.g. Berlin• The state of Berlin offers rooftops of public buildings to private
investors to build on these photovoltaic systems and to operate them
• The rent = some % of the feed-in tariff
• In the last years were more than 64 solar systems installed
“Currently, the demand for suitable roof areas is so large that set roofs often find an interested party within a day.”Note on the homepage of the solar roof exchange Stuttgart
February 22th 2011 – Markus Bauer, IHK Zetis GmbH
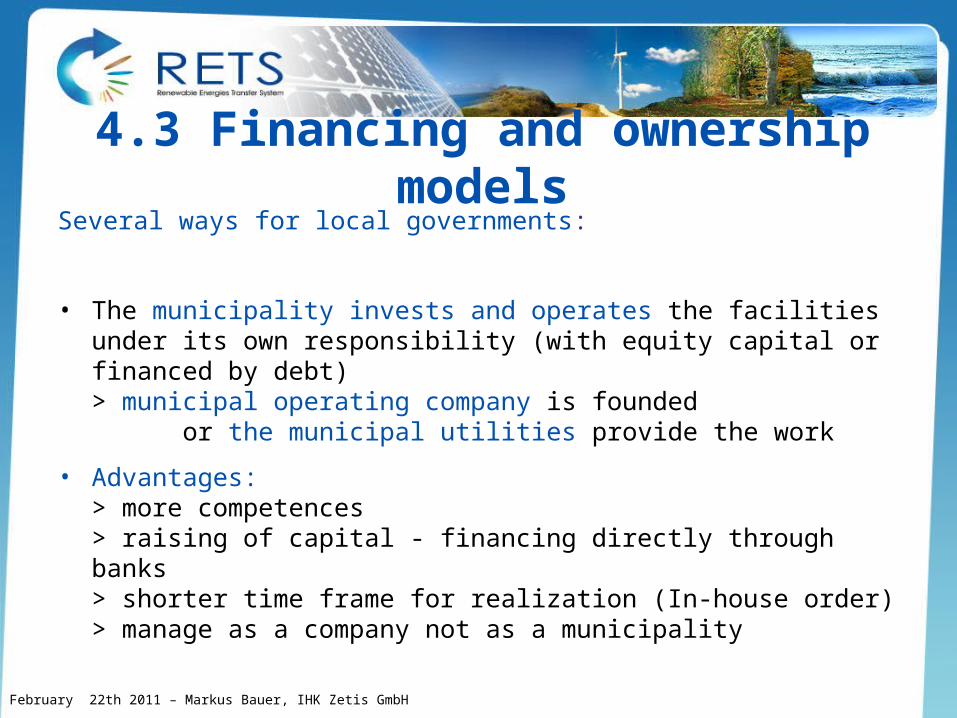
4.3 Financing and ownership modelsSeveral ways for local governments:
• The municipality invests and operates the facilities under its own responsibility (with equity capital or financed by debt)> municipal operating company is founded
or the municipal utilities provide the work
• Advantages:> more competences> raising of capital - financing directly through banks> shorter time frame for realization (In-house order)> manage as a company not as a municipality
February 22th 2011 – Markus Bauer, IHK Zetis GmbH
• A contractor could build and operate the PV-array for the municipality
> The contracting company takes charge of planning, construction and operation of the facility
>The municipality then pays the energy from those facilities for a fixed time frame
Citizens’ solar plants – cooperative associations
• Citizens join forces to establish an operating company and finance the project through corresponding shares.
• The municipality can offer suitable areas for free on municipal roofs or grounds
• Each participant invests a contribution to establish a common solar plant
• Motivation: to promote the PV and to make a20-year-well-secured investment (feed-in tariffs) , ROI 4-8%
• Form of organization: civil law association or cooperative associations
• Planning and operating companies take care for> planning, construction, financing and management> Community creates the legal requirements in the area of planning and permit.
• Professional investors (e.g. banks) buy PV projects and offer their customers the shares as a capital investment of an investment fund.
>>> The municipality does not have to be financially strong to use photovoltaic arrays.<<<
February 22th 2011 – Markus Bauer, IHK Zetis GmbH
4.4 Advantages for the municipalties
• Solar energy is free
• Produces no noise, high public acceptance
• Minimal maintenance required to keep the system running
• Modular systems can be quickly installed and easily expanded
• Climate protection
• Financial income (Feed-In Tariff, tax)
• Image improvement
• Generate local jobs
• New perspectives for the rural areas
February 22th 2011 – Markus Bauer, IHK Zetis GmbH
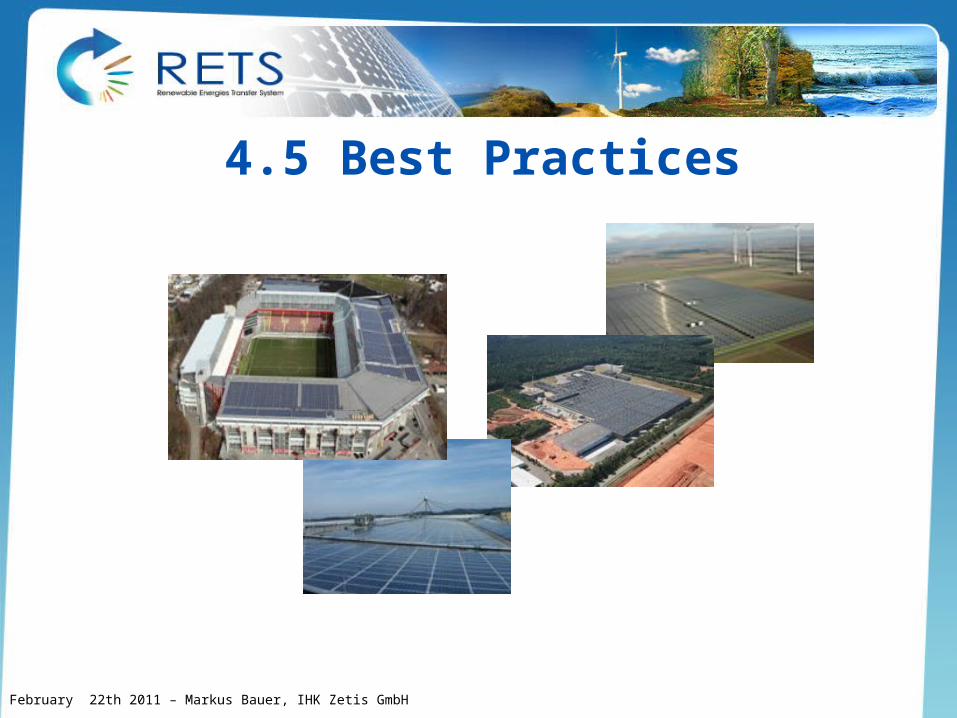
4.5 Best Practices
February 22th 2011 – Markus Bauer, IHK Zetis GmbH
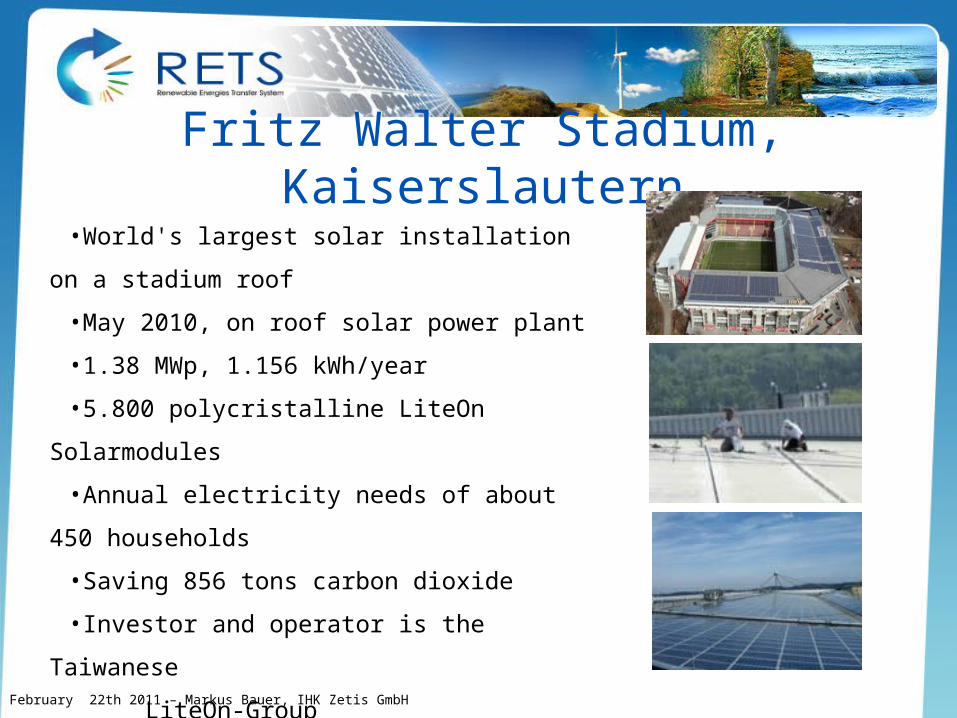
Fritz Walter Stadium, Kaiserslautern
•World's largest solar installation on a stadium roof
•May 2010, on roof solar power plant
•1.38 MWp, 1.156 kWh/year
•5.800 polycristalline LiteOn Solarmodules
•Annual electricity needs of about 450 households
•Saving 856 tons carbon dioxide
•Investor and operator is the Taiwanese
LiteOn-Group
•5 Mio. Euros Investment •Installed by the local partnerSOLAR ENERGIEDACH GmbH, Sembach
February 22th 2011 – Markus Bauer, IHK Zetis GmbH
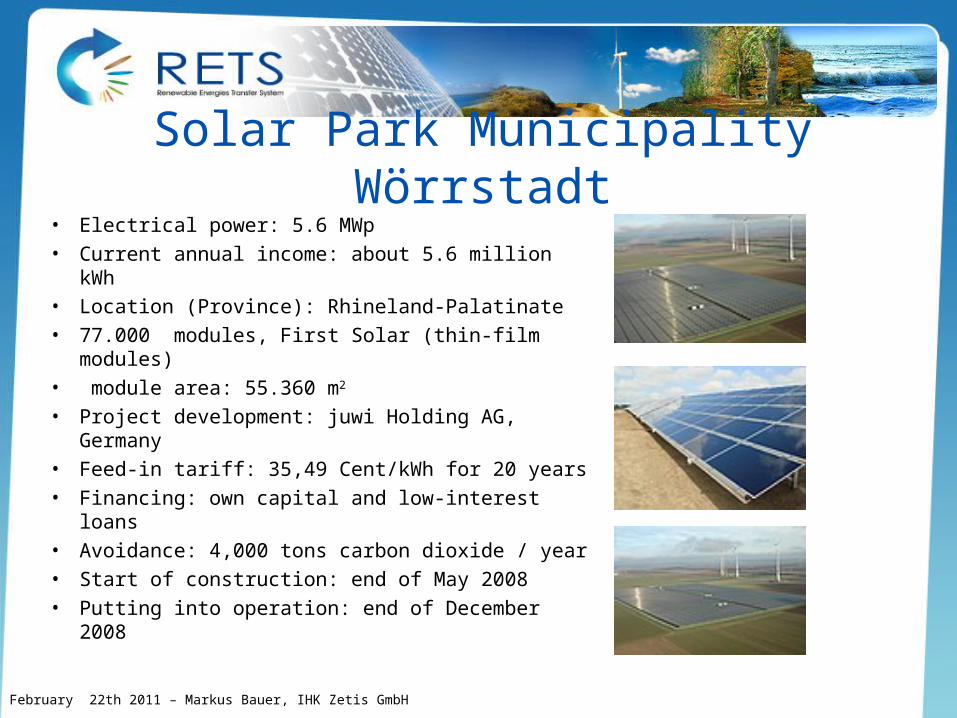
Solar Park Municipality Wörrstadt• Electrical power: 5.6 MWp
• Current annual income: about 5.6 million kWh
• Location (Province): Rhineland-Palatinate
• 77.000 modules, First Solar (thin-film modules)
• module area: 55.360 m2
• Project development: juwi Holding AG, Germany
• Feed-in tariff: 35,49 Cent/kWh for 20 years
• Financing: own capital and low-interest loans
• Avoidance: 4,000 tons carbon dioxide / year
• Start of construction: end of May 2008
• Putting into operation: end of December 2008
February 22th 2011 – Markus Bauer, IHK Zetis GmbH
Thank you for your attention.
IHK Zetis GmbH
Europaallee 10
67657 Kaiserslautern
www.zetis.de
Germany
February 22th 2011 – Markus Bauer, IHK Zetis GmbH
Related Documents