MNRAS 449, 1679–1685 (2015) doi:10.1093/mnras/stv365 Photospheric logarithmic velocity spirals as MHD wave generation mechanisms S. J. Mumford 1 ‹ and R. Erd´ elyi 1, 2 1 Solar Physics & Space Plasma Research Centre (SP 2 RC), School of Mathematics and Statistics, The University of Sheffield, Hicks Building, Hounsfield Road, Sheffield S3 7RH, UK 2 Debrecen Heliophysical Observatory, Research Centre for Astronomy and Earth Sciences, Hungarian Academy of Science, 4010 Debrecen, PO Box 30, Hungary Accepted 2015 February 17. Received 2015 February 12; in original form 2015 January 8 ABSTRACT High-resolution observations of the solar photosphere have identified a wide variety of spi- ralling motions in the solar plasma. These spirals vary in properties, but are observed to be abundant at the solar surface. In this work, these spirals are studied for their potential as magnetohydrodynamic (MHD) wave generation mechanisms. The inter-granular lanes, where these spirals are commonly observed, are also regions where the magnetic field strength is higher than average. This combination of magnetic field and spiralling plasma is a recipe for the generation of Alfv´ en waves and other MHD waves. This work employs numerical simu- lations of a self-similar magnetic flux tube embedded in a realistic, gravitationally stratified, solar atmosphere to study the effects of a single magnetic flux tube perturbed by a logarith- mic velocity spiral driver. The expansion factor of the logarithmic spiral driver is varied and multiple simulations are run for a range of values of the expansion factor centred around observational constraints. The simulations are analysed using ‘flux surfaces’ constructed from the magnetic field lines so that the vectors perpendicular, parallel and azimuthal to the local magnetic field vector can be calculated. The results of this analysis show that the Alfv´ en wave is the dominant wave for lower values of the expansion factor, whereas for the higher values the parallel component is dominant. This transition occurs within the range of the observa- tional constraints, meaning that spiral drivers, as observed in the solar photosphere, have the potential to generate a variety of MHD wave modes. Key words: MHD – waves – methods: numerical – Sun: oscillations – Sun: photosphere. 1 INTRODUCTION The solar atmosphere is a highly dynamic, often unpredictable and turbulent environment. It also has a direct impact on the Earth, with events such as Coronal Mass Ejections causing geomagnetic storms which can disrupt systems such as satellites and power grids. The outermost layer of the solar atmosphere, the corona, is observed to be heated to millions of degrees kelvin. This hot plasma requires a constant energy input to prevent it from cooling, and the mechanism by which this energy is transferred into the corona is a subject of intense study. The source of the energy is in the photosphere and the internal deeper regions of the Sun. The solar photosphere is a highly dynamic region of the solar atmosphere, with hot plasma rising up from the convection region, radiating and sinking back down within inter-granular lanes. Com- bined with this are multiscale magnetic fields which intersect the E-mail: s.mumford@sheffield.ac.uk photosphere and one outcome is the generation of magnetohydro- dynamic (MHD) waves by various driving motions and at different frequencies. These MHD waves are generated in a variety of verti- cal or near-vertical magnetic structures, which connect the different layers of the gravitationally stratified solar atmosphere. This yields a potential mechanism for energy transport vertically through the solar atmosphere, along these magnetic structures, which has been widely studied as a potential solution to the coronal heating problem. This, MHD wave heating of the solar atmosphere, has been studied analytically (e.g. Andries et al. 2009; Wang 2011), observation- ally (e.g. Bogdan & Judge 2006; Kobanov, Kolobov & Makarchik 2006; Jess et al. 2009; Taroyan & Erd´ elyi 2009; Morton et al. 2012; Dorotoviˇ c et al. 2014) and numerically (e.g. Bogdan et al. 2003; Hasan & van Ballegooijen 2008; Fedun et al. 2011; Scullion et al. 2011; Vigeesh et al. 2012; Wedemeyer-B¨ ohm et al. 2012). This work, as a follow-up to Mumford, Fedun & Erd´ elyi (2015), investigates the effect of logarithmic spiral-type velocity drivers in the solar photosphere and their properties as MHD wave gen- eration mechanisms. Mumford et al. (2015) studied five different C The Authors 2015. Published by Oxford University Press on behalf of The Royal Astronomical Society. This is an Open Access article distributed under the terms of the Creative Commons Attribution License (http://creativecommons.org/licenses/by/4.0/), which permits unrestricted reuse, distribution, and reproduction in any medium, provided the original work is properly cited. Downloaded from https://academic.oup.com/mnras/article/449/2/1679/1074146 by guest on 04 July 2022

Welcome message from author
This document is posted to help you gain knowledge. Please leave a comment to let me know what you think about it! Share it to your friends and learn new things together.
Transcript
MNRAS 449, 1679–1685 (2015) doi:10.1093/mnras/stv365
Photospheric logarithmic velocity spirals as MHD wavegeneration mechanisms
S. J. Mumford1‹ and R. Erdelyi1,2
1Solar Physics & Space Plasma Research Centre (SP2RC), School of Mathematics and Statistics, The University of Sheffield, Hicks Building, HounsfieldRoad, Sheffield S3 7RH, UK2Debrecen Heliophysical Observatory, Research Centre for Astronomy and Earth Sciences, Hungarian Academy of Science, 4010 Debrecen, PO Box 30,Hungary
Accepted 2015 February 17. Received 2015 February 12; in original form 2015 January 8
ABSTRACTHigh-resolution observations of the solar photosphere have identified a wide variety of spi-ralling motions in the solar plasma. These spirals vary in properties, but are observed to beabundant at the solar surface. In this work, these spirals are studied for their potential asmagnetohydrodynamic (MHD) wave generation mechanisms. The inter-granular lanes, wherethese spirals are commonly observed, are also regions where the magnetic field strength ishigher than average. This combination of magnetic field and spiralling plasma is a recipe forthe generation of Alfven waves and other MHD waves. This work employs numerical simu-lations of a self-similar magnetic flux tube embedded in a realistic, gravitationally stratified,solar atmosphere to study the effects of a single magnetic flux tube perturbed by a logarith-mic velocity spiral driver. The expansion factor of the logarithmic spiral driver is varied andmultiple simulations are run for a range of values of the expansion factor centred aroundobservational constraints. The simulations are analysed using ‘flux surfaces’ constructed fromthe magnetic field lines so that the vectors perpendicular, parallel and azimuthal to the localmagnetic field vector can be calculated. The results of this analysis show that the Alfven waveis the dominant wave for lower values of the expansion factor, whereas for the higher valuesthe parallel component is dominant. This transition occurs within the range of the observa-tional constraints, meaning that spiral drivers, as observed in the solar photosphere, have thepotential to generate a variety of MHD wave modes.
Key words: MHD – waves – methods: numerical – Sun: oscillations – Sun: photosphere.
1 IN T RO D U C T I O N
The solar atmosphere is a highly dynamic, often unpredictable andturbulent environment. It also has a direct impact on the Earth, withevents such as Coronal Mass Ejections causing geomagnetic stormswhich can disrupt systems such as satellites and power grids. Theoutermost layer of the solar atmosphere, the corona, is observed tobe heated to millions of degrees kelvin. This hot plasma requires aconstant energy input to prevent it from cooling, and the mechanismby which this energy is transferred into the corona is a subject ofintense study. The source of the energy is in the photosphere andthe internal deeper regions of the Sun.
The solar photosphere is a highly dynamic region of the solaratmosphere, with hot plasma rising up from the convection region,radiating and sinking back down within inter-granular lanes. Com-bined with this are multiscale magnetic fields which intersect the
� E-mail: [email protected]
photosphere and one outcome is the generation of magnetohydro-dynamic (MHD) waves by various driving motions and at differentfrequencies. These MHD waves are generated in a variety of verti-cal or near-vertical magnetic structures, which connect the differentlayers of the gravitationally stratified solar atmosphere. This yieldsa potential mechanism for energy transport vertically through thesolar atmosphere, along these magnetic structures, which has beenwidely studied as a potential solution to the coronal heating problem.This, MHD wave heating of the solar atmosphere, has been studiedanalytically (e.g. Andries et al. 2009; Wang 2011), observation-ally (e.g. Bogdan & Judge 2006; Kobanov, Kolobov & Makarchik2006; Jess et al. 2009; Taroyan & Erdelyi 2009; Morton et al. 2012;Dorotovic et al. 2014) and numerically (e.g. Bogdan et al. 2003;Hasan & van Ballegooijen 2008; Fedun et al. 2011; Scullion et al.2011; Vigeesh et al. 2012; Wedemeyer-Bohm et al. 2012).
This work, as a follow-up to Mumford, Fedun & Erdelyi (2015),investigates the effect of logarithmic spiral-type velocity driversin the solar photosphere and their properties as MHD wave gen-eration mechanisms. Mumford et al. (2015) studied five different
C© The Authors 2015. Published by Oxford University Press on behalf of The Royal Astronomical Society. This is an Open Access article distributed underthe terms of the Creative Commons Attribution License (http://creativecommons.org/licenses/by/4.0/), which permits unrestricted reuse, distribution, andreproduction in any medium, provided the original work is properly cited.
Dow
nloaded from https://academ
ic.oup.com/m
nras/article/449/2/1679/1074146 by guest on 04 July 2022
1680 S. J. Mumford and R. Erdelyi
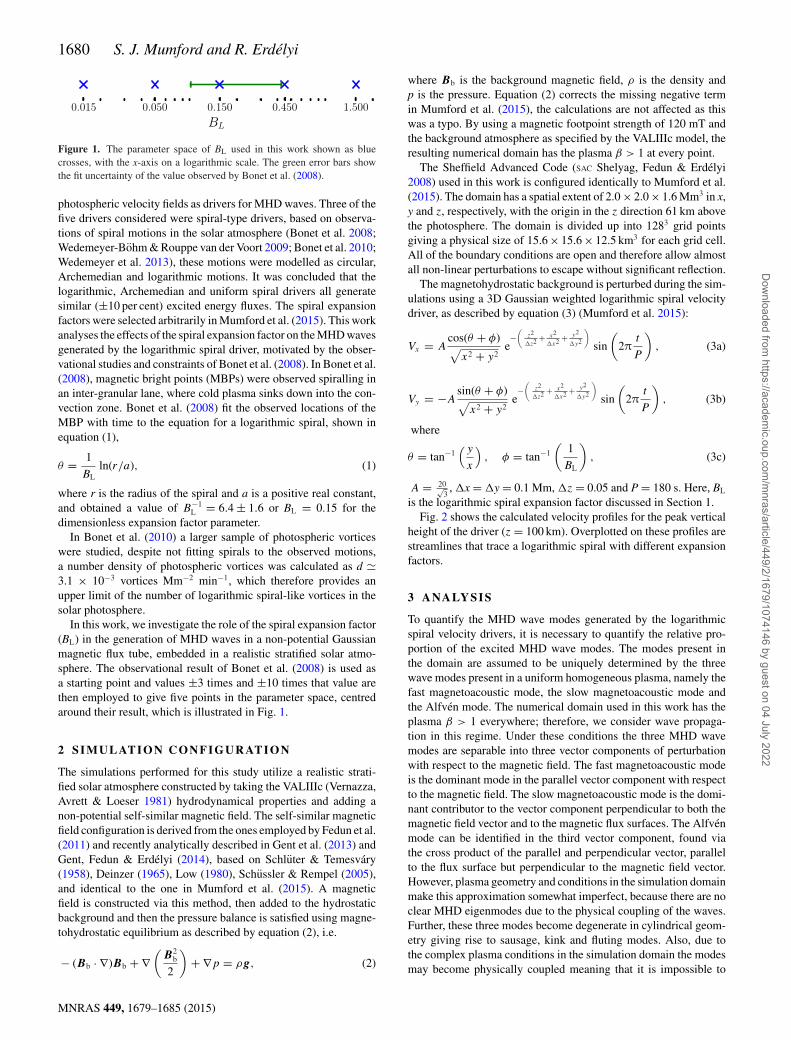
Figure 1. The parameter space of BL used in this work shown as bluecrosses, with the x-axis on a logarithmic scale. The green error bars showthe fit uncertainty of the value observed by Bonet et al. (2008).
photospheric velocity fields as drivers for MHD waves. Three of thefive drivers considered were spiral-type drivers, based on observa-tions of spiral motions in the solar atmosphere (Bonet et al. 2008;Wedemeyer-Bohm & Rouppe van der Voort 2009; Bonet et al. 2010;Wedemeyer et al. 2013), these motions were modelled as circular,Archemedian and logarithmic motions. It was concluded that thelogarithmic, Archemedian and uniform spiral drivers all generatesimilar (±10 per cent) excited energy fluxes. The spiral expansionfactors were selected arbitrarily in Mumford et al. (2015). This workanalyses the effects of the spiral expansion factor on the MHD wavesgenerated by the logarithmic spiral driver, motivated by the obser-vational studies and constraints of Bonet et al. (2008). In Bonet et al.(2008), magnetic bright points (MBPs) were observed spiralling inan inter-granular lane, where cold plasma sinks down into the con-vection zone. Bonet et al. (2008) fit the observed locations of theMBP with time to the equation for a logarithmic spiral, shown inequation (1),
θ = 1
BLln(r/a), (1)
where r is the radius of the spiral and a is a positive real constant,and obtained a value of B−1
L = 6.4 ± 1.6 or BL = 0.15 for thedimensionless expansion factor parameter.
In Bonet et al. (2010) a larger sample of photospheric vorticeswere studied, despite not fitting spirals to the observed motions,a number density of photospheric vortices was calculated as d �3.1 × 10⁻³ vortices Mm−2 min−1, which therefore provides anupper limit of the number of logarithmic spiral-like vortices in thesolar photosphere.
In this work, we investigate the role of the spiral expansion factor(BL) in the generation of MHD waves in a non-potential Gaussianmagnetic flux tube, embedded in a realistic stratified solar atmo-sphere. The observational result of Bonet et al. (2008) is used asa starting point and values ±3 times and ±10 times that value arethen employed to give five points in the parameter space, centredaround their result, which is illustrated in Fig. 1.
2 SI M U L ATI O N C O N F I G U R AT I O N
The simulations performed for this study utilize a realistic strati-fied solar atmosphere constructed by taking the VALIIIc (Vernazza,Avrett & Loeser 1981) hydrodynamical properties and adding anon-potential self-similar magnetic field. The self-similar magneticfield configuration is derived from the ones employed by Fedun et al.(2011) and recently analytically described in Gent et al. (2013) andGent, Fedun & Erdelyi (2014), based on Schluter & Temesvary(1958), Deinzer (1965), Low (1980), Schussler & Rempel (2005),and identical to the one in Mumford et al. (2015). A magneticfield is constructed via this method, then added to the hydrostaticbackground and then the pressure balance is satisfied using magne-tohydrostatic equilibrium as described by equation (2), i.e.
− (Bb · ∇)Bb + ∇(
B2b
2
)+ ∇p = ρg, (2)
where Bb is the background magnetic field, ρ is the density andp is the pressure. Equation (2) corrects the missing negative termin Mumford et al. (2015), the calculations are not affected as thiswas a typo. By using a magnetic footpoint strength of 120 mT andthe background atmosphere as specified by the VALIIIc model, theresulting numerical domain has the plasma β > 1 at every point.
The Sheffield Advanced Code (SAC Shelyag, Fedun & Erdelyi2008) used in this work is configured identically to Mumford et al.(2015). The domain has a spatial extent of 2.0 × 2.0 × 1.6 Mm3 in x,y and z, respectively, with the origin in the z direction 61 km abovethe photosphere. The domain is divided up into 1283 grid pointsgiving a physical size of 15.6 × 15.6 × 12.5 km3 for each grid cell.All of the boundary conditions are open and therefore allow almostall non-linear perturbations to escape without significant reflection.
The magnetohydrostatic background is perturbed during the sim-ulations using a 3D Gaussian weighted logarithmic spiral velocitydriver, as described by equation (3) (Mumford et al. 2015):
Vx = Acos(θ + φ)√
x2 + y2e−
(z2
�z2 + x2
�x2 + y2
�y2
)sin
(2π
t
P
), (3a)
Vy = −Asin(θ + φ)√
x2 + y2e−
(z2
�z2 + x2
�x2 + y2
�y2
)sin
(2π
t
P
), (3b)
where
θ = tan−1(y
x
), φ = tan−1
(1
BL
), (3c)
A = 20√3, �x = �y = 0.1 Mm, �z = 0.05 and P = 180 s. Here, BL
is the logarithmic spiral expansion factor discussed in Section 1.Fig. 2 shows the calculated velocity profiles for the peak vertical
height of the driver (z = 100 km). Overplotted on these profiles arestreamlines that trace a logarithmic spiral with different expansionfactors.
3 A NA LY SIS
To quantify the MHD wave modes generated by the logarithmicspiral velocity drivers, it is necessary to quantify the relative pro-portion of the excited MHD wave modes. The modes present inthe domain are assumed to be uniquely determined by the threewave modes present in a uniform homogeneous plasma, namely thefast magnetoacoustic mode, the slow magnetoacoustic mode andthe Alfven mode. The numerical domain used in this work has theplasma β > 1 everywhere; therefore, we consider wave propaga-tion in this regime. Under these conditions the three MHD wavemodes are separable into three vector components of perturbationwith respect to the magnetic field. The fast magnetoacoustic modeis the dominant mode in the parallel vector component with respectto the magnetic field. The slow magnetoacoustic mode is the domi-nant contributor to the vector component perpendicular to both themagnetic field vector and to the magnetic flux surfaces. The Alfvenmode can be identified in the third vector component, found viathe cross product of the parallel and perpendicular vector, parallelto the flux surface but perpendicular to the magnetic field vector.However, plasma geometry and conditions in the simulation domainmake this approximation somewhat imperfect, because there are noclear MHD eigenmodes due to the physical coupling of the waves.Further, these three modes become degenerate in cylindrical geom-etry giving rise to sausage, kink and fluting modes. Also, due tothe complex plasma conditions in the simulation domain the modesmay become physically coupled meaning that it is impossible to
MNRAS 449, 1679–1685 (2015)
Dow
nloaded from https://academ
ic.oup.com/m
nras/article/449/2/1679/1074146 by guest on 04 July 2022

Photospheric logarithmic spirals 1681
Figure 2. Cuts in the [x–y] plane through the driving velocity field. The normalized velocity is plotted in blue with velocity vectors overplotted in black and astreamline seeded at the centre plotted in red. A plot is shown for each value of BL used in a simulation.
completely separate the modes. Despite these complications the de-scription of the modes based on the three vector components in themagnetic field frame is taken as a good way to describe, identifyand quantify the MHD wave modes in the system.
To identify theses waves via the vector components relative tothe magnetic field the identification of a vector perpendicular to themagnetic field vector is required. In a 2D system, this is a trivialstep; however, in a 3D simulation, it is ill-defined. The solution tothis problem, used in this work, is to define a magnetic flux surfacewhich encapsulates a constant amount of magnetic flux at all heightsin the domain. This method is described in more detail and utilizedin Mumford et al. (2015). The surface then allows the computationof a vector perpendicular to it and, thus, to the magnetic field linesit is constructed from. These ‘flux surfaces’ are initially constructedfrom a ring of axisymmetric field lines computed in the static back-ground conditions. The field line seed points then move with theplasma velocity throughout the simulation, which results in the fluxsurface being constructed from the same field lines at all times in thesimulation. The combination of the surface normal vectors and themagnetic field vector provide the information required to calculatethe azimuthal vector via the cross product, which provides a thirdvector parallel to the surface but perpendicular to the magnetic field.
These surfaces are constructed, using the VTK library,1 for threedifferent characteristic initial radii (measured at the top of the do-main) of 156, 468 and 936 km from the centre of the domain,for each simulation, giving a good sampling through the differingplasma properties of the domain. This allows the analysis of theexcited modes at different points in the domain, giving an overallpicture of the waves.
1 Visualistation ToolKit 5.10.0 (www.vtk.org).
Using the flux surfaces, defined above, we can now decomposeany vector quantity in the domain into the parallel, perpendicular andazimuthal components, allowing study of the velocity and magneticfield perturbation vectors. While the velocity and magnetic fieldperturbation vectors are good for identifying and studying wave be-haviour itself, to quantify the amount of each wave mode generatedthe wave energy flux is computed using equation 4 from Bogdanet al. (2003),
Fwave ≡ pkv + 1
μ0(Bb · B)v − 1
μ0(v · B)Bb, (4)
where subscript b represents a background variable, tilde representsa perturbation from the background conditions and pk representskinetic pressure.
The wave energy flux equation (4) is decomposed on to the fluxsurface in the same way as the velocity vector, subject to the samelimitations as the velocity.
3.1 Results
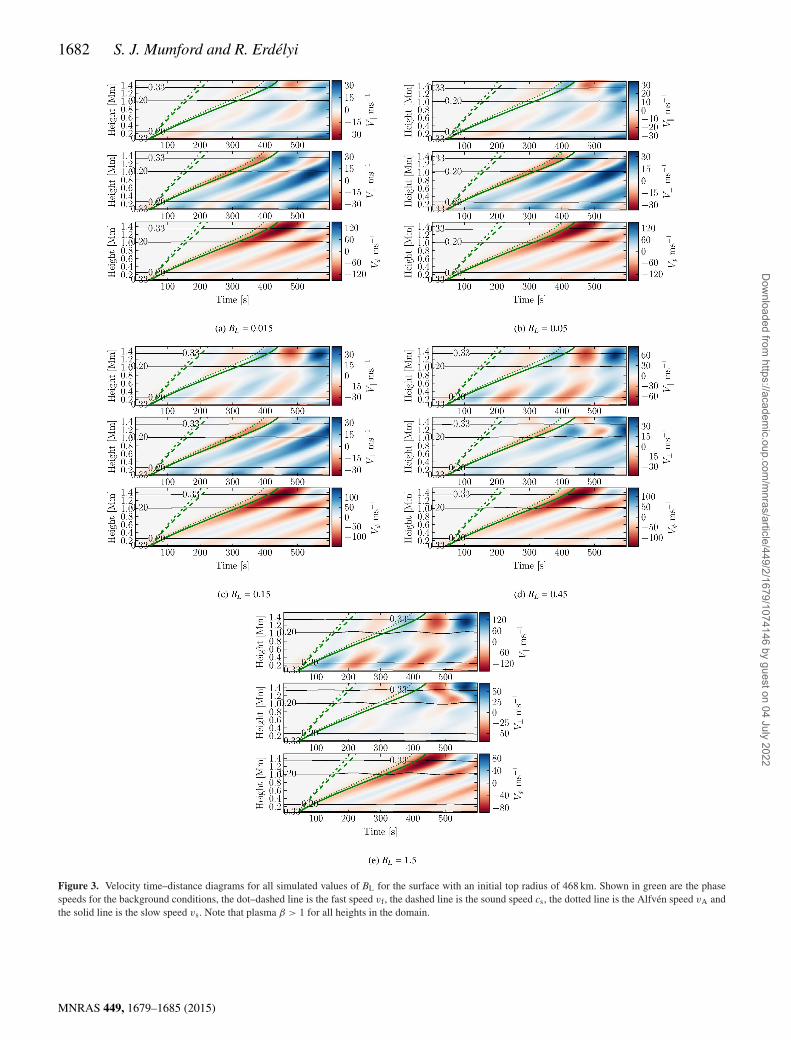
To assist in the visualization and analysis of the results providedby the flux surfaces, the vector components, for both velocity andwave flux, along one field line are extracted for all time steps andplotted as time–distance diagrams in Figs 3 and 4.
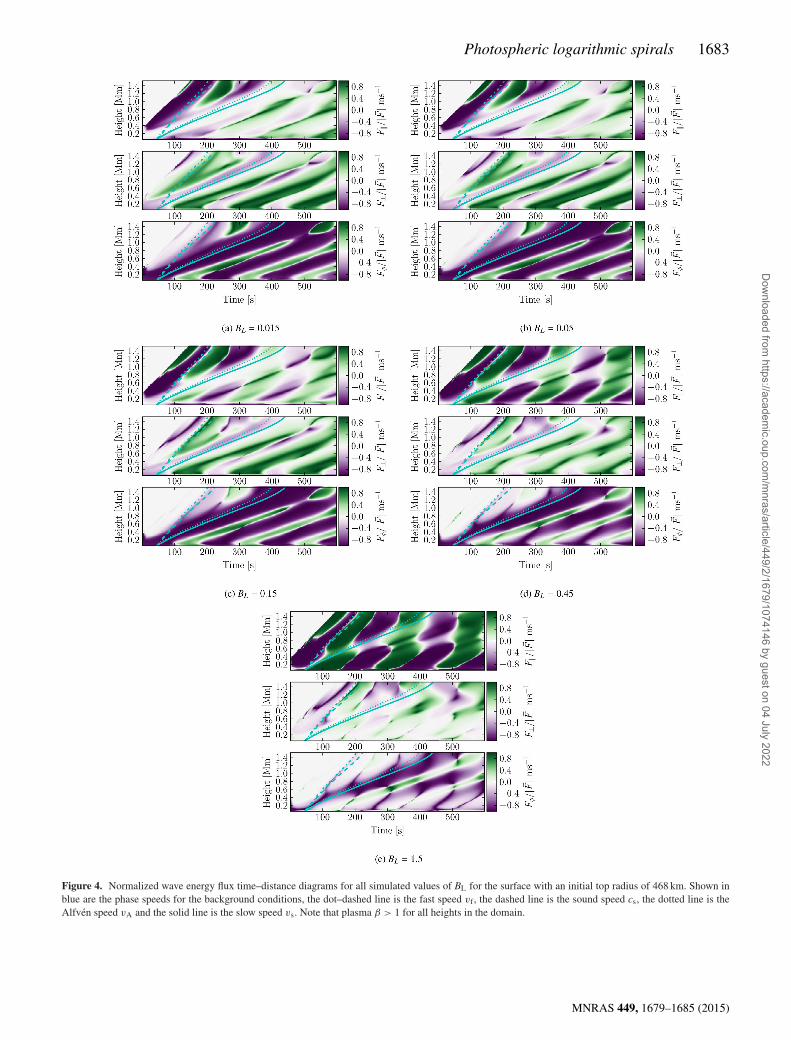
Combining the decomposed velocity vector plotted in Fig. 3 andthe decomposed wave flux vector plotted in Fig. 4, we can reli-ably describe the nature of the waves generated in the simulations.Overplotted on all panels in Figs 3 and 4 are the phase speeds forthe background conditions, the dot–dashed line is the fast speed vf,the dashed line is the sound speed cs, the dotted line is the Alfvenspeed vA and the solid line is the slow speed vs. By comparingthese characteristic wave mode speeds to the ridges in the time–distance diagrams, it can be seen that in the panels for the torsional
MNRAS 449, 1679–1685 (2015)
Dow
nloaded from https://academ
ic.oup.com/m
nras/article/449/2/1679/1074146 by guest on 04 July 2022
1682 S. J. Mumford and R. Erdelyi
Figure 3. Velocity time–distance diagrams for all simulated values of BL for the surface with an initial top radius of 468 km. Shown in green are the phasespeeds for the background conditions, the dot–dashed line is the fast speed vf, the dashed line is the sound speed cs, the dotted line is the Alfven speed vA andthe solid line is the slow speed vs. Note that plasma β > 1 for all heights in the domain.
MNRAS 449, 1679–1685 (2015)
Dow
nloaded from https://academ
ic.oup.com/m
nras/article/449/2/1679/1074146 by guest on 04 July 2022
Photospheric logarithmic spirals 1683
Figure 4. Normalized wave energy flux time–distance diagrams for all simulated values of BL for the surface with an initial top radius of 468 km. Shown inblue are the phase speeds for the background conditions, the dot–dashed line is the fast speed vf, the dashed line is the sound speed cs, the dotted line is theAlfven speed vA and the solid line is the slow speed vs. Note that plasma β > 1 for all heights in the domain.
MNRAS 449, 1679–1685 (2015)
Dow
nloaded from https://academ
ic.oup.com/m
nras/article/449/2/1679/1074146 by guest on 04 July 2022
1684 S. J. Mumford and R. Erdelyi
component (third panel in each figure), the dominant perturbationtravels with the Alfven speed (solid line). We interpret this pertur-bation as an Alfven wave. For the perpendicular component (secondpanels), it can be seen that the dominant perturbation travels withthe slow speed (solid line); therefore, this perturbation is interpretedas a slow sausage mode. We can infer that this perturbation is likelyto be a sausage mode perturbation due to the nature of the driver,in that it should not perturb the axis of the flux tube and, that weobserve no significant displacement on the flux surfaces during thesimulation. The most interesting result is shown for the parallelcomponent (top panel in each figure), where for lower values ofBL, the amplitudes are low, but the perturbations that are presenttravel with the slow speed (solid line). However, as BL increasesthe perturbations change form. There seems to appear a second,superimposed perturbation travelling with a speed close to that ofthe fast (or sound) speeds, which could be a fast sausage mode. Thissecond perturbation seems to grow proportionally to BL, and can beseen to be dominant in Figs 4(d) and (e).
The wave flux graphs in Fig. 4 are components normalized tothe magnitude of the wave flux vector, thus showing the relativestrengths of the components. Taking Fig. 4(a) for the BL = 0.015spiral, it can be seen that most of the excited wave flux is in theazimuthal component, associated with the Alfven wave. As theexpansion factor (BL) increases, the driver becomes more radial, andthe flux starts to shift from the azimuthal component into the parallelcomponent. This is interpreted as a change of the dominant modefrom the torsional Alfven wave into a sausage mode with dominantvelocity perturbations parallel to the field lines. Considering therange of BL, found by Bonet et al. (2008) and illustrated in therange spanned by Figs 3(c) and (d), it can be seen that even withinthis parameter range the parallel component becomes substantiallymore dominant, meaning the change in spectrum of excited MHDwave modes is sensitive to the expansion factor of a spiral driver.
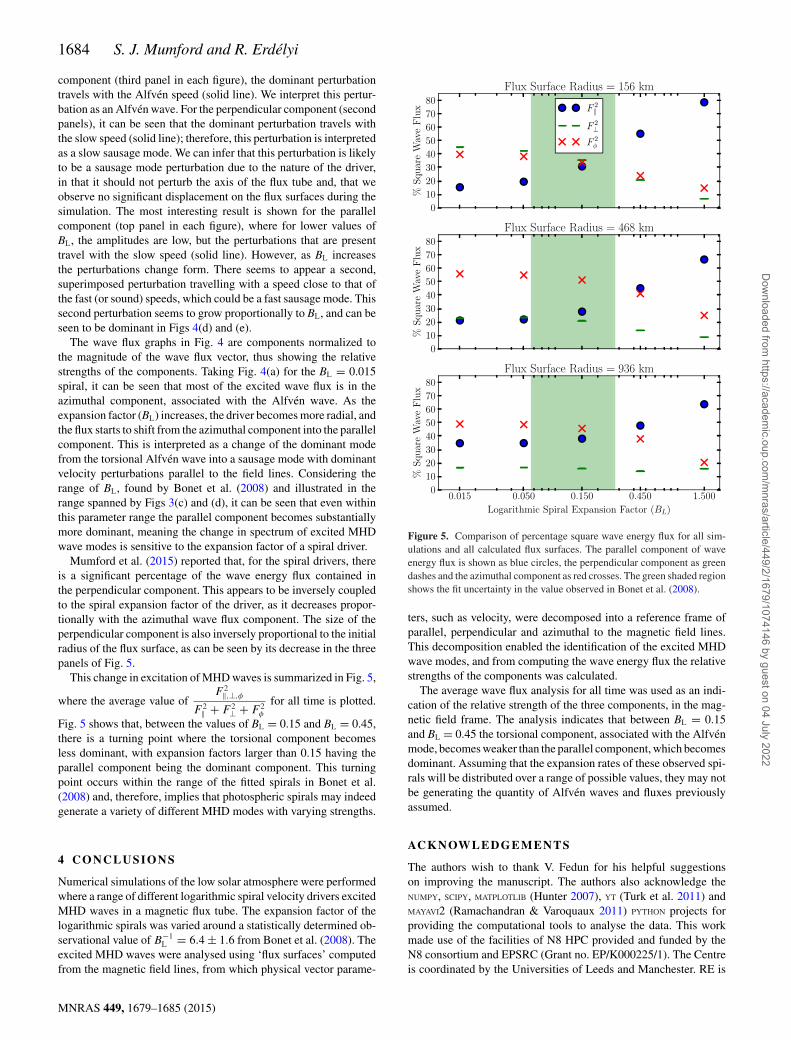
Mumford et al. (2015) reported that, for the spiral drivers, thereis a significant percentage of the wave energy flux contained inthe perpendicular component. This appears to be inversely coupledto the spiral expansion factor of the driver, as it decreases propor-tionally with the azimuthal wave flux component. The size of theperpendicular component is also inversely proportional to the initialradius of the flux surface, as can be seen by its decrease in the threepanels of Fig. 5.
This change in excitation of MHD waves is summarized in Fig. 5,
where the average value ofF 2
‖,⊥,φ
F 2‖ + F 2
⊥ + F 2φ
for all time is plotted.
Fig. 5 shows that, between the values of BL = 0.15 and BL = 0.45,there is a turning point where the torsional component becomesless dominant, with expansion factors larger than 0.15 having theparallel component being the dominant component. This turningpoint occurs within the range of the fitted spirals in Bonet et al.(2008) and, therefore, implies that photospheric spirals may indeedgenerate a variety of different MHD modes with varying strengths.
4 C O N C L U S I O N S
Numerical simulations of the low solar atmosphere were performedwhere a range of different logarithmic spiral velocity drivers excitedMHD waves in a magnetic flux tube. The expansion factor of thelogarithmic spirals was varied around a statistically determined ob-servational value of B−1
L = 6.4 ± 1.6 from Bonet et al. (2008). Theexcited MHD waves were analysed using ‘flux surfaces’ computedfrom the magnetic field lines, from which physical vector parame-
Figure 5. Comparison of percentage square wave energy flux for all sim-ulations and all calculated flux surfaces. The parallel component of waveenergy flux is shown as blue circles, the perpendicular component as greendashes and the azimuthal component as red crosses. The green shaded regionshows the fit uncertainty in the value observed in Bonet et al. (2008).
ters, such as velocity, were decomposed into a reference frame ofparallel, perpendicular and azimuthal to the magnetic field lines.This decomposition enabled the identification of the excited MHDwave modes, and from computing the wave energy flux the relativestrengths of the components was calculated.
The average wave flux analysis for all time was used as an indi-cation of the relative strength of the three components, in the mag-netic field frame. The analysis indicates that between BL = 0.15and BL = 0.45 the torsional component, associated with the Alfvenmode, becomes weaker than the parallel component, which becomesdominant. Assuming that the expansion rates of these observed spi-rals will be distributed over a range of possible values, they may notbe generating the quantity of Alfven waves and fluxes previouslyassumed.
AC K N OW L E D G E M E N T S
The authors wish to thank V. Fedun for his helpful suggestionson improving the manuscript. The authors also acknowledge theNUMPY, SCIPY, MATPLOTLIB (Hunter 2007), YT (Turk et al. 2011) andMAYAVI2 (Ramachandran & Varoquaux 2011) PYTHON projects forproviding the computational tools to analyse the data. This workmade use of the facilities of N8 HPC provided and funded by theN8 consortium and EPSRC (Grant no. EP/K000225/1). The Centreis coordinated by the Universities of Leeds and Manchester. RE is
MNRAS 449, 1679–1685 (2015)
Dow
nloaded from https://academ
ic.oup.com/m
nras/article/449/2/1679/1074146 by guest on 04 July 2022
Photospheric logarithmic spirals 1685
thankful to the Science and Technology Facilities Council (STFC)and NSF, Hungary (OTKA, Ref. no. K83133) and acknowledgesM. Keray for patient encouragement.
R E F E R E N C E S
Andries J., Doorsselaere T., Roberts B., Verth G., Verwichte E., Erdelyi R.,2009, Space Sci. Rev., 149, 3
Bogdan T., Judge P., 2006, Philos. Trans. R. Soc. A, 364, 313Bogdan T. J. et al., 2003, ApJ, 599, 626Bonet J. A., Marquez I., Sanchez Almeida J., Cabello I., Domingo V., 2008,
ApJ, 687, L131Bonet J. A. et al., 2010, ApJ, 723, L139Deinzer W., 1965, ApJ, 141, 548Dorotovic I., Erdelyi R., Freij N., Karlovsky V., Marquez I., 2014, A&A,
563, A12Fedun V., Shelyag S., Verth G., Mathioudakis M., Erdelyi R., 2011, Ann.
Geophys., 29, 1029Gent F. A., Fedun V., Mumford S. J., Erdelyi R., 2013, MNRAS, 435, 689Gent F. A., Fedun V., Erdelyi R., 2014, ApJ, 789, 42Hasan S. S., van Ballegooijen A. A., 2008, ApJ, 680, 1542Hunter J. D., 2007, Comput. Sci. Eng., 9, 90Jess D. B., Mathioudakis M., Erdelyi R., Crockett P. J., Keenan F. P.,
Christian D. J., 2009, Science, 323, 1582Kobanov N. I., Kolobov D. Y., Makarchik D. V., 2006, Sol. Phys., 238, 231
Low B. C., 1980, Sol. Phys., 67, 57Morton R. J., Verth G., Jess D. B., Kuridze D., Ruderman M. S., Math-
ioudakis M., Erdelyi R., 2012, Nat. Commun., 3, 1315Mumford S. J., Fedun V., Erdelyi R., 2015, ApJ, 799, 6Ramachandran P., Varoquaux G., 2011, Comput. Sci. Eng., 13, 40Schluter A., Temesvary S., 1958, in Lehnert B., ed., Proc. IAU Symp.
Vol. 6, Electromagnetic Phenomena in Cosmical Physics. CambridgeUniv. Press, Cambridge, p. 263
Schussler M., Rempel M., 2005, A&A, 441, 337Scullion E., Erdelyi R., Fedun V., Doyle J. G., 2011, ApJ, 743, 14Shelyag S., Fedun V., Erdelyi R., 2008, A&A, 486, 655Taroyan Y., Erdelyi R., 2009, Space Sci. Rev., 149, 229Turk M. J., Smith B. D., Oishi J. S., Skory S., Skillman S. W., Abel T.,
Norman M. L., 2011, ApJS, 192, 9Vernazza J. E., Avrett E. H., Loeser R., 1981, ApJS, 45, 635Vigeesh G., Fedun V., Hasan S. S., Erdelyi R., 2012, ApJ, 755, 18Wang T., 2011, Space Sci. Rev., 158, 397Wedemeyer S., Scullion E., Steiner O., Rodriguez J. d. l. C., Voort L. R. v.
d., 2013, J. Phys. Conf. Ser., 440, 012005Wedemeyer-Bohm S., Rouppe van der Voort L., 2009, A&A, 507, L9Wedemeyer-Bohm S., Scullion E., Steiner O., van der Voort L. R., de la
Cruz Rodriguez J., Fedun V., Erdelyi R., 2012, Nature, 486, 505
This paper has been typeset from a TEX/LATEX file prepared by the author.
MNRAS 449, 1679–1685 (2015)
Dow
nloaded from https://academ
ic.oup.com/m
nras/article/449/2/1679/1074146 by guest on 04 July 2022
Related Documents