Photonic Crystal Surface Waves for Optical Biosensors Valery N. Konopsky* and Elena V. Alieva Institute of Spectroscopy, Russian Academy of Sciences, Troitsk, Moscow region, 142190, Russia We present a new optical biosensor technique based on registration of dual optical s-polarized modes on a pho- tonic crystal surface. The simultaneous registration of two optical surface waves with different evanescent depths from the same surface spot permits the segregation of the volume and the surface contributions from an analyte, while the absence of metal damping permits an increase in the propagation length of the optical surface waves and the sensitivity of the biosensor. Our technique was tested with the binding of biotin molecules to a streptavidin monolayer that has been detected with signal/noise ratio of ∼15 at 1-s signal accumulation time. The detection limit is ∼20 fg of the analyte on the probed spot of the surface. Optical biosensors have played a key role in the selective recognition of target biomolecules and in biomolecular interaction analysis, providing kinetics data of biological binding events in real time without labeling. Advantages of the label-free concept are the elimination of undue detrimental effects from labels that may interfere with fundamental interaction and the absence of a time-consuming pretreatment. 1 Disadvantages of all label-free techniques, including the most mature one, surface plasmon resonance (SPR) technique, 2 are a deficient sensitivity to a specific signal and undesirable susceptibilities to nonspecific signals, e.g., to the volume effect of refraction index variations. Our goal was to overcome these variations caused by temperature fluctuations and drifts that are a problem for many state-of-the-art optical biosensors. Registration of optical waves propagating along the surface under investigation is the most used method in the label-free optical biosensors. 3 In the SPR technique, these waves are surface plasmon polaritons 4 propagating along a gold or silver surface, while in the resonant mirror technique, 5 the waves are waveguide modes excited in a high refractive index dielectric layer via the frustrated total internal reflection (TIR) from a low refractive index spacer. In both cases, an evanescent field of the optical wave (with penetration depth in water ∼100 nm) is sensitive not only to biomolecular interactions at the surface but also to changes in the volume refraction index (RI) of the liquid due to variations of the liquid temperature, composition, and so on. For example, a water temperature change of 0.1 °C gives a water RI change of ∼10 -5 . Therefore, a need exists for a biosensor technique that would be able to segregate the volume and the surface contributions from an analyte in detected signals. To obtain these two param- eters, one needs to detect at least two optical waves with different characteristics (e.g., with different penetration depths) simulta- neously. In the work, 6 we exploited a bulk optical wave, propagat- ing above the sensing surface as a reference of the volume RI fluctuations. The weakness of this method is the impossibility of decreasing the flow cell height (and therefore the flow cell volume) because of using the bulk optical wave. Slavı ´k et al. 7 have tried to use the excitation of long-range and short-range plasmons at the same surface spot by polychromatic light at fixed incident angle (so-called wavelength interrogations the spectrum of the reflected light is examined) to separate bulk from surface effects. Authors claimed a noise-limited resolution of their method is 11 times worse than the one of an ordinary SPR method with wavelength interrogation (which itself is less sensitive than an angular interrogation method). The reason is a very small propagation length of the short-range plasmons. Moreover, the excitation of both modes at the same incident angle means that these modes differ little in their penetration depths, because the penetration depth difference here is originated from a wavelength difference of these modes only (see eq 1 below). In a dual-waveguide interferometric technique 8 the measure- ment of propagation constants of two modes with s- and p- polarizations is used to seek an adsorption layer thickness and its RI. It is worth noting here that the exploitation of the modes with the orthogonal polarizations may be stated as a weakness of the method, because of an implicit assumption that the adlayer is an isotropic substance, while the adlayer is almost always anisotropic (and birefringent to some extent) due to its binding to the surface. Here we present a technique based on the simultaneous registration of two s-polarized optical surface waves on a one- dimensional photonic crystal surface. Photonic crystals (PCs) are materials that possess a periodic modulation of their refraction index on the scale of the wavelength of light. 9 Such materials can * To whom correspondence should be addressed. E-mail: konopsky@ isan.troitsk.ru. (1) Cooper, M. A. Anal. Bioanal. Chem. 2003, 377, 834-842. (2) Homola, J.; Yee, S. S.; Gauglitz, G. Sens. Actuators, B 1999, 54,3-15. (3) Robinson, G. Sens. Actuators, B 1995, 29, 31-36. (4) Raether, H. Surface Plasmons; Springer: Berlin, 1988. (5) Cush, R.; Cronin, J.; Stewart, W.; Maule, C.; Molloy, J.; Goddard, N. Biosens. Bioelectron. 1993, 8, 347-353. (6) Alieva, E. V.; Konopsky, V. N. Sens. Actuators, B 2004, 99, 90-97. (7) Slavı ´k, R.; Homola, J.; Vaisocherova ´ , H. Meas. Sci. Technol. 2006, 17, 932- 938. (8) Cross, G.; Reeves, A.; Brand, S.; Swann, M.; Peel, L.; Freeman, N.; Lu, J. J. Phys. D: Appl. Phys. 2004, 37, 74-80. (9) Yablonovitch, E. J. Opt. Soc. Am. B 1993, 10, 283-295. Anal. Chem. 2007, 79, 4729-4735 10.1021/ac070275y CCC: $37.00 © 2007 American Chemical Society Analytical Chemistry, Vol. 79, No. 12, June 15, 2007 4729 Published on Web 05/12/2007

Welcome message from author
This document is posted to help you gain knowledge. Please leave a comment to let me know what you think about it! Share it to your friends and learn new things together.
Transcript
Photonic Crystal Surface Waves for OpticalBiosensors
Valery N. Konopsky* and Elena V. Alieva
Institute of Spectroscopy, Russian Academy of Sciences, Troitsk, Moscow region, 142190, Russia
We present a new optical biosensor technique based onregistration of dual optical s-polarized modes on a pho-tonic crystal surface. The simultaneous registration of twooptical surface waves with different evanescent depthsfrom the same surface spot permits the segregation of thevolume and the surface contributions from an analyte,while the absence of metal damping permits an increasein the propagation length of the optical surface waves andthe sensitivity of the biosensor. Our technique was testedwith the binding of biotin molecules to a streptavidinmonolayer that has been detected with signal/noise ratioof ∼15 at 1-s signal accumulation time. The detection limitis ∼20 fg of the analyte on the probed spot of the surface.
Optical biosensors have played a key role in the selectiverecognition of target biomolecules and in biomolecular interactionanalysis, providing kinetics data of biological binding events inreal time without labeling. Advantages of the label-free conceptare the elimination of undue detrimental effects from labels thatmay interfere with fundamental interaction and the absence of atime-consuming pretreatment.1 Disadvantages of all label-freetechniques, including the most mature one, surface plasmonresonance (SPR) technique,2 are a deficient sensitivity to a specificsignal and undesirable susceptibilities to nonspecific signals, e.g.,to the volume effect of refraction index variations. Our goal wasto overcome these variations caused by temperature fluctuationsand drifts that are a problem for many state-of-the-art opticalbiosensors.
Registration of optical waves propagating along the surfaceunder investigation is the most used method in the label-freeoptical biosensors.3 In the SPR technique, these waves are surfaceplasmon polaritons4 propagating along a gold or silver surface,while in the resonant mirror technique,5 the waves are waveguidemodes excited in a high refractive index dielectric layer via thefrustrated total internal reflection (TIR) from a low refractive indexspacer. In both cases, an evanescent field of the optical wave (withpenetration depth in water ∼100 nm) is sensitive not only tobiomolecular interactions at the surface but also to changes inthe volume refraction index (RI) of the liquid due to variations of
the liquid temperature, composition, and so on. For example, awater temperature change of 0.1 °C gives a water RI change of∼10-5.
Therefore, a need exists for a biosensor technique that wouldbe able to segregate the volume and the surface contributionsfrom an analyte in detected signals. To obtain these two param-eters, one needs to detect at least two optical waves with differentcharacteristics (e.g., with different penetration depths) simulta-neously. In the work,6 we exploited a bulk optical wave, propagat-ing above the sensing surface as a reference of the volume RIfluctuations. The weakness of this method is the impossibility ofdecreasing the flow cell height (and therefore the flow cell volume)because of using the bulk optical wave.
Slavık et al.7 have tried to use the excitation of long-range andshort-range plasmons at the same surface spot by polychromaticlight at fixed incident angle (so-called wavelength interrogations
the spectrum of the reflected light is examined) to separate bulkfrom surface effects. Authors claimed a noise-limited resolutionof their method is 11 times worse than the one of an ordinarySPR method with wavelength interrogation (which itself is lesssensitive than an angular interrogation method). The reason is avery small propagation length of the short-range plasmons.Moreover, the excitation of both modes at the same incident anglemeans that these modes differ little in their penetration depths,because the penetration depth difference here is originated froma wavelength difference of these modes only (see eq 1 below).
In a dual-waveguide interferometric technique8 the measure-ment of propagation constants of two modes with s- and p-polarizations is used to seek an adsorption layer thickness andits RI. It is worth noting here that the exploitation of the modeswith the orthogonal polarizations may be stated as a weakness ofthe method, because of an implicit assumption that the adlayer isan isotropic substance, while the adlayer is almost alwaysanisotropic (and birefringent to some extent) due to its bindingto the surface.
Here we present a technique based on the simultaneousregistration of two s-polarized optical surface waves on a one-dimensional photonic crystal surface. Photonic crystals (PCs) arematerials that possess a periodic modulation of their refractionindex on the scale of the wavelength of light.9 Such materials can
* To whom correspondence should be addressed. E-mail: [email protected].(1) Cooper, M. A. Anal. Bioanal. Chem. 2003, 377, 834-842.(2) Homola, J.; Yee, S. S.; Gauglitz, G. Sens. Actuators, B 1999, 54, 3-15.(3) Robinson, G. Sens. Actuators, B 1995, 29, 31-36.(4) Raether, H. Surface Plasmons; Springer: Berlin, 1988.(5) Cush, R.; Cronin, J.; Stewart, W.; Maule, C.; Molloy, J.; Goddard, N. Biosens.
Bioelectron. 1993, 8, 347-353.
(6) Alieva, E. V.; Konopsky, V. N. Sens. Actuators, B 2004, 99, 90-97.(7) Slavık, R.; Homola, J.; Vaisocherova, H. Meas. Sci. Technol. 2006, 17, 932-
938.(8) Cross, G.; Reeves, A.; Brand, S.; Swann, M.; Peel, L.; Freeman, N.; Lu, J. J.
Phys. D: Appl. Phys. 2004, 37, 74-80.(9) Yablonovitch, E. J. Opt. Soc. Am. B 1993, 10, 283-295.
Anal. Chem. 2007, 79, 4729-4735
10.1021/ac070275y CCC: $37.00 © 2007 American Chemical Society Analytical Chemistry, Vol. 79, No. 12, June 15, 2007 4729Published on Web 05/12/2007
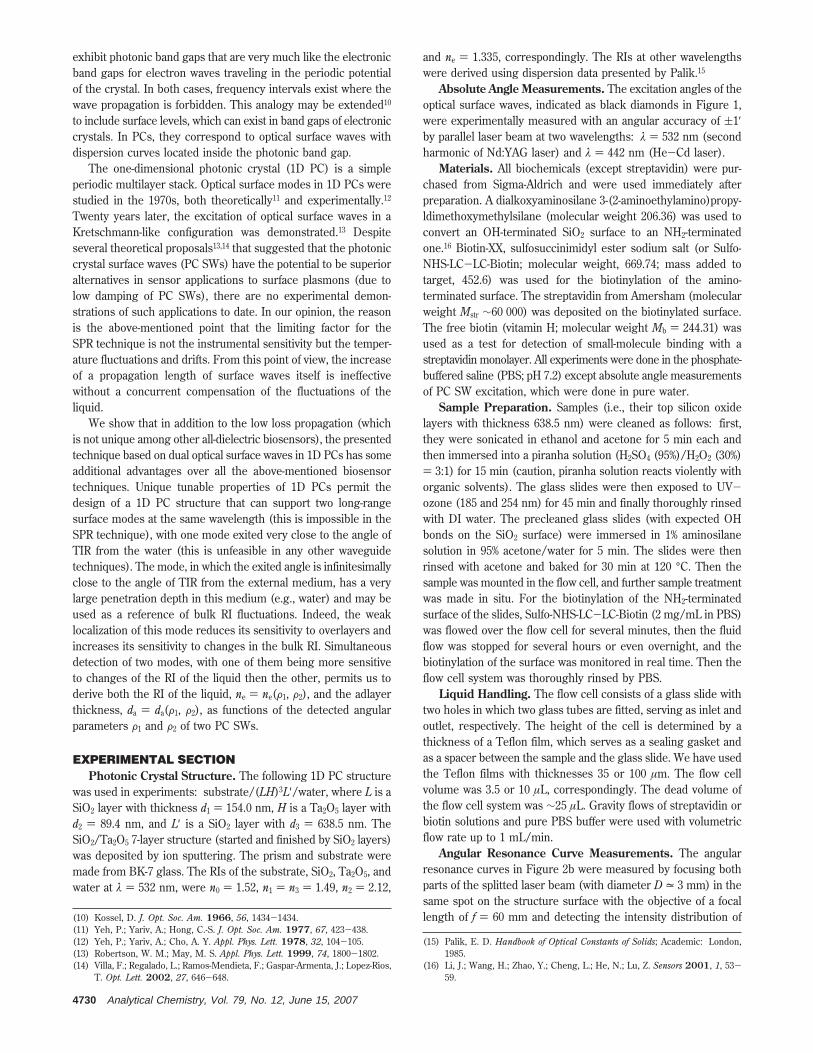
exhibit photonic band gaps that are very much like the electronicband gaps for electron waves traveling in the periodic potentialof the crystal. In both cases, frequency intervals exist where thewave propagation is forbidden. This analogy may be extended10
to include surface levels, which can exist in band gaps of electroniccrystals. In PCs, they correspond to optical surface waves withdispersion curves located inside the photonic band gap.
The one-dimensional photonic crystal (1D PC) is a simpleperiodic multilayer stack. Optical surface modes in 1D PCs werestudied in the 1970s, both theoretically11 and experimentally.12
Twenty years later, the excitation of optical surface waves in aKretschmann-like configuration was demonstrated.13 Despiteseveral theoretical proposals13,14 that suggested that the photoniccrystal surface waves (PC SWs) have the potential to be superioralternatives in sensor applications to surface plasmons (due tolow damping of PC SWs), there are no experimental demon-strations of such applications to date. In our opinion, the reasonis the above-mentioned point that the limiting factor for theSPR technique is not the instrumental sensitivity but the temper-ature fluctuations and drifts. From this point of view, the increaseof a propagation length of surface waves itself is ineffectivewithout a concurrent compensation of the fluctuations of theliquid.
We show that in addition to the low loss propagation (whichis not unique among other all-dielectric biosensors), the presentedtechnique based on dual optical surface waves in 1D PCs has someadditional advantages over all the above-mentioned biosensortechniques. Unique tunable properties of 1D PCs permit thedesign of a 1D PC structure that can support two long-rangesurface modes at the same wavelength (this is impossible in theSPR technique), with one mode exited very close to the angle ofTIR from the water (this is unfeasible in any other waveguidetechniques). The mode, in which the exited angle is infinitesimallyclose to the angle of TIR from the external medium, has a verylarge penetration depth in this medium (e.g., water) and may beused as a reference of bulk RI fluctuations. Indeed, the weaklocalization of this mode reduces its sensitivity to overlayers andincreases its sensitivity to changes in the bulk RI. Simultaneousdetection of two modes, with one of them being more sensitiveto changes of the RI of the liquid then the other, permits us toderive both the RI of the liquid, ne ) ne(F1, F2), and the adlayerthickness, da ) da(F1, F2), as functions of the detected angularparameters F1 and F2 of two PC SWs.
EXPERIMENTAL SECTIONPhotonic Crystal Structure. The following 1D PC structure
was used in experiments: substrate/(LH)3L′/water, where L is aSiO2 layer with thickness d1 ) 154.0 nm, H is a Ta2O5 layer withd2 ) 89.4 nm, and L′ is a SiO2 layer with d3 ) 638.5 nm. TheSiO2/Ta2O5 7-layer structure (started and finished by SiO2 layers)was deposited by ion sputtering. The prism and substrate weremade from BK-7 glass. The RIs of the substrate, SiO2, Ta2O5, andwater at λ ) 532 nm, were n0 ) 1.52, n1 ) n3 ) 1.49, n2 ) 2.12,
and ne ) 1.335, correspondingly. The RIs at other wavelengthswere derived using dispersion data presented by Palik.15
Absolute Angle Measurements. The excitation angles of theoptical surface waves, indicated as black diamonds in Figure 1,were experimentally measured with an angular accuracy of (1′by parallel laser beam at two wavelengths: λ ) 532 nm (secondharmonic of Nd:YAG laser) and λ ) 442 nm (He-Cd laser).
Materials. All biochemicals (except streptavidin) were pur-chased from Sigma-Aldrich and were used immediately afterpreparation. A dialkoxyaminosilane 3-(2-aminoethylamino)propy-ldimethoxymethylsilane (molecular weight 206.36) was used toconvert an OH-terminated SiO2 surface to an NH2-terminatedone.16 Biotin-XX, sulfosuccinimidyl ester sodium salt (or Sulfo-NHS-LC-LC-Biotin; molecular weight, 669.74; mass added totarget, 452.6) was used for the biotinylation of the amino-terminated surface. The streptavidin from Amersham (molecularweight Mstr ∼60 000) was deposited on the biotinylated surface.The free biotin (vitamin H; molecular weight Mb ) 244.31) wasused as a test for detection of small-molecule binding with astreptavidin monolayer. All experiments were done in the phosphate-buffered saline (PBS; pH 7.2) except absolute angle measurementsof PC SW excitation, which were done in pure water.
Sample Preparation. Samples (i.e., their top silicon oxidelayers with thickness 638.5 nm) were cleaned as follows: first,they were sonicated in ethanol and acetone for 5 min each andthen immersed into a piranha solution (H2SO4 (95%)/H2O2 (30%)) 3:1) for 15 min (caution, piranha solution reacts violently withorganic solvents). The glass slides were then exposed to UV-ozone (185 and 254 nm) for 45 min and finally thoroughly rinsedwith DI water. The precleaned glass slides (with expected OHbonds on the SiO2 surface) were immersed in 1% aminosilanesolution in 95% acetone/water for 5 min. The slides were thenrinsed with acetone and baked for 30 min at 120 °C. Then thesample was mounted in the flow cell, and further sample treatmentwas made in situ. For the biotinylation of the NH2-terminatedsurface of the slides, Sulfo-NHS-LC-LC-Biotin (2 mg/mL in PBS)was flowed over the flow cell for several minutes, then the fluidflow was stopped for several hours or even overnight, and thebiotinylation of the surface was monitored in real time. Then theflow cell system was thoroughly rinsed by PBS.
Liquid Handling. The flow cell consists of a glass slide withtwo holes in which two glass tubes are fitted, serving as inlet andoutlet, respectively. The height of the cell is determined by athickness of a Teflon film, which serves as a sealing gasket andas a spacer between the sample and the glass slide. We have usedthe Teflon films with thicknesses 35 or 100 µm. The flow cellvolume was 3.5 or 10 µL, correspondingly. The dead volume ofthe flow cell system was ∼25 µL. Gravity flows of streptavidin orbiotin solutions and pure PBS buffer were used with volumetricflow rate up to 1 mL/min.
Angular Resonance Curve Measurements. The angularresonance curves in Figure 2b were measured by focusing bothparts of the splitted laser beam (with diameter D = 3 mm) in thesame spot on the structure surface with the objective of a focallength of f ) 60 mm and detecting the intensity distribution of(10) Kossel, D. J. Opt. Soc. Am. 1966, 56, 1434-1434.
(11) Yeh, P.; Yariv, A.; Hong, C.-S. J. Opt. Soc. Am. 1977, 67, 423-438.(12) Yeh, P.; Yariv, A.; Cho, A. Y. Appl. Phys. Lett. 1978, 32, 104-105.(13) Robertson, W. M.; May, M. S. Appl. Phys. Lett. 1999, 74, 1800-1802.(14) Villa, F.; Regalado, L.; Ramos-Mendieta, F.; Gaspar-Armenta, J.; Lopez-Rios,
T. Opt. Lett. 2002, 27, 646-648.
(15) Palik, E. D. Handbook of Optical Constants of Solids; Academic: London,1985.
(16) Li, J.; Wang, H.; Zhao, Y.; Cheng, L.; He, N.; Lu, Z. Sensors 2001, 1, 53-59.
4730 Analytical Chemistry, Vol. 79, No. 12, June 15, 2007
reflected light with a 512-pixel Hamamatsu photodiode arrayplaced 385 mm|442 mm (F1|F2) apart from the structure as shownin Figure 2a. The dynamic range of the angular measurements is(D/(2f) ) (0.025 rad that corresponds to the external media RIchange ∆n = (0.035 or to the adlayer thickness deposition ∆d =
(120 nm.Data Handling. Data acquisition from the diode array, data
processing, and presentation were done with homemade softwarewe wrote on a personal computer running under Windows.
RESULTS AND DISCUSSIONWe prepared the test photonic crystal structure and measured
absolute angles of the PC SW excitation at two wavelengths: λ )532 nm and λ ) 442 nm. In Figure 1, a calculated dispersion ofour 1D PC structure in water is presented as the logarithm ofoptical field enhancement (i.e., as lg[(EeEe
/)/(E0E0/)]) in the
external medium near the structure. Good correspondence is seenbetween experimental points (black diamonds) and the calculateddispersion curves of the surface modes. The dispersion ispresented in coordinate λ(F), where λ is an optical wavelengthand F is a numerical aperture F ) n0 sin (θ0). The numericalaperture F may be used as an angle variable instead of angles θj
in different layers. This is a unified angle variable for all layerssince, according to Snell’s law, F ) n0 sin (θ0) ) nj sin (θj), forany layer j. The angular parameter F, at which the excitation of asurface mode occurs, is equal to an effective RI of the mode.Therefore, the two red curves in Figure 1 present the dispersionof the two optical surface modes (i.e., the dependence of theirseffective RI from the wavelength).
From Figure 1, one can see that it is possible to excite one ofthe PC SWs in proximity to the TIR angle from the water byappropriately choosing the laser wavelength or by appropriatelychoosing the PC structure. The penetration length of the evanes-cent wave intensity (i.e., EeEe
/) in the external medium, which is
may be very large for this mode if the difference (F1 - FTIR) ) (F1
- ne) is small. This is a unique property of PC SWs, because inany standard waveguide techniques,5,8 the numeric aperture or(in other words) the effective RI of the waveguide mode Fmode isalways more then a RI of the low refractive index spacer nspacer.Therefore, the difference (Fmode - FTIR) g (nspacer - ne) cannot bemade small in the standard waveguides, taking into account theRI of the water (ne = 1.33) and the RI of the spacer (usually madefrom SiO2, nspacer = 1.49).
Another unique property of PC SWs is the possibility to excitethem in the structure, where the final dielectric layer (the siliconoxide layer in our case) may have a low RI, while the standardwaveguide has a high RI layer on a low RI spacer. This simplifiesthe procedures of biochemical modification of the external surface,which is now the standard SiO2 surface.
In Figure 2, the biosensor setup scheme and a typical rawexperimental signal from the setup are shown. The Hamamatsuphotodiode array was used to record the experimental signalss
angles of two PC SWs (F1 and F2) simultaneously. The interference
Figure 1. Calculated dispersion of the 7-layer PC structure in water and measured experimental points (black diamonds) at λ ) 532 nm andλ ) 442 nm laser wavelengths. The two optical surface modes are clearly seen as red curves (with an enhancement ∼1000) inside the bandgap (with an enhancement much less than 1).
le ) λ
4πxF12 - FTIR
2(1)
Analytical Chemistry, Vol. 79, No. 12, June 15, 2007 4731
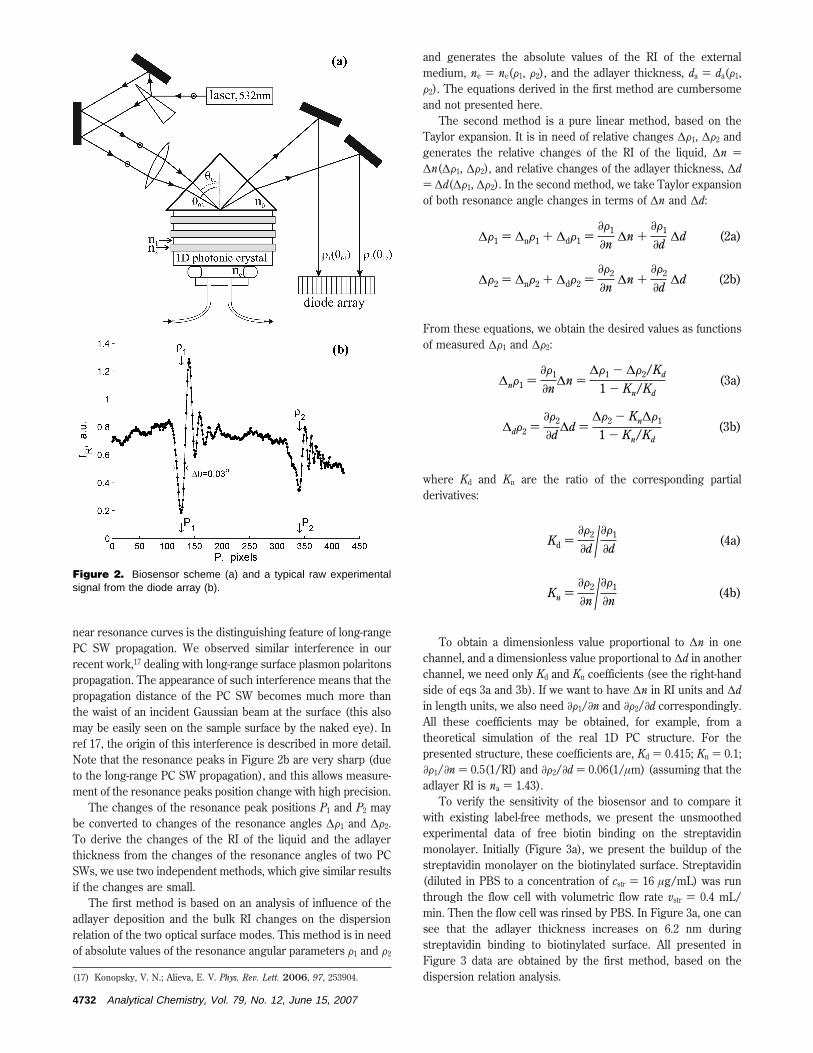
near resonance curves is the distinguishing feature of long-rangePC SW propagation. We observed similar interference in ourrecent work,17 dealing with long-range surface plasmon polaritonspropagation. The appearance of such interference means that thepropagation distance of the PC SW becomes much more thanthe waist of an incident Gaussian beam at the surface (this alsomay be easily seen on the sample surface by the naked eye). Inref 17, the origin of this interference is described in more detail.Note that the resonance peaks in Figure 2b are very sharp (dueto the long-range PC SW propagation), and this allows measure-ment of the resonance peaks position change with high precision.
The changes of the resonance peak positions P1 and P2 maybe converted to changes of the resonance angles ∆F1 and ∆F2.To derive the changes of the RI of the liquid and the adlayerthickness from the changes of the resonance angles of two PCSWs, we use two independent methods, which give similar resultsif the changes are small.
The first method is based on an analysis of influence of theadlayer deposition and the bulk RI changes on the dispersionrelation of the two optical surface modes. This method is in needof absolute values of the resonance angular parameters F1 and F2
and generates the absolute values of the RI of the externalmedium, ne ) ne(F1, F2), and the adlayer thickness, da ) da(F1,F2). The equations derived in the first method are cumbersomeand not presented here.
The second method is a pure linear method, based on theTaylor expansion. It is in need of relative changes ∆F1, ∆F2 andgenerates the relative changes of the RI of the liquid, ∆n )∆n(∆F1, ∆F2), and relative changes of the adlayer thickness, ∆d) ∆d(∆F1, ∆F2). In the second method, we take Taylor expansionof both resonance angle changes in terms of ∆n and ∆d:
From these equations, we obtain the desired values as functionsof measured ∆F1 and ∆F2:
where Kd and Kn are the ratio of the corresponding partialderivatives:
To obtain a dimensionless value proportional to ∆n in onechannel, and a dimensionless value proportional to ∆d in anotherchannel, we need only Kd and Kn coefficients (see the right-handside of eqs 3a and 3b). If we want to have ∆n in RI units and ∆din length units, we also need ∂F1/∂n and ∂F2/∂d correspondingly.All these coefficients may be obtained, for example, from atheoretical simulation of the real 1D PC structure. For thepresented structure, these coefficients are, Kd ) 0.415; Kn ) 0.1;∂F1/∂n ) 0.5(1/RI) and ∂F2/∂d ) 0.06(1/µm) (assuming that theadlayer RI is na ) 1.43).
To verify the sensitivity of the biosensor and to compare itwith existing label-free methods, we present the unsmoothedexperimental data of free biotin binding on the streptavidinmonolayer. Initially (Figure 3a), we present the buildup of thestreptavidin monolayer on the biotinylated surface. Streptavidin(diluted in PBS to a concentration of cstr ) 16 µg/mL) was runthrough the flow cell with volumetric flow rate vstr ) 0.4 mL/min. Then the flow cell was rinsed by PBS. In Figure 3a, one cansee that the adlayer thickness increases on 6.2 nm duringstreptavidin binding to biotinylated surface. All presented inFigure 3 data are obtained by the first method, based on thedispersion relation analysis.(17) Konopsky, V. N.; Alieva, E. V. Phys. Rev. Lett. 2006, 97, 253904.
Figure 2. Biosensor scheme (a) and a typical raw experimentalsignal from the diode array (b).
∆F1 ) ∆nF1 + ∆dF1 )∂F1
∂n∆n +
∂F1
∂d∆d (2a)
∆F2 ) ∆nF2 + ∆dF2 )∂F2
∂n∆n +
∂F2
∂d∆d (2b)
∆nF1 )∂F1
∂n∆n )
∆F1 - ∆F2/Kd
1 - Kn/Kd(3a)
∆dF2 )∂F2
∂d∆d )
∆F2 - Kn∆F1
1 - Kn/Kd(3b)
Kd )∂F2
∂d /∂F1
∂d(4a)
Kn )∂F2
∂n /∂F1
∂n(4b)
4732 Analytical Chemistry, Vol. 79, No. 12, June 15, 2007
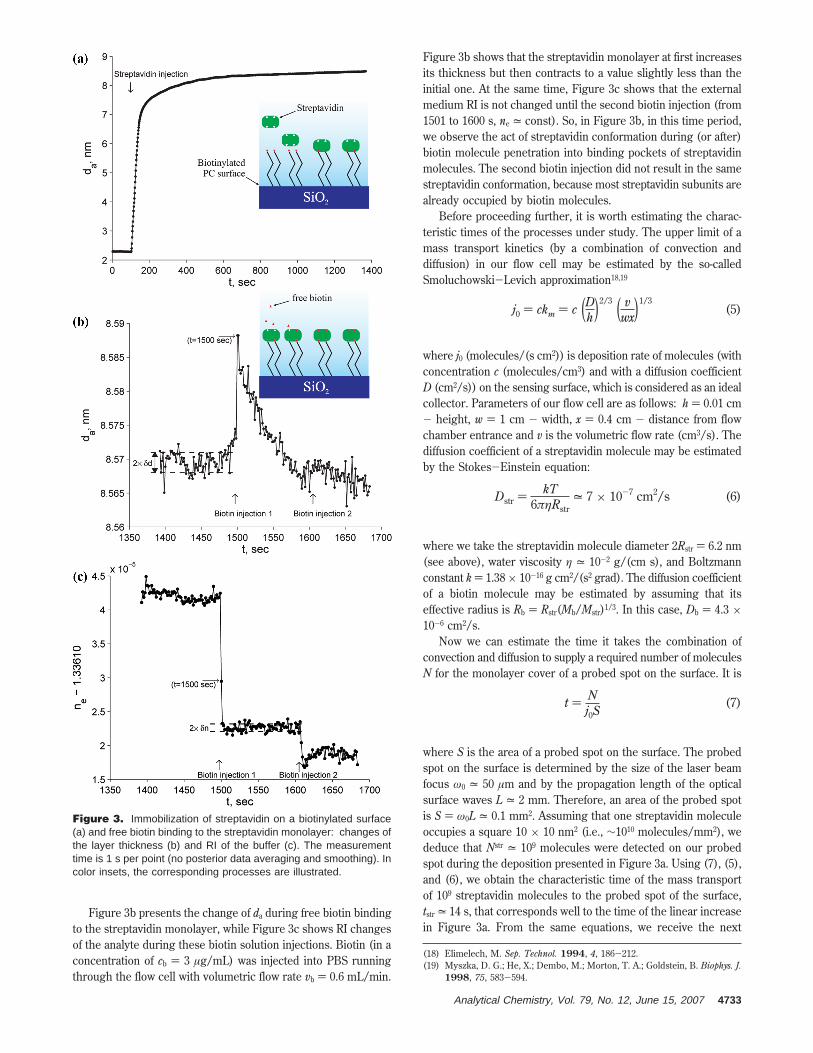
Figure 3b presents the change of da during free biotin bindingto the streptavidin monolayer, while Figure 3c shows RI changesof the analyte during these biotin solution injections. Biotin (in aconcentration of cb ) 3 µg/mL) was injected into PBS runningthrough the flow cell with volumetric flow rate vb ) 0.6 mL/min.
Figure 3b shows that the streptavidin monolayer at first increasesits thickness but then contracts to a value slightly less than theinitial one. At the same time, Figure 3c shows that the externalmedium RI is not changed until the second biotin injection (from1501 to 1600 s, ne = const). So, in Figure 3b, in this time period,we observe the act of streptavidin conformation during (or after)biotin molecule penetration into binding pockets of streptavidinmolecules. The second biotin injection did not result in the samestreptavidin conformation, because most streptavidin subunits arealready occupied by biotin molecules.
Before proceeding further, it is worth estimating the charac-teristic times of the processes under study. The upper limit of amass transport kinetics (by a combination of convection anddiffusion) in our flow cell may be estimated by the so-calledSmoluchowski-Levich approximation18,19
where j0 (molecules/(s cm2)) is deposition rate of molecules (withconcentration c (molecules/cm3) and with a diffusion coefficientD (cm2/s)) on the sensing surface, which is considered as an idealcollector. Parameters of our flow cell are as follows: h ) 0.01 cm- height, w ) 1 cm - width, x ) 0.4 cm - distance from flowchamber entrance and v is the volumetric flow rate (cm3/s). Thediffusion coefficient of a streptavidin molecule may be estimatedby the Stokes-Einstein equation:
where we take the streptavidin molecule diameter 2Rstr ) 6.2 nm(see above), water viscosity η = 10-2 g/(cm s), and Boltzmannconstant k ) 1.38 × 10⁻¹⁶ g cm2/(s2 grad). The diffusion coefficientof a biotin molecule may be estimated by assuming that itseffective radius is Rb ) Rstr(Mb/Mstr)1/3. In this case, Db ) 4.3 ×10⁻⁶ cm2/s.
Now we can estimate the time it takes the combination ofconvection and diffusion to supply a required number of moleculesN for the monolayer cover of a probed spot on the surface. It is
where S is the area of a probed spot on the surface. The probedspot on the surface is determined by the size of the laser beamfocus ω0 = 50 µm and by the propagation length of the opticalsurface waves L = 2 mm. Therefore, an area of the probed spotis S ) ω0L = 0.1 mm2. Assuming that one streptavidin moleculeoccupies a square 10 × 10 nm2 (i.e., ∼1010 molecules/mm2), wededuce that Nstr = 109 molecules were detected on our probedspot during the deposition presented in Figure 3a. Using (7), (5),and (6), we obtain the characteristic time of the mass transportof 109 streptavidin molecules to the probed spot of the surface,tstr = 14 s, that corresponds well to the time of the linear increasein Figure 3a. From the same equations, we receive the next
(18) Elimelech, M. Sep. Technol. 1994, 4, 186-212.(19) Myszka, D. G.; He, X.; Dembo, M.; Morton, T. A.; Goldstein, B. Biophys. J.
1998, 75, 583-594.
Figure 3. Immobilization of streptavidin on a biotinylated surface(a) and free biotin binding to the streptavidin monolayer: changes ofthe layer thickness (b) and RI of the buffer (c). The measurementtime is 1 s per point (no posterior data averaging and smoothing). Incolor insets, the corresponding processes are illustrated.
j0 ) ckm ) c (Dh )2/3 ( vwx)1/3
(5)
Dstr ) kT6πηRstr
= 7 × 10⁻⁷ cm2/s (6)
t ) Nj0S
(7)
Analytical Chemistry, Vol. 79, No. 12, June 15, 2007 4733
characteristic time of the mass transport of Nb ) 2Nstr = 2 × 10⁹
biotin molecules to the probed spot of the surface, tb = 0.16 s,i.e., less than the time of the single measurement (1 s). Thebiotin-streptavidin couple has extremely high binding affinity KA
) kon/koff ∼ 1013 (1/M), and therefore, the characteristic time ofbiotin-streptavidin binding estimated through its associationconstant kon ∼ 7.5 × 10⁷ (1/(M s))20 is in the millisecond range(at the concentration cb we used). However, the biotin-strepta-vidin association involved several transient intermediate steps, andthe simple framework based on the single association constantappears insufficient for detailed description of this binding. Thetransient intermediate steps include desolvation of five boundwater molecules in each biotin binding site. Then a flexible loopin streptavidin becomes immobilized after biotin binding in a biotinbinding pocket and closes the biotin binding pocket (and, hence,shields a biotin molecule from competition with solvent).21
The decrease of the streptavidin thickness in Figure 3b at 1501-1600 s may be this streptavidin postbinding conformational changeneeded for a stable interaction.
It may appear that the sharp thickness increase in Figure 3b(at 1499 s) is a data evaluation artifact due to sharp change of the
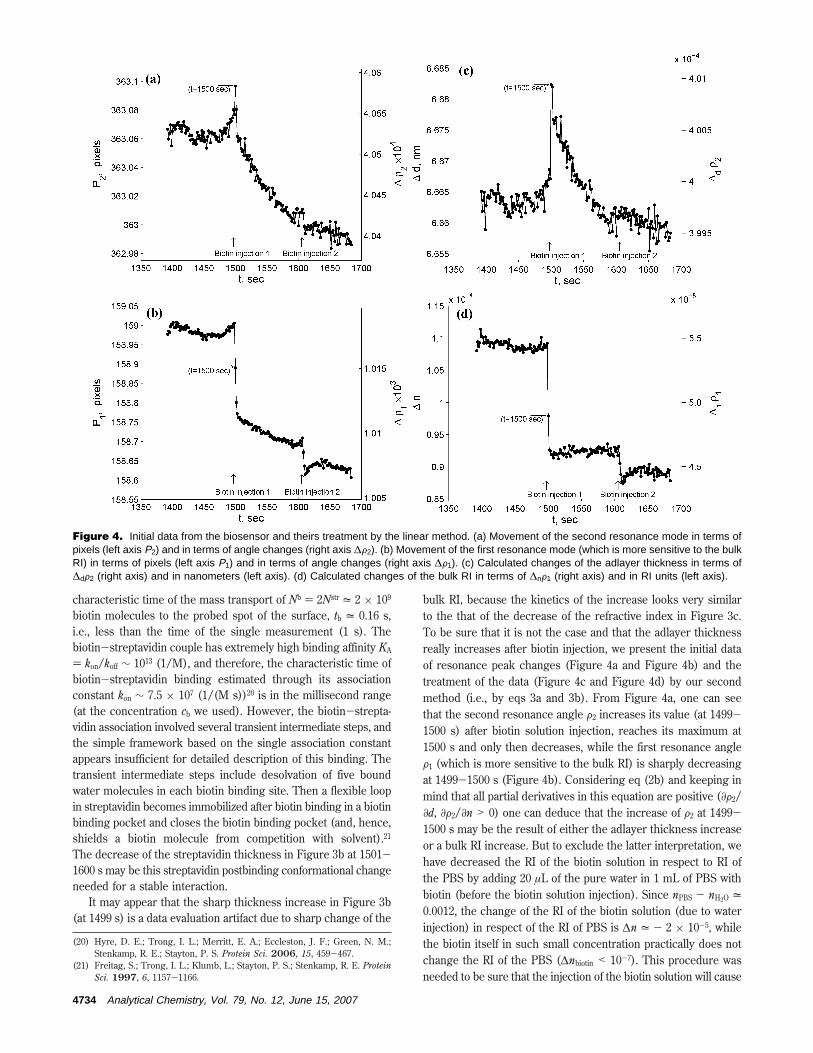
bulk RI, because the kinetics of the increase looks very similarto the that of the decrease of the refractive index in Figure 3c.To be sure that it is not the case and that the adlayer thicknessreally increases after biotin injection, we present the initial dataof resonance peak changes (Figure 4a and Figure 4b) and thetreatment of the data (Figure 4c and Figure 4d) by our secondmethod (i.e., by eqs 3a and 3b). From Figure 4a, one can seethat the second resonance angle F2 increases its value (at 1499-1500 s) after biotin solution injection, reaches its maximum at1500 s and only then decreases, while the first resonance angleF1 (which is more sensitive to the bulk RI) is sharply decreasingat 1499-1500 s (Figure 4b). Considering eq (2b) and keeping inmind that all partial derivatives in this equation are positive (∂F2/∂d, ∂F2/∂n > 0) one can deduce that the increase of F2 at 1499-1500 s may be the result of either the adlayer thickness increaseor a bulk RI increase. But to exclude the latter interpretation, wehave decreased the RI of the biotin solution in respect to RI ofthe PBS by adding 20 µL of the pure water in 1 mL of PBS withbiotin (before the biotin solution injection). Since nPBS - nH2O =
0.0012, the change of the RI of the biotin solution (due to waterinjection) in respect of the RI of PBS is ∆n = - 2 × 10⁻⁵, whilethe biotin itself in such small concentration practically does notchange the RI of the PBS (∆nbiotin < 10-7). This procedure wasneeded to be sure that the injection of the biotin solution will cause
(20) Hyre, D. E.; Trong, I. L.; Merritt, E. A.; Eccleston, J. F.; Green, N. M.;Stenkamp, R. E.; Stayton, P. S. Protein Sci. 2006, 15, 459-467.
(21) Freitag, S.; Trong, I. L.; Klumb, L.; Stayton, P. S.; Stenkamp, R. E. ProteinSci. 1997, 6, 1157-1166.
Figure 4. Initial data from the biosensor and theirs treatment by the linear method. (a) Movement of the second resonance mode in terms ofpixels (left axis P2) and in terms of angle changes (right axis ∆F2). (b) Movement of the first resonance mode (which is more sensitive to the bulkRI) in terms of pixels (left axis P1) and in terms of angle changes (right axis ∆F1). (c) Calculated changes of the adlayer thickness in terms of∆dF2 (right axis) and in nanometers (left axis). (d) Calculated changes of the bulk RI in terms of ∆nF1 (right axis) and in RI units (left axis).
4734 Analytical Chemistry, Vol. 79, No. 12, June 15, 2007
the bulk RI to decrease only. Therefore, the increase of F2 at 1499-1500 s may be the result of the adlayer thickness increase only.The exact value of the corresponding calculated adlayer thicknessincrease ∆d (but not its sign) in Figure 4c depends on theexactness of the numerical values of the coefficients pointed aftereq 4. But, inasmuch as the expected bulk RI change ∆n = - 2 ×10⁻⁵ corresponds well to the results from Figures 3c andFigure 4d (calculated with the same coefficients), we expect thatthe calculated value of the adlayer thickness increase ∆d is alsoreasonably accurate. From Figures 3b,c and Figures 4c,d, one cansee that our first (dispersion analysis) and the second (linear)methods of the initial data treatment give the very similar results(though, certainly, do not coincide point to point).
In compliance with the work,22 we suppose that the processof the biotin-streptavidin binding is a good candidate forcomparison of the signal/noise ratio of different label-free tech-niques. We believe that for comparison of the signal/noise ratioit is also very important always to point out the time of themeasurement and the fact of posterior data averaging, smoothing,or both (which increase the effective measurement time). In otherwords, the noise should be reduced to 1/Hz1/2 value. In ourexperiments, the signal accumulation time was 1 s per point andno posterior data averaging or smoothing was done. The noise(i.e., standard deviation - std) of the thickness measurement wasequal ∂d ) std(da) = 1.3 pm/Hz1/2. The noise of the measurementof the external medium RI was ∂n ) std(ne) = 5 × 10⁻⁷/Hz1/2. InFigure 3b, one can see that we detected the streptavidin confor-mation process during free biotin binding with a (signal/noise)b
ratio of ∼15. The deposition of the streptavidin monolayer wasdetected with a (signal/noise)str ratio of ∼5000. Taking intoaccount the (signal/noise)str ratio, we obtain a minimal quantityof streptavidin molecules that may be detected at the probed spotof our setup: Nmin
str ) Nstr/(signal/noise)str = 200 000 streptavidinmolecules. This corresponds to a mass detection limit mmin
str )Nmin
str Mstr/NA = 2 × 10-14 g ) 20 fg of the analyte on the probedspot of the surface (NA = 6 ×10²³ is Avogadro’s number). Forbiotin molecules, we have a minimal detectable quantity equal to
Nminb ) 2Nstr/(signal/noise)b = 1.3 × 10⁸ biotin molecules or
mminb ) Nmin
b Mb/NA = 50 fg of the analyte on our probed spot.Here we have assumed that in the process presented inFigure 3b each streptavidin molecule picks up two biotin mol-ecules. If a streptavidin molecule picks up only one biotin moleculethan this minimal detected mass is twice as small. We believethat the noise of the presented technique could be furtherdecreased by improving the quality of the dielectric multilayercoating and by decreasing the laser noise.
CONCLUSIONSWe have employed the two different optical modes on the
photonic crystal surface for the optical sensing of biomolecularinteractions. Unique properties of photonic crystals were used forthe excitation of optical waves along the photonic crystal surfaceso that the evanescent field of one wave penetrates much deeperinto the liquid volume. This wave is used as a reference for theRI of the liquid. The simultaneous registration of the two modes,reported here as a proof of principle, gives a possibility to deriveboth the RI of the liquid and the adlayer thickness. This permittedus to segregate the volume and the surface signals from theanalyte, increase the sensitivity of biomolecule detection, andrecord the act of streptavidin conformation during binding of biotinmolecules. Independent registration of the adlayer thickness andthe temperature-dependent RI of the liquid may be potentiallyuseful for design of a temperature-controlled flow cell, which maybe considered as a biochemical reactor for evaluation of temper-ature dependency of reactions at the surface.
ACKNOWLEDGMENTThe authors thank S. Grachev for the kind donation of some
biochemicals and for helpful advises about surface preparation.This work was partly supported by the European Network ofExcellence, NMP3-CT-2005-515703-2.
Received for review February 9, 2007. Accepted April 13,2007.
AC070275Y(22) Zybin, A.; Grunwald, C.; Mirsky, V. M.; Kuhlmann, J.; Wolfbeis, O. S.;
Niemax, K. Anal. Chem. 2005, 77, 2393-2399.
Analytical Chemistry, Vol. 79, No. 12, June 15, 2007 4735
Related Documents
![Silicon Photonic Biosensors for Lab-on-a-Chip Applicationsdownloads.hindawi.com/journals/aot/2008/383927.pdfoptical readout [11], porous silicon [12, 13], and so forth. The advantages](https://static.cupdf.com/doc/110x72/6106df218caf7233f7657465/silicon-photonic-biosensors-for-lab-on-a-chip-a-optical-readout-11-porous-silicon.jpg)