Meters and Electrodes pH, ISE, COND AND O 2 | PRECISE - RELIABLE - SELECTIVE IN LAB AND FIELD IN LAB AND FIELD pH, ISE, LF UND O 2 MESSEN — GENAU, ZUVERLÄSSIG, SELEKTIV pH, ISE, LF UND O 2 MESSEN — GENAU, ZUVERLÄSSIG, SELEKTIV Photometry Tips and Tricks

Welcome message from author
This document is posted to help you gain knowledge. Please leave a comment to let me know what you think about it! Share it to your friends and learn new things together.
Transcript

Meters and ElectrodespH, ISE, COND AND O2 | PRECISE - RELIABLE - SELECTIVEIN LAB AND FIELDIN LAB AND FIELD
pH, ISE, LF UND O2 MESSEN — GENAU, ZUVERLÄSSIG, SELEKTIVpH, ISE, LF UND O2 MESSEN — GENAU, ZUVERLÄSSIG, SELEKTIVPhotometry Tips and Tricks

Xylem Analytics Germany Sales GmbH & Co. KG, WTWDr.-Karl-Slevogt-Straße 1 D-82362 WeilheimGermany
Tel: +49 881 183-0Fax: +49 881 183-420E-Mail: [email protected]: www.XylemAnalytics.com
Photometry Tips and Tricks

70 Years of Experience
Photometric measurement procedures generally belong to the most important measurement techniques.In Research and Development (R&D) labs they are applied in search of new substances and enzymatic or biochemical reactions. In environmental applications, photometry serves to monitor environmental impacts. And, besides the big field of water analysis photometric procedures also ensure quality e.g. in food and beverages. The methodology complies absorbance or transmission measurement, concentration determination as well as scan and kinetics measurement. Since decades, the WTW® photometers simplify complex photometric tasks to offer a comfortable and fast measurement procedu-re by means of automatic settings and analytical quality assurance (AQA).
With this primer we want to help the user get to know the basics of mea-surement, make reasons and procedures clearer to the user, and, last but not least, provide practical tips for handling and maintenance.
We are happy to be at your disposal at any time, just give us a call!
Dr. Robert Reining and Ulrich Schwab (Directors of Xylem Analytics Germany GmbH)

CONTENTS
Chapter 1
Feasible measured values – the ten most important questions and answers 6
1.1 „The limit of the measurable“ .......................................................... 61.1.1 Measured value wrong? .......................................................... 6
1.1.2 Is the value not „ accurate enough“ ...................................... 7
1.1.3 Which benefits do the double and three-fold determinations offer? ............................................................... 8
1.1.4 What is the benefit of a control standard? .......................... 9
1.1.5 How do I increase the measured value accuracy? ............. 9
1.2 Trouble shooting ..............................................................................101.2.1 I cannot achieve a feasible measured value. Why ? ........11
1.2.2 What is a matrix check? .........................................................12
1.2.3 What is a carryover? ...............................................................13
1.2.4 Has the test been carried out correctly? ............................15
1.2.5 How do I store test kits properly? ........................................15
Chapter 2
From calibration curve to photometric method data The basic principles of calibration 17
Chapter 3
Chlorine – disinfectant in the water industry 19
3.1 pH value and redox: Important indicators for the disinfection effect .........................203.2 Turbidity particles: Source of contamination .............................213.3 A „real“ multi-parameter device for monitoring .......................213.4 Chlorine test kits - a tough choice ................................................23
Chapter 4
Photometric Colorimetry 26
4.1 Color scales ......................................................................................26
4.2 Water analytics ................................................................................27
4.2.1 Spectral absorption coefficient ...........................................27
4.2.2 ADMI color number ...............................................................28
4.3 Industrial applications .....................................................................28
4.3.1 EBC color number .................................................................28
4.3.2 ASBC color number ...............................................................29
4.3.3 Sugar color ICUMSA ..............................................................29
4.3.4 Hazen/APHA/Pt-Co-color number ......................................29
4.3.5 Yellowness Index .....................................................................30
4.3.6 Gardner color number ...........................................................30
4.3.7 ASTM color scale (mineral oil products) ............................31
4.3.8 Iodine color number ..............................................................31
4.4. Color spaces ....................................................................................31
4.4.1 CIE-L*a*b color space ............................................................33
4.4.2 CIE-L*u*v-Farbraum ...............................................................35

6
Photometry Tips and Tricks
Since the start of the photometry compendium, we have collected the most frequently asked questions about the subject „How to achieve good measured results?“ and com-piled them into a favorite list. Here, important subjects include the „Lim-its of the measurable“ and „Recog-nize error sources“. The individual questions involve intertwined topics. They are therefore summarized into the above mentioned topic blocks and clarified by means of the exam-ple „COD measurement“:
1.1 „The limits of the measurable“• Is my measured value wrong
• Is the value not „accurate enough“?
• Why should I perform a dou-ble or three-fold determina-tion?
• What is the benefit of a con-trol standard?
• How do I increase measure-ment accuracy?
1.1.1 Measured value wrong?
Basically, every measuring proce-dure has a resolution limit, either an instrumental and/or a chemical one. The further you conduct the measurement toward the lower end of the measuring range – i.e. at the lower limit of the measure-ment method – when using test kits for routine analysis, you will enter the area of the procedural detection limit.
As a percentage, this will strongly effect the maximum achievable accuracy for the measured value in the lower measuring range. At the upper end, the percentual ef-fect is lower, however, you should avoid exceeding the measuring range. Therefore, the general recommendation is to measure as closely to the measuring range center as possible and perhaps to repeat the measurement using a more suitable test kit.
A simple COD example clarifies this:
Chapter 1
Feasible measured values – the ten most important questions and answers
7
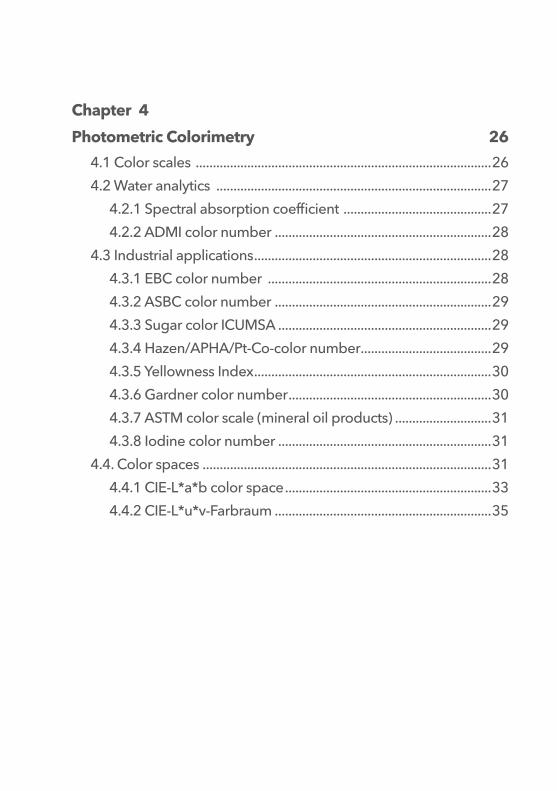
Using a COD test kit with a mea-suring range of 25-1500 mg/l, the maximum accuracy is ± 30 mg/l (s. Fig. 1: Procedure characteris-tics). This means that the „error“ or rather the tolerance, at the lower end of the measuring range, is even a little higher than the lower measuring range value itself. With this, the measured values of two parallel determinations can already be 60 mg/l apart, which is not an error, but still within the allowed tolerance range. This shows very clearly that the indi-cation of absolute values instead of percentual indications of the variance makes more sense in the lower measuring range.
1.1.2 Is the value not „accurate enough“
If a suspected „inaccurate“ mea-sured value is yielded, you should first look at the characteristics of the test kit you are using: Are the variances between two results ac-tually severly incorrect or are they within the permissible tolerance range for the test procedure?
For the determination of the dissolved substances nitrite, nitrate etc., there is usually a lower tolerance. With these highly re-acting parameters you must make sure that the sample is filtered or stabilized adequately in order to prevent the sample from chang-
Excerpt from the package insert of the WTW® test kit C4, COD for 25-1500 mg/l, procedure characteristics
8
Photometry Tips and Tricksing from the time of sampling un-til measurement. Otherwise, the condition of the sample during the determination will not match its condition during sampling.
1.1.3 Why should I perform a double or three-fold determination?
A single determination can, as described in questions 1.1.1) and 1.1.2), yield measured values which vary up or down within the tolerance range. However, there can be so-called outliers. Basi-cally, a single determination is always prone to errors. Especially with parameters being relevant for discharge fee, this can result in higher expenses in case of incorrect readings, than the costs when using of several test kits for a double or three-fold determi-nation. This is shown well by our COD example:
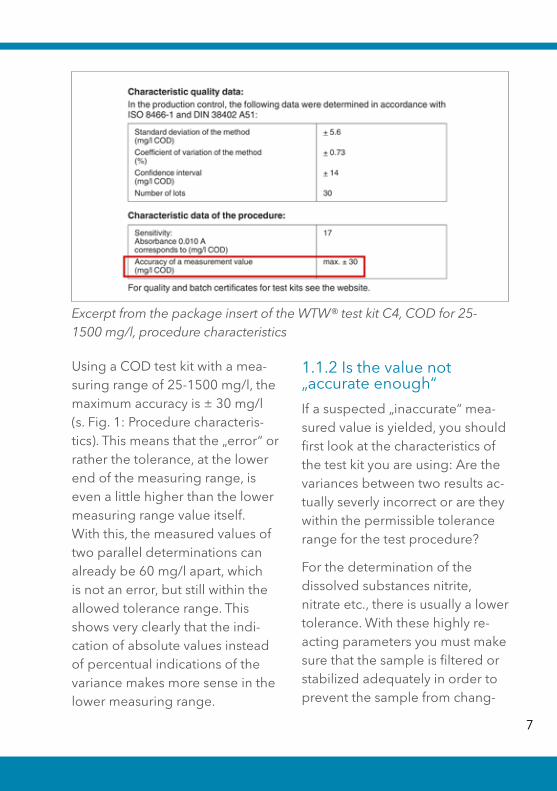
If from the effluent of a waste-water treatment plant a large COD-relevant particle is pipetted into a test cuvette, the measured value can be high or significantly higher than the actual average sample value. This outlier can be proven specifically using a three-fold determination: You can eliminate this if the two other de-
terminations yield a similar value – and, like in our example – lower values. A double determination can be used to calculate an aver-age value in case of similar values within the procedural tolerance range. In case of a high deviation of readings, a repetition of the measurement is recommended, especially if you are measuring at the measuring range limits (see 1.1.1). In this case, you must use a more suitable test. If this test once again yields unexpected results, a systematic troubleshooting process must be conducted, as described in chapter 1.2.
Fig. 2 COD test in three-fold de-termination

9
1.1.4 What is the benefit of a control standard?
A control standard will provide further facts about the measured value: Instead of the sample, a given concentration of the ana-lyte is pipetted here. Following a proper execution of the test, this must be found acc. to the proce-dure characteristics, meaning with an accuracy of ±X mg/l: This way, you will be certain that the entire measuring system, consisting of the pipette, test kit and device is in good order and that the test was performed without errors.
Using the COD example: If an 80 mg/l COD standard with an accuracy of ± 8 mg/l is used, the yielded measured value must be between 72 and 88 mg/l. If this re-sult is incorrect, check the expiry of the used test and standard first (see chapter 1.2.5).
1.1.5 How do I increase measurement accuracy?
In addition to the above-men-tioned measures like a control standard and multiple determina-tion, a few basic measures de-serve to be mentioned here:
Increasing the measured value accuracy by zeroing the device
The photometer zero can be important here: If a zeroing with de-ionized water is not performed reg-ularly on filter photometers, a slight drift of the device can already cause significant deviations of the result. In case of our COD test C4/25 (25-1500 mg/l), this means 17 mg/l for each zero deviation of 0.010 absor-bance units (see Fig. 1, Procedure characteristics, sensitivity). This way, the error caused by the absorbance of the zero point shift must be added to the tolerance range of the test kit, in our case this would add another 17 mg/l per each 0,010 nm drift to the +30 mg/l tolerance. When transporting a photometer for field or onsite measurement, a zeroing is mandatory due to good laboratory practice (GLP). Tempera-ture variations in a trunk may lead the drift of the zero.
Increasing the measured value accuracy by means of blank val-ue and cuvette orientation
Generally, the reagent blank val-ues of the tests – i.e., their self-col-oration – are stored along with the method data or programs. They are determined on the basis of several lots. When performing trace analysis, such as manga-nese in drinking water or nitrite

10
Photometry Tips and Tricksas a substance with quick turn over, we recommend determining and storing the respective current reagent blank value for each lot: As fluctuations within the permissible tolerance range are to be expect-ed during production, these slight fluctuations can be eliminated by storing the actual lot reagent blank for each new lot. Thus, the measured value will be even more accurate – especially for smallest concentrations.
In addition to this, attention should be paid to the orientation of the rectangular cuvettes for trace anal-ysis: Cuvettes cannot be produced 100% homogeneously. In order to avoid variances between different cuvettes and also within the same cuvette, the reagent blank as well as the measured value can be de-termined in the same cuvette with the same orientation.
Fig. 3 Cuvette orientation
The cuvette orientation can easily be identified and observed by the manufacturer logo or another marking.
1.2 Trouble shooting• Why don‘t I get a feasible
result?
• What is a matrix check?
• What is a carryover?
• Has the test been carried out correctly?
• How do I store test kits prop-erly?
1.2.1 Why don‘t I get a feasible result?
If you rate the result not being feasible after checking the mea-sured values by means of proce-dure characteristics and a control standard, one must start search-ing inside the system:
• Is sampling with cooling or sample treatment such as filtration or fixation of the sample OK?
• Is there a pipetting error
• Is there a carryover from another sample caused by a contaminated pipette (see chapter 1.2.3)?
11
• Is the device working properly? Most photometers offer an instrument check via AQA procedures (Analytical Quality Assurance). This can be found in the respective manual.
• Has the correct measuring range been selected?
• Is the the test kit faulty? Is the test expired, has been stored incorrectly or been handled correctly? To check this see con-trol standards (chapter 1.1.4).
• Is there an disturbing = for-eign substance in the sample matrix (see chapter 1.2.2)?
Experience has shown that the error is very rarely related to the device or the test kit itself. The
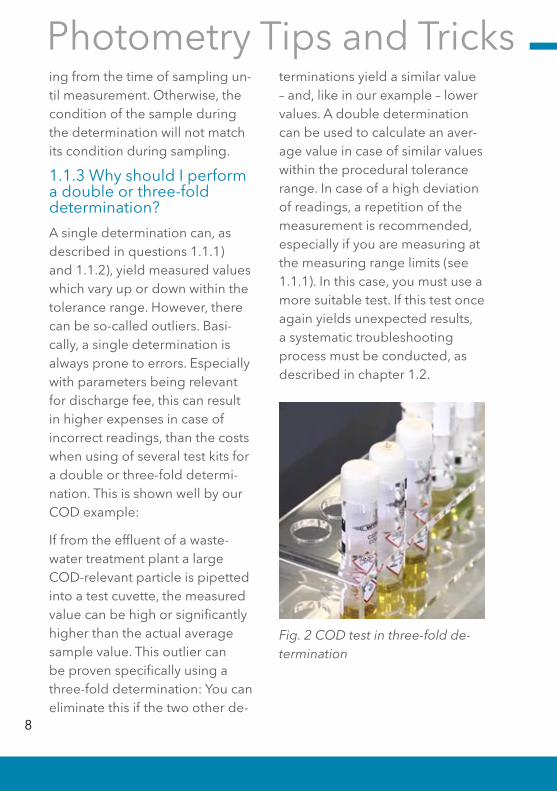
use of an inappropriate test kit or an unsuitable cuvette is often the most likely of all errors:
• In the UV range quartz glass cuvettes are mandatory; glass cuvettes will not yield a result due to their transmission char-acteristics!
• Disposable plastic cuvettes are usually unsuitable for UV ranges below 220 nm due to their transmission characteristics.
• Disposable plastic cuvettes must always be tested for their suitability of use in the application and device prior to using them on a large scale: Due to the cuvette de-tection systems, devices with
Fig. 4 Transmission curves of cuvettes of different glass types (Courtesy of Hellma GmbH & Co. KG)

12
Photometry Tips and Tricksautomatic cuvette detection usually require structured side surfaces in order to conduct a proper measurement. Non-detection can lead to a zero shift and therefore to erroneous measuring results, depending on the device.
1.2.2 What is a matrix check?
The matrix check is used to find and exclude interferences in the sample matrix. It is also known as standard addition procedure, stocking or spiking. With this pro-cedure it is checked whether the measurement results are falsified by other substances contained in the sample.
For the matrix check, a small amount of a known and high con-centration of the tested substance is added to the sample: If you find this value, there is no interference in the matrix. In this case, other possible causes for the error, such as proper sample preservation or the pipette that was used, must be examined. However, if you do not find the added substance concentration, this usually points to a masking or overlapping of the analyte by another com-pound. Examples are complex
formers that „retain“ the analyte. The permissible concentration of foreign or disturbing ions is often indicated in package inserts.
Fig. 5 CombiCheck 10 with stan-dard and stocking solution
Mercury-free COD and ChlorideCOD is a good example to greatly describe the effect of chloride as an interfering substance: With the standard-conforming COD de-termination by means of mercury sulfate, the mercury sulfate „catch-es“ the chloride ions dissolved in the sample as water-soluble HgCl2 and thus masks the chloride. How-ever, if you leave out the mercury (sulfate) using mercury-free COD tests, the chloride is partially cap-tured as COD via its reaction with dichromate and thus results in too high readings.

13
1.2.3 What is a carryover?
Carryover means introducing contamination and foreign sub-stances into the system from other samples or reagents and thus causing measuring errors: Sourc-es for this carryover include:
• Contaminated vessels and devices during sampling
• Incorrect cleaning of repeat-edly used cuvettes or vessels (parameter-dependent clean-ing requirements)
• Contaminated deionized water for dilution
• Pipettes and pipette tips: Han-dling, rinsing, storage
Incorrect handling of the pipettes will also result in contamination: If a sample or a reagent is sucked into the pipette cone, these
substances will be carried over into the next sample and can act as interfering ions and thus falsify measuring results. If pipettes are stored incorrectly, namely with the cone facing down and per-haps even with a used pipette tip, reagent or sample substances will also flow into the pipette. Multiple use of pipette tips with different samples is also a common error source. For COD measurement, the pipette tip should be rinsed with a little amount of sample in a separate vessel in order to remove plastic chips on the tip. These plastic chips take the effect of a C-source (carbon) during di-gestion and you will get too high readings.
Deionized water must be lint-free and not used after being stored for extended periods of time. For
Fig. 6 Too high readings with mercury-free COD tests

14
Photometry Tips and Tricksour example of COD, a contam-ination of the deionized dilution water in plastic bottles that have been stored too long could be an error source: The plastic of the PE bottle carries over into the water as a COD-relevant carbon, which yields in too high COD value. De-ionized water in glass bottles will eliminate this error source.
1.2.4 Has the test been carried out correctly?
The analytical procedures show the correct process for work-ing with test kits. There are test, which are more robust, others are more sensitive, featuring higher cross-sensitivities. Thus, trans-fering the sample of a prepara-tion cuvette into the measuring cuvette can lead to undesired ef-fects. When performing measure-ments in the trace range, influenc-es such as the method of shaking or dosing, formation of bubbles by pipetting too rapidly and the reaction times for the dissolution of bubbles have a significant im-pact on the measuring result.
For our COD example, the correct handling after completing the digestion time during the cooling phase is an especially important factor: The cuvette should be gen-
tly swiveled once after about 10 minutes in order to transfer con-densation drops from the lid into the sample: This drop contains „COD“ and increases the measur-ing accuracy once it is transferred into the solution. The subsequent slow cooling down of the sam-ple bears the advantage that the precipitation can settle slowly and will not interfere with the mea-surement in form of turbidity.
Looking at all these facts, it is worth it to read package inserts or analysis guidelines – and perhaps to slow down pipetting speed.
1.2.5 How do I store test kits properly?
Many reagents can be stored at room temperature up to 20–25°C, any temperature higher than this tend to spoil them and make them disintegrate or will affect their shelf life, similar to pharma-ceuticals. If the reagents freeze, their structure may be altered, which would impair or destroy their effectiveness. Also, strong light can influence reagents via photolysis.
15
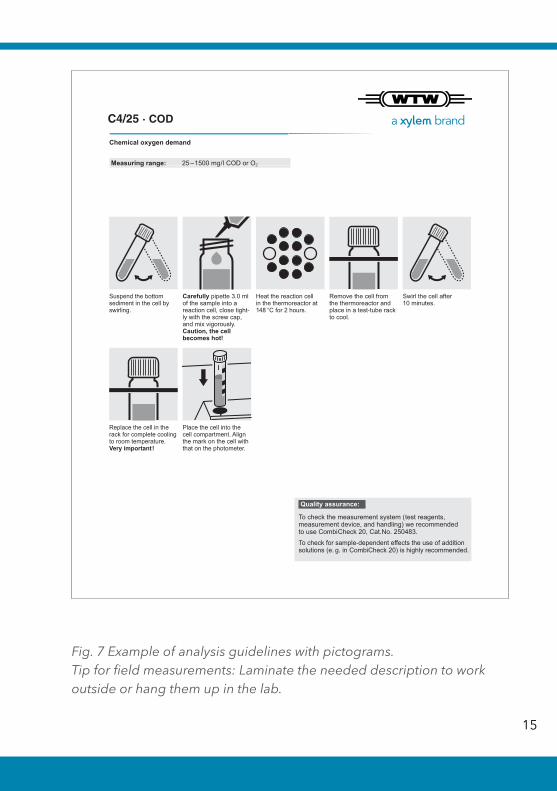
Fig. 7 Example of analysis guidelines with pictograms. Tip for field measurements: Laminate the needed description to work outside or hang them up in the lab. 54ba75728e10 06/2016 photoLab® / spectroFlex Serie 6000/7000
C4/25 · COD
® ®
Place the cell into the cell compartment. Align the mark on the cell with that on the photometer.
Carefully pipette 3.0 ml of the sample into a reaction cell, close tight-ly with the screw cap, and mix vigorously. Caution, the cell becomes hot!
Suspend the bottom sediment in the cell by swirling.
Heat the reaction cell in the thermoreactor at 148 °C for 2 hours.
Remove the cell from the thermoreactor and place in a test-tube rack to cool.
Swirl the cell after 10 minutes.
Replace the cell in the rack for complete cooling to room temperature. Very important!
Measuring range: 25 �1500 mg/l COD or O2
Chemical oxygen demand
Quality assurance:
To check the measurement system (test reagents, measurement device, and handling) we recommended to use CombiCheck 20, Cat.No. 250483.
To check for sample-dependent effects the use of addition solutions (e. g. in CombiCheck 20) is highly recommended.

16
Photometry Tips and Tricks
Fig. 5 The C4/25 test kit label with storage information
Therefore, you should only bring the required number of reagents to localities in the field.
Test kits, such as COD cells, are subject to photolysis and must be stored away from light. Using a control standard, you can usually recognize these errors at one glance: The found concentration mostly differs from the permissi-ble tolerance range.
17
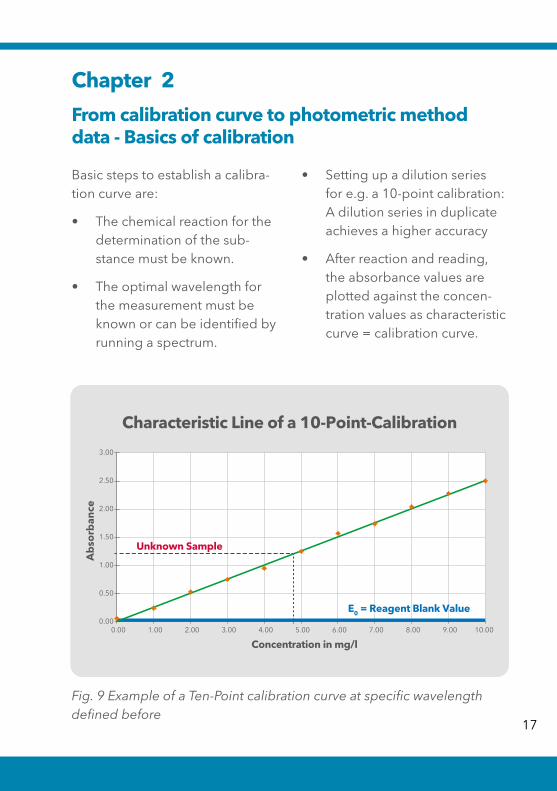
Basic steps to establish a calibra-tion curve are:
• The chemical reaction for the determination of the sub-stance must be known.
• The optimal wavelength for the measurement must be known or can be identified by running a spectrum.
• Setting up a dilution series for e.g. a 10-point calibration: A dilution series in duplicate achieves a higher accuracy
• After reaction and reading, the absorbance values are plotted against the concen-tration values as characteristic curve = calibration curve.
Chapter 2
From calibration curve to photometric method data - Basics of calibration
Characteristic Line of a 10-Point-Calibration
Ab
sorb
ance
Concentration in mg/l
E0 = Reagent Blank Value
Unknown Sample
0.00
0.50
1.00
1.50
2.00
2.50
3.00
0.00 1.00 2.00 3.00 4.00 5.00 6.00 7.00 8.00 9.00 10.00
Fig. 9 Example of a Ten-Point calibration curve at specific wavelength defined before

18
Photometry Tips and Tricks• In the past, the plotting has
been done on scale paper: The unkown sample concen-tration has been appraised directly from the curve or by calculation with slope factor.
Today‘s photometers offer easy measurement with pre-pro-grammed method data and easy set-up of user-defined calibration curves. User-guidance on screen is supporting:
• General settings for cuvette size, measurement range, wavelengths etc.
• Measuring the calibration solutions with averaging in case of multiple batches (up to 10 dilution batches)
• Alternatively, entering a char-acteristic curve simply via a known slope factor.
• The blank value (E0) can be stored.
• Calibration characteristics are stored with a method (pro-gram) identification (number or name)
• Automatic setting of wave-length and measuring range during method selection via program list or Barcode.
• Switching citations and units
• Setting of AQA default values for standard solutions and checking intervals
Method number: 31 Test name: 14560 Wavelength: 340 nm Cuvette size: 16 mm
Citation: CSB Range: 4-40 Unit: mg/l
Fig. 10 photoLab® 7000 Series - Display: Beside the COD value, addi-tional information are displayed

19
Chapter 3
Chlorine – disinfectant in the water industry
Based on its chemical character-istics and its reactivity response, chlorine is very well suited for dis-infection of water and to prevent contamination with bacteria and pathogens. Chlorine introduced into water exists in a pH-depen-dent balance; with a neutral pH level foremost as a Hypochlorous acid (HClO):
Cl2 + H2O ⇐ HClO + HCl
Hypochlorous acid is a strong oxidizing agent: Its disinfecting effect consists of the irreversible clumping of protein of viruses and bacteria - similar to the effect of heat exposure.
With an increasing pH value, the balance in the water is shifted to the hypochlorite, which lowers the disinfecting effect:
HClO + H2O ⇐ ClO– + H3O+
The regulation of the disinfection, of the agents used and the de-sired effect is discussed in nation-al ordinances, as well as in superi-
or organs such as WHO or the EU and the respective directives are constantly adapted.
Chlorine is added as chlorine gas, chlorine compounds, such as sodium hypochlorite or chlorine dioxide and is used
• for emergency chlorination
• transport chlorination for bro-ken pipes and contamination by germs in water protection areas, in wells, in the ground-water or during flood impact as well as for the protection from contamination in pipes. In the framework of the Ger-man drinking water ordinance 2001 (TrinkwV 2001) with the supplements added up until today, adding a max. of 1.2 mg/l free chlorine is permit-ted. After the completion of the mixture, no more than 0.3 mg/l of free chlorine must re-main in the water. Areas with (temporary) exceptions could be e.g. flood zones.

20
Photometry Tips and Tricks• for the standard disinfection
during drinking water produc-tion (in some countries; not in Germany).
• for the disinfection in pools and of basin water
The measurement of chlorine is also a deciding parameter for quality monitoring of drinking water as well as pool and basin water. In the wastewater industry, only sporadic measurements are conducted, e.g. during interfer-ences, such as the inflow of chlori-nated water from pools.
§ 11 of the TrinkwV 2001, Section Ic regulates the list of processing substances and disinfection-pro-cedures, including limit values and approved chlorination sub-stances.
The water treatment of pool and basin water is defined in the standard DIN 19643. The chem-istry of disinfection with chlorine and side products that can be created in pool and basin water is very complex. The typical pool odor is mostly not caused by chlorine but by the reaction of the chlorine with the urea that enters the water through human skin and urine which turns them into
nitrogenous chloramines such as monochloramine. The conversion products are combined as so called bound chlorine. Therefore, basin water have different limit values than drinking water. They are - as also published in the Federal Health Bulletin of 2014 by the Public Health Department - at 0.3 – 0.6 mg/l free chlorine. For bound chlorine, this value is at 0.2 mg/l.
3.1 pH value and redox: Important indicators for the disinfection effectThe measurement of chlorine is accompanied by the measure-ment of the pH value and often with the redox voltage (ORP). The pH value is an indicator for the disinfection measurement: Due to possible pH shifts into the basic range because of the con-tamination of the basin water, in exceptional cases, concentrations of up to 1.2 mg/l free chlorine are permitted, as the chemical balance HClO/ClO– shifts from Hypochlorous acid to hypochlo-rite, which lowers the disinfecting effect.
The measurement of the redox value is an indicator of the ratio

21
between oxidizing to reducing substances, such as the con-tamination of the basin water. Thus, this provides information regarding the disinfection ca-pacity of the chlorinated water: If the redox voltage is lower, there are more reducing substances and they may require a higher chlorine volume for the disin-fection compared to water with a higher redox voltage. On the other hand, the lower value of the chlorine concentration of 0.2 mg/l depending on the (high) redox voltage may be permitted.
3.2 Turbidity particles: Source of contaminationEspecially during flood or in swimming lakes, another import-ant indicator parameter is added for disinfection: turbidity. Turbidi-ty particles are a great settlement location for microorganisms. This makes turbidity itself an indicator of an increased risk for microbi-al contamination. The Drinking Water Ordinance lists an upper limit values of 1 FNU (Formazine Nephelometric Unit) or 1 NTU (Nephelometric Turbidity Unit).
3.3 A „real“ multi-parameter device for monitoringIn addition to self-monitoring by municipal water suppliers, operators of thermal baths and pools and similar operators in the water industry, especially health departments are busy in this sensible area: From emergency inspections related to introducing measures to regular monitoring.
Many health departments and water suppliers as well as service labs therefore even use several pHotoFlex® Turb for the mobile monitoring of drinking water systems, wells, community pools or thermal baths. This portable photometer has all necessary programs for photometric water inspections to the smallest of measuring ranges by means of the flexible cuvette system of 16 and 28 mm cuvettes as well as the standardized colorizing mea-surement at 436 nm in (drinking) water.
Being a true multi-parameter device, it covers the important pa-rameters pH, redox voltage (ORP) and turbidity in addition to the photometric measurements such

22
Photometry Tips and Tricksas chlorine: The measurement of pH and redox voltage is conduct-ed via classic electrochemical sensors with calibration protocols. The important nephelometric turbidity measurement by means of infrared light allows a measure-ment to the lowest measuring range - as per standard and suit-able for drinking water with lab quality offering adjustable calibra-tion interval and documentation.
3.4 Chlorine test kits - a tough choiceThe bandwidth of the chlorine test kits for bound and free chlo-rine, total chlorine and monochlo-ramine is huge. How does a user find his way through this thicket?
The price is not always the only criterion. And frequently, the expensive cell / round cuvette test with analytical quality assurance and bar code is even cheaper and more cost-efficient than the seemingly reasonable test. There-fore, the following requirements
Fig. 11 pHotoFlex with celltests and powder pillows tests

23
should be considered during the selection process:
• Is analytical quality assurance (AQA) desired?
• What is the required lower limit of the measuring range?
• Will the measurements take place in the lab or in the field?
• How often will measurements be conducted?
• Is there high humidity or strong wind in the measurement envi-ronment?
• Is there a large pH window during the test execution?
• What is the total cost?
For health departments, there will be a pre-selection of tests with batch certificates due to the desire for AQA. If series inspections are conducted, there is a lot of routine: Here, the price to performance ratio for test kits in the 10, 20 and 50 mm rectangular cuvettes is extremely good. Also, these test kits cover a large measuring range up to the trace analysis. The ones who measure less, appreciate the uncomplicated handling with the highest possible comfort. For the selection of the measuring system,
the site of use can be a deciding factor: Will you measure a lot in the field or will the lab conditions be available on the road as well? Test kits, such as the small packaged sin-gle portions with powder pillow kits are very cost-effective and practical in a dry and wind-protected envi-ronment. Here are the details of the different test types:
Round cell tests with batch cer-tificate of quality are mostly one thing: super comfortable and easy to handle. Depending on the test, a combined determination of free and total chlorine. Round cuvette tests are packaged as a set with ready-to-use cuvettes and necessary reagent. Pipette the sample directly, add reagent, measure.
If you use the universally usable pHotoFlex® Turb in the lab with its „lab station“, you can also utilize the bar code of the test kits via an external bar code reader for the retrieval of the respective program. As a special feature, the round cuvette test 00597 for free and total chlorine can also be used in the 28 mm cuvette. Therefore a measur-ing range starting from 0.025 mg/l for mobile measurement can be provided.

24
Photometry Tips and TricksRectangular cuvette test with batch certificate For the largest „family package“, the price per determination is sensa-tionally low at a little more than 10 cents! And they are not much more difficult to handle than the round cuvette tests: Only the refilling into the rectangular cuvettes from the supplied round cuvette, but the test allows the lowest measuring ranges!
The „drop test“ 00086–00088 is becoming more and more popu-lar in practice with pHotoFlex® Turb with its test sets 00086–00088: The single reagents, depending on the combination, allow the determina-tion of free and total chlorine in one step by consecutive drop adding of the different added reagents.
The great strength of this test type is the handling in high-humidity environments. Here, there will not be any clumped reagents! This is also very well-suited for thermal baths, swimming and recreational pools as well as for the monitor-ing health departments. And, in outdoor applications, this test is the most „streamlined“: no blow off of the reagents, but simple addition of drops into the supplied round cuvette.
Powder tests, so-called powder pillows: What is practical here, are the sin-gle portions that are added to the measuring cuvette, which can be well-planned for use on the road. Thus, reagents will not be exposed to unnecessarily high transport and ambient temperatures. Regard-ing the price per determination, powder tests almost always offer the most favorable solution. Per-haps, the pH must be adapted and dilution water may have to be used, which requires are more accurate handling compared to cuvette tests with their additional pH windows.
Conclusion: Chlorine measurement is a very important measurement and it rarely occurs alone Water is susceptible to impurities and contamination with pathogenic germs. Chlorine is still the most im-portant disinfectant for basin water and drinking water in the areas of emergency or transport chlorina-tion. In some countries, chlorine is used by default obligatorily for the treatment of drinking water.
Therefore, a respective amount of choices of solutions is available for chlorine measurements. Especially

25
for monitoring, a universal and eas-ily transportable device, such as the portable photometer photoFlex® Turb bears an advantage, which can also record and document the important indicator parameters pH, redox voltage and turbidity in a standardized manner. Analytical quality assurance and the ease of handling are foremost factors in the selection of suitable test kits, depending on the usage site.
Fig. 12 Test kit selection for measurement of the chlorine concentration

26
Photometry Tips and Tricks
Photometric color measurement is used in water analytics as well as in industrial production and is usually used to determine quality. In practice, different types of colo-rimetry have been established.
In the past, “colorimetry” rese-pectively “color measurement” was based on human color vision, which was strongly influenced by individual perception as well as by exterior influences, such as the ambient light and the brightness. Only with the use of photometers and defined and standardized color systems, the subjective visual estimation was replaced with an objective and accurate measurement. This measurement procedure attempts to describe a color using one or more numeric values. Here, different methods can be applied.
4.1 Color scalesColor scales help to evaluate the color of transparent liquids. Moreover, they are the earliest and simpliest way of color mea-
surement. The sample is com-pared to different, reproducible color (standard) solutions or colored glasses. The result is giv-en as biggest match with a color standard or colored glass.
Some color numbers are calcu-lated using individual or several defined or “standardized” wave-lengths. Their basis are reproduc-ibly producible color standards, from which smaller colorations are diluted, stemming from a master solution. Examples for this include e.g. color numbers for iodine, PtCo/APHA/Hazen and Gardner. For some color numbers, such as Pt-Co/APHA/Hazen and iodine, there are no defined calculation bases for photometric measure-ments. They are exclusively visual-ly defined. The respective stan-dards merely describe that the calculation from the tristimulus values X, Y, Z or the chromaticity coordinates, x, y, z can take place using a defined standard illumi-nant type and at a normal viewing angle (2° or 10°) according to CIE
Chapter 4
Photometric Color Measurement

27
publication 15:2004. The calcula-tion of these color numbers using spectral photometers is therefore conducted using manufactur-er-specific methods that were developed empirically by measur-ing defined standards.
Other color numbers are convert-ed from the tristimulus values X, Y, Z into three-dimensional color spaces such as CIE-L*a*b* or CIE-L*u*v. The basis for these color spaces is the “standard” color system developed in 1931 by the International Lighting Committee (Commission Internationale de l‘Éclairage, CIE).
4.2 Water analytics4.2.1 Spectral absorption coefficient
The spectral absorption coeffi-cient, usually referred to as the SAC, is often used for water ana-lytics in order to photometrically determine the sum of the dis-solved organic water content sub-stances. In practice, SAC measure-ments have become established in two different wavelengths. In drinking water applications, the SAC is usually used at a wave-length of 436 nm to measure the coloration. The SAC measurement
at the wavelength of 254 nm is generally used in the wastewater application and is used to deter-mine the organic contamination of the wastewater. However, the measurement at 254 nm is a mea-surement in the ultraviolet (UV) spectrum of the light; so it is not a color measurement and is not further discussed here.
Drinking water should be clear and colorless. Therefore, a mea-surement of the coloration in drinking water applications has been established for the qualita-tive evaluation of the water. Yellow and yellowish brown colorations of drinking water can be caused by iron compounds and humic substances. But, also the influx of fecal matter or physical/chemical contamination can cause a yellow coloration of the water. We gener-ally distinguish between apparent and true coloration. The apparent coloration is caused by dissolved substances and particulate matter of unfiltered samples. Contrary to this, the true coloration is caused exclusively by dissolved substanc-es, the sample must be filtered using a filter featuring a pore size 0.45 µm prior to measuring.
28
Photometry Tips and TricksFor the determination of the true coloration of the water as per DIN EN ISO 7887, procedure B, measurements of three different wavelengths in visible light are conducted on the filtered water sample at 436 nm, 525 nm, as well as 620 nm, but at least at 436 nm (SAC436). The measured value is standardized to 1 m of optical path width (Unit: 1/m). Restric-tively, it should be noted that the SAC determination can only be made reasonably, if the qualitative composition of the water content substances or the so-called “water matrix” does not change signifi-cantly.
4.2.2 ADMI color number
The platinum cobalt standard of the American Public Health As-sociation (APHA) was taken over from the American Dye Manufac-turers Institute (ADMI).
The ADMI color number is used to measure wastewater and water, whose color intensity corresponds to the platinum cobalt color scale, whose color tone may significant-ly differ from this.
4.3 Industrial applicationsIn the industry, colorimetry plays a significant role in the monitor-
ing of products or production processes. On the one hand, the color itself can be a characteristic feature of the product, whose specific limitations must be ad-hered to. On the other hand, the colorimetry on colorless products can be used to detect quality flaws, which may be caused by contamination and/or aging. Thus, the product is described or evalu-ated by means of the determined color values. In practice, a wide variety of color measurements are used, which are highly dependent on the industry.
4.3.1 EBC color number
The European Beer Color or EBC color number (European Brewing Convention) represents an important parameter for the quality monitoring of beer and wort in the brewing process. As per MEBAK 2.13.2, the EBC color number is determined by means of an extinction measurement at 430 nm using 10 mm cuvettes using the following formula:
EBC = E430 * 25 * F
where E430 represents the extinc-tion, measured at the wavelength of 430 nm and F represents the dilution factor of the beer sample.

29
The beer sample may have to be diluted if the undiluted sample has an extinction value of ≥2.
The typical beer color ranges are, for:
• Light beer 4–15 EBC
• Dark beer 16–35 EBC
• Very dark beer >35 EBC
4.3.2 ASBC color number
The US American beer color ASBC color number (American Society of Brewing Chemists) can be calculated from the EBC color number using the Standard Reference Method (SRM) of the ASBC by applying the following conversion formula:
ASBC = EBC / 1.97
4.3.3 Sugar color ICUMSA
The sugar colorimetry as per the ICUMSA method GS1/3-7 and method GS2/3-10 can be con-ducted for solutions of raw sugar, brown sugar and colorized syrups at a pH of 7.0. The calculation is based on the following formula:
as = 1000 *
Where as is the absorption index, As is the extinction measured at
the wavelength 420 nm, b is the used layer thickness in cm and c is the sugar concentration in g/ml.
4.3.4 Hazen/APHA/Pt-Co color number
The Hazen/APHA/Pt-Co color number was originally developed for the measurement of slightly yellow tinted wastewater samples. Today, the Hazen/APHA/Pt-Co color number is mainly used in the chemical or pharmaceutical industries as a quality feature for the evaluation of raw materials, such as greases and oils. The Hazen/APHA/Pt-Co color number is used to detect product aging caused by light and temperature influences, product contamination or process changes. It is only to be used for slightly yellow tinted, nearly clear samples and relates to platinum cobalt standard reference solutions (DIN EN ISO 6271). The DIN standard does not comprise precise measurement directions or a calculation basis. Thus, the measuring method is specific to the manufacturer and it extends from single wavelength measurements at different wave-lengths all the way to determina-tions pursuant to ASTM D5386-05 from the yellowness index as per
b * cAS

30
Photometry Tips and TricksASTM E 313, which, however, rep-resents an estimation of Hazen/APHA/Pt-Co color number.
With WTW® spectral photome-ters, the Hazen/APHA/Pt-Co color numbers can be determined at different wavelengths:
• Wavelength 340 nm: Stan-dardization to 10 mm, cuvette sizes to be used are 10 mm, 20 mm and 50 mm as well as 16 mm round cuvettes.
• Wavelengths 445 nm, 455 nm and 465 nm: Standardization to 50 mm, and only 50 mm cuvettes may be used.
4.3.5 Yellowness index
The Yellowness index as per ASTM Method E313 is used to detect product changes caused by light, chemical influences and process steps in industrial applications. Here, the deviation between a clear to a more yellow-ish coloration is determined.
The Yellowness index is calculated as follows:
YI = Y
100(CXX - CZZ)
where X, Y and Z represent the CIE tristimulus values and the co-
efficients Cx and Cz depend on the viewing angle (2° or 10°) and the type of light used (C or D65).
4.3.6 Gardner color number
The Gardner color number can be used for clear, yellowish brown, liquid samples, such as oil, clear varnish and solutions of fatty acids, polymerized fatty acids, resins, tall oils, tall oil fatty acids, colophon and other products. The calculation from CIE-L*a*b* values as per DIN EN ISO 4630-2 is defined via the CIE standard color value portions x and y.
4.3.7 ASTM color scale (mineral oil products)
The ASTM color scale is used for mineral oil products such as lubricants, heating oils, diesel fu-els and paraffins. It is defined via the CIE standard color portions X, Y, Z, using the standard illumi-nant type C and with a standard viewing angle of 2°. The measur-ing results are standardized to a cuvette size of 32.5 mm.
4.3.8 Iodine color number
The iodine color number is used to determine the color depth of clear liquids, whose color range spans clear to yellowish to dark brown and which therefore is

31
similar to an iodine potassium iodide solution. This iodine color number is used for example, for solvents, softeners, resins, oils and fatty acids.
4.4 Color spacesIn 1931, the International Lighting Committee (CIE - Commission Internationale de l’Éclairage) defined the CIE standard color system, or the CIE 1931 XYZ color space in order to correlate the physical causes of the color stim-ulation and the human color per-ception. The goal was to express the human color perception in number values in a reproducible and clear manner.
Human color perception takes place via three different color receptor portions in the retina, which perceive red, green or blue. Therefore, the CIE standard color system describes a color via the three standard color values, also referred to as tristimuli, X (red), Y (green) and Z (blue). For the vision pigmentation of three color receptors, the characteristic, wavelength-dependent absorp-tion curves, the so-called standard color matching functions [X(l), Y(l), Z(l)] were determined in the range from 360 to 830 nm.
Other important factors for the color perception, besides the receptor, include the light used or the light type, as well as the viewing angle of the observer. The vision angle influences the color perception, as the distribu-tion of the receptors in the eye is not the same. The CIE has defined two different viewing angles, the 2° viewing angle in 1931- and the 10° viewing angle in 1964. Thus, there are the standard spectral value curves for the 10° viewing angle X10(l), Y10(l), Z10(l) (Fig. 13).
Two different illuminant types were defined in the CIE standard color system, which feature differ-ent spectral energy distributions: Illuminant type A represents the light of a 100 W tungsten illumi-nant light bulb; illuminant type D65 represents daylight. In the meantime, more illuminant types, such as C, D50, D55 or D75 have been added. The relative spec-tral radiation distribution for the standard illuminant types is also listed in tables. Fig. 14 shows an example of the relative radiation distribution for the illuminant types A and D65.

32
Photometry Tips and TricksFor the actual colorimetry, the transmission across the wave-length range from 380 to 780 nm is measured using a spectral pho-tometer. The software uses the table values of the standardized light energy distribution of the set up illuminant type as well as the set up viewing angle to calculate the tristimulus values X, Y and Z or the chromaticity coordinates x, y and z.
If you apply the chromaticity coordinates x and y of the visible spectral colors of the wavelength range from 380 to 780 nm per-pendicular to each other, you will receive a curved line. Along with the composition of purple to red, the so-called purple line,
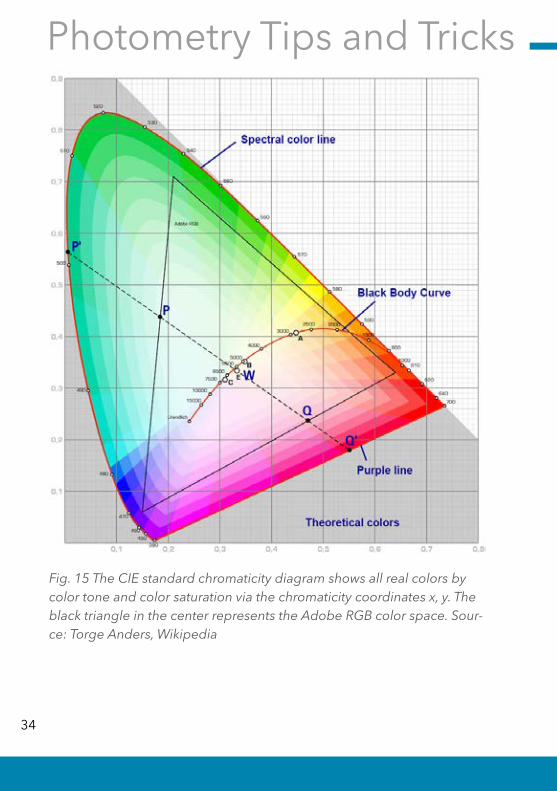
this will envelop an area. This enclosed area is the CIE standard color space chromaticity diagram, which, based on its shape is often colloquially referred to as the “horseshoe” (Fig. 3). The pure spectral colors are located on the exterior parable shaped line.
The chromaticity coordinates or tristimulus values mathematically precisely reproduce the color perception of the human eye. The disadvantage of these color values is that hardly anybody can imagine a color below these number values. Therefore, they present the basis for the subse-quent conversion into different color spaces, which correspond to
Fig. 13 Standard color matching functions for 2° and 10° observers.

33
Fig. 14 Relative spectral radiation distribution of the standard illuminants
the color doctrine and are there-fore easier to understand.
4.4.1 CIE-L*a*b color space
The CIE-L*a*b is a very frequently used color system. The measured spectral curves are reduced to three coordinates, L, a and b, while the axes of the coordinates are positioned perpendicular to each other (Fig. 4). The L coordi-nate is standardized to the values between 0 and 100 and describes the brightness of the color, but does not contain any color in-formation. A value of 100 means 100% light (white); a value of 0 means 0% light (black). The coor-dinates a and b contain the actual
color information, they are not standardized and span negative and positive values. The compli-mentary colors red and green are located on the ac coordinate axis; red is in the positive and green is in the negative range. The more positive or negative the coordinate, the stronger the color green or red. Analog to this, the b coordinate axis represents the complementary colors yellow and blue. If the a or b numeric values equal zero, there is no color, but, depending on the L value, there is a grey tone or white or black.
34
Photometry Tips and Tricks
Fig. 15 The CIE standard chromaticity diagram shows all real colors by color tone and color saturation via the chromaticity coordinates x, y. The black triangle in the center represents the Adobe RGB color space. Sour-ce: Torge Anders, Wikipedia

35
4.4.2 CIE-L*u*v color space
The CIE-L*u*v color space is very similar to the CIE-L*a*b color space described above. The calculation from the CIE tristimulus values is conducted using a different for-mula in order to reduce the green spectrum and increase the blue spectrum in the presentation. As a whole, you will receive a relatively evenly spaced representation of the color space. The axis of the comple-mentary colors green-red is referred to as u, and the of the yellow-blue is called v.
Fig. 16: Diagram of the three-di-mensional CIE-L*a*b color space

All names are registered trade names or trademarks of Xylem Inc. or of one of its subsidiaries. Technical changes reserved. © 2018 Xylem Analytics Germany Sales GmbH & Co. KG. 999206US August 2019
Xylem Analytics Germany Sales GmbH & Co. KG, WTWDr.-Karl-Slevogt-Straße 1D-82362 WeilheimGermany
Tel: +49 881 183-0Fax: +49 881 183-420Email: [email protected]: www.WTW.com
Offers and ordersTel: +49 881 183-323Fax: +49 881 183-333Email: [email protected]
Technical InformationTel: +49 881 183-321Fax: +49 881 183-425Email: [email protected]
Maintenance ServiceTel: +49 881 183-325Fax: +49 881 183-414
Email: [email protected]
Xylem |ˈzīləm|1) The tissue in plants that supplies the water from the roots up through the plant;
2) a leading global water technology enterprise.
We are a global team with the shared goal of creating innovative solutions to provide for our world’s water needs. The focus of our work is the development of new technologies that improve the type and manner of water use and re-use in the future. We move, treat and analyze water and lead it back into the environment, and help people to efficiently use water in their homes, buildings, factories and agricultural operations. Through the takeover of Sensus in October 2016, Xylem expanded its portfolio with intelligent measuring meters, network technologies, and advanced services for data analysis in the water, gas and electrici-ty industry. We have strong long-term relationships with customers in more than 150 coun-tries, among whom we are famed for our high-performance combination of leading product brands and expertise, supported by a tradition of innovation.
Additional information on how Xylem can help you can be found at www.xylem.com
Related Documents


![Luminaire Photometry External[1]](https://static.cupdf.com/doc/110x72/55554ff2b4c90530208b4b6b/luminaire-photometry-external1.jpg)