Photometric and Spectroscopic evolution of Type II-P Supernova SN 2004et D. K. Sahu, G.C. Anupama, S. Srividya and S. Muneer

Welcome message from author
This document is posted to help you gain knowledge. Please leave a comment to let me know what you think about it! Share it to your friends and learn new things together.
Transcript

Photometric and Spectroscopic evolution of Type II-P Supernova
SN 2004et
D. K. Sahu, G.C. Anupama, S. Srividya and S. Muneer

Introduction
Classification of Supernovae
Core Collapse Supernovae IIP -- IIL -- Ib -- Ic
Thermonuclear explosion Ia
Observational Importance of Supernovae:Type Ia – Ideal probe to be used as distance indicator.Type II - Wide range in luminosity. Type IIP plateau luminosity is correlated with expansion velocity of ejecta.Advantages:Well understood progenitors
Atmosphere is dominated by Hydrogen
Based on spectroscopy near max. light
Hydrogen rich Type II Hydrogen deficient Type I
Explosion mechanism
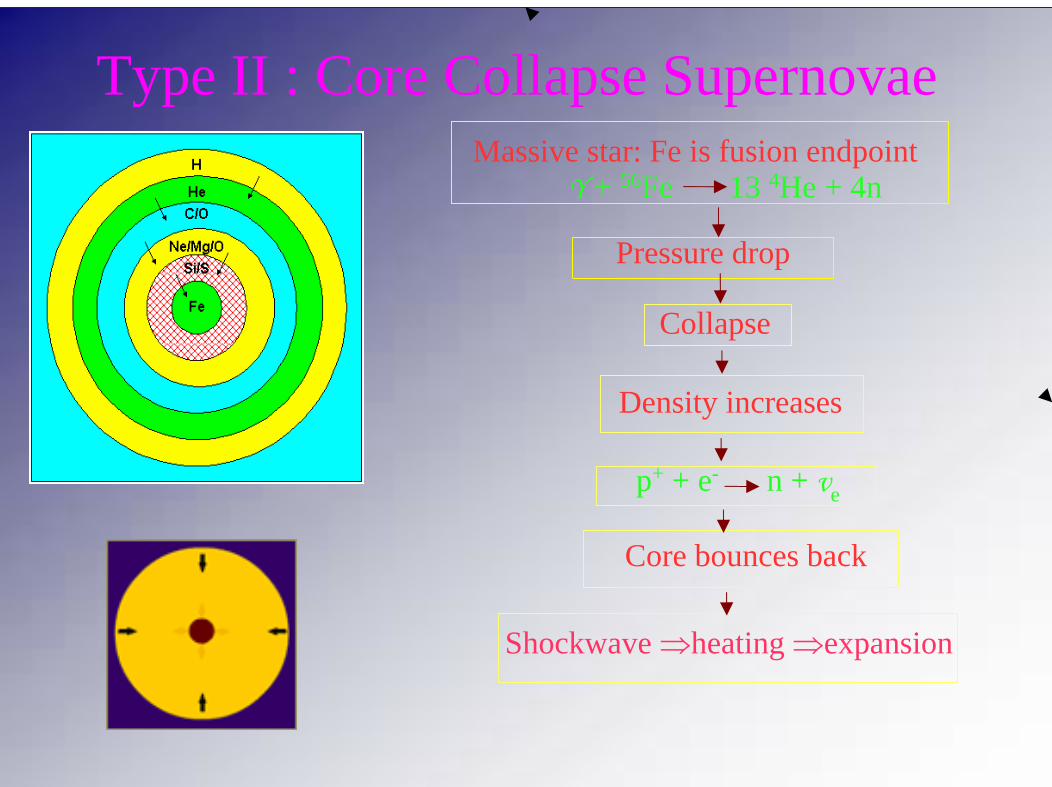
Type II : Core Collapse Supernovae
Pressure drop
Collapse
Density increases
Core bounces back
Shockwave ⇒heating ⇒expansion
Massive star: Fe is fusion endpointY + 56Fe 13 4He + 4n
p+ + e- n + ve

Host Galaxy - NGC 6946, already had produced 7 supernovaeDiscovery – Sept. 27, 2004 (Moretti et al.)Classification – II-P (Zwitter et al. & Filippenko et al. 2004)Early detection in radio ==> presence of appreciable circumstellar material
(Stockdale et al 2004)
SN 2004et
Numbered stars are the secondary standards

Observations
Photometry : Sept 29, 2004 to March 2006 (8 days to 540 days after explosion)
Spectroscopy: Oct. 16, 2004 to Dec. 2005 (25 days to 465 days after explosion)
mU(max) = 12.17±0.05 (JD 2453279.9)mB(max) = 12.89±0.02 (JD 2453280.7)mV(max) = 12.55±0.02 (JD 2453286.6)mR(max) = 12.15±0.02 (JD 2453291 5)
Date of explosion : Sept 22, 2004 (JD 2453270.5)
Plateau in V, R and I bands -consequence of propagation of cooling and recombination wave

Colour Curve
Colour evolution of SN 2004et is different from SN 1999em, U-B and B-V colours of SN 2004et evolve slowly than those of SN 1999em
Reddening Estimate
Equiv. width of NaI D line 1.70Å==> E(B-V) = 0.44 (Munari & Zwitter).High resolution spectroscopy ==> E(B-V) = 0.41 (Zwitter et al.)

Spectroscopic evolutionPhotospheric Spectra Nebular Spectra
P-Cygni lines superimposed on photospheric continuum.Two component P-Cygni profile.
Emission dominated, nebular emission lines of [OI], [CaII] .

Line identification Expansion velocity
Photospheric velocity estimated using the absorption minima of FeII lines.H_alpha and H_beta gives always higher velocity.
SN 2004et has higher expansion velocity.
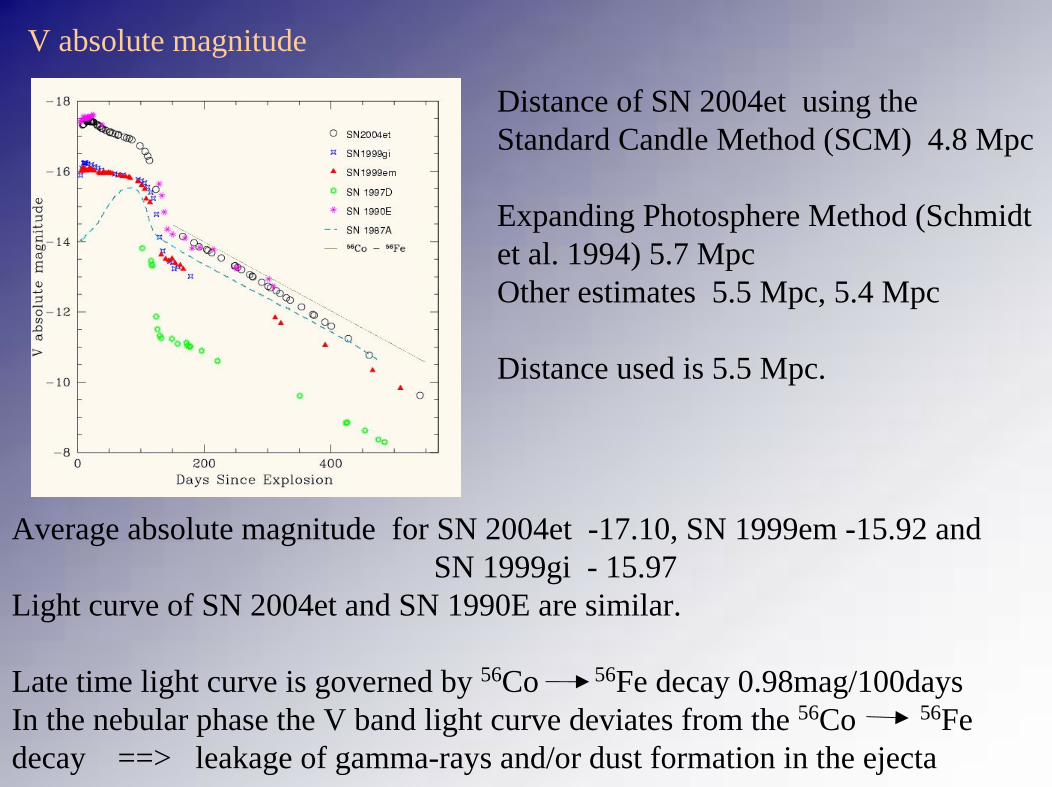
V absolute magnitude
Distance of SN 2004et using the Standard Candle Method (SCM) 4.8 Mpc
Expanding Photosphere Method (Schmidt et al. 1994) 5.7 Mpc Other estimates 5.5 Mpc, 5.4 Mpc
Distance used is 5.5 Mpc.
Average absolute magnitude for SN 2004et -17.10, SN 1999em -15.92 and SN 1999gi - 15.97
Light curve of SN 2004et and SN 1990E are similar.
Late time light curve is governed by 56Co 56Fe decay 0.98mag/100days In the nebular phase the V band light curve deviates from the 56Co 56Fe decay ==> leakage of gamma-rays and/or dust formation in the ejecta

Bolometric light Curve
Optical magnitudes are converted into fluxes.
The UBVRI flux is integrated to get the bolometric flux
Mass of 56Ni can be estimated from the late time bolometric curve1. V magnitude in tail phase,correct for Av= 1.27 and convert V mag in bolometric luminosity 56 Ni mass = 0.059 ±0.02 M_sun(Hamuy 2003)
2. Comparison of tail phase bolometric luminosity with that of SN 1987A, difference of log of bolometric luminosity is 0.198±0.02 56Ni mass 0.048±0.01 M_sun

3. Photometric estimate of 56Ni mass and maximum rate of decline in V bandlight curve from plateau to tail is anticorrelated. (Elmhamdi et al. 2003)Steepness parameter 0.062±0.02 ==> mass of 56Ni 0.062±0.02 M_sun
Properties of progenitor : Mass of the envelope thrown off Mradius of the star prior to the outburst Renergy of explosion EObservables – absolute magnitude Mv at the mid plateau, velocity of photosphere at mid plateau and length of the plateau.Plateau length 120±10 days; photospheric velocity at mid plateau 3560±100 km/sec; Mv -17.10Litvinova et al. (1985) relations givesExplosion energy 1.20(±0.35) X 1051 ergsMass ejected during explosion 20±6 M_sunPre-supernova radius 496±80 R_sunMass of progenitor ~ 15 - 26 M_sun

Probable dust formation in the ejecta
Formation of dust in the supernova ejecta:a. increases the rate of decline of light curveb. shifts peak of optical emission lines towards blue
In SN 1987A and SN 1999em dust formation is seen ~ 400 days after explosion.
Steepening in the decline of the V band light curve ~320 days after explosion and blue shift in the emission lines indicate probable dust formation in the ejecta of SN 2004et.

Summary
1. Fast rise in the early part shows that it was caught young few days after the shock breakout.
2. Average mass of 56Ni synthesized during the explosion is 0.061±0.02 M_sun
3. Mass ejected during the explosion ~ 20±6 M_sun, Explosion energy ~1.20(±0.35) X 1051 ergsPre-supernova radius ~ 496±80 R_sunMass of progenitor ~ 15 - 26 M_sun
4. Possible dust formation in the supernova ejecta
Related Documents


![Photometric and Spectroscopic Study of Nova Cassiopeiae 1995 … · 2014. 6. 14. · the white dwarf material [22]. A thermonuclear explo-sion of hydrogen occurs at the bottom of](https://static.cupdf.com/doc/110x72/6125f09aa38e6e74c07ffd06/photometric-and-spectroscopic-study-of-nova-cassiopeiae-1995-2014-6-14-the.jpg)