otographer: Frank T. Wilson 1903-1904 1922 Case 12-20 Tractor Cultural Evolution of Agriculture: A Historical Assay 1900 - 2000 FOR 460, 2006 J.Tyndall orn Harvest – Iowa

Photographer: Frank T. Wilson 1903-1904 1922 Case 12-20 Tractor Cultural Evolution of Agriculture: A Historical Assay 1900 - 2000 FOR 460, 2006 J.Tyndall.
Dec 24, 2015
Welcome message from author
This document is posted to help you gain knowledge. Please leave a comment to let me know what you think about it! Share it to your friends and learn new things together.
Transcript

Photographer: Frank T. Wilson 1903-1904
1922 Case 12-20 Tractor
Cultural Evolution of Agriculture:
A Historical Assay1900 - 2000
FOR 460, 2006J.Tyndall
Corn Harvest – Iowa


Vegetation Types = F(?)= F (Abiotic & Biotic)

What about culturally speaking?Vegetation Types = F(?)
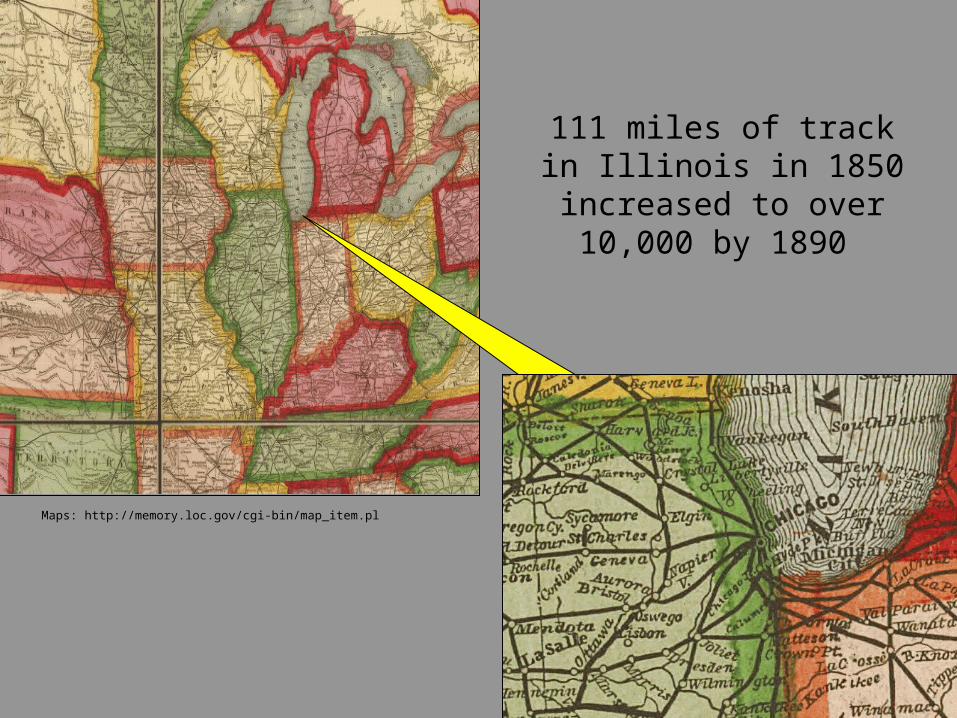
111 miles of track in Illinois in 1850 increased to over 10,000 by 1890
Maps: http://memory.loc.gov/cgi-bin/map_item.pl
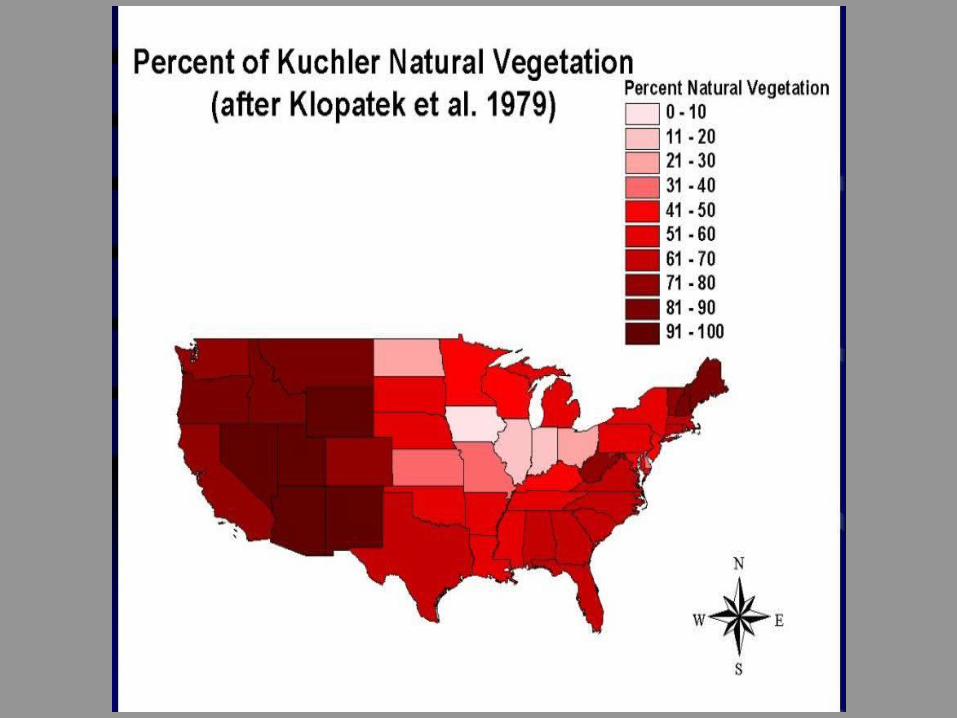

Photo: MS®
> 93% of Iowa’s land area has been converted to fairly homogenous
crop production

Central Iowa
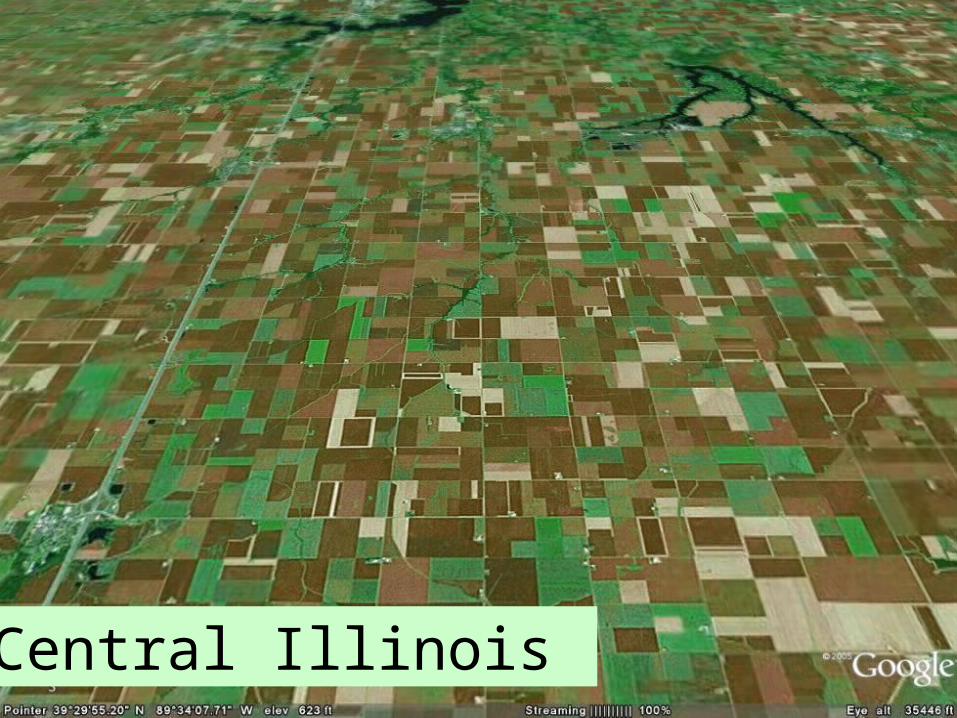
Central Illinois

Systems Hierarchy in Agriculture
• field scale - agronomic
• farm scale - microecon
• Watershed/ landscape scale
– politico-ecological
• National/ transnational level –
politico-macroeconomic
Dominance of constraints :

Harvested Acres – 1900 - 2000


Year Acres harvested
(000’s)
Bushels/Ac
1900’s 95,000 25
1950’s 72,000 42
1960’s 60,000 64
1980’s 63,000 98
2000’s 70,000 135
US Corn Production History
Data Source - NASS

US Production of Corn(this relates to other crops too…)
• The gasoline tractor – ‘20s and ‘30s
• Changes in Performance, Parentage, and Genetic Diversity of Successful Corn Hybrids, 1930–2000
• Post WWII – new technology
• Increased production in corn belt 1960 and beyond– Why?
– Land grants (Purdue & ISU); Research $ = i.e. hybrids, pest control, fertilizer inputs that are tested in Midwest; growing power of agribusiness corps.
• Larger contiguous acreages – economies of scale
• Limited crop diversification = stronger infrastructure
• Rise in Predicate Industries & clustering of concomitant industries
• Subsidy programs
usda


2003-2004 U.S. Corn Use By Segment (bushels)
Feed/Residual5.8 billion (56.8%)
Exports 1.9 billion (18.6%)
Ethanol (fuel) 1.2 billion (11.7%)
High Fructose Corn Syrup 530 million (5.1%)
Corn Starch 271 million (2.6%)
Corn Sweeteners 228 million (2.2%)
Cereal/Other 187 million (1.8%)
Beverage Alcohol 132 million (1.2%)
Total 10.2 billion bushels
Source: USDA, industry statistics.

Corn Subsidies by year, Iowa
YearCorn
Subsidies
1995 $596,197,712
1996 $325,359,974
1997 $556,282,084
1998 $928,223,373
1999 $1,376,230,642
2000 $1,529,407,150
2001 $1,015,844,232
2002 $371,750,668
2003 $532,368,974
2004 $867,720,362
Total $8,099,385,172
Source: EWG Farm Subsidy Database.


Harvested Acres – 1900 - 2000


US Soybean Production History
Year Acres harvested
(000’s)
Bushels/Ac
1920’s 580 11
1940’s 8,000 18.5
1950’s 16,000 20
1970’s 55,000 25
2000’s 72,500 38Data Source - NASS
John Deer

US History of the SB
• Introduced around 1765 – Samuel Bowen - EIC
• 1930’s – Surplus of cotton and wheat – SB meal became important in animal feed.
– The gasoline tractor - general use in the ‘20s and ‘30s
• 1940 – US was importing 40% of oils & fats – WWII• 1941 – US production doubled
• 1949 – Became net exporter• Major component of the Marshall Plan food aid program
• Rise in ‘Value Added’ Predicate industries
– Livestock
• 1995 RR beans
Graphic from the US Soybean Association
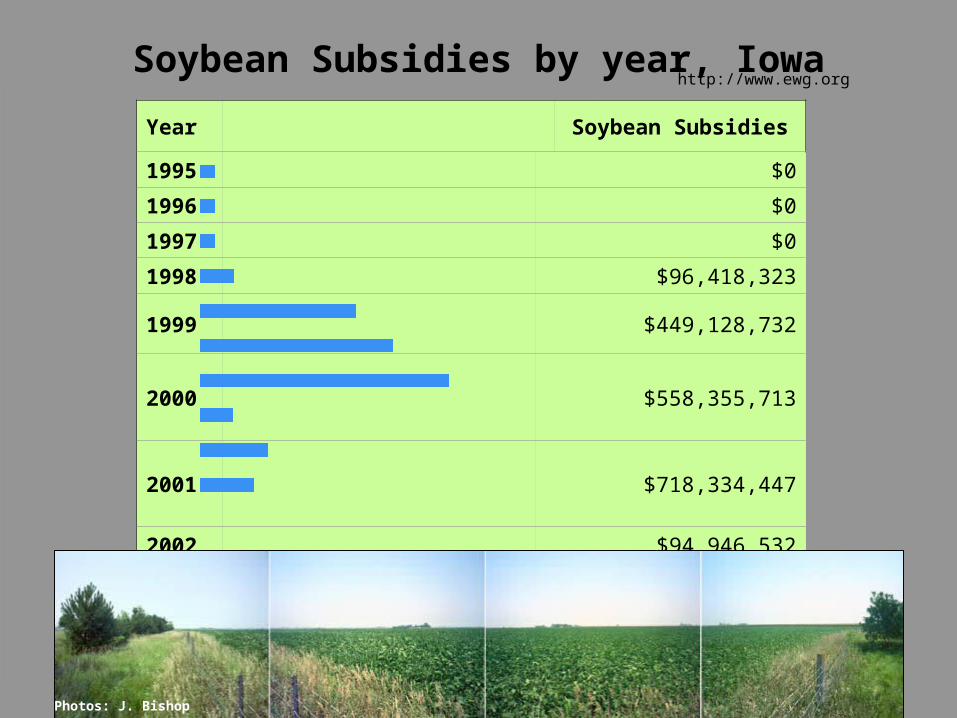
http://www.ewg.orgSoybean Subsidies by year, Iowa
Year Soybean Subsidies
1995 $0
1996 $0
1997 $0
1998 $96,418,323
1999 $449,128,732
2000 $558,355,713
2001 $718,334,447
2002 $94,946,532
2003 $195,358,637
2004 $154,412,851
Total $2,266,955,234
Photos: J. Bishop

Amount of Subsidies received (1995-2004)
Over $4.2 billion over 10 years
$1.84 - $4.2 billion over 10 years
$600 million - $1.84 billion over 10 years
$100 - $600 million over 10 years
Under $100 million over 10 years Source: EWG Farm Subsidy Database.

With the steady increase in crop yields over time due to technological advances, the relative reduction of yields per
centimeter of soil loss has declined.
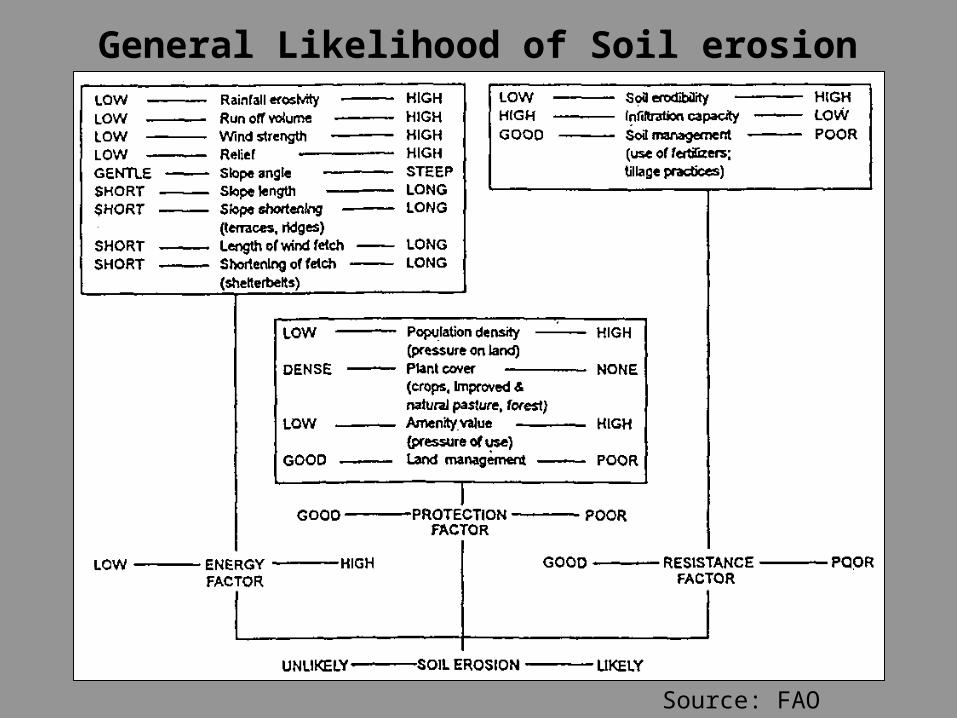
General Likelihood of Soil erosion
Source: FAO

What does all this mean with regards to….?
Habitat change?Fragmentation?Pest/predation dynamics?Resource use – i.e. water?T & E species?Path dependency?What else?

The NAS is a measure of the physical characteristics of a county area that enhance the location as a place to live. The scale combines measures of climate, typography, & water area that reflect environmental qualities most people prefer.
(NAS)


Source: Mike Duffy, Leopold Center, 2005


Photos: ISU Agronomy Dept
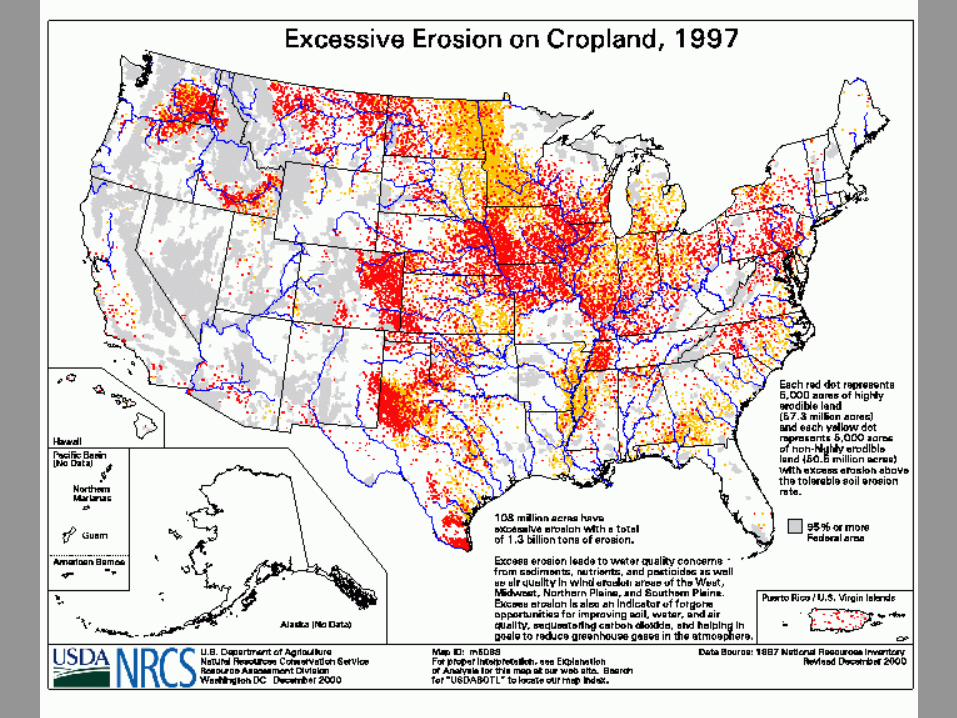
Erosion…


Sustainability, Agriculture & Technology
The following are all tech that sprang from the notion of Sustainable Ag (Approaches &/or BMP’s):
• Precision Ag• GMO’s• Riparian buffers• Shelterbelts and livestock odor• Organic farming
All are direct responses to patterns of land use– Which were largely dictated by Government Policy at various
levels (notably the Farm Bills, 1980…2002) & CES

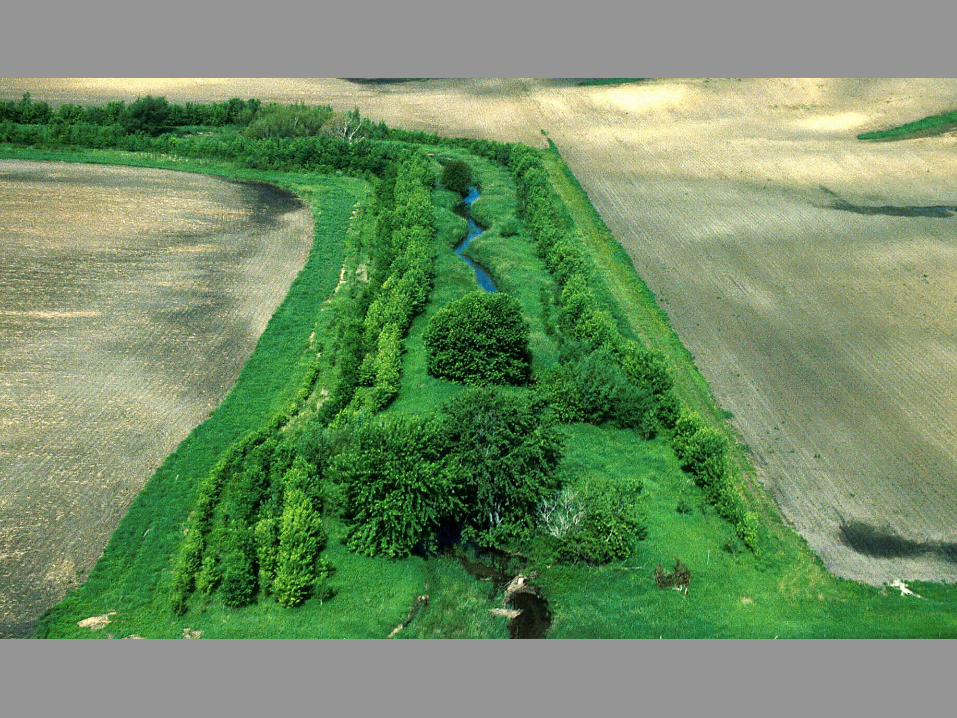
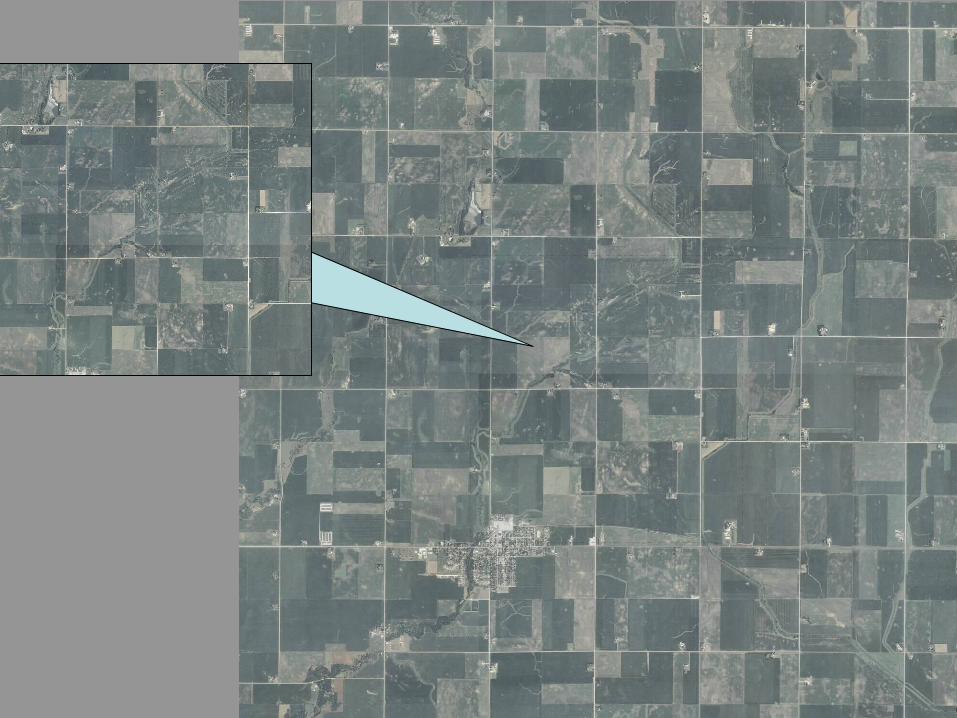
Riparian Buffers – Water Quality Remedy
What is the Micro Environmental story? What is the Macro Environmental story?

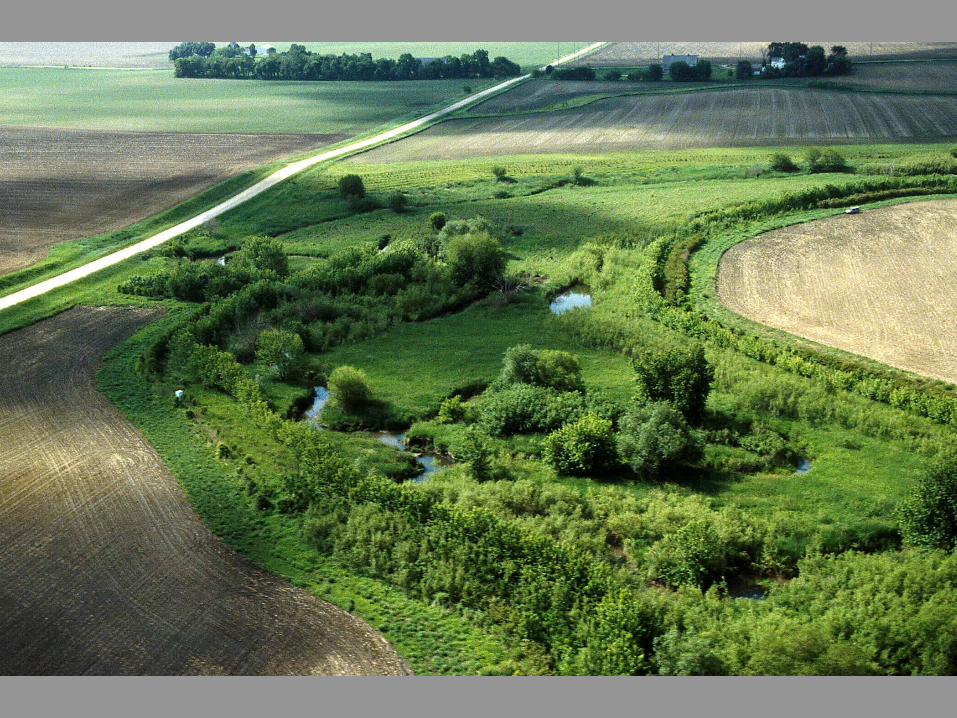
Integrated Wet Lands – Water Quality Remedy
What is the Micro Environmental story? What is the Macro Environmental story?
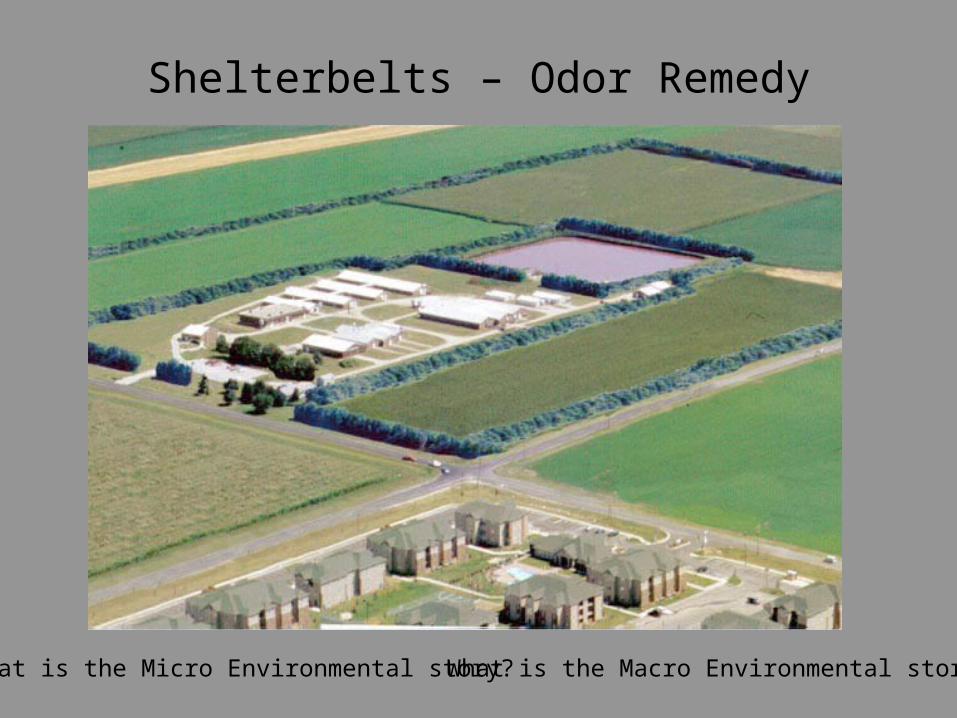
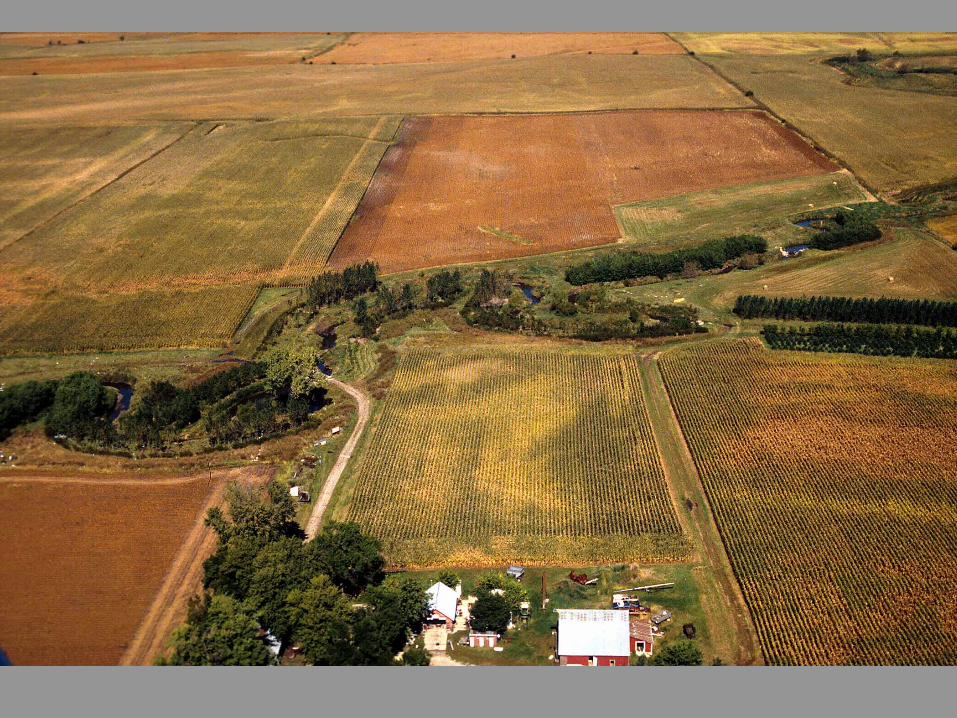
Shelterbelts – Odor Remedy
What is the Micro Environmental story? What is the Macro Environmental story?

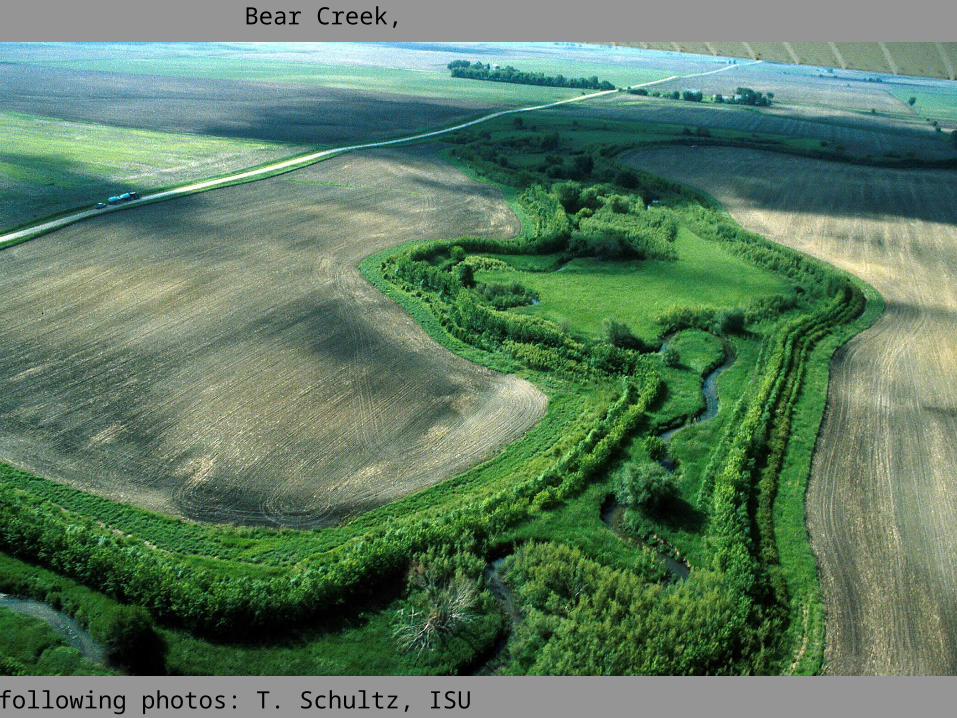
The following photos: T. Schultz, ISU
Bear Creek,


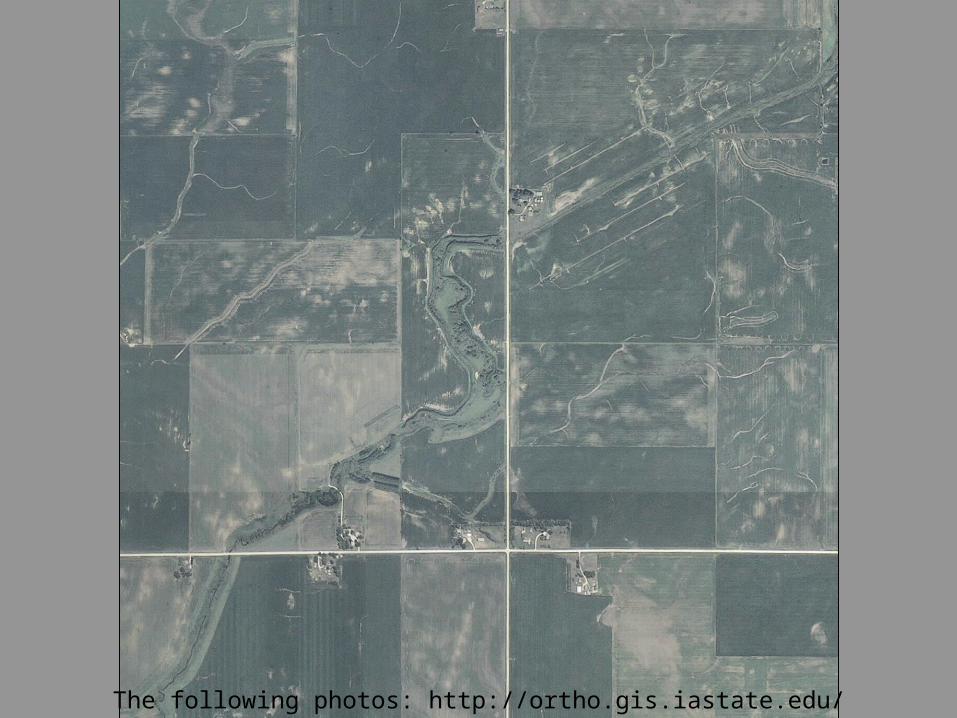
The following photos: http://ortho.gis.iastate.edu/


Related Documents