Photoelectron Spectroscopy of Organic Anions by Scott William Wren B.S. University of California at Davis, 2005 A thesis submitted to the Faculty of the Graduate School of the University of Colorado in partial fulfillment of the requirements for the degree of Doctor of Philosophy Department of Chemistry and Biochemistry 2011

Welcome message from author
This document is posted to help you gain knowledge. Please leave a comment to let me know what you think about it! Share it to your friends and learn new things together.
Transcript
Photoelectron Spectroscopy of Organic Anions
by
Scott William Wren
B.S. University of California at Davis, 2005
A thesis submitted to the Faculty of the Graduate School of the University of Colorado in partial
fulfillment of the requirements for the degree of Doctor of Philosophy
Department of Chemistry and Biochemistry
2011
This Thesis entitled:
Photoelectron Spectroscopy of Organic Anions
written by Scott William Wren
has been approved for the Department of Chemistry and Biochemistry
. .
W. Carl Lineberger
. .
Barney Ellison
Date: .
The final copy of this thesis has been examined by the signatories, and we find that both the content and the form meet acceptable presentation standards of scholarly work in the above
mentioned discipline.
iii
Wren, Scott William (Ph.D., Chemistry, Department of Chemistry and Biochemistry)
Photoelectron Spectroscopy of Organic Anions
Thesis directed by Professor W. Carl Linebergera
Negative ion photoelectron spectroscopy is a very useful tool to investigate the properties of
anions and their related neutral molecules. The neutral molecules that are formed when an
electron is photodetached are often short-lived reactive radicals, which are difficult to study
using other optical spectroscopy techniques. This thesis comprises several investigations that I
performed on a series of related gas-phase anionic systems; these systems highlight the
advantages and challenges associated with negative ion photoelectron spectroscopy.
Additionally, a new innovative velocity mass filter was integrated into the existing instrument
and its design and performance is described in detail.
The systems studied in this thesis can be coarsely divided into two classes of molecules. First, a
series of six-membered aromatic rings are studied, where a nitrogen atom(s) is either inserted
into the phenyl ring or is added as a substituent. Anilinide (C6H5NH–) offers a straightforward
example of a rigid molecular system having a simple photoelectron spectrum where all the
spectral features are easily assigned. A series of five azinide anions (CnHnNn–) are then
investigated to understand how the number of nitrogen atom(s) inserted into the phenyl ring and
their position within the ring affect the thermochemical properties of the anion and neutral
molecules. The photoelectron spectra of all five azinide anions have similar structure, though the
measured electron affinities strongly depend on the proximity of the deprotonation site relative to
the nitrogen atom(s).
The second class of molecules are anions which undergo drastic geometry changes when an
electron is photodetached to form the neutral molecule. A series of halocarbene anions (CX2–
with X =Cl, Br, I) was investigated to definitively determine the energy difference between the
ground state singlet and excited triplet state in the neutral carbene. The related dihalomethyl
anions (CHX2–) are a much more challenging system to understand. The photoelectron spectra
display an extended, structured vibrational progression due to the large geometry change
between the anion and the neutral. A similar phenomenon is also found in the final two anions

iv
studied, c-C4F8– and SF6
–, where high-level theoretical modeling is required to analyze the
photoelectron spectra.

Dedication
To my teachers. I have had many excellent teachers whose dedication and passion for teaching have impacted me more than they could have realized. Their lessons, both academic and general wisdom, have provided me with the foundation necessary to be successful in graduate school.

vi
Acknowledgements
The work presented in this thesis would not have been possible without the help, support,
and guidance of many individuals. I first want to thank my thesis advisor, Carl Lineberger, for
allowing me to join his talented research group and for the support and guidance he has offered
over the past six years. Graduate school can be very challenging and often times becomes an
exercise in perseverance. I couldn’t have asked for a better advisor than Carl who allowed me to
learn from my mistakes and provided encouragement and advice when it was needed. The
number of talented scientists that have passed through Carl’s labs over the past forty years is
quite staggering, and I feel very fortunate to have been able to contribute to the work done in the
basement of JILA.
In addition to Carl, there are many individuals in JILA and in the Chemistry department
who were instrumental in my success in graduate school. I feel very privileged to work
alongside such talented coworkers and learn from very gifted teachers. The facilities and staff
within JILA are certainly among the best in world. Specifically, the technical staff in the
electronic and machine shops have been critical in fixing and improving the instrumentation used
in this thesis work. The new Wien filter was designed and constructed entirely within JILA by
the machine shop and I need to thank Kim Hagen, Blaine Horner, David Alchenberger and Ariel
Paul for their contributions to the project.
I also need to thank several professors that have had a lasting influence on me while both
in graduate school. Mathias Weber started his career in JILA roughly the same time I started
working in Carl’s lab and I have appreciated all his suggestions and advice. Veronica Bierbaum
has taught me the subtle but important aspects of ion thermochemistry, which was very
important in our joint work presented in Chapter 5. Barney Ellison has been a constant source of

vii
support and inspiration over my six years in graduate school. I never left Barney’s office
without a smile on my face and a head filled with new ideas and projects to work on. Lastly, I
wanted to thank Casey Hynes for his dedication and patience in teaching the two graduate
courses I took from him. I don’t know many professors who put as much work and care in
teaching as Casey.
There have also been a large number of visiting scientists that I have had the chance to
work with who I owe a large debt of gratitude. Kent Ervin worked as a visiting scientist for six
months in JILA and taught me much of what I know about how to theoretically model
photoelectron spectra and the details of data analysis. Bob McMahon was also a visiting
scientist and helped motivate much of the work currently being performed on in the lab as well
as providing a physical organic chemist’s point of view on several of the projects in this thesis.
David Osborn was the most recent visiting scientist and worked in the lab for over six months. It
was a great privilege to work with such a knowledgeable individual who is so humble and giving
of his time. While David was in lab, he contributed to several lasting improvements to the
instrumentation and the methods we use to take data and analyze our results. I also need to thank
both John Stanton and Anne McCoy for all their theoretical help on various projects over the
years. Though I don’t necessarily always understand everything they say, both John and Anne
have come to the rescue many times to help understand our results when challenging problems
arise.
However the group of individuals that influenced and helped me the most in graduate
school are the former and present members of the Lineberger, Ellison, Bierbaum, Weber and
Nesbitt groups. There have been so many individuals whom have help me in one way or another
in these groups, and I feel it would be impossible to list everyone. I do want to thank a few

viii
individuals whom I interacted with the most. I first need to thank Kristen Lemke, who worked
alongside me in lab for the past four years and significantly contributed to much of the work
presented in this thesis. I also want to acknowledge Elisa Miller who has been very supportive
and helpful over the last six year while becoming a great friend and scientist. Adam Gianola
trained me on the PES instrument when I first started working in the lab and has continued to
answer my questions long after leaving the lab. He has become a great friend and has offered me
support and encouragement in the dark periods when the ions were lost and the laser was broken.
I spent several summers working with Stephanie Villano, who patiently taught me about ion
chemistry and is one of the most efficient researchers I know. I also want to thank Leonid Sheps.
Leonid challenged me to become a better scientist while constantly answering all my questions
and helping me with any problems I brought him. I feel Leonid made all of the scientists he
worked with better and I owe much of what I learned in graduate school to him.
Finally, I need to thank my family, whom without I would surely not be where I am
today. My parents have been very supportive throughout my extended educational journey and
taught me many of the skills necessary to survive graduate school. I need to thank my Father in
particular in shaping my interest in chemistry. Not only did I have the fortunate opportunity to
have him as my general chemistry professor in college, it was in this class that I met my wife. I
also need to thank my brother David for his support over the year. Being identical twins who
both went to graduate school studying chemistry has resulted in a constant partner in science
classes, someone to commiserate with, and a lasting friendship I am very thankful for. However,
above everyone else listed in this section, I need to thank two important women in my life. My
dog Ona has been thoroughly neglected over large parts of my time in graduate school, but has
always been a wonderful companion and happy to see me when I get home. My wife Rachelle

ix
has been by my side for over ten years and has provided an endless supply of encouragement and
support throughout undergraduate and graduate school. I can say, without hesitation, I would not
be in the position I am today without Rachelle. I cannot thank her enough for the sacrifices she
has made which have allowed me to pursue my goals. Rachelle is one of the most talented and
caring people I have ever met and I feel so lucky to have her in my life.

x
Contents
1 Introduction ............................................................................................................................. 1
1.1 Anion Photoelectron Spectroscopy .................................................................................. 1
1.2 Atomic Species ................................................................................................................. 6
1.3 Molecular Anion Photodetachment .................................................................................. 9
1.4 Selection Rules and Photoelectron Intensities ............................................................... 10
1.5 Photoelectron Angular Distributions .............................................................................. 15
1.6 Thermodynamics ............................................................................................................ 17
1.7 Survey of Thesis Topics ................................................................................................. 19
1.8 References ...................................................................................................................... 23
2 Experimental Methods .......................................................................................................... 25
2.1 Introduction .................................................................................................................... 25
2.2 Ion Source ...................................................................................................................... 26
2.3 Ion Optics and Mass Selection ....................................................................................... 30
2.4 Ultraviolet Laser System ................................................................................................ 35
2.5 Photoelectron Energy Analysis and Detection ............................................................... 38
2.6 Data Acquisition and Analysis ....................................................................................... 40
2.7 Ab initio Calculation and Franck-Condon Simulation ................................................... 41
2.8 References ...................................................................................................................... 44
3 Wien Velocity Filter: New Mass Filter ................................................................................. 47
3.1 Introduction .................................................................................................................... 47
3.2 Theory of Wien Velocity Filter ...................................................................................... 48
3.3 Previous Wien Filter Design .......................................................................................... 53
3.4 New Wien Filter Design ................................................................................................. 57
3.5 Performance of New Wien Filter ................................................................................... 62
3.6 Conclusion ...................................................................................................................... 66
3.7 References ...................................................................................................................... 66
4 Photoelectron Spectroscopy of Anilinide: C6H5NH‒ ........................................................... 67
4.1 Introduction .................................................................................................................... 67

xi
4.2 Experimental Method ..................................................................................................... 69
4.3 Results and Discussion ................................................................................................... 70
4.4 Conclusion ...................................................................................................................... 80
4.5 References ...................................................................................................................... 80
5 Photoelectron Spectroscopy of Azinides: Pyridinide, 1,2-diazinide, 1,3-diazinide, 1,4-diazinide, 1,3,5-triazinide ...................................................................................................... 82
5.1 Introduction .................................................................................................................... 82
5.2 Experimental Method ..................................................................................................... 88
5.3 Results ............................................................................................................................ 90
5.3.1 Pyridinide, C5H4N‒ ................................................................................................ 94
5.3.2 1,3-Diazine, C4H3N2– ............................................................................................. 96
5.3.3 1,2-Diazine, C4H3N2– ........................................................................................... 101
5.3.4 1,4-Diazine, C4H3N2– ........................................................................................... 102
5.3.5 1,3,5-Triazine, C3H2N3– ....................................................................................... 103
5.4 Discussion .................................................................................................................... 104
5.5 Conclusion .................................................................................................................... 108
5.6 References .................................................................................................................... 109
6 Photoelectron Spectroscopy of Dihalocarbenes: CCl2‒, CBr2
‒ and CI2‒ ........................... 111
6.1 Introduction .................................................................................................................. 111
6.2 Experimental Method ................................................................................................... 113
6.3 Theoretical Methods ..................................................................................................... 114
6.4 Results and Discussion: Dihalocarbene Anions (CX2–) .............................................. 116
6.4.1 CCl2– ..................................................................................................................... 118
6.4.2 CBr2– ..................................................................................................................... 126
6.4.3 CI2– ....................................................................................................................... 131
6.5 Results and Discussion: Dihalomethyl Anions (CHX2–) ............................................. 134
6.6 Conclusion .................................................................................................................... 145
6.7 References .................................................................................................................... 148
7 Photoelectron Spectroscopy of SF6‒ and c-C4F8
‒ ............................................................... 153
7.1 Introduction .................................................................................................................. 153
7.2 Experimental Method ................................................................................................... 155

xii
7.3 Results and Discussion ................................................................................................. 156
7.3.1 Photoelectron Spectrum of c-C4F8– ...................................................................... 156
7.3.2 Photoelectron Spectrum of SF6– ........................................................................... 163
7.4 Conclusion .................................................................................................................... 169
7.5 References .................................................................................................................... 170
8 Bibliography ........................................................................................................................ 174
xiii
List of Tables
Table 4.1 Peak positions and assignments for the photoelectron spectrum of anilinide anion. .. 73 Table 4.2 Calculated and experimental vibrational frequencies of anilinide anion (𝑋 1A') and the
anilino radical (𝑋 2A") ................................................................................................ 74 Table 4.3 Optimized Geometry of anilinide anion (𝑋 1A') and the anilino radical (𝑋 2A") and the
calculated net geometry change after removing an electron from the anion to form the radical (B3LYP/aug-cc-pvdz). Bond lengths are in units of angstroms (Å) and bond angles are in units of degree (◦). The geometry change is defined as the difference between the values of the internal coordinates from the anion to the radical. ............ 76
Table 5.1 Summary of Experimental Thermochemical Properties of Azine Systems: C-H Bond Dissociation Energies, Electron Affinities, and Deprotonation Enthalpies ................ 91
Table 5.2 Experimental Vibrational Frequencies of Azine Radicals and Anionsa ..................... 92 Table 5.3 Summary of FA-SIFT Results ..................................................................................... 93 Table 5.4 Calculateda EAs, ∆acidH298s, and BDEs for Benzene and the Azinesb. ....................... 94 Table 5.5 Calculated and Experimental Vibrational Frequencies for 1,3-diazin-5-ide (1A1) and
1,3-diazin-5-yl (2A1). .................................................................................................. 99 Table 6.1 Energies of origin transitions, vertical detachment energies, and singlet-triplet
splittings (ΔEST) of dihalocarbenes (eV). ................................................................. 121 Table 6.2 Spectroscopic quantities and molecular constants of CCl2. ...................................... 124 Table 6.3 Spectroscopic quantities and molecular constants of CBr2. ...................................... 129 Table 6.4 The experimental and calculated [CCSD(T)/aug-cc-pVDZ for CHCl2(CDCl2) and
B3LYP/6-311++G(d,p) for CHBr2(CDBr2) and CHI2(CDI2)] electron affinity (EA) and vertical detachment energy (VDE) for each of the dihalomethyl radicals. Basis sets and pseudopotentials for Br and I were developed by Stoll et al.67, 68 ............... 137
Table 7.1 Theoretical normal mode frequencies (cm-1), calculated at the MP2/TZVPP level of theory, for both c-C4F8 and c-C4F8
– with the corresponding experimental values for c-C4F8. ...................................................................................................................... 161
Table 7.2 Theoretical normal mode frequencies (cm-1), calculated at the MBPT(2) level of theory, for both SF6 and SF6
– with the corresponding experimental values for SF6.................................................................................................................................... 169
xiv
List of Figures
Figure 1.1 Diagram of the photodetachment process for a diatomic anion (AB‒) and the resulting photoelectron spectrum. Potential energy curves are represented by a Morse oscillator and are a function of the internuclear bond distance. Figure is adapted from previous figure by Dr. Leonid Sheps. ................................................................. 4
Figure 1.2 Photoelectron spectrum of atomic oxygen anion (O‒) taken both at 300 K and 150 K. Inset energy level diagram is a schematic illustrating the possible transitions from the different spin-orbit energy levels in the anion and neutral. The red sticks indicate the positions of the experimentally measured energy levels of the transitions in the inset diagram. .............................................................................................................. 8
Figure 1.3 Negative ion thermochemistry cycle that can be used to determine the bond dissociation energy of a R–H bond. In the figure, EA(R) is the electron affinity of the radical, ∆acidH(RH) is the enthalpy of deprotonation of the hydrogenated neutral, IE(H) is the well-known ionization energy of hydrogen atom, and D(RH) is the homolytic bond dissociation energy. In order to obtain information from this thermochemical cycle, two of the three unknown values need to be experimentally determined. ................................................................................................................ 18
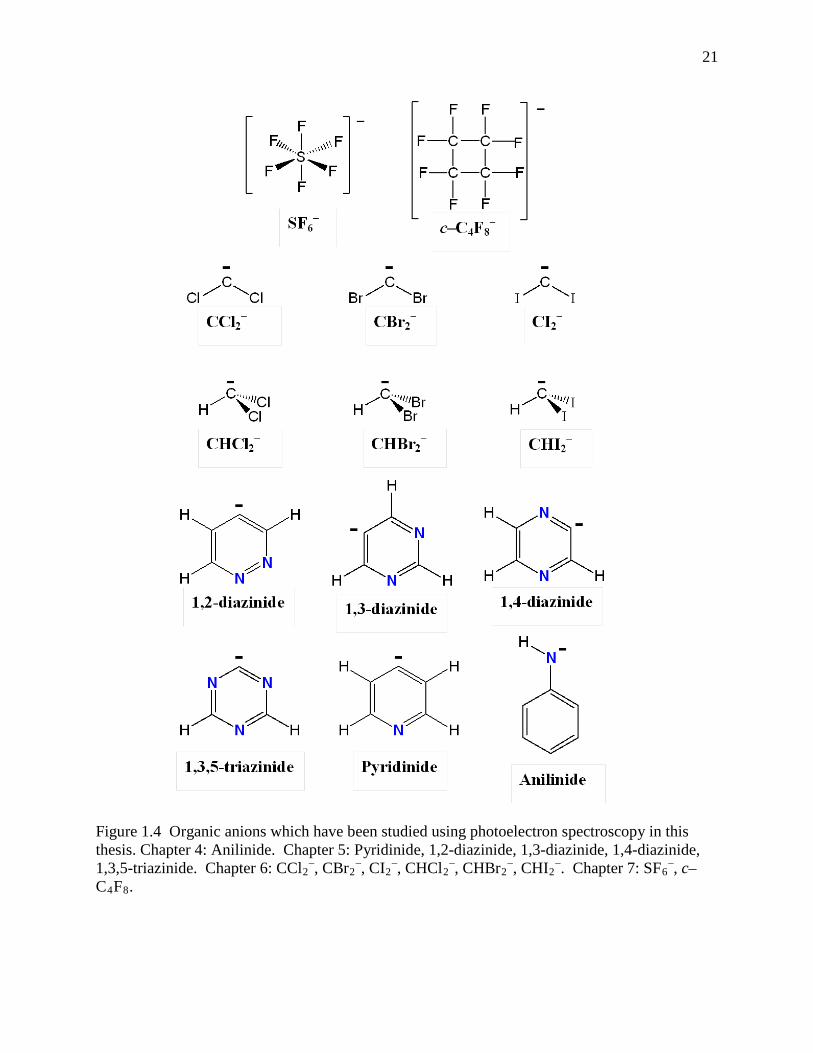
Figure 1.4 Organic anions which have been studied using photoelectron spectroscopy in this thesis. Chapter 4: Anilinide. Chapter 5: Pyridinide, 1,2-diazinide, 1,3-diazinide, 1,4-diazinide, 1,3,5-triazinide. Chapter 6: CCl2
–, CBr2–, CI2
–, CHCl2–, CHBr2
–, CHI2–.
Chapter 7: SF6–, c–C4F8. ........................................................................................... 21
Figure 2.1 Schematic illustrating the main components of the negative ion photoelectron spectrometer .............................................................................................................. 26
Figure 2.2 Schematic of the flowing afterglow microwave discharge. The position of the reaction inlets can be adjusted independently. .......................................................... 28
Figure 2.3 Schematic overview of the major components of the photoelectron spectrometer. The different regions of pressure and ion beam energy are label on the bottom and top axis, respectively. ...................................................................................................... 31
Figure 2.4 Side-view picture of refurbished Q2 quadrupole. The middle elements, which deflect the ion beam, are twice as long as the first and third elements used for focusing ions. The four horizontal poles on the first and third elements share a common voltage, as do the four vertical poles. The four middle deflecting poles each are supplied independent voltages. Therefore, there are six independent voltages used in each quadrupole assembly. ................................................................................................ 33
xv
Figure 2.5 Schematic of the laser system illustrating the major components. The light from an argon ion laser is steered, focused, and manipulated before entering the vacuum chapter, which serves as an external build-up cavity. An AOM is used to shift and modulate the laser frequency while the half-waveplate rotates the laser polarization. ................................................................................................................................... 36
Figure 2.6 Cross-sectional view of the electron energy analyzer and the interaction region. ..... 39
Figure 3.1 Schematic of Wien filter depicting the directions of the electric and magnetic fields, as well as the forces on the anion as it passes through the filter. .............................. 47
Figure 3.2 Schematic diagram defining the physical parameters of the Wien filter. ................... 50
Figure 3.3 Simplified diagram of the Wien filter construction. Magnetic pole pieces in the Wien filter assembly are magnetized by an external electromagnet and provide a horizontal electric field. The electrostatic deflectors (electrodes) provide the electric field. Pairs of stainless steel shims (dark grey) separated by Teflon (white) are used to simulate infinite parallel plates and eliminate fringe fields. The voltage on the shims is decreased stepwise moving away from the electrodes while the distance between the opposite polarity shim decreases. This maintains the same electric field while decreasing the potential between the plates to the ion beam voltage. The voltages shown are an example of the stepwise decrease if the electrodes were at +20 V and -20 V where 0 is the ion beam voltage. ...................................................................... 53
Figure 3.4 Schematic of electric field between two electrodes (parallel plates). The top example is the ideal case where the plates extend to infinity and there is a uniform electric field between the plates. The bottom example shows how fringe fields develop at the edges of electrodes creating an inhomogeneous electric field. ........................... 55
Figure 3.5 Schematic illustrating the difference of the new (left) and previous (right) Wien filter. The new Wien filter employs larger electrodes which are directly connected to silicon coated glass which acts as a high–resistance conductor creating a potential gradient between two electrodes. The curved arrows through the glass indicate the current flow through the silicon film on the glass. .................................................... 57
Figure 3.6 Schematic of the new Wien filter assembly. A cross section in shown in (a) highlighting the electrodes and the silicon coated glass. The entire assembled filter is shown in (b). The two faceplates at the entrance and exit of the Wien filter are optional and can be easily removed. Four identical faceplates with varying apertures (4, 5, 6, 7 mm) were made in to allow for adjustments and optimization of the Wien filter’s performance ................................................................................................... 59
Figure 3.7 Schematic looking down the ion beam path of the Wien filter, shown with (a) and without (b) the faceplates. Besides being an aperture plate to measure the incoming

xvi
and exiting ion current, the faceplate also acts to shield the ion beam from the edges of the glass plates. ..................................................................................................... 60
Figure 3.8 Photographs of the Wien filter assembly with quadrupoles Q2 and Q3 (a), and a top view of just Wien filter with electrical connections (b). ........................................... 61
Figure 3.9 Mass spectra results using the new Wien filter with different strength magnetic and electric fields. The electric field was set to the specific value indicated in the inset of each panel and the electromagnets voltage was scanned to obtain the mass spectra. For the scans shown, oxygen was added to the flowing afterglow source and the ion optics were optimized to make O‒. The mass resolution dramatically increases as the electric field is increased from (a) – (c). .............................................................. 63
Figure 3.10 Typical mass spectrum of the products from the reaction of pyridine (C5H6N) with O‒. The O‒ peak has a measured m/∆m = 71 and m/∆m = 65 for the C5H5N‒, which are both almost a factor of two greater than the best performance of the old Wien filter. .......................................................................................................................... 64
Figure 4.1 Magic-angle negative ion photoelectron spectrum of anilinide. (a) 364-nm experimental spectrum with ions at ~ 300 K. (b) Simulated photoelectron spectrum at 300 K (blue line) with red sticks corresponding to the Franck-Condon factors (FCF) for the vibronic transitions from the ground states of the anilinide anion to the anilino radical. Inset in (b) illustrates the calculated atomic displacements of the vibrational mode in the anilino radical which dominates the vibrational progression observed in the photoelectron spectrum. ................................................................... 71
Figure 4.2 The 364 nm magic angle photoelectron spectrum of anilinide at ~ 300 K (black line) and ~ 200 K (blue line). The spectrum measured with cold ions has lower counts and was normalized to the room temperature spectrum. Both spectra look very similar except for the intensity of the hot band peak at approximately 1.55 eV, which is reduced in when the ions are cooled. ..................................................................... 76
Figure 4.3 The 364 nm magic angle photoelectron spectra of three phenyl-substituted anions. The spectra of benzyl anion (C6H5CH2
–) and phenoxide (C6H5O–) were previously recorded in our lab and shown in (a) and (b) respectively.6 The aniline spectrum with room temperature ions is shown in (c). The three spectra are plotted on independent energy scales with the origin peaks (000) aligned to highlight the similar vibrational progressions. ............................................................................... 78
Figure 5.1 Schematic of the Negative Ion Thermochemistry Cycle used to relate the experimentally determined EA and ∆acidH298 with the known ionization energy (IE) of hydrogen to obtain the C–H BDEs (D(RH)) in this work. .................................. 83
Figure 5.2 Magic-angle negative ion photoelectron spectra of phenide (a), pyridinide (b), 1,2-diazinide (c), 1,3-diazinide (d), 1,4-diazinide (e), 1,3,5-triazinide (f). ..................... 85

xvii
Figure 5.3 Magic-angle negative ion photoelectron spectra of pyridinide and simulations of possible anion isomers at 300 K. (a) 364-nm experimental spectrum; peaks used to identify experimental frequencies are indicated with solid lines (neutral frequencies) and dashed lines (anion frequency). Simulated photoelectron spectra of pyridin-4-ide (b), pyridine-3-ide (c), pyridine-2-ide (d). ........................................................... 95
Figure 5.4 Magic-angle negative ion photoelectron spectrum of 1,3-diazinide. (a) 364-nm experimental spectrum with ions cooled to ~150 K. Peaks used to identify experimental frequencies are indicated with solid lines. (b) Simulated photoelectron spectrum at 150 K. Inset in (b) illustrates the calculated atomic displacements of the two most dominant vibrational modes, though all active modes are included in simulation. The simulated spectra for 1,3-diazin-4-ide and 1,3-diazin-2-ide are shown in (c) and (d) respectively. ............................................................................. 96
Figure 5.5 Magic-angle negative ion photoelectron spectra of 1,2-diazinide and simulations of possible anion isomers at 300 K. (a) 364-nm experimental spectrum; peaks used to identify experimental frequencies are indicated with solid lines (neutral frequencies) and dashed lines (anion frequency). The simulated spectra for 1,2-diazin-4-ide and 1,2-diazin-3-ide are shown in (b) and (c) respectively ............................................ 101
Figure 5.6 Magic-angle negative ion photoelectron spectrum of 1,4-diazinide. (a) 364-nm experimental spectrum with ion at 300 K. Peaks used to identify experimental frequencies are indicated with solid (neutral frequency) and dashed lines (anion frequency) (b) Simulated photoelectron spectrum at 300 K. ................................. 102
Figure 5.7 Magic-angle negative ion photoelectron spectrum of 1,3,5-triazinide. (a) 364-nm experimental spectrum with ion cooled to ~ 150 K. Peaks used to identify experimental frequencies are indicated with solid lines. (b) Simulated photoelectron spectrum at 150 K. ................................................................................................... 102
Figure 6.1 CCl2− magic angle photoelectron spectra. (a) The 364 nm CCl2
− spectrum from the previous experimental study.28 (b) The new 351 nm spectrum collected at m/z ~ 81 minimizes the CDCl2
− contamination. The pure CDCl2− spectrum is scaled and
subtracted from the m/z ~ 81 trace to yield the “clean” CCl2− spectrum. ............... 118
Figure 6.2 Analysis of the photoelectron spectrum of CCl2−. (a) The experimental magic angle
spectrum was collected at room temperature (upper trace) and at ~200 K (lower trace). (b) Simulated photoelectron spectrum computed at 350 K. The singlet and triplet origins are marked with solid and dashed arrows, respectively. Sticks represent individual vibronic transitions. ................................................................ 119
Figure 6.3 Expanded view of X 1A1 CCl2−. All the resolved features are identified based on
peak position, progression spacing, and agreement with the simulated spectrum. The inset is an expanded view of the origin region comparing the cooled and room
xviii
temperature photoelectron spectra. The peak labels in red designate hot bands, and the solid arrows indicate the origin for X 1A1 CCl2. ............................................... 122
Figure 6.4 CBr2− magic angle photoelectron spectra: A comparison of (a) the new 364 nm
spectrum with (b) the previously published 364 nm spectrum.28 The new photoelectron spectrum is collected at m/z ~ 172 and contains both CBr2 and CHBr2. The pure CHBr2
− spectrum is clearly responsible for the progression attributed to the triplet state of CBr2 in the previous spectrum. Subtraction of the CHBr2
− contribution from the m/z ~ 172 spectrum yields the corrected CBr2
− spectrum. (c) Franck-Condon simulation of the singlet state of CBr2, computed at 350 K. Sticks represent individual vibronic transitions. Solid arrows in (b) and (c) mark the singlet origin in the previous and current studies, respectively, as determined by Franck-Condon analysis. The dashed arrow in (b) marks the incorrect triplet origin assignment of the previous dihalocarbene study.28 ................................................. 127
Figure 6.5 Comparison of the best fit simulation and the corrected CBr2− spectrum, showing
both the a 3B1 and X 1A1 states of CBr2 in the simulation. The a 3B1 state is
simulated using the electron affinity and vibrational frequencies calculated by Dyke et al.31 The Franck-Condon factors for both the singlet and triplet states are calculated in the Morse oscillator, parallel mode approximation using numerically integrated Laguerre polynomial wavefunctions. ..................................................... 130
Figure 6.6 CI2− 364 nm photoelectron spectra: A comparison of (a) the new magic angle
spectrum and (b) the previously published spectrum.28 The previous singlet and triplet origin assignments are marked with solid and dashed arrows, respectively, in (b). The photoelectron spectrum collected at m/z ~ 266 contains both CI2 and CHI2. The pure CHI2
− spectrum is clearly responsible for the progression attributed to the triplet state of CI2 in the previous spectrum.28 Subtraction of the CHI2
− contribution from the m/z ~ 266 spectrum yields the corrected CI2
− spectrum. .......................... 132
Figure 6.7 Experimental photoelectron spectra of the dihalomethyl anions (a) CHCl2−, (b)
CHBr2−, (c) CHI2
−, (d) CDCl2−, (e) CDBr2
−, and (f) CDI2−. The calculated
(B3LYP/6-311++G(d,p)) adiabatic electron affinity (EA) for each dihalomethyl radical is marked with a labeled arrow. ................................................................... 135
Figure 6.8 CHCl2 (blue) and CHCl2– (red) potential energy curves as a function of the out-of-
plane angle (τClCHCl'). The inversion barrier for CHCl2 is calculated to be only 162 cm-1. ......................................................................................................................... 139
Figure 6.9 Change in the CHCl2 internal coordinates θHCCl (green) (a), rCCl (purple) and rCH (blue), (b), as the out-of-plane angle τClCHCl' is varied. Plots indicates the dependence of both the θHCCl angle and the C–Cl bond length (rCCl) on the out-of-plane angle (τClCHCl') ................................................................................................ 140
xix
Figure 6.10 Comparison between theory and experiment for CDCl2−. (a) The photoelectron
spectrum of CDCl2− (150 K) and its simulation using normal mode analysis in
Cartesian coordinates, which fails to reproduce the width of the spectral envelope. (b) Improvement in the agreement between experiment and the normal mode simulation is achieved by using an internal coordinate representation. (c) The width of the calculated spectral envelope is further reduced by using (2 + 1) – dimensional anharmonic coupled-mode analysis. All CDCl2
− calculated and simulated spectra were calculated at 150 K and were shifted to match the experimental EA of 1.3 eV. ................................................................................................................................. 142
Figure 7.1 Calculated structures (B3LYP/6-31+G(3df)) of c-C4F8 neutral (top) and anion (bottom). .................................................................................................................. 154
Figure 7.2 The 351 nm photoelectron spectrum of c-C4F8– taken at the magic angle using a
flowing afterglow photoelectron spectrometer. A regular harmonic progression is present with spacing corresponding to a frequency of 355(3) cm-1, shown in the inset. The EA determined by Miller et al. is depicted on the graph by a vertical arrow at 0.63 eV.8 .................................................................................................... 156
Figure 7.3 Calculated photoelectron spectrum of c-C4F8– reproduced from Borrelli et al.42 Only
two modes are included in the simulations (ν1 and ν5) in a) while all modes were included in the simulation in b). The Franck-Condon factors are convoluted with a 25 cm-1 Gaussian. .................................................................................................... 160
Figure 7.4 The magic angle 351 nm photoelectron spectrum of SF6– measured using ions cooled
to ~ 150 K. The inset highlights the regular peak spacing corresponding to a vibrational frequency of 750(20) cm-1 (black line) in the neutral. An additional set of interloping peaks is also present (dashed blue lines) which has the same characteristic spacing but is offset from the main progression by 440(10) cm-1. ... 161
Figure 7.5 Comparison of the (c) 351 nm photoelectron spectrum of SF6– reproduced from
Figure 7.4, and (a and c) spectra taken at Yale University using a double focusing tandem time-of-flight pulsed spectrometer. The photoelectron spectrum in trace b is of bare SF6
– and trace a is of the SF6–•Ar complex. ............................................... 165
1
1 Introduction
1.1 Anion Photoelectron Spectroscopy
Photoelectron spectroscopy is a very powerful spectroscopic technique to study the
physical and chemical properties of both neutral molecules and ions. Neutral photoelectron
spectroscopy is generally more common than its negative ion counterpart, and though both
techniques share many similarities, each has its own unique advantages. The following
discussion attempts to highlight the differences between these two techniques and the distinct
advantages of negative ion photoelectron spectroscopy. Additionally, a brief introduction to
negative ion photoelectron spectroscopy is given below in order to better understand the
experimental results presented in later chapters.
Photoelectron spectroscopy is a special case of electronic spectroscopy, namely the
spectroscopy of bound-free electronic transitions. Electronic spectroscopy is the study of
transitions of electrons from one electronic state to another, induced by the emission or
absorption of a quantum of electromagnetic radiation.1 In order to induce a transition between
two states, the energy of the photon satisfies resonance condition,
Equation 1.1
E2 − E1 = hν =hcλ
where E1 and E2 are the energies of the states involved in the transition and λ is the wavelength
of the light used to probe the system. Photoelectron spectroscopy differs from conventional
electronic spectroscopy in that the photon energy is sufficiently great to eject an electron
following photoabsorbtion. The resonance condition stated in Equation 1.1 is still met (hence
2
energy is still conserved), but the ejected electron carries away with it any energy in excess of
ionization following photoabsorption in the form of electron kinetic energy (eKE). In other
words, the photon energy is partitioned between the energy required for the transitions from the
initial to final state and the kinetic energy of the departing electron. So, unlike conventional
electronic absorption spectroscopy where photon energies are measured, the electron kinetic
energies are recorded in photoelectron spectroscopy.
Negative ion photoelectron spectroscopy is analogous to neutral photoelectron
spectroscopy, except that the initial state is an anion instead of a neutral molecule. When an
electron is photodetached from an anion, a neutral molecule is formed. Since the anion valence
electrons are weakly bound relative to their counterparts in neutral molecules, the minimum
amount of energy required to remove an electron from an anion is correspondingly lower than
what is required to ionize a neutral molecule. Thus, by measuring the kinetic energy of the
photodetached electron, one obtains a vibrational and electronic spectrum of the transitions
between the anion and the final neutral state(s).2
Before discussing the complexities of anion photoelectron spectroscopy, it is useful to
overview the basics of the technique using a diatomic molecule as an example. Figure 1.1 is a
schematic that illustrates the photodetachment process for a simple diatomic anion (AB‒),
forming a neutral (AB). The potential energy curves shown are for the ground state of AB‒ and
AB, as well as the first excited state of AB, and are represented by Morse oscillators. In this
figure, photons with fixed energy (Ehν) induce transitions from the ground vibrational state of the
AB‒ anion to a virtual level in the [AB + e‒] continuum. Electrons are then ejected with kinetic
energies equal to the difference in energy between the laser photon energy and various
vibrational energy levels in the neutral, illustrated as blue arrows in Figure 1.1. The
3
corresponding photoelectron spectrum is displayed on the right vertical axis, which is on the
same energy axis as the potential energy curves. This model diatomic example is useful in
understanding negative ion photoelectron spectroscopy and the spectroscopic quantities which
can be experimentally measured. It is now convenient to introduce the concept of binding
energies, which is defined as
Equation 1.2 eBE = hν − eKE
Though we measure electron kinetic energies (eKE), the photoelectron spectra present in this
thesis are plotted in terms of electron binding energies (eBE), as this quantity is independent of
the photon energy used.
One of the most useful and important spectroscopic quantities measured in negative ion
photoelectron spectroscopy is the energy difference between the ground vibrational and
rotational state of the anion (vP
״P = 0, J P
״P = 0) and the neutral (v P
׳P = 0, J P
׳P = 0); this energy difference is
defined as the adiabatic electron affinity (EA) and is schematically shown in Figure 1.1 as the
red vertical arrow. Physically, this is the minimum amount of energy required to remove an
electron from the lowest energy state of the anion and is analogous to the ionization energy in
neutral photoelectron spectroscopy.

4
Figure 1.1 Diagram of the photodetachment process for a diatomic anion (AB‒) and the resulting photoelectron spectrum. Potential energy curves are represented by a Morse oscillator and are a function of the internuclear bond distance. Figure is adapted from previous figure by Dr. Leonid Sheps.
5
It is also possible to determine the energy difference between electronic states of the
neutral, if both excited states are low enough in energy to be accessed by the photon energy used.
In Figure 1.1, the energy difference between the lowest vibrational and rotational levels of the
ground and first excited neutral states is designated as the term energy (T0). Furthermore, since
the spin selection rule for a photodetachment process is ∆S = ±1/2, neutral states of different spin
multiplicities can be observed in the photoelectron spectrum. For example, many of the anions
studied are doublet states, which when an electron is removed, can form either a singlet or a
triplet state. The term energy between the singlet and triplet states is known as the singlet –
triplet splitting (EST) and is an important quantity to measure (as will be highlighted in Chapter
6). Transitions between states of different spin multiplicity are strongly forbidden in optical
spectroscopy, leading to a unique advantage of anion photoelectron spectroscopy.
The position and relative intensities of the vibrational transitions in the photoelectron
spectrum offer additional information about both the anion and the corresponding neutral
photodetachment product molecule. As Figure 1.1 illustrates, the peak spacing in a
photoelectron spectrum corresponds to the difference in energy between vibrational energy
levels in the neutral. This vibrational structure leads directly to determination of the vibrational
frequencies and often anharmonicities of active modes in the neutral molecule. Additionally, as
will be discussed more in Section 1.4, the intensities of peaks in photoelectron spectra are
governed by the Franck-Condon overlap of the vibrational wavefunctions of the anion and the
neutral. If there is a large geometry change between the anion and the neutral, as in the neutral
excited state A in Figure 1.1, an extended vibrational progression will be observed. This occurs
because the best overlap with the anion ground state vibrational wavefunction is with higher
vibrational levels in the neutral, which shifts spectral intensity away from the origin. Therefore,

6
the observed vibrational structure directly relates to the relative geometry changes between the
anion and the neutral.
Lastly, the inherent advantage of using an anion as our initial state is that we can select a
specific ion of interest by mass filtering our ion beam. This identifies the signal carrier in the
photoelectron spectrum. Furthermore, the anion is a chemically distinct species from the neutral
that is formed after photodetaching an electron. Therefore, many stable anions have very
reactive and unstable neutral counterparts which are very difficult to study by other experimental
methods.
1.2 Atomic Species
Photodetachment of electrons from atomic anions is the simplest case of negative anion
spectroscopy. Energy is conserved in the photodetachment process and can be represented by
Equation 1.3 A−�Eelec"� + hν ⟶ A(Eelec′) + e−(eKE)
where A– is an atomic anion, A is the neutral, Eelec is the electronic energy, and the double prime
denotes the initial state (anion) and the single prime denotes the final state (neutral).
For atomic species, the only transitions available are between different electronic states;
therefore, all the peaks in the photoelectron spectrum correspond to different states of the neutral
atom within the photon energy. As an example, Figure 1.2 shows the photoelectron spectrum of
atomic oxygen anion (O‒) taken both at 300 K (solid black line) and 150 K (dotted blue line).
The inset energy level diagram represents the different transitions possible between the ground
states of the anion (2P3/2,1/2) and neutral (3P2,1,0). Due to spin–orbit coupling, electronic fine
structure splittings are present and five of the six known transitions are resolved under
experimental conditions optimized for best energy resolution (~ 5 meV).3 The line width in

7
atomic spectra is determined by the instrumental resolution. In Figure 1.2 the energy resolution
is approximately 8 meV, which is typical for normal operation and representative of the
conditions of the experiments in this thesis. The energies of the spin–orbit transitions,
represented by red sticks in Figure 1.2, are placed at the known experimental values.4, 5 Peak (c)
corresponds to the EA for oxygen atom (1.461112 eV)6, which is the transition from the ground
state of O‒ (2P3/2) to the ground state of O neutral (3P2). When the O‒ anions are cooled to 150
K, there is a reduced population in the higher energy 2P1/2 state in the anion, which causes a
decrease in the relative intensity of peak (a) and a slight narrowing of peak (c).

8
Figure 1.2 Photoelectron spectrum of atomic oxygen anion (O‒) taken both at 300 K and 150 K. Inset energy level diagram is a schematic illustrating the possible transitions from the different spin-orbit energy levels in the anion and neutral. The red sticks indicate the positions of the experimentally measured energy levels of the transitions in the inset diagram.
9
1.3 Molecular Anion Photodetachment
Electron photodetachment from molecular species is much more complicated than from
atoms due to the presence of vibrational and rotational degrees of freedom. Both anions and
neutral molecules have vibrational and rotational energy levels accessible, which dramatically
increases the number of allowed transitions and the complexity of the photoelectron spectra.
Equation 1.3 can be rewritten to include the molecular vibrational and rotational energy levels,
Evib(v) and Erot(J), respectively:
Equation 1.4
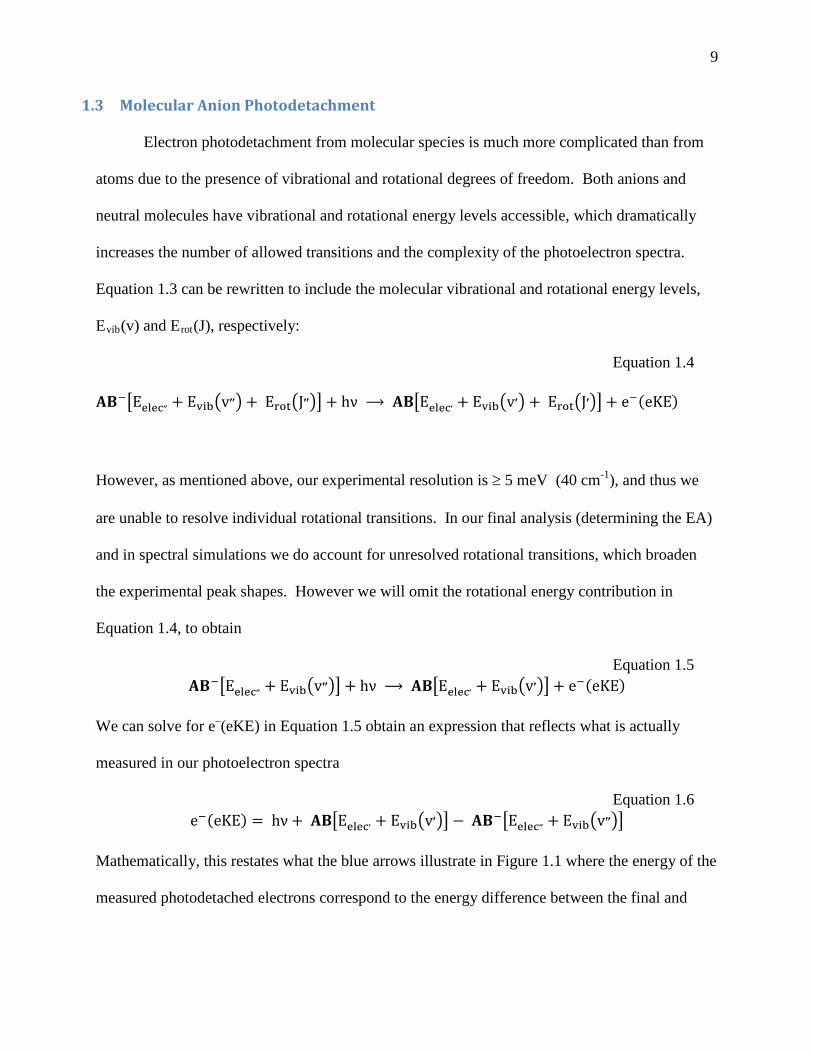
𝐀𝐁−�Eelec״ + Evib�v״� + Erot�J״�� + hν ⟶ 𝐀𝐁�Eelec׳ + Evib�v׳� + Erot�J׳�� + e−(eKE)
However, as mentioned above, our experimental resolution is ≥ 5 meV (40 cm P
-1P), and thus we
are unable to resolve individual rotational transitions. In our final analysis (determining the EA)
and in spectral simulations we do account for unresolved rotational transitions, which broaden
the experimental peak shapes. However we will omit the rotational energy contribution in
Equation 1.4, to obtain
Equation 1.5 𝐀𝐁−�Eelec״ + Evib�v״�� + hν ⟶ 𝐀𝐁�Eelec׳ + Evib�v׳�� + e−(eKE)
We can solve for eP
–P(eKE) in Equation 1.5 obtain an expression that reflects what is actually
measured in our photoelectron spectra
Equation 1.6 e−(eKE) = hν + 𝐀𝐁�Eelec׳ + Evib�v׳�� − 𝐀𝐁−�Eelec״ + Evib�v״��
Mathematically, this restates what the blue arrows illustrate in Figure 1.1 where the energy of the
measured photodetached electrons correspond to the energy difference between the final and
10
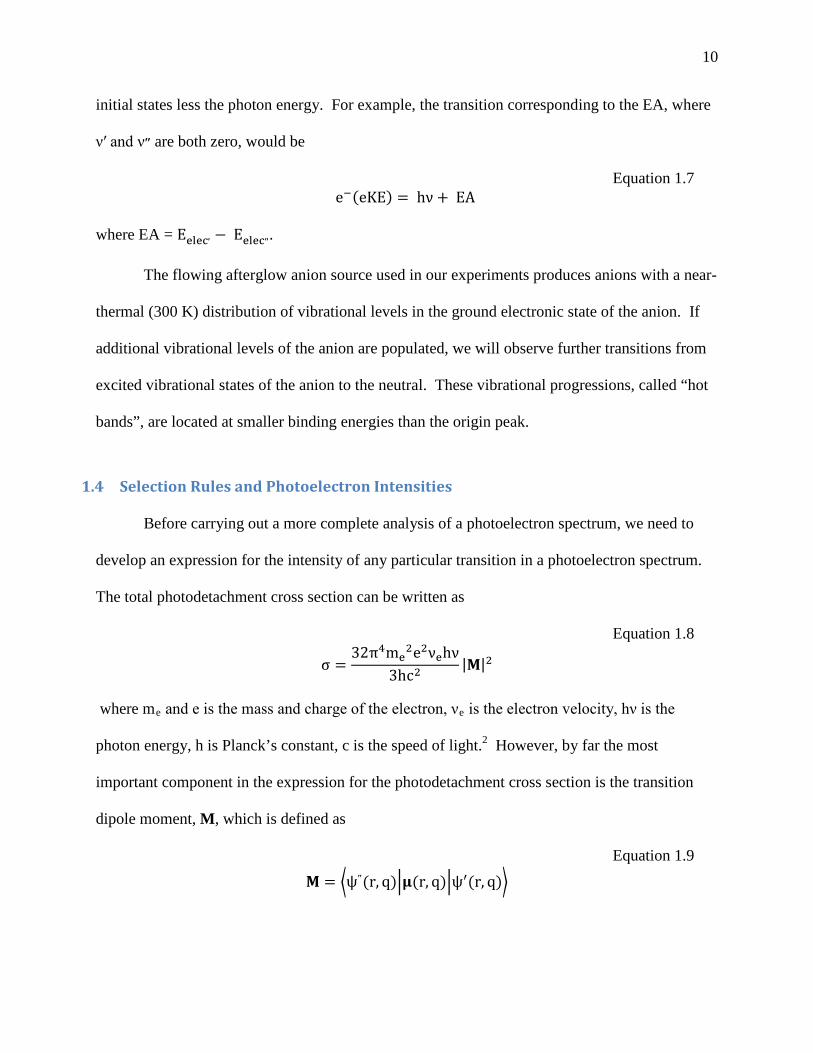
initial states less the photon energy. For example, the transition corresponding to the EA, where
ν′ and ν״ are both zero, would be
Equation 1.7 e−(eKE) = hν + EA
where EA = Eelec׳ − Eelec״.
The flowing afterglow anion source used in our experiments produces anions with a near-
thermal (300 K) distribution of vibrational levels in the ground electronic state of the anion. If
additional vibrational levels of the anion are populated, we will observe further transitions from
excited vibrational states of the anion to the neutral. These vibrational progressions, called “hot
bands”, are located at smaller binding energies than the origin peak.
1.4 Selection Rules and Photoelectron Intensities
Before carrying out a more complete analysis of a photoelectron spectrum, we need to
develop an expression for the intensity of any particular transition in a photoelectron spectrum.
The total photodetachment cross section can be written as
Equation 1.8
σ =32π4me
2e2νehν3hc2
|𝐌|2
where mReR and e is the mass and charge of the electron, νReR is the electron velocity, hν is the
photon energy, h is Planck’s constant, c is the speed of light. P
2P However, by far the most
important component in the expression for the photodetachment cross section is the transition
dipole moment, M, which is defined as
Equation 1.9 𝐌 = �ψ״(r, q)�𝛍(r, q)�ψ′(r, q)�
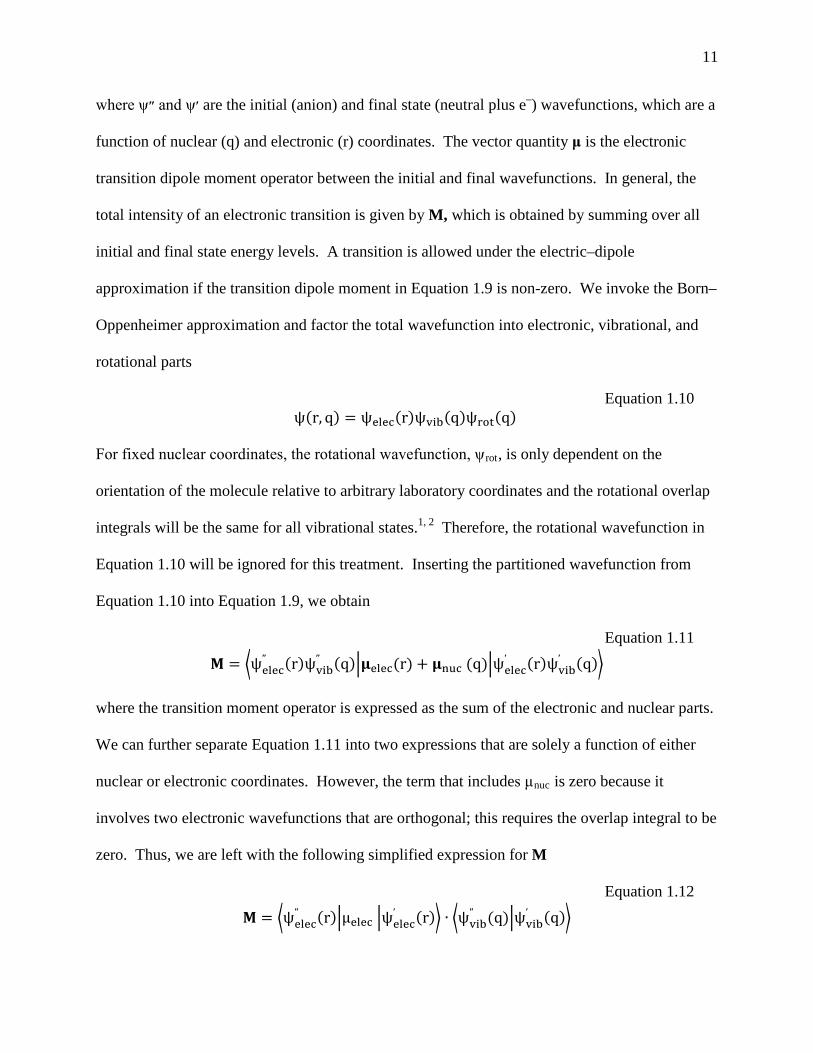
11
where ψ״ and ψ׳ are the initial (anion) and final state (neutral plus eP
–P) wavefunctions, which are a
function of nuclear (q) and electronic (r) coordinates. The vector quantity μ is the electronic
transition dipole moment operator between the initial and final wavefunctions. In general, the
total intensity of an electronic transition is given by M, which is obtained by summing over all
initial and final state energy levels. A transition is allowed under the electric–dipole
approximation if the transition dipole moment in Equation 1.9 is non-zero. We invoke the Born–
Oppenheimer approximation and factor the total wavefunction into electronic, vibrational, and
rotational parts
Equation 1.10 ψ(r, q) = ψelec(r)ψvib(q)ψrot(q)
For fixed nuclear coordinates, the rotational wavefunction, ψRrotR, is only dependent on the
orientation of the molecule relative to arbitrary laboratory coordinates and the rotational overlap
integrals will be the same for all vibrational states. P
1, 2P Therefore, the rotational wavefunction in
Equation 1.10 will be ignored for this treatment. Inserting the partitioned wavefunction from
Equation 1.10 into Equation 1.9, we obtain
Equation 1.11 𝐌 = �ψelec
״ (r)ψvib״ (q)�𝛍elec(r) + 𝛍nuc (q)�ψelec
׳ (r)ψvib׳ (q)�
where the transition moment operator is expressed as the sum of the electronic and nuclear parts.
We can further separate Equation 1.11 into two expressions that are solely a function of either
nuclear or electronic coordinates. However, the term that includes μRnucR is zero because it
involves two electronic wavefunctions that are orthogonal; this requires the overlap integral to be
zero. Thus, we are left with the following simplified expression for M
Equation 1.12 𝐌 = �ψelec
״ (r)�µelec �ψelec׳ (r)� ∙ �ψvib
״ (q)�ψvib׳ (q)�
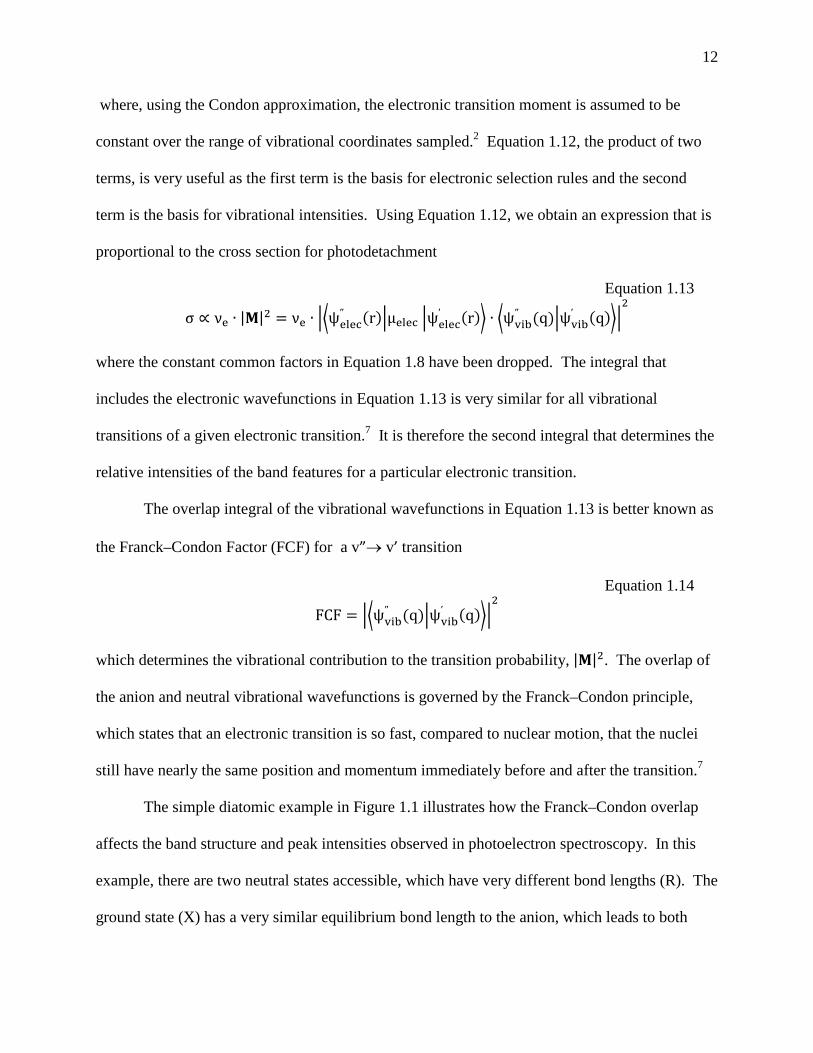
12
where, using the Condon approximation, the electronic transition moment is assumed to be
constant over the range of vibrational coordinates sampled.2 Equation 1.12, the product of two
terms, is very useful as the first term is the basis for electronic selection rules and the second
term is the basis for vibrational intensities. Using Equation 1.12, we obtain an expression that is
proportional to the cross section for photodetachment
Equation 1.13
σ ∝ νe ∙ |𝐌|2 = νe ∙ ��ψelec״ (r)�µelec �ψelec
׳ (r)� ∙ �ψvib״ (q)�ψvib
׳ (q)��2
where the constant common factors in Equation 1.8 have been dropped. The integral that
includes the electronic wavefunctions in Equation 1.13 is very similar for all vibrational
transitions of a given electronic transition.P
7P It is therefore the second integral that determines the
relative intensities of the band features for a particular electronic transition.
The overlap integral of the vibrational wavefunctions in Equation 1.13 is better known as
the Franck–Condon Factor (FCF) for a v”→ v’ transition
Equation 1.14
FCF = ��ψvib״ (q)�ψvib
׳ (q)��2
which determines the vibrational contribution to the transition probability, |𝐌|2. The overlap of
the anion and neutral vibrational wavefunctions is governed by the Franck–Condon principle,
which states that an electronic transition is so fast, compared to nuclear motion, that the nuclei
still have nearly the same position and momentum immediately before and after the transition. P
7
The simple diatomic example in Figure 1.1 illustrates how the Franck–Condon overlap
affects the band structure and peak intensities observed in photoelectron spectroscopy. In this
example, there are two neutral states accessible, which have very different bond lengths (R). The
ground state (X) has a very similar equilibrium bond length to the anion, which leads to both
13
similar potential energy curves and vibrational wavefunctions. The best overlap of vibrational
wavefunctions in Figure 1.1 is between the v "= 0 and the ν'= 0 wavefunctions, which will
produce a relatively large Franck–Condon factor and corresponds to the most intense peak in the
photoelectron spectrum. However, the excited neutral state (A) has a different equilibrium bond
length compared to the anion, which shifts the potential energy curve. Thus, the best vertical
overlap with the anion wavefunction will be at much higher vibrational energy levels of the
neutral. Mathematically, if the amplitude and phase of two wavefunctions are very different, the
positive and negative contributions to the overlap will tend to cancel in the integral in Equation
1.14, yielding very small Franck–Condon factors.
Polyatomic molecules have many more degrees of freedom than a diatomic and the
vibrations cannot be described in a simple two-dimensional picture. In the harmonic oscillator
limit, the vibrational motion of polyatomic molecules can be reduced to a superposition of
vibrations in 3N – 6 normal modes (3N – 5 for linear molecules).1 The total vibrational
wavefunction can then be expressed as a product of individual normal mode wavefunctions
Equation 1.15 ψvib(Q) = � ψ1(Q1)ψ2(Q2)⋯
3N−6
ψ3N−6(Q3N−6)
where Qi is the normal mode coordinate for vibrational mode νi. For polyatomic molecules, the
total vibrational wavefunction represented by Equation 1.15 for the anion and neutral is inserted
into Equation 1.14. Therefore, instead of having one vibrational overlap integral, there is a
product of overlap integrals, one for each normal mode. In this approach, each vibrational mode
is assumed to be independent and uncoupled from the other modes, though in later chapters it
will be shown that this is not always the case.
14
If all the vibrations in a molecule had non-negligible FCFs, or are active, the
photoelectron spectrum of even a small molecule would quickly become very difficult to
analyze. Fortunately, not all vibrations are active. In contrast, only totally symmetric vibrational
modes‡ generally dominate the photoelectron spectra. However, unlike diatomic wavefunctions,
polyatomic vibrational wavefunctions can be either totally symmetric or non-totally symmetric
depending on the symmetry of the normal coordinates and the vibrational quantum number.
Additionally, non-totally symmetric normal coordinates will have a vibrational wavefunction
that will alternate between being totally symmetric and non-totally symmetric as ν changes from
even to odd. The consequence of this alternating symmetry of the vibrational wavefunction is
that non-totally symmetric modes can be active, but only ∆v = 0, ±2, ±4, ±6,⋯ transitions are
allowed. However, under most circumstances only the ∆v = 0 (0–0) transition will have any
appreciable intensity.
Using the ideas presented above, we can make some general conclusions about
vibrational selection rules. In general, totally symmetric vibrational modes will tend to have the
only significant intensity in a photoelectron spectrum. Furthermore, totally symmetric vibrations
that reflect the geometry change between the anion and neutral will carry most of the signal
strength and dominate the photoelectron spectrum. For example, if the bond angle in a nonlinear
triatomic molecule has a dramatic change from the anion to the neutral, one would expect the
symmetric bend vibration to be active in the photoelectron spectrum. Lastly, modes that are non-
totally symmetric can be active, but only if certain conditions are met.
As mentioned previously, traditional electronic spectroscopy has the strict spin selection
rule that only transitions between states of the same multiplicity are allowed; therefore ∆S =
0. Photoelectron spectroscopy still has the constraint that the total spin of the system must be ‡ totally symmetric vibrations maintain the same point group symmetry throughout the entire vibration
15
conserved; however the detached electron departs with a spin of ± 1 2⁄ ℏ and the spin of the
neutral molecule change by the same amount. Since only one electron is involved in a transition,
the general spin selection rule for photodetachment is ∆S = ± 1 2⁄ . The consequence of this
selection rule is that the spin multiplicity must change for a transition to occur. It also allows for
the possibility to make transitions to both singlet and triplet states of the neutral if the ground
state of the anion is a doublet state.
1.5 Photoelectron Angular Distributions
The intensity of the photoelectron signal varies with the angle between the laser
polarization vector and the electron collection direction; the orientation of the laser polarization
can be manipulated by rotating a half-waveplate in the laser beam. In the electric dipole
approximation for one photon photoabsorption, the angular dependence of the photodetached
intensity is given by the well-known relation8
Equation 1.16 I(θ) =
σtotal4π
(1 + β ∙ P2(cosθ))
where θ is the angle between the electric field vector of the laser light and the direction of the
ejected electron, β is the asymmetry parameter (– 1 < β ≤ + 2), σ is the total photodetachment
cross section, and P2 (cos θ) is the second associated Legendre polynomial given by
Equation 1.17
P2(cosθ) =12
(3cos2θ − 1)
When the laser polarization is adjusted such that θ = 54.7°, referred to as the “magic” angle, the
second associated Legendre polynomial vanishes and the photoelectron signal is proportional to
the total cross section, independent of the value of β. Therefore, at the magic angle, the
16
photoelectron signal is independent of β and corresponds to the total detachment cross section
(σtotal).
The anisotropy parameter β is an especially useful physical property to determine.
Measurement of β is achieved by rotating a half waveplate in small (5°) increments through at
least 180° (which corresponds to 360° rotation of the laser polarization) while collecting
photoelectrons from a narrow kinetic energy range corresponding to a single peak/feature. Then,
a least squares fit of the data to Equation 1.16 extracts the β parameter. A less accurate method
(but generally sufficient for determining the anion orbital from which photodetachment
occurred) for determining β employs measuring photoelectron intensities at two angles, 0° and
90°, and using the relationship
Equation 1.18
β =I0 − I90
(1 2)⁄ I0 + I90
Angular distribution measurements provide qualitative insight about the angular
momentum state from which the electron was detached. When an electron is detached from an
atom, β is dependent on the momentum contained by the photoelectron. This is because the total
angular momentum must be conserved by the system. The angular momentum selection rule for
atomic photodetachment is ∆ℓ = ±1, as the photon imparts one unit of angular momentum to the
electron. Therefore, an electron detached from an s orbital (ℓ = 0) departs as a pure p-wave
(ℓ = 1) which corresponds to a β ≈ 2. In this situation, the maximum photoelectron intensity is
along the electric field vector of the light (θ = 0°). On the other hand, if an electron is detached
from a p orbital (ℓ = 1), the electron will depart as both s-wave (ℓ = 0) and d-waves (ℓ = 2),
where partial-wave interference will influence the measured β value. Close to the detachment
threshold, the lower angular momentum state will dominate and only s-wave detachment will be

17
observed, producing isotropic angular distribution of ejected electrons (β ≈ 0). Away from
threshold (1 eV or higher), both angular momentum states with be present and the partial waves
will interfere which will tend to produce negative β values.9
The photoelectron angular distributions arising from molecular photodetachment are
much more complicated. Atomic systems have inherent spherical symmetry so the atom’s
orientation does not affect the angular distribution. However, this is not the case for molecules,
where random orientation leads to averaging of the observed photoelectron angular distribution
over molecular orientations. It is possible to measure molecular frame photoelectron angular
distributions, but this procedure is complex and generally involves dissociative photodetachment
and requires using coincident detection of molecular fragments and photodetached elections.10
The mathematical treatment is beyond the scope of this work,8, 11 but we can still obtain valuable
qualitative anion orbital information from the β values in molecular photodetachment. It has
been shown from previous negative ion photoelectron studies12-14 that each electronic state of a
particular neutral is expected to have a characteristic value for β. Therefore, the peaks in a
vibrational progression belonging to transitions to a single neutral state will have very similar β
values, though these values will vary slightly over extended energy ranges. Furthermore, past
results have indicated that detachment from σ-type orbitals typically have large positive β ( > 1),
while detachment producing 0.5 – 1.5 eV photoelectrons arising from π-type orbitals will have a
negative β, indicating interference between s- and d-partial waves.9, 12, 14 Therefore, the β value
can be used as an indicator of the symmetry of the orbital from which the electron is detached.
1.6 Thermodynamics
As mentioned earlier, the primary result from a photoelectron spectrum of a molecular
anion is the electron affinity of the corresponding neutral radical, EA(R). The EA can be
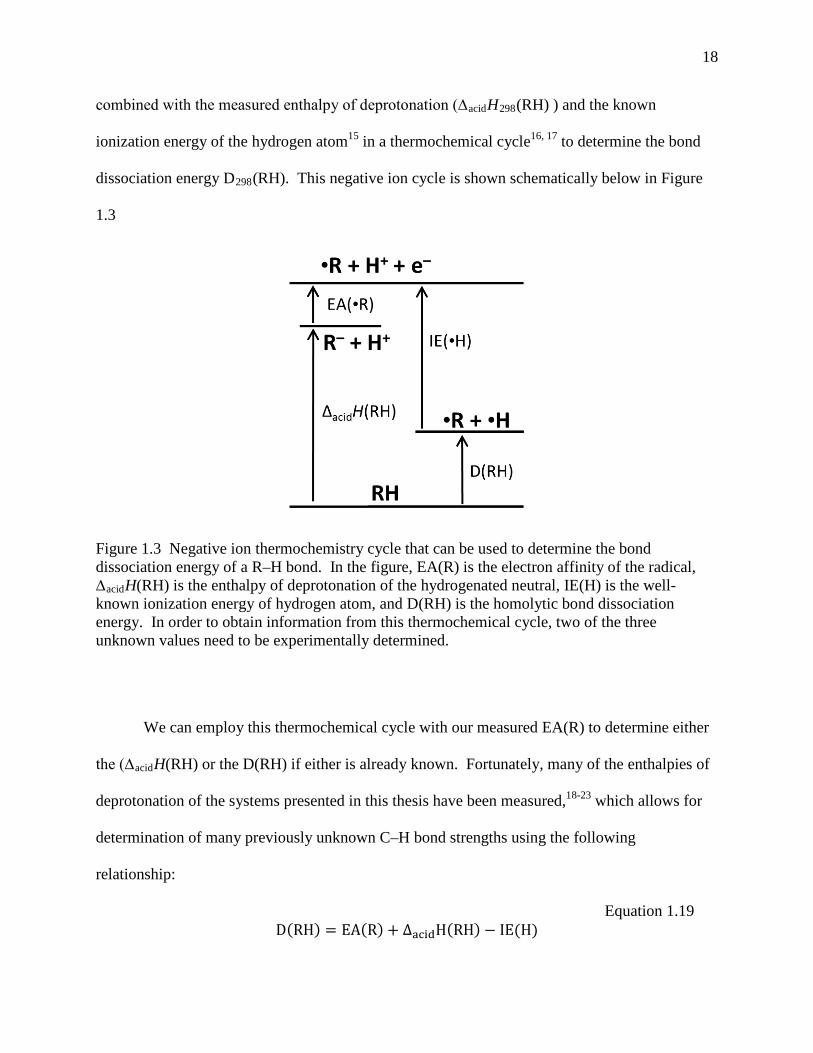
18
combined with the measured enthalpy of deprotonation (∆acidH298(RH) ) and the known
ionization energy of the hydrogen atom15 in a thermochemical cycle16, 17 to determine the bond
dissociation energy D298(RH). This negative ion cycle is shown schematically below in Figure
1.3
We can employ this thermochemical cycle with our measured EA(R) to determine either
the (∆acidH(RH) or the D(RH) if either is already known. Fortunately, many of the enthalpies of
deprotonation of the systems presented in this thesis have been measured,18-23 which allows for
determination of many previously unknown C–H bond strengths using the following
relationship:
Equation 1.19 D(RH) = EA(R) + ∆acidH(RH) − IE(H)
Figure 1.3 Negative ion thermochemistry cycle that can be used to determine the bond dissociation energy of a R–H bond. In the figure, EA(R) is the electron affinity of the radical, ∆acidH(RH) is the enthalpy of deprotonation of the hydrogenated neutral, IE(H) is the well-known ionization energy of hydrogen atom, and D(RH) is the homolytic bond dissociation energy. In order to obtain information from this thermochemical cycle, two of the three unknown values need to be experimentally determined.

19
The enthalpies of deprotonation are based on experiments typically measured at 300 K17, 18, 23
and the electron affinity and ionization energy are 0 K measurements; therefore, a small thermal
correction is needed when using Equation 1.19 to associate the bond dissociation energy with a
temperature (either 0 or 300 K). However, this thermal correction is always smaller than 0.3
kcal mol-1 so it is commonly ignored.24 Alternatively, D(RH) can be measured with very
accurate spectroscopic techniques,25 which when combined with our EA, lead to very accurate
values for the enthalpy of deprotonation (and the related gas phase acidity).
1.7 Survey of Thesis Topics
I have had the opportunity to be involved in many different projects as a graduate student,
many of which are contained within this dissertation. The molecular systems presented here are
collected into chapters which share similar themes and properties. Chapters 2 and 3 focus on the
instrumentation and experimental techniques used to collect the photoelectron spectra presented
in the following chapters. Chapter 2 presents a comprehensive overview of the critical
components of the apparatus including the ion source, ion optics and mass filter, the laser
system, electron analyzer, and detection method. Chapter 3 goes into detail on the new velocity
mass filter that was recently installed in our instrument along with an overview of how such
filters operate. Figure 1.4 illustrates the organic ions which are studied using photoelectron
spectroscopy in Chapters 4 – 7. A short summary of these experimental chapters are given
below.
Chapter 4 reports the photoelectron spectra of anilinide. This photoelectron spectrum is
very simple and easily analyzed compared to the other molecular species in this thesis. A regular
vibrational progression with a clear origin is observed in the photoelectron spectrum, which
readily allows for the determination of the electron affinity of the anilino radical. Additionally,

20
the anilino radical is isoelectronic with previously studied benzyl and phenoxyl radicals and the
structures in the photoelectron spectra are very similar with the analogous active vibrations.
Chapter 5 investigates the thermochemistry of a series of five azine anions: pyridinide,
1,2-diazinide, 1,3-diazinide, 1,4-diazininde, and 1,3,5-triazinide. Studying six-membered rings
with one, two, and three inserted nitrogen atoms allows for an understanding of how the nitrogen
affects the energetics and structure of the azinide anions and azinyl radicals. The structure in the
five photoelectron spectra is very similar with only two dominant active modes contributing to
the majority of the spectral features. Using recent gas-phase acidity measurements, the C–H
bond strengths in all five azines are determined.
21
Figure 1.4 Organic anions which have been studied using photoelectron spectroscopy in this thesis. Chapter 4: Anilinide. Chapter 5: Pyridinide, 1,2-diazinide, 1,3-diazinide, 1,4-diazinide, 1,3,5-triazinide. Chapter 6: CCl2
–, CBr2–, CI2
–, CHCl2–, CHBr2
–, CHI2–. Chapter 7: SF6
–, c–C4F8.
22
Chapter 6 focuses on a series of small halogen-containing molecules, which present
unique experimental and theoretical challenges. The dihalocarbenes (CX2 with X = Cl, Br, I)
had been previously studied and singlet-triplet energy splittings determined in our laboratory, but
recently high-level calculations called these results into question and prompted our
reinvestigation. The neutral carbenes formed from the doublet state of the anion can have either
singlet or triplet multiplicity, which have very different chemical and energetic properties. The
singlet-triplet splitting in these dihalocarbenes was the source of the discrepancy, and we were
able to determine the limited mass resolution in the earlier experiment had allowed previously
undetected dihalomethyl anions (CHX2) to contaminate the earlier data. We were able to make
the CHX2– cleanly and subtract their contribution from the CX2
– spectra. In an independent
study, we investigated the previously unknown CHX2– photoelectron spectra. These spectra
display a broad, structured vibrational progression due to a large geometry change between the
anion and corresponding neutral. Sophisticated calculations are necessary to understand the
origins of the vibrational structure observed in the photoelectron spectra.
Finally, Chapter 7 describes the photoelectron spectra of C4F8– and SF6
–, obtained in a
joint experimental effort between two research labs.26 The photoelectron spectra for these
systems illustrate broad vibrational progressions which have very harmonic peak spacing. This
extended progression is due to a large relative geometry change from the equilibrium structure of
the anion to the corresponding neutral. This large geometry change makes determination of the
origin experimentally unfeasible and provides a challenge in our ability to theoretically model
the photoelectron spectrum. As in Chapter 6, we rely on the assistance of high-level calculations
to better understand the experimental results.
23
1.8 References
1. Ellis, A.M., M. Feher, and T.G. Wright, Electronic and Photoelectron Spectroscopy 2005, Cambridge: Cambridge University Press.
2. Ervin, K.M. and W.C. Lineberger, Advances in Gas Phase Ion Chemistry, in Advances in Gas Phase Ion Chemistry, N.G. Adams and L.M. Babcock, Editors. 1992, JAI: Greenwich. p. 121.
3. Ervin, K.M., et al., The Only Stable State of O2− Is the X 2Πg Ground State and It (Still!)
Has an Adiabatic Electron Detachment Energy of 0.45 eV. J. Phys. Chem. A, 2003. 107(41): p. 8521.
4. Andersen, T., H.K. Haugen, and H. Hotop, Binding energies in atomic negative ions: III. Journal of Physical and Chemical Reference Data, 1999. 28(6): p. 1511-1533.
5. Kelleher, D.E., et al., The new NIST Atomic Spectra Database. Physica Scripta, 1999. T83: p. 158-161.
6. Neumark, D.M., et al., Laser photodetachment measurement of the electron-affinity of atomic oxygen. Phys. Rev. A, 1985. 32(3): p. 1890.
7. Herzberg, G., Electronic Spectra and Electronic Structure of Polyatomic Molecules. 2 ed. Molecular Spectra and Molecular Structure. Vol. 1. 1966, New York: Van Nostrand Reinhold. Chaps. 4 and 5.
8. Cooper, J. and R.N. Zare, Angular Distribution Of Photoelectrons. J. Chem. Phys., 1968. 48(2): p. 942.
9. Hanstorp, D., C. Bengtsson, and D.J. Larson, Angular-distributions in photodetachment from O. Physical Review A, 1989. 40(2): p. 670-675.
10. Continetti, R.E., Coincidence Spectroscopy. Annual Review of Physical Chemistry, 2001. 52(1): p. 165-192.
11. Mabbs, R., et al., Photoelectron imaging: an experimental window into electronic structure. Chemical Society Reviews, 2009. 38(8): p. 2169-2177.
12. Gunion, R.F., et al., Ultraviolet photoelectron-spectroscopy of the phenide, benzyl and phenoxide anions, with ab initio calculations. International Journal of Mass Spectrometry and Ion Processes, 1992. 117(1-3): p. 601-620.
13. Vogelhuber, K.M., et al., The C-H bond dissociation energy of furan: Photoelectron spectroscopy of the furanide anion. Journal of Chemical Physics, 2011. 134(6).
14. Surber, E., R. Mabbs, and A. Sanov, Probing the Electronic Structure of Small Molecular Anions by Photoelectron Imaging†. The Journal of Physical Chemistry A, 2003. 107(40): p. 8215-8224.
15. WebBook, N.C., NIST Standard Reference Database.
16. Brauman, J.I. and L.K. Blair, Gas-phase acidities of alcohols. Journal of the American Chemical Society, 1970. 92(20): p. 5986.
24
17. Davico, G.E., et al., The C-H bond-energy of benzene. Journal of the American Chemical Society, 1995. 117(9): p. 2590-2599.
18. DePuy, C.H., V.M. Bierbaum, and R. Damrauer, Relative gas-phase acidities of the alkanes. Journal of the American Chemical Society, 1984. 106(14): p. 4051-4053.
19. DePuy, C.H., S.R. Kass, and G.P. Bean, Formation and Reactions of Heteroaromatic Anions in the Gas-Phase. J. Org. Chem., 1988. 53(19): p. 4427.
20. Ellison, G.B., et al., Thermochemistry of the benzyl and allyl radicals and ions. International Journal of Mass Spectrometry and Ion Processes, 1996. 156(1-2): p. 109-131.
21. Robinson, M.S., et al., Experimental studies of allene, methylacetylene, and the propargyl radical- Bond-dissociation energies, gas-phase acidities, and ion-molecule chemistry. Journal of the American Chemical Society, 1995. 117(25): p. 6766-6778.
22. Villano, S.M., et al., Photoelectron Spectroscopy and Thermochemistry of the Peroxyformate Anion. Journal of Physical Chemistry A, 2010. 114(1): p. 191-200.
23. Eyet, N., S.M. Villano, and V.M. Bierbaum, Anchoring the gas-phase acidity scale: From formic acid to methanethiol. International Journal of Mass Spectrometry, 2009. 283(1-3): p. 26-29.
24. Berkowitz, J., G.B. Ellison, and D. Gutman, 3 methods to measure RH bond-energies. Journal of Physical Chemistry, 1994. 98(11): p. 2744-2765.
25. King, G.A., T.A.A. Oliver, and M.N.R. Ashfold, Dynamical insights into (1)pi sigma* state mediated photodissociation of aniline. Journal of Chemical Physics, 2010. 132(21).
26. Bopp, J.C., et al., Spectroscopic characterization of the isolated SF6- and C4F8
- anions: Observation of very long harmonic progressions in symmetric deformation modes upon photodetachment. Journal of Physical Chemistry A, 2007. 111(7): p. 1214-1221.

25
2 Experimental Methods
2.1 Introduction
The photoelectron spectrometer used for the experiment described in this thesis has
been in operation, in one form or another, since 1967.1 Many changes, improvements, and
additions have occurred over the past 40 years, but the basic technique of negative ion
photoelectron spectroscopy was born in the basement of JILA on our apparatus. The current
instrument can be summarized in five main sections, which are illustrated in Figure 2.1. Ions
are formed using a flowing afterglow in the ion source region. Following formation, ions are
accelerated and focused using a series of ion optics, and then pass through a Wien velocity
filter. The ions that pass through the filter undeflected intersect a fixed frequency laser beam
in the interaction region. Photodetached electrons are collected using a hemispherical energy
analyzer and then imaged onto a position sensitive detector.
Each of the sections mentioned above are described in detail in this chapter. For more
detailed and exhaustive descriptions of this apparatus, readers are referred to previous
accounts.2-5

26
2.2 Ion Source
Though several ion sources have previously been used on this apparatus6, 7, all of the
experiments presented here were conducted using a microwave discharge flowing afterglow
ion source.8, 9 There are several advantages of this type of ion source. First, we can generate
continuous and stable ion beams of a single target anion with nanoampere ion currents.
Second, we can perform rational stepwise gas-phase reactions in our flow tube to synthesize
anions that are difficult or challenging to make otherwise. Third, we use high densities (~ 1
Torr) of helium buffer gas which will, on average, collide with the anions formed 104 – 105
times to rotationally and vibrationally thermalize the ions. The rotational temperature of ions
made in the source, without external cooling, has been measured to be ~ 300 K.2 An external
liquid nitrogen jacket ,which surrounds the flow tube, can additionally cool the ions in the
synthesis region to ~ 150 K. Finally, the flowing afterglow is very versatile; we can easily
Figure 2.1 Schematic illustrating the main components of the negative ion photoelectron spectrometer
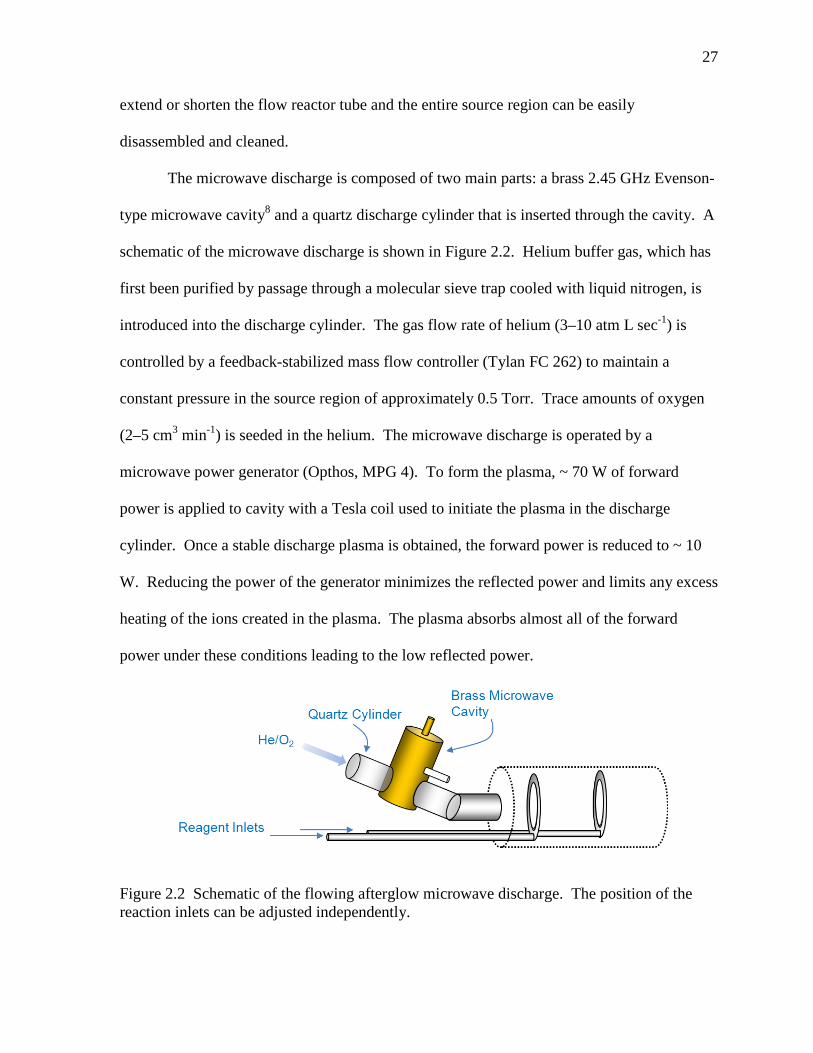
27
extend or shorten the flow reactor tube and the entire source region can be easily
disassembled and cleaned.
The microwave discharge is composed of two main parts: a brass 2.45 GHz Evenson-
type microwave cavity8 and a quartz discharge cylinder that is inserted through the cavity. A
schematic of the microwave discharge is shown in Figure 2.2. Helium buffer gas, which has
first been purified by passage through a molecular sieve trap cooled with liquid nitrogen, is
introduced into the discharge cylinder. The gas flow rate of helium (3–10 atm L sec-1) is
controlled by a feedback-stabilized mass flow controller (Tylan FC 262) to maintain a
constant pressure in the source region of approximately 0.5 Torr. Trace amounts of oxygen
(2–5 cm3 min-1) is seeded in the helium. The microwave discharge is operated by a
microwave power generator (Opthos, MPG 4). To form the plasma, ~ 70 W of forward
power is applied to cavity with a Tesla coil used to initiate the plasma in the discharge
cylinder. Once a stable discharge plasma is obtained, the forward power is reduced to ~ 10
W. Reducing the power of the generator minimizes the reflected power and limits any excess
heating of the ions created in the plasma. The plasma absorbs almost all of the forward
power under these conditions leading to the low reflected power.
Figure 2.2 Schematic of the flowing afterglow microwave discharge. The position of the reaction inlets can be adjusted independently.
28
A number of different species are formed in a pure helium discharge including He,
He+, He2+, electrons, and metastable He atoms (2 3S and 2 1S).8 Ions are produced by
addition of neutral gas reagents directly into or after the helium plasma. One mechanism by
which negative ions are formed in the discharge is by dissociative electron attachment in the
microwave discharge region.10 Oxygen radical anion (O–), which is used extensively in our
experiments, is formed using this mechanism and is shown in the reaction below
Scheme 2.1 O2 + e− → (O2
∗)− → O− + O
where e– is a low energy electron produced in the plasma that attaches to an oxygen atom,
which then dissociates to form O– and a neutral oxygen radical.11
In order to produce the ion of interest, a neutral precursor molecule is added
downstream of the discharge through a ring reagent inlet, illustrated in Figure 2.2. The
reaction of O– with organic molecules (RH2) has been studied in great detail10, 12 but the
general product channels are:
Scheme 2.2 O– + RH2 → R– + H2O
O– + RH2 → RH– + OH
O– + RH2 → RH + OH–
O– + RH2 → RHO– + H
The first two reactions are the dominant channels observed in our ion source: the abstraction
of either H2+ or H+. In the first reaction, where a net H2
+ is abstracted from RH2, the
hydrogen atoms can either be on the same carbon center or on different carbon atoms in the
molecule. Often, only the removal of one proton is desired. In this case, methane (CH4) is
introduced downstream of O–, forming hydroxide (OH–) by the following reaction:

29
Scheme 2.3 O– + CH4 → OH– + CH3
Following OH– formation, the organic precursor is added through a reagent inlet downstream
of the methane inlet and the following reaction occurs
Scheme 2.4 OH– + RH2 → H2O + RH–
In order to make sure all the O– has been removed through Scheme 2.3, excess methane is
added until all the measurable O– signal (both ion current and photoelectron counts) is
depleted. The flow rates of helium, oxygen, and the precursor molecules are optimized to
maximize ion current at the interaction region. The reagent inlet positions can also be varied
during the course of an experiment to optimize ion signal.
Under typical experimental conditions, ions are thermalized in the ion source to
approximately room temperature. A jacket that surrounds the flow tube can be filled with
liquid nitrogen to further cool the ions to approximately ~ 150 K. As will be shown in later
chapters, cooling the ions suppresses hot bands, which often results in a less congested and
cleaner photoelectron spectrum with an unambiguous origin peak. Cooling the flow tube can
reduce the ion current and is best used for experiments with appreciable ion signal at room
temperature ( > 100 pA) or for ions with large photodetachment cross sections.
The ion source region is maintained at a constant pressure of ~ 0.5 Torr by a Stokes
roots blower pump is used to pump away the helium, which provides 330 L sec-1 of pumping
speed. A skimmer nosecone (1-mm diameter) is placed at the end of the flow tube, which
serves two purposes: to gently extract the ions with a small potential bias (0–3 V), and to
create a pressure differential between the source region and the remainder of the apparatus.
30
The potential bias is kept relatively low to avoid heating the thermalized ions in the
extraction process.13
2.3 Ion Optics and Mass Selection
Figure 2.3 is a schematic overview of the instrument illustrating the relative position
of all the ion optics and major components of the apparatus. After extraction from the flow
tube through the nosecone, the ions pass through a series of adjustable ion lenses used to
focus, accelerate, and steer the ion beam. The first set of lenses (L1–6) accelerates the ion
beam from the nosecone extraction voltage to the beam voltage of 735 V. Elements L1–4
and are independently controlled, while L5 and L6 have constant applied potentials (400 and
735 V
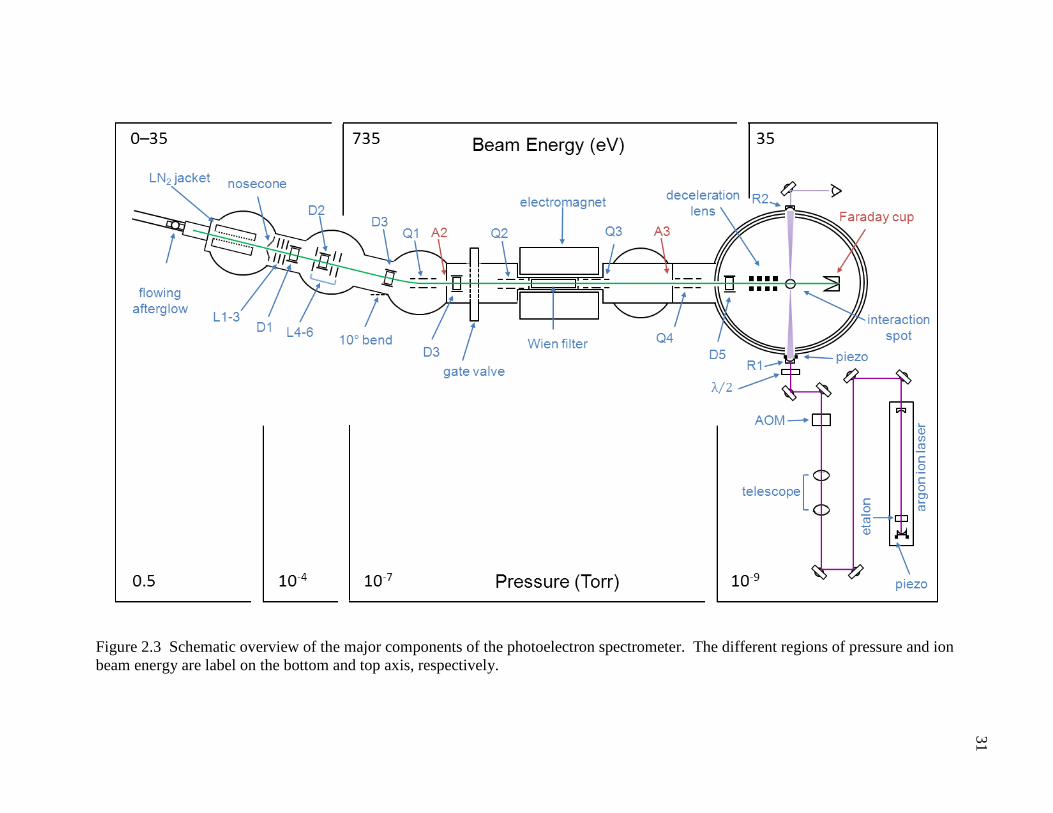
31
Figure 2.3 Schematic overview of the major components of the photoelectron spectrometer. The different regions of pressure and ion beam energy are label on the bottom and top axis, respectively.
31
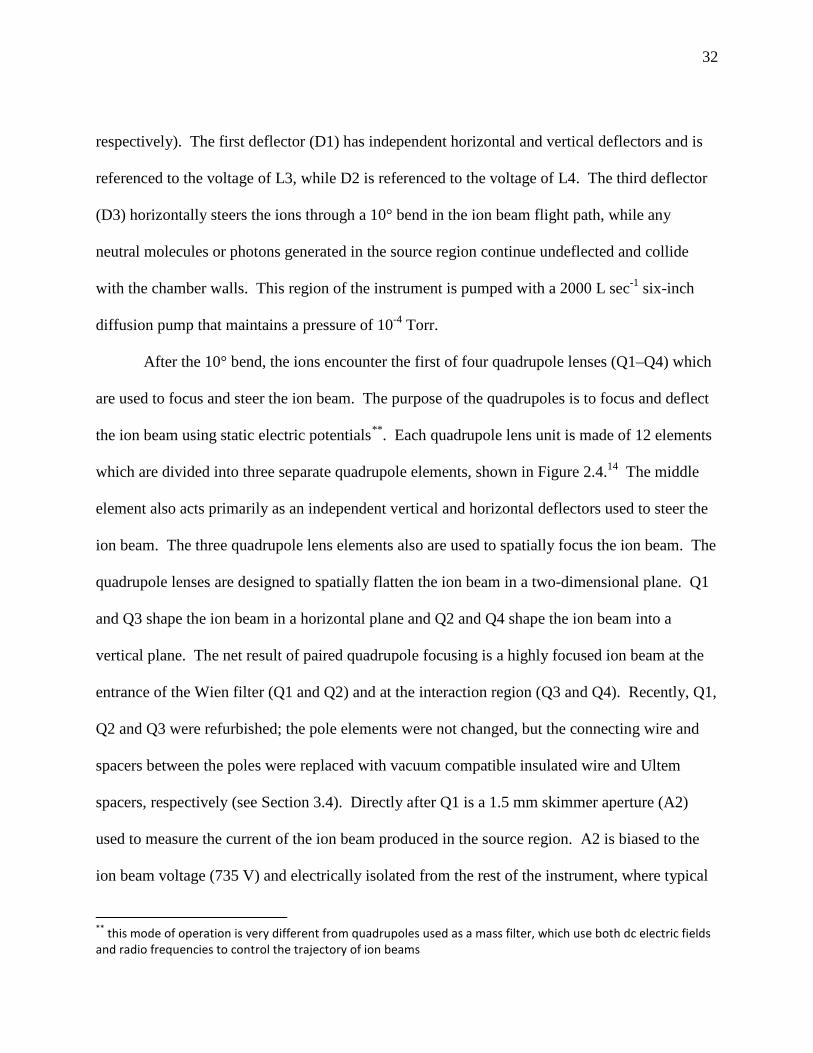
32
respectively). The first deflector (D1) has independent horizontal and vertical deflectors and is
referenced to the voltage of L3, while D2 is referenced to the voltage of L4. The third deflector
(D3) horizontally steers the ions through a 10° bend in the ion beam flight path, while any
neutral molecules or photons generated in the source region continue undeflected and collide
with the chamber walls. This region of the instrument is pumped with a 2000 L sec-1 six-inch
diffusion pump that maintains a pressure of 10-4 Torr.
After the 10° bend, the ions encounter the first of four quadrupole lenses (Q1–Q4) which
are used to focus and steer the ion beam. The purpose of the quadrupoles is to focus and deflect
the ion beam using static electric potentials**. Each quadrupole lens unit is made of 12 elements
which are divided into three separate quadrupole elements, shown in Figure 2.4.14 The middle
element also acts primarily as an independent vertical and horizontal deflectors used to steer the
ion beam. The three quadrupole lens elements also are used to spatially focus the ion beam. The
quadrupole lenses are designed to spatially flatten the ion beam in a two-dimensional plane. Q1
and Q3 shape the ion beam in a horizontal plane and Q2 and Q4 shape the ion beam into a
vertical plane. The net result of paired quadrupole focusing is a highly focused ion beam at the
entrance of the Wien filter (Q1 and Q2) and at the interaction region (Q3 and Q4). Recently, Q1,
Q2 and Q3 were refurbished; the pole elements were not changed, but the connecting wire and
spacers between the poles were replaced with vacuum compatible insulated wire and Ultem
spacers, respectively (see Section 3.4). Directly after Q1 is a 1.5 mm skimmer aperture (A2)
used to measure the current of the ion beam produced in the source region. A2 is biased to the
ion beam voltage (735 V) and electrically isolated from the rest of the instrument, where typical
** this mode of operation is very different from quadrupoles used as a mass filter, which use both dc electric fields and radio frequencies to control the trajectory of ion beams
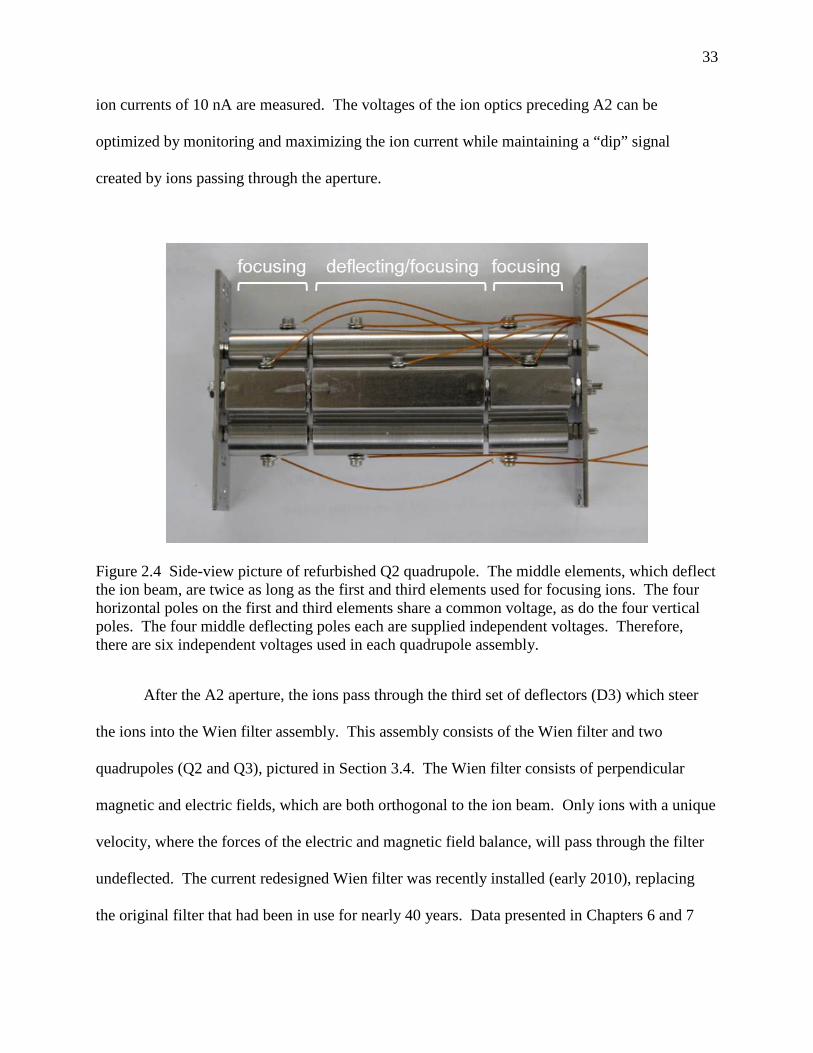
33
ion currents of 10 nA are measured. The voltages of the ion optics preceding A2 can be
optimized by monitoring and maximizing the ion current while maintaining a “dip” signal
created by ions passing through the aperture.
After the A2 aperture, the ions pass through the third set of deflectors (D3) which steer
the ions into the Wien filter assembly. This assembly consists of the Wien filter and two
quadrupoles (Q2 and Q3), pictured in Section 3.4. The Wien filter consists of perpendicular
magnetic and electric fields, which are both orthogonal to the ion beam. Only ions with a unique
velocity, where the forces of the electric and magnetic field balance, will pass through the filter
undeflected. The current redesigned Wien filter was recently installed (early 2010), replacing
the original filter that had been in use for nearly 40 years. Data presented in Chapters 6 and 7
Figure 2.4 Side-view picture of refurbished Q2 quadrupole. The middle elements, which deflect the ion beam, are twice as long as the first and third elements used for focusing ions. The four horizontal poles on the first and third elements share a common voltage, as do the four vertical poles. The four middle deflecting poles each are supplied independent voltages. Therefore, there are six independent voltages used in each quadrupole assembly.
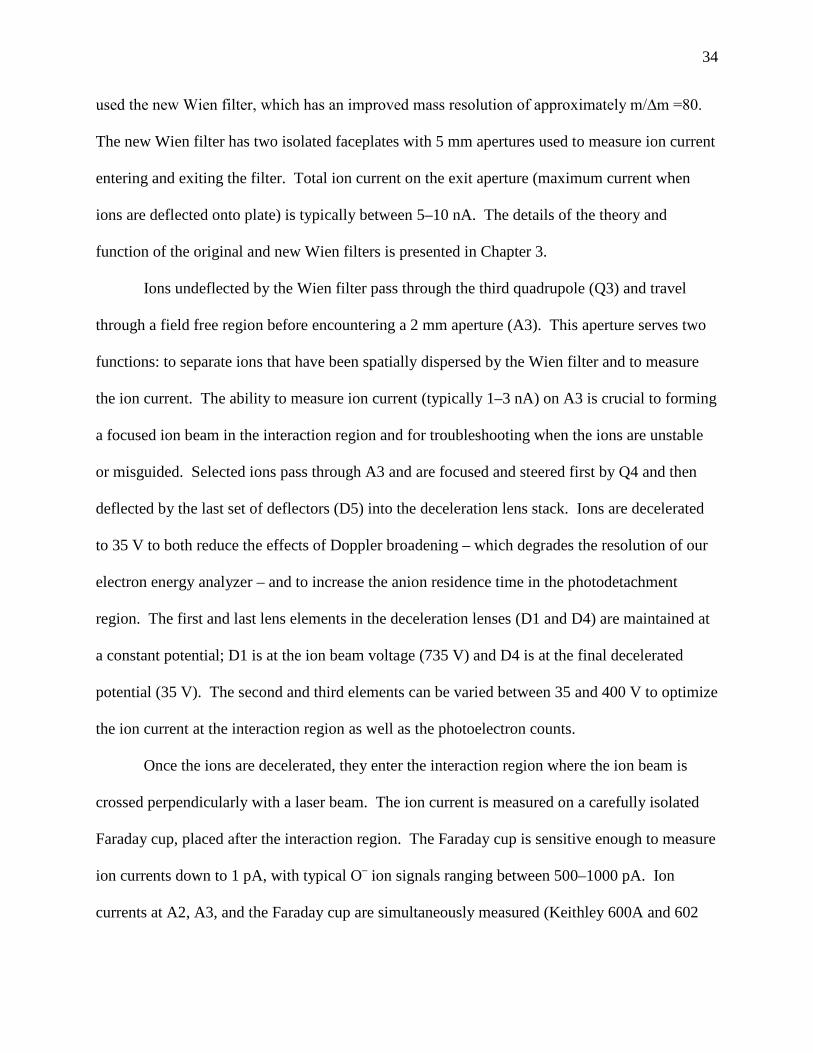
34
used the new Wien filter, which has an improved mass resolution of approximately m/∆m =80.
The new Wien filter has two isolated faceplates with 5 mm apertures used to measure ion current
entering and exiting the filter. Total ion current on the exit aperture (maximum current when
ions are deflected onto plate) is typically between 5–10 nA. The details of the theory and
function of the original and new Wien filters is presented in Chapter 3.
Ions undeflected by the Wien filter pass through the third quadrupole (Q3) and travel
through a field free region before encountering a 2 mm aperture (A3). This aperture serves two
functions: to separate ions that have been spatially dispersed by the Wien filter and to measure
the ion current. The ability to measure ion current (typically 1–3 nA) on A3 is crucial to forming
a focused ion beam in the interaction region and for troubleshooting when the ions are unstable
or misguided. Selected ions pass through A3 and are focused and steered first by Q4 and then
deflected by the last set of deflectors (D5) into the deceleration lens stack. Ions are decelerated
to 35 V to both reduce the effects of Doppler broadening – which degrades the resolution of our
electron energy analyzer – and to increase the anion residence time in the photodetachment
region. The first and last lens elements in the deceleration lenses (D1 and D4) are maintained at
a constant potential; D1 is at the ion beam voltage (735 V) and D4 is at the final decelerated
potential (35 V). The second and third elements can be varied between 35 and 400 V to optimize
the ion current at the interaction region as well as the photoelectron counts.
Once the ions are decelerated, they enter the interaction region where the ion beam is
crossed perpendicularly with a laser beam. The ion current is measured on a carefully isolated
Faraday cup, placed after the interaction region. The Faraday cup is sensitive enough to measure
ion currents down to 1 pA, with typical O– ion signals ranging between 500–1000 pA. Ion
currents at A2, A3, and the Faraday cup are simultaneously measured (Keithley 600A and 602
35
electrometers) to provide information on the magnitude and focusing of the ion beam at
difference points in the instrument. Operational pressures in the interaction region of ~10-9 Torr
are maintained by two turbomolecular pumps (Varian 6 and 8 inch turbo pumps; 250 L sec-1 and
280 L sec-1, respectively).
2.4 Ultraviolet Laser System
The decelerated ion beam is intersected by a fixed frequency laser beam in the interaction
region. The design and operation of the laser system used has been described in great detail
previously,3, 5, 6, 15 and will be summarized below. Figure 2.5 illustrates the major components of
the current laser system. We use an argon ion laser (Spectra Physics 2085-25) to obtain roughly
1 W of continuous fixed-frequency laser light at wavelengths of either 351 or 364 nm. The
current laser recently replaced the previous laser (Spectra Physics 2045), but very few major
changes were made between the new and previous systems and they will be treated as the same
for this description.††
Our experiment requires a fixed frequency laser to determine the appropriate energy of
the photodetached electrons, as shown in Equation 1.3. However, there are several lines of the
argon ion laser that can lase, which span several hundred nanometers.13 To produce light at a
single frequency (of a single line in the laser), special attention much be paid to the optics used
in the laser cavity. A custom high-reflective optic (0.25 in CVI Y3 mirror) is used as the back
mirror; this optic has a coating that is highly reflective for light in a narrow range (80 nm
bandwidth center around 355 nm). The other cavity mirror (a wavelength-selective output
coupler) has a 10 nm bandwidth so only one line of the argon ion laser will be able to lase.
†† The etalon now uses an automated heater unit to obtain single frequency operation, and a position-stabilizing feedback system was added to the output coupler mirror (which we deactivate when using our servo).
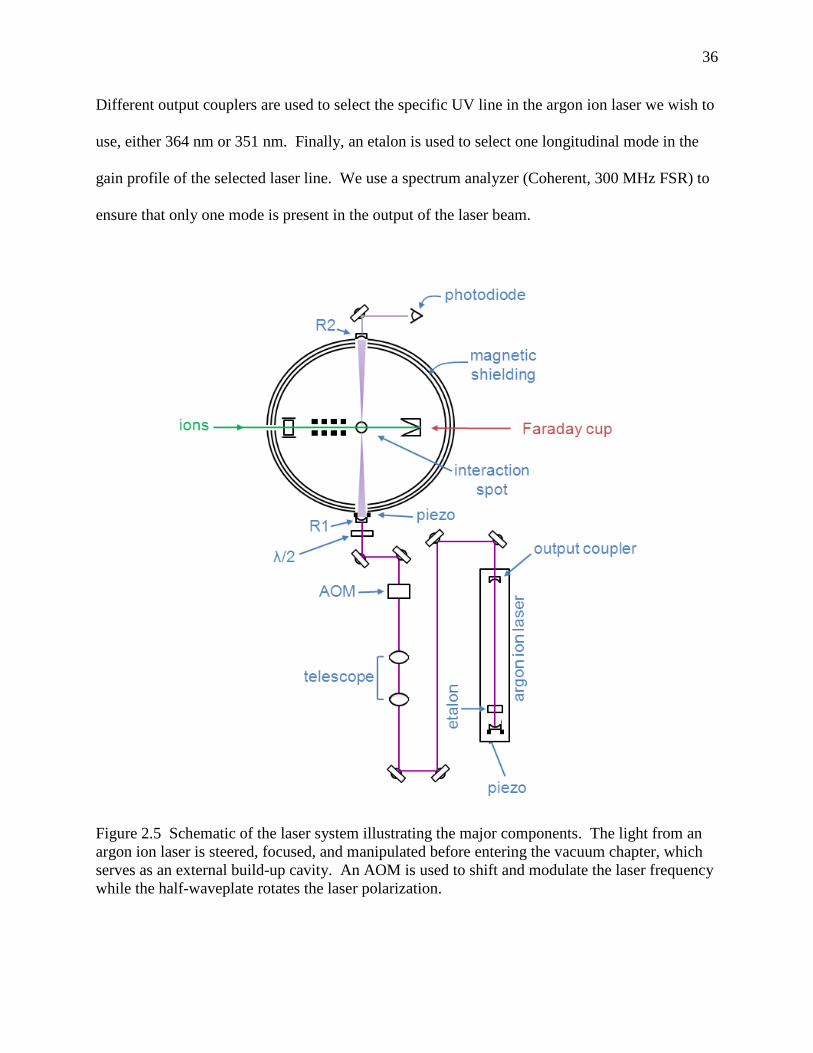
36
Different output couplers are used to select the specific UV line in the argon ion laser we wish to
use, either 364 nm or 351 nm. Finally, an etalon is used to select one longitudinal mode in the
gain profile of the selected laser line. We use a spectrum analyzer (Coherent, 300 MHz FSR) to
ensure that only one mode is present in the output of the laser beam.
Figure 2.5 Schematic of the laser system illustrating the major components. The light from an argon ion laser is steered, focused, and manipulated before entering the vacuum chapter, which serves as an external build-up cavity. An AOM is used to shift and modulate the laser frequency while the half-waveplate rotates the laser polarization.
37
The laser light is coupled into an external build-up cavity that amplifies the power inside
the interaction region by a factor of ~ 100. High circulating laser powers are necessary due to
the low number density of ions in the interaction region and the small collection efficiency of our
electron energy analyzer (see Section 2.5). The external build-up cavity is essentially a Fabry-
Perot interferometer that is locked to resonance.15 The condition for build up inside the vacuum
chamber is that the resonant frequency of the laser and build-up cavity be exactly matched.
However, the resonant frequencies of both the laser and build-up cavities will vary over the
course of a day due to variables such as thermal drift, mechanical vibrations, and fluctuations in
the laser plasma density. In order to keep the resonant frequencies matched, a custom
servoamplifier system adjusts the lengths of both the laser and build-up cavities with
piezoelectric discs mounted to the cavity mirrors.
A major component of the laser/servoamplifier system is an acousto-optic modulator
(AOM) which is used to modulate the laser light. The AOM (Inter-Action model AOM 704)
serves several important purposes. First, the AOM shifts the laser light by 50–80 MHz, which
isolates the laser and build-up cavities and prevents light reflected off the build-up cavity mirror
from returning to the laser cavity and causing interference. Second, the AOM can make very fast
( > 5 kHz) adjustments to the laser frequency which the piezos cannot handle. Lastly, the AOM
adds a 1 MHz dither onto the laser light which provides an error signal for the servoamplifier.
Using this error signal, the servoamplifier can adjust the build-up cavity piezo, the laser cavity
piezo, or the AOM frequency shift to maintain resonance conditions between the two cavities.6
Two other critical components in the laser system are the telescope and half-waveplate.
The telescope is used to adjust the spatial mode parameters of the laser beam in order to match
the diameter of the wave-front curvature of the build-up cavity TEM00 mode.16 The half-
38
waveplate is used to rotate the polarization of the laser beam, which is required to obtain
angular-dependent photoelectron spectra.
2.5 Photoelectron Energy Analysis and Detection
The laser and ion beams cross in the interaction region, where electrons are
photodetached in all directions. Only the electrons that pass through a 5° solid angle cone
(0.065” circular aperture, 3/8” away from the interaction spot) are collected; this represents less
than 0.2% of the ejected electrons. Figure 2.6 shows a cross-sectional view of the electron
energy analyzer and the interaction region. Electrons that pass through the acceptance aperture
are then accelerated and focused into the hemispherical energy analyzer. The hemispherical
analyzer is made of two concentric hemispheres, which provides a radial electric field that
disperses the electrons spatially at the analyzer’s output according to the electron’s kinetic
energy.4 The analyzer is operated at constant transmission energy (presently ~ 4 eV), which
defines the energy an electron must have to successfully pass through the hemispheres.
Photodetached electrons will have kinetic energies ranging from 0 eV to the photon energy (~
3.5 eV). Therefore, in order to pass through the analyzer and be detected, the electrons must be
accelerated to the transmission energy. This is accomplished by a series of cylindrical input
lenses (VIR, V1, V2, VHC). The first three lenses (VIR, V1, and V2) together form a zoom lens
which accelerates the ions. A second zoom lens is formed by V2, V3, and VHC, which serves to
focus and accelerate the electrons to the transmission energy. The lenses at the entrance and exit
of the hemispheres are Herzog correction lenses (VHC), which help prevent any fringe fields
from entering the hemispheres. The voltages applied to the input lenses, and the inner and outer
hemispheres are determined by simple relationships to the kinetic energy of electrons that are

39
selected to be transmitted through the analyzer and the transmission energy; this is described in
detail in Feigerle’s thesis.4
Electrons that enter the hemispheres will experience different forces depending on their
energy and spread out spatially, with high-energy electrons passing near the outer hemisphere
and low-energy electrons traveling near the inner hemisphere. If the electron kinetic energy is
too little or high, it will have a trajectory that will cause it to collide with the hemispheres, and
will not be detected. Electrons within 2% of the transmission energy will be transmitted through
the analyzer, which is ~ 100 meV for the current transmission energy. In this manner, the
Figure 2.6 Cross-sectional view of the electron energy analyzer and the interaction region.
40
photoelectron spectrum is obtained by collecting overlapping 100 meV segments of electrons at
a time by varying the voltages on the input lens stack and allowing electrons of different energies
to be transmitted. The energy dispersed electrons are then accelerated and focused onto a
position sensitive detector that includes a stack of five mircochannel plates coupled to a resistive
anode. The position sensitive detector is a two-dimensional array that correlates the electron
impact position with a specific kinetic energy. The detector is divided into 256 channels in the
energy dispersion direction, the x-axis, and 16 channels in the y-axis, which corresponds to
electron counts (or impact events). The data in the 16 channels that correspond to counts are
simply integrated to produce an integer number of counts per channel in the x-direction.
Electrons with kinetic energies less than about 0.3 eV are not detected very efficiently due to the
effects of stray fields and degraded resolution.
2.6 Data Acquisition and Analysis
The position sensitive detector is coupled to an external position analyzer (Quantar
Technology 2401B), which analyzes the raw data from the resistive anode and determines the
position of the detected electron. The position analyzer sends the processed signals to a PC
computer which collects and stores the data. The analyzer is also connected to an oscilloscope
where real-time signals of the electron impact position on the detector can be monitored. Details
of how the position analyzer interfaces with the position sensitive detector and the PC computer
is outlined in Ramond’s thesis.7 A custom LabVIEW program is used to interface and
coordinate with the position analyzer to collect data. This program also communicates with a
voltage programmer (JILA L036), which controls the voltages in the hemispherical analyzer
assembly.
41
The raw data that are stored in the computer (counts versus detector channel) must be
calibrated and converted from detector position into an absolute electron kinetic energy scale.
This is done by measuring the photoelectron spectrum of an atomic system with well-known
energy transitions. In our case, it is convenient to use O– because it is present as a precursor in
our ion source and the electron affinity of neutral oxygen atom, EA(O) = 1.46111 eV, is
precisely known.17 This calibration is performed several times throughout the day, generally
before and after acquiring data sets. There is also a slight nonlinearity of the kinetic energy
analyzer scale that must be corrected for; this is typically performed whenever there are major
adjustments of the laser beam position. A kinetic energy compression factor, which is an
empirical correction to the relative energy scale, is made by measuring energy of well-known
transitions of either tungsten (W–) or oxygen (O2–) anions.3 A correction, which is dependent on
the transmission energy, of less than 1% is generally observed.
2.7 Ab initio Calculation and Franck-Condon Simulation
Electronic structure calculations have proven to be a valuable, and often necessary,
component of assigning and interpreting photoelectron spectra. Most of the calculations
presented in this thesis use the B3LYP method of density functional theory (DFT)18, 19 with basis
sets ranging from modest (6-311++G(d,p)) to more sophisticated (aug-cc-pVTZ). We often use
this DFT method as it has been shown to yield reliable frequencies and is computationally
efficient for large molecules.20, 21 The GAUSSIAN 03 program package22 is used to obtain
optimized equilibrium molecular geometries, harmonic vibrational frequencies, and vibrational
normal coordinates for both the anion and corresponding neutral.
42
In order to simulate the photoelectron spectrum of an anion, the Franck-Condon factors
(FCF) for all allowed vibronic transitions must be determined. The expression for determining
the FCF, derived in Chapter 1, is
Equation 2.1
FCF = ��ψv״(Q״)�ψv׳�Q׳���2
where ψv״�Q״� is the multidimensional wavefunction in quantum state ν״ (ν״ = ν1״ , ν2
״ , … , νn״ ) as a
function of the normal coordinates of the anion Q״, and ψv׳�Q׳� is the corresponding vibrational
wavefunction of the neutral in terms of its normal coordinates Q׳.P
2P In order to complete the
integration in Equation 2.1, the wavefunctions must be expressed in terms of the same
coordinates for both states. This can be accomplished by using the Duschinsky transformation P
23P,
which expresses the normal mode coordinates of the neutral in the basis set of the normal mode
coordinates of the anion. The transformation between the normal coordinates (Q״and Q׳) is given
by
Equation 2.2 𝐐״ = 𝐉״𝐐׳ + 𝐊״
where 𝐉״is the Duschinsky rotation matrix and 𝐊״is a vector of geometry displacements given in
the basis of the normal coordinates of the anion.P
2P The Duschinsky rotation matrix accounts for
the vibrational mixing of the normal modes that result from a relative rotation of the normal
coordinates between the anion and neutral states. P
24P In order to determine 𝐉״and 𝐊״, a Fortran
program (FCFGAUS) is used to extract the calculated normal coordinate vectors and geometries
from the electronic structure calculations. Another Fortran program (PESCALP
25P) uses the output
files from FCFGAUS to calculate the Franck-Condon factors. PESCAL uses the Sharp-

43
Rosenstock-Chen method in the harmonic oscillator approximation including Duschinsky
rotations.26 The raw FCFs are sorted according to their energies and then convoluted with a
Gaussian lineshape representative of the experimental resolution (~ 10 meV).
Using only the results from the electronic structure calculation, one can simulate the
photoelectron spectrum that is independent of experimental observations. However, it is often
the case that some experimental data has previously been determined (vibrational frequencies,
vibrational anharmonicities, electron affinity, and geometries), which can be inputted into
PESCAL when simulating the spectrum. We generally include the experimental vibrational
frequencies of active modes and the position of the origin peak (the EA) in the simulation if they
can be determined from the photoelectron spectrum. PESCAL also has a nonlinear least-squares
optimization procedure that can be used to fit the experimental spectrum. The values for the
anion and neutral vibrational constants, geometries, the electron affinity, the anion vibrational
temperature, and a scaling factor for the relative intensity are used as adjustable parameters
which are optimized to minimize the differences between the simulated and experimental
spectra.
Many molecular systems studied in our lab have excellent agreement between experiment
and simulated spectra.2, 27-31 However, the type of normal mode analysis described above can be
insufficient for systems that have a large change in geometry between the anion and neutral
states or when there are non-adiabatic effects present.32-35 In these cases, a more tailored and
sophisticated treatment is required, with several examples presented in Chapters 6 and 7 in this
thesis.
44
2.8 References
1. Brehm, B., M.A. Gusinow, and J.L. Hall, Electron affinity of helium via laser photodetachment of its negative ion. Physical Review Letters, 1967. 19(13): p. 737-&.
2. Ervin, K.M., J. Ho, and W.C. Lineberger, Ultraviolet Photoelectron-Spectrum of NO2. J. Phys. Chem., 1988. 92(19): p. 5405-5412.
3. Ervin, K.M. and W.C. Lineberger, in Advances in Gas Phase Ion Chemistry, N.G. Adams and L.M. Babcock, Editors. 1992, JAI: Greenwich. p. 121.
4. Feigerle, C.S., in JILA 1983, University of Colorado: Boulder.
5. Ho, J., in Chemistry 1992, University of Colorado: Boulder.
6. Gunion, R.F., Ultraviolet Photoelectron Spectroscopy of Molecular Anions, in Department of Chemistry 1995, Boulder: Boulder. p. 275.
7. Ramond, T.M., Negative Ion Photoelectron Spectroscopy of Alkyl Peroxides, Alkoxides, and Group VIII Transition Metal Oxides, in Chemistry2001, University of Colorado: Boulder.
8. Fehsenfe.Fc, K.M. Evenson, and H.P. Broida, Microwave discharge cavities operating at 2450 MHz. Review of Scientific Instruments, 1965. 36(3): p. 294.
9. Leopold, D.G., et al., Methylene: A study of the X 3B1 and a 1A1 states by photoelectron spectroscopy of CH2
- and CD2-. J. Chem. Phys., 1985. 83(10): p. 4849.
10. Lee, J. and J.J. Grabowski, Reactions of the Atomic Oxygen Radical Anion and the Synthesis of Organic Reactive Intermediates. Chem. Rev., 1992. 92(7): p. 1611.
11. Jennings, K.R., Negative Ions. Philosophical Transactions of the Royal Society of London. Series A, Mathematical and Physical Sciences, 1979. 293(1400): p. 125-133.
12. DePuy, C.H., V.M. Bierbaum, and R. Damrauer, Relative gas-phase acidities of the alkanes. Journal of the American Chemical Society, 1984. 106(14): p. 4051-4053.
13. Moore, J.H., C.C. Davis, and M.A. Coplan, Building Scientific Apparatus. Third ed2003, Boulder: Westview Press. 654.
14. Marynowski, M., W. Franzen, and M. Elbatanouny, Analysis of the properties of an electrostatic triplet quadrupole lens used as an electron-beam transport device E. Review of Scientific Instruments, 1994. 65(12): p. 3718-3723.
15. Ervin, K.M., J. Ho, and W.C. Lineberger, A Study of the Singlet and Triplet-States of Vinylidene by Photoelectron-Spectroscopy of H2C=C-, D2C=C-, and HDC=C- - Vinylidene Acetylene Isomerization. J. Chem. Phys., 1989. 91(10): p. 5974-5992.
16. Kogelnik, H. and T. Li, Laser beams and resonators. Applied Optics, 1966. 5(10): p. 1550.
17. Neumark, D.M., et al., Laser photodetachment measurement of the electron-affinity of atomic oxygen. Phys. Rev. A, 1985. 32(3): p. 1890.
18. Becke, A.D., Density-functional thermochemistry. III. The role of exact exchange. Journal of Chemical Physics, 1993. 98(7): p. 5648-5652.

45
19. Lee, C.T., W.T. Yang, and R.G. Parr, Development of the colle-salvetti correlation-energy formula into a functional of the electron density. Physical Review B, 1988. 37(2): p. 785-789.
20. Wong, M.W., Vibrational frequency prediction using density functional theory. Chemical Physics Letters, 1996. 256(4-5): p. 391-399.
21. Halls, M.D., J. Velkovski, and H.B. Schlegel, Harmonic frequency scaling factors for Hartree-Fock, S-VWN, B-LYP, B3-LYP, B3-PW91 and MP2 with the Sadlej pVTZ electric property basis set. Theoretical Chemistry Accounts, 2001. 105(6): p. 413-421.
22. Frisch, M.J., et al., Gaussian 03, Revision B.052003, Pittsburgh: Gaussian, Inc.
23. Duschinsky, F., The importance of the electron spectrum in multi atomic molecules. concerning the Franck-Condon principle. Acta Physicochimica Urss, 1937. 7(4): p. 551-566.
24. Muller, C.W., et al., Duschinsky mixing between four non-totally symmetric normal coordinates in the S-1-S-0 vibronic structure of (E)-phenylvinylacetylene: a quantitative analysis. Physical Chemistry Chemical Physics, 2010. 12(10): p. 2331-2343.
25. Ervin, K.M., PESCAL, Fortran program. PESCAL, Fortran program, 2010.
26. Sharp, T.E. and H.M. Rosenstock, Franck-condon factors for polyatomic molecules. Journal of Chemical Physics, 1964. 41(11): p. 3453.
27. Ervin, K.M., et al., The Only Stable State of O2- Is the X 2Pg Ground State and It (Still!)
Has an Adiabatic Electron Detachment Energy of 0.45 eV. J. Phys. Chem. A, 2003. 107(41): p. 8521.
28. Ervin, K.M., et al., Naphthyl radical: Negative ion photoelectron spectroscopy, Franck-Condon simulation, and thermochemistry. J. Phys. Chem. A, 2001. 105(48): p. 10822.
29. Villano, S.M., et al., Photoelectron Spectroscopy and Thermochemistry of the Peroxyformate Anion. Journal of Physical Chemistry A, 2010. 114(1): p. 191-200.
30. Wren, S.W., et al., The photoelectron spectrum of CCl2-: the convergence of theory and
experiment after a decade of debate. Physical Chemistry Chemical Physics, 2009. 11(23): p. 4745-4753.
31. Vogelhuber, K.M., et al., The C-H bond dissociation energy of furan: Photoelectron spectroscopy of the furanide anion. Journal of Chemical Physics, 2011. 134(6).
32. Bopp, J.C., et al., Spectroscopic characterization of the isolated SF6- and C4F8
- anions: Observation of very long harmonic progressions in symmetric deformation modes upon photodetachment. Journal of Physical Chemistry A, 2007. 111(7): p. 1214-1221.
33. Gianola, A.J., et al., Thermochemical studies of pyrazolide. J. Phys. Chem. A, 2006. 110(27): p. 8457.
34. Vogelhuber, K.M., et al., Photoelectron spectra of dihalomethyl anions: Testing the limits of normal mode analysis. The Journal of Chemical Physics, 2011. 134(18): p. 184306-13.
35. Ichino, T., et al., The vibronic level structure of the cyclopentadienyl radical. Journal of Chemical Physics, 2008. 129(8).

46
47
3 Wien Velocity Filter: New Mass Filter
3.1 Introduction
One of the defining advantages of studying charged particles in the gas phase is the
ability to control the trajectory of ions with applied electric and magnetic fields. The forces on
the charged particles from the external fields can additionally be used to separate ions based on
their mass-to-charge ratio. Being able to filter anions based on their mass is a powerful tool
which allows us to select one specific anion from the mixture of ions created in our source
region. This ability to select an individual anion is critical for our experiment, and limited
resolution of the mass filter will likely be detrimental to our measurements.
There are several techniques widely used for filtering a beam of ions, namely magnetic
sector mass analyzers, RF quadrupole mass analyzers, linear time-of-flight mass spectrometers,
and Wien filters.1, 2 Determining which technique to use depends largely on whether the ion
beam is pulsed or continuous, and the type of experiment, mass range and resolution required,
and method of detection that will be employed. Our experiment requires a filter that has high
transmission allowing a relatively large current from a focused ion beam (10-9 – 10-12 A) to reach
the laser interaction region due to the low collection efficiency of our energy analyzer. We also
need moderate mass resolutions (m/∆m ~ 40) in order to separate small anions (roughly 40 amu)
that only differ by 1 amu – specifically the loss of a proton. The Wien velocity filter meets the
above requirements and has the additional advantage of producing an undeflected beam of
selected anions. However, after over thirty years of dutiful service and several rebuilds, the
Wien filter in our apparatus was not functioning as designed, which caused the instrument to
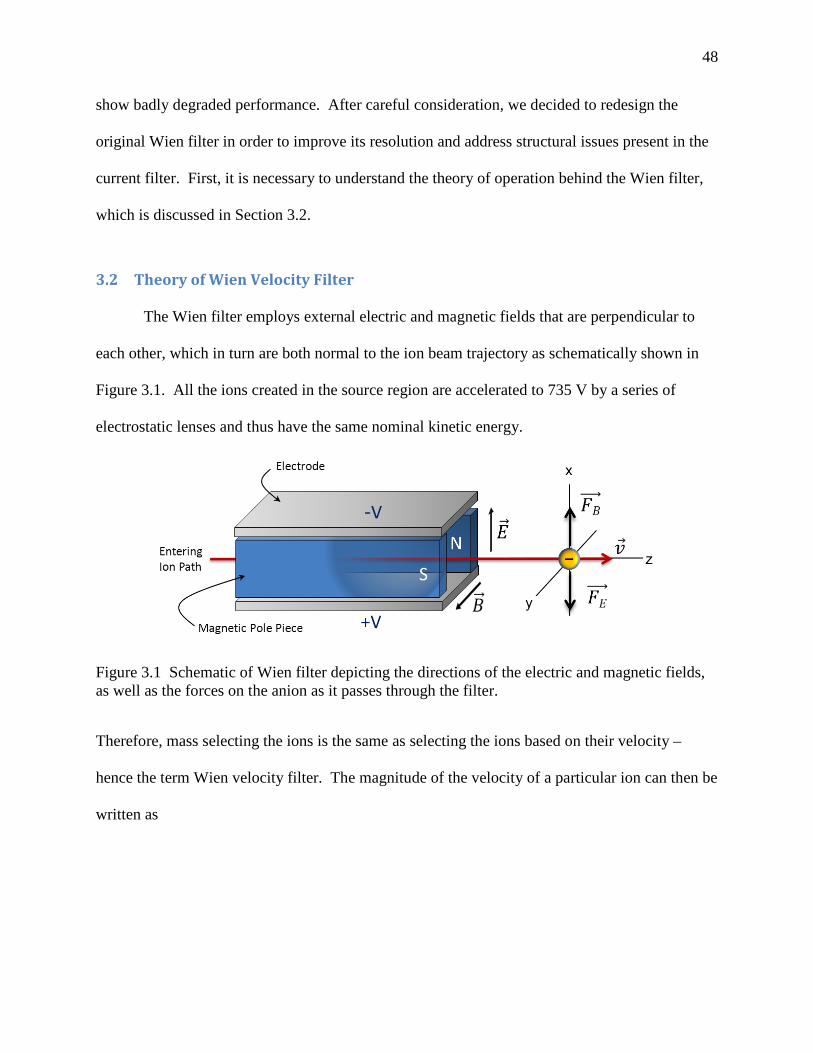
48
show badly degraded performance. After careful consideration, we decided to redesign the
original Wien filter in order to improve its resolution and address structural issues present in the
current filter. First, it is necessary to understand the theory of operation behind the Wien filter,
which is discussed in Section 3.2.
3.2 Theory of Wien Velocity Filter
The Wien filter employs external electric and magnetic fields that are perpendicular to
each other, which in turn are both normal to the ion beam trajectory as schematically shown in
Figure 3.1. All the ions created in the source region are accelerated to 735 V by a series of
electrostatic lenses and thus have the same nominal kinetic energy.
Therefore, mass selecting the ions is the same as selecting the ions based on their velocity –
hence the term Wien velocity filter. The magnitude of the velocity of a particular ion can then be
written as
Figure 3.1 Schematic of Wien filter depicting the directions of the electric and magnetic fields, as well as the forces on the anion as it passes through the filter.
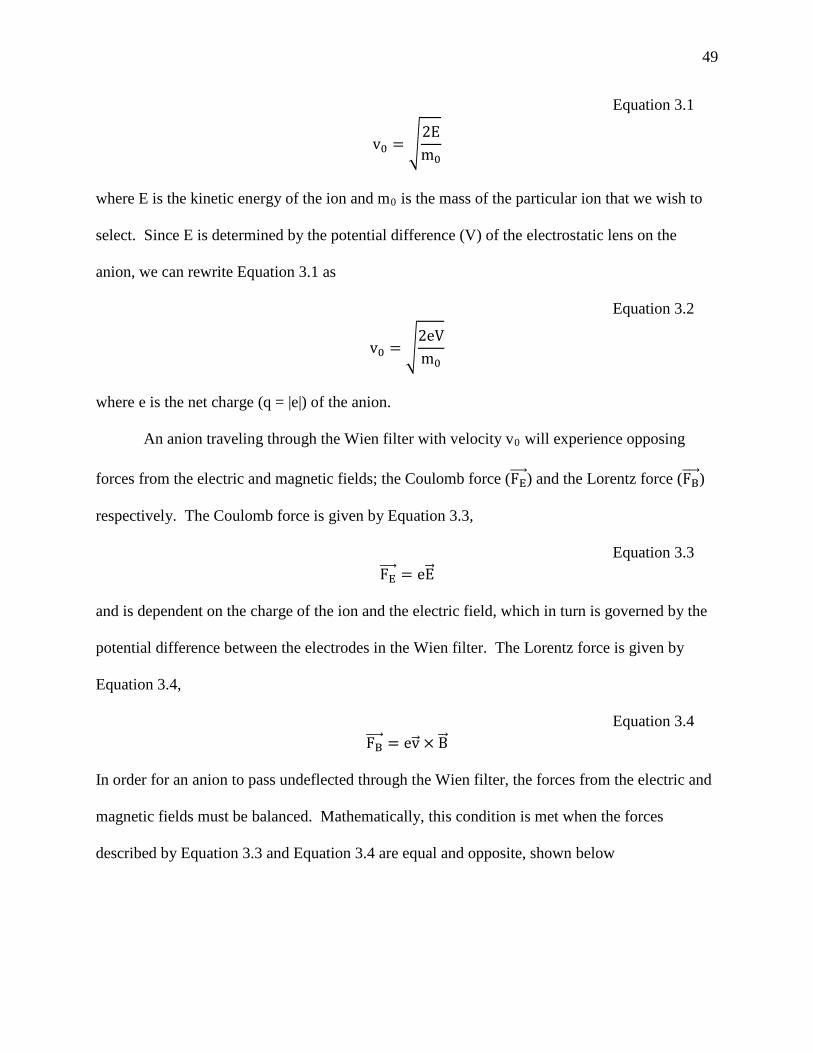
49
Equation 3.1
v0 = �2Em0
where E is the kinetic energy of the ion and m0 is the mass of the particular ion that we wish to
select. Since E is determined by the potential difference (V) of the electrostatic lens on the
anion, we can rewrite Equation 3.1 as
Equation 3.2
v0 = �2eVm0
where e is the net charge (q = |e|) of the anion.
An anion traveling through the Wien filter with velocity v0 will experience opposing
forces from the electric and magnetic fields; the Coulomb force (FE����⃗ ) and the Lorentz force (FB����⃗ )
respectively. The Coulomb force is given by Equation 3.3,
Equation 3.3 FE����⃗ = eE��⃗
and is dependent on the charge of the ion and the electric field, which in turn is governed by the
potential difference between the electrodes in the Wien filter. The Lorentz force is given by
Equation 3.4,
Equation 3.4 FB����⃗ = ev�⃗ × B��⃗
In order for an anion to pass undeflected through the Wien filter, the forces from the electric and
magnetic fields must be balanced. Mathematically, this condition is met when the forces
described by Equation 3.3 and Equation 3.4 are equal and opposite, shown below

50
Equation 3.5 eE��⃗ = ev�⃗ × B��⃗
Substituting the expression derived for the ion velocity in Equation 3.2, and solving for the
magnitude of the magnetic field,
Equation 3.6
B = E�m0
2eV
to obtain Equation 3.6. Physically, this means that for a particular electric and magnetic field
strength, only one unique m0 will traverse through the Wien filter undeflected. Experimentally,
we can control the magnitude of both E and B but we choose to keep the electric field constant
and vary the magnetic field to select a desired anion.
For anions that have masses (mx) where the forces from the electric and magnetic fields
are not balanced, they will experience a centripetal force (F�⃗ C) given by
Equation 3.7 F�⃗ C = F�⃗ B − F�⃗ E
We can rewrite Equation 3.7 using the definition of centripetal force and Equation 3.3 and
Equation 3.4
Equation 3.8 mxvx2
R= evxB − eE
where R is the radius of the circular path that ions with mass mx will be deflected. We can
further simplify Equation 3.8
Equation 3.9
mxvx2
R= eE ��
m0
mx− 1�
and then set Equation 3.9 equal to R
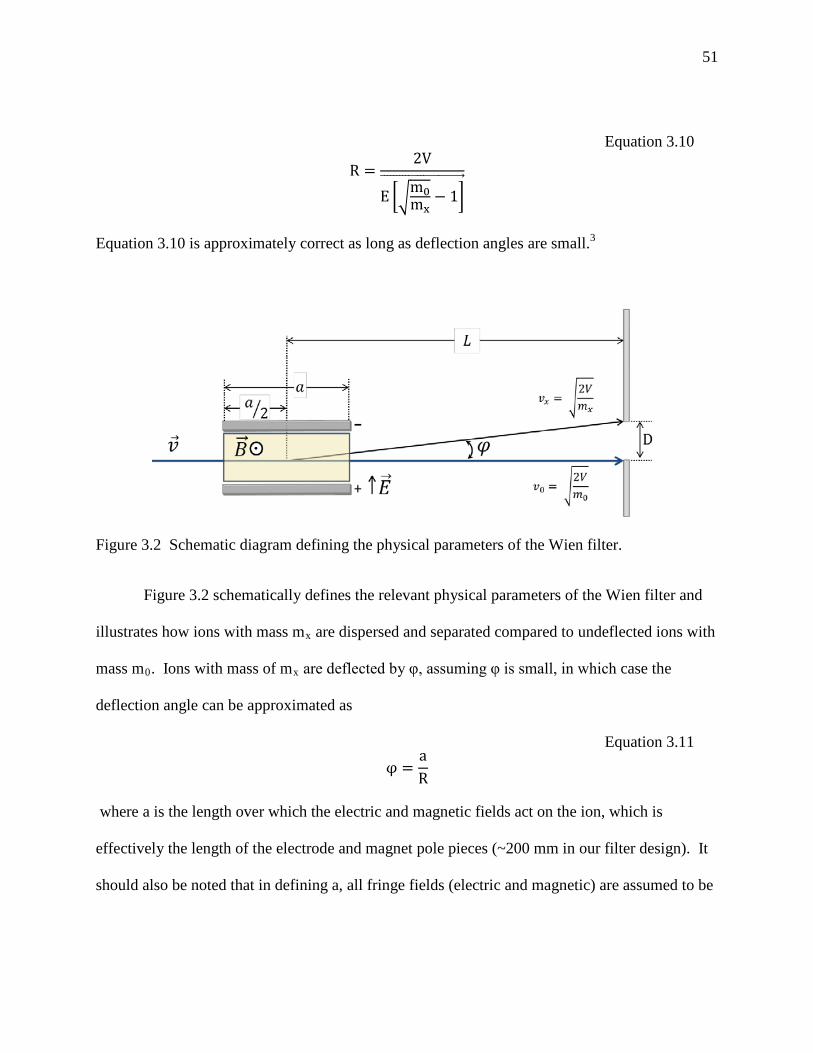
51
Equation 3.10
R =2V
E ��m0mx
− 1���������������������������⃗
Equation 3.10 is approximately correct as long as deflection angles are small.3
Figure 3.2 schematically defines the relevant physical parameters of the Wien filter and
illustrates how ions with mass mx are dispersed and separated compared to undeflected ions with
mass m0. Ions with mass of mx are deflected by φ, assuming φ is small, in which case the
deflection angle can be approximated as
Equation 3.11 φ =
aR
where a is the length over which the electric and magnetic fields act on the ion, which is
effectively the length of the electrode and magnet pole pieces (~200 mm in our filter design). It
should also be noted that in defining a, all fringe fields (electric and magnetic) are assumed to be
Figure 3.2 Schematic diagram defining the physical parameters of the Wien filter.

52
negligible. Equation 3.11 can be rewritten by inserting the expression for R determined in
Equation 3.10 to obtain
Equation 3.12
φ =aeE2V
��m0
mx− 1�
Finally, we can relate the dispersion angle (φ) to the separating power of the Wien filter by
considering the distance the ions travel before encountering an aperture with diameter D
Equation 3.13
D = Lφ =aLeE
2V��
m0
mx− 1�
where L in our apparatus is the distance from the center of the Wien filter to aperture D. We can
further simplify Equation 3.12 to obtain
Equation 3.14
D ≅aLeE��⃗
4V∆mm0
which can be rearranged to obtain an expression for the mass resolution of the mass filter,
m0/∆m
Equation 3.15 m0
∆m≅
aLE��⃗4DV
We can then calculate the theoretical limit for the mass resolution of our Wien filter, as all the
values in Equation 3.15 are known. With a = 200 mm, L = 500 mm, E = 130 V cm-1, D = 2 mm,
and V = 735 V, the calculated resolution is then ~ 220. The values of E can be linearly scaled to
higher field strengths, which will in principle increase the mass resolution.
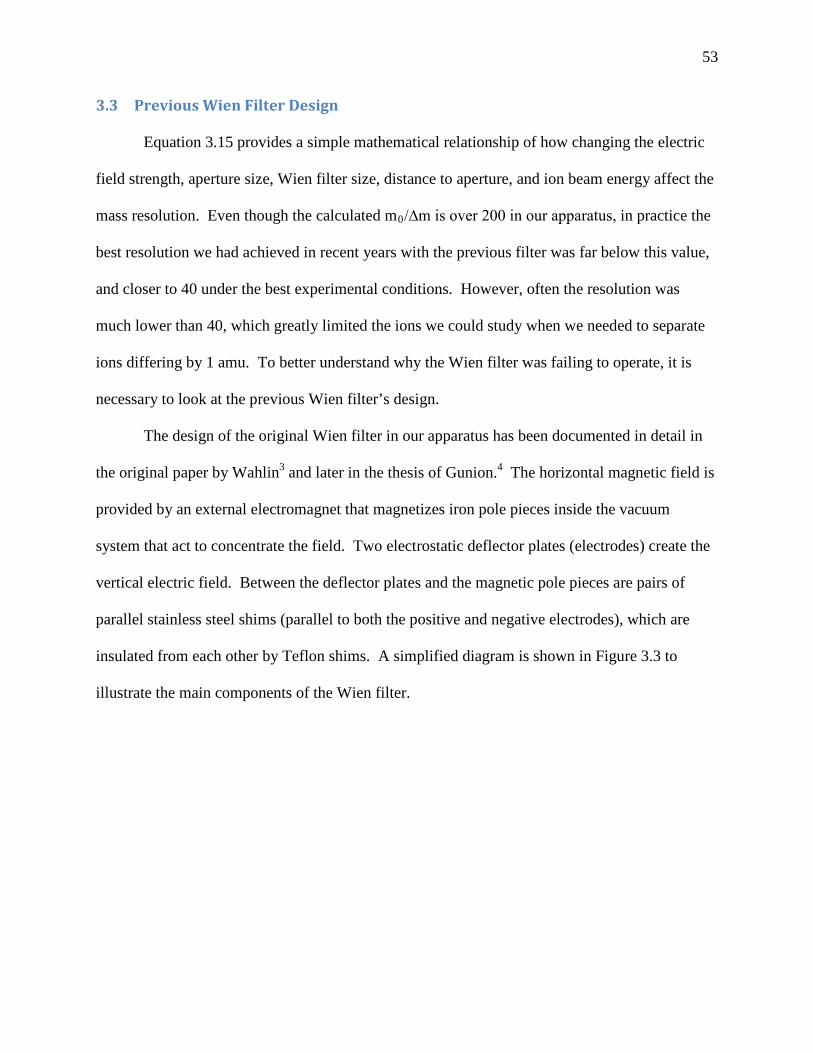
53
3.3 Previous Wien Filter Design
Equation 3.15 provides a simple mathematical relationship of how changing the electric
field strength, aperture size, Wien filter size, distance to aperture, and ion beam energy affect the
mass resolution. Even though the calculated m0/∆m is over 200 in our apparatus, in practice the
best resolution we had achieved in recent years with the previous filter was far below this value,
and closer to 40 under the best experimental conditions. However, often the resolution was
much lower than 40, which greatly limited the ions we could study when we needed to separate
ions differing by 1 amu. To better understand why the Wien filter was failing to operate, it is
necessary to look at the previous Wien filter’s design.
The design of the original Wien filter in our apparatus has been documented in detail in
the original paper by Wahlin3 and later in the thesis of Gunion.4 The horizontal magnetic field is
provided by an external electromagnet that magnetizes iron pole pieces inside the vacuum
system that act to concentrate the field. Two electrostatic deflector plates (electrodes) create the
vertical electric field. Between the deflector plates and the magnetic pole pieces are pairs of
parallel stainless steel shims (parallel to both the positive and negative electrodes), which are
insulated from each other by Teflon shims. A simplified diagram is shown in Figure 3.3 to
illustrate the main components of the Wien filter.
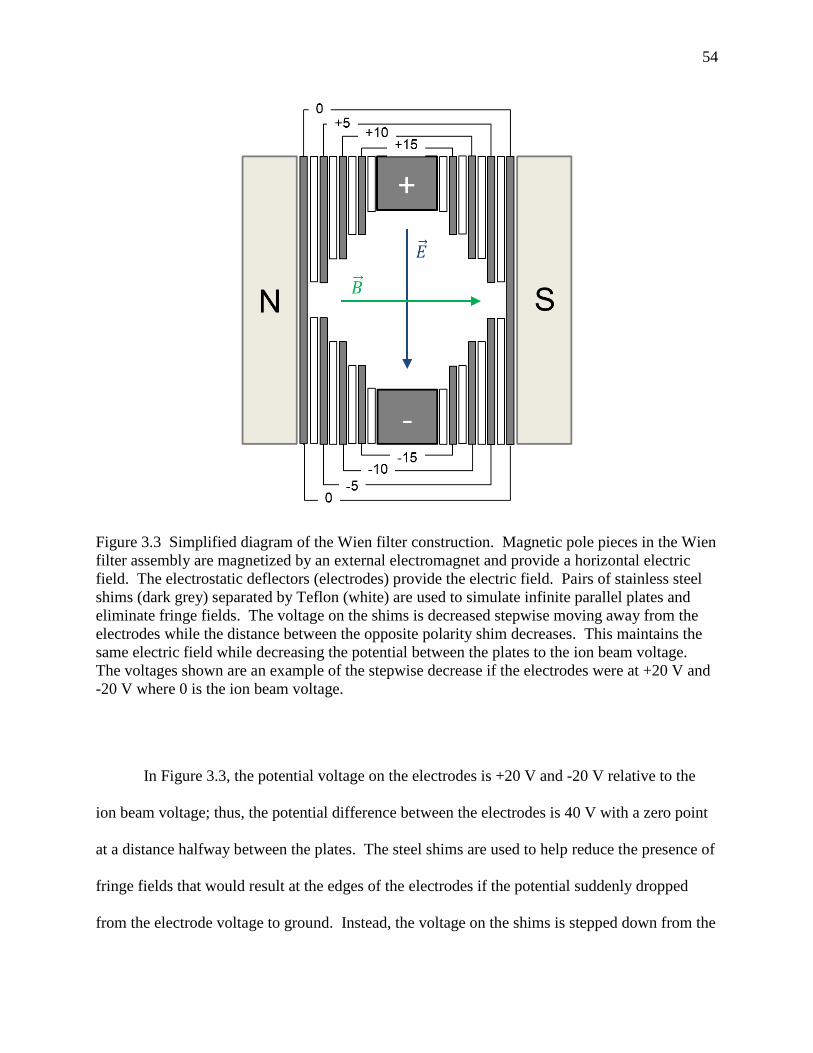
54
In Figure 3.3, the potential voltage on the electrodes is +20 V and -20 V relative to the
ion beam voltage; thus, the potential difference between the electrodes is 40 V with a zero point
at a distance halfway between the plates. The steel shims are used to help reduce the presence of
fringe fields that would result at the edges of the electrodes if the potential suddenly dropped
from the electrode voltage to ground. Instead, the voltage on the shims is stepped down from the
Figure 3.3 Simplified diagram of the Wien filter construction. Magnetic pole pieces in the Wien filter assembly are magnetized by an external electromagnet and provide a horizontal electric field. The electrostatic deflectors (electrodes) provide the electric field. Pairs of stainless steel shims (dark grey) separated by Teflon (white) are used to simulate infinite parallel plates and eliminate fringe fields. The voltage on the shims is decreased stepwise moving away from the electrodes while the distance between the opposite polarity shim decreases. This maintains the same electric field while decreasing the potential between the plates to the ion beam voltage. The voltages shown are an example of the stepwise decrease if the electrodes were at +20 V and -20 V where 0 is the ion beam voltage.
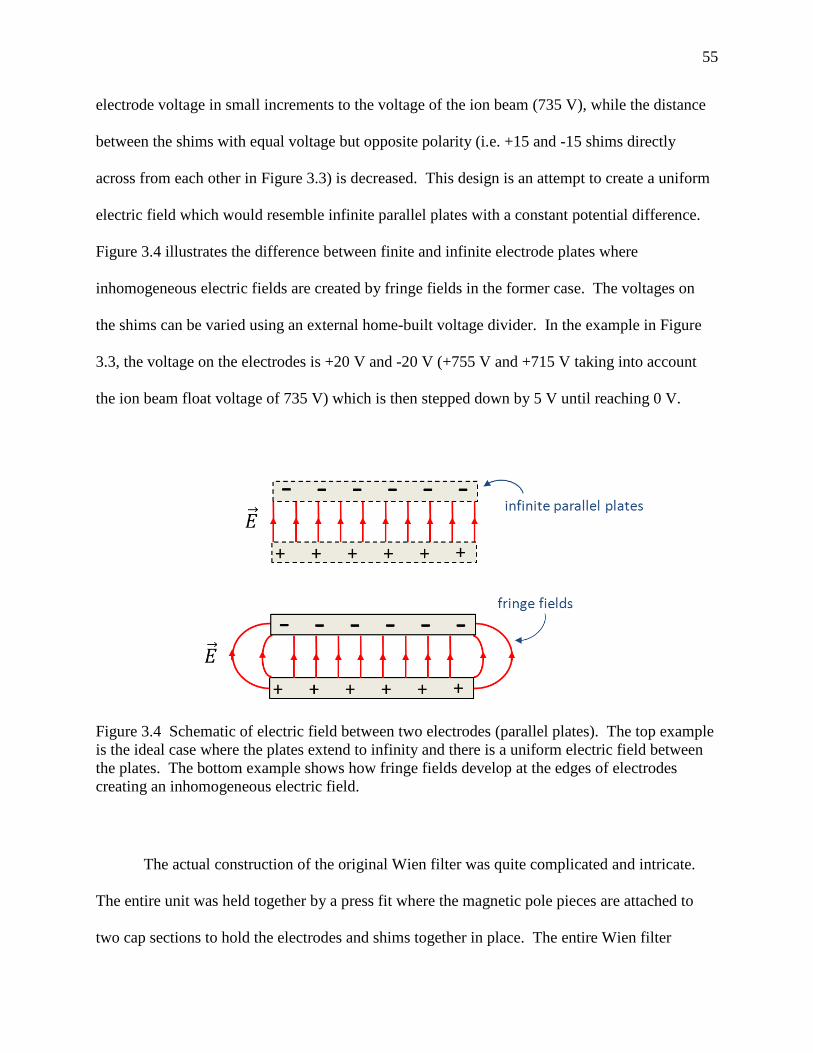
55
electrode voltage in small increments to the voltage of the ion beam (735 V), while the distance
between the shims with equal voltage but opposite polarity (i.e. +15 and -15 shims directly
across from each other in Figure 3.3) is decreased. This design is an attempt to create a uniform
electric field which would resemble infinite parallel plates with a constant potential difference.
Figure 3.4 illustrates the difference between finite and infinite electrode plates where
inhomogeneous electric fields are created by fringe fields in the former case. The voltages on
the shims can be varied using an external home-built voltage divider. In the example in Figure
3.3, the voltage on the electrodes is +20 V and -20 V (+755 V and +715 V taking into account
the ion beam float voltage of 735 V) which is then stepped down by 5 V until reaching 0 V.
The actual construction of the original Wien filter was quite complicated and intricate.
The entire unit was held together by a press fit where the magnetic pole pieces are attached to
two cap sections to hold the electrodes and shims together in place. The entire Wien filter
Figure 3.4 Schematic of electric field between two electrodes (parallel plates). The top example is the ideal case where the plates extend to infinity and there is a uniform electric field between the plates. The bottom example shows how fringe fields develop at the edges of electrodes creating an inhomogeneous electric field.

56
assembly, including Q2 and Q3, fit inside a long rectangular housing with very tight tolerances.
This has led to severe galling in the past where there is metal-metal contact between the housing
and the Wien filter if great care was not taken when servicing the filter. The voltage to each of
the pairs of shims (both positive and negative), as well as the electrodes, was made using spot-
welded thin wires insulated with delicate ceramic tubing. Therefore, disassembling the Wien
filter and accessing the shims was very tedious and time–consuming.
It is critical that all components of the Wien filter stay electrically isolated from one
another in order for proper operation. However, over the course of servicing the Wien filter and
several repairs over the years, nearly half of the shims were shorted creating inhomogeneous
fields inside the filter. All efforts to isolate the shims failed and we were left with the decision to
either undertake a major rebuild of the filter to isolate the shims, or devise a new way to
eliminate fringe fields. We decided to completely redesign the Wien filter and eliminate the steel
shims, while keeping the physical dimensions of the filter the same.
3.4 New Wien Filter Design
The new Wien filter employs the same crossed electric and magnetic fields to separate
the ion beam, but has significant changes intended to make the electric field more uniform and
increase the ease of service of the Wien filter. The distinguishing difference between the two
filters is changing the stepped electric field associated with the shim plates to, essentially on with
an infinite number of shim plates. This is accomplished by replacing the steel shims with two
silicon coated pieces of glass that separate the magnetic pole pieces and the electrodes, shown
schematically in Figure 3.5. These coated glass plates are electrically connected to the two
electrodes, but have a very high sheet resistance so only a small current (approximately 100 μA)
is drawn. This provides a uniform potential gradient across the plate which, in conjunction with

57
the electrodes, provides a uniform electric field inside the Wien filter. The new filter also uses
non-metallic material in its design (see Figure 3.6), which act to prevent galling between the
Wien filter casing and the chamber housing. Additionally, new isolated apertures have been
added to monitor and measure ion current before and after the Wien filter. These design changes
result in a mass filter that is simpler, with fewer connections and components, which has
dramatically improved performance over the previous design.
In the deciding how to redesign the Wien filter, we looked at other methods for creating
homogenous fields inside the ion flight path. Steel shims have been used to reduce fringe fields
since the Wien filter was invented, though other designs have been suggested.3, 5-8 The idea of
using a material with high sheet resistivity that conducts a small electrical current is not new,8
Figure 3.5 Schematic illustrating the difference of the new (left) and previous (right) Wien filter. The new Wien filter employs larger electrodes which are directly connected to silicon coated glass which acts as a high–resistance conductor creating a potential gradient between two electrodes. The curved arrows through the glass indicate the current flow through the silicon film on the glass.
New Original
58
but its implementation has presented technical challenges which made construction difficult.
The desired material or coating needs to have a high sheet resistance** (≥ 10 MΩ/sq) that is
extremely uniform over the entire surface and is compatible with a high vacuum environment.
There are very few conductive materials that have a sheet resistance this large that can withstand
our experimental conditions. Initially, a coating of indium tin oxide (ITO) was deposited on
glass plates using electron beam physical vapor deposition in the JILA special techniques
laboratory. However, in order to achieve the proper resistivity, the coating thickness was too
thin and easily scratched off. The material that best met our requirements was silicon deposited
on glass using the same technique. Close attention was paid to ensure the thin film of silicon
was uniform since the thickness of the film directly correlates to the local resistance. If the
resistance varied over the coating, the potential gradient would also vary causing inhomogeneous
fields in the filter.
We characterized the coatings using two spectroscopic techniques: UV-Visible spectra to
investigate uniformity of the coatings, and ellipsometry to determine the approximate thickness
of the film. The silicon coatings were thin enough that we could use a UV-Visible spectrometer
to make transmission measurements on specific regions of the coated glass and observe how the
absorption varied across the plates. A mask was used to limit the region of the slide that was
probed to a 2 mm by 3 mm rectangle. If there was a large difference in thickness of the silicon
film, it would be reflected in the UV-Visible spectra as an increase or decrease in the percent
transmission. Spectra for a particular slide(s) in a single deposition run varied by less than 5%,
which is consistent with a uniform coating. However, the spectra did vary for slides coated in
different batches, which is to be expected. Therefore, the slides that were used in the Wien filter ** The sheet resistance (RS) is a measure of the resistance across a thin film of uniform thickness and is analogous to resistivity used in three-dimensional systems. To calculate RS, bulk resistance is multiplied by ratio of the dimensions of the film area: 𝑅𝑠 = (𝑊 𝐿)⁄ 𝑅. Sheet resistance has the units of Ω/sq.

59
were deposited at the same time under identical conditions. The ellipsometry measurements
were also made over several localized regions of the final coated plates. The results and
corresponding fits indicated that there was a uniform coating of approximately 400 nm of silicon.
In order to make a robust connection between the silicon coated glass and the electrodes, two
half-inch strips of gold were deposited (using the same deposition method as described above for
the silicon) on top of the silicon coating where the two electrodes made contact with the glass.
Figure 3.6 Schematic of the new Wien filter assembly. A cross section in shown in (a) highlighting the electrodes and the silicon coated glass. The entire assembled filter is shown in (b). The two faceplates at the entrance and exit of the Wien filter are optional and can be easily removed. Four identical faceplates with varying apertures (4, 5, 6, 7 mm) were made in to allow for adjustments and optimization of the Wien filter’s performance
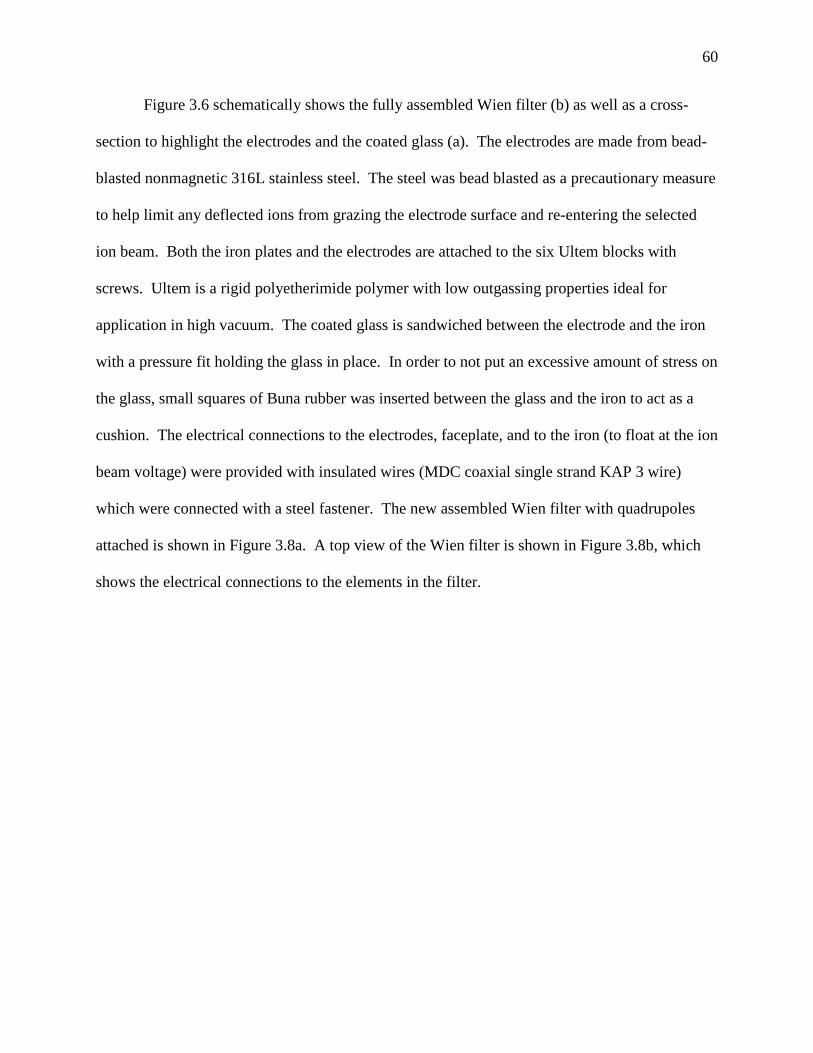
60
Figure 3.6 schematically shows the fully assembled Wien filter (b) as well as a cross-
section to highlight the electrodes and the coated glass (a). The electrodes are made from bead-
blasted nonmagnetic 316L stainless steel. The steel was bead blasted as a precautionary measure
to help limit any deflected ions from grazing the electrode surface and re-entering the selected
ion beam. Both the iron plates and the electrodes are attached to the six Ultem blocks with
screws. Ultem is a rigid polyetherimide polymer with low outgassing properties ideal for
application in high vacuum. The coated glass is sandwiched between the electrode and the iron
with a pressure fit holding the glass in place. In order to not put an excessive amount of stress on
the glass, small squares of Buna rubber was inserted between the glass and the iron to act as a
cushion. The electrical connections to the electrodes, faceplate, and to the iron (to float at the ion
beam voltage) were provided with insulated wires (MDC coaxial single strand KAP 3 wire)
which were connected with a steel fastener. The new assembled Wien filter with quadrupoles
attached is shown in Figure 3.8a. A top view of the Wien filter is shown in Figure 3.8b, which
shows the electrical connections to the elements in the filter.

61
The new Wien filter also has two isolated steel faceplates at the entrance and exit of the
filter. These plates serve several important functions and are shown in more detail in Figure 3.7.
First, the plates allow us to measure the ion current entering and exiting the Wien filter which is
very useful in determining how the filter is functioning. Second, the aligned apertures also help
ensure the ions enter and exit the filter on center. Lastly, the entrance faceplate acts to shield the
ion beam from the edges of the glass plates, which is not at the beam voltage.
Figure 3.7 Schematic looking down the ion beam path of the Wien filter, shown with (a) and without (b) the faceplates. Besides being an aperture plate to measure the incoming and exiting ion current, the faceplate also acts to shield the ion beam from the edges of the glass plates.

62
3.5 Performance of New Wien Filter
The major goal of this project was to design a new Wien filter that was simpler, easier to
service, more reliable, and more versatile than the previous design. However, improving the
mass resolution is much more difficult as we limited our project to the physical constraints of the
old filter; we decided to not change the length of the filter (a) or the distance from the exit of the
filter (L) to the separation aperture (D). Then, from Equation 3.15, the only variables left in our
control are the magnitude of the electric and magnetic fields and the size of D. If we reduce the
aperture size of D, we would also reduce the total ion current that reaches the interaction region.
For the experiments in this thesis, reducing the ion current significantly would have made
experiments much more difficult, so the aperture size was left at 2 mm. Therefore, only
increasing the strength of the electric and magnetic fields is used to improve the resolving power
Figure 3.8 Photographs of the Wien filter assembly with quadrupoles Q2 and Q3 (a), and a top view of just Wien filter with electrical connections (b).
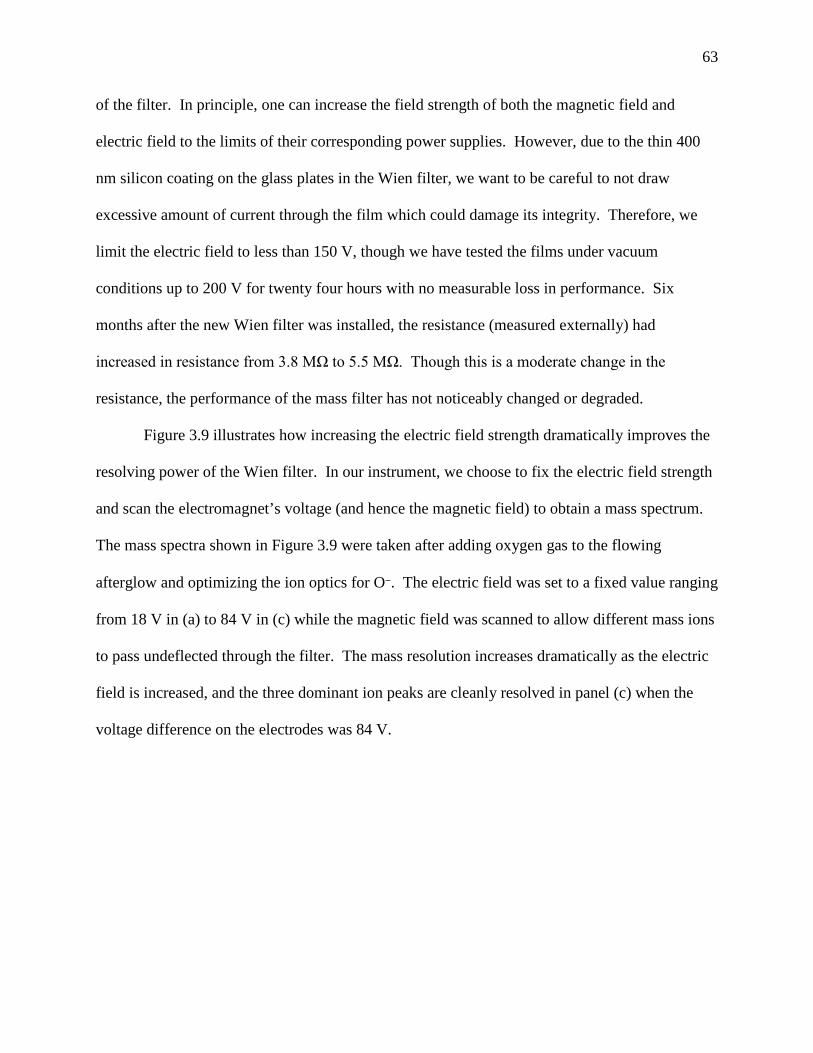
63
of the filter. In principle, one can increase the field strength of both the magnetic field and
electric field to the limits of their corresponding power supplies. However, due to the thin 400
nm silicon coating on the glass plates in the Wien filter, we want to be careful to not draw
excessive amount of current through the film which could damage its integrity. Therefore, we
limit the electric field to less than 150 V, though we have tested the films under vacuum
conditions up to 200 V for twenty four hours with no measurable loss in performance. Six
months after the new Wien filter was installed, the resistance (measured externally) had
increased in resistance from 3.8 MΩ to 5.5 MΩ. Though this is a moderate change in the
resistance, the performance of the mass filter has not noticeably changed or degraded.
Figure 3.9 illustrates how increasing the electric field strength dramatically improves the
resolving power of the Wien filter. In our instrument, we choose to fix the electric field strength
and scan the electromagnet’s voltage (and hence the magnetic field) to obtain a mass spectrum.
The mass spectra shown in Figure 3.9 were taken after adding oxygen gas to the flowing
afterglow and optimizing the ion optics for O‒. The electric field was set to a fixed value ranging
from 18 V in (a) to 84 V in (c) while the magnetic field was scanned to allow different mass ions
to pass undeflected through the filter. The mass resolution increases dramatically as the electric
field is increased, and the three dominant ion peaks are cleanly resolved in panel (c) when the
voltage difference on the electrodes was 84 V.
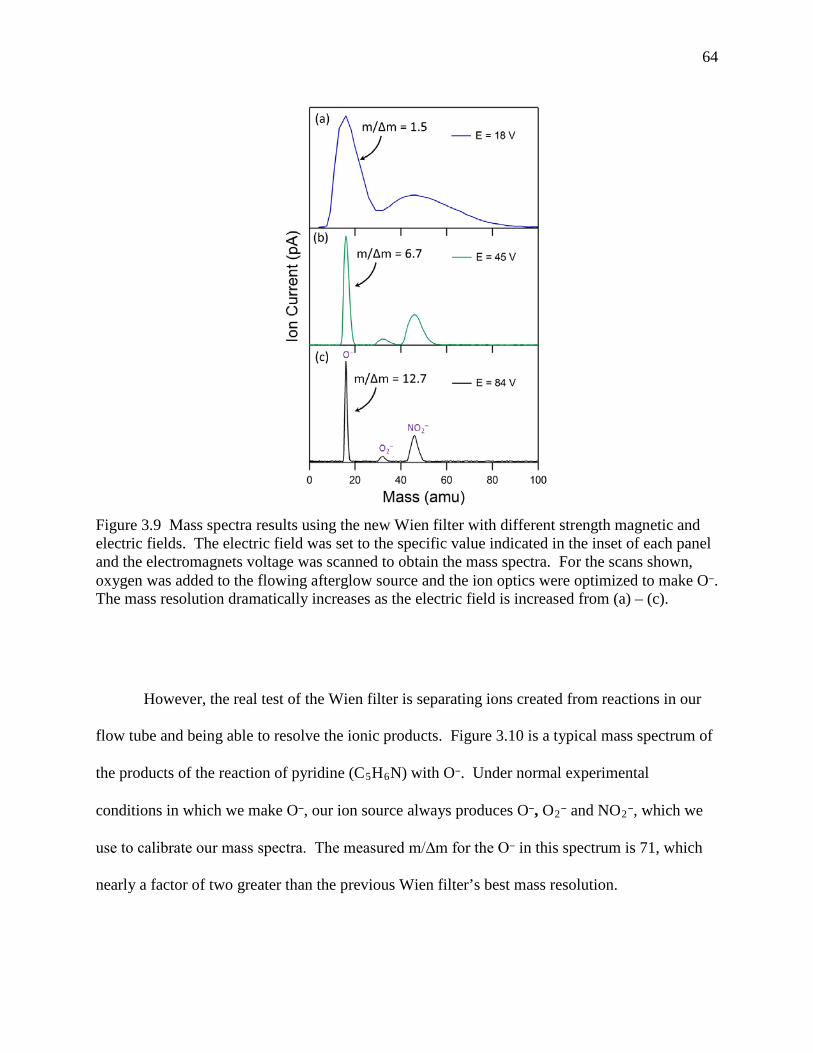
64
However, the real test of the Wien filter is separating ions created from reactions in our
flow tube and being able to resolve the ionic products. Figure 3.10 is a typical mass spectrum of
the products of the reaction of pyridine (C5H6N) with O‒. Under normal experimental
conditions in which we make O‒, our ion source always produces O‒, O2‒ and NO2‒, which we
use to calibrate our mass spectra. The measured m/∆m for the O‒ in this spectrum is 71, which
nearly a factor of two greater than the previous Wien filter’s best mass resolution.
Figure 3.9 Mass spectra results using the new Wien filter with different strength magnetic and electric fields. The electric field was set to the specific value indicated in the inset of each panel and the electromagnets voltage was scanned to obtain the mass spectra. For the scans shown, oxygen was added to the flowing afterglow source and the ion optics were optimized to make O‒. The mass resolution dramatically increases as the electric field is increased from (a) – (c).
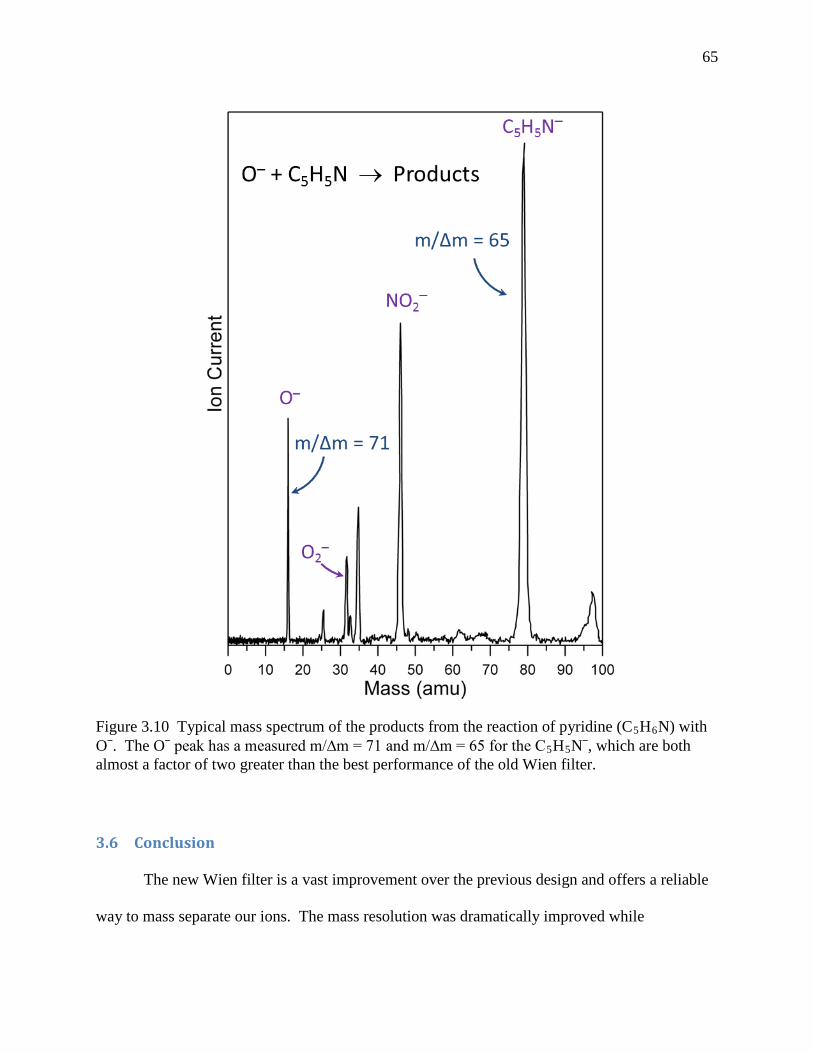
65
3.6 Conclusion
The new Wien filter is a vast improvement over the previous design and offers a reliable
way to mass separate our ions. The mass resolution was dramatically improved while
Figure 3.10 Typical mass spectrum of the products from the reaction of pyridine (C5H6N) with O‒. The O‒ peak has a measured m/∆m = 71 and m/∆m = 65 for the C5H5N‒, which are both almost a factor of two greater than the best performance of the old Wien filter.
66
maintaining the same high throughput of selected ions. The entire Wien filter assembly
(including Q2 and Q3) is much easier to service with electrical connections are much less prone
to shorting. However, one of the most important improvements with the new filter is the ability
to measure the ion current on the two faceplates when troubleshooting poor ion beams. Before
these faceplates were added, we were limited to measuring the ion current on three permanent
measurement plates over the nearly ten feet which our ion beam travels. These two additional
plates have greatly improved our ability to align our ion beam through the Wien filter and
optimize the focusing and trajectory of the undeflected ion beam as it travels to the interaction
region.
Lastly, we have found that the Wien filter’s mass resolution changes dramatically with
ion focusing and position. For a given electric and magnetic field setting, the mass resolution
can change by 20–30% simply by adjusting the ion optics prior to the Wien filter. Therefore,
when the best mass resolution is required, great care must be taken to optimize and maintain the
ion beam position and spatial focusing during the course of an experiment.
67
3.7 References
1. Moore, J.H., C.C. Davis, and M.A. Coplan, Building Scientific Apparatus. Third ed 2003, Boulder: Westview Press. 654.
2. Johnson, M.A. and W.C. Lineberger, Pulsed Methods for Cluster Ion Spectroscopy, in Techniques for the Study of Ion-Molecule Reactions, J.M. Farrar and J. W. H. Saunders, Editors. 1988, Wiley: New York. p. 591-635.
3. Wahlin, L., The Colutron, a zero deflection isotope separator. Nuclear Instruments & Methods, 1964. 27(1): p. 55-60.
4. Gunion, R.F., Ultraviolet Photoelectron Spectroscopy of Molecular Anions, in Department of Chemistry1995, Boulder: Boulder. p. 275.
5. Seliger, R.L., E X B mass-separator design. Journal of Applied Physics, 1972. 43(5): p. 2352.
6. Jensen, K. and E. Veje, Construction of a Wien filter heavy-ion accelerator. Nuclear Instruments & Methods, 1974. 122(3): p. 511-515.
7. Aberth, W., High mass analysis capability of a Wien spectrometer. International Journal of Mass Spectrometry and Ion Processes, 1986. 68(1-2): p. 209-212.
8. Parker, N.W., Wien Filter Design, 1988, MicroBeam Inc.
68
4 Photoelectron Spectroscopy of Anilinide: C6H5NH‒
4.1 Introduction
Phenyl-substituted anions and radicals have been of considerable interest for the past
thirty years. Aromatic amines are particularly important due to their presence in many biological
molecules. Two of the simplest aromatic amines are anilinide (C6H5NH–) and the related
anilino radical (C6H5NH), which has had surprisingly sparse theoretical or experimental
investigations. Bartmess used a pulsed ion cyclotron resonance spectrometer to record the first
electron affinity determination of the anilino radical of 1.61(13) eV in 1979.1 Five years later,
Brauman refined this measurement to 1.704(30) eV using photodetachment threshold
spectroscopy.2 A time resolved resonance Raman study was performed just two years later to
measure, for the first time, several vibrational frequencies of the anilino radical.3 More recently,
Ashfold and coworkers used photofragment translational spectroscopy to measure the N–H bond
dissociation energy of aniline, BDE(N–H ) = 90.44 kcal/mol-1, forming the anilino radical as a
product.
As mentioned in Chapter 1, the intensities of peaks in a photoelectron spectrum (or
equivalently the intensities of transitions to the neutral vibrational levels) is governed by the
Franck-Condon overlap between the ground vibrational wavefunction of the anion with the
wavefunctions of the various vibrational levels of the neutral. If the geometries of the anion and
neutral are similar, the best Franck-Condon overlap occurs between the ground vibrational
wavefunction of the anion and the ground vibrational wavefunction of the neutral.

69
In this case, the most prominent peak in the photoelectron spectrum will correspond to the
transition between the ground vibrational states of the anion and the neutral. This feature is
designated as the origin, from which the adiabatic electron affinity can be readily determined.
Furthermore, the width of the photoelectron spectral envelope is minimal in the case of a small
geometry change; the Franck-Condon region of the spectrum is confined to an area near the
potential minimum of the neutral molecule, where vibrational modes can be well-approximated
as harmonic and uncoupled.4
Experimentally, there are no previously measured bond angles or lengths known for
anilinide or the anilino radical. However, a recent theoretical report investigated the structure,
electron affinity, and harmonic frequencies for series of substituted phenyl anions and radicals
using a range of density functional methods.5 This study found that both the 1A' ground state of
anilinide and 2A" ground state of the anilno radical have Cs symmetry. More importantly, their
results indicated that there was no significant differences in the geometry of the neutral after an
electron had been removed from the anion. Therefore, we would expect that the photoelectron
spectrum would have narrow vibrational envelope with a prominent origin peak.
In this chapter, we present the first photoelectron spectrum of anilinide and report the
most accurate electron affinity for the anilino radical to date. The measured spectrum is
surprisingly simple for a molecule containing 13 atoms, with a clear origin peak and only one
dominant vibrational progression. Anilinide represents a model system where small geometry
changes between the anion and the neutral result in a simple photoelectron spectra that are
straightforward to understand and analyze. Furthermore, the anilino radical is also isoelectronic
benzyl (C6H5CH2) and phenoxyl (C6H5O) radicals, which have been previously studied with
photoelectron spectroscopy.6 The three photoelectron spectra have almost identical vibrational

70
structure but very different electron affinities. We compare the series of phenyl-substituted
anions and radicals to understand how the different substituent on the benzene ring affects the
structure and thermochemistry of three related molecules.
4.2 Experimental Method
Anilinide (C6H5NH–) is generated using the flowing afterglow ion source described in
Chapter 2. Methane is added downstream of O‒ where H-atom abstraction from methane forms
hydroxide (HO‒), which is thermalized and subsequently reacts with aniline: ≥98.5%, Sigma-
Aldrich) to generate anilinide anions via proton abstraction. Spectra was recorded with both ions
at room temperature (~ 300 K) and cooled with a liquid nitrogen (~ 200 K). The mass resolution
of the new Wien velocity filter for these experiments was m/Δm ~ 60. Typical anilinide ion
beam currents were ~ 100 pA. The ~1 W output from a single-mode continuous-wave argon ion
laser operating at 364 nm (3.40814 eV) is built up to approximately 100 W of circulating power
using a high Q resonant cavity in the interaction region. The energy resolution of the
hemispherical analyzer is approximately 11 meV under the experimental conditions used here.
Electronic structure calculations were performed with the Gaussian 03 software package.7
Geometry optimization and frequency calculations were carried out using density functional
theory (DFT) method with Becke’s hybrid three-parameter functional8 and the correlation
functional of Lee et al.9 (B3LYP) and with an augmented correlation-consistent polarized
double-zeta basis set (aug-cc-pVDZ).10, 11 The geometry of both the anilinide anion and anilino
radical where constrained to Cs symmetry. No scaling factor is applied to the calculated
vibrational frequencies.
The Franck-Condon profiles of the photoelectron spectra are simulated using the
PESCAL program.12 The simulations employ the calculated theoretical geometries, normal
71
mode vectors, and vibrational frequencies of the anion and neutral states. The Franck-Condon
factors are computed in the harmonic oscillator approximation including Duschinsky rotation
using the Sharp-Rosenstock-Chen method.13 The individual vibronic peak contours are
simulated by a Gaussian function with a FWHM of 11 meV, consistent with instrumental
resolution.
4.3 Results and Discussion
The photoelectron spectrum of anilinide, shown in Figure 4.1a, consists of a very simple
and regular vibrational progression. The most prominent peak in the spectrum, peak B in Figure
4.1a, is the origin corresponds to an electron affinity (EA) of 1.607(4) eV. The positions and
assignments of all the peaks in the anilinide spectrum are given in Table 4.1. There is a very
regular peak spacing of approximately 525 cm-1 between peaks B–F, which appear to arise from
a single vibrational progression. All calculated vibrational modes, along with a qualitative
description of the atomic motion and available experimental measurements, are listed in Table
4.2. The measured frequency of the vibrational progression agrees well with the calculated
frequency of the ν22 mode of the anilino radical: 531 cm-1. Based on the excellent agreement
between the simulated spectrum in Figure 1b with the experimental data, peaks B–F are
predominately due to the 220𝑛 transition. It is a little surprising that there is only one dominant
active vibrational mode as the anilino radical has 33 vibrational modes, of which 23 are totally
symmetric A' modes. However, as will be shown below, the photoelectron spectrum of related
substituted phenyl anions have very similar simple vibrational progressions dominated by only
one or two vibrational modes.
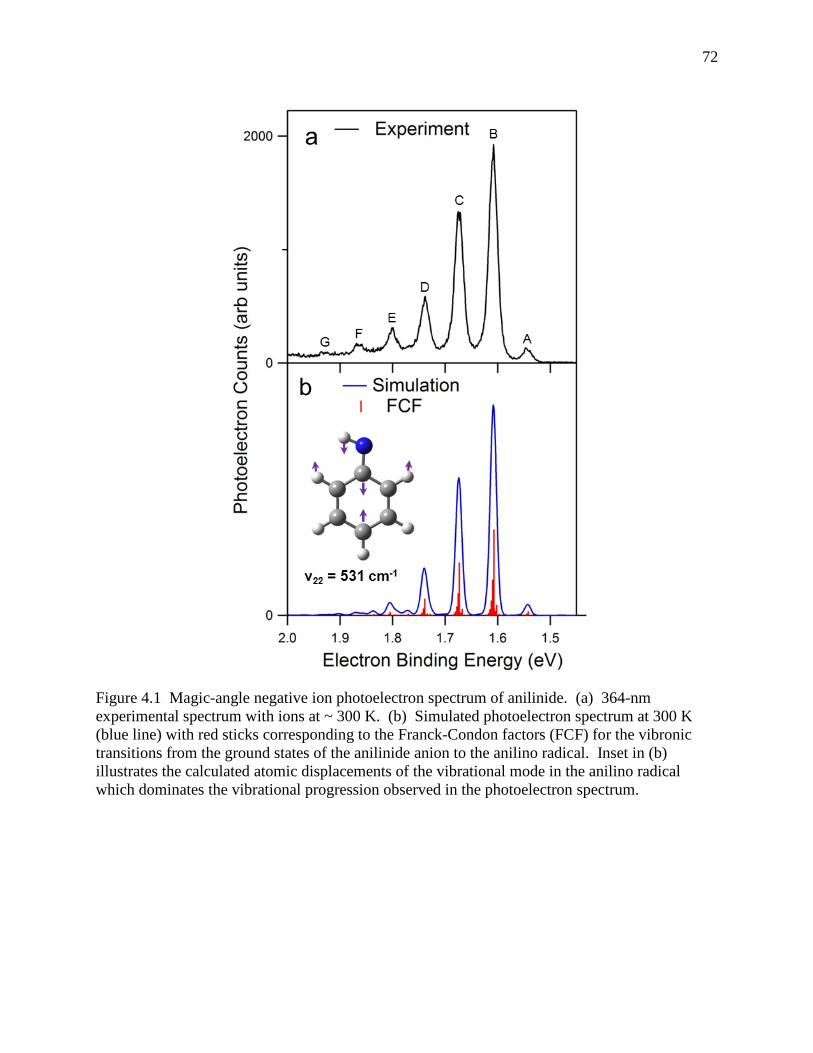
72
Figure 4.1 Magic-angle negative ion photoelectron spectrum of anilinide. (a) 364-nm experimental spectrum with ions at ~ 300 K. (b) Simulated photoelectron spectrum at 300 K (blue line) with red sticks corresponding to the Franck-Condon factors (FCF) for the vibronic transitions from the ground states of the anilinide anion to the anilino radical. Inset in (b) illustrates the calculated atomic displacements of the vibrational mode in the anilino radical which dominates the vibrational progression observed in the photoelectron spectrum.
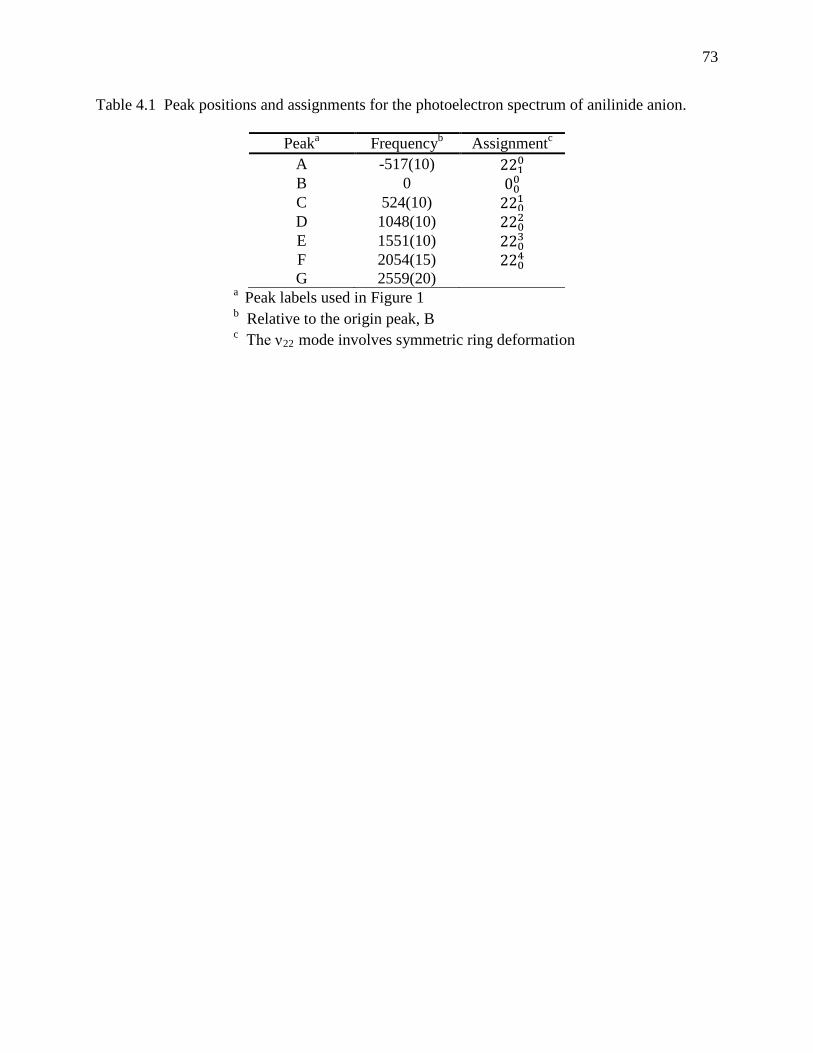
73
Table 4.1 Peak positions and assignments for the photoelectron spectrum of anilinide anion.
Peaka Frequencyb Assignmentc A -517(10) 2210 B 0 000 C 524(10) 2201 D 1048(10) 2202 E 1551(10) 2203 F 2054(15) 2204 G 2559(20)
a Peak labels used in Figure 1 b Relative to the origin peak, B c The ν22 mode involves symmetric ring deformation
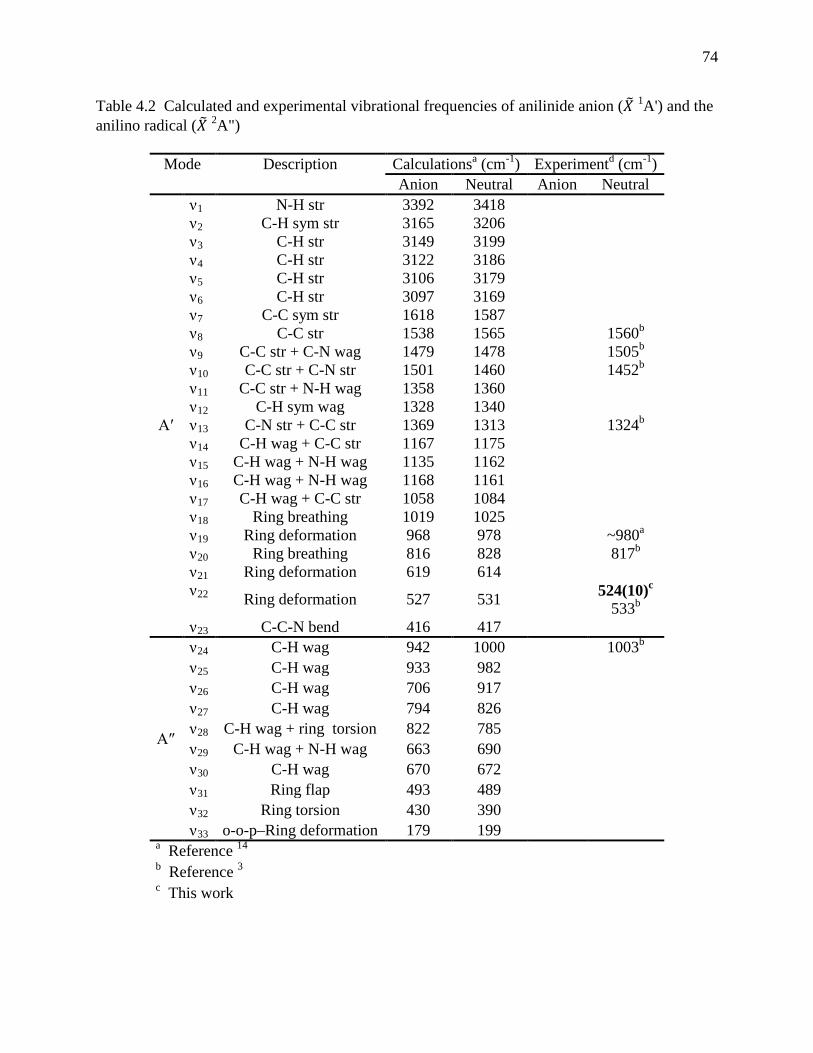
74
Table 4.2 Calculated and experimental vibrational frequencies of anilinide anion (𝑋� 1A') and the anilino radical (𝑋� 2A")
Mode Description Calculationsa (cm-1) Experimentd (cm-1) Anion Neutral Anion Neutral
A′
ν1 N-H str 3392 3418 ν2 C-H sym str 3165 3206 ν3 C-H str 3149 3199 ν4 C-H str 3122 3186 ν5 C-H str 3106 3179 ν6 C-H str 3097 3169 ν7 C-C sym str 1618 1587 ν8 C-C str 1538 1565 1560b ν9 C-C str + C-N wag 1479 1478 1505b ν10 C-C str + C-N str 1501 1460 1452b ν11 C-C str + N-H wag 1358 1360 ν12 C-H sym wag 1328 1340 ν13 C-N str + C-C str 1369 1313 1324b ν14 C-H wag + C-C str 1167 1175 ν15 C-H wag + N-H wag 1135 1162 ν16 C-H wag + N-H wag 1168 1161
ν17 C-H wag + C-C str 1058 1084 ν18 Ring breathing 1019 1025 ν19 Ring deformation 968 978 ~980a ν20 Ring breathing 816 828 817b ν21 Ring deformation 619 614 ν22 Ring deformation 527 531 524(10)c
533b ν23 C-C-N bend 416 417
A″
ν24 C-H wag 942 1000 1003b ν25 C-H wag 933 982 ν26 C-H wag 706 917 ν27 C-H wag 794 826 ν28 C-H wag + ring torsion 822 785 ν29 C-H wag + N-H wag 663 690 ν30 C-H wag 670 672 ν31 Ring flap 493 489 ν32 Ring torsion 430 390 ν33 o-o-p–Ring deformation 179 199
a Reference 14 b Reference 3 c This work
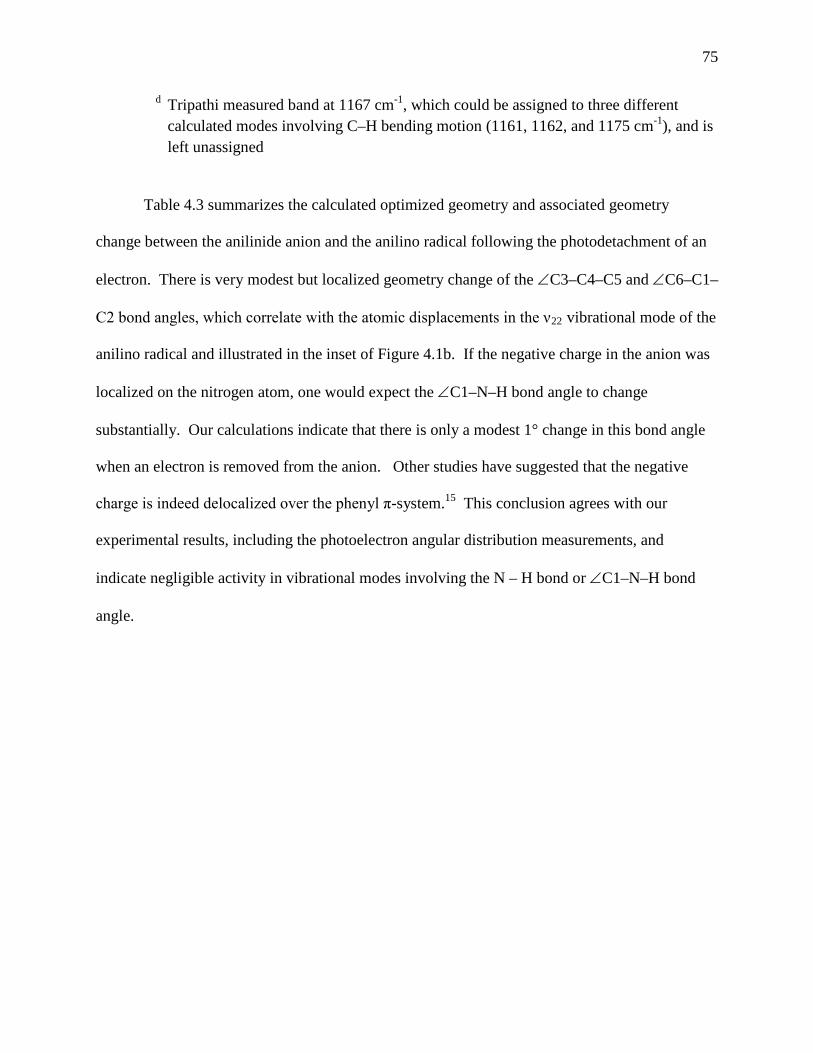
75
d Tripathi measured band at 1167 cm-1, which could be assigned to three different calculated modes involving C–H bending motion (1161, 1162, and 1175 cm-1), and is left unassigned
Table 4.3 summarizes the calculated optimized geometry and associated geometry
change between the anilinide anion and the anilino radical following the photodetachment of an
electron. There is very modest but localized geometry change of the ∠C3–C4–C5 and ∠C6–C1–
C2 bond angles, which correlate with the atomic displacements in the ν22 vibrational mode of the
anilino radical and illustrated in the inset of Figure 4.1b. If the negative charge in the anion was
localized on the nitrogen atom, one would expect the ∠C1–N–H bond angle to change
substantially. Our calculations indicate that there is only a modest 1° change in this bond angle
when an electron is removed from the anion. Other studies have suggested that the negative
charge is indeed delocalized over the phenyl π-system.15 This conclusion agrees with our
experimental results, including the photoelectron angular distribution measurements, and
indicate negligible activity in vibrational modes involving the N – H bond or ∠C1–N–H bond
angle.
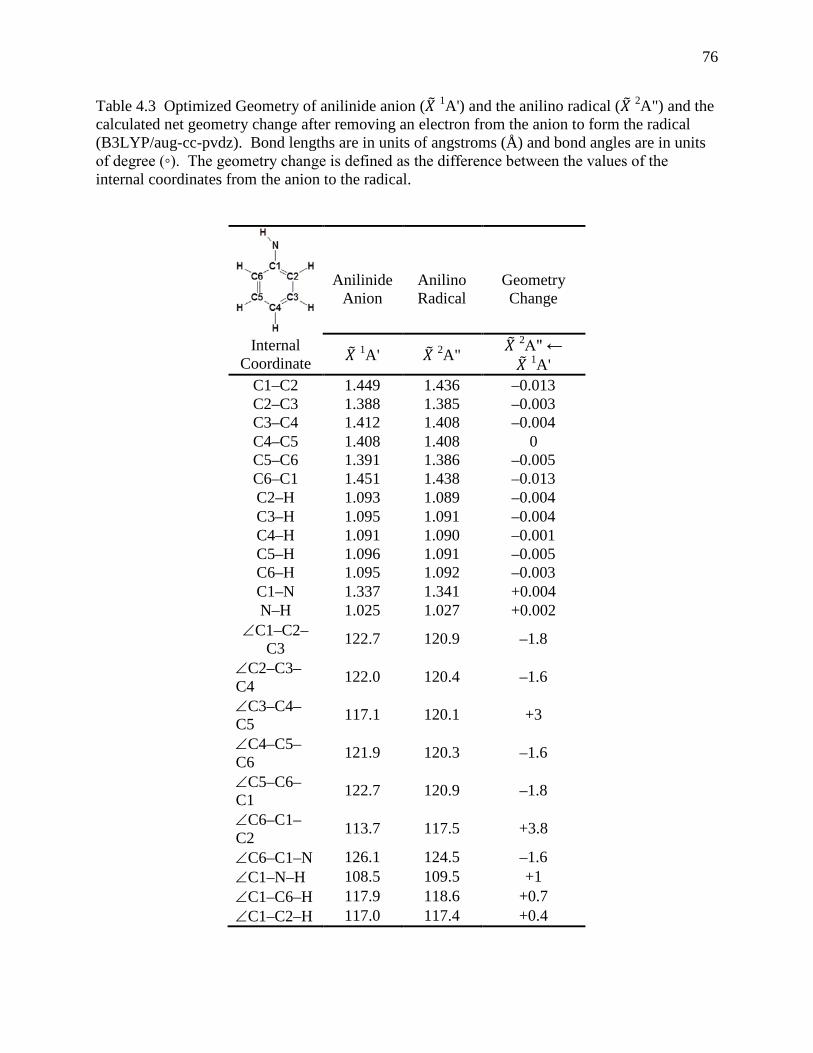
76
Table 4.3 Optimized Geometry of anilinide anion (𝑋� 1A') and the anilino radical (𝑋� 2A") and the calculated net geometry change after removing an electron from the anion to form the radical (B3LYP/aug-cc-pvdz). Bond lengths are in units of angstroms (Å) and bond angles are in units of degree (◦). The geometry change is defined as the difference between the values of the internal coordinates from the anion to the radical.
Anilinide Anion
Anilino Radical
Geometry Change
Internal Coordinate 𝑋� 1A' 𝑋� 2A" 𝑋� 2A" ←
𝑋� 1A' C1–C2 1.449 1.436 –0.013 C2–C3 1.388 1.385 –0.003 C3–C4 1.412 1.408 –0.004 C4–C5 1.408 1.408 0 C5–C6 1.391 1.386 –0.005 C6–C1 1.451 1.438 –0.013 C2–H 1.093 1.089 –0.004 C3–H 1.095 1.091 –0.004 C4–H 1.091 1.090 –0.001 C5–H 1.096 1.091 –0.005 C6–H 1.095 1.092 –0.003 C1–N 1.337 1.341 +0.004 N–H 1.025 1.027 +0.002
∠C1–C2–C3 122.7 120.9 –1.8
∠C2–C3–C4 122.0 120.4 –1.6
∠C3–C4–C5 117.1 120.1 +3
∠C4–C5–C6 121.9 120.3 –1.6
∠C5–C6–C1 122.7 120.9 –1.8
∠C6–C1–C2 113.7 117.5 +3.8
∠C6–C1–N 126.1 124.5 –1.6 ∠C1–N–H 108.5 109.5 +1 ∠C1–C6–H 117.9 118.6 +0.7 ∠C1–C2–H 117.0 117.4 +0.4

77
The simulated anilinide spectrum also indicates there are several other minor transitions
that contribute to peaks B–D that are spaced by 20 cm-1. These transitions are due to sequence
bands from the low–frequency out-of-plane ν33 vibrational mode (33𝑛𝑛). Due to the low
frequency of this mode, these sequence bands will still have some intensity even when the ions
are cooled to ~ 200 K; for this reason, we do not measure appreciable peak narrowing in our cold
spectrum (shown in Figure 4.2). Peak A, to the lower binding energy of the origin, is a hot band
assigned to the 2210 transition from vibrationally excited anions. When the ions were cooled to ~
200 K, the intensity of this peak is reduced significantly, confirming its assignment as a hot
band.
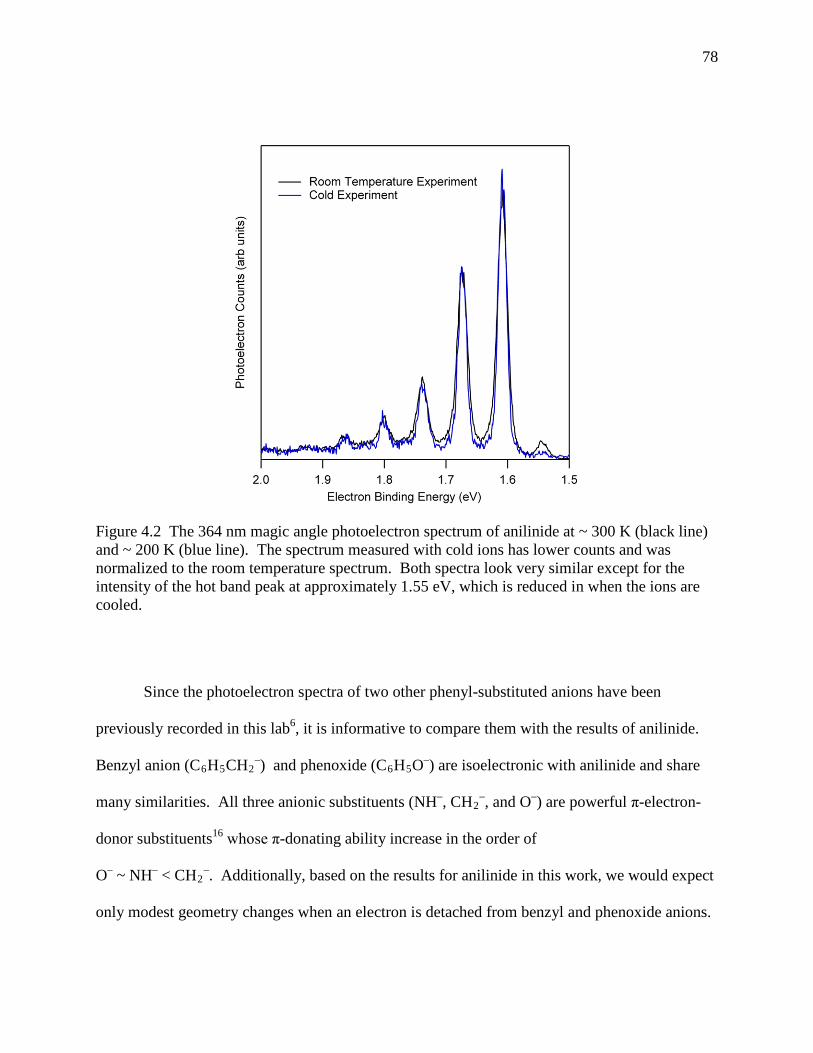
78
Since the photoelectron spectra of two other phenyl-substituted anions have been
previously recorded in this lab6, it is informative to compare them with the results of anilinide.
Benzyl anion (C6H5CH2–) and phenoxide (C6H5O–) are isoelectronic with anilinide and share
many similarities. All three anionic substituents (NH–, CH2–, and O–) are powerful π-electron-
donor substituents16 whose π-donating ability increase in the order of
O– ~ NH– < CH2–. Additionally, based on the results for anilinide in this work, we would expect
only modest geometry changes when an electron is detached from benzyl and phenoxide anions.
Figure 4.2 The 364 nm magic angle photoelectron spectrum of anilinide at ~ 300 K (black line) and ~ 200 K (blue line). The spectrum measured with cold ions has lower counts and was normalized to the room temperature spectrum. Both spectra look very similar except for the intensity of the hot band peak at approximately 1.55 eV, which is reduced in when the ions are cooled.
79
Figure 4.3 compares the three photoelectron spectra, which were all recorded using
similar experimental conditions; 364 nm spectra recorded at magic angle using room temperature
ions. The three spectra look remarkably similar, in that there is a single vibrational progression
with ~ 515 cm-1 peak spacing. This isn’t too surprising since all three anions and corresponding
radical geometries have many similarities, as we anticipated.15, 17 Only small difference are
calculated in the C1–C2 and the C3–C4 bonds in the radicals, whose lengths decrease in going
from phenoxyl to benzyl radical. This variance in bond lengths has been attributed to the
differences in the electronegativity of the substituents.17 In a computational study on these three
radicals, Adamo and coworkers found that there was no significant mixing in the vibrational
modes characteristic of the six-membered ring and those representative of the substituents.17
Therefore, the vibrational normal modes in the anilino radical have analogous modes in the
benzyl and phenoxyl radicals. The 515 cm-1 mode in both benzyl and phenoxyl radicals was
assigned to a vibrational mode that involves the same atomic displacements seen in the ν22
vibrational mode of the anilino radical.
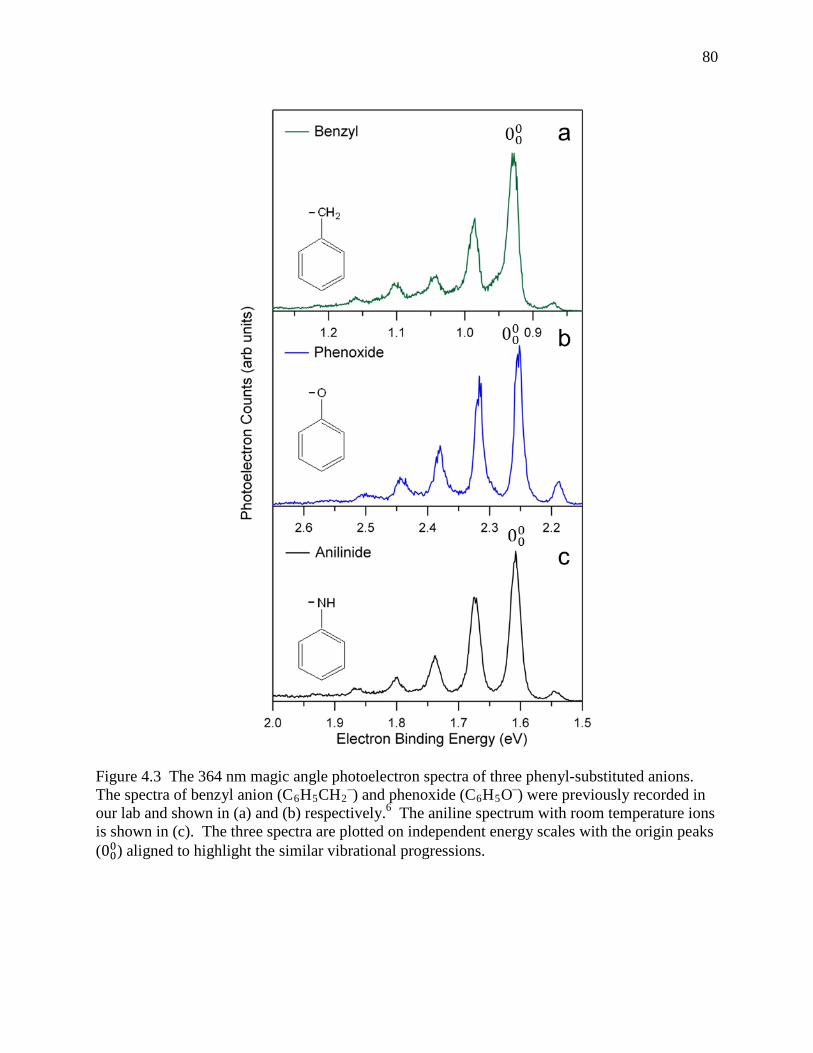
80
Figure 4.3 The 364 nm magic angle photoelectron spectra of three phenyl-substituted anions. The spectra of benzyl anion (C6H5CH2
–) and phenoxide (C6H5O–) were previously recorded in our lab and shown in (a) and (b) respectively.6 The aniline spectrum with room temperature ions is shown in (c). The three spectra are plotted on independent energy scales with the origin peaks (000) aligned to highlight the similar vibrational progressions.
81
However, the EA’s of the three radicals are drastically different, spanning a range of
almost 1.5 eV. The trend in the EA is found to increase in magnitude with the electronegativity
of the substituent on the benzene ring: O– > NH– > CH2–. Phenoxyl has the largest EA value at
2.253(6) eV, followed by anilino at 1.607(4) eV, with Benzyl having the lowest EA at 0.912(6)
eV.
4.4 Conclusion
The photoelectron spectrum of anilinide is measured for the first time and which allows
for the most accurate EA determination of the anilino radical of 1.607(4) eV. The measured
spectrum contains only one dominant vibrational progression corresponding to a ring-distortion
vibrational mode. This molecule is a model system for when there is a small geometry change
between an anion and the corresponding neutral, resulting in a very simple photoelectron
spectrum that is straight forward to analyze. We also compared our results with two other
previously studied phenyl-substituted anions to determine the effects of changing the substituent
on a benzene ring. The photoelectron spectra are nearly identical since the changes in geometry
are nearly the same for all three species. The EAs, however, are significantly different due to the
different electronegativities of the substituents.
82
4.5 References
1. Bartmess, J.E., J.A. Scott, and R.T. McIver, Scale of acidities in the gas phase from methanol to phenol. Journal of the American Chemical Society, 1979. 101(20): p. 6046-6056.
2. Drzaic, P.S. and J.I. Brauman, Electron photodetachment from phenylnitrene, anilide, and benzyl anions - Electron affinities of the anilino and benzyl radicals and phenylnitrene. Journal of Physical Chemistry, 1984. 88(22): p. 5285-5290.
3. Tripathi, G.N.R. and R.H. Schuler, Time resolved resonance raman Spectra of anilino radical and aniline radical cation. Journal of Chemical Physics, 1987. 86(7): p. 3795-3800.
4. Vogelhuber, K.M., et al., Photoelectron spectra of dihalomethyl anions: Testing the limits of normal mode analysis. The Journal of Chemical Physics, 2011. 134(18): p. 184306-13.
5. Xu, W. and A. Gao, Structures, Electron Affinities, and Harmonic Vibrational Frequencies of C6H5X/C6H5X- (X = N, S, NH, PH, CH2, and SiH2). The Journal of Physical Chemistry A, 2005. 110(3): p. 997-1004.
6. Gunion, R.F., et al., Ultraviolet photoelectron-spectroscopy of the phenide, benzyl and phenoxide anions, with ab initio calculations. International Journal of Mass Spectrometry and Ion Processes, 1992. 117(1-3): p. 601-620.
7. Frisch, M.J., et al., Gaussian 03, Revision B.012004, Wallingford, CT: Gaussian, Inc.
8. Becke, A.D., Density-functional thermochemistry. III. The role of exact exchange. Journal of Chemical Physics, 1993. 98(7): p. 5648-5652.
9. Lee, C.T., W.T. Yang, and R.G. Parr, Development of the colle-salvetti correlation-energy formula into a functional of the electron-density. Physical Review B, 1988. 37(2): p. 785-789.
10. Woon, D.E. and T.H. Dunning, Gaussian-Basis Sets for Use in Correlated Molecular Calculations .3. the Atoms Aluminum through Argon. Journal of Chemical Physics, 1993. 98(2): p. 1358-1371.
11. Dunning, T.H., Gaussian-basis sets for use in correlated molecular calculations. 1. The atoms boron through neon and hydrogen. Journal of Chemical Physics, 1989. 90(2): p. 1007-1023.
12. Ervin, K.M., PESCAL, Fortran program. PESCAL, Fortran program, 2010.
13. Ervin, K.M., et al., Naphthyl radical: Negative ion photoelectron spectroscopy, Franck-Condon simulation, and thermochemistry. J. Phys. Chem. A, 2001. 105(48): p. 10822.
14. King, G.A., T.A.A. Oliver, and M.N.R. Ashfold, Dynamical insights into (1)pi sigma* state mediated photodissociation of aniline. Journal of Chemical Physics, 2010. 132(21).
15. Rappoport, Z.Z., ed. The Chemistry of Anilines, Part 1. 2007.

83
16. Kemister, G., et al., A theoretical approach to substituent effects. Examination of phenoxides and anilides as models for benzyl anions. The Journal of Organic Chemistry, 1980. 45(6): p. 1056-1060.
17. Adamo, C., et al., Structure and magnetic properties of benzyl, anilino, and phenoxyl radicals by density functional computations. Journal of Chemical Physics, 1998. 109(23): p. 10244-10254.

84
5 Photoelectron Spectroscopy of Azinides: Pyridinide, 1,2-diazinide, 1,3-diazinide, 1,4-diazinide, 1,3,5-triazinide
5.1 Introduction
There is considerable interest in understanding the pyrolysis of nitrogen-containing
heterocycles, especially five-membered (azole) and six-membered (azine) compounds.1-3 These
nitrogen-rich compounds are abundant in coal,4, 5 and represent the fundamental unit of many
high-energy density materials.6, 7 Combustion of these compounds leads to the production of
nitrogen oxide (NOx) species, which play an important role in the formation and degradation of
tropospheric ozone.8 A number of recent studies have focused on the pyrolysis of azine
molecules containing one, two, and three nitrogen atoms (referred to as pyridine, diazines, and
triazines, respectively).9-14 One of the main goals of these studies was to determine the strength
and reactivity of specific C–H bonds that were shown to be critical in the decomposition process.
For example, the generally accepted mechanism for decomposition of pyridine is initiated by the
cleavage of the weakest C–H bond – the bond adjacent to the nitrogen atom.3 Clearly,
knowledge of the bond dissociation energy (BDE) of various C–H bonds in azine molecules is
needed to understand which decomposition pathways are most important.
Azines provide model systems to investigate how replacement of a C–H group with a
nitrogen atom affects the thermochemical properties of six-membered aromatic rings. Only a
limited number of experimental studies of gaseous azines exist, and those have been largely
limited to shock tube experiments.9, 11, 12, 14-16 One of the most important shock tube results was
the bond strengths for pyridine, 1,3-diazine, and 1,4-diazine. However, the shock tube
85
measurements rely heavily on modeling and fits to data, which in turn lead to fairly large error
bars for the dissociation energy. There appear to be no experimental determinations of the BDE
of 1,2-diazine or any triazines. These shock tube results were later complemented by a
comprehensive theoretical investigation by Barckholtz et al., focused on computing the C–H and
N–H BDEs of aromatic hydrocarbons.17 Both shock tube and theoretical studies concluded that
when there was more than one possible C–H bond fission site, the most stable radical site was
always adjacent to a nitrogen atom. Furthermore, both found that the strengths of all C–H bonds
in pyridine and the diazines were less than the C–H bond strength in benzene (112.9(5) kcal
mol-1), the prototypical six-membered ring aromatic molecule.18
The bond strength of benzene was determined19 using a combination of gas-phase ion
chemistry and negative ion photoelectron spectroscopy20 utilizing the negative ion
thermochemical cycle given by Equation 5.1 and depicted in Figure 5.1,
D(R– H) = Δacid𝐻(RH) + EA(R) – IE(H)
where D(R–H) is the BDE, ΔacidH(RH) is the gas-phase enthalpy of deprotonation, EA(R) is the
electron affinity and IE(H) is the ionization energy of a hydrogen atom. In this chapter, we apply
this well-established methodology to obtain the C–H bond strengths of the most acidic sites of
several azines. To date, the EAs of any azinyl radical have not been measured. The gas phase
acidities of pyridine and the diazines have been reported,21 but these measurements were made at
elevated temperatures (450 – 650 K) with relatively large error bars (±2.4 kcal mol-1). The
identity of the deprotonation site was also not verified, but only surmised based on chemical
intuition and the primitive theoretical calculations available twenty years ago. The gas phase
acidity of 1,3,5-triazine has never been measured, though a recent study of its reactivity was
Equation 5.1
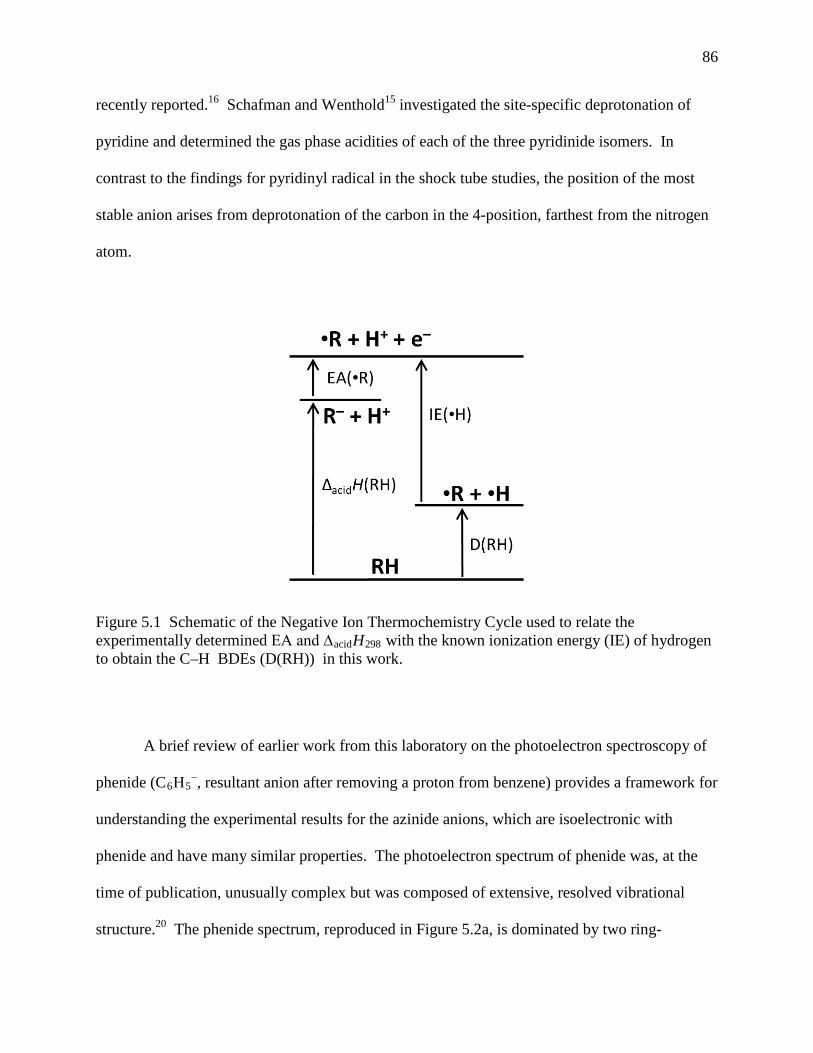
86
recently reported.16 Schafman and Wenthold15 investigated the site-specific deprotonation of
pyridine and determined the gas phase acidities of each of the three pyridinide isomers. In
contrast to the findings for pyridinyl radical in the shock tube studies, the position of the most
stable anion arises from deprotonation of the carbon in the 4-position, farthest from the nitrogen
atom.
A brief review of earlier work from this laboratory on the photoelectron spectroscopy of
phenide (C6H5–, resultant anion after removing a proton from benzene) provides a framework for
understanding the experimental results for the azinide anions, which are isoelectronic with
phenide and have many similar properties. The photoelectron spectrum of phenide was, at the
time of publication, unusually complex but was composed of extensive, resolved vibrational
structure.20 The phenide spectrum, reproduced in Figure 5.2a, is dominated by two ring-
Figure 5.1 Schematic of the Negative Ion Thermochemistry Cycle used to relate the experimentally determined EA and ∆acidH298 with the known ionization energy (IE) of hydrogen to obtain the C–H BDEs (D(RH)) in this work.

87
distortion vibrational progressions with frequencies of 600(10) cm-1 and 968(15) cm-1. The
presence of only two dominant active vibrational modes is remarkable, given that there are ten
allowed A1 symmetry modes in the phenyl radical. The normal modes responsible for the
vibrational progression are in-plane ring distortions principally involving the carbon atom where
the ejected electron was localized. The reported EA was 1.096(6) eV, much higher than for
other alkyl radicals that do not have a conjugated π electronic system.22 This finding shows that
the ring system contributes significantly to the stabilization of the electron pair on the carbon
atom, from which a proton was removed.

88
Figure 5.2 Magic-angle negative ion photoelectron spectra of phenide (a), pyridinide (b), 1,2-diazinide (c), 1,3-diazinide (d), 1,4-diazinide (e), 1,3,5-triazinide (f).
89
The deprotonation enthalpy of benzene was determined to be ∆acidH300(C6H6) = 401.7(5)
kcal mol-1 in a detailed study by Davico et al.19 This study measured the rate constants for
proton transfer between amide ion and benzene, and between phenide ion and ammonia,
obtaining the equilibrium constant between the forward and reverse proton transfer reactions.19
Recent work has refined the acidity of ammonia – the reference acid in the Davico work – and
the acidity of benzene was slightly reduced,18 by 0.5 kcal mol-1, to 401.2(5) kcal mol-1. Using
this ΔacidH for benzene, and the EA of phenyl radical (0 K), the BDE of benzene was determined
using Equation 5.1 to be D300(C6H6) = 112.9(5) kcal mol-1. This benzene C–H bond strength
provides the basic reference point for evaluating the C–H bond strengths of azines upon
systematic addition of nitrogen atom(s).
In this Chapter we employ a combination of gas-phase ion chemistry, anion
photoelectron spectroscopy, and ab initio calculations to investigate the gas phase acidities,
radical EAs, and C–H bond strengths of five azine molecules: pyridine, 1,2-diazine (pyridazine),
1,3-diazine (pyrimidine), 1,4-diazine (pyrazine), and 1,3,5-triazine (s-triazine). We measure the
EA of the azinyl radicals and gas phase acidity for each azine (with the exception of pyridine23 ),
which allows determination of the C–H BDE for the most acidic proton site in each azine
molecule.
Due to the large number of molecules studied, the result section is divided into six
sections. First, we present an overview of our experimental findings, followed by a detailed
analysis of 1,3-diazine, which typifies the other four azines studied. Following the experimental
results, we discuss the general trends in C-H bond strengths observed in the context of adding
nitrogen atoms to azines.

90
5.2 Experimental Method
Negative Ion Photoelectron Measurements
The negative ion photoelectron spectrometer used in this experiment has been described
in detail in Chapter 2. Negative ions are formed in a flowing afterglow ion source. A
microwave discharge containing trace amounts of O2 in He buffer gas (~0.4 Torr) generates
atomic oxygen radical anion, O‒. Methane is added downstream of O‒ where H-atom abstraction
from methane forms hydroxide (HO‒), which is thermalized and subsequently reacts with an
appropriate azine precursor (pyridine, 1,2-diazine, 1,3-diazine, 1,4-diazine, 1,3,5-triazine: ≥97%,
Sigma-Aldrich) to generate azinide anions. Since many of the azine molecules have low vapor
pressures, high-purity helium (General Air, 99.99999%) was bubbled through the sample which
significantly increased the azinide ion signal. Spectra was recorded both with ions at room
temperature ( ~ 300 K) and cooled with a liquid nitrogen ( ~ 150 K). The mass resolution of the
new Wien velocity filter for these experiments was m/Δm ~ 60. Typical mass-selected ion beam
currents were ~ 50 –120 pA. The ~1 W output from a single-mode continuous-wave argon ion
laser operating at 364 nm (3.40814 eV) is built up to approximately 100 W of circulating power
in the interaction region. The energy resolution of the hemispherical analyzer is approximately
11 meV under the experimental conditions used here.
Flowing Afterglow-Selected Ion Flow Tube (FA-SIFT) Measurements
The gas phase acidities of the azines were determined via proton transfer reaction kinetic
measurements using a variety of anions in a tandem FA-SIFT instrument that has been described
previously.24, 25 The experimental details for the acidity measurements have been reported in
detail in previous publications16, 26 and will not be repeated here. However, a brief summary of
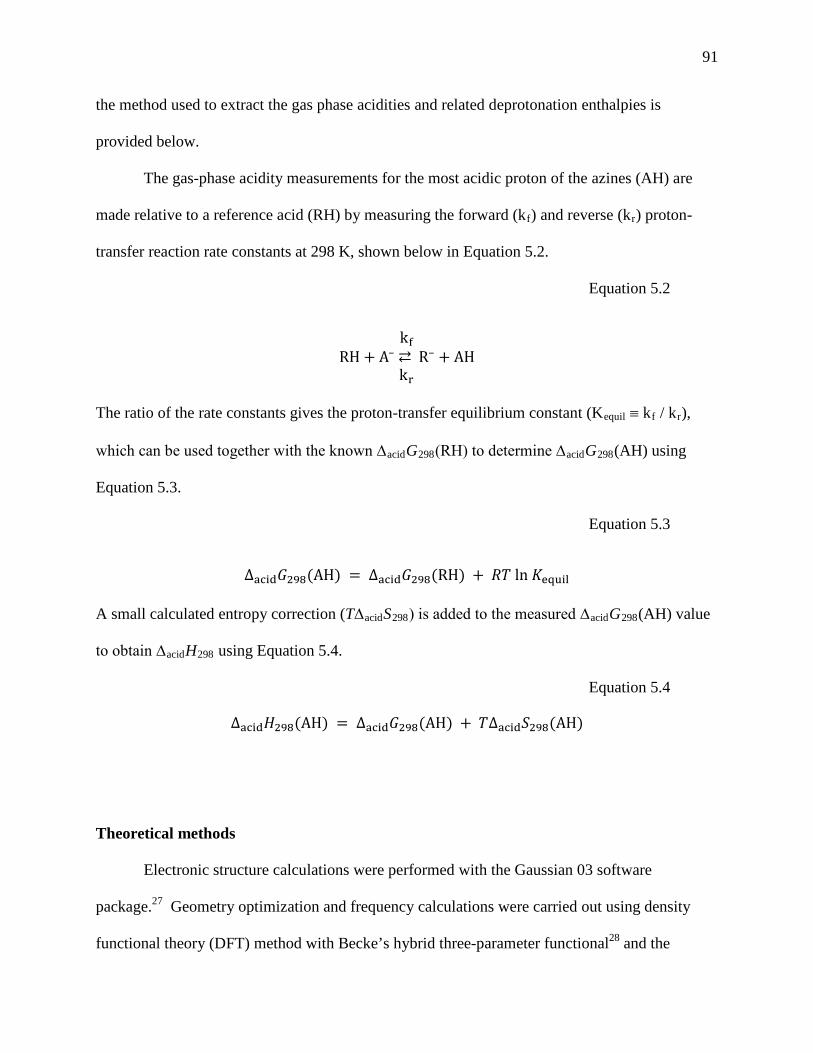
91
the method used to extract the gas phase acidities and related deprotonation enthalpies is
provided below.
The gas-phase acidity measurements for the most acidic proton of the azines (AH) are
made relative to a reference acid (RH) by measuring the forward (kf) and reverse (kr) proton-
transfer reaction rate constants at 298 K, shown below in Equation 5.2.
RH + A– kf⇄ kr
R– + AH
The ratio of the rate constants gives the proton-transfer equilibrium constant (Kequil ≡ kf / kr),
which can be used together with the known ∆acidG298(RH) to determine ∆acidG298(AH) using
Equation 5.3.
∆acid𝐺298(AH) = ∆acid𝐺298(RH) + 𝑅𝑇 ln 𝐾equil
A small calculated entropy correction (T∆acidS298) is added to the measured ∆acidG298(AH) value
to obtain ∆acidH298 using Equation 5.4.
∆acid𝐻298(AH) = ∆acid𝐺298(AH) + 𝑇∆acid𝑆298(AH)
Theoretical methods
Electronic structure calculations were performed with the Gaussian 03 software
package.27 Geometry optimization and frequency calculations were carried out using density
functional theory (DFT) method with Becke’s hybrid three-parameter functional28 and the
Equation 5.2
Equation 5.3
Equation 5.4

92
correlation functional of Lee et al.29 (B3LYP) and with an augmented correlation-consistent
polarized double-zeta basis set (aug-cc-pVDZ).30, 31 No scaling factor is applied to the calculated
vibrational frequencies.
The Franck-Condon profiles of the photoelectron spectra are simulated using the
PESCAL program.32 The simulations employ the calculated theoretical geometries, normal
mode vectors, and vibrational frequencies of the anion and neutral states. The Franck-Condon
factors are computed in the harmonic oscillator approximation including Duschinsky rotation
using the Sharp-Rosenstock-Chen method.33 The individual vibronic peak contours are
simulated by a Gaussian function with a FWHM of 11 meV, consistent with instrumental
resolution.
5.3 Results
Figure 5.2 shows the negative ion photoelectron spectra of the five azinide anions
studied, as well as the previously published spectrum of phenide for comparison.34 One of the
most striking features of the azinide spectra is the similarity of the vibrational progressions. The
structure in the spectra is largely dominated by two vibrational modes with frequencies of
approximately 700 and 1000 cm-1, analogous to those observed in the phenide spectrum. Each
spectrum has a clear origin peak that is marked with an arrow indicating the measured EA,
reported in Table 5.1. The photoelectron spectra of 1,3-diazinide and 1,3,5-triazinide, shown in
Figure 5.2d and Figure 5.2f respectively, were recorded at ~ 150 K; the remaining spectra were
collected at 300 K. All 300 K spectra exhibit a singular hot band peak to the lower-eBE side of
the origin peak. From these hot bands, we extract a frequency corresponding to a transition
originating from a ring-distortion mode in the anion. Measured vibrational frequencies are

93
summarized in Table 5.2. With a photon energy of ~ 3.4 eV, we did not observe clear
spectroscopic signatures of excited states of the neutral radicals. There are weak features that
appear at higher binding energy in the spectra of pyridinide and 1,2-diazinide, but the signal
level was insufficient for a conclusive assignment.
Table 5.1 Summary of Experimental Thermochemical Properties of Azine Systems: C-H Bond Dissociation Energies, Electron Affinities, and Deprotonation Enthalpies
a Reference 18 b Reference 34 c Rererence 15
Table 5.3 summarizes the results of the gas-phase acidity measurements from the FA-
SIFT experiments. Our experimental acidities are from the most acidic sites in the azines, all
which reside within an 8 kcal mol-1 range and have error bars of less than 1 kcal mol-1. The gas-
phase acidity of pyridine, which was previously measured by Schafman and coworkers, was not
repeated in this study but is described in the results section below.15
Benzene
Pyridine
1,2-diazine
1,3-diazine
1,4-diazine
1,3,5-
triazine
D298(C-H) (kcal mol-1) 112.9(5)a 110.4(2.0) 111.3(7) 113.4(7) 107.5(4) 107.8(7)
EA (eV) 1.096(6)b 1.480(6) 1.850(6) 1.840(6) 1.254(6) 1.529(6)
∆acidH298(C-H)
(kcal mol-1) 401.2(5)a 389.9(2.0)
c 382.2(7) 384.6(7) 392.2(4) 386.1(7)
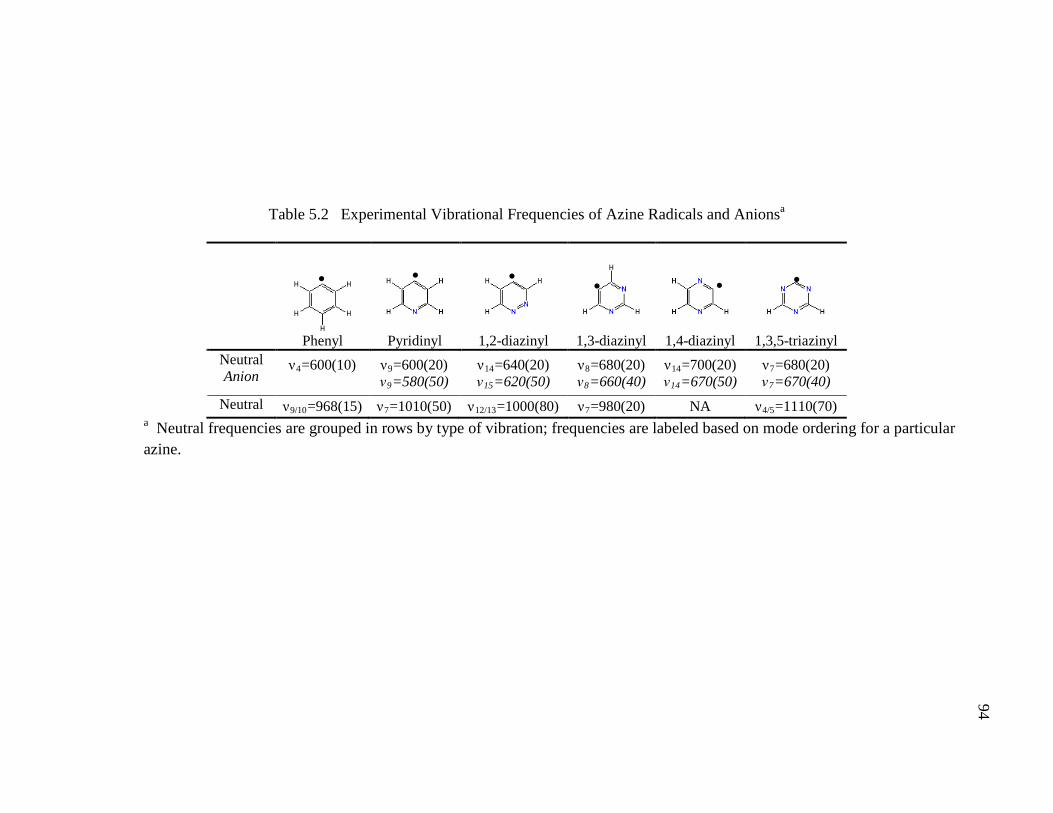
94
Table 5.2 Experimental Vibrational Frequencies of Azine Radicals and Anionsa
Phenyl
Pyridinyl
1,2-diazinyl
1,3-diazinyl
1,4-diazinyl
1,3,5-triazinyl Neutral Anion
ν4=600(10)
ν9=600(20) ν9=580(50)
ν14=640(20) ν15=620(50)
ν8=680(20) ν8=660(40)
ν14=700(20) ν14=670(50)
ν7=680(20) ν7=670(40)
Neutral ν9/10=968(15) ν7=1010(50) ν12/13=1000(80) ν7=980(20) NA ν4/5=1110(70) a Neutral frequencies are grouped in rows by type of vibration; frequencies are labeled based on mode ordering for a particular azine.
● ● ● ● ● ●
94
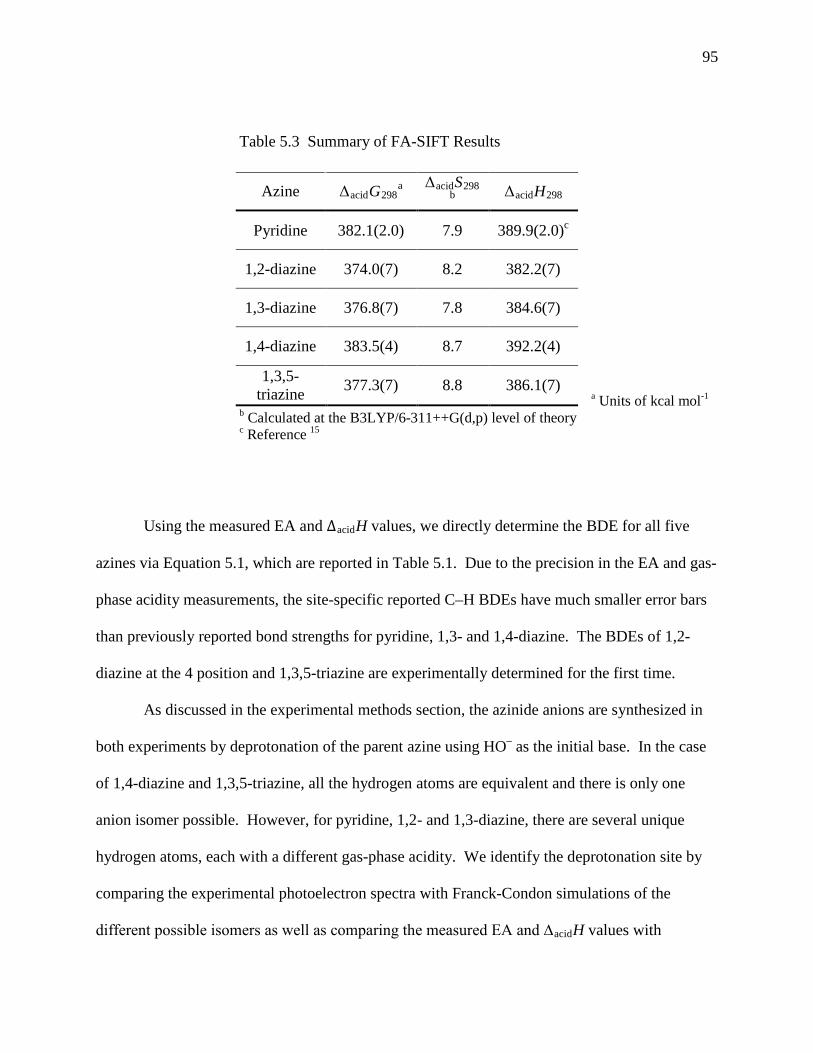
95
Table 5.3 Summary of FA-SIFT Results
a Units of kcal mol-1 b Calculated at the B3LYP/6-311++G(d,p) level of theory c Reference 15
Using the measured EA and ∆acidH values, we directly determine the BDE for all five
azines via Equation 5.1, which are reported in Table 5.1. Due to the precision in the EA and gas-
phase acidity measurements, the site-specific reported C–H BDEs have much smaller error bars
than previously reported bond strengths for pyridine, 1,3- and 1,4-diazine. The BDEs of 1,2-
diazine at the 4 position and 1,3,5-triazine are experimentally determined for the first time.
As discussed in the experimental methods section, the azinide anions are synthesized in
both experiments by deprotonation of the parent azine using HO– as the initial base. In the case
of 1,4-diazine and 1,3,5-triazine, all the hydrogen atoms are equivalent and there is only one
anion isomer possible. However, for pyridine, 1,2- and 1,3-diazine, there are several unique
hydrogen atoms, each with a different gas-phase acidity. We identify the deprotonation site by
comparing the experimental photoelectron spectra with Franck-Condon simulations of the
different possible isomers as well as comparing the measured EA and ∆acidH values with
Azine ΔacidG298a ΔacidS298
b ΔacidH298
Pyridine 382.1(2.0) 7.9 389.9(2.0)c
1,2-diazine 374.0(7) 8.2 382.2(7)
1,3-diazine 376.8(7) 7.8 384.6(7)
1,4-diazine 383.5(4) 8.7 392.2(4)
1,3,5-triazine 377.3(7) 8.8 386.1(7)
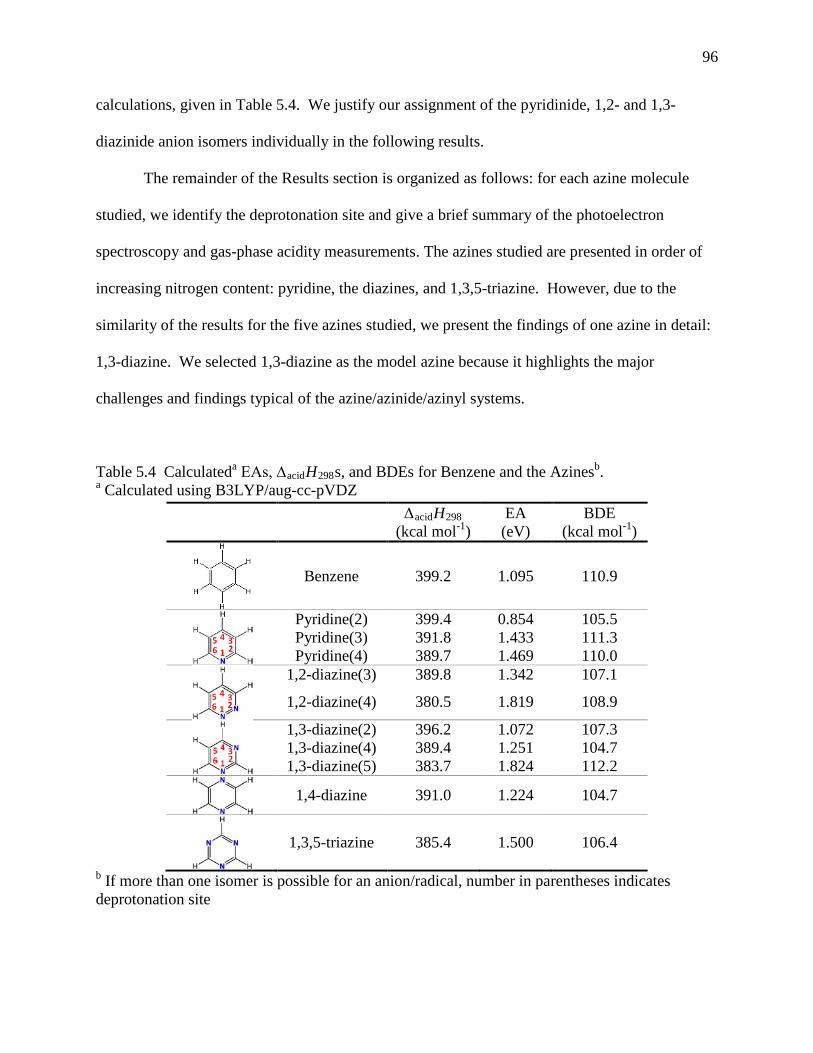
96
calculations, given in Table 5.4. We justify our assignment of the pyridinide, 1,2- and 1,3-
diazinide anion isomers individually in the following results.
The remainder of the Results section is organized as follows: for each azine molecule
studied, we identify the deprotonation site and give a brief summary of the photoelectron
spectroscopy and gas-phase acidity measurements. The azines studied are presented in order of
increasing nitrogen content: pyridine, the diazines, and 1,3,5-triazine. However, due to the
similarity of the results for the five azines studied, we present the findings of one azine in detail:
1,3-diazine. We selected 1,3-diazine as the model azine because it highlights the major
challenges and findings typical of the azine/azinide/azinyl systems.
Table 5.4 Calculateda EAs, ∆acidH298s, and BDEs for Benzene and the Azinesb. a Calculated using B3LYP/aug-cc-pVDZ
b If more than one isomer is possible for an anion/radical, number in parentheses indicates deprotonation site
ΔacidH298 (kcal mol-1)
EA (eV)
BDE (kcal mol-1)
Benzene 399.2 1.095 110.9
Pyridine(2) 399.4 0.854 105.5 Pyridine(3) 391.8 1.433 111.3 Pyridine(4) 389.7 1.469 110.0
1,2-diazine(3) 389.8 1.342 107.1
1,2-diazine(4) 380.5 1.819 108.9
1,3-diazine(2) 396.2 1.072 107.3 1,3-diazine(4) 389.4 1.251 104.7 1,3-diazine(5) 383.7 1.824 112.2
1,4-diazine 391.0 1.224 104.7
1,3,5-triazine 385.4 1.500 106.4

97
5.3.1 Pyridinide, C5H4N‒ Pyridine has three possible anion isomers with very similar measured acidities for the
hydrogen atoms at the 3- and 4-positions: 391.2 – 391.5 and 389.9(2.0) kcal mol-1 respectively.15
Wenthold and coworkers also measured the regioselectivity of pyridine deprotonation under very
similar experimental conditions as those used in this work and found 70 – 80% of the anions
corresponded to pyridin-4-ide, and 20 – 30% were from pyridine-3-ide.15
Deprotonation from the 2-position, which is calculated to be the least acidic site in
pyridine, was shown to be inaccessible under their experimental conditions. In our experiments,
the pyridinide anion exchanged two hydrogen atoms with D2O, duplicating the results by
Schafman and Wenthold.15 These results are consistent with the theoretical prediction (Table
5.4) that both the 2- and 3-position hydrogen atoms are sufficiently acidic to be accessed by HO–.
However, even though hydrogen atoms in the 2- and 3-positions have similar acidities, we expect
to make primarily the pyridine-4-ide anion based on the branching ratios determined by
Wenthold. This is supported by our simulations of the photoelectron spectra of the various
pyridinide isomers; the experimental spectrum is clearly best reproduced by the pyridin-4-ide
simulation shown in Figure 5.3b. Contribution from multiple isomers would result in a more
congested spectrum than what we observe, indicating that only pyridine-4-ide contributes
significantly to the photoelectron spectrum.
The measured EA of pyridin-4-yl is 1.480(6) eV, in excellent agreement with the
calculated EA of 1.469 eV. We experimentally measure two vibrational frequencies of the
pyridinyl radical, one at 600(20) cm-1 and another at 1010(50) cm-1, and one frequency of
pyridinide anion at 580(50) cm-1. Using the previously reported ∆acidH and the measured EA
reported above, the C–H BDE for pyridine at the 4-position is 110.4(2.0) kcal mol-1.

98
Figure 5.3 Magic-angle negative ion photoelectron spectra of pyridinide and simulations of possible anion isomers at 300 K. (a) 364-nm experimental spectrum; peaks used to identify experimental frequencies are indicated with solid lines (neutral frequencies) and dashed lines (anion frequency). Simulated photoelectron spectra of pyridin-4-ide (b), pyridine-3-ide (c), pyridine-2-ide (d).
99
5.3.2 1,3-Diazine, C4H3N2– The analysis of 1,3-diazine results are more detailed than the other azine species in this
chapter and is used to address many of the challenges and findings characteristic to the azines
studied. The experimental 150 K magic-angle photoelectron spectrum of 1,3-diazinide is shown
in Figure 5.4, along with Frank-Condon spectral simulations of the three possible 1,3-diazinide
isomers. We confirm that we only observe contributions from one isomer by comparing our
photoelectron spectra to the corresponding Franck-Condon simulations. In general, we can
distinguish between signatures of different anion isomers if they have unique photoelectron
spectra.35-37 1,3-Diazinide has three possible anion isomers, but as Figure 5.4 indicates, all three
have dramatically different simulated photoelectron spectra. The simulation of 1,3-diazin-5-ide
has nearly quantitative agreement with the experimental photoelectron spectrum, while neither
the vibrational structure nor the calculated EA of 1,3-diazin-4-ide or 1,3-diazin-2-ide match the
observed spectrum. We also compare the calculated ∆acidH298 of each isomer with our
experimental measurements. The hydrogen at the 2-position is calculated to be much less acidic
(at least 6 kcal mol-1) relative to the other hydrogen atoms at the 4 and 5 positions and, therefore,
will be inaccessible in our experiment. The measured ∆acidH298 of 384.6(7) kcal mol-1 is
consistent with the calculated value of 383.7 kcal mol-1 for the hydrogen at the 5-position. Based
on agreement between the experimental and simulated photoelectron spectra, as well as the
agreement of the measured ∆acidH298 with calculations, it is clear that only 1,3-diazin-5-ide
contributes to our measurements.
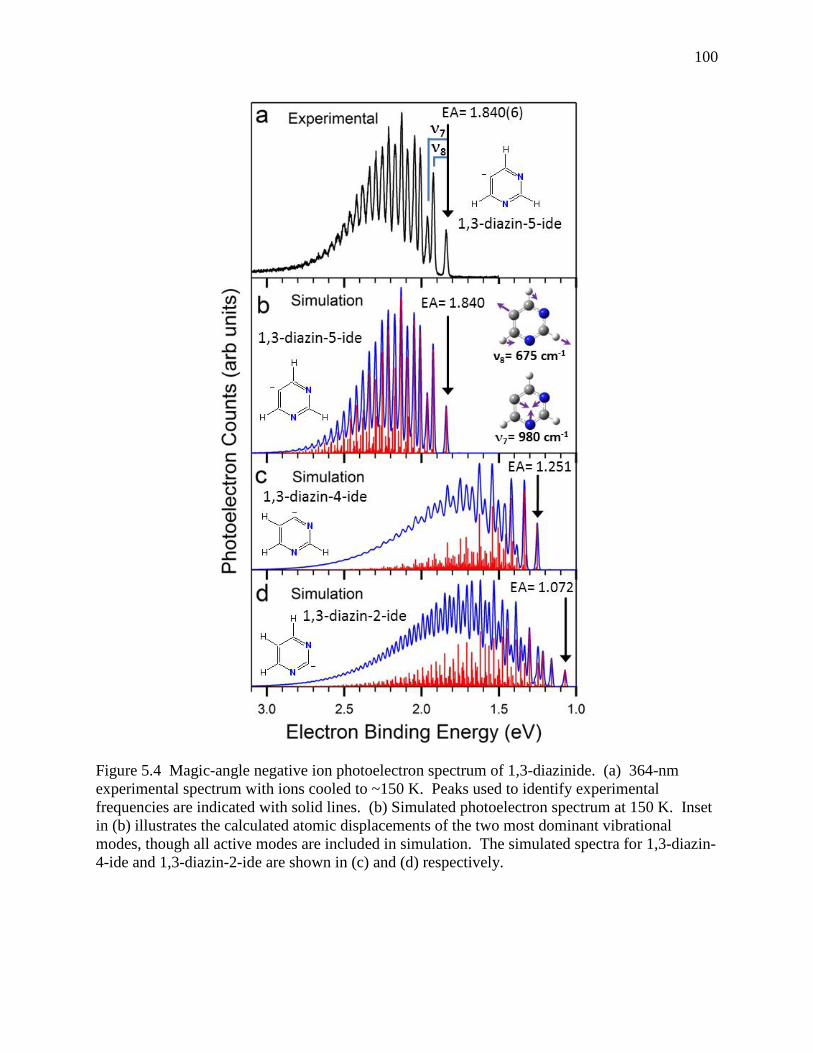
100
Figure 5.4 Magic-angle negative ion photoelectron spectrum of 1,3-diazinide. (a) 364-nm experimental spectrum with ions cooled to ~150 K. Peaks used to identify experimental frequencies are indicated with solid lines. (b) Simulated photoelectron spectrum at 150 K. Inset in (b) illustrates the calculated atomic displacements of the two most dominant vibrational modes, though all active modes are included in simulation. The simulated spectra for 1,3-diazin-4-ide and 1,3-diazin-2-ide are shown in (c) and (d) respectively.
101
Confident with our identification of 1,3-diazin-5-ide anion, we can now investigate the
vibrational structure in the measured photoelectron spectrum. The spectrum of 1,3-diazinide was
also collected at room temperature (not shown); the 300 K spectrum has a hot band at lower
binding energy than the origin transition, from which we directly measure one vibrational
frequency of the anion, 660(40) cm-1. The photoelectron spectrum in Figure 5.4a has two
dominant vibrational progressions that yield two vibrational frequencies of the neutral 1,3-
diazin-5-yl radical, 680(20) and 980(20) cm-1. Chemical insight and ab initio calculations enable
assignment of these frequencies to vibrational normal modes. Table 5.5 lists the calculated
vibrational modes for 1,3-diazin-5-ide anion and 1,3-diazin-5-yl radical, along with a qualitative
description of the atomic motion and the experimental measurements for the photoelectron
spectrum.
In general, progressions observed in photoelectron spectroscopy are from vibrational
modes with atomic displacements that reflect the change in equilibrium geometry from the anion
to the neutral. The location of the excess electron in the anion has a large effect on the
equilibrium geometry; in 1,3-diazin-5-ide, there are two electrons localized on the 5-carbon
atom. This causes the ∠C4C5C6 bond angle to be smaller and the two adjacent C–C bond
lengths to be larger than in the corresponding radical, which does not have to accommodate the
excess charge. This prediction is confirmed by our calculations that indicate a +12.3° change in
the ∠C4C5C6 bond angle, and a 0.035 Å decrease in the adjacent C–C bond length upon
photodetachment. Therefore, we expect that the observed vibrational progressions will
correspond to totally symmetric vibrations that involve changes in the ∠C4C5C6 angle and the
C4–C5 and C6–C5 bond length. The moderate geometry change between the 1,3-diazin-5-ide

102
anion and neutral 1,3-diazin-5-yl radical results in the observed extended vibrational progression
spanning approximately 1 eV.
Table 5.5 Calculated and Experimental Vibrational Frequencies for 1,3-diazin-5-ide (1A1) and 1,3-diazin-5-yl (2A1).
Mode Description Calculationsa (cm-1) Experimentb (cm-1) Anion Neutral Anion Neutral
A1
ν1 sym H str 3087 3182 ν2 sym H str 3035 3175 ν3 sym ip ring
deformation 1475 1513
ν4 N-C-N sym str + H-wag 1412 1409
ν5 sym ip ring deformation 1156 1126
ν6 sym ring breathing 1075 1081 ν7 sym ip ring
deformation 975 989 980(20)
ν8 sym ip ring deformation 673 688
657(40) 675(20)
A2 ν9 asym o-o-p H-wag 995 972 ν10 o-o-p ring deformation 330 400
B1
ν11 asym o-o-p H-wag 962 1000 ν12 o-o-p ring deformation 866 895 ν13 o-o-p ring deformation 764 700 ν14 o-o-p ring puckering 345 376
B2
ν15 asym H str 3035 3179 ν16 asym ip ring
deformation 1559 1598
ν17 asym ip H-wag 1392 1435 ν18 asym ip H-wag 1343 1331 ν19 asym ip ring
deformation 1223 1250
ν20 asym ip ring deformation 1169 1158
ν21 asym ip ring deformation 652 568
a Used GAUSSIAN03 B3LYP/aug-cc-pVDZ where all frequencies are harmonica and unscaled, this work b Experimental, this work
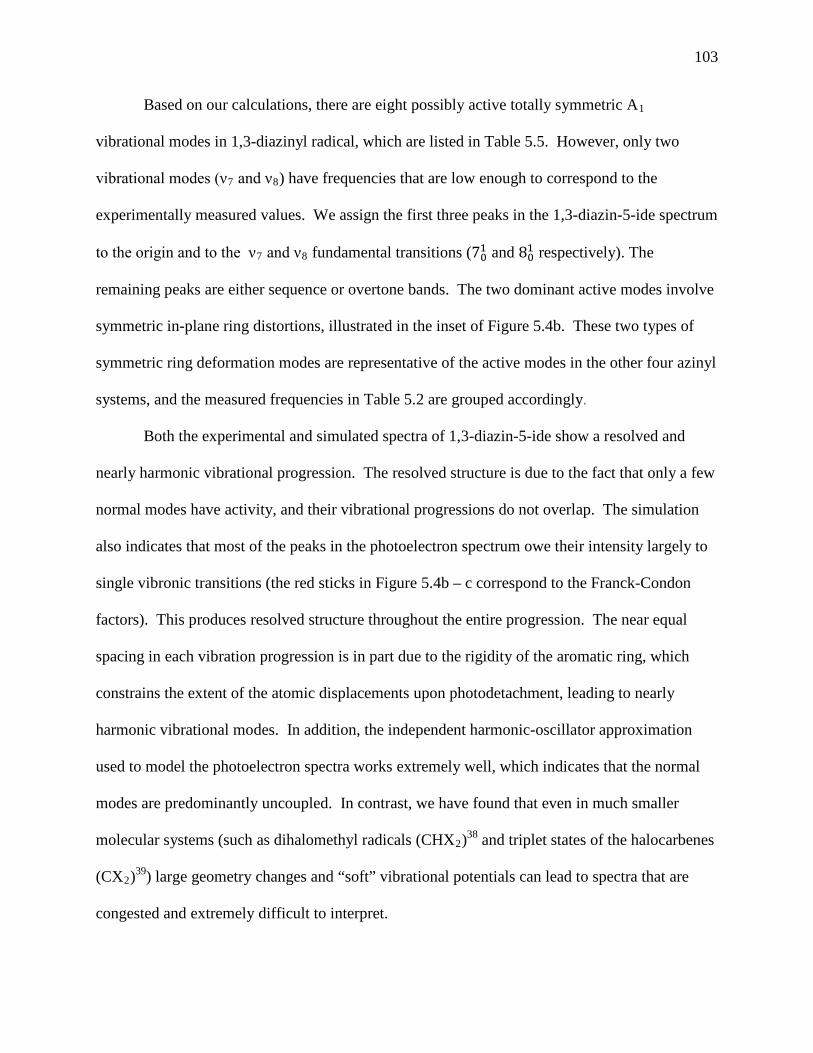
103
Based on our calculations, there are eight possibly active totally symmetric A1
vibrational modes in 1,3-diazinyl radical, which are listed in Table 5.5. However, only two
vibrational modes (ν7 and ν8) have frequencies that are low enough to correspond to the
experimentally measured values. We assign the first three peaks in the 1,3-diazin-5-ide spectrum
to the origin and to the ν7 and ν8 fundamental transitions (701 and 801 respectively). The
remaining peaks are either sequence or overtone bands. The two dominant active modes involve
symmetric in-plane ring distortions, illustrated in the inset of Figure 5.4b. These two types of
symmetric ring deformation modes are representative of the active modes in the other four azinyl
systems, and the measured frequencies in Table 5.2 are grouped accordingly.
Both the experimental and simulated spectra of 1,3-diazin-5-ide show a resolved and
nearly harmonic vibrational progression. The resolved structure is due to the fact that only a few
normal modes have activity, and their vibrational progressions do not overlap. The simulation
also indicates that most of the peaks in the photoelectron spectrum owe their intensity largely to
single vibronic transitions (the red sticks in Figure 5.4b – c correspond to the Franck-Condon
factors). This produces resolved structure throughout the entire progression. The near equal
spacing in each vibration progression is in part due to the rigidity of the aromatic ring, which
constrains the extent of the atomic displacements upon photodetachment, leading to nearly
harmonic vibrational modes. In addition, the independent harmonic-oscillator approximation
used to model the photoelectron spectra works extremely well, which indicates that the normal
modes are predominantly uncoupled. In contrast, we have found that even in much smaller
molecular systems (such as dihalomethyl radicals (CHX2)38 and triplet states of the halocarbenes
(CX2)39) large geometry changes and “soft” vibrational potentials can lead to spectra that are
congested and extremely difficult to interpret.
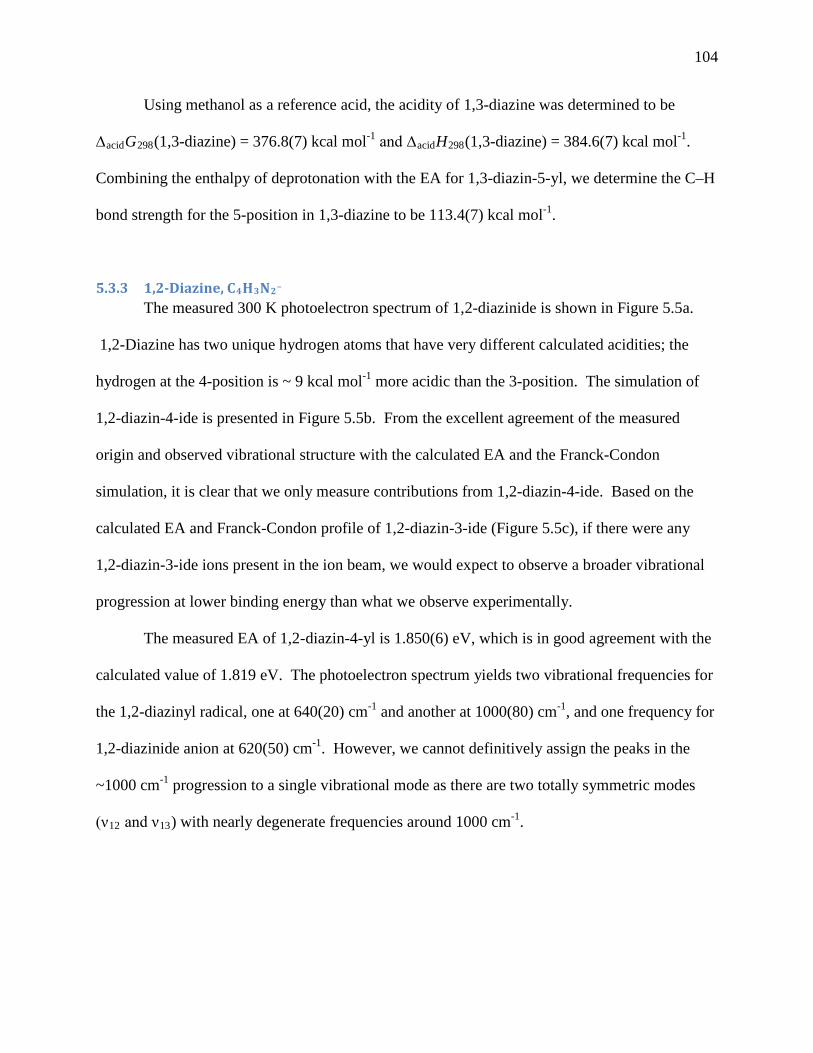
104
Using methanol as a reference acid, the acidity of 1,3-diazine was determined to be
∆acidG298(1,3-diazine) = 376.8(7) kcal mol-1 and ∆acidH298(1,3-diazine) = 384.6(7) kcal mol-1.
Combining the enthalpy of deprotonation with the EA for 1,3-diazin-5-yl, we determine the C–H
bond strength for the 5-position in 1,3-diazine to be 113.4(7) kcal mol-1.
5.3.3 1,2-Diazine, C4H3N2– The measured 300 K photoelectron spectrum of 1,2-diazinide is shown in Figure 5.5a.
1,2-Diazine has two unique hydrogen atoms that have very different calculated acidities; the
hydrogen at the 4-position is ~ 9 kcal mol-1 more acidic than the 3-position. The simulation of
1,2-diazin-4-ide is presented in Figure 5.5b. From the excellent agreement of the measured
origin and observed vibrational structure with the calculated EA and the Franck-Condon
simulation, it is clear that we only measure contributions from 1,2-diazin-4-ide. Based on the
calculated EA and Franck-Condon profile of 1,2-diazin-3-ide (Figure 5.5c), if there were any
1,2-diazin-3-ide ions present in the ion beam, we would expect to observe a broader vibrational
progression at lower binding energy than what we observe experimentally.
The measured EA of 1,2-diazin-4-yl is 1.850(6) eV, which is in good agreement with the
calculated value of 1.819 eV. The photoelectron spectrum yields two vibrational frequencies for
the 1,2-diazinyl radical, one at 640(20) cm-1 and another at 1000(80) cm-1, and one frequency for
1,2-diazinide anion at 620(50) cm-1. However, we cannot definitively assign the peaks in the
~1000 cm-1 progression to a single vibrational mode as there are two totally symmetric modes
(ν12 and ν13) with nearly degenerate frequencies around 1000 cm-1.

105
Figure 5.5 Magic-angle negative ion photoelectron spectra of 1,2-diazinide and simulations of possible anion isomers at 300 K. (a) 364-nm experimental spectrum; peaks used to identify experimental frequencies are indicated with solid lines (neutral frequencies) and dashed lines (anion frequency). The simulated spectra for 1,2-diazin-4-ide and 1,2-diazin-3-ide are shown in (b) and (c) respectively

106
The gas-phase acidity of ∆acidG298(1,2-diazine) = 374.0(7) kcal mol-1 was measured with
a corresponding enthalpy of deprotonation of ∆acidH298(1,2-diazine) = 382.2(7) kcal mol-1.
Combining the measured enthalpy of deprotonation above with the EA for 1,2-diazin-4-yl, we
determine the C–H bond strength for the 4-position in 1,2-diazine to be 111.3(7) kcal mol-1.
5.3.4 1,4-Diazine, C4H3N2– The four hydrogen atoms in 1,4-diazine are equivalent so there is only one possible 1,4-
diazinide isomer. The measured EA of the 1,4-diazinyl radical is 1.254(6) eV, again in very
good agreement with the calculated EA of 1.224 eV. We can experimentally identify one
vibrational frequency of the 1,4-diazinyl radical, 700(20) cm-1, and one frequency of the 1,4-
diazinide anion, 670(50) cm-1.
Using water as the reference acid, the acidity of 1,4-diazine is determined to be
∆acidG298(1,4-diazine) = 383.5(4) kcal mol-1, with a corresponding enthalpy of deprotonation
∆acidH298(1,4-diazine) = 392.2(4) kcal mol-1. From the measured enthalpy of deprotonation with
the EA for 1,4-diazinyl, we determine the C–H bond strength for the 1,4-diazine to be 107.5(4)
kcal mol-1.

107
5.3.5 1,3,5-Triazine, C3H2N3– The three hydrogen atoms in 1,3,5-triazine are equivalent, therefore there is only one
possible 1,3,5-triazinide isomer. The measured EA of 1,3,5-triazinyl is 1.529(6) eV. We
Figure 5.6 Magic-angle negative ion photoelectron spectrum of 1,4-diazinide. (a) 364-nm experimental spectrum with ion at 300 K. Peaks used to identify experimental frequencies are indicated with solid (neutral frequency) and dashed lines (anion frequency) (b) Simulated photoelectron spectrum at 300 K.
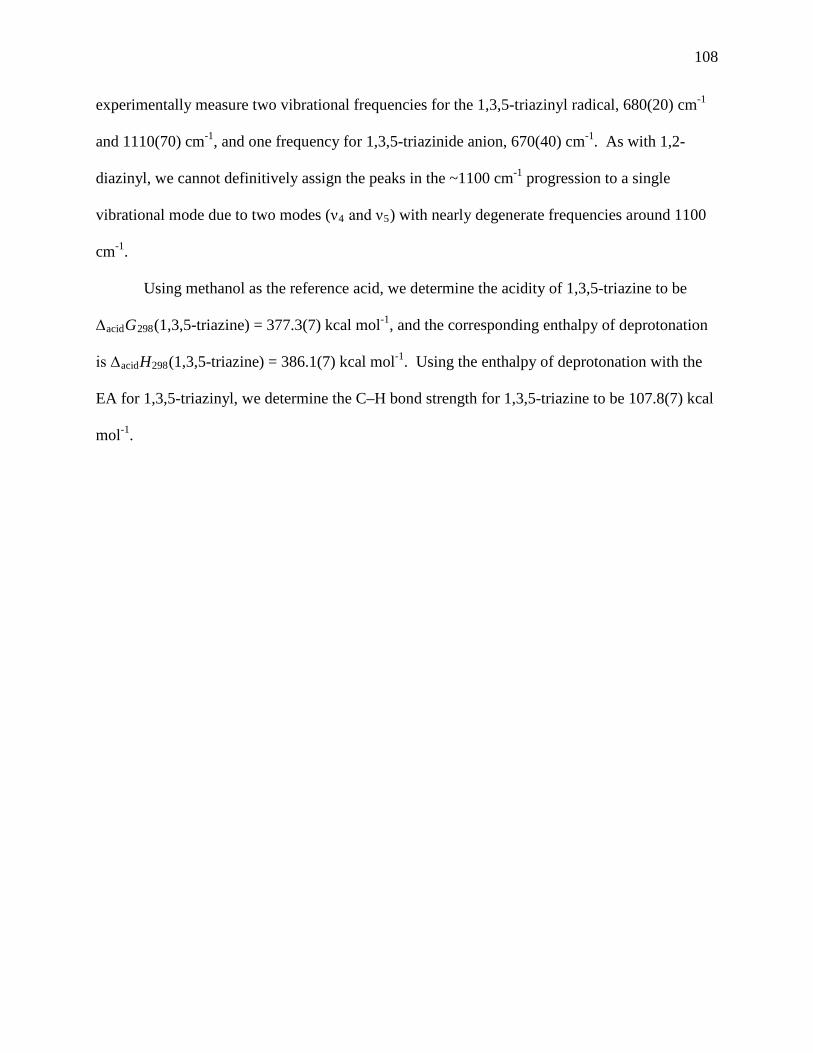
108
experimentally measure two vibrational frequencies for the 1,3,5-triazinyl radical, 680(20) cm-1
and 1110(70) cm-1, and one frequency for 1,3,5-triazinide anion, 670(40) cm-1. As with 1,2-
diazinyl, we cannot definitively assign the peaks in the ~1100 cm-1 progression to a single
vibrational mode due to two modes (ν4 and ν5) with nearly degenerate frequencies around 1100
cm-1.
Using methanol as the reference acid, we determine the acidity of 1,3,5-triazine to be
∆acidG298(1,3,5-triazine) = 377.3(7) kcal mol-1, and the corresponding enthalpy of deprotonation
is ∆acidH298(1,3,5-triazine) = 386.1(7) kcal mol-1. Using the enthalpy of deprotonation with the
EA for 1,3,5-triazinyl, we determine the C–H bond strength for 1,3,5-triazine to be 107.8(7) kcal
mol-1.
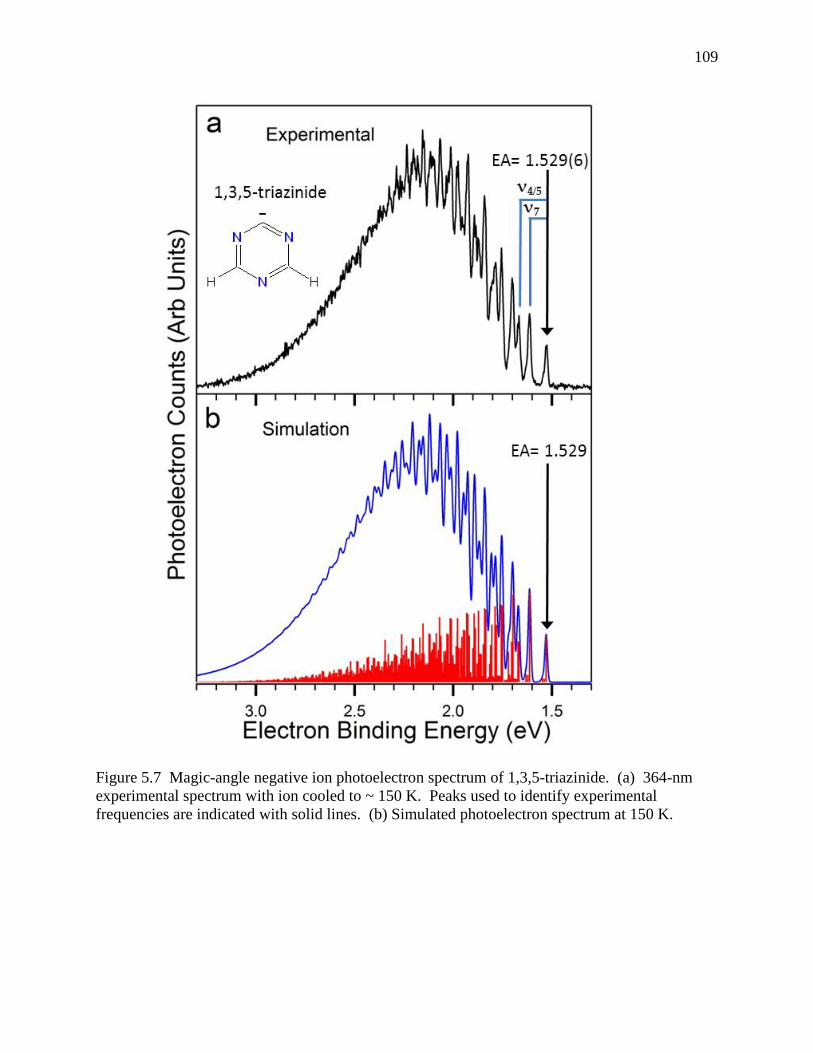
109
Figure 5.7 Magic-angle negative ion photoelectron spectrum of 1,3,5-triazinide. (a) 364-nm experimental spectrum with ion cooled to ~ 150 K. Peaks used to identify experimental frequencies are indicated with solid lines. (b) Simulated photoelectron spectrum at 150 K.
110
5.4 Discussion
In order to understand the effects of adding nitrogen atoms to six-membered rings, we
will first compare pyridine with benzene; this is the simplest case in which only one nitrogen
atom has been added. We then will systematically investigate and compare azines in order of
increasing complexity and nitrogen content. By studying a series of azines with slight
perturbations, namely the addition of nitrogen atoms, we can try to decouple what factors
contribute to the stability of the azinide anions and the strength of C–H bonds.
Like benzene, pyridine is aromatic but replaces a C–H group with an electronegative
nitrogen atom with a lone pair of electrons in an out-of-plane sp2 hybridized orbital. This
nitrogen insertion causes the hydrogen atoms in the 2-, 3-, and 4-positions – ortho, meta, and
para respectively – to have drastically different measured acidities depending on proximity to
the nitrogen atom.15 In pyridine, the hydrogen in the para position is the most acidic, and is 11.3
kcal mol-1 more acidic than benzene. In fact, our results seem to agree with past findings that
there are competing electrostatic effects that influence the stability of an azinide anion, and in
turn the gas-phase acidity and EA.15 Schafman suggested that forming an anion at the para
position is favorable due to resonance stabilization.15 This resonance picture is depicted in
Scheme 5.1. The ortho position also benefits from resonance stabilization, but suffers from
extensive electron-pair repulsion with the lone-pair electrons on the nitrogen atom, destabilizing
the anion. In general, the relative stability of an anion can be inferred by the value of the
deprotonation enthalpy. For example, if a specific azinide anion is very stable relative to the
neutral azine molecule, then the proton at the anion site will be more acidic and the
corresponding ∆acidH(R-H) value with be lower. Furthermore, since our experiments
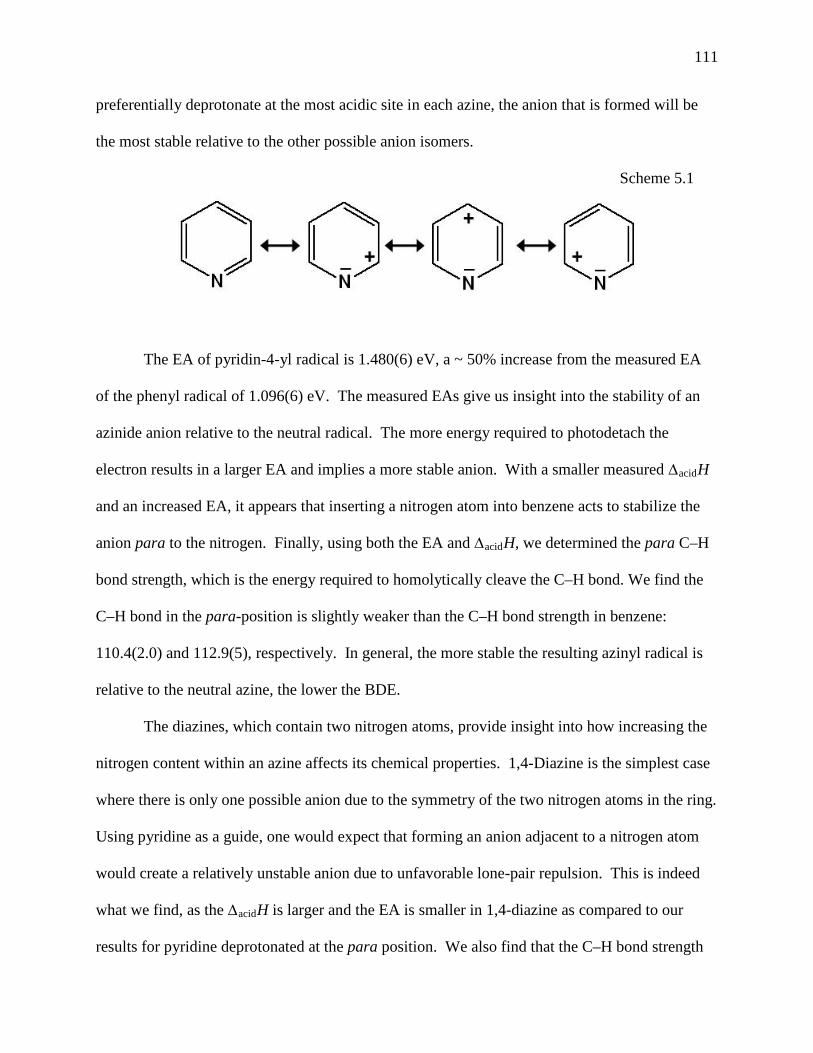
111
preferentially deprotonate at the most acidic site in each azine, the anion that is formed will be
the most stable relative to the other possible anion isomers.
Scheme 5.1
The EA of pyridin-4-yl radical is 1.480(6) eV, a ~ 50% increase from the measured EA
of the phenyl radical of 1.096(6) eV. The measured EAs give us insight into the stability of an
azinide anion relative to the neutral radical. The more energy required to photodetach the
electron results in a larger EA and implies a more stable anion. With a smaller measured ∆acidH
and an increased EA, it appears that inserting a nitrogen atom into benzene acts to stabilize the
anion para to the nitrogen. Finally, using both the EA and ∆acidH, we determined the para C–H
bond strength, which is the energy required to homolytically cleave the C–H bond. We find the
C–H bond in the para-position is slightly weaker than the C–H bond strength in benzene:
110.4(2.0) and 112.9(5), respectively. In general, the more stable the resulting azinyl radical is
relative to the neutral azine, the lower the BDE.
The diazines, which contain two nitrogen atoms, provide insight into how increasing the
nitrogen content within an azine affects its chemical properties. 1,4-Diazine is the simplest case
where there is only one possible anion due to the symmetry of the two nitrogen atoms in the ring.
Using pyridine as a guide, one would expect that forming an anion adjacent to a nitrogen atom
would create a relatively unstable anion due to unfavorable lone-pair repulsion. This is indeed
what we find, as the ∆acidH is larger and the EA is smaller in 1,4-diazine as compared to our
results for pyridine deprotonated at the para position. We also find that the C–H bond strength
112
in 1,4-diazine is ~2.6 kcal mol-1 weaker than the para C–H bond in pyridine. Previous studies on
pyridin-2-yl have suggested that a radical adjacent to a nitrogen atom can be stabilized by a
resonance interaction between the unpaired electron and the adjacent nitrogen lone pair.9, 11, 12, 40
In other words, the adjacent nitrogen atom allows for additional resonance structures, serving to
delocalize the unpaired electron and thereby stabilize the radical.11 Therefore, a more stable 1,4-
diazinyl radical would explain the lower BDE. We can conclude that there is a balancing of
electrostatic effects between electron – lone-pair repulsion in the anion and resonance
stabilization in the radical.
The other two diazines, 1,2- and 1,3-diazine, lack the symmetry of 1,4-diazine but share
similar experimental results. In both cases, the most acidic site is the farthest away from the
nitrogen atoms, the meta-position for both diazines. The photoelectron spectra in Figure 5.2
illustrate the similarity of the EAs – within 10 meV of each other – and that 1,2-diazin-4-yl and
1,3-diazin-5-yl have the largest EAs of any of the azines we studied. These results indicate that
the anion formed from 1,2- and 1,3-diazine are very stable relative to the corresponding neutral
azine or radical. Table 5.1 also indicates that the measured ∆acidH values are smaller than any of
the other azines we studied, further implying the stability of the 1,2-diazin-4-ide and 1,3-diazin-
5-ide anions. Comparing the results from benzene and pyridine to the diazines, it also appears
that the additional nitrogen plays a role in stabilizing the anion. However, it is very difficult to
experimentally decouple which factors are most important. The C–H bond for 1,3-diazine at the
5-position is the strongest we measure with an BDE of 113.4(7) kcal mol-1. The C–H bond in
1,2-diazine at the 4-position is only slightly weaker with a BDE of 111.3(7) kcal mol-1. Unlike
1,4-dazinyl, the radical formed in both of these diazines has no additional resonance interaction
with an adjacent nitrogen atom, thus both have bond strengths similar to benzene.

113
Lastly, 1,3,5-triazine is the special case where there are three nitrogen atoms inserted
symmetrically into the six-membered ring. As with 1,4-diazine, only one possible anion can be
formed, which will be adjacent to a nitrogen atom. But unlike 1,4-diazinide, the excess electron
of 1,3,5-triazinide is adjacent to two nitrogen atoms, which should be very unfavorable if one
only considers the effect of electron – lone-pair repulsion. However, the EA is ~ 0.3 eV (or ~ 7
kcal mol-1) larger and the ∆acidH is ~ 6 kcal mol-1 smaller than for 1,4-diazine. It would appear
that lone-pair repulsion with the excess electron is not the dominant factor governing the EA of
1,3,5-triazinide.
Though our experimental measurements are limited to anions formed at the most acidic
deprotonation site in an azine, we can use our calculations to compare chemical properties of
azinide isomers. As shown in the results section, our experimental results agree very well with
our calculations, giving us confidence in the calculations for the other isomers. 1,3-Diazine
deprotonated at the 2-position forms an anion similar to 1,3,5-triazinide in that the excess
electron of both anions is located between two nitrogen atoms. The ∆acidH value for 1,3-diazine
at the 2-position is 10 kcal mol-1 larger than what we measure in 1,3,5-triazine. Furthermore, the
calculated EA of 1,3-diazin-2-yl is nearly 0.5 eV smaller than what we measure for 1,3,5-
triazinyl. The comparison of the ∆acidH and the EA values are both indicative of a less stable
1,3-diazin-2-ide anion. Thus, the additional nitrogen atom para to the anion in 1,3,5-triazinide
must stabilize the anion in order to observe such a drastic decrease in the enthalpy of
deprotonation and increase in the EA.
We can make several additional observations concerning the C–H bond strengths in the
azines we studied by combining our experimental observations with our calculations. Table 5.4
summarizes the calculated results for all possible isomers created by single deprotonation of the
114
azine species in this work. Our experimental results indicate that the C–H bond strength is the
weakest when adjacent to and strongest when removed from a nitrogen atom. The calculated
results support this finding; in pyridine, 1,2-diazine, and 1,3-diazine, the weakest bond is indeed
adjacent to a nitrogen atom. Furthermore, the most acidic deprotonation site generally
corresponds to the strongest C–H bond with the largest BDE value. Even though we find that the
BDEs vary depending on the proximity to a nitrogen atom, all six measured BDEs in Table 5.1
only span a narrow 6 kcal mol-1 range.
5.5 Conclusion
Five azine molecules were investigated by both negative ion photoelectron spectroscopy
and ion kinetics using a FA-SIFT. We were able to, for the first time, measure EAs for five
azinyl radicals, as well greatly improve the accuracy of the deprotonation enthalpies for four
azine molecules. The measured acidities and EAs are accounted for based on electrostatic
arguments where certain anion sites are preferentially stabilized by resonance while others are
destabilized by electron pair repulsion. However, as the nitrogen content increases in the
diazines and 1,3,5-triazine, there is a balancing of these competing effects which are manifested
in our results. We determined site-specific BDE for all five azines, including the first
experimental measurements for 1,2-diazine and 1,3,5-triazine. The results suggest that the
proximity of the C–H bond to a nitrogen atom has a greater influence on the thermochemistry
(EA, BDE, ΔacidH298) than the number of nitrogen atoms in the azine. Furthermore, we found
that C–H bonds adjacent to a nitrogen atom have lower BDE relative to C–H bonds meta or para
to the nitrogen.

115
5.6 References
1. Smith, K.L., et al., eds. The Structure and Reaction Processes of Coal. 1994, Plenum Press: New York.
2. Wallace, S., K.D. Bartle, and D.L. Perry, Quantification of nitrogen functional groups in coal and coal derived products. Fuel, 1989. 68(11): p. 1450-1455.
3. Hore, N.R. and D.K. Russell, Radical pathways in the thermal decomposition of pyridine and diazines: a laser pyrolysis and semi-empirical study. Journal of the Chemical Society-Perkin Transactions 2, 1998(2): p. 269-275.
4. Axworthy, A.E., V.H. Dayan, and G.B. Martin, Reactions of fuel-nitrogen compounds under conditions of inert pyrolysis. Fuel, 1978. 57(1): p. 29-35.
5. Pohl, J.H. and A.F. Sarofim, Devolatilization and oxidation of coal nitrogen. Symposium (International) on Combustion, 1977. 16(1): p. 491-501.
6. Fried, L.E., et al., Design and synthesis of energetic materials. Annual Review of Materials Research, 2001. 31(1): p. 291-321.
7. Turker, L., S. Gumus, and T. Atalar, A DFT Study on Nitro Derivatives of Pyridine. Journal of Energetic Materials, 2010. 28(2): p. 139-171.
8. FinlaysonPitts, B.J. and J.N. Pitts, Tropospheric air pollution: Ozone, airborne toxics, polycyclic aromatic hydrocarbons, and particles. Science, 1997. 276(5315): p. 1045-1052.
9. Doughty, A. and J.C. Mackie, Kinetics of thermal-decompotion of the diazines – shock-tube pyrolysis of pyrimidine. Journal of the Chemical Society-Faraday Transactions, 1994. 90(4): p. 541-548.
10. Jones, J., et al., Ab-initio studies of the thermal-decomposition of azaaromatics- Free-radical versus intermolecular mechanism. Journal of the Chemical Society-Faraday Transactions, 1995. 91(11): p. 1587-1592.
11. Kiefer, J.H., et al., Pyrolyses of aromatic azines: Pyrazine, pyrimidine, and pyridine. Journal of Physical Chemistry A, 1997. 101(38): p. 7061-7073.
12. Mackie, J.C., M.B. Colket, and P.F. Nelson, Shock-tube pyrolysis of pyridine. Journal of Physical Chemistry, 1990. 94(10): p. 4099-4106.
13. Mackie, J.C., et al., Shock-tube Pyrolysis of Pyrrole and Kinetic Modeling. Int. J. Chem. Kinet., 1991. 23(8): p. 733.
14. Xu, H. and J.H. Kiefer, Shock Tube Study of 1,3,5-Triazine Dissociation and Relaxation and Relaxation of Pyrazine. International Journal of Chemical Kinetics, 2010. 42(4): p. 211-220.
15. Schafman, B.S. and P.G. Wenthold, Regioselectivity of pyridine deprotonation in the gas phase. Journal of Organic Chemistry, 2007. 72(5): p. 1645-1651.
116
16. Garver, J., et al., Gas Phase Reactions of 1,3,5-Triazine: Proton Transfer, Hydride Transfer, and Anionic σ-Adduct Formation. Journal of the American Society for Mass Spectrometry, 2011. 22(7): p. 1260-1272.
17. Barckholtz, C., T.A. Barckholtz, and C.M. Hadad, C-H and N-H bond dissociation energies of small aromatic hydrocarbons. J. Am. Chem. Soc., 1999. 121(3): p. 491.
18. Ervin, K.M. and V.F. DeTuro, Anchoring the gas-phase acidity scale. Journal of Physical Chemistry A, 2002. 106(42): p. 9947-9956.
19. Davico, G.E., et al., The C-H bond-energy of benzene. Journal of the American Chemical Society, 1995. 117(9): p. 2590-2599.
20. Gunion, R.F., et al., Int. J. Mass Spectrom. Ion Processes, 1992. 117: p. 601.
21. Meotner, M. and S.A. Kafafi, Carbon acidities of aromatic-compounds. Journal of the American Chemical Society, 1988. 110(19): p. 6297-6303.
22. Wenthold, P.G., et al., Transition-state spectroscopy of cyclooctatetraene. Science, 1996. 272(5267): p. 1456-1459.
23. We chose to not repeat the acidity measurement for pyridine since it seemed unlikely we could improve on the measurement make by Schafman and Wenthold. Reactivity measurements and exchange reactions with D2O were consistent with Schafman's findings.
24. Van Doren, J.M., et al., The tandem flowing afterglow-sift-drift. International Journal of Mass Spectrometry and Ion Processes, 1987. 81: p. 85-100.
25. Bierbaum, V.M., Theory and Ion Chemistry, in Encyclopedia of Mass Spectrometry, M.L. Gross and R. Caprioli, Editors. 2003, Elsevier: Amsterdam. p. 276.
26. Wren, S.W., et al., Nitrogen Proximity Effects in Azines: How Nitrogen Atoms Affect C–H Bond Strengths and Anion Stability. In Preparation.
27. Frisch, M.J., et al., Gaussian 03, Revision B.052003, Pittsburgh: Gaussian, Inc.
28. Becke, A.D., Density-functional thermochemistry. III. The role of exact exchange. Journal of Chemical Physics, 1993. 98(7): p. 5648-5652.
29. Lee, C.T., W.T. Yang, and R.G. Parr, Development of the colle-salvetti correlation-energy formula into a functional of the electron density. Physical Review B, 1988. 37(2): p. 785-789.
30. Woon, D.E. and T.H. Dunning, Gaussian-Basis Sets for Use in Correlated Molecular Calculations .3. the Atoms Aluminum through Argon. Journal of Chemical Physics, 1993. 98(2): p. 1358-1371.
31. Dunning, T.H., Gaussian-basis sets for use in correlated molecular calculations. 1. The atoms boron through neon and hydrogen. Journal of Chemical Physics, 1989. 90(2): p. 1007-1023.
32. Ervin, K.M., PESCAL, Fortran program. PESCAL, Fortran program, 2010.
33. Ervin, K.M., et al., Naphthyl radical: Negative ion photoelectron spectroscopy, Franck-Condon simulation, and thermochemistry. J. Phys. Chem. A, 2001. 105(48): p. 10822.

117
34. Gunion, R.F., et al., Ultraviolet photoelectron-spectroscopy of the phenide, benzyl and phenoxide anions, with ab initio calculations. International Journal of Mass Spectrometry and Ion Processes, 1992. 117(1-3): p. 601-620.
35. Ichino, T., et al., Structure of the vinyldiazomethyl anion and energetic comparison to the cyclic isomers. Journal of Physical Chemistry A, 2007. 111(34): p. 8374-8383.
36. Villano, S.M., et al., Photoelectron spectroscopy and thermochemistry of the peroxyacetate anion. European Journal of Mass Spectrometry, 2010. 16(3): p. 255-268.
37. Villano, S.M., et al., Photoelectron Spectroscopy and Thermochemistry of the Peroxyformate Anion. Journal of Physical Chemistry A, 2010. 114(1): p. 191-200.
38. Vogelhuber, K.M., et al., Photoelectron spectra of dihalomethyl anions: Testing the limits of normal mode analysis. The Journal of Chemical Physics, 2011. 134(18): p. 184306-13.
39. Wren, S.W., et al., The photoelectron spectrum of CCl2-: the convergence of theory and
experiment after a decade of debate. Physical Chemistry Chemical Physics, 2009. 11(23): p. 4745-4753.
40. Kikuchi, O., et al., An ab initio molecular-orbital study of pyridyl radicals. Bulletin of the Chemical Society of Japan, 1988. 61(1): p. 291-292.

118
6 Photoelectron Spectroscopy of Dihalocarbenes: CCl2‒,
CBr2‒ and CI2
‒
6.1 Introduction
Carbenes are highly reactive diradicals with two electrons occupying nearly degenerate σ
and π orbitals. They serve as intermediates in many chemical reactions, including addition to a
double bond, insertion into a single bond, dimerization, and intramolecular rearrangement.1-4
The nature of the substituents affects whether the electronic configuration of the ground state is a
σ2 singlet or a diradical σ1π1 triplet.4 The singlet 1A1 and triplet 3B1 states lie close in energy but
exhibit very different reactivities, so the difference in energy between the two states (ΔEST) is a
quantity of great interest. Furthermore, dihalocarbenes have served as test cases for comparing
experimental and theoretical energy splittings. For these reasons, carbenes have drawn attention
from both experimental and theoretical research groups for decades. The simplest carbene
possesses a single carbon atom, :CXY; methylene, :CH2 and the halocarbenes have accordingly
been the subject of numerous experimental and theoretical investigations.5
Singlet-triplet energy splittings are difficult to determine experimentally.4 Though the
singlet ground states of the dihalocarbenes have been well-characterized,6-18 spectroscopic
methods are commonly unable to interrogate states of different multiplicity, making ΔEST an
elusive quantity. Extensive theoretical work has been done to calculate ΔEST of the
dihalocarbenes. In the late 1980s, Carter and Goddard19-21 carried out one of the first thorough
studies to determine the magnitude of ΔEST of neutral dihalocarbenes. More calculations
119
followed,22-25 and the computational results reached a consensus that the 3B1 states of CCl2,
CBr2, and CI2 lie 10 – 35 kcal mol−1 higher in energy than their respective 1A1 ground states.
Anion photoelectron spectroscopy has been shown to be an important, direct method for
measuring ΔEST.26, 27 In 1999, Lineberger and co-workers investigated the series of
dihalocarbenes CX2 (X = F, Cl, Br, I) with this technique.28 The singlet-triplet splitting obtained
from the spectrum of CF2– (ΔEST = 54(3) kcal mol-1)28 agreed with theoretical predictions (ΔEST
= 56.9(7) kcal mol-1),29 but the energy splittings for the heavier dihalocarbenes did not.29
Theorists calculated a ΔEST of ~ 20 kcal mol-1 for CCl2 and ~ 17 kcal mol-1 for CBr2,22-25 while
the photoelectron spectra implied substantially lower ΔEST values: 3(3) kcal mol-1 for CCl2, and
2(3) kcal mol-1 for CBr2. Recently, more sophisticated calculations have followed as rapid
advances in theory have been made.29-37 Of particular interest was CCl2, the most
computationally tractable of the dihalocarbenes. Notably, Dyke and co-workers performed a
combined ab initio/Franck-Condon study to simulate the CCl2– photoelectron spectrum.35 All
calculations yielded the larger ΔEST values, consistent with the earlier theoretical studies. This
discrepancy between theory and experiment prompted us to carry out a careful reinvestigation of
the photoelectron spectra of the dihalocarbenes, particularly CCl2–.
We have carefully examined the chemistry taking place in the ion source, and identified
contamination from CHCl2– in the previously reported CCl2
– spectrum; the spectrum of this
contaminant unexpectedly obscured the triplet band origin of CCl2 and resulted in an erroneous
determination of ΔEST(CCl2). In the current study, we collect the photoelectron spectrum of
pure CHCl2– and minimize its contribution to elucidate the CCl2
– experimental data.38 We
present the 351 nm photoelectron spectrum of CCl2– that exhibits vibrationally resolved
transitions to singlet and triplet electronic states, yielding substantially improved agreement with
120
high-level calculations. We then show that the halomethyl anions CHBr2– and CHI2
– also had
contaminated the previous photoelectron spectra of CBr2– and CI2
–.28 The material in the
Chapter is largely based upon two recent publications from this laboratory.38, 39
6.2 Experimental Method
The negative ion photoelectron spectrometer used in this experiment has been described
in detail in Chapter 2. Negative ions are formed in a flowing afterglow ion source. A
microwave discharge containing trace amounts of O2 gas in He buffer gas (~ 0.4 Torr) generates
atomic oxygen radical anion, O–. The appropriate CH2X2 dihalomethane precursor (CH2Cl2,
CH2Br2, or CH2I2, Sigma-Aldrich) is added downstream, where it can undergo a variety of
reactions with O–: H2+ abstraction to produce CX2
– + H2O, H+ abstraction to produce CHX2– +
OH, O addition to produce X– + OCH2X, and H abstraction to produce OH– + CHX2. Collisions
with helium buffer gas vibrationally cool the ions to approximately 300 K. As described in more
detail later, we employ a different reaction sequence using hydroxide (OH–) reactant ion to
produce exclusively CHX2– dihalomethyl anions exclusively. The flow tube can be cooled with
a liquid nitrogen jacket to obtain a cold spectrum of ions with vibrational temperatures near 200
K. The original Wien velocity filter, with a mass resolution of m/Δm ~ 40, was used in these
experiments. The typical ion current for the mass-selected ion beam of CX2– and CHX2
– is
between 200 and 500 pA. Here, the ~ 0.5 W output from a single-mode continuous-wave argon
ion laser operating at either 351 nm (3.531 eV) or 364 nm (3.408 eV) is built up to
approximately 50 W of circulating power in an optical buildup cavity located within the vacuum
system. The energy analyzer resolution for these experiments was approximately 12 meV.
However, after accounting for the resolution of the spectrometer and rotational peak profiles,
absolute electron binding energies can be determined with an accuracy of 5 meV or better.40 A

121
rotatable half-wave plate positioned outside the buildup cavity controls the polarization of the
photodetachment radiation. All spectra shown here were collected with magic angle polarization
unless otherwise noted.
6.3 Theoretical Methods
Electronic structure calculations were carried out using the Gaussian 03 software
package.41 All calculations for CCl2 use the coupled-cluster CCSD(T) method42 with an
augmented correlation-consistent polarized triplet-zeta basis set (aug-cc-pVTZ).43, 44
Calculations for CBr2 were performed with density functional theory at the B3LYP/6-
311++G(d,p) level.45, 46 Geometries were optimized and harmonic vibrational frequencies and
normal mode coordinates were calculated for the doublet anion and the singlet and triplet neutral
states. Calculated harmonic frequencies are reported without applying a scaling factor.
The Franck-Condon profiles of the photoelectron spectra are simulated using the
PESCAL program, which was modified recently in order to simulate transitions among multiple
electronic states simultaneously.47 The simulations start with the theoretical geometries, normal
mode vectors, and vibrational frequencies of the anion and neutral states. For the X 1A1 CCl2
and X 1A1 CBr2 singlet states, however, the harmonic frequencies, anharmonicities, and
geometries from high-resolution spectroscopy experiments14, 17, 18, 48, 49 (Tables 2 and 3) are used
in the simulations instead of the calculated values. For the singlet state transitions, the
anharmonicities are significant and known experimentally, whereas the calculated Duschinsky
rotation angles between normal mode vectors of the two active are modest (5.3° for CCl2 and
9.6° for CBr2). Therefore, the Franck-Condon factors for the singlet state are calculated in the
Morse oscillator, parallel mode approximation using numerically integrated Laguerre polynomial
wavefunctions.50 For the CCl2 triplet state transition, the anharmonicities are unknown

122
experimentally, and the calculated Duschinsky rotation angle is significant (17.5°), so the
Franck-Condon factors are calculated in the harmonic oscillator approximation but including
Duschinsky rotation using the Sharp-Rosenstock-Chen method.51, 52
The individual vibronic peak contours are obtained by calculating the rotational
spectrum, treating the molecules approximately as prolate tops, and convoluting the rotational
transitions with the instrumental resolution function, approximated as a Gaussian function with a
FWHM of 12 meV. This procedure directly accounts for the small (typically < 4 meV)
displacement of the rotationless origin of a peak from the location of its maximum intensity.
Finally, the normal mode displacements between the anion and the neutral for the Franck-
Condon active modes (symmetric stretch and bend), along with the positions of the origin
transitions, are adjusted from the theoretical values to match the experimental spectra.
The Wien filter partially resolves the 12C35,37Cl2− and 12C79,81Br2
− ions; calculated
frequencies and rotational constants indicate that the presence of more than one isotope will
produce negligible broadening. Thus, isotope issues are neglected in the analysis.
6.4 Results and Discussion: Dihalocarbene Anions (CX2–)
In the previous dihalocarbene studies and in the work presented in this paper, the
dihalocarbene target anions are produced by reacting O– with CH2X2 (X=Cl, Br, I).53 As a
specific example, reactions involving CH2Cl2 are described in detail below. A variety of
reactions occur when O– reacts with CH2Cl2 at 300 K, leading to the formation of products with
the following branching fractions:53
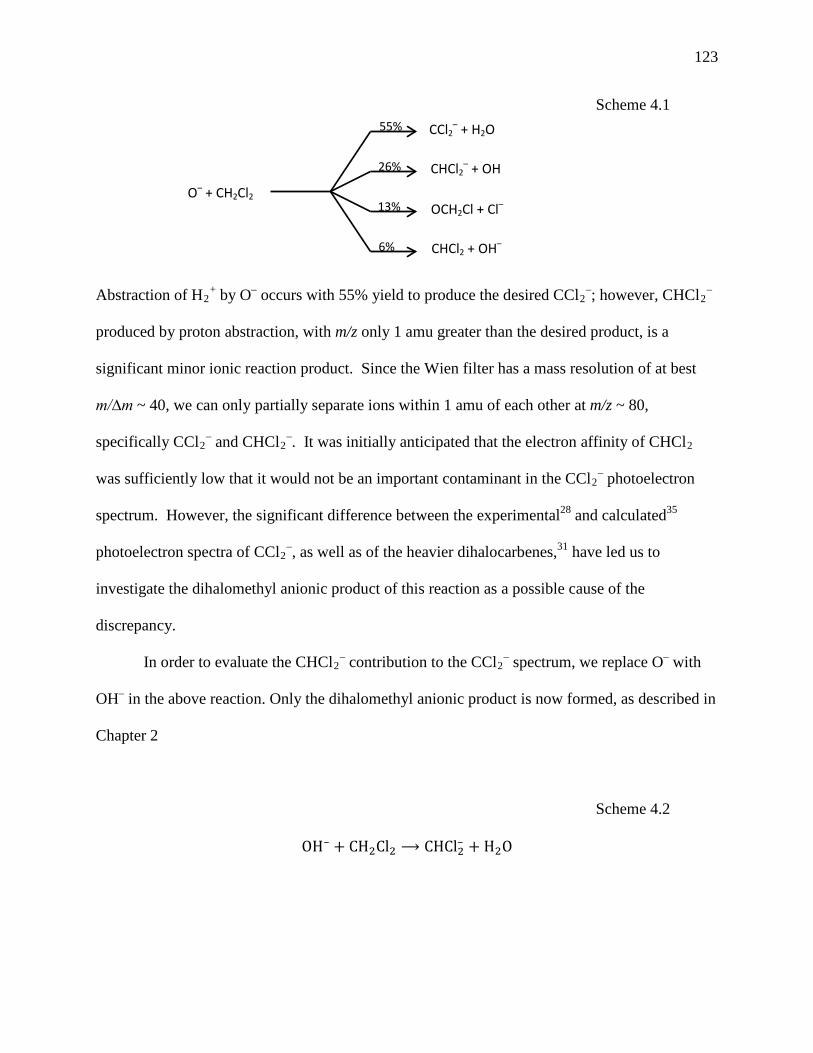
123
Scheme 4.1
Abstraction of H2+ by O– occurs with 55% yield to produce the desired CCl2
–; however, CHCl2–
produced by proton abstraction, with m/z only 1 amu greater than the desired product, is a
significant minor ionic reaction product. Since the Wien filter has a mass resolution of at best
m/∆m ~ 40, we can only partially separate ions within 1 amu of each other at m/z ~ 80,
specifically CCl2– and CHCl2
–. It was initially anticipated that the electron affinity of CHCl2
was sufficiently low that it would not be an important contaminant in the CCl2– photoelectron
spectrum. However, the significant difference between the experimental28 and calculated35
photoelectron spectra of CCl2–, as well as of the heavier dihalocarbenes,31 have led us to
investigate the dihalomethyl anionic product of this reaction as a possible cause of the
discrepancy.
In order to evaluate the CHCl2– contribution to the CCl2
– spectrum, we replace O– with
OH– in the above reaction. Only the dihalomethyl anionic product is now formed, as described in
Chapter 2
Scheme 4.2
OH– + CH2Cl2 ⟶ CHCl2– + H2O
O– + CH2Cl2
CCl2– + H2O
CHCl2– + OH
OCH2Cl + Cl–
CHCl2 + OH–
26%
13%
6%
55%
124
Sufficient methane is added to ensure complete removal of O– before CH2Cl2 is introduced into
the ion source region in order to guarantee that CHCl2– is the only species present near m/z ~ 83.
The photoelectron spectrum of CHCl2– is remarkably broad and exhibits extensive
vibrational structure, and will be analyzed further in Section 6.5. Comparison with the earlier
data shows conclusively that dihalomethyl anion contamination was present in the previously
reported photoelectron spectrum of CCl2– and is responsible for the bulk of the progression
previously attributed28 to the triplet state of CCl2. Spectra of CHBr2– and CHI2
–, similarly broad
and highly structured, overlap with the spectra of the corresponding dihalocarbene anion,
indicating that dihalomethyl anion contamination was also present in the photoelectron spectra of
CBr2– and CI2
–.28
We take several steps to obtain dihalocarbene anion photoelectron spectra with minimal
contamination. We first minimize CHX2– contribution to the contaminated spectrum by tuning
the Wien mass filter to 50% of the maximum ion signal on the low-mass side of the appropriate
unresolved mass peak. In the synthesis of CCl2–, we took the additional step of using deuterated
dichloromethane precursor (CD2Cl2) to increase the mass difference between CCl2– and CDCl2
–,
improving our ability to separate the two ions with the Wien filter. As this approach is less
effective for the heavier dihalocarbenes, CH2Br2 and CH2I2 precursors were used to make CBr2–
and CI2–, respectively. Next, the appropriately scaled authentic CHX2
– photoelectron spectrum
is subtracted from the two-component spectrum. The multiple peaks that are attributable solely
to dihalomethyl anion are used to determine the scaling factor. The final constraint is that the
scaling factor must leave the subtracted spectrum everywhere non-negative. As discussed below,

125
this procedure was applied to each of the dihalocarbenes, but the amount of new information
gained diminished for the heavier dihalocarbenes.
6.4.1 CCl2– We obtain a 351-nm photoelectron spectrum of CCl2
– that clearly resolves both the X 1A1
and a 3B1 electronic states of the carbene. By tuning the Wien filter to the low-mass side of the
mass peak containing both CCl2– and CDCl2
–, the dihalomethyl anion contribution to the
photoelectron spectrum is considerably reduced from that previously reported.28 Figure 6.1a
shows the previous 364 nm photoelectron spectrum reported by Schwartz et al.28 Figure 6.1b
depicts the new 351 nm spectrum that contains signal from both CCl2– and CDCl2
– (black trace).
The 351 nm pure CDCl2– photoelectron spectrum obtained under the same experimental
conditions is shown in red in Figure 6.2b, highlighting the contamination in the CCl2– spectrum.
There is very good overlap between the pure CDCl2– spectrum and the progression centered at
2.7 eV in the contaminated CCl2– spectrum. The contribution due to pure CDCl2
– is subtracted
from the contaminated CCl2– spectrum in Figure 6.1b to produce the clean CCl2
– photoelectron
spectrum shown in Figure 6.1a. Some residual CDCl2– contamination is seen as regular structure
between 2.5 and 2.7 eV because of the slight difference in the peak widths of the two data sets.
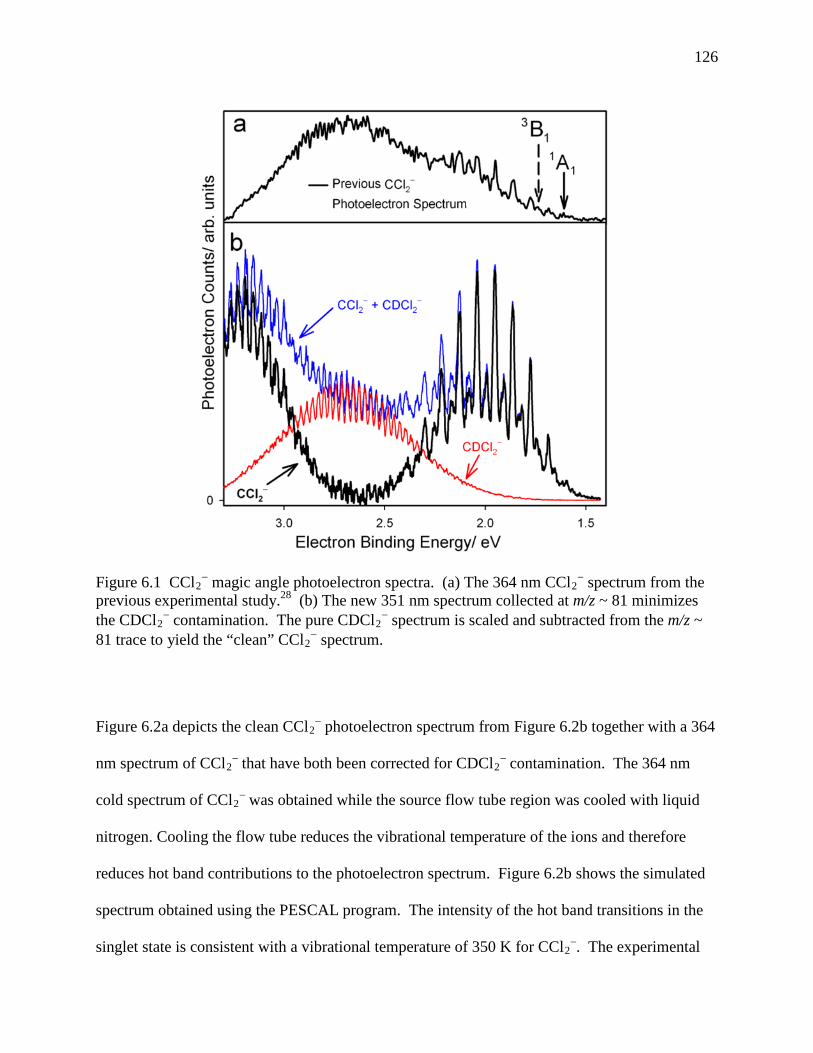
126
Figure 6.2a depicts the clean CCl2– photoelectron spectrum from Figure 6.2b together with a 364
nm spectrum of CCl2– that have both been corrected for CDCl2
– contamination. The 364 nm
cold spectrum of CCl2– was obtained while the source flow tube region was cooled with liquid
nitrogen. Cooling the flow tube reduces the vibrational temperature of the ions and therefore
reduces hot band contributions to the photoelectron spectrum. Figure 6.2b shows the simulated
spectrum obtained using the PESCAL program. The intensity of the hot band transitions in the
singlet state is consistent with a vibrational temperature of 350 K for CCl2–. The experimental
Figure 6.1 CCl2− magic angle photoelectron spectra. (a) The 364 nm CCl2
− spectrum from the previous experimental study.28 (b) The new 351 nm spectrum collected at m/z ~ 81 minimizes the CDCl2
− contamination. The pure CDCl2− spectrum is scaled and subtracted from the m/z ~
81 trace to yield the “clean” CCl2− spectrum.

127
spectra are limited to an upper binding energy of 3.3 eV because slow electrons (eKE < ~0.3 eV)
are not transmitted through the hemispherical energy analyzer. As a result, spectral features
from electrons detached near threshold lose intensity. An instrument-related sharp drop-off and
the erroneous appearance of a maximum in the Franck-Condon envelope appear at 3.2 eV, which
represents a lower limit for the triplet state VDE. The CCSD(T)/aug-cc-pVTZ calculation gives
a triplet VDE of 3.401 eV (Table 6.1), slightly beyond the usable range of our spectrometer.
The photoelectron spectrum of CCl2– in Figure 6.2a has improved energy resolution over
the previous photoelectron experiments,28 a result of several instrumental improvements and of
Figure 6.2 Analysis of the photoelectron spectrum of CCl2−. (a) The experimental magic angle
spectrum was collected at room temperature (upper trace) and at ~200 K (lower trace). (b) Simulated photoelectron spectrum computed at 350 K. The singlet and triplet origins are marked with solid and dashed arrows, respectively. Sticks represent individual vibronic transitions.

128
optimization of the ion-laser intersection position relative to the electron energy analyzer optics.
Additionally, we now resolve features at higher electron binding energy because higher photon
energy is available with 351 nm excitation and because CDCl2– contamination has been
subtracted. The origin peak of the singlet X 1A1 state is marked with a solid arrow and is seen in
both the room temperature and cold spectra. Our experimental measurement for EA(X 1A1
CCl2) of 1.593(6) eV, which includes a rotational peak shift of -4 ± 1 meV, is in good agreement
with previous experimental assignments and has improved accuracy.28, 54 The cold spectrum
shows a significant reduction in several peak intensities relative to the room temperature
spectrum. This observation, along with measured progression peak spacing, enables the
assignment of hot bands within the singlet manifold and further confirms the identity of the
origin peak.
Table 6.1 Energies of origin transitions, vertical detachment energies, and singlet-triplet splittings (ΔEST) of dihalocarbenes (eV). X 1A1 X 2B1 a
3B1 X 2B1 ΔEST (0-0) VDE (0-0) VDE
CCl2 This work 1.593(6) 2.00 2.47(20) >3.2 0.9(2) Theoretical a 1.586 1.910 2.481 3.401 0.895 CBr2 This work 1.78(10) 2.25 >1.9 -- -- Theoretical b 1.834 2.400 2.579 3.719 0.745 CI2 This work < 3 -- -- -- -- Theoretical b 2.095 2.537 2.500 3.535 0.39 a CCSD(T)/aug-cc-pVTZ. b Single-point RCCSD(T)/ECP28MWB- and ECP46MDF-basis sets31
We observe three distinct vibrational progressions in the singlet state, which are
identified in Figure 6.2a. The dominant progression arises from the symmetric stretch vibration.
A series of doublet peaks lie between the symmetric stretch peaks; the lower eBE peaks arise
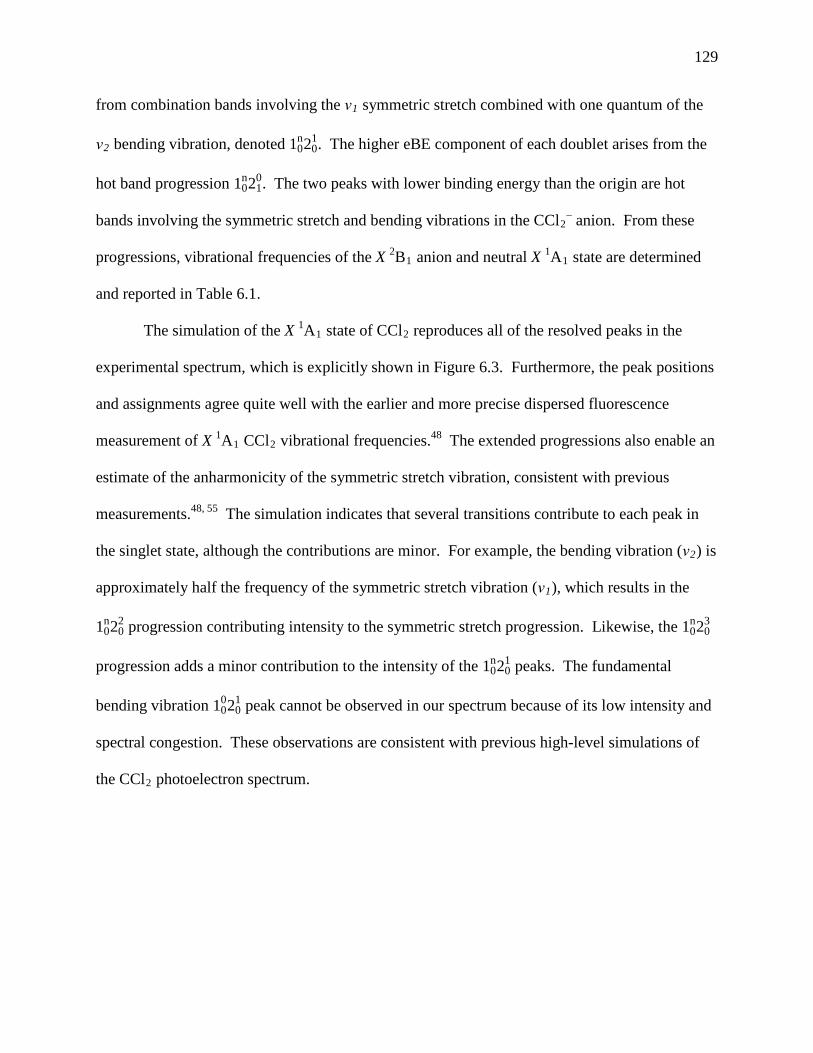
129
from combination bands involving the ν1 symmetric stretch combined with one quantum of the
ν2 bending vibration, denoted 10n20
1. The higher eBE component of each doublet arises from the
hot band progression 10n21
0. The two peaks with lower binding energy than the origin are hot
bands involving the symmetric stretch and bending vibrations in the CCl2– anion. From these
progressions, vibrational frequencies of the X 2B1 anion and neutral X 1A1 state are determined
and reported in Table 6.1.
The simulation of the X 1A1 state of CCl2 reproduces all of the resolved peaks in the
experimental spectrum, which is explicitly shown in Figure 6.3. Furthermore, the peak positions
and assignments agree quite well with the earlier and more precise dispersed fluorescence
measurement of X 1A1 CCl2 vibrational frequencies.48 The extended progressions also enable an
estimate of the anharmonicity of the symmetric stretch vibration, consistent with previous
measurements.48, 55 The simulation indicates that several transitions contribute to each peak in
the singlet state, although the contributions are minor. For example, the bending vibration (ν2) is
approximately half the frequency of the symmetric stretch vibration (ν1), which results in the
10n20
2 progression contributing intensity to the symmetric stretch progression. Likewise, the 10n20
3
progression adds a minor contribution to the intensity of the 10n20
1 peaks. The fundamental
bending vibration 10020
1 peak cannot be observed in our spectrum because of its low intensity and
spectral congestion. These observations are consistent with previous high-level simulations of
the CCl2 photoelectron spectrum.

130
We assign the broad spectral feature at higher binding energy to the a 3B1 excited state of
CCl2. The progression has an apparent onset at ~ 2.7 eV and has a Franck-Condon vibrational
envelope that extends beyond the region accessible with our apparatus. The well-structured
progression is very regular with peaks having a FWHM of 30 meV spaced by 300 cm-1. The
width is a factor of two greater than the instrument resolution, indicating that more than one
transition lies beneath each of the triplet peaks. The extended progression also indicates that a
large geometry change occurs in both the C-Cl bond length and the Cl-C-Cl bond angle when an
electron is ejected from the X 2B1 state of the anion to produce the a 3B1 state of neutral CCl2.
Calculations confirm this observation (Table 6.2), with computed differences in C-Cl bond
Figure 6.3 Expanded view of X 1A1 CCl2−. All the resolved features are identified based on
peak position, progression spacing, and agreement with the simulated spectrum. The inset is an expanded view of the origin region comparing the cooled and room temperature photoelectron spectra. The peak labels in red designate hot bands, and the solid arrows indicate the origin for X 1A1 CCl2.
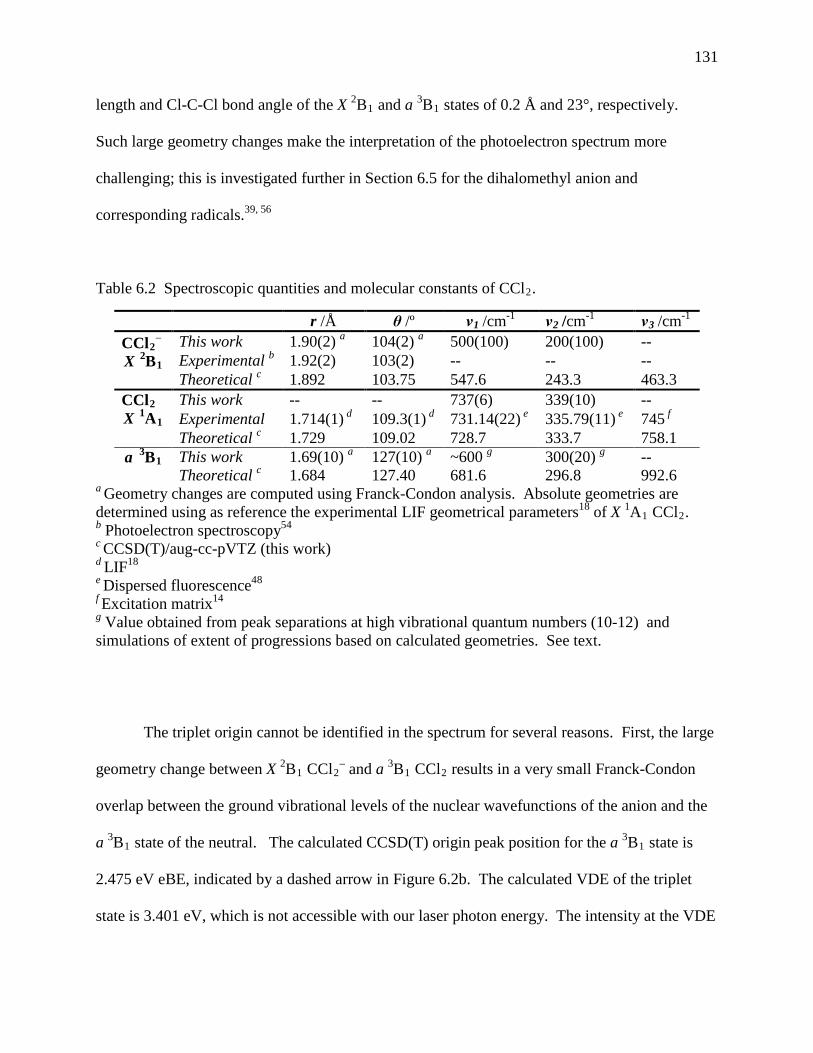
131
length and Cl-C-Cl bond angle of the X 2B1 and a 3B1 states of 0.2 Å and 23°, respectively.
Such large geometry changes make the interpretation of the photoelectron spectrum more
challenging; this is investigated further in Section 6.5 for the dihalomethyl anion and
corresponding radicals.39, 56
Table 6.2 Spectroscopic quantities and molecular constants of CCl2.
a Geometry changes are computed using Franck-Condon analysis. Absolute geometries are determined using as reference the experimental LIF geometrical parameters18 of X 1A1 CCl2. b Photoelectron spectroscopy54 c CCSD(T)/aug-cc-pVTZ (this work) d LIF18 e Dispersed fluorescence48 f Excitation matrix14 g Value obtained from peak separations at high vibrational quantum numbers (10-12) and simulations of extent of progressions based on calculated geometries. See text.
The triplet origin cannot be identified in the spectrum for several reasons. First, the large
geometry change between X 2B1 CCl2– and a 3B1 CCl2 results in a very small Franck-Condon
overlap between the ground vibrational levels of the nuclear wavefunctions of the anion and the
a 3B1 state of the neutral. The calculated CCSD(T) origin peak position for the a 3B1 state is
2.475 eV eBE, indicated by a dashed arrow in Figure 6.2b. The calculated VDE of the triplet
state is 3.401 eV, which is not accessible with our laser photon energy. The intensity at the VDE
r /Å θ /º ν1 /cm-1 ν2 /cm-1
ν3 /cm-1
CCl2−
X 2B1 This work 1.90(2) a 104(2) a 500(100) 200(100) -- Experimental b 1.92(2) 103(2) -- -- -- Theoretical c 1.892 103.75 547.6 243.3 463.3
CCl2 X 1A1
This work -- -- 737(6) 339(10) -- Experimental 1.714(1) d 109.3(1) d 731.14(22) e 335.79(11) e 745 f Theoretical c 1.729 109.02 728.7 333.7 758.1
a 3B1 This work 1.69(10) a 127(10) a ~600 g 300(20) g -- Theoretical c 1.684 127.40 681.6 296.8 992.6
132
is calculated by Franck-Condon factors to be approximately 105 times higher than that at the
origin. Based upon this estimate, the intensity of the triplet origin is too weak to be observed
with our apparatus, even if there were no other obscuring features. Additionally, the expected
triplet origin occurs at electron binding energies corresponding to the greatest interference from
the CHCl2– contaminant. Furthermore, the high energy end of the X 1A1 state progression
overlaps the low energy end of the triplet spectrum. These factors effectively render the triplet
origin unobservable.
Consequently, we must use only the shape and intensity of the a 3B1 photoelectron
spectrum to obtain an estimate of the binding energy of the triplet origin; this origin then gives
our best estimate of the singlet-triplet splitting. We simulate the a 3B1 photoelectron spectrum
using a range of origin values centered around the calculated 2.475 eV value. Simulations with
origins above 2.7 and below 2.3 eV do not reproduce the experimental features and spectral
shape without large changes in the calculated optimized geometries of the X 2B1 and a 3B1 states.
Therefore, from the agreement of the simulated spectrum with the experimental results and using
the EA determined for the X 1A1 state, we estimate ΔEST = 0.9(2) eV for CCl2. This value is
consistent with singlet-triplet splitting obtained in recent theoretical studies.31, 35, 57
Further detailed analysis of the triplet state progression provides an experimental
challenge. The observed peak widths of the resolved a 3B1 state features indicate that each peak
contains contributions from several vibrational transitions. Despite this fact, the separation
between the resolved transitions is remarkably uniform at 302(11) cm-1, a value that is consistent
with the calculated frequency of the bending vibration of 296 cm-1 and that is also approximately
half the calculated (690 cm-1) symmetric stretch frequency. Dyke et al. calculate substantial
anharmonicity in this mode, quite possibly leading to an apparent near 2:1 ratio of these
133
frequencies at the higher vibrational levels that are observed in the triplet progressions.35
Therefore, we might well expect the resultant vibrational progression to appear as a single
progression with contributions from both the bending and symmetric stretching vibrations of
a 3B1 CCl2.
Our simulations, as well as those carried out earlier by Dyke et. al,35 clearly show a single
progression of peaks containing contributions from both the bending and symmetric stretching
vibrations of a 3B1 CCl2. The transitions result from overlapping combination bands of the
bending vibrational progression built upon successive quanta of the symmetric stretch vibration.
Using our simulated spectrum and corresponding vibronic transitions, we determine the
vibrational frequencies for the symmetric stretch (~600 cm-1) and bending vibrations (~300 cm-
1), listed in Table 6.2.
6.4.2 CBr2– We report the 364 nm photoelectron spectrum of CBr2
– obtained through the reaction of
CH2Br2 with O–. As with CCl2–, both CBr2
– and CHBr2– are formed in the reaction of CH2Br2
with O– and are not separable with the Wien filter. Thus, we selectively synthesize CHBr2– by
reacting CH2Br2 with OH– and then subtract the CHBr2– contribution to the contaminated
spectrum. The photoelectron spectrum at m/z 172, taken with horizontal polarization and
containing both CBr2– and CHBr2
– is compared to the magic-angle spectrum of pure CHBr2– in
Figure 6.4a The spectrum of CHBr2– is highly structured, indicating that the signal at high eBE
in the contaminated spectrum is due to CHBr2–. This correspondence of well-defined peaks
enables subtraction of the contaminant from the spectrum. The CHBr2– spectrum is scaled to the
contaminated CBr2– spectrum, assuming that the difference between the two spectra must remain
134
positive and that all of the intensity in the high eBE peaks is due to CHBr2–. The clean
photoelectron spectrum of CBr2–, mostly free of contamination from CHBr2
–, is also shown in
Figure 6.4a. After subtraction, we observe one main progression centered at 2.3 eV that we
assign to X 1A1 CBr2. Combined with the improved spectral resolution and increased signal-to-
noise in this study, the subtraction of CHBr2– yields a CBr2
– spectrum with substantial
improvement over the previous photoelectron spectrum of CBr2– (Figure 6.4b).28
The X 1A1 state of CBr2 displays an extended vibrational progression due to the very
large difference in ∠ (Br-C-Br) bond angel between the anion and the singlet neutral, indicated
in Table 6.3. This change in geometry also results in poor Franck-Condon overlap between the
ground vibrational levels of X 2B1 CBr2– and X 1A1 CBr2, and thus we are unable to observe the
singlet origin peak in the photoelectron spectrum.

135
Franck-Condon simulations are employed to aid in the interpretation of the singlet state spectrum
(Figure 6.4c). Frequencies and anharmonicities of the singlet state were obtained from a recent
single vibronic level (SVL) emission study by Reid and co-workers,49 while parameters for the
Figure 6.4 CBr2− magic angle photoelectron spectra: A comparison of (a) the new 364 nm
spectrum with (b) the previously published 364 nm spectrum.28 The new photoelectron spectrum is collected at m/z ~ 172 and contains both CBr2 and CHBr2. The pure CHBr2
− spectrum is clearly responsible for the progression attributed to the triplet state of CBr2 in the previous spectrum. Subtraction of the CHBr2
− contribution from the m/z ~ 172 spectrum yields the corrected CBr2
− spectrum. (c) Franck-Condon simulation of the singlet state of CBr2, computed at 350 K. Sticks represent individual vibronic transitions. Solid arrows in (b) and (c) mark the singlet origin in the previous and current studies, respectively, as determined by Franck-Condon analysis. The dashed arrow in (b) marks the incorrect triplet origin assignment of the previous dihalocarbene study.28

136
anion were calculated using B3LYP/6-311++G** (Table 6.3).58 The convolution (black trace) of
the individual vibronic transitions (green sticks) reproduces the experimental photoelectron
spectrum with EA(X 1A1 CBr2) = 1.75(15) eV. The geometry change between the anion and the
neutral are determined from these simulations. Using as a reference the geometry of the singlet
neutral that was determined by the LIF excitation spectrum17 combined with ab initio
calculations,59 we determine the geometry of X 2B1 CBr2– (Table 6.3): the C-Br bond length is
2.09(2) Å, with a BrCBr bond angle of 105(4)º.
Table 6.3 Spectroscopic quantities and molecular constants of CBr2.
a B3LYP/6-311++G** (this work) b Geometry changes are computed using Franck-Condon analysis. Absolute geometries are determined using as reference the experimental LIF geometrical parameters17 of CBr2 X 1A1. c Combined LIF17 and Theory59 d Single Vibronic Level Emission49 e CCSD(T)/cc-pVTZ31
Franck-Condon simulations reveal that the progression arising from X 1A1 of CBr2
results from overlapping combination bands of the bend built upon successive quanta of the
symmetric stretch vibration. The simulated stick spectrum is in good agreement with the peak
positions of the X 1A1 manifold observed by SVL emission.49 The frequency of the symmetric
stretch vibration is approximately three times that of the bend, so the spacing between peaks in
r /Å θ /º ν1 /cm-1 ν2 /cm-1
ν3 /cm-1
CBr2−
X 2B1 This work 2.09(2) b 105(4) b -- -- -- Theoretical a 2.100 106.36 455.8 129.7 365.8
CBr2 X 1A1
This work -- -- 600(50) 200(50) -- Experimental 1.865 c 110.7 c 606.6(4) d 199.5 d 679.8(7) d Theoretical e 1.898 110.0 601.6 196.6 655.3
a 3B1 This work -- -- -- -- -- Theoretical e 1.839 129.5 533.6 185.4 878.7

137
the photoelectron spectrum roughly corresponds to the frequency of the bending vibration.
Analysis of the spectral peak positions supports a bending frequency of approximately 200 cm-1,
with an uncertainty on the order of the peak width (100 cm-1).
It is unclear whether we have any evidence of the triplet state of CBr2 in the
photoelectron spectrum. Upon subtraction of the CHBr2– photoelectron spectrum from the
contaminated CBr2– spectrum, some residual intensity remains at binding energies greater than
2.6 eV (Figure 6.4a). Because the fractional CHBr2– contribution in this region is large and
because all of the maxima in the subtracted spectrum occur at very nearly the same energy as
CHBr2– contaminant peaks, we must consider this residual intensity above 2.6 eV EBE to be an
artifact of the subtraction. Unfortunately, unlike the CCl2– spectrum in which the CHCl2
– peak
appears in the valley between the singlet and triplet states of CCl2, the CHBr2– contamination—
and thus the residual intensity—occurs in the region we expect to see the triplet. Dyke and co-
workers predict the a 3B1 origin to be 2.579 eV with a VDE of 3.719 eV (Table 6.1).31 Franck-
Condon simulations, shown in Figure 6.5, of the a 3B1 CBr2 spectrum using molecular constants
calculated by Dyke et al.31 reproduce the peak spacing of the residual features; however, this
peak spacing is also the same (within 15 cm-1) as that of the contaminant CHBr2–. Thus, the fact
that the contaminant ion completely overlaps the region in which we expect to see the triplet,
along with the similarity in CHBr2 and the predicted a 3B1 CBr2 vibrational progressions,
conspire to prevent a definitive assignment of the residual peaks. It is clear, however, that the
previous a 3B1 origin assignment was incorrect, and the ΔEST of CBr2 is greater than previously
reported.28
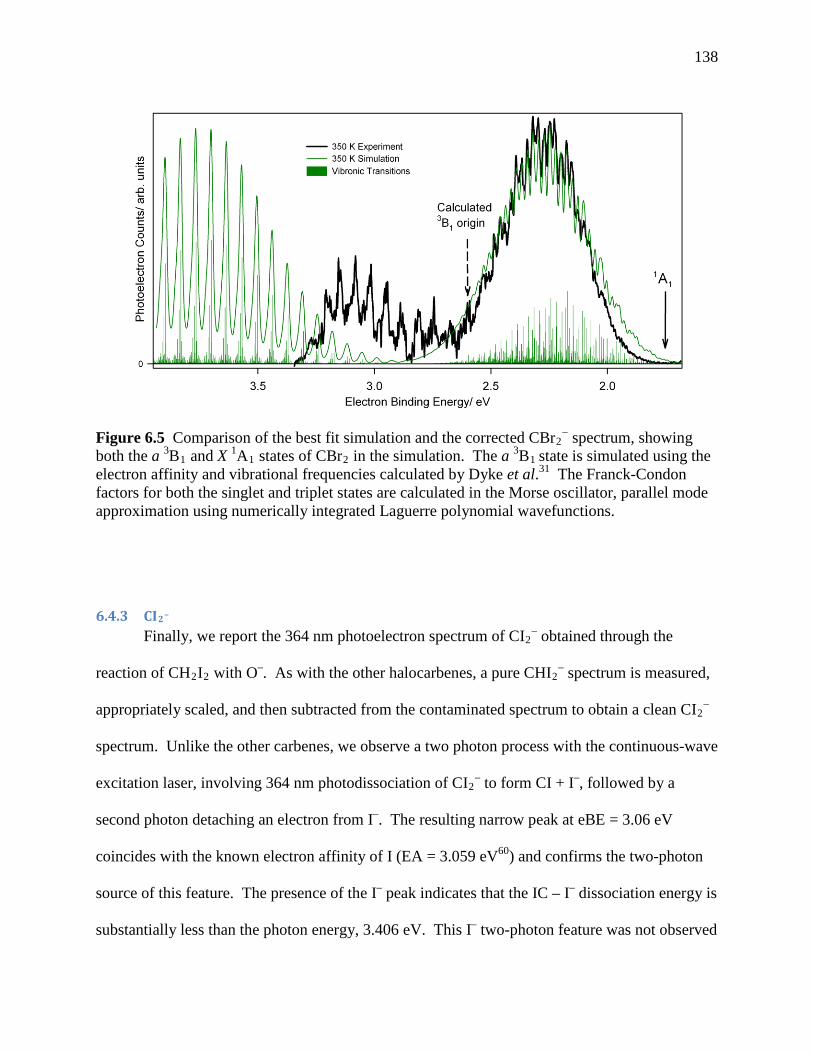
138
6.4.3 CI2– Finally, we report the 364 nm photoelectron spectrum of CI2
– obtained through the
reaction of CH2I2 with O–. As with the other halocarbenes, a pure CHI2– spectrum is measured,
appropriately scaled, and then subtracted from the contaminated spectrum to obtain a clean CI2–
spectrum. Unlike the other carbenes, we observe a two photon process with the continuous-wave
excitation laser, involving 364 nm photodissociation of CI2– to form CI + I–, followed by a
second photon detaching an electron from I–. The resulting narrow peak at eBE = 3.06 eV
coincides with the known electron affinity of I (EA = 3.059 eV60) and confirms the two-photon
source of this feature. The presence of the I– peak indicates that the IC – I– dissociation energy is
substantially less than the photon energy, 3.406 eV. This I– two-photon feature was not observed
Figure 6.5 Comparison of the best fit simulation and the corrected CBr2− spectrum, showing
both the a 3B1 and X 1A1 states of CBr2 in the simulation. The a 3B1 state is simulated using the
electron affinity and vibrational frequencies calculated by Dyke et al.31 The Franck-Condon factors for both the singlet and triplet states are calculated in the Morse oscillator, parallel mode approximation using numerically integrated Laguerre polynomial wavefunctions.
139
in the previous photoelectron spectrum28 (Figure 6.6b), presumably because the laser power in
the previous work—a factor of four lower than that used in the present study—was insufficient
to make this two-photon process significant. Similar two-photon processes have been observed
in anion photoelectron spectroscopy of O3–, Ni3
–, and Au3–.50, 61, 62 We speculate that 364 nm
radiation might produce CX – X– photodissociation in CCl2– and CBr2
–, as well. However, we
are unable to observe Cl– or Br– photodissociation products because the electron affinity of Cl
(EA = 3.613 eV63) exceeds the laser photon energy, and 351 nm photodetachment of Br–
(EA(Br) = 3.364 eV64) produces electrons with kinetic energy that is too low to be transmitted
through the hemispherical electron analyzer.

140
The photoelectron spectrum is dominated by CHI2–, which has a broad spectral band
spanning approximately 1 eV. As seen in Figure 6.6a, there is some residual structure left after
the subtraction of CHI2– features at binding energies below 3 eV. As with CBr2
–, the residual
peaks mimic the CHI2– spectrum. The remaining broad, structureless feature is attributed to CI2
–
, but the lack of resolved features and limited electron energy range preclude any further
assignment. Calculations performed by Dyke et al. predict the electron affinity of CI2 to be 2.1
eV and the a 3B1 origin to be 2.5 eV with a VDE of 3.5 eV.31 After the subtraction of the CHI2
Figure 6.6 CI2− 364 nm photoelectron spectra: A comparison of (a) the new magic angle
spectrum and (b) the previously published spectrum.28 The previous singlet and triplet origin assignments are marked with solid and dashed arrows, respectively, in (b). The photoelectron spectrum collected at m/z ~ 266 contains both CI2 and CHI2. The pure CHI2
− spectrum is clearly responsible for the progression attributed to the triplet state of CI2 in the previous spectrum.28 Subtraction of the CHI2
− contribution from the m/z ~ 266 spectrum yields the corrected CI2−
spectrum.
141
progression, we find no significant photoelectron signal below 3.0 eV, and can only claim that
EA(CI2) < 3 eV. It is clear that the previous origin assignments28 for the CI2 singlet and triplet
states were actually components of the CHI2– photoelectron spectrum, and the assignments were
incorrect
6.5 Results and Discussion: Dihalomethyl Anions (CHX2–)
One of the key reasons why the contamination of the dihalocarbene photoelectron spectra
went undetected for nearly ten years was the lack of any experimental photoelectron spectra of
the dihalomethyl anions. Though the CHX2‒ spectra are shown in the previous sections, these
were mainly used to subtract their contribution from the spectra of the CX2‒ anions. This section
focuses on what we can experimentally learn about the dihalomethyl anions and corresponding
radicals.
Even though the dihalomethyl anions and radicals contain only four atoms, analysis of
the experimental spectra is very challenging due to the large geometry change between the anion
and neutral. We have dedicated a considerable amount of effort analyzing and modeling the
dihalomethyl spectra in an attempt to extract the spectroscopic information one hopes to obtain
using photoelectron spectroscopy.39 Furthermore, we investigate how the normal mode analysis
that is generally used to model photoelectron spectra is inadequate for molecular systems where
there is significant mode-coupling present, as well when there is a large geometry change
between the anion and neutral. Thus, a more sophisticated methodology is required to model and
simulate the photoelectron spectra, which accounts for mode coupling and the anharmonic nature
of the anion and neutral potential energy surfaces.
The photoelectron spectra of the three dihalomethyl anions (CHCl2–, CHBr2
–, CHI2–) and
their deuterated analogs are shown in Figure 6.7. The spectra exhibit extended, partially
142
resolved vibrational progressions that arise from the large geometry change that takes place
when an electron is detached from the pyramidal anion, producing an essentially planar neutral
radical. This large geometry change and the broad vibrational progression are analogous to the
triplet state of CCl2, which also has an extended vibrational progression with no measurable
intensity at the origin. From the Franck-Condon simulations (shown for CDCl2– in Figure 6.10),
the origin transition is calculated to have approximately 10–5 the intensity of the peak at the VDE.
Thus, the origin will not be experimentally observable. Even though the origin cannot be
directly measured, the observed VDE of each dihalomethyl radical can be readily determined
from the spectra in Figure 6.7. These measured VDE’s are in good agreement with the
calculated values.65 Furthermore, the calculated EAs are consistent with previous experimental
EA determinations of CHCl2 and CHBr2 (Table 6.4).66 This provides us with confidence that
electronic structure calculations can be used to accurately describe the electronic energies of
these species.

143
The calculated VDEs, computed by subtracting the energy of the anion from the energy
of the neutral at the equilibrium geometry of the anion, agree reasonably well with the measured
VDEs of the dihalomethyl anions, as shown in Table 6.4 The calculation of the difference in
energy between the VDE and the EA should be fairly accurate for the rigid dihalomethyl anions.
Therefore, an estimate for the EA can be obtained using the following equation:
Figure 6.7 Experimental photoelectron spectra of the dihalomethyl anions (a) CHCl2−, (b)
CHBr2−, (c) CHI2
−, (d) CDCl2−, (e) CDBr2
−, and (f) CDI2−. The calculated (B3LYP/6-
311++G(d,p)) adiabatic electron affinity (EA) for each dihalomethyl radical is marked with a labeled arrow.

144
Equation 6.1 EAest = VDEexp – [VDEcalc – EAcalc]
where
Equation 6.2 VDEcalc = E(neutral at anion eqm geometry) – E(anion at anion eqm geometry)
and
Equation 6.3 EAcalc = E(neutral at neutral eqm geometry) – E(anion at anion eqm geometry)
The results of the EA estimates using Equation 6.1 are summarized in Table 6.4. Our
estimates are consistent with the previous EA determinations of CHCl2 and CHBr2.66 The
simulations and calculations for the photoelectron spectra presented in Figure 6.10 employ the
EA estimates for the CHCl2 and CDCl2 radicals, listed in Table 6.4
Table 6.4 The experimental and calculated [CCSD(T)/aug-cc-pVDZ for CHCl2(CDCl2) and B3LYP/6-311++G(d,p) for CHBr2(CDBr2) and CHI2(CDI2)] electron affinity (EA) and vertical detachment energy (VDE) for each of the dihalomethyl radicals. Basis sets and pseudopotentials for Br and I were developed by Stoll et al.67, 68
CHCl2 CDCl2 CHBr2 CDBr2 CHI2 CDI2
EA/ eV Experiment 1.3(2)a
1.47(4)b
1.3(2)a 1.9(2)a
1.71(8)b
1.9(2)a 1.9(2)a 1.9(2)a
Calculation 1.430 1.433 1.744 1.747 1.820 1.826
VDE/ eV Experiment 2.6487 2.6815 3.0181 3.0171 2.8287 2.9057
Calculation 2.8621 2.8630 2.8829 2.8836 2.8271 2.8271 a Estimates of EA were obtained by subtracting the calculated difference in energy between the VDE and the EA (VDEcalc – EAcalc) from the experimentally measured VDE using Equation 6.1. b Experiment, Fourier transform ion cyclotron resonance mass spectrometry66
145
One of the most striking features of the spectra in Figure 6.7 is the observed regular peak
spacing and the dramatic affect that deuteration has on the structure of the vibrational
progression. There are several indications that the structure in the spectra does not result from a
single vibrational progression and instead arises from multiple active vibrational modes with
several vibronic transitions lying under each peak. First, the spacing between the peaks in the
spectrum of CDCl2− (230 cm-1) does not correspond to the calculated frequency of any of the
symmetric vibrational modes. Out of the 6 vibrational modes in CDCl2−, only 4 are totally
symmetric, with the lowest frequency mode (the HCCl symmetric stretch) calculated to be ~ 300
cm-1. Second, isotopic substitution has an unexpected effect on the spectrum of CHCl2−. The
spectrum generally becomes more congested upon deuteration, as seen in the spectra of CHBr2−
and, to a lesser extent, of CHI2−. However, the spectrum of CDCl2
− has more resolved structure
than that of CHCl2−, implying that the observed structure is due to accidental resonance among
two or more vibrational modes, rather than to a single vibrational progression. Also, the peak
widths near the VDE are at least 20 meV, significantly greater than our experimental resolution
of about 12 meV; this is particularly true for CHCl2− and CDCl2
− where the cooled ions should
have minimal broadening from hot band transitions. Furthermore, the modulation depth of the
peaks and the peak spacings change across the progression, a result of anharmonicity causing the
vibronic transitions to move into and out of resonance.
Although the spectra show that multiple active vibrational modes give rise to the
observed structure, the similarity of the CHBr2− and CHI2
− spectra suggests that the out-of-plane
bend is active, and that the spacing of the peaks roughly corresponds to the frequency of this
motion in the neutral species. In CHBr2 the average peak spacing is 520(30) cm-1, and in CHI2 it
is 440(40) cm-1 near the VDE.
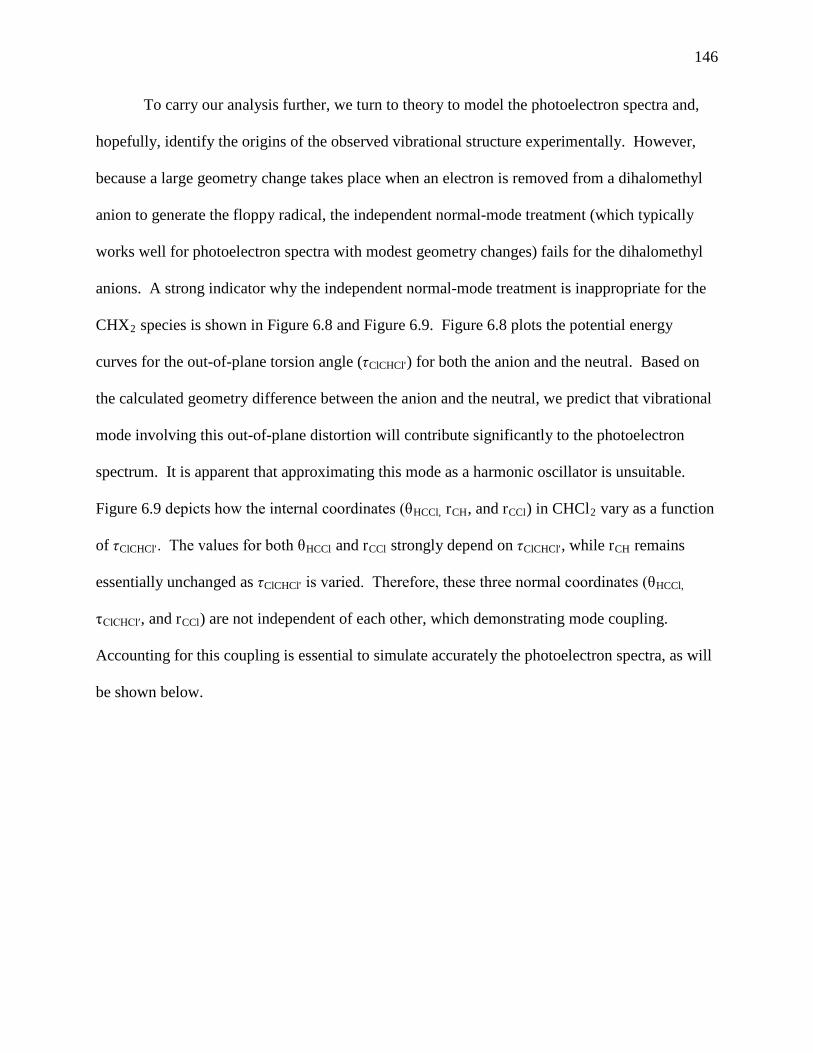
146
To carry our analysis further, we turn to theory to model the photoelectron spectra and,
hopefully, identify the origins of the observed vibrational structure experimentally. However,
because a large geometry change takes place when an electron is removed from a dihalomethyl
anion to generate the floppy radical, the independent normal-mode treatment (which typically
works well for photoelectron spectra with modest geometry changes) fails for the dihalomethyl
anions. A strong indicator why the independent normal-mode treatment is inappropriate for the
CHX2 species is shown in Figure 6.8 and Figure 6.9. Figure 6.8 plots the potential energy
curves for the out-of-plane torsion angle (τClCHCl') for both the anion and the neutral. Based on
the calculated geometry difference between the anion and the neutral, we predict that vibrational
mode involving this out-of-plane distortion will contribute significantly to the photoelectron
spectrum. It is apparent that approximating this mode as a harmonic oscillator is unsuitable.
Figure 6.9 depicts how the internal coordinates (θHCCl, rCH, and rCCl) in CHCl2 vary as a function
of τClCHCl'. The values for both θHCCl and rCCl strongly depend on τClCHCl', while rCH remains
essentially unchanged as τClCHCl' is varied. Therefore, these three normal coordinates (θHCCl,
τClCHCl′, and rCCl) are not independent of each other, which demonstrating mode coupling.
Accounting for this coupling is essential to simulate accurately the photoelectron spectra, as will
be shown below.
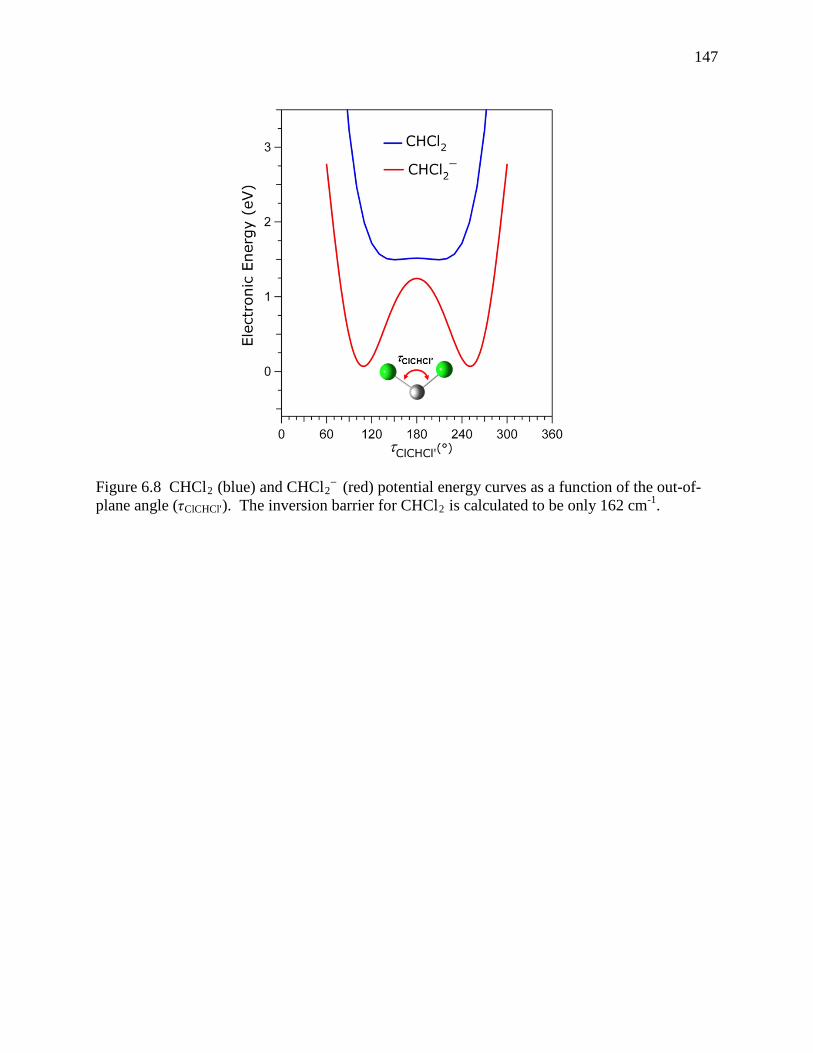
147
Figure 6.8 CHCl2 (blue) and CHCl2– (red) potential energy curves as a function of the out-of-
plane angle (τClCHCl'). The inversion barrier for CHCl2 is calculated to be only 162 cm-1.
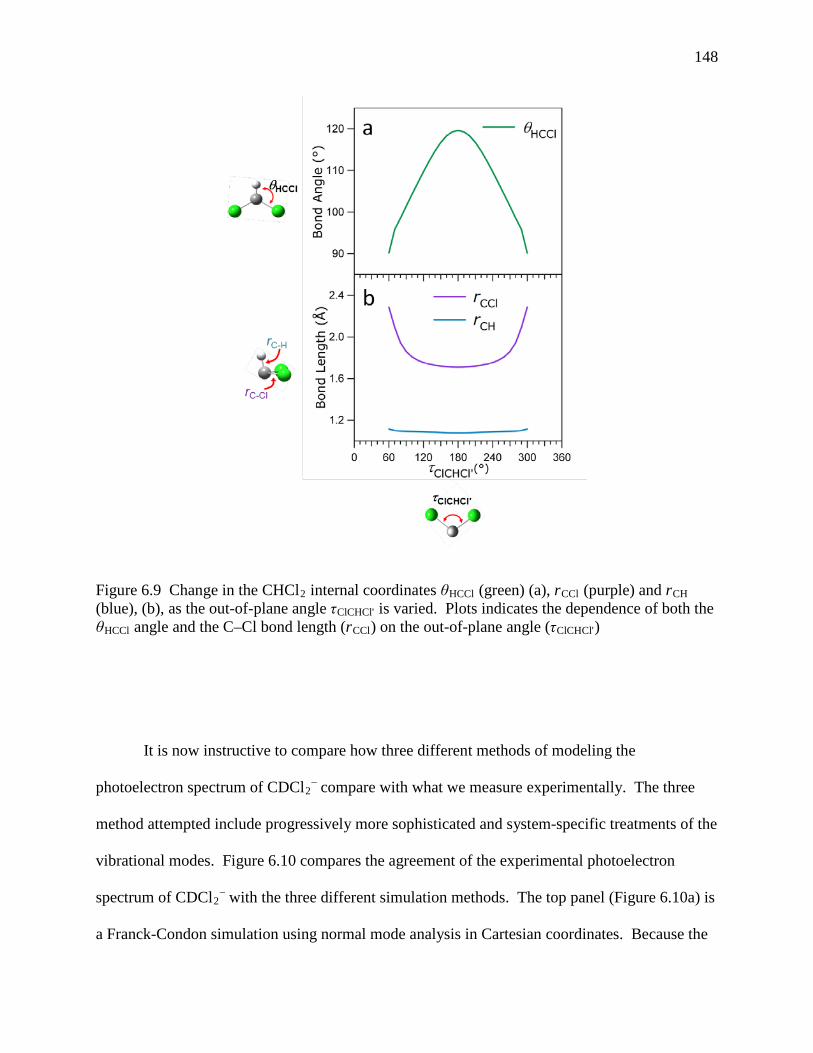
148
It is now instructive to compare how three different methods of modeling the
photoelectron spectrum of CDCl2– compare with what we measure experimentally. The three
method attempted include progressively more sophisticated and system-specific treatments of the
vibrational modes. Figure 6.10 compares the agreement of the experimental photoelectron
spectrum of CDCl2– with the three different simulation methods. The top panel (Figure 6.10a) is
a Franck-Condon simulation using normal mode analysis in Cartesian coordinates. Because the
Figure 6.9 Change in the CHCl2 internal coordinates θHCCl (green) (a), rCCl (purple) and rCH (blue), (b), as the out-of-plane angle τClCHCl' is varied. Plots indicates the dependence of both the θHCCl angle and the C–Cl bond length (rCCl) on the out-of-plane angle (τClCHCl')

149
normal mode method for modeling photoelectron spectra has proven so powerful in the past and
works well for the dihalocarbenes,38, 69, 70 we first employ a Franck-Condon analysis using
normal modes based in Cartesian coordinates to interpret the photoelectron spectra of the
dihalomethyl anions. This method completely fails to reproduce the spectral envelope of the
observed CDCl2– spectrum. The simulations for the other dihalomethyl anions suffer from the
same broad progressions shown in Figure 6.10a.
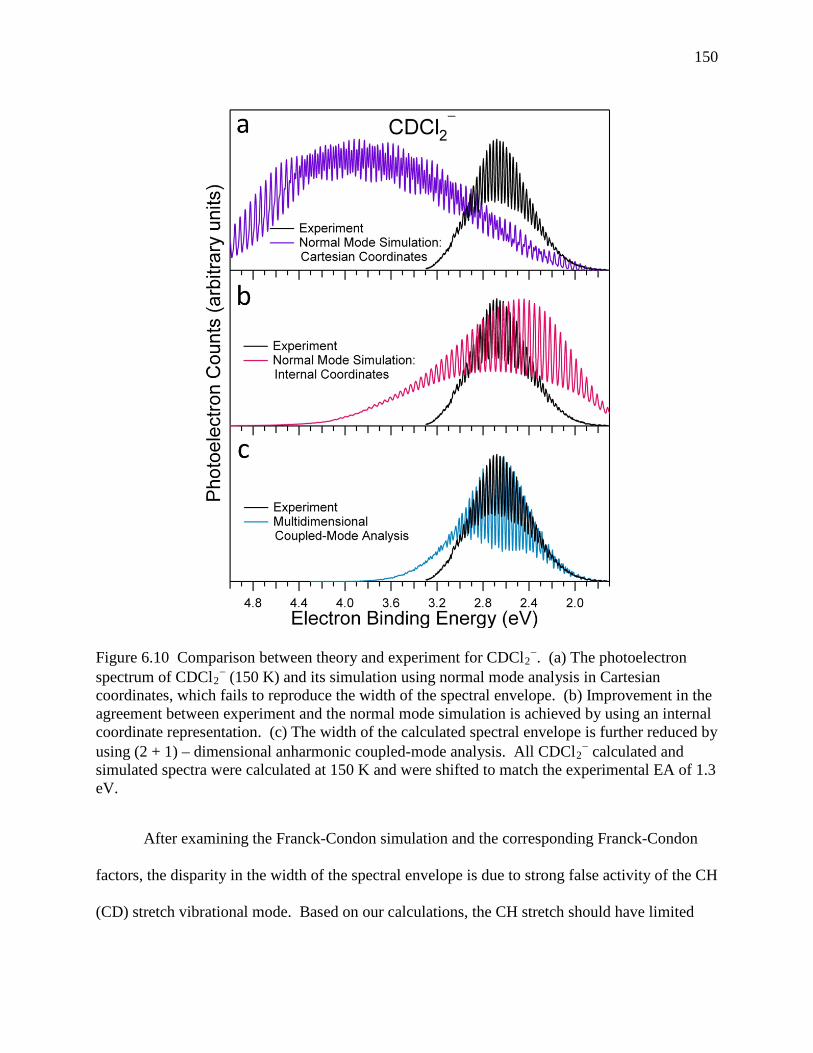
150
After examining the Franck-Condon simulation and the corresponding Franck-Condon
factors, the disparity in the width of the spectral envelope is due to strong false activity of the CH
(CD) stretch vibrational mode. Based on our calculations, the CH stretch should have limited
Figure 6.10 Comparison between theory and experiment for CDCl2−. (a) The photoelectron
spectrum of CDCl2− (150 K) and its simulation using normal mode analysis in Cartesian
coordinates, which fails to reproduce the width of the spectral envelope. (b) Improvement in the agreement between experiment and the normal mode simulation is achieved by using an internal coordinate representation. (c) The width of the calculated spectral envelope is further reduced by using (2 + 1) – dimensional anharmonic coupled-mode analysis. All CDCl2
− calculated and simulated spectra were calculated at 150 K and were shifted to match the experimental EA of 1.3 eV.

151
activity as there is a very small change in the C–H bond length from CDCl2– to neutral CDCl2.
It appears that the only manner in which the rectilinear Cartesian coordinates can reproduce the
large geometry change is by erroneous displacement in the CH stretch normal mode coordinate,
in combination with other modes. This type of mode mixing has been observed previously with
other molecules undergoing large geometry changes upon photodetachement (including c-C4F8
in this thesis) .71-75 In particular, a large geometry displacement in one Cartesian coordinate is
partially projected (or mixed) onto the other coordinates, resulting in the appearance of
vibrational progressions in the computed spectrum that are not experimentally observed.
In order to better represent the vibrational displacement between the anion and the neutral
in the CHX2 system, we next simulate the photoelectron spectrum based on a normal mode
analysis using internal displacement coordinates (bond lengths and angles). Internal coordinates
more naturally represent the vibrational potential energy surfaces and are less prone to induce
artificial mixing between modes. The simulation using internal coordinates is shown in Figure
6.10b. The calculated spectral width has been substantially reduced compared to the simulation
using Cartesian coordinates. However, the spectral envelopes from the simulation using internal
coordinates still inadequately model the experimental spectrum. A lingering issue is that the
large difference in the equilibrium geometries and bonding between the anion and the neutral
cause the normal modes of the neutral to be characteristically different than those of the anion.
When we express the normal modes of the neutral in terms of the harmonic normal mode
vibrations of the anion, the orthogonality of the neutral normal modes is lost causing mode
mixing. Additionally, this method still fails to address the issue of mode coupling which we
know is present in the dihalomethyl systems from Figure 6.9.
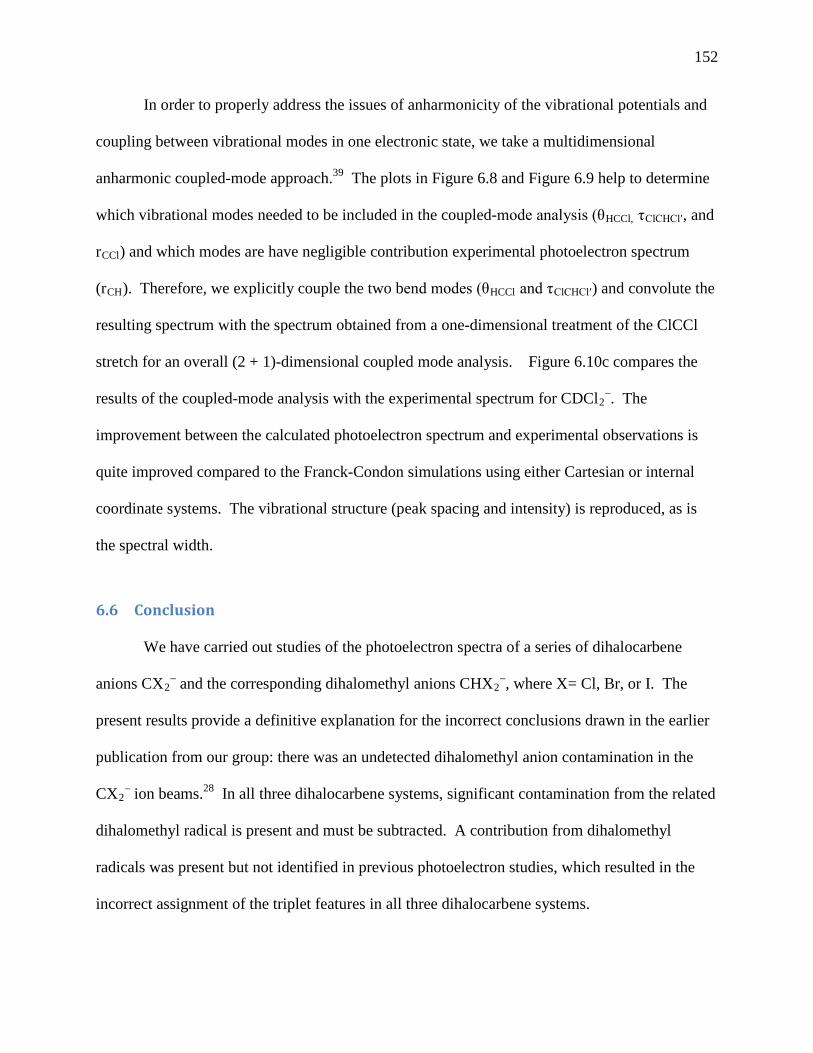
152
In order to properly address the issues of anharmonicity of the vibrational potentials and
coupling between vibrational modes in one electronic state, we take a multidimensional
anharmonic coupled-mode approach.39 The plots in Figure 6.8 and Figure 6.9 help to determine
which vibrational modes needed to be included in the coupled-mode analysis (θHCCl, τClCHCl′, and
rCCl) and which modes are have negligible contribution experimental photoelectron spectrum
(rCH). Therefore, we explicitly couple the two bend modes (θHCCl and τClCHCl′) and convolute the
resulting spectrum with the spectrum obtained from a one-dimensional treatment of the ClCCl
stretch for an overall (2 + 1)-dimensional coupled mode analysis. Figure 6.10c compares the
results of the coupled-mode analysis with the experimental spectrum for CDCl2–. The
improvement between the calculated photoelectron spectrum and experimental observations is
quite improved compared to the Franck-Condon simulations using either Cartesian or internal
coordinate systems. The vibrational structure (peak spacing and intensity) is reproduced, as is
the spectral width.
6.6 Conclusion
We have carried out studies of the photoelectron spectra of a series of dihalocarbene
anions CX2– and the corresponding dihalomethyl anions CHX2
–, where X= Cl, Br, or I. The
present results provide a definitive explanation for the incorrect conclusions drawn in the earlier
publication from our group: there was an undetected dihalomethyl anion contamination in the
CX2– ion beams.28 In all three dihalocarbene systems, significant contamination from the related
dihalomethyl radical is present and must be subtracted. A contribution from dihalomethyl
radicals was present but not identified in previous photoelectron studies, which resulted in the
incorrect assignment of the triplet features in all three dihalocarbene systems.
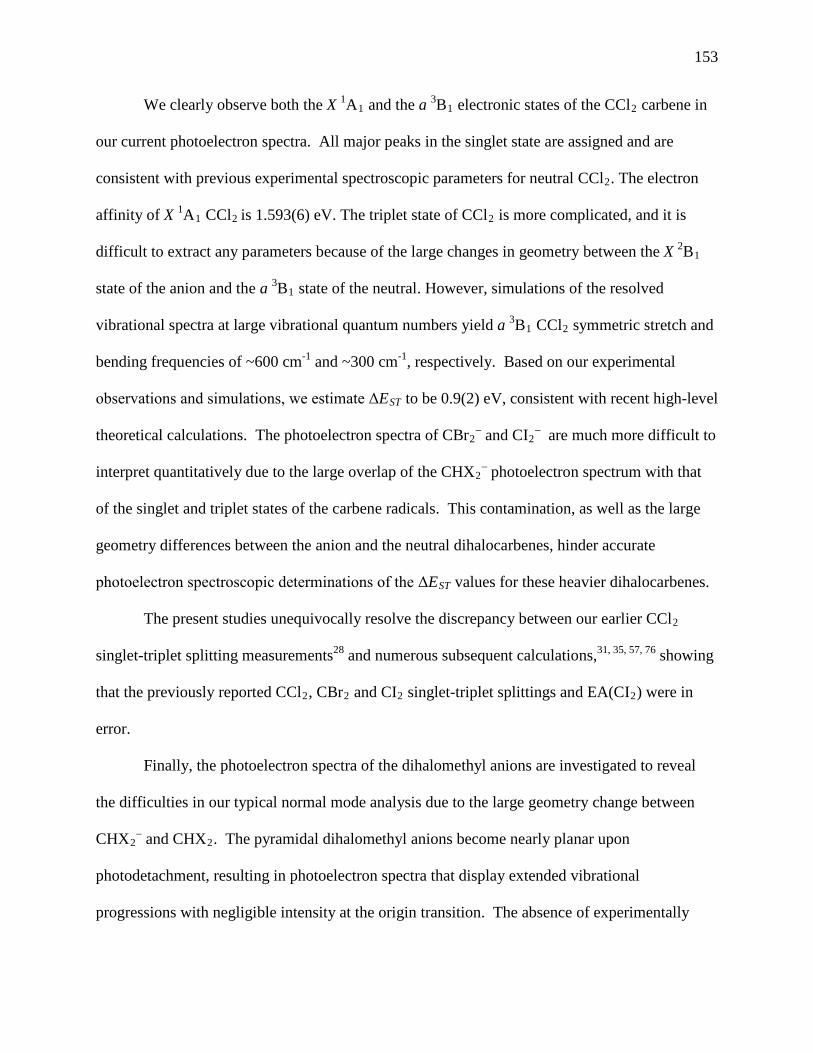
153
We clearly observe both the X 1A1 and the a 3B1 electronic states of the CCl2 carbene in
our current photoelectron spectra. All major peaks in the singlet state are assigned and are
consistent with previous experimental spectroscopic parameters for neutral CCl2. The electron
affinity of X 1A1 CCl2 is 1.593(6) eV. The triplet state of CCl2 is more complicated, and it is
difficult to extract any parameters because of the large changes in geometry between the X 2B1
state of the anion and the a 3B1 state of the neutral. However, simulations of the resolved
vibrational spectra at large vibrational quantum numbers yield a 3B1 CCl2 symmetric stretch and
bending frequencies of ~600 cm-1 and ~300 cm-1, respectively. Based on our experimental
observations and simulations, we estimate ΔEST to be 0.9(2) eV, consistent with recent high-level
theoretical calculations. The photoelectron spectra of CBr2– and CI2
– are much more difficult to
interpret quantitatively due to the large overlap of the CHX2– photoelectron spectrum with that
of the singlet and triplet states of the carbene radicals. This contamination, as well as the large
geometry differences between the anion and the neutral dihalocarbenes, hinder accurate
photoelectron spectroscopic determinations of the ΔEST values for these heavier dihalocarbenes.
The present studies unequivocally resolve the discrepancy between our earlier CCl2
singlet-triplet splitting measurements28 and numerous subsequent calculations,31, 35, 57, 76 showing
that the previously reported CCl2, CBr2 and CI2 singlet-triplet splittings and EA(CI2) were in
error.
Finally, the photoelectron spectra of the dihalomethyl anions are investigated to reveal
the difficulties in our typical normal mode analysis due to the large geometry change between
CHX2– and CHX2. The pyramidal dihalomethyl anions become nearly planar upon
photodetachment, resulting in photoelectron spectra that display extended vibrational
progressions with negligible intensity at the origin transition. The absence of experimentally

154
observable origins in the spectra and the inability to accurately reproduce the spectral envelopes
preclude the direct determination of EAs or vibrational frequencies of the dihalomethyl anions in
this study. While normal mode analysis accurately simulates the spectra of molecules that
experience small displacements of equilibrium nuclear configurations upon photodetachment,
false activity of the CH stretch is predicted in the dihalomethyl radicals when a Cartesian
displacement coordinate system is employed. Therefore, more sophisticated analysis is required
which accounts for mode coupling and the anharmonic nature of the anion and neutral potential
energy surfaces. This work illustrates that we cannot treat the vibrational normal modes in the
CHX2 class of molecules as separable, nor can we compute the Franck-Condon factors as a
product of harmonic oscillators.
6.7 References
1. Kirmse, W., Carbene Chemistry1971, New York: Academic Press.
155
2. Moss, R.A. and M. Jones, eds. Carbenes. ed. R.A. Moss and M. Jones. Vol. 2. 1975, Wiley: New York.
3. Moss, R.A. and M. Jones, eds. Reactive Intermediates. 1978, Wiley: New York.
4. Borden, W.T., ed. Diradicals. 1982, Wiley: New York.
5. Carl Lineberger, W. and W. Thatcher Borden, The synergy between qualitative theory, quantitative calculations, and direct experiments in understanding, calculating, and measuring the energy differences between the lowest singlet and triplet states of organic diradicals. Physical Chemistry Chemical Physics, 2011. 13(25): p. 11792-11813.
6. Andrews, L., Infrared Spectrum of Dichlorocarbene in Solid Argon. J. Chem. Phys., 1968. 48(3): p. 979.
7. Clouthier, D.J. and J. Karolczak, Pyrolysis Jet Spectroscopy - Rotationally Resolved Electronic-Spectrum of Dichlorocarbene. J. Phys. Chem., 1989. 93(22): p. 7542-7544.
8. Tevault, D.E. and L. Andrews, Laser-Induced Fluorescence-Spectrum of Argon Matrix-Isolated Dichlorocarbene. J. Mol. Spec., 1975. 54(1): p. 110-120.
9. Bondybey, V.E. and J.H. English, Laser Excitation-Spectra and Lifetimes of CBrCl and CBr2 in Solid Ar. J. Mol. Spec., 1980. 79(2): p. 416-423.
10. Choe, J.I., S.R. Tanner, and M.D. Harmony, Laser-Excitation Spectrum and Structure of CCl2 in a Free-Jet Expansion from a Heated Nozzle. J. Mol. Spec., 1989. 138(2): p. 319-331.
11. Fujitake, M. and E. Hirota, The Millimeter-Wave and Submillimeter-Wave Spectrum of Dichlorocarbene CCl2 - Electronic-Structure Estimated from the Nuclear-Quadrupole Coupling-Constants. J. Chem. Phys., 1989. 91(6): p. 3426-3430.
12. Xu, S.L. and M.D. Harmony, Halocarbene Production in Free-Jet Expansions from a Hot Nozzle. Chem. Phys. Lett., 1993. 205(6): p. 502-507.
13. Ivey, R.C., et al., Electron-Diffraction Study of Structure of Dibromomethylene Radical. J. Chem. Phys., 1974. 60(8): p. 3174-3177.
14. Bondybey, V.E., Emission and Excitation-Spectra of CCl2 in Solid Argon. J. Mol. Spec., 1977. 64(2): p. 180-183.
15. Zhou, S.K., et al., Gas-Phase Spectrum of Dibromocarbene Studied by Laser-Induced Fluorescence. Chem. Phys. Lett., 1990. 166(5-6): p. 547-550.
16. Schlachta, R., et al., Laser-Induced Fluorescence Excitation Spectrum of Supersonically Cooled Bromochlorocarbene in the Gas-Phase. J. Phys. Chem., 1991. 95(19): p. 7132-7134.
17. Xu, S.L. and M.D. Harmony, LIF Excitation Spectrum of Dibromocarbene in a Supersonic Free-Jet Expansion. J. Phys. Chem., 1993. 97(29): p. 7465-7470.
18. Clouthier, D.J. and J. Karolczak, A Pyrolysis Jet Spectroscopic Study of the Rotationally Resolved Electronic-Spectrum of Dichlorocarbene. J. Chem. Phys., 1991. 94(1): p. 1-10.
19. Carter, E.A. and W.A. Goddard, Relation between Singlet Triplet Gaps and Bond-Energies. J. Phys. Chem., 1986. 90(6): p. 998-1001.
156
20. Carter, E.A. and W.A. Goddard, New Predictions for Singlet Triplet Gaps of Substituted Carbenes. J. Phys. Chem., 1987. 91(18): p. 4651-4652.
21. Carter, E.A. and W.A. Goddard, Correlation-Consistent Singlet Triplet Gaps in Substituted Carbenes. J. Chem. Phys., 1988. 88(3): p. 1752-1763.
22. Gutsev, G.L. and T. Ziegler, Theoretical-Study on Neutral and Anionic Halocarbynes and Halocarbenes. J. Phys. Chem., 1991. 95(19): p. 7220-7228.
23. Russo, N., E. Sicilia, and M. Toscano, Geometries, Singlet-Triplet Separations, Dipole-Moments, Ionization-Potentials, and Vibrational Frequencies in Methylene (CH2) and Halocarbenes (CHF, CF2, CCl2, CBr2, and CI2). J. Chem. Phys., 1992. 97(7): p. 5031-5036.
24. Garcia, V.M., et al., Singlet-triplet energy gap in halogen-substituted carbenes and silylenes: A difference-dedicated configuration interaction calculation. Mol. Phys., 1996. 87(6): p. 1395-1404.
25. Gobbi, A. and G. Frenking, The Singlet-Triplet Gap of the Halonitrenium Ions NHX+, NX2
+ and the Halocarbenes CHX, CX2 (X=F, Cl, Br, I). J. Chem. Soc.-Chem. Communications, 1993(14): p. 1162-1164.
26. Wenthold, P.G. and W.C. Lineberger, Negative ion photoelectron spectroscopy studies of organic reactive intermediates. Accts. Chem. Research, 1999. 32(7): p. 597-604.
27. Zittel, P.F., et al., Laser photoelectron spectrometry of CH2-- Singlet-triplet splitting and
electron-affinity of CH2. Journal of the American Chemical Society, 1976. 98(12): p. 3731-3732.
28. Schwartz, R.L., et al., Singlet-triplet splittings in CX2 (X = F, Cl, Br, I) dihalocarbenes via negative ion photoelectron spectroscopy. J. Phys. Chem. A, 1999. 103(41): p. 8213-8221.
29. Chau, F.T., et al., The singlet-triplet separation in CF2: State-of-the-art ab initio calculations and Franck-Condon simulations including anharmonicity. ChemPhysChem, 2005. 6(10): p. 2037-2045.
30. Sendt, K. and G.B. Bacskay, Spectroscopic constants of the (X)over-tilde((1)A(1)), (a)over-tilde(B-3(1)), and (A)over-tilde(B-1(1)) states of CF2, CCl2, and CBr2 and heats of formation of selected halocarbenes: An ab initio quantum chemical study. J. Chem. Phys., 2000. 112(5): p. 2227-2238.
31. Lee, E.P.F., J.M. Dyke, and T.G. Wright, The lowest singlet-triplet gap in CCl2, CBr2 and CI2. Chem. Phys. Lett., 2000. 326(1-2): p. 143-150.
32. Drake, S.A., J.M. Standard, and R.W. Quandt, An ab initio investigation of the ground and excited electronic state properties of a series of bromine- and iodine-containing singlet carbenes. J. Phys. Chem. A, 2002. 106(7): p. 1357-1364.
33. McKee, M.L. and J. Michl, A possible reinterpretation of the photoelectron spectra of CCl2, CBr2, and CI2: A role for quartet isodihalocarbene or dihalocarbene radical anions? J. Phys. Chem. A, 2002. 106(37): p. 8495-8497.

157
34. Liang, J., et al., Geometries of the Halocarbene anions HCF- and CF2-: ab initio
calculation and Franck-Condon analysis. J. Mol. Structure-Theochem, 2004. 672(1-3): p. 133-139.
35. Dyke, J.M., et al., A combined ab initio/Franck-Condon study of the A-X single-vibronic-level emission spectrum of CCl2 and the photodetachment spectrum of CCl. ChemPhysChem, 2005. 6(10): p. 2046-2059.
36. Tarczay, G., et al., Accurate ab initio determination of spectroscopic and thermochemical properties of mono- and dichlorocarbenes. Phys. Chem. Chem. Phys., 2005. 7(15): p. 2881-2893.
37. Seal, P. and S. Chakrabarti, Explicit role of dynamical and nondynamical electron correlation on singlet-triplet splitting in carbenes. Chem. Phys., 2007. 332(2-3): p. 232-242.
38. Wren, S.W., et al., The photoelectron spectrum of CCl2-: the convergence of theory and
experiment after a decade of debate. Physical Chemistry Chemical Physics, 2009. 11(23): p. 4745-4753.
39. Vogelhuber, K.M., et al., Photoelectron spectra of dihalomethyl anions: Testing the limits of normal mode analysis. The Journal of Chemical Physics, 2011. 134(18): p. 184306-13.
40. Ervin, K.M. and W.C. Lineberger, in Advances in Gas Phase Ion Chemistry, N.G. Adams and L.M. Babcock, Editors. 1992, JAI: Greenwich. p. 121.
41. Frisch, M.J., et al., Gaussian 03, Revision B.052003, Pittsburgh: Gaussian, Inc.
42. Pople, J.A., M. Headgordon, and K. Raghavachari, Quadratic Configuration-Interaction - a General Technique for Determining Electron Correlation Energies. Journal of Chemical Physics, 1987. 87(10): p. 5968-5975.
43. Dunning, T.H., Gaussian-basis sets for use in correlated molecular calculations. 1. The atoms boron through neon and hydrogen. Journal of Chemical Physics, 1989. 90(2): p. 1007-1023.
44. Woon, D.E. and T.H. Dunning, Gaussian-Basis Sets for Use in Correlated Molecular Calculations .3. the Atoms Aluminum through Argon. Journal of Chemical Physics, 1993. 98(2): p. 1358-1371.
45. Becke, A.D., Density-functional thermochemistry. III. The role of exact exchange. Journal of Chemical Physics, 1993. 98(7): p. 5648-5652.
46. Lee, C.T., W.T. Yang, and R.G. Parr, Development of the colle-salvetti correlation-energy formula into a functional of the electron density. Physical Review B, 1988. 37(2): p. 785-789.
47. Ervin, K.M., PESCAL, Fortran program, 2008.
48. Liu, M.L., et al., Dispersed fluorescence spectra of the CCl2 (A)over-tilde-(X)over-tilde vibronic bands. Phys. Chem. Chem. Phys., 2003. 5(7): p. 1352-1358.

158
49. Tao, C., C. Mukarakate, and S.A. Reid, Single vibronic level emission spectroscopy of the (A)over-tilde(1)A ''-> X(1)A ' system of bromochlorocarbene. J. Mol. Spec., 2007. 246(2): p. 113-117.
50. Ho, J., K.M. Ervin, and W.C. Lineberger, Photoelectron-Spectroscopy of Metal Cluster Anions - Cun
-, Agn-, and Aun
-. Journal of Chemical Physics, 1990. 93(10): p. 6987-7002.
51. Chen, P., ed. Unimolecular and Bimolecular Ion-Molecule Reaction Dynamics. ed. C.-Y. Ng, T. Baer, and I. Powis1994, Wiley & Sons Chichester. 371.
52. Ervin, K.M., et al., Naphthyl radical: Negative ion photoelectron spectroscopy, Franck-Condon simulation, and thermochemistry. J. Phys. Chem. A, 2001. 105(48): p. 10822.
53. Lee, J. and J.J. Grabowski, Reactions of the Atomic Oxygen Radical Anion and the Synthesis of Organic Reactive Intermediates. Chem. Rev., 1992. 92(7): p. 1611.
54. Murray, K.K., et al., Photoelectron-Spectroscopy of the Halocarbene Anions HCF-, HCCI-, HCBr-, HCI-, CF2
-, and CCl2-. J. Chem. Phys., 1988. 89(9): p. 5442-5453.
55. Mukarakate, C., et al., Probing spin-orbit mixing and the singlet-triplet gap in dichloromethylene via K-a-sorted emission spectra. Phys. Chem. Chem. Phys., 2006. 8(37): p. 4320-4326.
56. Bopp, J.C., et al., Spectroscopic characterization of the isolated SF6- and C4F8
- anions: Observation of very long harmonic progressions in symmetric deformation modes upon photodetachment. Journal of Physical Chemistry A, 2007. 111(7): p. 1214-1221.
57. Barden, C.J. and H.F. Schaefer, The singlet-triplet separation in dichlorocarbene: A surprising difference between theory and experiment. J. Chem. Phys., 2000. 112(15): p. 6515-6516.
58. Frisch, M.J., et al., Gaussian 03, Revision B.012004, Wallingford, CT: Gaussian, Inc.
59. Bauschlicher, C.W., Singlet-Triplet Separation in CBr2. J. Am. Chem. Soc., 1980. 102(17): p. 5492-5493.
60. Hanstorp, D. and M. Gustafsson, Determination of the Electron-Affinity of Iodine. J. Phys. B, 1992. 25(8): p. 1773-1783.
61. Novick, S.E., et al., Laser Photoelectron, Photodetachment, and Photodestruction Spectra of O-3. J. Chem. Phys., 1979. 70(6): p. 2652-2662.
62. Ervin, K.M., J. Ho, and W.C. Lineberger, Electronic and vibrational structure of transition metal trimers: photoelectron spectra of Ni3
-, Pd3-, and Pt3
-. Journal of Chemical Physics, 1988. 89(8): p. 4514-21.
63. Martin, J.D.D. and J.W. Hepburn, Determination of bond dissociation energies by threshold ion-pair production spectroscopy: An improved D-0(HCl). J. Chem. Phys., 1998. 109: p. 8139.
64. Blondel, C., et al., High Resolution Determination of the Electron Affinity of Fluorine and Bromine using Crossed Ion and Laser Beams. Phys. Rev. A, 1989. 40: p. 3698.
65. Li, Q.S., et al., Electron affinities, molecular structures, and thermochemistry of the fluorine, chlorine and bromine substituted methyl radicals. Mol. Phys., 2002. 100(23): p. 3615.

159
66. Born, M., S. Ingemann, and N.M.M. Nibbering, Thermochemical properties of halogen-substituted methanes, methyl radicals, and carbenes in the gas phase. Int. J. Mass Spectrom., 2000. 194(2-3): p. 103.
67. Stoll, H., B. Metz, and M. Dolg, Relativistic energy-consistent pseudopotentials - Recent developments. J. Comput. Chem., 2002. 23(8): p. 767.
68. Thompson, M.A., et al., A combined experimental/theoretical investigation of the near-infrared photodissociation of IBr-(CO2)(n). J. Chem. Phys., 2008. 129(22).
69. Ichino, T., et al., Structure of the vinyldiazomethyl anion and energetic comparison to the cyclic isomers. Journal of Physical Chemistry A, 2007. 111(34): p. 8374-8383.
70. Vogelhuber, K.M., et al., The C-H bond dissociation energy of furan: Photoelectron spectroscopy of the furanide anion. Journal of Chemical Physics, 2011. 134(6).
71. Borrelli, R. and A. Peluso, The vibrational progressions of the N -> V electronic transition of ethylene: A test case for the computation of Franck-Condon factors of highly flexible photoexcited molecules. J. Chem. Phys., 2006. 125(19).
72. Borrelli, R. and A. Peluso, The electron photodetachment spectrum of c-C4F8-: A test case for the computation of Franck-Condon factors of highly flexible molecules. J. Chem. Phys., 2008. 128(4).
73. Kikuchi, H., et al., Computational method for calculating multidimensional Franck-Condon factors: Based on Sharp-Rosenstock's method. J. Chem. Phys., 2003. 119(2): p. 729.
74. Reimers, J.R., A practical method for the use of curvilinear coordinates in calculations of normal-mode-projected displacements and Duschinsky rotation matrices for large molecules. J. Chem. Phys., 2001. 115(20): p. 9103.
75. Wilson, E.B., J.C. Decius, and P.C. Cross, Molecular Vibrations1980, New York: Dover.
76. Hajgato, B., et al., Triplet-singlet energy gaps in iodo-carbenes (I-C-X): Remarkable discrepancy between theory and experiment. Phys. Chem. Chem. Phys., 2000. 2(22): p. 5041-5045.

160
7 Photoelectron Spectroscopy of SF6‒ and c-C4F8
‒
7.1 Introduction
Both SF6 and c-C4F8 have industrial applications in etching plasmas as well as insulating
gasses for high voltages. In addition, both molecules have long lifetimes in the upper
atmosphere and are considered greenhouse gasses.1 These two perfluorinated molecules are of
fundamental interest and share the unique propensity to non-dissociatively attach low energy
electrons, indicating that the corresponding anions have a very long lifetime with respect to
autodetachment.2 One of the reasons for this slow autodetachment undoubtedly results from the
change in structure of the molecular framework upon anion formation. For these reasons, both
molecules have been the subject of many studies which have focused on the characterization of
the neutral and the formation and reactivity of the anion3-9; however very few spectroscopic
studies have addressed the structural aspects of the ions.
Of particular interest, SF6 has been the focus of intense study for the past thirty years.10-20
The neutral structure has been well characterized by several Raman and Infrared studies21, 22,
however only two reports address the structural aspects of the ion through spectroscopy.23, 24 An
early study commented only on the lack of observed photodetachment in the near ultraviolet23,
far above the adiabatic threshold, while a matrix isolation study identified a single weak
vibrational transition near 600 cm-1.24
Several theoretical studies have also have investigated the properties of SF6 and SF6–.
Computational results predict that the Oh symmetry of SF6 is retained upon attachment of an
electron; however the S−F bond lengths are elongated by about 0.2 Å.25 The electron affinity of
neutral SF6 has been calculated by a variety of electronic structure methods ranging from modest
161
density functional to the more sophisticated coupled-cluster theories, resulting in a wide range
of values.20, 22, 26-29 The most reliable EA calculations use highly correlated methods (MP2,
CCSD) and have converged on a generally accepted value of 0.9 eV.22 Additionally, after
publication of the work which this Chapter is based,30 two groups have calculated the
photoelectron spectrum of SF6–, in an attempt to reproduce the experimental results presented in
this Chapter.26, 28 The results of these calculations and their implications are discussed in some
detail in the results section.
C-C4F8, like SF6, is expected to have a large geometry change upon attachment of an
electron. It is known from spectroscopic studies that the geometry of the neutral is bent (D2d
symmetry) with the majority of the 23 vibrational mode frequencies having been measured.31-38
Recent high-level theoretical calculation (CCSD(T)/CBS) have mapped out the anharmonic
double-well potential energy surface in the ring-puckering coordinate in c-C4F8; a 132 cm-1
barrier was determined for this low-frequency puckering motion. However, far less is known
about the anion structure and vibrational frequencies. Recent ESR studies have shown that the
anion is planar with D4h symmetry39 and computational results predict that the added electron is
delocalized in a ‘p-like’ orbital extending over the entire molecule. This strengthens the four
C−C bonds via π-bonding interactions, and weakening the eight C−F bonds by σ-antibonding
interactions.39, 40
The present study investigates what happens when an electron is attached to a closed
shell perfluorinated molecule, SF6 and c-C4F8. Photoelectron spectroscopy is uniquely able to
provide experimental insight into the structural changes between the anion and neutral species as
well as possible determination of the adiabatic electron affinity. The photoelectron spectra of
both c-C4F8– and , SF6
– are measured and reported in this Chapter. This work was performed in
162
collaboration with Professor Mark A. Johnson at Yale University and Thomas M. Miller and A.
A. Viggiano at Hanscom Air Force Research Laboratory. In addition to independently
measuring the SF6– photoelectron spectrum, our collaborators at Yale University also recorded
the argon-tagged photoelectron spectrum of SF6–, which limits the amount of internal energy
available to the SF6–•Ar complex. The experimental findings are compared to recent theoretical
calculated results, which provide additional insight into the structure of the energetics of both
systems studied in this work.
7.2 Experimental Method
The photoelectron spectra for both c-C4F8– and SF6
– anions used the negative ion
photoelectron spectrometer described in Chapter 2. Negative ions are formed in a flowing
afterglow ion source. Specifically, target anions were formed by seeding the helium buffer gas
with trace amounts of either SF6 or c-C4F8 gas prior to the microwave discharge. The
photoelectron spectrum of SF6– was recorded with ions cooled to ~ 150 K using a liquid nitrogen
jacket surrounding the flow tube. The mass resolution of the Wien velocity filter for these
experiments was m/Δm ~ 40. Typical mass-selected ion beam currents were ~ 500 pA. The ~
0.5 W output from a single-mode continuous-wave argon ion laser operating at 351 nm (3.531
eV) is built up to approximately 50 W of circulating power in the interaction region. The energy
resolution of the hemispherical analyzer is approximately 8 meV under the experimental
conditions used here.
Calculated optimized geometries and unscaled harmonic vibrational frequencies for
anions and corresponding neutral molecules are determined with density functional theory
(B3LYP/6-31+G(3df)) using the Gaussian 03 program.25

163
7.3 Results and Discussion
7.3.1 Photoelectron Spectrum of c-C4F8– It is known from electron diffraction and infrared studies that neutral c-C4F8 in its
ground state has a bent D2d symmetry with the four carbon atoms forming a dihedral angle of ~
17°.31-38 However, ESR studies have shown that this dihedral angle in the anion is
approximately 0° resulting in a planar ring with D4h symmetry.39 Figure 7.1 illustrates the
geometries of the anion and neutral calculated using density functional theory, which illustrates
this geometry change from the anion to the neutral. Detachment of an electron elongates the C–
C bonds, shortens the C–F bonds, and increases the nonbonded F–F distance. This increase in
symmetry has been predicted by computations that also show that the negative charge in the
anion is a ‘p-like’ orbital that is delocalized over the entire molecule.39, 40 Therefore, we would
expect to observe a broad vibrational envelope in the photoelectron spectra due to the large
geometry changes expected when an electron is removed from the anion.
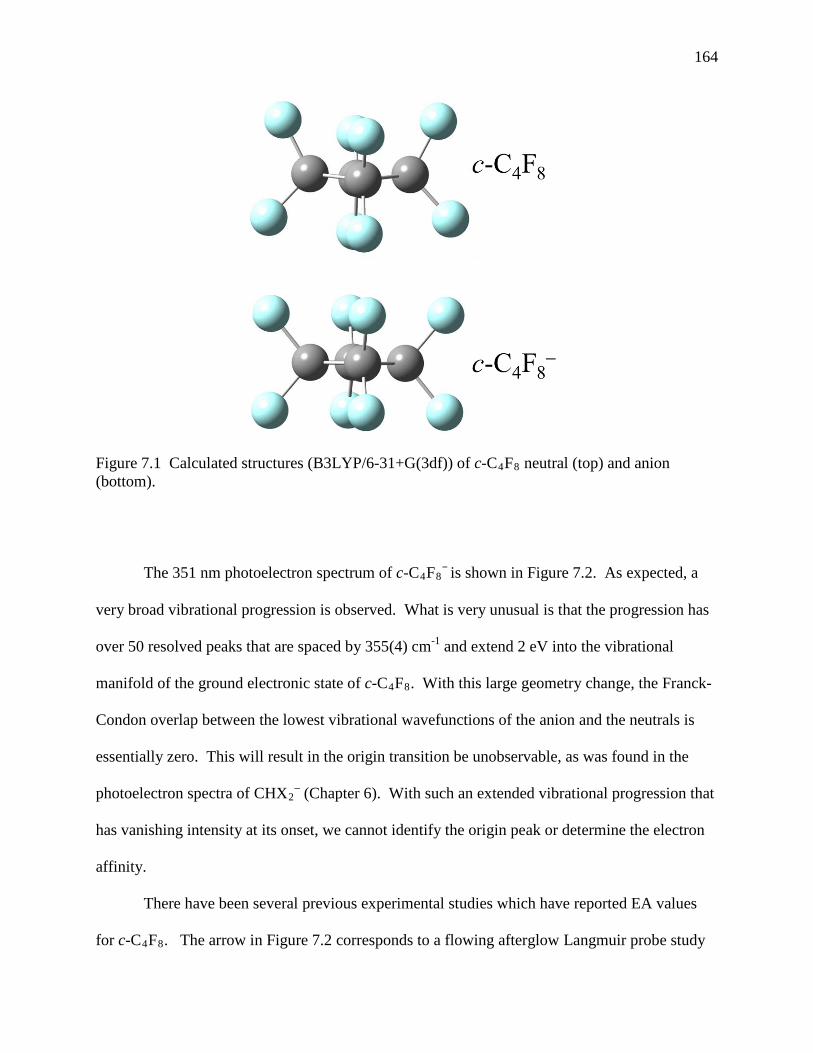
164
The 351 nm photoelectron spectrum of c-C4F8‒
is shown in Figure 7.2. As expected, a
very broad vibrational progression is observed. What is very unusual is that the progression has
over 50 resolved peaks that are spaced by 355(4) cm-1 and extend 2 eV into the vibrational
manifold of the ground electronic state of c-C4F8. With this large geometry change, the Franck-
Condon overlap between the lowest vibrational wavefunctions of the anion and the neutrals is
essentially zero. This will result in the origin transition be unobservable, as was found in the
photoelectron spectra of CHX2– (Chapter 6). With such an extended vibrational progression that
has vanishing intensity at its onset, we cannot identify the origin peak or determine the electron
affinity.
There have been several previous experimental studies which have reported EA values
for c-C4F8. The arrow in Figure 7.2 corresponds to a flowing afterglow Langmuir probe study
Figure 7.1 Calculated structures (B3LYP/6-31+G(3df)) of c-C4F8 neutral (top) and anion (bottom).
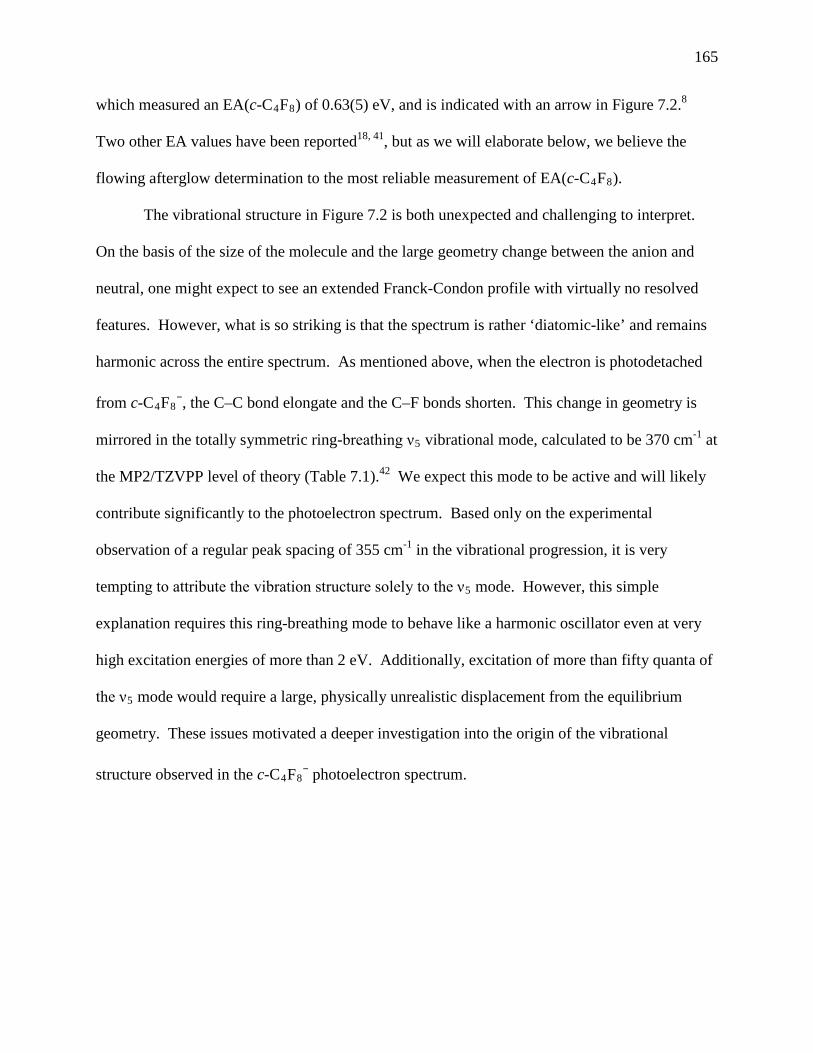
165
which measured an EA(c-C4F8) of 0.63(5) eV, and is indicated with an arrow in Figure 7.2.8
Two other EA values have been reported18, 41, but as we will elaborate below, we believe the
flowing afterglow determination to the most reliable measurement of EA(c-C4F8).
The vibrational structure in Figure 7.2 is both unexpected and challenging to interpret.
On the basis of the size of the molecule and the large geometry change between the anion and
neutral, one might expect to see an extended Franck-Condon profile with virtually no resolved
features. However, what is so striking is that the spectrum is rather ‘diatomic-like’ and remains
harmonic across the entire spectrum. As mentioned above, when the electron is photodetached
from c-C4F8‒, the C–C bond elongate and the C–F bonds shorten. This change in geometry is
mirrored in the totally symmetric ring-breathing ν5 vibrational mode, calculated to be 370 cm-1 at
the MP2/TZVPP level of theory (Table 7.1).42 We expect this mode to be active and will likely
contribute significantly to the photoelectron spectrum. Based only on the experimental
observation of a regular peak spacing of 355 cm-1 in the vibrational progression, it is very
tempting to attribute the vibration structure solely to the ν5 mode. However, this simple
explanation requires this ring-breathing mode to behave like a harmonic oscillator even at very
high excitation energies of more than 2 eV. Additionally, excitation of more than fifty quanta of
the ν5 mode would require a large, physically unrealistic displacement from the equilibrium
geometry. These issues motivated a deeper investigation into the origin of the vibrational
structure observed in the c-C4F8‒ photoelectron spectrum.
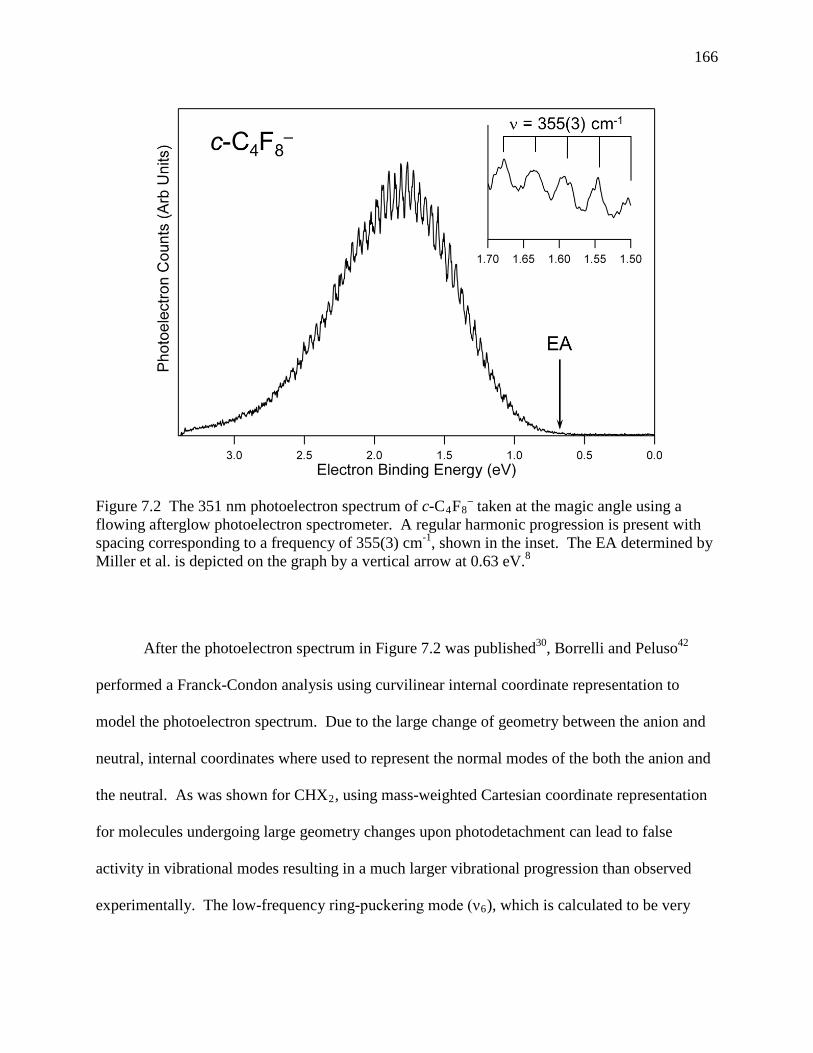
166
After the photoelectron spectrum in Figure 7.2 was published30, Borrelli and Peluso42
performed a Franck-Condon analysis using curvilinear internal coordinate representation to
model the photoelectron spectrum. Due to the large change of geometry between the anion and
neutral, internal coordinates where used to represent the normal modes of the both the anion and
the neutral. As was shown for CHX2, using mass-weighted Cartesian coordinate representation
for molecules undergoing large geometry changes upon photodetachment can lead to false
activity in vibrational modes resulting in a much larger vibrational progression than observed
experimentally. The low-frequency ring-puckering mode (ν6), which is calculated to be very
Figure 7.2 The 351 nm photoelectron spectrum of c-C4F8– taken at the magic angle using a
flowing afterglow photoelectron spectrometer. A regular harmonic progression is present with spacing corresponding to a frequency of 355(3) cm-1, shown in the inset. The EA determined by Miller et al. is depicted on the graph by a vertical arrow at 0.63 eV.8

167
anharmonic, was also treated independent of the other active modes when evaluating the overlap
integrals in the Franck-Condon calculations.
Their calculations indicated that, when only ν5 vibrational mode is active, the simulated
photoelectron spectrum should exhibit a progression that spans less than 1 eV, much narrower
than the measured spectrum. However, when an additional higher-frequency ring-breathing
mode (ν5) is included in the simulation, the resulting spectral profile qualitatively agrees with the
experimental spectrum. This simulation, shown in Figure 7.3, has ~ 60 peaks that are spaced by
approximately 370 cm-1. It appears that the equally spaced peaks in the photoelectron spectrum
are due to accidental resonances of several quasidegenerate transitions; namely 10𝑚50𝑛 and
10𝑚−150𝑛+4 where m and n are integers. The underlying continuum, which is not replicated when
only two modes are included in the simulation, is reproduced with the inclusion of the ring-
puckering vibrational mode. Figure 7.3b shows the final simulation achieved when all modes
were included in the calculation, which agrees very well with the experimental photoelectron
spectrum.
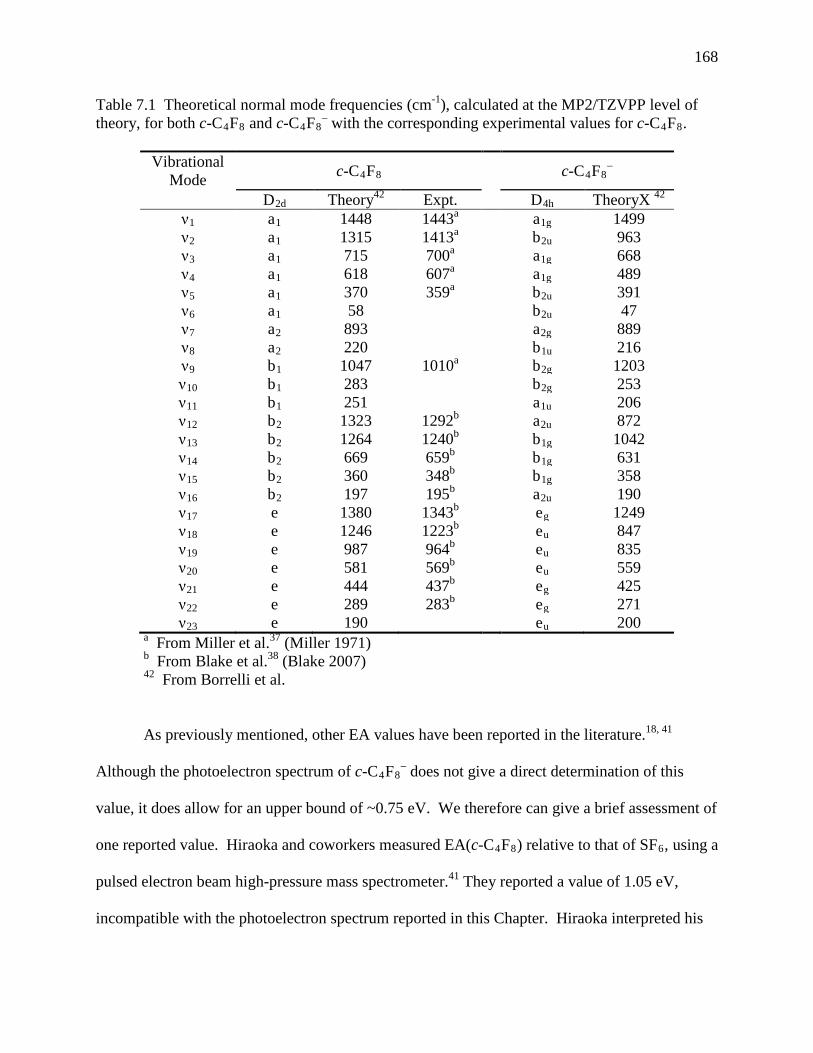
168
Table 7.1 Theoretical normal mode frequencies (cm-1), calculated at the MP2/TZVPP level of theory, for both c-C4F8 and c-C4F8
– with the corresponding experimental values for c-C4F8.
Vibrational Mode c-C4F8
c-C4F8–
D2d Theory42 Expt. D4h TheoryX 42 ν1 a1 1448 1443a a1g 1499 ν2 a1 1315 1413a b2u 963 ν3 a1 715 700a a1g 668 ν4 a1 618 607a a1g 489 ν5 a1 370 359a b2u 391 ν6 a1 58 b2u 47 ν7 a2 893 a2g 889 ν8 a2 220 b1u 216 ν9 b1 1047 1010a b2g 1203 ν10 b1 283 b2g 253 ν11 b1 251 a1u 206 ν12 b2 1323 1292b a2u 872 ν13 b2 1264 1240b b1g 1042 ν14 b2 669 659b b1g 631 ν15 b2 360 348b b1g 358 ν16 b2 197 195b a2u 190 ν17 e 1380 1343b eg 1249 ν18 e 1246 1223b eu 847 ν19 e 987 964b eu 835 ν20 e 581 569b eu 559 ν21 e 444 437b eg 425 ν22 e 289 283b eg 271 ν23 e 190 eu 200
a From Miller et al.37 (Miller 1971) b From Blake et al.38 (Blake 2007) 42 From Borrelli et al.
As previously mentioned, other EA values have been reported in the literature.18, 41
Although the photoelectron spectrum of c-C4F8– does not give a direct determination of this
value, it does allow for an upper bound of ~0.75 eV. We therefore can give a brief assessment of
one reported value. Hiraoka and coworkers measured EA(c-C4F8) relative to that of SF6, using a
pulsed electron beam high-pressure mass spectrometer.41 They reported a value of 1.05 eV,
incompatible with the photoelectron spectrum reported in this Chapter. Hiraoka interpreted his

169
observations to suggest the presence of an excited C4F8– isomer, which would form at elevated
temperatures (above 350 K) and undergo electron detachment. The EA of this other isomer was
reported to be 0.5 eV, based upon electron-transfer equilibrium with O2. The coexistence of a
second anionic isomer is not supported by the photoelectron angular distribution measurements,
which give a smooth progression of the anisotropy parameter, β, across the spectrum.
Furthermore, the Franck-Condon calculations effectively reproduce the experimental spectrum
by considering only one C4F8– isomer. While our results do not provide a definitive EA
determination, they do indicate which prior measurements are most reliable. Thus we conclude
that the EA value of 0.63 eV8 is both consistent with our data, and the most reliable value
available. A detailed discussion of all the earlier EA determinations for C4F8 has recently been
reported by Miller et al.8
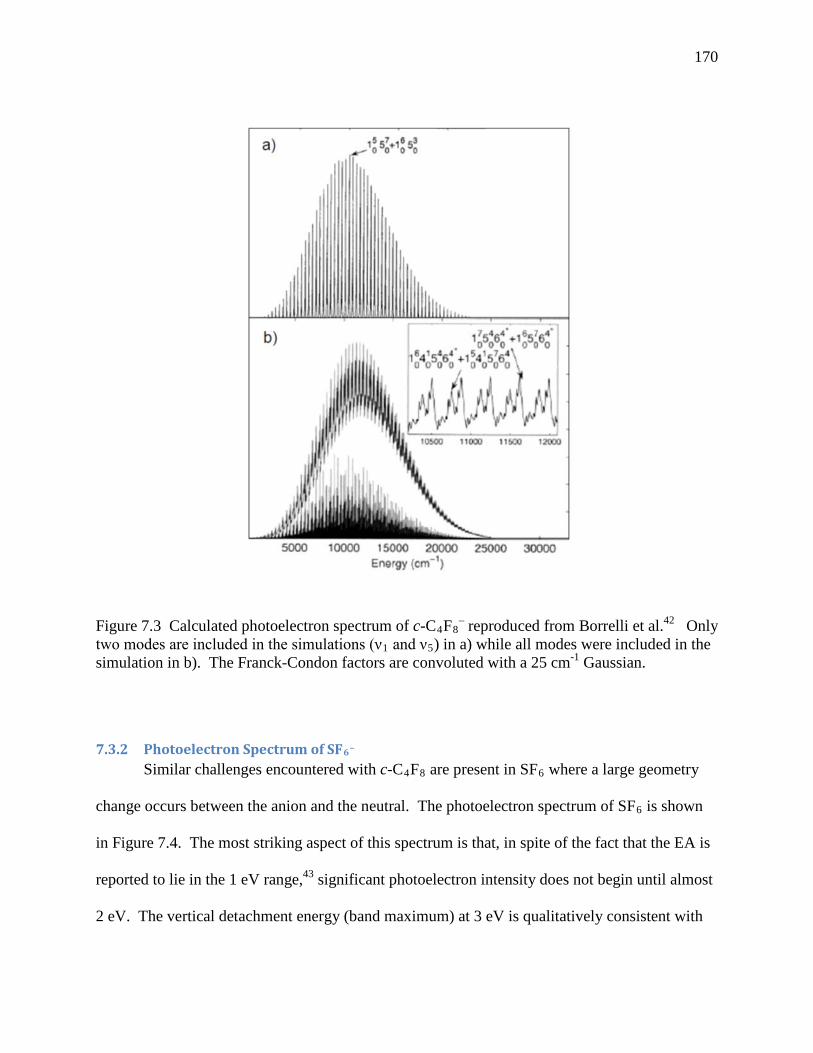
170
7.3.2 Photoelectron Spectrum of SF6– Similar challenges encountered with c-C4F8 are present in SF6 where a large geometry
change occurs between the anion and the neutral. The photoelectron spectrum of SF6 is shown
in Figure 7.4. The most striking aspect of this spectrum is that, in spite of the fact that the EA is
reported to lie in the 1 eV range,43 significant photoelectron intensity does not begin until almost
2 eV. The vertical detachment energy (band maximum) at 3 eV is qualitatively consistent with
Figure 7.3 Calculated photoelectron spectrum of c-C4F8– reproduced from Borrelli et al.42 Only
two modes are included in the simulations (ν1 and ν5) in a) while all modes were included in the simulation in b). The Franck-Condon factors are convoluted with a 25 cm-1 Gaussian.

171
previous CCSD calculations. The global minimum for the SF6– anion is calculated to have
considerably elongated S–F bonds (~ 0.2 Ǻ), but retain the Oh symmetry of the neutral
molecule.22 The photoelectron spectrum contains two regular vibrational progressions,
highlighted in the inset of Figure 7.4, which are labeled with solid and dashed lines.
In an effort to better understand the origin of the vibrational progression in the
photoelectron spectrum, SF6– was produced using a pulsed source and the photoelectron
Figure 7.4 The magic angle 351 nm photoelectron spectrum of SF6– measured using ions cooled
to ~ 150 K. The inset highlights the regular peak spacing corresponding to a vibrational frequency of 750(20) cm-1 (black line) in the neutral. An additional set of interloping peaks is also present (dashed blue lines) which has the same characteristic spacing but is offset from the main progression by 440(10) cm-1.
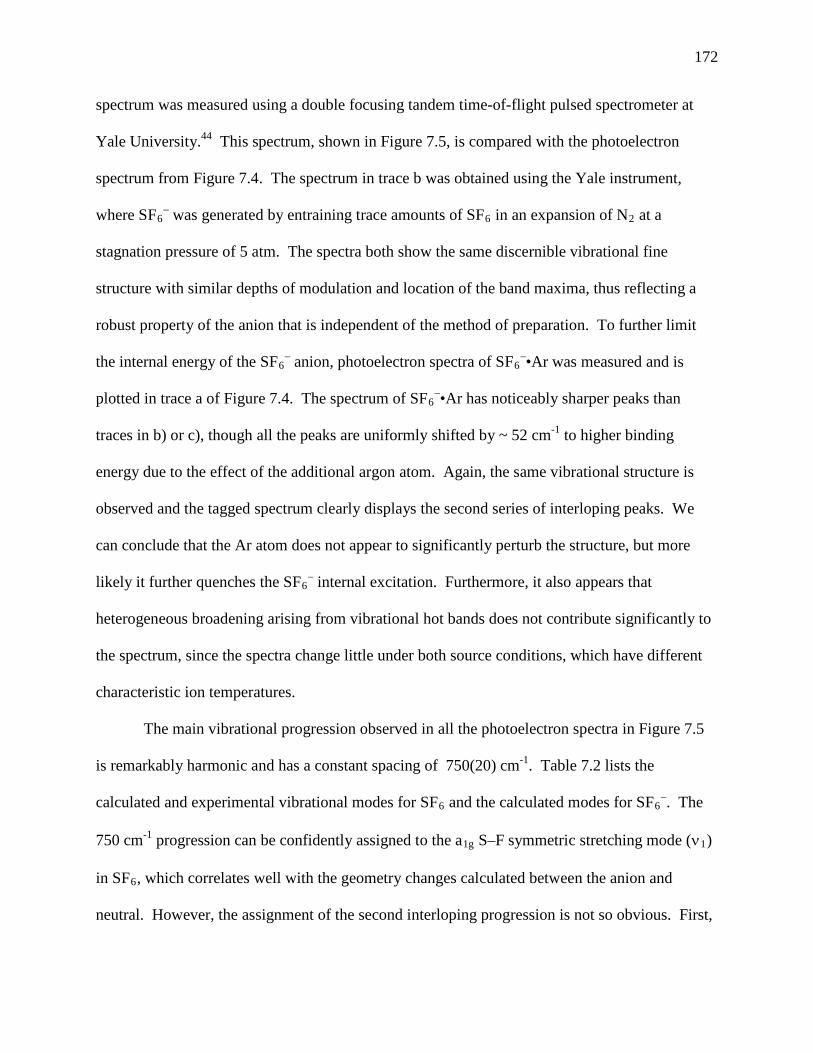
172
spectrum was measured using a double focusing tandem time-of-flight pulsed spectrometer at
Yale University.44 This spectrum, shown in Figure 7.5, is compared with the photoelectron
spectrum from Figure 7.4. The spectrum in trace b was obtained using the Yale instrument,
where SF6– was generated by entraining trace amounts of SF6 in an expansion of N2 at a
stagnation pressure of 5 atm. The spectra both show the same discernible vibrational fine
structure with similar depths of modulation and location of the band maxima, thus reflecting a
robust property of the anion that is independent of the method of preparation. To further limit
the internal energy of the SF6– anion, photoelectron spectra of SF6
–•Ar was measured and is
plotted in trace a of Figure 7.4. The spectrum of SF6–•Ar has noticeably sharper peaks than
traces in b) or c), though all the peaks are uniformly shifted by ~ 52 cm-1 to higher binding
energy due to the effect of the additional argon atom. Again, the same vibrational structure is
observed and the tagged spectrum clearly displays the second series of interloping peaks. We
can conclude that the Ar atom does not appear to significantly perturb the structure, but more
likely it further quenches the SF6– internal excitation. Furthermore, it also appears that
heterogeneous broadening arising from vibrational hot bands does not contribute significantly to
the spectrum, since the spectra change little under both source conditions, which have different
characteristic ion temperatures.
The main vibrational progression observed in all the photoelectron spectra in Figure 7.5
is remarkably harmonic and has a constant spacing of 750(20) cm-1. Table 7.2 lists the
calculated and experimental vibrational modes for SF6 and the calculated modes for SF6–. The
750 cm-1 progression can be confidently assigned to the a1g S–F symmetric stretching mode (ν1)
in SF6, which correlates well with the geometry changes calculated between the anion and
neutral. However, the assignment of the second interloping progression is not so obvious. First,
173
the interloper spacing remains constant throughout the spectrum, so that we can rule out a
situation where two different modes are independently contributing to the Gaussian-like
progression originating from the same initial state of the anion. Furthermore, the measured 440
cm-1 peak spacing does not correspond to any of the fundamental frequencies in neutral SF6.
The modes which are the closest frequencies are ν5 (524 cm-1) and ν6 (348 cm-1), both do not
correspond to the measured peak spacing. Thus, the second progression is not likely due to a
combination band involving ν1 and another quantum of a second vibrational mode.
A remaining possibility is that the second progression could be due to a
combination/overtone band. This has been investigated in great deal in two recent theoretical
studies which focus specifically on reproducing the photoelectron spectrum of SF6–.26, 28 In a
similar manner to that used to calculate the photoelectron spectrum of c-C4F8–, Borrelli
performed a straightforward Franck-Condon analysis on SF6–. This work suggests that the
observed experimental spectrum is due to an extended progression in ν1 (101) in conjunction with
a progression from simultaneous excitation of the ν1 mode and of the triply degenerate ν4 mode
(10𝑛402). Since ν4 is a non-totally symmetric mode, the only allowed transitions are of the type
∆ν = ±2 (0 → 2, 0 → 4, etc.), however any transitions with more than two quanta in ν1 has
insufficient intensity to be experimentally observed. This analysis seemed to provide a
satisfactory explanation for the experimental spectra. However, a more recent high-level
theoretical study recently published has added even more complexity to this already difficult
problem.
In the Franck-Condon analysis by Borrelli, the symmetry of the SF6– anion and neutral
were both assumed to be Oh. Using high-level electronic structure calculations [RCCSD(T)/
AVQZ+d], Eisfeld concluded that though the neutral does have Oh symmetry, the anion in fact
174
has C4v symmetry. Furthermore, the potential energy surface of the anion was shown to be
strongly anharmonic which causes the anion to distorting to C4v symmetry. Therefore,
accurately describing the initial state of the anion is critical to reproducing the experimental
photoelectron spectrum. This was done by identifying and treating the four normal modes which
lead to intensity in the photoelectron spectrum. A four-dimensional potential energy surface was
then calculated to directly account for the anharmonicity in the system. The computed
photoelectron spectrum is a broad, unstructured Gaussian-shaped band which spans 5 eV (2.5 –
7.5 eV). This result differs significantly from both the spectrum calculated by Borrelli and the
measured spectrum. The photon energy for both the measured photoelectron spectra in this
Chapter was 3.5 eV, with the result that we cannot confirm or repute these new calculations with
employing the new ultraviolet imaging photoelectron spectrometer in our laboratory. This may
become a beginning project for a new graduate student in our group. In any event, it appears that
both experimental spectra have a VDE at ~ 3 eV, but low energy electrons (0.2 eV or less) are
not collected very efficiently in either apparatus. This could give rise to an artificial drop in
photoelectron intensity. However, this concern could be easy tested by using higher energy
photons when measuring the photoelectron spectrum. Though the new theoretical calculations
shed light on the photoelectron spectrum of SF6–, the definitive assignments and clear
understanding of the experimental spectra remains elusive.

175
Figure 7.5 Comparison of the (c) 351 nm photoelectron spectrum of SF6– reproduced from
Figure 7.4, and (a and c) spectra taken at Yale University using a double focusing tandem time-of-flight pulsed spectrometer. The photoelectron spectrum in trace b is of bare SF6
– and trace a is of the SF6
–•Ar complex.
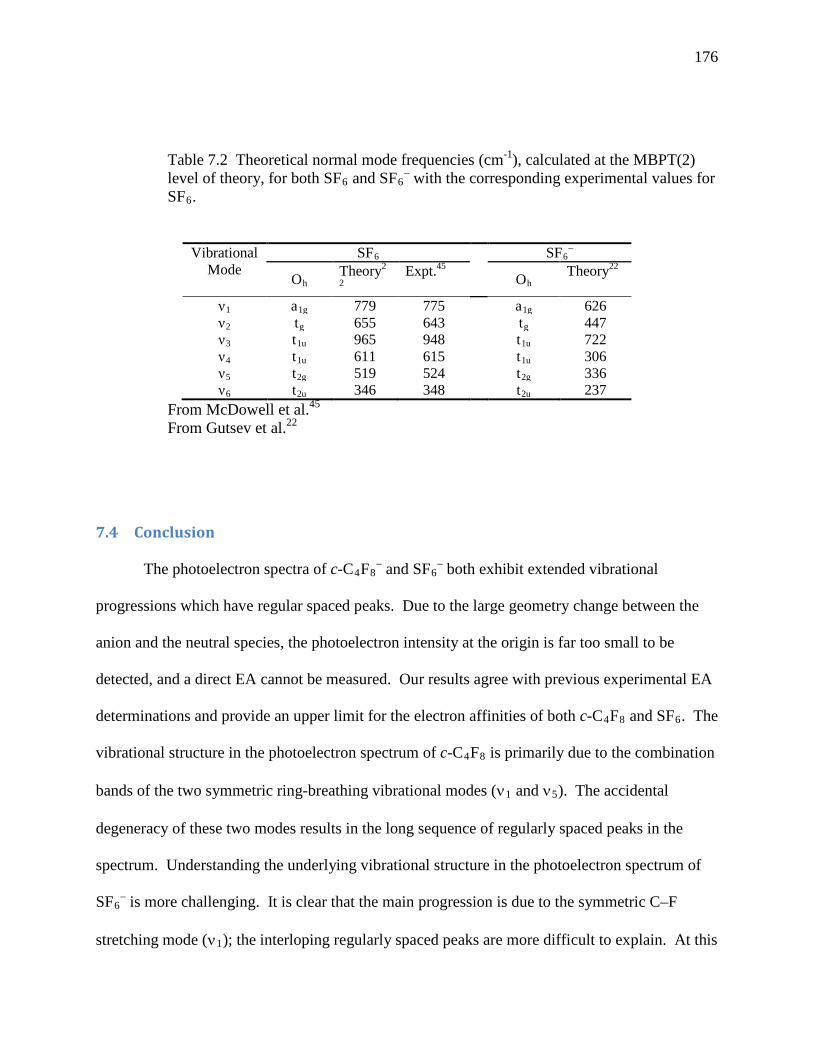
176
Table 7.2 Theoretical normal mode frequencies (cm-1), calculated at the MBPT(2) level of theory, for both SF6 and SF6
– with the corresponding experimental values for SF6.
Vibrational Mode
SF6 SF6–
Oh Theory2
2 Expt.45 Oh
Theory22
ν1 a1g 779 775 a1g 626 ν2 tg 655 643 tg 447 ν3 t1u 965 948 t1u 722 ν4 t1u 611 615 t1u 306 ν5 t2g 519 524 t2g 336 ν6 t2u 346 348 t2u 237
From McDowell et al.45 From Gutsev et al.22
7.4 Conclusion
The photoelectron spectra of c-C4F8– and SF6
– both exhibit extended vibrational
progressions which have regular spaced peaks. Due to the large geometry change between the
anion and the neutral species, the photoelectron intensity at the origin is far too small to be
detected, and a direct EA cannot be measured. Our results agree with previous experimental EA
determinations and provide an upper limit for the electron affinities of both c-C4F8 and SF6. The
vibrational structure in the photoelectron spectrum of c-C4F8 is primarily due to the combination
bands of the two symmetric ring-breathing vibrational modes (ν1 and ν5). The accidental
degeneracy of these two modes results in the long sequence of regularly spaced peaks in the
spectrum. Understanding the underlying vibrational structure in the photoelectron spectrum of
SF6– is more challenging. It is clear that the main progression is due to the symmetric C–F
stretching mode (ν1); the interloping regularly spaced peaks are more difficult to explain. At this

177
point, the Franck-Condon analysis by Borrelli, which suggests the structure originates from
combination/overtone bands, appears to be the most reasonable. The high-level theoretical
calculations by Eisfeld are intriguing, but the resulting predictions differ significantly from the
experimental spectrum. Both these systems provide clear cases where large geometry changes
between the anion and neutral molecule result in photoelectron spectra which are difficult to
analyze without the assistance of high-level electronic structure calculations.

178
7.5 References
1. Morris, R.A., et al., Effects of Electron and Ion Reactions on Atmospheric Lifetimes of Fully Fluorinated Compounds. Journal of Geophysical Research, [Atmospheres], 1995. 100(D1): p. 1287-1294.
2. Compton, R.N., et al., Nondissociative Electron Capture in Complex Molecules and Negative-Ion Lifetimes. Journal of Chemical Physics, 1966. 45(12): p. 4634.
3. Dehmer, J.L., J. Siegel, and D. Dill, Shape Resonances in E-SF6 Scattering. Journal of Chemical Physics, 1978. 69(11): p. 5205-5206.
4. Field, D., N.C. Jones, and J.P. Ziesel, Cold electron scattering in SF6 and C6F6: Bound and virtual state channels. Physical Review A, 2004. 69(5): p. 057216.
5. Ferch, J., W. Raith, and K. Schroder, Total Cross-Section Measurement for E-Sf6 Scattering down to 0.036 Ev. Journal of Physics B: Atomic, Molecular and Optical Physics, 1982. 15(5): p. L175-L178.
6. Christophorou, L.G. and J.K. Olthoff, Electron interactions with SF6. Journal of Physical and Chemical Reference Data, 2000. 29(3): p. 267-330.
7. Christophorou, L.G. and J.K. Olthoff, Electron interactions with c-C4F8. Journal of Physical and Chemical Reference Data, 2001. 30(2): p. 449-473.
8. Miller, T.M., J.F. Friedman, and A.A. Viggiano, Electron attachment and detachment and the electron affinity of cyclo-C4F8. Journal of Chemical Physics, 2004. 120(15): p. 7024-7028.
9. Braum, M., et al., IR photon enhanced dissociative electron attachment to SF6: Dependence on photon, vibrational, and electron energy. Journal of Chemical Physics, 2006.
10. Gianturco, F.A. and R.R. Lucchese, Electron scattering from gaseous SF6: Comparing calculations with experiments. Journal of Chemical Physics, 2001. 114(8): p. 3429-3439.
11. Chen, E.C.M., et al., The Negative-Ion States of Sulfur-Hexafluoride. Journal of Chemical Physics, 1988. 88(8): p. 4711-4719.
12. Babcock, L.M. and G.E. Streit, Ion-Molecule Reactions of SF6 - Determination of Ip(SF5), Ap(SF5+-SF6), and D(SF5-F). Journal of Chemical Physics, 1981. 74(10): p. 5700-5706.
13. Compton, R.N., P.W. Reinhardt, and C.D. Cooper, Collisional Ionization between Fast Alkali Atoms and Selected Hexafluoride Molecules. Journal of Chemical Physics, 1978. 68(5): p. 2023-2036.
14. Christophorou, L.G., Electron-Molecule interactions and their applications 1984, New York: Ed.; Academic.

179
15. Mock, R.S. and E.P. Grimsrud, Electron Photodetachment of the Molecular Anions of SF6 and Several Perfluorinated Hydrocarbons. Chemical Physics Letters, 1991. 184(1-3): p. 99-101.
16. Hay, P.J., The Relative Energies of SF6- and SF6 as a Function of Geometry. Journal of Chemical Physics, 1982. 76(1): p. 502-504.
17. Streit, G.E., Gas-Phase Reactions of O- and O2- with a Variety of Halogenated
Compounds. Journal of Physical Chemistry, 1982. 86(13): p. 2321-2324.
18. Lifshitz, C., T.O. Tiernan, and B.M. Hughes, Electron Affinities from Endothermic Negative-Ion Charge-Transfer Reactions .4. SF6, Selected Fluorocarbons and Other Polyatomic-Molecules. Journal of Chemical Physics, 1973. 59(6): p. 3182-3192.
19. Datskos, P.G., J.G. Carter, and L.G. Christophorou, Photodetachment of SF6-. Chemical Physics Letters, 1995. 239(1-3): p. 38-43.
20. Klobukowski, M., et al., Towards Hf Scf Value of Electron-Affinity of SF6. Journal of Chemical Physics, 1987. 86(3): p. 1637-1638.
21. Mcdowell, R.S. and B.J. Krohn, Vibrational Levels and Anharmonicity in SF6 .2. Anharmonic and Potential Constants. Spectrochimica Acta, Part A: Molecular Spectroscopy, 1986. 42(2-3): p. 371-385.
22. Gutsev, G.L. and R.J. Bartlett, Adiabatic electron affinities of PF5 and SF6: a coupled-cluster study. Molecular Physics, 1998. 94(1): p. 121-125.
23. Drzaic, P.S. and J.I. Brauman, Electron Photodetachment Study of Sulfur-Hexafluoride Anion - Comments on the Structure of SF6-. Journal of the American Chemical Society, 1982. 104(1): p. 13-19.
24. Lugez, C.L., et al., Experimental and ab initio study of the infrared spectra of ionic species derived from SF6 and SF4 and trapped in solid neon. Journal of Chemical Physics, 1998. 108(23): p. 9639-9650.
25. Frisch, M.J., et al., Gaussian 03, Revision B.052003, Pittsburgh: Gaussian, Inc.
26. Borrelli, R., Franck-Condon analysis of the SF6- electron photodetachment spectrum.
Chemical Physics Letters, 2007. 445(4-6): p. 84-88.
27. Brinkmann, N.R. and H.F. Schaefer, The SF6- enigma for density functional theory: is the
KMLYP functional a reasonable solution for this problematic anion? Chemical Physics Letters, 2003. 381(1-2): p. 123-128.
28. Eisfeld, W., Highly accurate determination of the electron affinity of SF6 and analysis of structure and photodetachment spectrum of SF6. Journal of Chemical Physics, 2011. 134(5).
29. Gutsev, G.L. and T. Ziegler, Theoretical-Study on Neutral and Anionic Halocarbynes and Halocarbenes. J. Phys. Chem., 1991. 95(19): p. 7220-7228.
30. Bopp, J.C., et al., Spectroscopic characterization of the isolated SF6- and C4F8
- anions: Observation of very long harmonic progressions in symmetric deformation modes upon photodetachment. Journal of Physical Chemistry A, 2007. 111(7): p. 1214-1221.

180
31. Fischer, G., R.L. Purchase, and D.M. Smith, The ring-puckering motion in perfluorocyclobutane. Journal of Molecular Structure, 1997. 405(2-3): p. 159-167.
32. Bauman, R.P. and B.J. Bulkin, Spectra and Structure of Perfluorocyclobutane. Journal of Chemical Physics, 1966. 45(2): p. 496.
33. Mao, C., C.S. Nie, and Z.Y. Zhu, Normal Coordinate Analyses of C4-C6 Perfluorocycloparaffins. Spectrochimica Acta, Part A: Molecular Spectroscopy, 1988. 44(11): p. 1093-1098.
34. Beagley, B., et al., The Molecular-Structure of Perfluoro-Thiirane in the Presence of Perfluoro-Cyclobutane - a Gas-Phase Electron-Diffraction Study. Journal of Molecular Structure, 1987. 158: p. 309-314.
35. Chang, C.H., R.F. Porter, and S.H. Bauer, Molecular Structures of Perfluorocyclobutane and Perfluorocyclobutene, Determined by Electron Diffraction. Journal of Molecular Structure, 1971. 7(1-2): p. 89.
36. Lemaire, H.P. and R.L. Livingston, The Molecular Structures of Octafluorocyclobutane and of Methylcyclobutane. Journal of the American Chemical Society, 1952. 74: p. 5732.
37. Miller, F.A. and R.J. Capwell, Infrared and Raman Spectra of Octachloroxycyclobutane, Octafluoroxycyclobutane, and Octahydroxycyclobutane. Spectrochimica Acta, Part A: Molecular Spectroscopy, 1971. A 27(7): p. 1113.
38. Blake, T.A., et al., High-resolution infrared Spectroscopy in the 1200-1300 cm-1 region and accurate theoretical estimates for the structure and ring-puckering barrier of perfluorocyclobutane. Journal of Physical Chemistry A, 2007. 111(44): p. 11328-11341.
39. ElSohly, A.M., et al., Computational and ESR studies of electron attachment to decafluorocyclopentane, octafluorocyclobutane, and hexafluorocyclopropane: Electron affinities of the molecules and the structures of their stable negative ions as determined from C-13 and F-19 hyperfine coupling constants. Journal of the American Chemical Society, 2005. 127(30): p. 10573-10583.
40. Gallup, G.A., The structures of c-C4F8 and c-C4F8- and the adiabatic electron affinity of c-C4F8. Chemical Physics Letters, 2004. 399(1-3): p. 206-209.
41. Hiraoka, K., et al., Gas-phase ion/molecule reactions in octafluorocyclobutane. Journal of Chemical Physics, 2002. 116(17): p. 7574-7582.
42. Borrelli, R. and A. Peluso, The electron photodetachment spectrum of c-C4F8-: A test
case for the computation of Franck-Condon factors of highly flexible molecules. J. Chem. Phys., 2008. 128(4).
43. Grimsrud, E.P., S. Chowdhury, and P. Kebarle, Electron-Affinity of SF6 and Perfluoromethylcyclohexane - the Unusual Kinetics of Electron-Transfer Reactions a-+B=a+B-, Where a=SF6 or Perfluorinated Cyclo-Alkanes. Journal of Chemical Physics, 1985. 83(3): p. 1059-1068.
44. Johnson, M.A. and W.C. Lineberger, Pulsed Methods for Cluster Ion Spectroscopy, in Techniques for the Study of Ion Molecule Reactions, J.M. Farrar and J.W. Saunders, Editors. 1988, Wiley: New York. p. 591-635.

181
45. Mcdowell, R.S., et al., Vibrational Levels and Anharmonicity in SF6 .1. Vibrational Band Analysis. Spectrochimica Acta, Part A: Molecular Spectroscopy, 1986. 42(2-3): p. 351-369.

182
8 Bibliography
Aberth, W. (1986). "High mass analysis capability of a Wien spectrometer." International Journal of Mass Spectrometry and Ion Processes 68(1-2): 209-212.
Adamo, C., R. Subra, A. Di Matteo and V. Barone (1998). "Structure and magnetic properties of benzyl, anilino, and phenoxyl radicals by density functional computations." Journal of Chemical Physics 109(23): 10244-10254.
Andersen, T., H. K. Haugen and H. Hotop (1999). "Binding energies in atomic negative ions: III." Journal of Physical and Chemical Reference Data 28(6): 1511-1533.
Andrews, L. (1968). "Infrared Spectrum of Dichlorocarbene in Solid Argon." J. Chem. Phys. 48(3): 979-&.
Axworthy, A. E., V. H. Dayan and G. B. Martin (1978). "Reactions of fuel-nitrogen compounds under conditions of inert pyrolysis." Fuel 57(1): 29-35.
Babcock, L. M. and G. E. Streit (1981). "Ion-Molecule Reactions of SF6- Determination of
Ip(SF5), Ap(SF5+-SF6), and D(SF5-F)." Journal of Chemical Physics 74(10): 5700-5706.
Barckholtz, C., T. A. Barckholtz and C. M. Hadad (1999). "C-H and N-H bond dissociation energies of small aromatic hydrocarbons." J. Am. Chem. Soc. 121(3): 491.
Barden, C. J. and H. F. Schaefer (2000). "The singlet-triplet separation in dichlorocarbene: A surprising difference between theory and experiment." J. Chem. Phys. 112(15): 6515-6516.
Bartmess, J. E., J. A. Scott and R. T. McIver (1979). "Scale of acidities in the gas phase from methanol to phenol." Journal of the American Chemical Society 101(20): 6046-6056.
Bauman, R. P. and B. J. Bulkin (1966). "Spectra and Structure of Perfluorocyclobutane." Journal of Chemical Physics 45(2): 496.
Bauschlicher, C. W. (1980). "Singlet-Triplet Separation in CBr2." J. Am. Chem. Soc. 102(17): 5492-5493.
Beagley, B., R. Calladine, R. G. Pritchard and S. F. Taylor (1987). "The Molecular-Structure of Perfluoro-Thiirane in the Presence of Perfluoro-Cyclobutane - a Gas-Phase Electron-Diffraction Study." Journal of Molecular Structure 158: 309-314.
Becke, A. D. (1993). "Density-functional thermochemistry. III. The role of exact exchange." Journal of Chemical Physics 98(7): 5648-5652.
Berkowitz, J., G. B. Ellison and D. Gutman (1994). "3 methods to measure RH bond-energies." Journal of Physical Chemistry 98(11): 2744-2765.
Bierbaum, V. M. (2003). Theory and Ion Chemistry. Encyclopedia of Mass Spectrometry. M. L. Gross and R. Caprioli. Amsterdam, Elsevier. 1: 276.
183
Blake, T. A., E. A. Glendening, R. L. Sams, S. W. Sharpe and S. S. Xantheas (2007). "High-resolution infrared Spectroscopy in the 1200-1300 cm-1 region and accurate theoretical estimates for the structure and ring-puckering barrier of perfluorocyclobutane." Journal of Physical Chemistry A 111(44): 11328-11341.
Blondel, C., P. Cacciani, C. Delsart and R. Trainham (1989). "High Resolution Determination of the Electron Affinity of Fluorine and Bromine using Crossed Ion and Laser Beams." Phys. Rev. A 40: 3698.
Bondybey, V. E. (1977). "Emission and Excitation-Spectra of Ccl2 in Solid Argon." J. Mol. Spec. 64(2): 180-183.
Bondybey, V. E. and J. H. English (1980). "Laser Excitation-Spectra and Lifetimes of CBrCl and CBr2 in Solid Ar." J. Mol. Spec. 79(2): 416-423.
Bopp, J. C., J. R. Roscioli, et al. (2007). "Spectroscopic characterization of the isolated SF6- and
C4F8- anions: Observation of very long harmonic progressions in symmetric deformation
modes upon photodetachment." Journal of Physical Chemistry A 111(7): 1214-1221.
Borden, W. T., Ed. (1982). Diradicals. New York, Wiley.
Born, M., S. Ingemann and N. M. M. Nibbering (2000). "Thermochemical properties of halogen-substituted methanes, methyl radicals, and carbenes in the gas phase." Int. J. Mass Spectrom. 194(2-3): 103.
Borrelli, R. (2007). "Franck-Condon analysis of the SF6- electron photodetachment spectrum."
Chemical Physics Letters 445(4-6): 84-88.
Borrelli, R. and A. Peluso (2006). "The vibrational progressions of the N -> V electronic transition of ethylene: A test case for the computation of Franck-Condon factors of highly flexible photoexcited molecules." J. Chem. Phys. 125(19).
Borrelli, R. and A. Peluso (2008). "The electron photodetachment spectrum of c-C4F8-: A test
case for the computation of Franck-Condon factors of highly flexible molecules." J. Chem. Phys. 128(4).
Braum, M., F. Gruber, et al. (2006). "IR photon enhanced dissociative electron attachment to SF6: Dependence on photon, vibrational, and electron energy." Journal of Chemical Physics
Brauman, J. I. and L. K. Blair (1970). "Gas-phase acidities of alcohols." Journal of the American Chemical Society 92(20): 5986
Brehm, B., M. A. Gusinow and J. L. Hall (1967). "Electron affinity of helium via laser photodetachment of its negative ion." Physical Review Letters 19(13): 737.
Brinkmann, N. R. and H. F. Schaefer (2003). "The SF6- enigma for density functional theory: is
the KMLYP functional a reasonable solution for this problematic anion?" Chemical Physics Letters 381(1-2): 123-128.
Carl Lineberger, W. and W. Thatcher Borden (2011). "The synergy between qualitative theory, quantitative calculations, and direct experiments in understanding, calculating, and measuring the energy differences between the lowest singlet and triplet states of organic diradicals." Physical Chemistry Chemical Physics 13(25): 11792-11813.

184
Carter, E. A. and W. A. Goddard (1986). "Relation between Singlet Triplet Gaps and Bond-Energies." J. Phys. Chem. 90(6): 998-1001.
Carter, E. A. and W. A. Goddard (1987). "New Predictions for Singlet Triplet Gaps of Substituted Carbenes." J. Phys. Chem. 91(18): 4651-4652.
Carter, E. A. and W. A. Goddard (1988). "Correlation-Consistent Singlet Triplet Gaps in Substituted Carbenes." J. Chem. Phys. 88(3): 1752-1763.
Chang, C. H., R. F. Porter and S. H. Bauer (1971). "Molecular Structures of Perfluorocyclobutane and Perfluorocyclobutene, Determined by Electron Diffraction." Journal of Molecular Structure 7(1-2): 89.
Chau, F. T., D. K. W. Mok, E. P. F. Lee and J. M. Dyke (2005). "The singlet-triplet separation in CF2: State-of-the-art ab initio calculations and Franck-Condon simulations including anharmonicity." ChemPhysChem 6(10): 2037-2045.
Chen, E. C. M., L. R. Shuie, E. D. Dsa, C. F. Batten and W. E. Wentworth (1988). "The Negative-Ion States of Sulfur-Hexafluoride." Journal of Chemical Physics 88(8): 4711-4719.
Chen, P., Ed. (1994). Unimolecular and Bimolecular Ion-Molecule Reaction Dynamics. Chichester, Wiley & Sons
Choe, J. I., S. R. Tanner and M. D. Harmony (1989). "Laser-Excitation Spectrum and Structure of CCl2 in a Free-Jet Expansion from a Heated Nozzle." J. Mol. Spec. 138(2): 319-331.
Christophorou, L. G. (1984). Electron-Molecule interactions and their applications. New York, Ed.; Academic.
Christophorou, L. G. and J. K. Olthoff (2000). "Electron interactions with SF6." Journal of Physical and Chemical Reference Data 29(3): 267-330.
Christophorou, L. G. and J. K. Olthoff (2001). "Electron interactions with c-C4F8." Journal of Physical and Chemical Reference Data 30(2): 449-473.
Clouthier, D. J. and J. Karolczak (1989). "Pyrolysis Jet Spectroscopy - Rotationally Resolved Electronic-Spectrum of Dichlorocarbene." J. Phys. Chem. 93(22): 7542-7544.
Clouthier, D. J. and J. Karolczak (1991). "A Pyrolysis Jet Spectroscopic Study of the Rotationally Resolved Electronic-Spectrum of Dichlorocarbene." J. Chem. Phys. 94(1): 1-10.
Compton, R. N., Christop.Lg, G. S. Hurst and Reinhard.Pw (1966). "Nondissociative Electron Capture in Complex Molecules and Negative-Ion Lifetimes." Journal of Chemical Physics 45(12): 4634.
Compton, R. N., P. W. Reinhardt and C. D. Cooper (1978). "Collisional Ionization between Fast Alkali Atoms and Selected Hexafluoride Molecules." Journal of Chemical Physics 68(5): 2023-2036.
Continetti, R. E. (2001). "Coincidence Spectroscopy." Annual Review of Physical Chemistry 52(1): 165-192.
Cooper, J. and R. N. Zare (1968). "Angular Distribution Of Photoelectrons." J. Chem. Phys. 48(2): 942.

185
Datskos, P. G., J. G. Carter and L. G. Christophorou (1995). "Photodetachment of SF6-."
Chemical Physics Letters 239(1-3): 38-43.
Davico, G. E., V. M. Bierbaum, C. H. DePuy, G. B. Ellison and R. R. Squires (1995). "The C-H bond-energy of benzene." Journal of the American Chemical Society 117(9): 2590-2599.
Dehmer, J. L., J. Siegel and D. Dill (1978). "Shape Resonances in E-SF6 Scattering." Journal of Chemical Physics 69(11): 5205-5206.
DePuy, C. H., V. M. Bierbaum and R. Damrauer (1984). "Relative gas-phase acidities of the alkanes." Journal of the American Chemical Society 106(14): 4051-4053.
DePuy, C. H., S. R. Kass and G. P. Bean (1988). "Formation and Reactions of Heteroaromatic Anions in the Gas-Phase." J. Org. Chem. 53(19): 4427.
Doughty, A. and J. C. Mackie (1994). "Kinetics of thermal-decompotion of the diazines – shock-tube pyrolysis of pyrimidine." Journal of the Chemical Society-Faraday Transactions 90(4): 541-548.
Drake, S. A., J. M. Standard and R. W. Quandt (2002). "An ab initio investigation of the ground and excited electronic state properties of a series of bromine- and iodine-containing singlet carbenes." J. Phys. Chem. A 106(7): 1357-1364.
Drzaic, P. S. and J. I. Brauman (1982). "Electron Photodetachment Study of Sulfur-Hexafluoride Anion - Comments on the Structure of SF6
-." Journal of the American Chemical Society 104(1): 13-19.
Drzaic, P. S. and J. I. Brauman (1984). "Electron photodetachment from phenylnitrene, anilide, and benzyl anions - Electron-affinities of the anilino and benzyl radicals and phenylnitrene." Journal of Physical Chemistry 88(22): 5285-5290.
Dunning, T. H. (1989). "Gaussian-basis sets for use in correlated molecular calculations. 1. The atoms boron through neon and hydrogen." Journal of Chemical Physics 90(2): 1007-1023.
Duschinsky, F. (1937). "The importance of the electron spectrum in multi atomic molecules. concerning the Franck-Condon principle." Acta Physicochimica Urss 7(4): 551-566.
Dyke, J. M., E. P. F. Lee, D. K. W. Mok and F. T. Chau (2005). "A combined ab initio/Franck-Condon study of the A-X single-vibronic-level emission spectrum of CCl2 and the photodetachment spectrum of CCl." ChemPhysChem 6(10): 2046-2059.
Eisfeld, W. (2011). "Highly accurate determination of the electron affinity of SF6 and analysis of structure and photodetachment spectrum of SF6." Journal of Chemical Physics 134(5).
Ellis, A. M., M. Feher and T. G. Wright (2005). Electronic and Photoelectron Spectroscopy. Cambridge, Cambridge University Press.
Ellison, G. B., G. E. Davico, V. M. Bierbaum and C. H. DePuy (1996). "Thermochemistry of the benzyl and allyl radicals and ions." International Journal of Mass Spectrometry and Ion Processes 156(1-2): 109-131.
ElSohly, A. M., G. S. Tschumper, R. A. Crocombe, J. T. Wang and F. Williams (2005). "Computational and ESR studies of electron attachment to decafluorocyclopentane, octafluorocyclobutane, and hexafluorocyclopropane: Electron affinities of the molecules
186
and the structures of their stable negative ions as determined from C-13 and F-19 hyperfine coupling constants." Journal of the American Chemical Society 127(30): 10573-10583.
Ervin, K. M. (2008). PESCAL, Fortran program.
Ervin, K. M. (2010). "PESCAL, Fortran program." PESCAL, Fortran program.
Ervin, K. M., W. Anusiewicz, P. Skurski, J. Simons and W. C. Lineberger (2003). "The Only Stable State of O2
− Is the X 2Πg Ground State and It (Still!) Has an Adiabatic Electron Detachment Energy of 0.45 eV." J. Phys. Chem. A 107(41): 8521.
Ervin, K. M. and V. F. DeTuro (2002). "Anchoring the gas-phase acidity scale." Journal of Physical Chemistry A 106(42): 9947-9956.
Ervin, K. M., J. Ho and W. C. Lineberger (1988). "Electronic and vibrational structure of transition metal trimers: photoelectron spectra of Ni3
−, Pd3−, and Pt3
−." Journal of Chemical Physics 89(8): 4514-4521.
Ervin, K. M., J. Ho and W. C. Lineberger (1988). "Ultraviolet Photoelectron-Spectrum of No2." J. Phys. Chem. 92(19): 5405-5412.
Ervin, K. M., J. Ho and W. C. Lineberger (1989). "A Study of the Singlet and Triplet-States of Vinylidene by Photoelectron-Spectroscopy of H2C=C-, D2C=C-, and HDC=C- - Vinylidene Acetylene Isomerization." J. Chem. Phys. 91(10): 5974-5992.
Ervin, K. M. and W. C. Lineberger (1992). Advances in Gas Phase Ion Chemistry. Advances in Gas Phase Ion Chemistry. N. G. Adams and L. M. Babcock. Greenwich, JAI. 1: 121.
Ervin, K. M., T. M. Ramond, et al. (2001). "Naphthyl radical: Negative ion photoelectron spectroscopy, Franck-Condon simulation, and thermochemistry." J. Phys. Chem. A 105(48): 10822.
Eyet, N., S. M. Villano and V. M. Bierbaum (2009). "Anchoring the gas-phase acidity scale: From formic acid to methanethiol." International Journal of Mass Spectrometry 283(1-3): 26-29.
Fehsenfe.Fc, K. M. Evenson and H. P. Broida (1965). "Microwave discharge cavities operating at 2450 MHz." Review of Scientific Instruments 36(3): 294
Feigerle, C. S. (1983). Ph.D. Thesis, University of Colorado.
Ferch, J., W. Raith and K. Schroder (1982). "Total Cross-Section Measurement for E-SF6 Scattering down to 0.036 Ev." Journal of Physics B: Atomic, Molecular and Optical Physics 15(5): L175-L178.
Field, D., N. C. Jones and J. P. Ziesel (2004). "Cold electron scattering in SF6 and C6F6: Bound and virtual state channels." Physical Review A 69(5): 057216.
FinlaysonPitts, B. J. and J. N. Pitts (1997). "Tropospheric air pollution: Ozone, airborne toxics, polycyclic aromatic hydrocarbons, and particles." Science 276(5315): 1045-1052.
Fischer, G., R. L. Purchase and D. M. Smith (1997). "The ring-puckering motion in perfluorocyclobutane." Journal of Molecular Structure 405(2-3): 159-167.
187
Fried, L. E., M. R. Manaa, P. F. Pagoria and R. L. Simpson (2001). "Design and synthesis of energetic materials." Annual Review of Materials Research 31(1): 291-321.
Frisch, M. J., G. W. Trucks, et al. (2003). Gaussian 03, Revision B.05. Pittsburgh, Gaussian, Inc.
Frisch, M. J., G. W. Trucks, et al. (2004). Gaussian 03, Revision B.01. Wallingford, CT, Gaussian, Inc.
Fujitake, M. and E. Hirota (1989). "The Millimeter-Wave and Submillimeter-Wave Spectrum of Dichlorocarbene CCl2 - Electronic-Structure Estimated from the Nuclear-Quadrupole Coupling-Constants." J. Chem. Phys. 91(6): 3426-3430.
Gallup, G. A. (2004). "The structures of c-C4F8 and c-C4F8- and the adiabatic electron affinity of
c-C4F8." Chemical Physics Letters 399(1-3): 206-209.
Garcia, V. M., O. Castell, M. Reguero and R. Caballol (1996). "Singlet-triplet energy gap in halogen-substituted carbenes and silylenes: A difference-dedicated configuration interaction calculation." Mol. Phys. 87(6): 1395-1404.
Garver, J., Z. Yang, et al. (2011). "Gas Phase Reactions of 1,3,5-Triazine: Proton Transfer, Hydride Transfer, and Anionic σ-Adduct Formation." Journal of the American Society for Mass Spectrometry 22(7): 1260-1272.
Gianola, A. J., T. Ichino, S. Kato, V. M. Bierbaum and W. C. Lineberger (2006). "Thermochemical studies of pyrazolide." J. Phys. Chem. A 110(27): 8457.
Gianturco, F. A. and R. R. Lucchese (2001). "Electron scattering from gaseous SF6: Comparing calculations with experiments." Journal of Chemical Physics 114(8): 3429-3439.
Gobbi, A. and G. Frenking (1993). "The Singlet-Triplet Gap of the Halonitrenium Ions NHX+, NX2
+ and the Halocarbenes CHX, CX2 (X= F, Cl, Br, I)." J. Chem. Soc.-Chem. Communications(14): 1162-1164.
Grimsrud, E. P., S. Chowdhury and P. Kebarle (1985). "Electron-Affinity of SF6 and Perfluoromethylcyclohexane - the Unusual Kinetics of Electron-Transfer Reactions a-+B=a+B-, Where a=SF6 or Perfluorinated Cyclo-Alkanes." Journal of Chemical Physics 83(3): 1059-1068.
Gunion, R. F. (1995). Ultraviolet Photoelectron Spectroscopy of Molecular Anions. Doctor of Philosophy, Boulder.
Gunion, R. F., M. K. Gilles, M. L. Polak and W. C. Lineberger (1992). Int. J. Mass Spectrom. Ion Processes 117: 601.
Gunion, R. F., M. K. Gilles, M. L. Polak and W. C. Lineberger (1992). "Ultraviolet photoelectron-spectroscopy of the phenide, benzyl and phenoxide anions, with ab initio calculations." International Journal of Mass Spectrometry and Ion Processes 117(1-3): 601-620.
Gutsev, G. L. and R. J. Bartlett (1998). "Adiabatic electron affinities of PF5 and SF6: a coupled-cluster study." Molecular Physics 94(1): 121-125.
Gutsev, G. L. and T. Ziegler (1991). "Theoretical-Study on Neutral and Anionic Halocarbynes and Halocarbenes." J. Phys. Chem. 95(19): 7220-7228.
188
Hajgato, B., H. M. T. Nguyen, T. Veszpremi and M. T. Nguyen (2000). "Triplet-singlet energy gaps in iodo-carbenes (I-C-X): Remarkable discrepancy between theory and experiment." Phys. Chem. Chem. Phys. 2(22): 5041-5045.
Halls, M. D., J. Velkovski and H. B. Schlegel (2001). "Harmonic frequency scaling factors for Hartree-Fock, S-VWN, B-LYP, B3-LYP, B3-PW91 and MP2 with the Sadlej pVTZ electric property basis set." Theoretical Chemistry Accounts 105(6): 413-421.
Hanstorp, D., C. Bengtsson and D. J. Larson (1989). "Angular-distributions in photodetachment from O." Physical Review A 40(2): 670-675.
Hanstorp, D. and M. Gustafsson (1992). "Determination of the Electron-Affinity of Iodine." J. Phys. B 25(8): 1773-1783.
Hay, P. J. (1982). "The Relative Energies of SF6- and SF6 as a Function of Geometry." Journal
of Chemical Physics 76(1): 502-504.
Herzberg, G. (1966). Electronic Spectra and Electronic Structure of Polyatomic Molecules. New York, Van Nostrand Reinhold.
Hiraoka, K., T. Mizuno, et al. (2002). "Gas-phase ion/molecule reactions in octafluorocyclobutane." Journal of Chemical Physics 116(17): 7574-7582.
Ho, J. (1992). University of Colorado.
Ho, J., K. M. Ervin and W. C. Lineberger (1990). "Photoelectron-Spectroscopy of Metal Cluster Anions - Cun-, Agn-, and Aun." Journal of Chemical Physics 93(10): 6987-7002.
Hore, N. R. and D. K. Russell (1998). "Radical pathways in the thermal decomposition of pyridine and diazines: a laser pyrolysis and semi-empirical study." Journal of the Chemical Society-Perkin Transactions 2(2): 269-275.
Ichino, T., A. J. Gianola, S. Kato, V. M. Bierbaum and W. C. Lineberger (2007). "Structure of the vinyldiazomethyl anion and energetic comparison to the cyclic isomers." Journal of Physical Chemistry A 111(34): 8374-8383.
Ichino, T., S. W. Wren, et al. (2008). "The vibronic level structure of the cyclopentadienyl radical." Journal of Chemical Physics 129(8).
Ivey, R. C., P. D. Schulze, T. L. Leggett and D. A. Kohl (1974). "Electron-Diffraction Study of Structure of Dibromomethylene Radical." J. Chem. Phys. 60(8): 3174-3177.
Jennings, K. R. (1979). "Negative Ions." Philosophical Transactions of the Royal Society of London. Series A, Mathematical and Physical Sciences 293(1400): 125-133.
Jensen, K. and E. Veje (1974). "Construction of a Wien filter heavy-ion accelerator." Nuclear Instruments & Methods 122(3): 511-515.
Johnson, M. A. and W. C. Lineberger (1988). Pulsed Methods for Cluster Ion Spectroscopy. Techniques for the Study of Ion-Molecule Reactions. J. M. Farrar and J. W. H. Saunders. New York, Wiley. 20: 591-635.
Johnson, M. A. and W. C. Lineberger (1988). Pulsed Methods for Cluster Ion Spectroscopy. Techniques for the Study of Ion Molecule Reactions. J. M. Farrar and J. W. Saunders. New York, Wiley: 591-635.
189
Jones, J., G. B. Bacskay, J. C. Mackie and A. Doughty (1995). "Ab-initio studies of the thermal-decomposition of azaaromatics- Free-radical versus intermolecular mechanism." Journal of the Chemical Society-Faraday Transactions 91(11): 1587-1592.
Kelleher, D. E., W. C. Martin, et al. (1999). "The new NIST Atomic Spectra Database." Physica Scripta T83: 158-161.
Kemister, G., A. Pross, L. Radom and R. W. Taft (1980). "A theoretical approach to substituent effects. Examination of phenoxides and anilides as models for benzyl anions." The Journal of Organic Chemistry 45(6): 1056-1060.
Kiefer, J. H., Q. Zhang, R. D. Kern, J. Yao and B. Jursic (1997). "Pyrolyses of aromatic azines: Pyrazine, pyrimidine, and pyridine." Journal of Physical Chemistry A 101(38): 7061-7073.
Kikuchi, H., M. Kubo, N. Watanabe and H. Suzuki (2003). "Computational method for calculating multidimensional Franck-Condon factors: Based on Sharp-Rosenstock's method." J. Chem. Phys. 119(2): 729.
Kikuchi, O., Y. Hondo, K. Morihashi and M. Nakayama (1988). "An ab initio molecular-orbital study of pyridyl radicals." Bulletin of the Chemical Society of Japan 61(1): 291-292.
King, G. A., T. A. A. Oliver and M. N. R. Ashfold (2010). "Dynamical insights into (1)pi sigma* state mediated photodissociation of aniline." Journal of Chemical Physics 132(21).
Kirmse, W. (1971). Carbene Chemistry. New York, Academic Press.
Klobukowski, M., Z. Barandiaran, L. Seijo and S. Huzinaga (1987). "Towards Hf Scf Value of Electron-Affinity of SF6." Journal of Chemical Physics 86(3): 1637-1638.
Kogelnik, H. and T. Li (1966). "Laser beams and resonators." Applied Optics 5(10): 1550-&.
Lee, C. T., W. T. Yang and R. G. Parr (1988). "Development of the colle-salvetti correlation-energy formula into a functional of the electron-density." Physical Review B 37(2): 785-789.
Lee, E. P. F., J. M. Dyke and T. G. Wright (2000). "The lowest singlet-triplet gap in CCl2, CBr2 and CI2." Chem. Phys. Lett. 326(1-2): 143-150.
Lee, J. and J. J. Grabowski (1992). "Reactions of the Atomic Oxygen Radical Anion and the Synthesis of Organic Reactive Intermediates." Chem. Rev. 92(7): 1611.
Lemaire, H. P. and R. L. Livingston (1952). "The Molecular Structures of Octafluorocyclobutane and of Methylcyclobutane." Journal of the American Chemical Society 74: 5732.
Leopold, D. G., K. K. Murray, A. E. S. Miller and W. C. Lineberger (1985). "Methylene: A study of the X 3B1 and a 1A1 states by photoelectron spectroscopy of CH2
− and CD2−." J.
Chem. Phys. 83(10): 4849.
Li, Q. S., J. F. Zhao, Y. M. Xie and H. F. Schaefer (2002). "Electron affinities, molecular structures, and thermochemistry of the fluorine, chlorine and bromine substituted methyl radicals." Mol. Phys. 100(23): 3615.
190
Liang, J., X. L. Kong, X. Y. Zhang and H. Y. Li (2004). "Geometries of the Halocarbene anions HCF- and CF2-: ab initio calculation and Franck-Condon analysis." J. Mol. Structure-Theochem 672(1-3): 133-139.
Lifshitz, C., T. O. Tiernan and B. M. Hughes (1973). "Electron Affinities from Endothermic Negative-Ion Charge-Transfer Reactions .4. SF6, Selected Fluorocarbons and Other Polyatomic-Molecules." Journal of Chemical Physics 59(6): 3182-3192.
Liu, M. L., C. L. Lee, et al. (2003). "Dispersed fluorescence spectra of the CCl2 (A) - (X) vibronic bands." Phys. Chem. Chem. Phys. 5(7): 1352-1358.
Lugez, C. L., M. E. Jacox, R. A. King and H. F. Schaefer (1998). "Experimental and ab initio study of the infrared spectra of ionic species derived from SF6 and SF4 and trapped in solid neon." Journal of Chemical Physics 108(23): 9639-9650.
Mabbs, R., E. R. Grumbling, K. Pichugin and A. Sanov (2009). "Photoelectron imaging: an experimental window into electronic structure." Chemical Society Reviews 38(8): 2169-2177.
Mackie, J. C., M. B. Colket and P. F. Nelson (1990). "Shock-tube pyrolysis of pyridine." Journal of Physical Chemistry 94(10): 4099-4106.
Mackie, J. C., M. B. Colket, P. F. Nelson and M. Esler (1991). "Shock-tube Pyrolysis of Pyrrole and Kinetic Modeling." Int. J. Chem. Kinet. 23(8): 733.
Mao, C., C. S. Nie and Z. Y. Zhu (1988). "Normal Coordinate Analyses of C4-C6 Perfluorocycloparaffins." Spectrochimica Acta, Part A: Molecular Spectroscopy 44(11): 1093-1098.
Martin, J. D. D. and J. W. Hepburn (1998). "Determination of bond dissociation energies by threshold ion-pair production spectroscopy: An improved D-0(HCl)." J. Chem. Phys. 109: 8139.
Marynowski, M., W. Franzen and M. Elbatanouny (1994). "Analysis of the properties of an electrostatic triplet quadrupole lens used as an electron-beam transport device." Review of Scientific Instruments 65(12): 3718-3723.
Mcdowell, R. S. and B. J. Krohn (1986). "Vibrational Levels and Anharmonicity in SF6 .2. Anharmonic and Potential Constants." Spectrochimica Acta, Part A: Molecular Spectroscopy 42(2-3): 371-385.
Mcdowell, R. S., B. J. Krohn, H. Flicker and M. C. Vasquez (1986). "Vibrational Levels and Anharmonicity in SF6 .1. Vibrational Band Analysis." Spectrochimica Acta, Part A: Molecular Spectroscopy 42(2-3): 351-369.
McKee, M. L. and J. Michl (2002). "A possible reinterpretation of the photoelectron spectra of CCl2, CBr2, and CI2: A role for quartet isodihalocarbene or dihalocarbene radical anions?" J. Phys. Chem. A 106(37): 8495-8497.
Meotner, M. and S. A. Kafafi (1988). "Carbon acidities of aromatic-compounds." Journal of the American Chemical Society 110(19): 6297-6303.
191
Miller, F. A. and R. J. Capwell (1971). "Infrared and Raman Spectra of Octachloroxycyclobutane, Octafluoroxycyclobutane, and Octahydroxycyclobutane." Spectrochimica Acta, Part A: Molecular Spectroscopy A 27(7): 1113-&.
Miller, T. M., J. F. Friedman and A. A. Viggiano (2004). "Electron attachment and detachment and the electron affinity of cyclo-C4F8." Journal of Chemical Physics 120(15): 7024-7028.
Mock, R. S. and E. P. Grimsrud (1991). "Electron Photodetachment of the Molecular Anions of SF6 and Several Perfluorinated Hydrocarbons." Chemical Physics Letters 184(1-3): 99-101.
Moore, J. H., C. C. Davis and M. A. Coplan (2003). Building Scientific Apparatus. Boulder, Westview Press.
Morris, R. A., T. M. Miller, et al. (1995). "Effects of Electron and Ion Reactions on Atmospheric Lifetimes of Fully Fluorinated Compounds." Journal of Geophysical Research, [Atmospheres] 100(D1): 1287-1294.
Moss, R. A. and M. Jones, Eds. (1975). Carbenes. New York, Wiley.
Moss, R. A. and M. Jones, Eds. (1978). Reactive Intermediates. New York, Wiley.
Mukarakate, C., Y. Mishchenko, D. Brusse, C. Tao and S. A. Reid (2006). "Probing spin-orbit mixing and the singlet-triplet gap in dichloromethylene via K-a-sorted emission spectra." Phys. Chem. Chem. Phys. 8(37): 4320-4326.
Muller, C. W., J. J. Newby, C. P. Liu, C. P. Rodrigo and T. S. Zwier (2010). "Duschinsky mixing between four non-totally symmetric normal coordinates in the S-1-S-0 vibronic structure of (E)-phenylvinylacetylene: a quantitative analysis." Physical Chemistry Chemical Physics 12(10): 2331-2343.
Murray, K. K., D. G. Leopold, T. M. Miller and W. C. Lineberger (1988). "Photoelectron-Spectroscopy of the Halocarbene Anions HCF-, HCCI-, HCBr-, HCI-, CF2
-, and CCI2." J. Chem. Phys. 89(9): 5442-5453.
Neumark, D. M., K. R. Lykke, T. Andersen and W. C. Lineberger (1985). "Laser photodetachment measurement of the electron-affinity of atomic oxygen." Phys. Rev. A 32(3): 1890.
Novick, S. E., P. C. Engelking, P. L. Jones, J. H. Futrell and W. C. Lineberger (1979). "Laser Photoelectron, Photodetachment, and Photodestruction Spectra of O-3." J. Chem. Phys. 70(6): 2652-2662.
Parker, N. W. (1988). Wien Filter Design, MicroBeam Inc.
Pohl, J. H. and A. F. Sarofim (1977). "Devolatilization and oxidation of coal nitrogen." Symposium (International) on Combustion 16(1): 491-501.
Pople, J. A., M. Headgordon and K. Raghavachari (1987). "Quadratic Configuration-Interaction - a General Technique for Determining Electron Correlation Energies." Journal of Chemical Physics 87(10): 5968-5975.
Ramond, T. M. (2001). Negative Ion Photoelectron Spectroscopy of Alkyl Peroxides, Alkoxides, and Group VIII Transition Metal Oxides, University of Colorado.

192
Rappoport, Z. Z., Ed. (2007). The Chemistry of Anilines, Part 1.
Reimers, J. R. (2001). "A practical method for the use of curvilinear coordinates in calculations of normal-mode-projected displacements and Duschinsky rotation matrices for large molecules." J. Chem. Phys. 115(20): 9103.
Robinson, M. S., M. L. Polak, V. M. Bierbaum, C. H. Depuy and W. C. Lineberger (1995). "Experimental studies of allene, methylacetylene, and the propargyl radical- Bond-dissociation energies, gas-phase acidities, and ion-molecule chemistry." Journal of the American Chemical Society 117(25): 6766-6778.
Russo, N., E. Sicilia and M. Toscano (1992). "Geometries, Singlet-Triplet Separations, Dipole-Moments, Ionization-Potentials, and Vibrational Frequencies in Methylene (CH2) and Halocarbenes (CHF, CF2, CCl2, CBr2, and CI2)." J. Chem. Phys. 97(7): 5031-5036.
Schafman, B. S. and P. G. Wenthold (2007). "Regioselectivity of pyridine deprotonation in the gas phase." Journal of Organic Chemistry 72(5): 1645-1651.
Schlachta, R., G. Lask, A. Stangassinger and V. E. Bondybey (1991). "Laser-Induced Fluorescence Excitation Spectrum of Supersonically Cooled Bromochlorocarbene in the Gas-Phase." J. Phys. Chem. 95(19): 7132-7134.
Schwartz, R. L., G. E. Davico, T. M. Ramond and W. C. Lineberger (1999). "Singlet-triplet splittings in CX2 (X = F, Cl, Br, I) dihalocarbenes via negative ion photoelectron spectroscopy." J. Phys. Chem. A 103(41): 8213-8221.
Seal, P. and S. Chakrabarti (2007). "Explicit role of dynamical and nondynamical electron correlation on singlet-triplet splitting in carbenes." Chem. Phys. 332(2-3): 232-242.
Seliger, R. L. (1972). "E X B mass-separator design." Journal of Applied Physics 43(5): 2352.
Sendt, K. and G. B. Bacskay (2000). "Spectroscopic constants of CF2, CCl2, and CBr2 and heats of formation of selected halocarbenes: An ab initio quantum chemical study." J. Chem. Phys. 112(5): 2227-2238.
Sharp, T. E. and H. M. Rosenstock (1964). "Franck-condon factors for polyatomic molecules." Journal of Chemical Physics 41(11): 3453.
Smith, K. L., L. D. Smoot, T. H. Fletcher and R. J. Pugmire, Eds. (1994). The Structure and Reaction Processes of Coal. New York, Plenum Press.
Stoll, H., B. Metz and M. Dolg (2002). "Relativistic energy-consistent pseudopotentials - Recent developments." J. Comput. Chem. 23(8): 767.
Streit, G. E. (1982). "Gas-Phase Reactions of O- and O-2- with a Variety of Halogenated Compounds." Journal of Physical Chemistry 86(13): 2321-2324.
Surber, E., R. Mabbs and A. Sanov (2003). "Probing the Electronic Structure of Small Molecular Anions by Photoelectron Imaging†." The Journal of Physical Chemistry A 107(40): 8215-8224.
Tao, C., C. Mukarakate and S. A. Reid (2007). "Single vibronic level emission spectroscopy of the (A)over-tilde(1)A ''-> X(1)A ' system of bromochlorocarbene." J. Mol. Spec. 246(2): 113-117.
193
Tarczay, G., T. A. Miller, G. Czako and A. G. Csaszar (2005). "Accurate ab initio determination of spectroscopic and thermochemical properties of mono- and dichlorocarbenes." Phys. Chem. Chem. Phys. 7(15): 2881-2893.
Tevault, D. E. and L. Andrews (1975). "Laser-Induced Fluorescence-Spectrum of Argon Matrix-Isolated Dichlorocarbene." J. Mol. Spec. 54(1): 110-120.
Thompson, M. A., J. P. Martin, J. P. Darr, W. C. Lineberger and R. Parson (2008). "A combined experimental/theoretical investigation of the near-infrared photodissociation of IBr-(CO2)(n)." J. Chem. Phys. 129(22).
Tripathi, G. N. R. and R. H. Schuler (1987). "Time resolved resonance raman- Spectra of anilino radical and aniline radical cation." Journal of Chemical Physics 86(7): 3795-3800.
Turker, L., S. Gumus and T. Atalar (2010). "A DFT Study on Nitro Derivatives of Pyridine." Journal of Energetic Materials 28(2): 139-171.
Van Doren, J. M., S. E. Barlow, C. H. DePuy and V. M. Bierbaum (1987). "The tandem flowing afterglow-sift-drift." International Journal of Mass Spectrometry and Ion Processes 81: 85-100.
Villano, S. M., N. Eyet, et al. (2010). "Photoelectron spectroscopy and thermochemistry of the peroxyacetate anion." European Journal of Mass Spectrometry 16(3): 255-268.
Villano, S. M., N. Eyet, et al. (2010). "Photoelectron Spectroscopy and Thermochemistry of the Peroxyformate Anion." Journal of Physical Chemistry A 114(1): 191-200.
Vogelhuber, K. M., S. W. Wren, A. B. McCoy, K. M. Ervin and W. C. Lineberger (2011). "Photoelectron spectra of dihalomethyl anions: Testing the limits of normal mode analysis." The Journal of Chemical Physics 134(18): 184306-184313.
Vogelhuber, K. M., S. W. Wren, L. Sheps and W. C. Lineberger (2011). "The C-H bond dissociation energy of furan: Photoelectron spectroscopy of the furanide anion." Journal of Chemical Physics 134(6).
Wahlin, L. (1964). "The Colutron, a zero deflection isotope separator." Nuclear Instruments & Methods 27(1): 55-60.
Wallace, S., K. D. Bartle and D. L. Perry (1989). "Quantification of nitrogen functional groups in coal and coal derived products." Fuel 68(11): 1450-1455.
WebBook, N. C. NIST Standard Reference Database. Number 69.
Wenthold, P. G., D. A. Hrovat, W. T. Borden and W. C. Lineberger (1996). "Transition-state spectroscopy of cyclooctatetraene." Science 272(5267): 1456-1459.
Wenthold, P. G. and W. C. Lineberger (1999). "Negative ion photoelectron spectroscopy studies of organic reactive intermediates." Accts. Chem. Research 32(7): 597-604.
Wilson, E. B., J. C. Decius and P. C. Cross (1980). Molecular Vibrations. New York, Dover.
Wong, M. W. (1996). "Vibrational frequency prediction using density functional theory." Chemical Physics Letters 256(4-5): 391-399.

194
Woon, D. E. and T. H. Dunning (1993). "Gaussian-Basis Sets for Use in Correlated Molecular Calculations .3. the Atoms Aluminum through Argon." Journal of Chemical Physics 98(2): 1358-1371.
Wren, S. W., K. M. Vogelhuber, K. M. Ervin and W. C. Lineberger (2009). "The photoelectron spectrum of CCl2-: the convergence of theory and experiment after a decade of debate." Physical Chemistry Chemical Physics 11(23): 4745-4753.
Wren, S. W., K. M. Vogelhuber, et al. (In Preparation). "Nitrogen Proximity Effects in Azines: How Nitrogen Atoms Affect C–H Bond Strengths and Anion Stability."
Xu, H. and J. H. Kiefer (2010). "Shock Tube Study of 1,3,5-Triazine Dissociation and Relaxation and Relaxation of Pyrazine." International Journal of Chemical Kinetics 42(4): 211-220.
Xu, S. L. and M. D. Harmony (1993). "Halocarbene Production in Free-Jet Expansions from a Hot Nozzle." Chem. Phys. Lett. 205(6): 502-507.
Xu, S. L. and M. D. Harmony (1993). "Lif Excitation Spectrum of Dibromocarbene in a Supersonic Free-Jet Expansion." J. Phys. Chem. 97(29): 7465-7470.
Xu, W. and A. Gao (2005). "Structures, Electron Affinities, and Harmonic Vibrational Frequencies of C6H5X/C6H5X- (X = N, S, NH, PH, CH2, and SiH2)." The Journal of Physical Chemistry A 110(3): 997-1004.
Zhou, S. K., M. S. Zhan, J. L. Shi and C. X. Wang (1990). "Gas-Phase Spectrum of Dibromocarbene Studied by Laser-Induced Fluorescence." Chem. Phys. Lett. 166(5-6): 547-550.
Zittel, P. F., G. B. Ellison, et al. (1976). "Laser photoelectron spectrometry of CH2-- Singlet-
triplet splitting and electron-affinity of CH2." Journal of the American Chemical Society 98(12): 3731-3732.
Related Documents


