Article Photoelectrochemical Synthesis of Ammonia on the Aerophilic-Hydrophilic Heterostructure with 37.8% Efficiency A unique aerophilic-hydrophilic heterostructure composed of Au nanoparticles highly dispersed in a poly(tetrafluoroethylene) porous framework is fabricated on a Si-based photocathode for N 2 -to-NH 3 fixation. The amphipathic nature of the heterostructure is considered to be the origin of the enhanced nitrogen reduction reaction with efficient conversion efficiency and high production rate. Jianyun Zheng, Yanhong Lyu, Man Qiao, ..., Huaijuan Zhou, San Ping Jiang, Shuangyin Wang [email protected] (Y.L.) [email protected] (H.Z.) [email protected] (S.P.J.) [email protected] (S.W.) HIGHLIGHTS Aerophilic-hydrophilic heterostructure achieved a superb NRR The heterostructure enriched N 2 concentration at the Au active sites The heterostructure manipulated the proton activity with suppressed HER DFT calculation indicated the decrease in the NRR energy barrier on the structure Zheng et al., Chem 5, 617–633 March 14, 2019 ª 2018 Elsevier Inc. https://doi.org/10.1016/j.chempr.2018.12.003

Welcome message from author
This document is posted to help you gain knowledge. Please leave a comment to let me know what you think about it! Share it to your friends and learn new things together.
Transcript
Article
Photoelectrochemical Synthesis of Ammoniaon the Aerophilic-Hydrophilic Heterostructurewith 37.8% Efficiency
Jianyun Zheng, Yanhong Lyu,
Man Qiao, ..., Huaijuan Zhou,
San Ping Jiang, Shuangyin
Wang
[email protected] (Y.L.)
[email protected] (H.Z.)
[email protected] (S.P.J.)
[email protected] (S.W.)
HIGHLIGHTS
Aerophilic-hydrophilic
heterostructure achieved a superb
NRR
The heterostructure enriched N2
concentration at the Au active
sites
The heterostructure manipulated
the proton activity with
suppressed HER
DFT calculation indicated the
decrease in the NRR energy
barrier on the structure
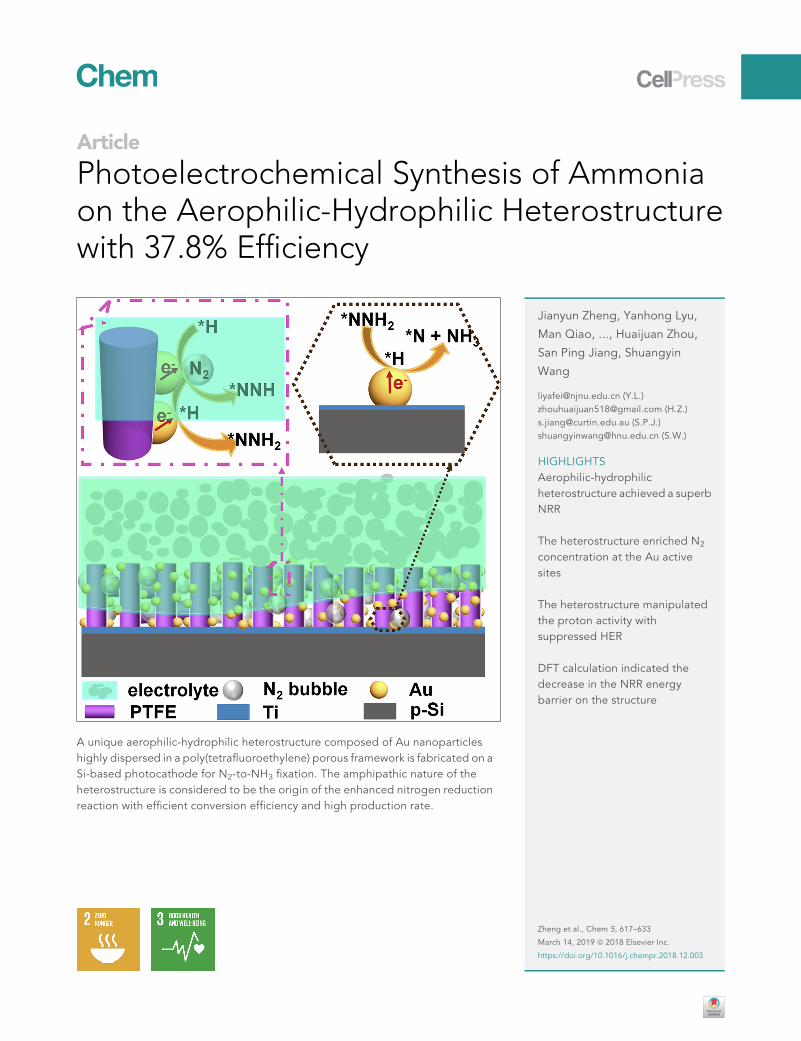
A unique aerophilic-hydrophilic heterostructure composed of Au nanoparticles
highly dispersed in a poly(tetrafluoroethylene) porous framework is fabricated on a
Si-based photocathode for N2-to-NH3 fixation. The amphipathic nature of the
heterostructure is considered to be the origin of the enhanced nitrogen reduction
reaction with efficient conversion efficiency and high production rate.
Zheng et al., Chem 5, 617–633
March 14, 2019 ª 2018 Elsevier Inc.
https://doi.org/10.1016/j.chempr.2018.12.003
Article
Photoelectrochemical Synthesisof Ammonia on the Aerophilic-HydrophilicHeterostructure with 37.8% EfficiencyJianyun Zheng,1,2,5 Yanhong Lyu,1,2,5 Man Qiao,3,5 Ruilun Wang,1 Yangyang Zhou,1 Hao Li,1
Chen Chen,1 Yafei Li,3,* Huaijuan Zhou,4,* San Ping Jiang,2,* and Shuangyin Wang1,6,*
The Bigger Picture
Liquid ammonia can be the key
enabler for being an easily
transported energy storage
carrier, which is highly desirable to
be produced from renewable
energy, such as solar or electricity,
under eco-friendly and mild
conditions. However, innovation
in the photoelectrochemical
devices with high activity,
stability, and selectivity for
nitrogen-to-ammonia fixation has
proven to be very challenging
because nitrogen reduction
SUMMARY
Photoelectrochemical nitrogen reduction reaction can provide a useful source of
ammonia and transportable carrier of hydrogen, but the process is limited by the
photocathodes with poor conversion efficiency and low production rate. Here,
we have designed a unique aerophilic-hydrophilic heterostructured Si-based
photocathode for nitrogen-to-ammonia fixation in an acid electrolyte under
mild conditions, achieving a high ammonia yield rate of �18.9 mg,cm�2,hr�1
and an excellent faradic efficiency of 37.8% at �0.2 V versus a reversible
hydrogen electrode. The heterostructure based on the Au nanoparticles highly
dispersed in poly(tetrafluoroethylene) porous framework enriches nitrogen
molecular concentration at the Au active sites while manipulateing the proton
activity with suppressed hydrogen evolution reactions. DFT calculation indicates
that such heterostructure reduces the energy barrier for the nitrogen reduction
reaction. The aerophilic-hydrophilic heterostructure provides a new insight on
designing efficient and robust photocathodes for nitrogen fixation.
reaction competes with the
hydrogen evolution reaction,
which occurs preferentially on the
photocathode surface at a
comparable thermodynamic
potential. Thus, we have designed
a unique aerophilic-hydrophilic
heterostructured Si-based
photocathode for improving the
energy conversion efficiency. The
aerophilic-hydrophilic
heterostructure provides a new
insight on designing efficient and
robust photocathodes for
nitrogen fixation.
INTRODUCTION
Approximately 200 million tons of ammonia (NH3) is produced in the world annually,
reflecting the vast need in agriculture, pharmaceutical production, and other indus-
trial processes.1 NH3 with 17.6 wt % hydrogen is also being considered as an
emerging easily transported carrier of hydrogen energy and carbon-free solar
energy storage carrier.2 As a result of the high energy consumption and CO2 emis-
sion in the traditional Haber-Bosch process,3 it is highly desirable to develop an
alternative route for nitrogen (N2)-to-NH3 fixation under environmentally friendly
and mild conditions. Various strategies have been explored to promote the N2
reduction reaction (NRR), including biochemical, photocatalytic, electrochemical
and photoelectrochemical (PEC).4–6 Among them, PEC NRR is of considerable inter-
est because it can couple with the merits of the photocatalytic and electrochemical
processes. Such an approach not only allows for the possibility of NRR under mild
conditions such as ambient temperature and atmospheric pressure, but also can
be powered by sun.
Recently, significant effort has been devoted to advancing the prospects of produc-
ing NH3 from N2.7–10 The NRR at room temperature yields a certain amount of NH3
production and increased faradic efficiencies via tuning the catalyst structure,11,12
introducing the dopants and defects,13–15 and manipulating the reaction condi-
tions.16,17 In previous work, Ali et al.18 prepared nanostructured p-type Si with Au
nanoparticles (NPs) and achieved a PEC N2-to-NH3 fixation at 6.0 mg,cm�2,hr�1
Chem 5, 617–633, March 14, 2019 ª 2018 Elsevier Inc. 617
1State Key Laboratory of Chem/Bio-Sensing andChemometrics, College of Chemistry andChemical Engineering, Hunan University,Changsha, Hunan 410082, China
2Western Australian School of Mines: Minerals,Energy and Chemical Engineering and Fuels andEnergy Technology Institute, Curtin University,Perth, WA 6102, Australia
3Jiangsu Collaborative Innovation Centre ofBiomedical Functional Materials, School ofChemistry and Materials Science, Nanjing
without applied bias from atmospheric N2 under 2 sun illumination and 7 atm pres-
sure. Separately, a faradic efficiency of 10% for NRR was recently obtained on a
zeolitic imidazolate framework-71 (ZIF)-coated Ag-Au platform by suppressing the
hydrogen evolution reaction (HER) via hydrophobic ZIF.19 Mukherjee et al.20 re-
ported a metal-organic-framework-derived nitrogen-doped nanoporous carbon
with a remarkable NH3 production rate of 3.4 mmol,cm�2,hr�1 and a faradic effi-
ciency of 10.2% for NRR under room temperature by using alkaline aqueous electro-
lyte. In addition, electrochemical NRR with a notable faradic efficiency of �35% was
acquired with N2 and steam in a molten hydroxide suspension under high-
temperature (200�C) and high-pressure (>25 atm) conditions.3 To achieve a higher
faradic efficiency (�60%), Zhou et al.16 employed ionic liquids with high N2 solubility
as electrolyte to suppress the HER and enhance the conversion of N2 to NH3 on a
nanostructured iron catalyst under ambient conditions. However, because water is
the most common and environmentally friendly solvent and source of protons,
development of a water-based system for NRR is of practical and technological
importance. Nevertheless, most reported NRRs in aqueous solution are still very
unfavorable under mild conditions, retaining the conversion efficiency of �10% or
lower.21 The most significant difficulty behind the low conversion efficiency is the
poor selectivity for NH3 production and the overwhelming competing HER from
water-fed systems across all traditional NRR catalysts.
To settle the competition from HER, one of the general strategies is to employ a gas-
diffusion layer to supply an unobstructed gas-diffusion pathway and impede water
absorption at the electrode surface.19,22,23 Porous hydrophobic materials, such as
poly(tetrafluoroethylene) (PTFE), are commonly used to accelerate the gas-diffusion
process by creating a gas molecular-concentrating effect. But, their insulating nature
would obstruct the electron transport and result in a severe performance decay.
On the other hand, the formation of active proton (*H) is limited because of its
hydrophobic structure, further reducing the NRR performance. Therefore, it is
challenging to simultaneously satisfy the stringent requirements on N2 gas diffusion,
electron transport, and production of *H.
In this work, we designed a highly efficient Si-based photocathode for solar-light-
driven conversion of N2 to NH3, which was composed of Si as the photo absorber,
PTFE porous framework as the gas-diffusion layer, and Au NPs as the active sites.
The highly dispersed and nearly free-stacked Au NPs coated on the surface of the
PTFE framework and the Si formed an intimate connection between the PTFE frame-
work and Si, providing an electric contact. Most critical, the PTFE porous framework
with highly dispersed Au NPs created a functional aerophilic-hydrophilic hetero-
structure, facilitating an enriched N2-gas layer and controlling proton activity under
aqueous media. The optimal photocathode showed an ammonia yield rate of
�18.9 mg,cm�2,hr�1 and a faradic efficiency of 37.8% at �0.2 V versus reversible
hydrogen electrode (RHE) at ambient condition.
Normal University, Nanjing 210023, China4State Key Laboratory of High PerformanceCeramics and Superfine Microstructure,Shanghai Institute of Ceramics, ChineseAcademy of Sciences, Shanghai 200050, China
5These authors contributed equally
6Lead Contact
*Correspondence: [email protected] (Y.L.),[email protected] (H.Z.),[email protected] (S.P.J.),[email protected] (S.W.)
https://doi.org/10.1016/j.chempr.2018.12.003
RESULTS AND DISCUSSION
Synthesis and Characterization of Si-Based Photocathodes
Figure 1A shows the scheme for fabrication of the aerophilic-hydrophilic hetero-
structured Si-based photocathode for PEC NRR. A thin Ti layer on the Si surface
(labeled as TS) affords a passivation function in terms of stability under acid condi-
tions24 and serves as an adhesion layer for growing the Au NPs and PTFE porous
framework.25 PTFE, as one of the most hydrophobic materials,26 was chosen as
the porous framework for allowing the diffusion of N2 and stabilizing the
618 Chem 5, 617–633, March 14, 2019
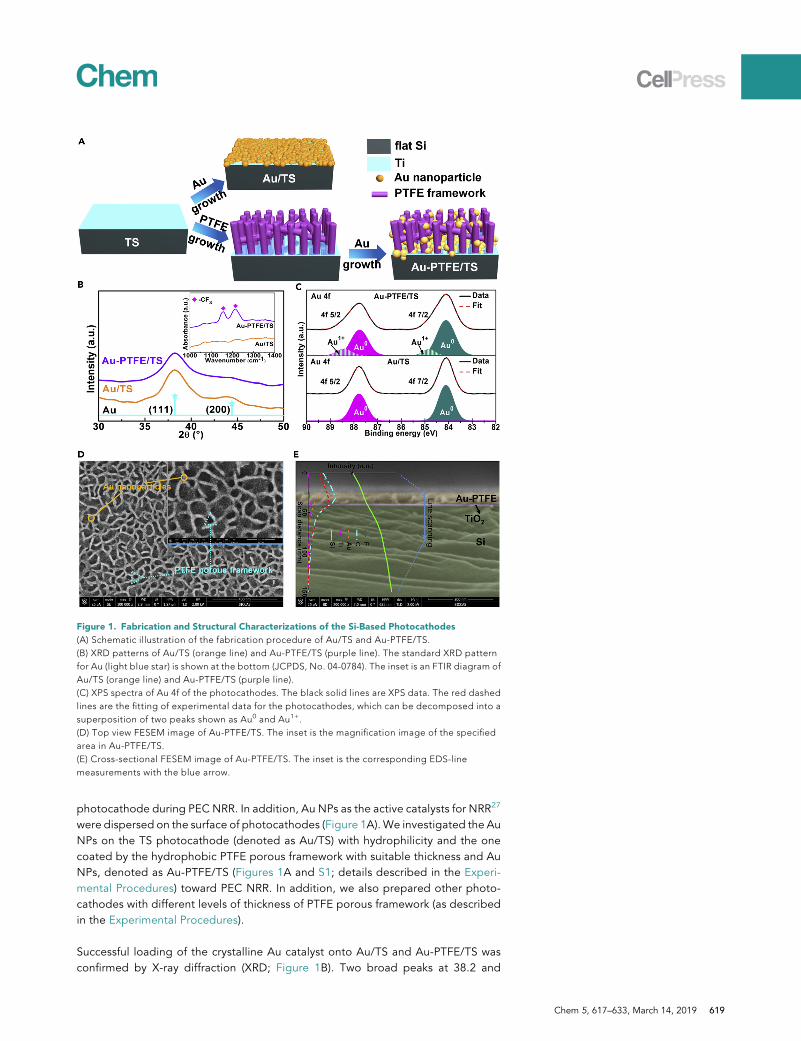
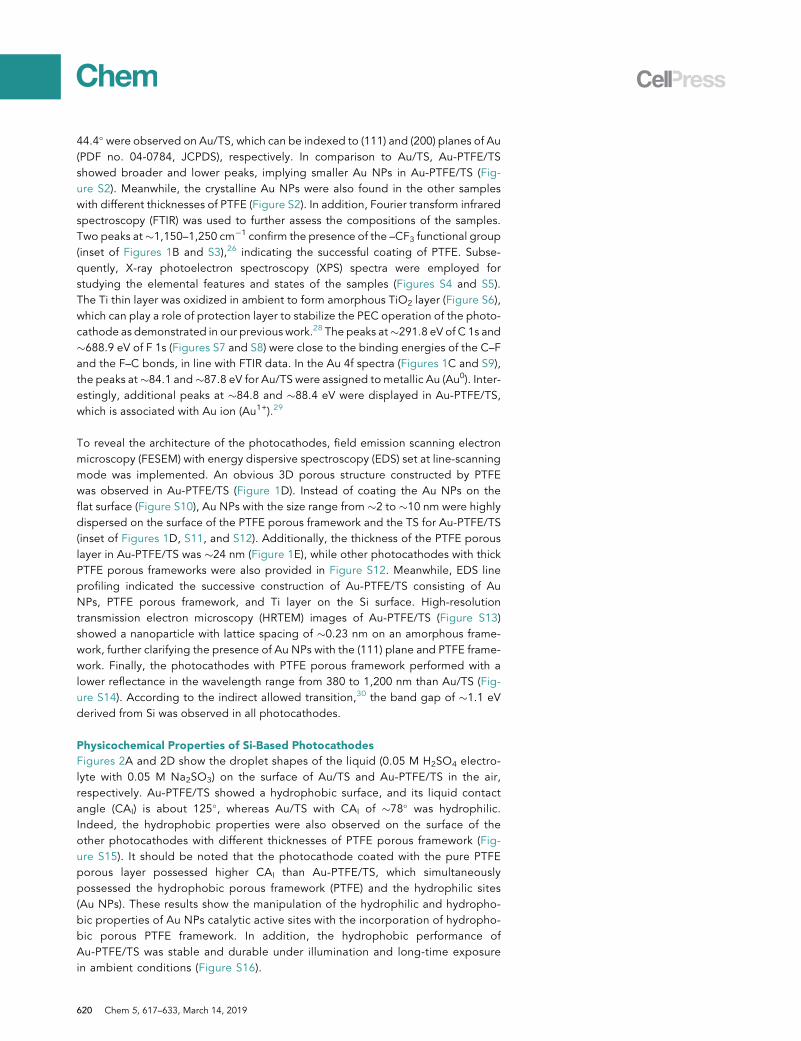
Figure 1. Fabrication and Structural Characterizations of the Si-Based Photocathodes
(A) Schematic illustration of the fabrication procedure of Au/TS and Au-PTFE/TS.
(B) XRD patterns of Au/TS (orange line) and Au-PTFE/TS (purple line). The standard XRD pattern
for Au (light blue star) is shown at the bottom (JCPDS, No. 04-0784). The inset is an FTIR diagram of
Au/TS (orange line) and Au-PTFE/TS (purple line).
(C) XPS spectra of Au 4f of the photocathodes. The black solid lines are XPS data. The red dashed
lines are the fitting of experimental data for the photocathodes, which can be decomposed into a
superposition of two peaks shown as Au0 and Au1+.
(D) Top view FESEM image of Au-PTFE/TS. The inset is the magnification image of the specified
area in Au-PTFE/TS.
(E) Cross-sectional FESEM image of Au-PTFE/TS. The inset is the corresponding EDS-line
measurements with the blue arrow.
photocathode during PEC NRR. In addition, Au NPs as the active catalysts for NRR27
were dispersed on the surface of photocathodes (Figure 1A). We investigated the Au
NPs on the TS photocathode (denoted as Au/TS) with hydrophilicity and the one
coated by the hydrophobic PTFE porous framework with suitable thickness and Au
NPs, denoted as Au-PTFE/TS (Figures 1A and S1; details described in the Experi-
mental Procedures) toward PEC NRR. In addition, we also prepared other photo-
cathodes with different levels of thickness of PTFE porous framework (as described
in the Experimental Procedures).
Successful loading of the crystalline Au catalyst onto Au/TS and Au-PTFE/TS was
confirmed by X-ray diffraction (XRD; Figure 1B). Two broad peaks at 38.2 and
Chem 5, 617–633, March 14, 2019 619
44.4� were observed on Au/TS, which can be indexed to (111) and (200) planes of Au
(PDF no. 04-0784, JCPDS), respectively. In comparison to Au/TS, Au-PTFE/TS
showed broader and lower peaks, implying smaller Au NPs in Au-PTFE/TS (Fig-
ure S2). Meanwhile, the crystalline Au NPs were also found in the other samples
with different thicknesses of PTFE (Figure S2). In addition, Fourier transform infrared
spectroscopy (FTIR) was used to further assess the compositions of the samples.
Two peaks at�1,150–1,250 cm�1 confirm the presence of the –CF3 functional group
(inset of Figures 1B and S3),26 indicating the successful coating of PTFE. Subse-
quently, X-ray photoelectron spectroscopy (XPS) spectra were employed for
studying the elemental features and states of the samples (Figures S4 and S5).
The Ti thin layer was oxidized in ambient to form amorphous TiO2 layer (Figure S6),
which can play a role of protection layer to stabilize the PEC operation of the photo-
cathode as demonstrated in our previous work.28 The peaks at�291.8 eV of C 1s and
�688.9 eV of F 1s (Figures S7 and S8) were close to the binding energies of the C–F
and the F–C bonds, in line with FTIR data. In the Au 4f spectra (Figures 1C and S9),
the peaks at�84.1 and�87.8 eV for Au/TS were assigned to metallic Au (Au0). Inter-
estingly, additional peaks at �84.8 and �88.4 eV were displayed in Au-PTFE/TS,
which is associated with Au ion (Au1+).29
To reveal the architecture of the photocathodes, field emission scanning electron
microscopy (FESEM) with energy dispersive spectroscopy (EDS) set at line-scanning
mode was implemented. An obvious 3D porous structure constructed by PTFE
was observed in Au-PTFE/TS (Figure 1D). Instead of coating the Au NPs on the
flat surface (Figure S10), Au NPs with the size range from �2 to �10 nm were highly
dispersed on the surface of the PTFE porous framework and the TS for Au-PTFE/TS
(inset of Figures 1D, S11, and S12). Additionally, the thickness of the PTFE porous
layer in Au-PTFE/TS was �24 nm (Figure 1E), while other photocathodes with thick
PTFE porous frameworks were also provided in Figure S12. Meanwhile, EDS line
profiling indicated the successive construction of Au-PTFE/TS consisting of Au
NPs, PTFE porous framework, and Ti layer on the Si surface. High-resolution
transmission electron microscopy (HRTEM) images of Au-PTFE/TS (Figure S13)
showed a nanoparticle with lattice spacing of �0.23 nm on an amorphous frame-
work, further clarifying the presence of Au NPs with the (111) plane and PTFE frame-
work. Finally, the photocathodes with PTFE porous framework performed with a
lower reflectance in the wavelength range from 380 to 1,200 nm than Au/TS (Fig-
ure S14). According to the indirect allowed transition,30 the band gap of �1.1 eV
derived from Si was observed in all photocathodes.
Physicochemical Properties of Si-Based Photocathodes
Figures 2A and 2D show the droplet shapes of the liquid (0.05 M H2SO4 electro-
lyte with 0.05 M Na2SO3) on the surface of Au/TS and Au-PTFE/TS in the air,
respectively. Au-PTFE/TS showed a hydrophobic surface, and its liquid contact
angle (CAl) is about 125�, whereas Au/TS with CAl of �78� was hydrophilic.
Indeed, the hydrophobic properties were also observed on the surface of the
other photocathodes with different thicknesses of PTFE porous framework (Fig-
ure S15). It should be noted that the photocathode coated with the pure PTFE
porous layer possessed higher CAl than Au-PTFE/TS, which simultaneously
possessed the hydrophobic porous framework (PTFE) and the hydrophilic sites
(Au NPs). These results show the manipulation of the hydrophilic and hydropho-
bic properties of Au NPs catalytic active sites with the incorporation of hydropho-
bic porous PTFE framework. In addition, the hydrophobic performance of
Au-PTFE/TS was stable and durable under illumination and long-time exposure
in ambient conditions (Figure S16).
620 Chem 5, 617–633, March 14, 2019
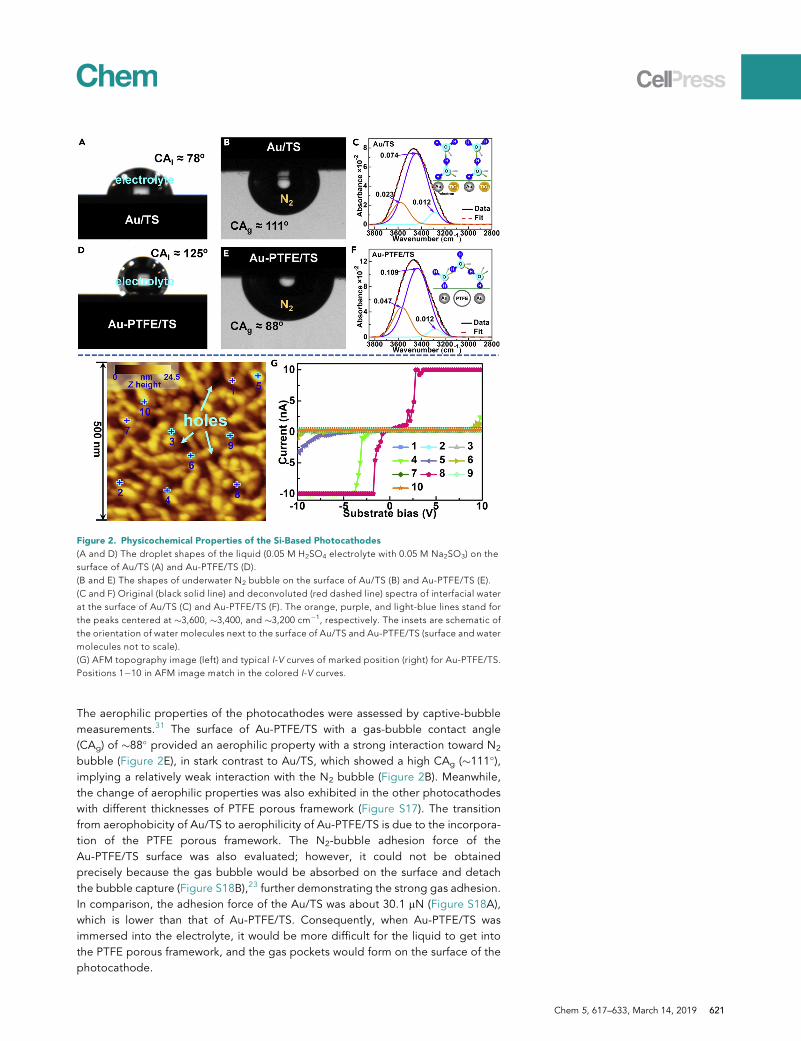
Figure 2. Physicochemical Properties of the Si-Based Photocathodes
(A and D) The droplet shapes of the liquid (0.05 M H2SO4 electrolyte with 0.05 M Na2SO3) on the
surface of Au/TS (A) and Au-PTFE/TS (D).
(B and E) The shapes of underwater N2 bubble on the surface of Au/TS (B) and Au-PTFE/TS (E).
(C and F) Original (black solid line) and deconvoluted (red dashed line) spectra of interfacial water
at the surface of Au/TS (C) and Au-PTFE/TS (F). The orange, purple, and light-blue lines stand for
the peaks centered at �3,600, �3,400, and �3,200 cm�1, respectively. The insets are schematic of
the orientation of water molecules next to the surface of Au/TS and Au-PTFE/TS (surface and water
molecules not to scale).
(G) AFM topography image (left) and typical I-V curves of marked position (right) for Au-PTFE/TS.
Positions 1�10 in AFM image match in the colored I-V curves.
The aerophilic properties of the photocathodes were assessed by captive-bubble
measurements.31 The surface of Au-PTFE/TS with a gas-bubble contact angle
(CAg) of �88� provided an aerophilic property with a strong interaction toward N2
bubble (Figure 2E), in stark contrast to Au/TS, which showed a high CAg (�111�),implying a relatively weak interaction with the N2 bubble (Figure 2B). Meanwhile,
the change of aerophilic properties was also exhibited in the other photocathodes
with different thicknesses of PTFE porous framework (Figure S17). The transition
from aerophobicity of Au/TS to aerophilicity of Au-PTFE/TS is due to the incorpora-
tion of the PTFE porous framework. The N2-bubble adhesion force of the
Au-PTFE/TS surface was also evaluated; however, it could not be obtained
precisely because the gas bubble would be absorbed on the surface and detach
the bubble capture (Figure S18B),23 further demonstrating the strong gas adhesion.
In comparison, the adhesion force of the Au/TS was about 30.1 mN (Figure S18A),
which is lower than that of Au-PTFE/TS. Consequently, when Au-PTFE/TS was
immersed into the electrolyte, it would be more difficult for the liquid to get into
the PTFE porous framework, and the gas pockets would form on the surface of the
photocathode.
Chem 5, 617–633, March 14, 2019 621
The orientation of interfacial water molecules near the surface of Au/TS and
Au-PTFE/TS was probed by FTIR with attenuated total reflection (ATR) accessory,
as given in Figures 2C and 2F, respectively. To distinguish between the two spectra,
the broad band of vibrational spectrum of water between 3,100 and 3,800 cm�1 (the
OH stretching region), which yielded against the background spectrum of the clean
diamond with the water, was deconvoluted into three peaks centered at �3,200,
3,400, and 3,600 cm�1, which are ascribed to OH stretching modes associated
with the tetrahedral structure of bulk water molecules, hydrogen-bonded OH strad-
dling the interface, and non-hydrogen-bonded OH pointing toward the surface,
respectively.32,33 As reported in the literature,32,33 a hydrophobic material shows
a higher magnitude at �3,600 cm�1 than a hydrophilic material. In Figures 2C and
2F, the intensity of the peak at �3,200 cm�1 related to the OH stretching of bulk wa-
ter was almost identical for the surface of Au/TS and Au-PTFE/TS. In contrast, the
peak at �3,600 cm�1 was higher for Au-PTFE/TS than that for Au/TS by a factor of
�2. Correspondingly, Au-PTFE/TS also displayed a higher peak at �3,400 cm�1,
suggesting that its surface has a larger number of OHs straddling the interface. To
some extent, the intensity of the peaks at �3,400 and �3,600 cm�1 increases with
the increase in the thickness of the PTFE layer (Figure S19). Furthermore, the photo-
cathode with the thicker PTFE layer (Au-PTFE_1/TS; Figure S19C) showed a lower in-
tensity of the peaks at�3,400 and�3,600 cm�1 than Au-PTFE_0.75/TS (Figure S19B)
because more Au NPs were stacked on the surface, in line with XPS data. As a result,
we can imagine that the hydrogen-bonding network of the water molecules next
to the surface of Au-PTFE/TS is destroyed as sketched in the inset of Figure 2F.
One hydrogen-bond vector pointing toward the surface is associated with the
hydrogen bonding between the Au atom and the OH bond of the water molecule,
whereas the remaining three hydrogen-bond vectors point away from the surface.
In contrast, Au atoms and amorphous TiO2 on the surface of Au/TS form hydrogen
bonds with interfacial water molecules, resulting in a hydrophilic hydration structure
(see the inset of Figure 2C).
In order to explore the charge carrier transport, the electrical measurements of the
photocathodes were conducted by conductive atomic force microscopy (c-AFM) in a
vertical configuration. An AFM topographic image showing the typical current-
voltage (I-V) curves of the marked position for Au-PTFE/TS is presented in Figure 2G.
Au-PTFE/TS in the positions 4, 5, 6, and 8 shows the current responses. Among
them, positions 4 and 8 in the hole exhibited sensitive and intense current re-
sponses (10 nA), and the currents of positions 5 and 6 on the PTFE porous
framework with Au NPs were less than 3 nA at an applied bias of �10 V. In contrast
to Au-PTFE/TS, Au/TS in all the positions 1–10 produced high currents (10 nA) at low
applied bias (<7 V) (Figure S20). Nevertheless, when the thickness of the PTFE
porous framework was gradually increased, the current response of the sample
was markedly weakened (Figures S21–S23). Finally, there was no current response
in the TS coating the pure PTFE porous framework with a thickness of �24 nm at
applied bias ranging from �10 to 10 V (Figure S24). The results make clear that
the dispersed Au NPs provide the necessary electron transport channels for NRR
as a result of the intimate connection among Au NPs (Figure S25), and the current
response of the Au NPs on the TS surface is stronger and faster than it is on the
PTFE porous framework for the Au-PTFE/TS photocathode.
Photoelectrochemical Properties of Si-Based Photocathodes
Figure 3A schematically illustrates a PEC cell for NRR with the N2 bubbling over the
surface of the photocathode in 0.05 M H2SO4 electrolyte with 0.05 M Na2SO3 under
1 sun illumination. To facilitate the contact between the N2 bubbling and
622 Chem 5, 617–633, March 14, 2019
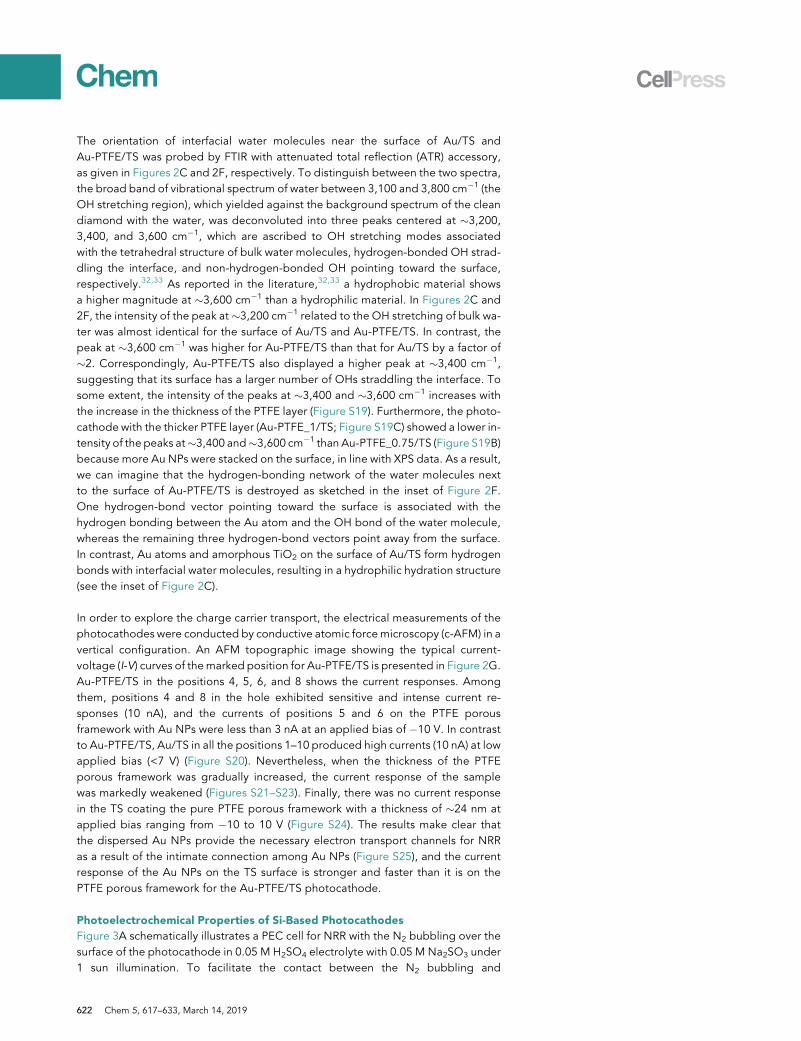
Figure 3. Photoelectrochemical N2-to-NH3 Fixation of the Si-Based Photocathodes
(A) Schematic diagram of the PEC cell under 1 sun illumination in 0.05 M H2SO4 electrolyte with
0.05 M Na2SO3.
(B) Yield rate of NH3 (column diagrams) and faradic efficiency (point plots) on Au/TS (orange) and
Au-PTFE/TS (purple) at each given potential for 4 hr.
(C) The time dependence of NH3 yield (green balls) and faradic efficiency (brown stars) obtained
from Au-PTFE/TS.
(D) FTIR spectra of the post-electrolysis electrolytes reacted on the Au-PTFE/TS at different
reaction time. Black and red lines are FTIR spectra of the standard ammonium sulfate solution with
the concentration of 0.05 and 0.3 mg,mL�1 in the electrolyte, respectively.
photocathode surface and avoid contamination from ambient conditions, mild stir-
ring was conducted in the NRR process, and the exiting N2 stream was bubbled
through a water-filled vessel to form a liquid seal (Figure S26). As reported in previ-
ous work,18 Na2SO3 was added to the electrolyte to offer alternate electron donors
for scavenging the photogenerated holes and protected the Pt anode. After 24 hr
of electrolysis, the concentration of Pt in the electrolyte was �5.8 3 10�3 mg,mL�1,
evaluated by inductively coupled plasma mass spectrometry (ICP-MS). The yields
of NH3 and hydrazine (N2H4) were measured by the indophenol blue method and
the method of Watt and Chrisp (described in the Experimental Procedures), respec-
tively. The standard solutions of ammonium sulfate ((NH4)2SO4) and N2H4 with
known concentrations in the electrolyte were prepared, and the absorbance at
�650 and 460 nm was used to plot the calibration curves shown in Figures S27
and S28, respectively. No N2H4 was detected in any of the post-electrolysis
electrolytes.
The yield rate of NH3 and the faradic efficiency of Au/TS and Au-PTFE/TS at each
given potential in a 4-hr period are shown in Figure 3B. The yield rate of NH3 and
the faradic efficiency were in the range of 8.6–11.3 mg hr�1 cm�2 and 4.1%–7.4%
on Au/TS, respectively; however, after the incorporation of suitable PTFE porous
framework, both the yield rate of NH3 and the faradic efficiency were increased
markedly on Au-PTFE/TS by nearly 1.5 and 4 times, respectively. Based on the
calculation of the Nernst equation, the standard potential for the reduction of N2
to NH3 is 0.137 V versus RHE under our experimental conditions (see the
Chem 5, 617–633, March 14, 2019 623
Experimental Procedures for the calculations).34 In Figure 3B, the yield rate of NH3
and the faradic efficiency increased as the negative potential increased to �0.2 V
versus RHE, where the maximum yield rate of NH3 and the faradic efficiency were
�18.9 mg hr�1 cm�2 and 37.8% achieved on Au-PTFE/TS for 4 hr, respectively.
Beyond this negative potential, the reduction rate and faradic efficiency decreased,
which is attributed to the strong competitive adsorption of hydrogen species on the
electrode surface at high negative potential. The potential dependence of the yield
rate of NH3 and the faradic efficiency was also observed in the other photocathodes
at different reaction times (Figures S29 and S30). Furthermore, the corresponding
HER performance and hydrogen production on the photocathodes were demon-
strated by linear sweep voltammetric curves and gas chromatography detection
(Figure S31).
Ammonia production and faradic efficiency as a function of time on the Au-PTFE/TS
photocathode at�0.2 V versus RHE is shown in Figure 3C. In comparison to the con-
trol experiments that took place in the dark, replaced N2 with Ar, or removed the
Au co-catalysts (Figure S32), the NH3 production on Au-PTFE/TS was increased pro-
gressively with the increase in reaction time, implying that the NH3 originated from
PEC NRR of Au-PTFE/TS and not from contamination. NH3 production reached a
maximum (�210.5 mg cm�2) on Au-PTFE/TS in a 24-hr period and decayed slightly
to �192.5 mg cm�2 with electrolysis over 48 hr. Nevertheless, the faradic efficiency
decreased gradually with the increased reaction time when the reaction time was
more than 4 hr. This phenomenon can be ascribed to the decrease in the PEC activity
of the photocathode and the increase in NH3 concentration in the electrolyte during
the NRR process. For practical use, evaluating the durability of the photocathodes is
critical. As shown in Figure S33, Au-PTFE/TS demonstrates a good PECNRR stability
for �11.5 hr. Furthermore, FTIR spectrum (Figure S34) and FESEM images with EDS
data (Figure S35) revealed the maintenance of the PTFE porous framework and Au
NPs after the electrolysis for 11.5 hr. However, the loss of the Au-PTFE layer and
the photooxidation of the Si substrate (Figure S36) were found on the surface of
Au-PTFE/TS after 24 hr of electrolysis, which can be the dominating factors in the
degradation of the photocathode in long-term PEC NRR.
To further determine the generation of NH3 unambiguously, FTIR spectra with
ATR was applied to collect the information of post-electrolysis electrolyte with
the identical thickness of liquid film after subtracting the background spectrum
of water. As shown in Figure 3D (red line), two sharp peaks at �2,950 and
2,850 cm�1 arose from the characteristic N-H stretching of NH4+, and the other
peaks at �1,710 and �1,560 cm�1 were attributed to the s(N–H) bending.13,27
After electrolysis for 4 hr, FTIR spectra of the post-electrolysis electrolytes at
�0.2 V versus RHE showed the four peaks reflecting the signature of NH4+. The
intensity of the peaks increased with the increase in reaction time, suggesting
the increased production of NH3 PEC NRR. Moreover, an ammonia-ammonium
ion selective electrode (ISE) was also consolidated for the NH3 production via
PEC NRR. The time and potential dependence of NH3 yield on Au-PTFE/TS under
illumination is in concordance with the results mentioned above, whereas the NH3
production is negligible in the dark (Figures S37–S39). An 15N isotopic labeling
experiment was also performed to qualitatively verify the N source of the NH3
yielded by PEC NRR. In the 1H nuclear magnetic resonance (1H NMR) spectra
(Figure S40), a doublet coupling for 15NH4+ was observed in the electrolyte
when 15N2 was supplied as the feeding gas.2,34 Thus, Au-PTFE/TS with the aero-
philic-hydrophilic heterostructure is very effective for PEC N2-to-NH3 fixation
under ambient conditions.
624 Chem 5, 617–633, March 14, 2019
Calculation and Reaction Mechanism
To further supplement and support the experimental findings, density functional
theory (DFT) calculation was carried out to assess the impact of the aerophilic-
hydrophilic heterostructure on the activation energy barriers and the thermody-
namics of the PEC N2-to-NH3 fixation. Generally, there are two reaction mechanisms
for NRR, namely a dissociative and an associative mechanism. According to the
calculations, the dissociative mechanism is not feasible because the dissociation
of N2 on the Au surface is an extremely high endothermic process.35 On the other
hand, the associative mechanism can be divided into the distal and alternating path-
ways, which is inspired by the proposed mechanism for N2-fixing nitrogenase in
biochemistry.36 Multiple proton-coupled electron transfer (PCET) reactions are
required for the completion of N2 into NH3. For the distal pathway, one N atom of
N2 would be hydrogenated first and then released as NH3, being energetically
more favorable than the alternating pathway that simultaneously produced two
NH3 molecules by hydrogenating two N atoms.37 The free energy profiles at various
states along the distal pathway on Au/TS and Au-PTFE/TS are given in Figure 4A.
The first electron-transfer step for the formation of *NNH species is the rate-
determining step (RDS). The DFT calculation shows that the free energy change
(DG) of N2 hydrogenation to *NNH on Au-PTFE/TS is 2.37 eV, smaller than the
2.52 eV obtained on Au/TS, indicating that the *NNH would be easily generated
on Au-PTFE/TS. The reduced DG of *NNH is most likely related to the unique aero-
philic-hydrophilic heterostructure of Au NPs-PTFE porous framework, leading to the
dramatically increased PEC NRR performance. To gain deeper insights, the plot of
charge-density difference (Figure 4B) was constructed by subtracting the calculated
electronic charge of Au-PTFE/TS from that of individual PTFE and Au/TS. It is
clearly seen that the charge density is redistributed between PTFE and Au/TS with
a considerable charge transfer from PTFE to Au/TS, which is in agreement with the
presence of Au1+ from XPS data (Figure 1). The result suggests that Au-PTFE/TS
can give rise to a stronger binding strength of *NNH species than Au/TS and
consequently shows an excellent catalytic activity. Additionally, the *H specie
(DGH) adsorbed in PTFE-Au and Au is 0.34 and 0.37 eV, respectively. This means
that once the *H intermediate is generated in the Au1+ site, it clings to PTFE frame-
work and will rapidly proceed to the formation of *NNH species through a proton-
coupled electron transfer process (*H + e� + N2 / *NNH). However, in our system,
a portion of naked PTFE without Au is unfavorable for absorbing *H species, which
plays an important role in controlling the rate of HER by limiting the proton
concentrations.
According to the experimental results and theory calculations, the promotion mech-
anism of PEC NRR on Au-PTFE/TS by the aerophilic porous framework and hydro-
philic metal NPs is illustrated in Figure 4C. The Si wafer yields the photogenerated
electron-hole pairs under illumination, and then the electrons reach the photo-
cathode surface to induce the N2-to-NH3 fixation. As a result of the hydrophobic
properties, most possibly the solid-liquid contact happens in the Au NPs depositing
on the tip of PTFE porous framework, where the active protons are obtained even in
low current. At the same time, the overall proton activities, i.e., the adsorption of H+,
at the Au-PTFE/TS are reduced because of the hydrophobic surface. The active
proton transfer occurs from the outside to the inside of the PTFE framework via stir-
ring and N2 bubbling. The close proximity of active protons and N2 molecules to
the Au NPs on the surface of PTFE framework facilitates the intermolecular interac-
tions for hydrogenating N2 and overcoming the RDS of N2-to-NH3 fixation when a
suitable electron energy is dedicated. It is imaged that PTFE porous framework
renders a stable N2 layer under aqueous media resulting in a high-pressure N2
Chem 5, 617–633, March 14, 2019 625
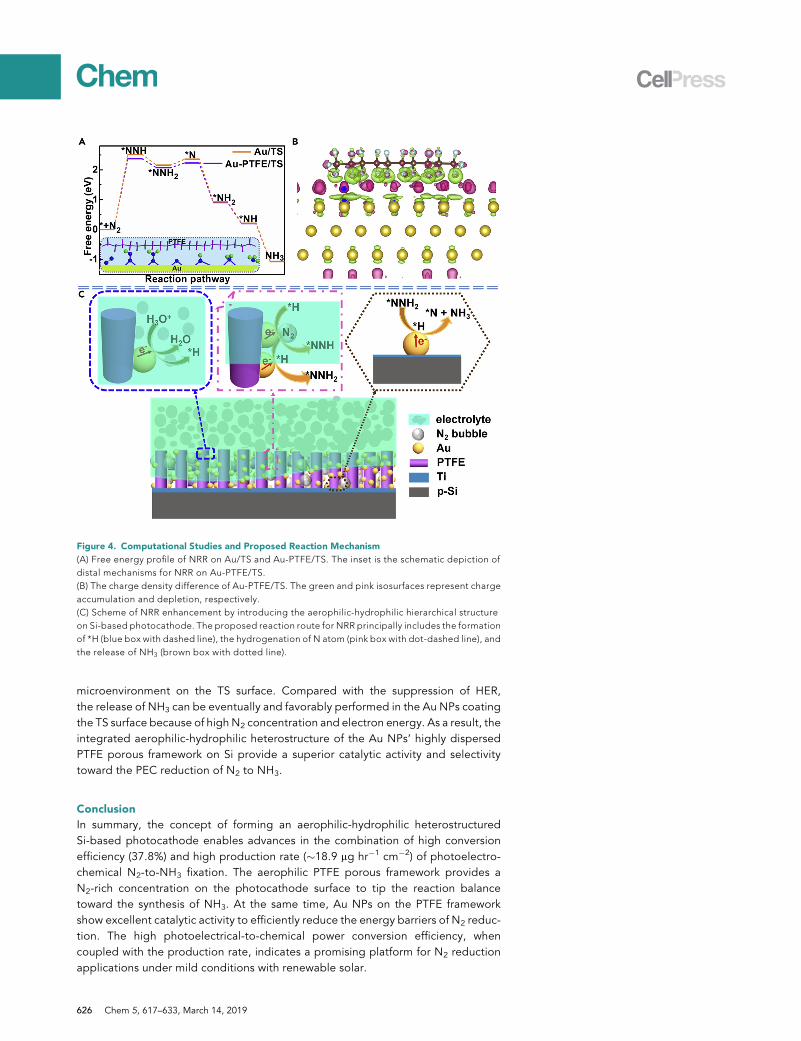
Figure 4. Computational Studies and Proposed Reaction Mechanism
(A) Free energy profile of NRR on Au/TS and Au-PTFE/TS. The inset is the schematic depiction of
distal mechanisms for NRR on Au-PTFE/TS.
(B) The charge density difference of Au-PTFE/TS. The green and pink isosurfaces represent charge
accumulation and depletion, respectively.
(C) Scheme of NRR enhancement by introducing the aerophilic-hydrophilic hierarchical structure
on Si-based photocathode. The proposed reaction route for NRR principally includes the formation
of *H (blue box with dashed line), the hydrogenation of N atom (pink box with dot-dashed line), and
the release of NH3 (brown box with dotted line).
microenvironment on the TS surface. Compared with the suppression of HER,
the release of NH3 can be eventually and favorably performed in the Au NPs coating
the TS surface because of high N2 concentration and electron energy. As a result, the
integrated aerophilic-hydrophilic heterostructure of the Au NPs’ highly dispersed
PTFE porous framework on Si provide a superior catalytic activity and selectivity
toward the PEC reduction of N2 to NH3.
Conclusion
In summary, the concept of forming an aerophilic-hydrophilic heterostructured
Si-based photocathode enables advances in the combination of high conversion
efficiency (37.8%) and high production rate (�18.9 mg hr�1 cm�2) of photoelectro-
chemical N2-to-NH3 fixation. The aerophilic PTFE porous framework provides a
N2-rich concentration on the photocathode surface to tip the reaction balance
toward the synthesis of NH3. At the same time, Au NPs on the PTFE framework
show excellent catalytic activity to efficiently reduce the energy barriers of N2 reduc-
tion. The high photoelectrical-to-chemical power conversion efficiency, when
coupled with the production rate, indicates a promising platform for N2 reduction
applications under mild conditions with renewable solar.
626 Chem 5, 617–633, March 14, 2019
EXPERIMENTAL PROCEDURES
Sample Preparation
A 500-mm-thick, boron-doped, single-side-polished, (100)-oriented, p-type Si wafer
with a resistivity of 1–10 U,cm (Figure S41) was first cleaned sequentially in an ultra-
sonic bath of acetone, ethanol, and distilled (DI) water for 20 min. The clean Si wafer
was immersed in a 5 wt% HF solution for 5 min to remove the native SiO2 layer and
subsequently rinsed with DI water and dried by compressed nitrogen gas. Before
depositing, the Si surface was further cleaned with Ar plasma treatment. A thin Ti
metal layer was deposited on the Si wafer with a magnetron sputtering (MS) appa-
ratus (Chuangshiweina Co. Ltd., MSP-3200) to sputter the planar round metal Ni
target (purity > 99.5 wt %) in pure Ar (99.99%) atmosphere at room temperature
by the power of 100 W for 30 s. Thereafter, the Ti coated Si wafer was transferred
to a vacuum evaporation system (Shenyang Kejing Co. Ltd., GSL-1800X-ZF4) for
fabricating porous poly(tetrafluoroethylene) (PTFE) layer via evaporating PTFE
powder (Aladdin reagent, average grain size of 5 mm) at 110 A for 30 min. Aiming
to explore the effect of PTFE layer on N2 reduction reaction (NRR) performance of
Si-based photocathode, the weight of PTFE powder was 0, 0.25, 0.5, 0.75, and
1.0 g corresponding to Ti-Si (labeled as TS), 0.25 g PTFE/Ti-Si (labeled as
PTFE_0.25/TS), 0.5 g PTFE/Ti-Si (labeled as PTFE/TS), 0.75 g PTFE/Ti-Si (labeled
as PTFE_0.75/TS), and 1.0 g PTFE/Ti-Si (labeled as PTFE_1/TS), respectively.
After evaporation, Au nanoparticles were grown on the surface of the samples by
MS to sputter planar round metal Au targets (purity > 99.9 wt %) at room tempera-
ture by the power of 25 W for 10 s.38 In such conditions, the samples with Au
nanoparticles were simply denoted as Au/TS, Au-PTFE_0.25/TS, Au-PTFE/TS,
Au-PTFE_0.75/TS, and Au-PTFE_1/TS.
The back sides of all samples were first polished and then deposited with an Au layer
of�300 nm thickness and connected to a metal Cu belt, forming an ohmic back con-
tact. Silver paint was applied to affix the Cu belt. After drying, the entire back side
and partial front side of the Si-based electrodes were encapsulated in epoxy, estab-
lishing an exposed active area of �0.1 cm2. Calibrated digital images and ImageJ
were used to determine the geometric area of the exposed electrode surface
defined by epoxy.
Physicochemical Characterization
To investigate the crystalline structure of the samples, a Rigaku diffractometer
(Rigaku Ultima IV) using Cu Ka radiation (l = 0.15406 nm) was applied via 2q X-ray
diffraction (XRD) scans with the grazing angle of 1� at the scan rate of 1�,min�1.
FTIR (Thermo Nicolet is10) at a grazing angle of 80� was used to determine the pres-
ence of PTFE layer on the sample surface. The chemical composition of the sample
was analyzed by X-ray photoelectron spectroscopy (XPS, Thermo escalab 250XI)
with monochromated Al Ka radiation on at a pass energy of 29.4 eV. All binding en-
ergies were referenced to the C1s peak (284.8 eV) arising from adventitious carbon.
The atomic force microscopy (AFM) images presenting both the surface morphology
and microscopic I-V curves were collected by Nanocute SII scanning probe micro-
scopy operated in contact and electric models. To explore the microstructure and
composition of the samples before and after PEC measurements, field emission
scanning electron microscopy (FESEM, Magellan 400) with energy dispersive X-ray
spectroscopy (EDS) was employed to observe the surface and cross section of the
film. High-resolution transmission electron microscopy (HRTEM, Tecnai G2 F20
S�Twin) was employed to further analyze the Au nanoparticles coated on the
PTFE porous framework. The concentration of Pt in the electrolyte solution was
Chem 5, 617–633, March 14, 2019 627
confirmed by inductively coupled plasma mass spectrometry (ICP-MS) with a
Thermo Scientific iCAP-Q instrument.
The optical transmittance characteristics were monitored on a UV-visible (vis)-near-
infrared spectrophotometer (Hitachi, UV-4100) at normal incidence from 350 to
2600 nm with an integrating sphere. The Kubelka-Munk theory is generally used
for the analysis of diffuse reflection (R) spectra to obtain the absorption coefficient
(a) of the samples as follows:
FðRÞ= ð1� RÞ22R
ya; (Equation 1)
where F(R) is the Kubelka-Munk function. The optical energy band gap of the sample
has been estimated with the classical relation of optical absorption
ahn=B�hn� Eg
�m; (Equation 2)
where B, Eg, and hn denote the band tailing parameter, the optical band gap, and
the photon energy, respectively. The value ofm should be taken as 2, a characteristic
value for the indirect allowed transition that dominates over the optical absorption.
To probe the orientation of interfacial water molecules, the spectra of water mole-
cules near the film surface was recorded by a Thermo Nicolet iS 50 FTIR spectrom-
eter in conjunction with an attenuated total reflection accessory (ATR). In the
spectrometer, the ATR was used for analyzing thin water films on the sample surface
and consisted of a diamond hemispherical ATR crystal and a 45� angle of incidence.
Prior to each run, we cleaned the diamond crystal to avoid contamination. For each
measurement, we sandwiched a 10-mL water droplet between the sample and the
diamond crystal by using the built-in pressure applicator in conjunction with a
slip-clutch and a torque screwdriver. Interfacial water spectra were generated by
taking the absorbance spectrum of water against the background spectrum of the
clean diamond with air and water. The technique allowed analysis of a sufficiently
thin film of water (�300 nm)33 and yielded spectra that contained information about
the surface as well as of bulk water.32
Contact Angle Measurements
The wettability of the samples was determined bymeasuring the CA of an electrolyte
droplet on the sample surface. The method of digital video image was used to pro-
cess the sessile droplets by a CA apparatus (Chengde Dingsheng Testing Machine
Co. Ltd, JY-82A) in ambient air at room temperature. A CCD camera with space res-
olution 1,2803 1,024 and color resolution 256 gray levels was applied to capture the
droplet images. A droplet (�5 mL) of 0.05 M H2SO4 electrolyte with 0.05 M Na2SO3
was injected onto the surface with a 1-mL micro-injector. The CA values for each film
before or after solar light irradiation (produced by a Xe lamp with 300 W power and
wavelength range from 250 to 2,000 nm) for 30 min were averaged from five mea-
surements. Furthermore, the nitrogen (N2)-bubble CA with the volume of �1 mL
was performed by the captive bubble method (Dataphysics OCA20) and was
defined as the observed equilibrium CA of electrolyte around the pinned bubbles
on the sample surface, in line with the previous work.23,39
The interaction force between the N2 bubble and photoelectrode interface was as-
sessed with a high-sensitivity micro-electromechanical balance system (Dataphysics
DCAT11, Germany).23,39 A N2 bubble was suspended on a metal ring pre-treated
by hydrophobic fluorine silane under an acid solution (0.05 M H2SO4). The photo-
electrode surface was brought into contact with N2 bubble at a moving rate of
628 Chem 5, 617–633, March 14, 2019
0.02 mm,s�1. Subsequently, when the surfaces left the N2 bubble after contact, the
balance force increased gradually and reached a critical force. Finally, the surfaces
broke away from theN2 bubble, and the cycle of forcemeasurement was completed.
The critical force hysteresis to which the N2 bubble was subjected can be regarded
as the adhesive force between the photoelectrode interface and N2 bubble.
Photoelectrochemical Nitrogen Reduction Reaction Measurements
All of the chemical reagents in this study were of analytical grade and were supplied
by Aladdin (USA). A three-electrode sealed cell (that is, Si-based photocathode as
the working electrode, Pt wire as the counter electrode, and Ag/AgCl as the refer-
ence electrode) was implemented for photoelectrochemical (PEC) nitrogen reduc-
tion reaction (NRR) in a PEC 1000 system (PerfectLight Co. Ltd.) with illumination
of solar light (AM 1.5G, 100 mW,cm�2) and a solar simulator (optical fiber source,
FX300). Before each measurement, the solar simulator intensity was calibrated
with a reference silicon solar cell and a readout meter for the solar simulator
irradiance (PerfectLight Co. Ltd., PL-MW 200). 80 mL, 0.05 M aqueous H2SO4 with
0.05 M Na2SO3 was set as the electrolyte. To avoid the loss of Pt, sodium sulfite
was added to the electrolyte used to provide an alternate electron donor to scav-
enge the photogenerated holes and hence protect the Pt anode.18 Additionally,
in H2SO4-Na2SO3 aqueous solution, the product of the overall reaction can be
ammonium sulfate, N2 + 3H2SO3 + 3H2O / 2H2SO4 + (NH4)2SO4, which is a form
of ammonia commonly used as a fertilizer. Photoelectrochemical measurements
were conducted with a CHI 630E electrochemical workstation with illumination at
�25�C. The NRR activity of a photocathode was evaluated with controlled potential
electrolysis and reaction time in the electrolyte. During each test, the electrolyte was
continuously bubbled with N2 at a flow rate of 2 sccm and was agitated with a stirring
bar at a stirring rate of about 300 rpm. Before NRR, N2 was passed through the
electrolyte for 30 min to remove O2. The exiting N2 gas stream was bubbled through
a water-filled collector vessel to construct a sealed reaction. Readings for the Ag/
AgCl electrode were converted to reversible hydrogen electrode (RHE) according
to the following relationship.
EðRHEÞ=EðAg=AgClÞ+ 0:197 V+ 0:0593pH: (Equation 3)
Quantification and Analysis of Ammonia and Hydrazine
The NH3 produced was quantitatively determined by the indophenol blue method40
and an ammonia-ammonium ISE (Bante Instruments, NH3-US). In the indophenol
blue method, 1 mL of the reaction solution was first pipetted from the post-
electrolysis electrolyte. Afterward, the reaction solution was mixed with 1 mL of a
1 M NaOH solution containing salicylic acid and sodium citrate, 1.5 mL of 0.05 M
NaClO, and 0.1 mL of 1 wt % C5FeN6Na2O (sodium nitroferricyanide). The mixture
was gently agitated for 30 s and was then allowed to stand for 2 hr to ensure com-
plete color development. The UV-vis spectrometer was used to measure the
absorbance of the mixture at �650 nm. The concentration-absorbance curves
were calibrated with standard ammonium sulfate solution with a series of concentra-
tions in the H2SO4-Na2SO3 electrolyte. The fitting curve (y = 0.3892x – 0.0009,
R2 = 0.9995) shows good linear relation of absorbance value with NH3 concentration
by three times independent calibrations.
Furthermore, the ISE probe was calibrated with standard ammonia solutions con-
taining the sacrificial agent (at concentrations lower than the electrode manufac-
turer’s salinity limit). To avoid the interference of the residual solution, the ISE probe
was immersed in the deionized water with stirring to achieve the surface potential of
201.2 mV (initial value of surface potential in the deionized water) before and after
Chem 5, 617–633, March 14, 2019 629
testing. The potential-log(concentration) curves were calibrated with standard
ammonium sulfate solution with a series of concentrations in the H2SO4-Na2SO3
electrolyte. The fitting curve (y = �56.857x + 100.774, R2 = 0.9968) shows good
linear relation of potential value with log(concentration) by three times independent
calibrations.
The hydrazine presented in the electrolyte was estimated by themethod ofWatt and
Chrisp.41 Typically, 2 mL of the electrolyte solution was taken out and then mixed
with 2 mL of the coloring solution (4 g of p-dimethylaminobenzaldehyde
dissolved in 20 mL of concentrated sulfuric acid and 200 mL of ethanol). After gently
stirring for 20 min, the absorption spectra of the resulting solution were acquired
with the UV-vis spectrophotometer. The solutions of N2H4 with known concentra-
tions in the H2SO4-Na2SO3 solution were set as calibration standards, and the absor-
bance at �460 nm was used to plot the calibration curve (y = 0.7157x � 0.0079,
R2 = 0.9993).
To further prove the NH3 production, the post-electrolysis electrolytes were
measured by FTIR-ATR. During each testing, the thicknesses of the solutions are
the same. All spectra were presented in transmittance. Moreover, an isotopic label-
ing experiment used 15N2 enriched gas (98 atom% 15N) as the feeding gas to clarify
the source of ammonia. After PEC NRR at �0.2 V versus RHE for 4 hr, 20 mL of the
electrolyte was taken out, and then concentrated to 5 mL by heating at �70�C.Subsequently, 0.9 mL of the resulting solution was taken out and mixed with
0.1 mL D2O containing 100 ppm dimethyl sulfoxide as an internal standard for 1H
nuclear magnetic resonance measurement (Bruker AvanceIII HD500).
The ammonia yield rate (r) and faradic efficiency (FE) were calculated by the
following equations:
rðNH3Þ= ½NH3�3V
t3A; (Equation 4)
FEðNH3Þ= 33 96;4853 ½NH3�3V
MNH33Q
; (Equation 5)
where [NH3] is the measured NH3 concentration, V is the volume of the electrolyte
(80 mL), t is the reaction time, A is the geometric area of photocathode, MNH3 is
the molecular weight, and Q is the total charge passed through the photocathode.
The values of the absorbance at �650 nm, [NH3], A, and Q during PEC NRR pro-
cesses are listed in Tables S1–S3.
The equilibrium potential at 298.15 K under our experimental conditions was calcu-
lated with the Nernst equation under the assumption of 1 atm of N2 and 0.1 mM
NH4OH in the solution.
N2ðgÞ+ 2H2O+ 6H+ + 6e�/2NH4OH�aq�
DG0 = � 33:8 kJ mol�1 (Equation 6)
E0 = � DG0�nF = 0:058 V;
where n = 6 is the number of electrons transferred in the reaction and F is the faraday
constant.
E =E0 � RT
6Fln
½NH4OH�2
½H+ �6!+ 0:059V3pH: (Equation 7)
The equilibrium potential is 0.137 V versus RHE in 0.05 M H2SO4 solution.
630 Chem 5, 617–633, March 14, 2019
Computational Method
All DFT calculations were performed with the plane-wave technique implemented in
Vienna ab initio simulation package (VASP).42,43 The ion-electron interaction was
described according to the projector-augmented plane wave (PAW) approach.44
The generalized gradient approximation (GGA) expressed by Perdew-Burke-
Ernzerhof (PBE) exchange-correlation functional45 and a 420 eV cutoff for the
plane-wave basis set were adopted in all the computations. In this work, we built
three-layer (4O3 3 3) supercell totally 72 Au atoms to model the Au (111) surface,
namely Au/TS. To model Au-supported PTFE framework (Au-PTFE/TS), we placed
five C2F4 repeat-units (C10F22 chains) on top of above mentioned Au (111) slab. In
the calculations, the bottom two layers were fixed at their bulk positions, whereas
the remaining atoms were allowed to relax. The convergence threshold was set as
10�4 eV in energy and 0.04 eV A�1 in force. The Brillouin zone was sampled with a
2 3 5 3 1 Monkhorst-Pack mesh for k-point sampling. The PBE-D3 method was
adopted to describe the van der Waals interactions. The solvent effect on adsor-
bates was simulated with the Poisson-Boltzmann implicit solvation model with a
dielectric constant of 80.46
The free energy (G) of each species is estimated at T = 298 K according to
G=EDFT +EZPE � TS; (Equation 8)
where EDFT, EZPE, and S refer to the DFT total energy, zero-point energy, and en-
tropy, respectively. For adsorbed intermediates, EZPE and S were determined by
vibration frequencies calculations, where all 3N degrees of freedom are treated as
harmonic oscillator approximations with neglecting contributions from the slab.
The values of these molecules were taken from the NIST database (http://cccbdb.
nist.gov/). The contribution of zero-point energy and entropy corrections to G is
provided in Table S4.
SUPPLEMENTAL INFORMATION
Supplemental Information includes 41 figures and 4 tables and can be found with
this article online at https://doi.org/10.1016/j.chempr.2018.12.003.
ACKNOWLEDGMENTS
The authors are grateful to the National Natural Science Foundation of China
(51402100, 21573066, 21825201, and 21805080), the China Postdoctoral Science
Foundation, the Provincial Natural Science Foundation of Hunan (2016JJ1006 and
2016TP1009), the Shanghai Sailing Program (17YF1429800), and the Australian
Research Council (DP180100568 and DP180100731). We acknowledge the facilities
and scientific and technical assistance of the Curtin University Microscopy & Micro-
analysis Facility and theWA X-Ray Surface Analysis Facility. We thank Dr. Jean-Pierre
Veder from the John de Laeter Centre for assistance with XPS measurements. Part of
this research was undertaken with the EM instrumentation (ARC LE140100150) and
XPS instrumentation (ARC LE120100026) at the John de Laeter Centre of Curtin
University.
AUTHOR CONTRIBUTIONS
J.Z. and S.W. conceived the ideas, designed the research, and oversaw the entire
project. J.Z. and Y. Lyu synthesized the catalysts, conducted electrochemical mea-
surements, and analyzed the data. R.W., Y.Z., H.L., and C.C. carried out the quanti-
fication and analysis of NH3 in the electrolyte. M.Q. and Y. Lyu finished the
Chem 5, 617–633, March 14, 2019 631
calculation in theory. J.Z., Y. Lyu, M.Q., H.Z., Y. Li, S.P.J., and S.W. co-wrote the pa-
per and commented on the manuscript.
DECLARATION OF INTERESTS
The authors declare no competing interests.
Received: September 4, 2018
Revised: October 2, 2018
Accepted: December 3, 2018
Published: January 17, 2019
REFERENCES AND NOTES
1. Service, R.F. (2014). New recipe producesammonia from air, water, and sunlight. Science345, 610.
2. Chen, G.F., Cao, X., Wu, S., Zeng, X., Ding, L.X.,Zhu, M., and Wang, H. (2017). Ammoniaelectrosynthesis with high selectivity underambient conditions via a Li+ incorporationstrategy. J. Am. Chem. Soc. 139, 9771–9774.
3. Licht, S., Cui, B., Wang, B., Li, F.-F., Lau, J., andLiu, S. (2014). Ammonia synthesis by N2 andsteam electrolysis in molten hydroxidesuspensions of nanoscale Fe2O3. Science 345,637–640.
4. Liu, J., Kelley, M.S., Wu, W., Banerjee, A.,Douvalis, A.P., Wu, J., Zhang, Y., Schatz, G.C.,and Kanatzidis, M.G. (2016). Nitrogenase-mimic iron-containing chalcogels forphotochemical reduction of dinitrogen toammonia. Proc. Natl. Acad. Sci. USA 113,5530–5535.
5. Song, Y., Johnson, D., Peng, R., Hensley, D.K.,Bonnesen, P.V., Liang, L., Huang, J., Yang, F.,Zhang, F., Qiao, R., et al. (2018). A physicalcatalyst for the electrolysis of nitrogen toammonia. Sci. Adv. 4, e1700336.
6. Li, C., Wang, T., Zhao, Z.J., Yang, W., Li, J.F., Li,A., Yang, Z., Ozin, G.A., and Gong, J. (2018).Promoted fixation of molecular nitrogen withsurface oxygen vacancies on plasmon-enhanced TiO2 photoelectrodes. Angew.Chem. Int. Ed. 57, 5278–5282.
7. van der Ham, C.J.M., Koper, M.T.M., andHetterscheid, D.G.H. (2014). Challenges inreduction of dinitrogen by proton and electrontransfer. Chem. Soc. Rev. 43, 5183–5191.
8. Medford, A.J., and Hatzell, M.C. (2017).Photon-driven nitrogen fixation: currentprogress, thermodynamic considerations, andfuture outlook. ACS Catal. 7, 2624–2643.
9. Guo, C., Ran, J., Vasileff, A., and Qiao, S.Z.(2018). Rational design of electrocatalysts andphoto(electro)catalysts for nitrogen reductionto ammonia (NH3) under ambient conditions.Energy Environ. Sci. 11, 45–56.
10. Li, J., Li, H., Zhan, G., and Zhang, L. (2017). Solarwater splitting and nitrogen fixation withlayered bismuth oxyhalides. Acc. Chem. Res.50, 112–121.
11. Li, S.J., Bao, D., Shi, M.M., Wulan, B.R., Yan,J.M., and Jiang, Q. (2017). Amorphizing of Aunanoparticles by CeOx–RGO hybrid supporttowards highly efficient electrocatalyst for N2
632 Chem 5, 617–633, March 14, 2019
reduction under ambient conditions. Adv.Mater. 29, 1700001.
12. Zhao, Y., Zhao, Y., Waterhouse, G.I.N., Zheng,L., Cao, X., Teng, F., Wu, L.Z., Tung, C.H.,O’Hare, D., and Zhang, T. (2017). Layered-double-hydroxide nanosheets as efficientvisible-light-driven photocatalysts fordinitrogen fixation. Adv. Mater. 29, 1703828.
13. Li, H., Shang, J., Ai, Z., and Zhang, L. (2015).Efficient visible light nitrogen fixation withBiOBr nanosheets of oxygen vacancies on theexposed {001} facets. J. Am. Chem. Soc. 137,6393–6399.
14. Liu, Y., Su, Y., Quan, X., Fan, X., Chen, S., Yu, H.,Zhao, H., Zhang, Y., and Zhao, J. (2018). Facileammonia synthesis from electrocatalyticN2 reduction under ambient conditions onN-doped porous carbon. ACS Catal. 8,1186–1191.
15. Zhu, D., Zhang, L., Ruther, R.E., and Hamers,R.J. (2013). Photo-illuminated diamond as asolid-state source of solvated electrons inwater for nitrogen reduction. Nat. Mater. 12,836–841.
16. Zhou, F., Azofra, L.M., Ali, M., Kar, M., Simonov,A.N., McDonnell-Worth, C., Sun, C., Zhang, X.,and MacFarlane, D.R. (2017). Electro-synthesisof ammonia from nitrogen at ambienttemperature and pressure in ionic liquids.Energy Environ. Sci. 10, 2516–2520.
17. Liu, C., Sakimoto, K.K., Colon, B.C., Silver, P.A.,and Nocera, D.G. (2017). Ambient nitrogenreduction cycle using a hybrid inorganic-biological system. Proc. Natl. Acad. Sci. USA114, 6450–6455.
18. Ali, M., Zhou, F., Chen, K., Kotzur, C., Xiao, C.,Bourgeois, L., Zhang, X., and MacFarlane, D.R.(2016). Nanostructured photoelectrochemicalsolar cell for nitrogen reduction using plasmon-enhanced black silicon. Nat. Commun. 7,11335.
19. Lee, H.K., Koh, C.S.L., Lee, Y.H., Liu, C., Phang,I.Y., Han, X., Tsung, C.K., and Ling, X.Y. (2018).Favoring the unfavored: selectiveelectrochemical nitrogen fixation using areticular chemistry approach. Sci. Adv. 4,eaar3208.
20. Mukherjee, S., Cullen, D.A., Karakalos, S., Liu,K., Zhang, H., Zhao, S., Xu, H., More, K.L.,Wang, G., and Wu, G. (2018). Metal-organicframework-derived nitrogen-doped highlydisordered carbon for electrochemical
ammonia synthesis using N2 and H2O inalkaline electrolytes. Nano Energy 48, 217–226.
21. Lv, C., Yan, C., Chen, G., Ding, Y., Sun, J., Zhou,Y., and Yu, G. (2018). An amorphous nobel-metal-free electrocatalyst that enablesnitrogen fixation under ambient conditions.Angew. Chem. Int. Ed. 57, 6073–6076.
22. Dinh, C.T., Burdyny, T., Kibria, M.G.,Seifitokaldani, A., Gabardo, C.M., Garcıa deArquer, F.P., Kiani, A., Edwards, J.P., De Luna,P.D., Bushuyev, O.S., et al. (2018). CO2
electroreduction to ethylene via hydroxide-mediated copper catalysis at an abruptinterface. Science 360, 783–787.
23. Lu, Z., Xu,W., Ma, J., Li, Y., Sun, X., and Jiang, L.(2016). Superaerophilic carbon-nanotube-arrayelectrode for high-performance oxygenreduction reaction. Adv. Mater. 28, 7155–7161.
24. Liu, R., Zheng, Z., Spurgeon, J., and Yang, X.(2014). Enhanced photoelectrochemical water-splitting performance of semiconductors bysurface passivation layers. Energy Environ. Sci.7, 2504–2517.
25. Zhao, J., Cai, L., Li, H., Shi, X., and Zheng, X.(2017). Stabilizing silicon photocathodes bysolution-deposited Ni-Fe layered doublehydroxide for efficient hydrogen evolution inalkaline media. ACS Energy Lett. 2, 1939–1946.
26. Peng, C., Chen, Z., and Tiwari, M.K. (2018). All-organic superhydrophobic coatings withmechanochemical robustness and liquidimpalement resistance. Nat. Mater. 17,355–360.
27. Yao, Y., Zhu, S., Wang, H., Li, H., and Shao, M.(2018). A spectroscopic study on the nitrogenelectrochemical reduction reaction on goldand platinum surfaces. J. Am. Chem. Soc. 140,1496–1501.
28. Zheng, J., Lyu, Y., Wang, R., Xie, C., Zhou, H.,Jiang, S.P., and Wang, S. (2018). CrystallineTiO2 protective layer with graded oxygendefects for efficient and stable silicon-basedphotocathode. Nat. Commun. 9, 3572.
29. Bourg, M.C., Badia, A., and Lennox, R.B. (2000).Gold-sulfur bonding in 2D and 3D self-assembled monolayers: XPS characterization.J. Phys. Chem. B 104, 6562–6567.
30. Zheng, J., Lyu, Y., Xie, C., Wang, R., Tao, L., Wu,H., Zhou, H., Jiang, S., and Wang, S. (2018).Defect-enhanced charge separation andtransfer within protection layer/semiconductor

structure of photoanodes. Adv. Mater. 30,e1801773.
31. Lu, Z., Zhu, W., Yu, X., Zhang, H., Li, Y., Sun, X.,Wang, X., Wang, H., Wang, J., Luo, J., et al.(2014). Ultrahigh hydrogen evolutionperformance of under-water‘‘superaerophobic’’ MoS2 nanostructuredelectrodes. Adv. Mater. 26, 2683–2687.
32. Azimi, G., Dhiman, R., Kwon, H., Paxson, A.T.,and Varanasi, K.K. (2013). Hydrophobicity ofrare-earth oxide ceramics. Nat. Mater. 12,315–320.
33. Zheng, J.Y., Bao, S.H., Guo, Y., and Jin, P.(2014). Natural hydrophobicity and reversiblewettability conversion of flat anatase TiO2 thinfilm. ACS Appl. Mater. Interfaces 6, 1351–1355.
34. Wang, J., Yu, L., Hu, L., Chen, G., Xin, H., andFeng, X. (2018). Ambient ammonia synthesis viapalladium-catalyzed electrohydrogenation ofdinitrogen at low overpotential. Nat. Commun.9, 1795.
35. Montoya, J.H., Tsai, C., Vojvodic, A., andNørskov, J.K. (2015). The challenge ofelectrochemical ammonia synthesis: a new
perspective on the role of nitrogen scalingrelations. ChemSusChem 8, 2180–2186.
36. Deng, J., Iniguez, J.A., and Liu, C. (2018).Electrocatalytic nitrogen reduction at lowtemperature. Joule 2, 846–856.
37. Skulason, E., Bligaard, T., Gudmundsdottir, S.,Studt, F., Rossmeisl, J., Abild-Pedersen, F.,Vegge, T., Jonsson, H., and Norskov, J.K.(2012). A theoretical evaluation of possibletransition metal electro-catalysts for N2reduction. Phys. Chem. Chem. Phys. 14,1235–1245.
38. Zheng, J., Bao, S., Zhang, X., Wu, H., Chen, R.,and Jin, P. (2016). Pd-MgNix nanospheres/black-TiO2 porous films with highly efficienthydrogen production by near-completesuppression of surface recombination. Appl.Catal. B 183, 69–74.
39. He, J., Hu, B., and Zhao, Y. (2016).Superaerophobic electrode with metal@metal-oxide powder catalyst for oxygen evolutionreaction. Adv. Funct. Mater. 26, 5998–6004.
40. Searle, P.L. (1984). The Berthelot or indophenolreaction and its use in the analytical chemistryof nitrogen. A review. Analyst 109, 549–568.
41. Watt, G.W., and Chrisp, J.D. (1952).Spectrophotometric method for determinationof hydrazine. Anal. Chem. 24, 2006–2008.
42. Kresse, G., and Furthmuller, J. (1996). Efficientiterative schemes for ab initio total-energycalculations using a plane-wave basis set. Phys.Rev. B 54, 11169–11186.
43. Kresse, G., and Furthmuller, J. (1996). Efficiencyof ab-initio total energy calculations for metalsand semiconductors using a plane-wave basisset. Comput. Mater. Sci. 6, 15–50.
44. Kresse, G., and Joubert, D. (1999). Fromultrasoft pseudopotentials to the projectoraugmented-wave method. Phys. Rev. B 59,1758–1775.
45. Perdew, J.P., Burke, K., and Ernzerhof, M.(1996). Generalized gradient approximationmade simple. Phys. Rev. Lett. 77,3865–3868.
46. Mathew, K., Sundararaman, R., Letchworth-Weaver, K., Arias, T.A., and Hennig, R.G. (2014).Implicit solvation model for density-functionalstudy of nanocrystal surfaces and reactionpathways. J. Chem. Phys. 140, 084106.
Chem 5, 617–633, March 14, 2019 633
Chem, Volume 5
Supplemental Information
Photoelectrochemical Synthesis
of Ammonia on the Aerophilic-Hydrophilic
Heterostructure with 37.8% Efficiency
Jianyun Zheng, Yanhong Lyu, Man Qiao, Ruilun Wang, Yangyang Zhou, Hao Li, ChenChen, Yafei Li, Huaijuan Zhou, San Ping Jiang, and Shuangyin Wang
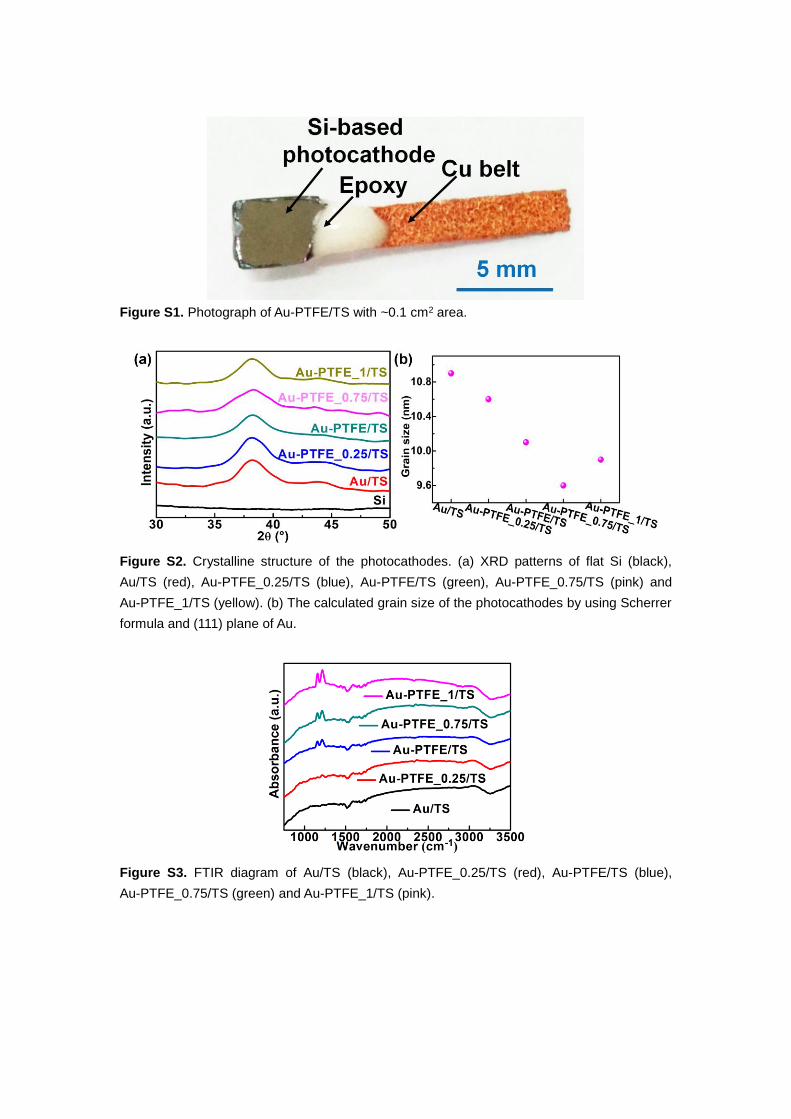
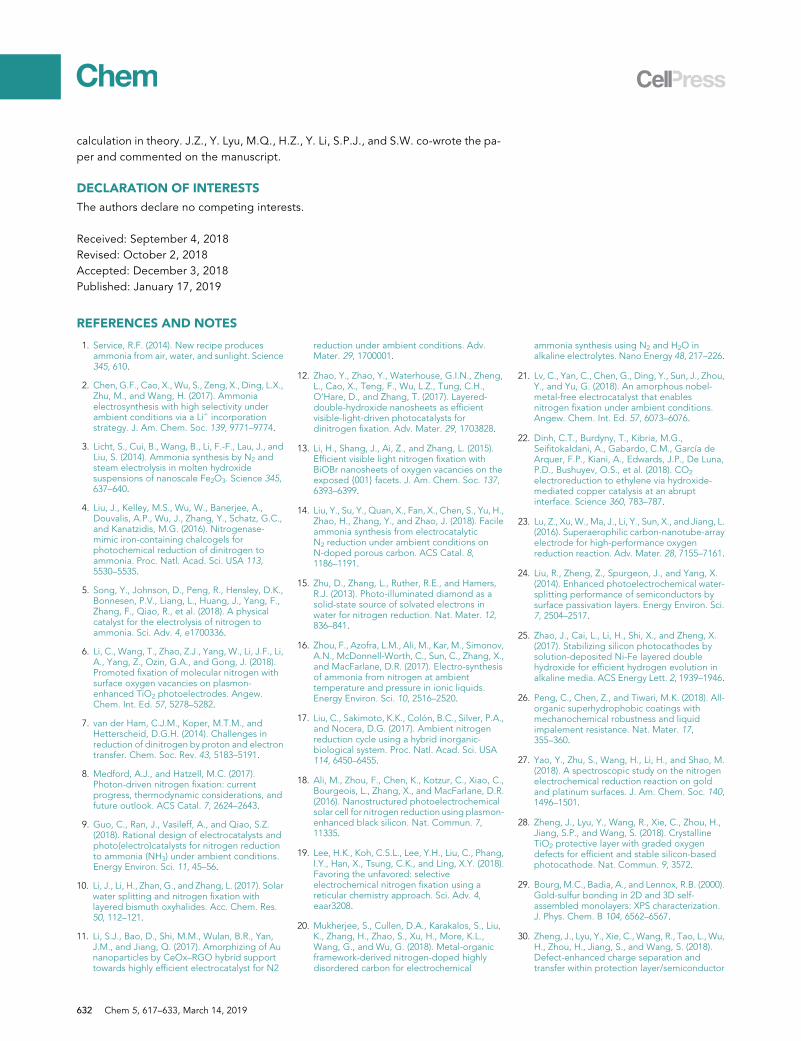
Figure S1. Photograph of Au-PTFE/TS with ~0.1 cm2 area.
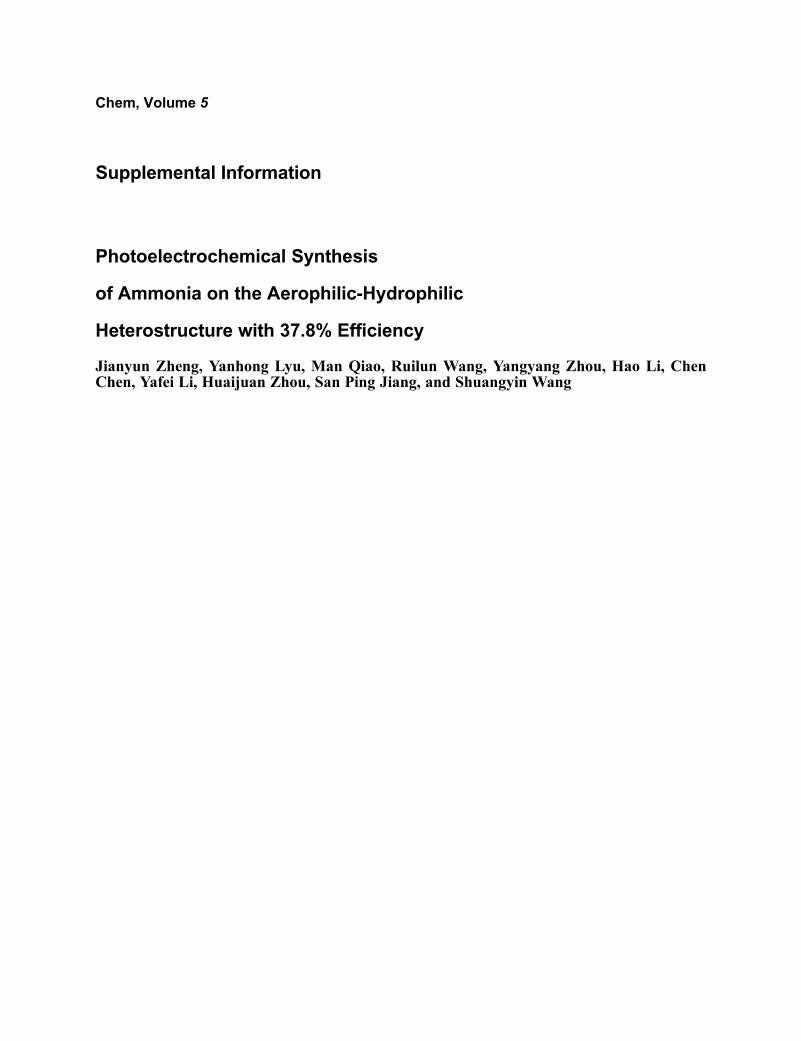
Figure S2. Crystalline structure of the photocathodes. (a) XRD patterns of flat Si (black),
Au/TS (red), Au-PTFE_0.25/TS (blue), Au-PTFE/TS (green), Au-PTFE_0.75/TS (pink) and
Au-PTFE_1/TS (yellow). (b) The calculated grain size of the photocathodes by using Scherrer
formula and (111) plane of Au.
Figure S3. FTIR diagram of Au/TS (black), Au-PTFE_0.25/TS (red), Au-PTFE/TS (blue),
Au-PTFE_0.75/TS (green) and Au-PTFE_1/TS (pink).
Figure S4. XPS survey spectra of Au/TS (orange), Au-PTFE/TS (purple) and Au-PTFE_1/TS
(green).
Figure S5. Atomic ratio of various elements on the surface of Au/TS, Au-PTFE/TS and
Au-PTFE_1/TS.
Figure S6. XPS spectrum of Ti 2p on the surface of Au/TS.
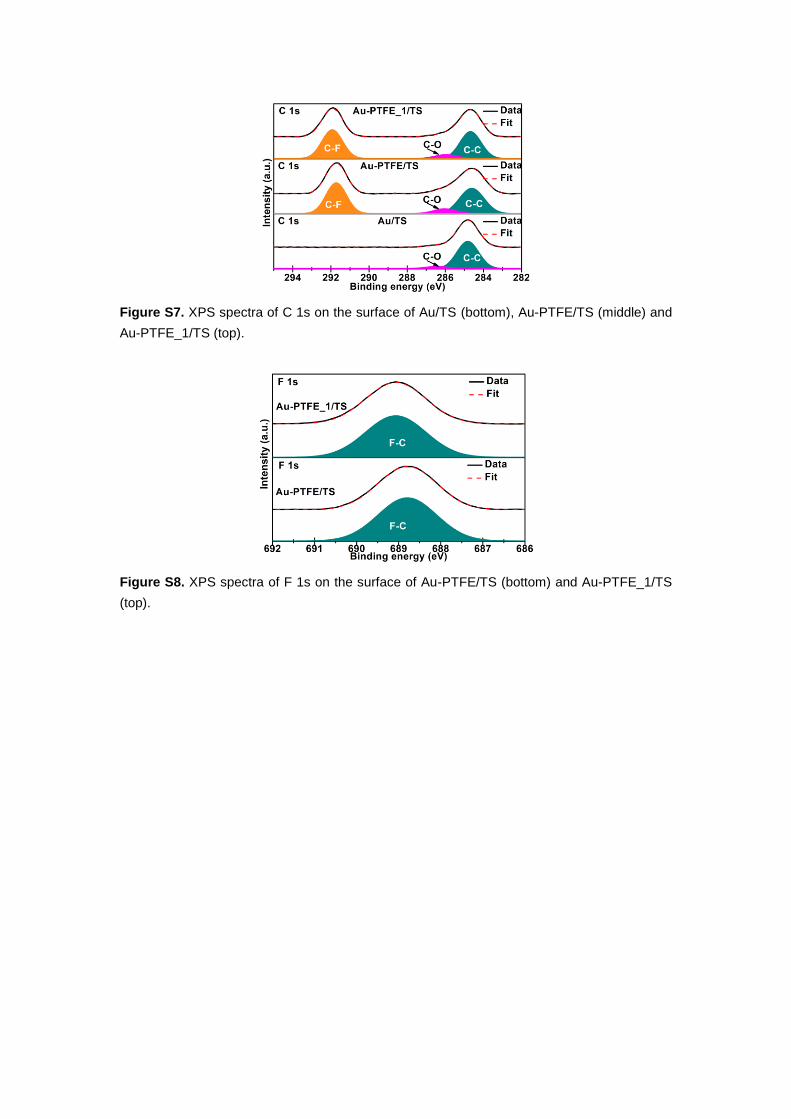
Figure S7. XPS spectra of C 1s on the surface of Au/TS (bottom), Au-PTFE/TS (middle) and
Au-PTFE_1/TS (top).
Figure S8. XPS spectra of F 1s on the surface of Au-PTFE/TS (bottom) and Au-PTFE_1/TS
(top).
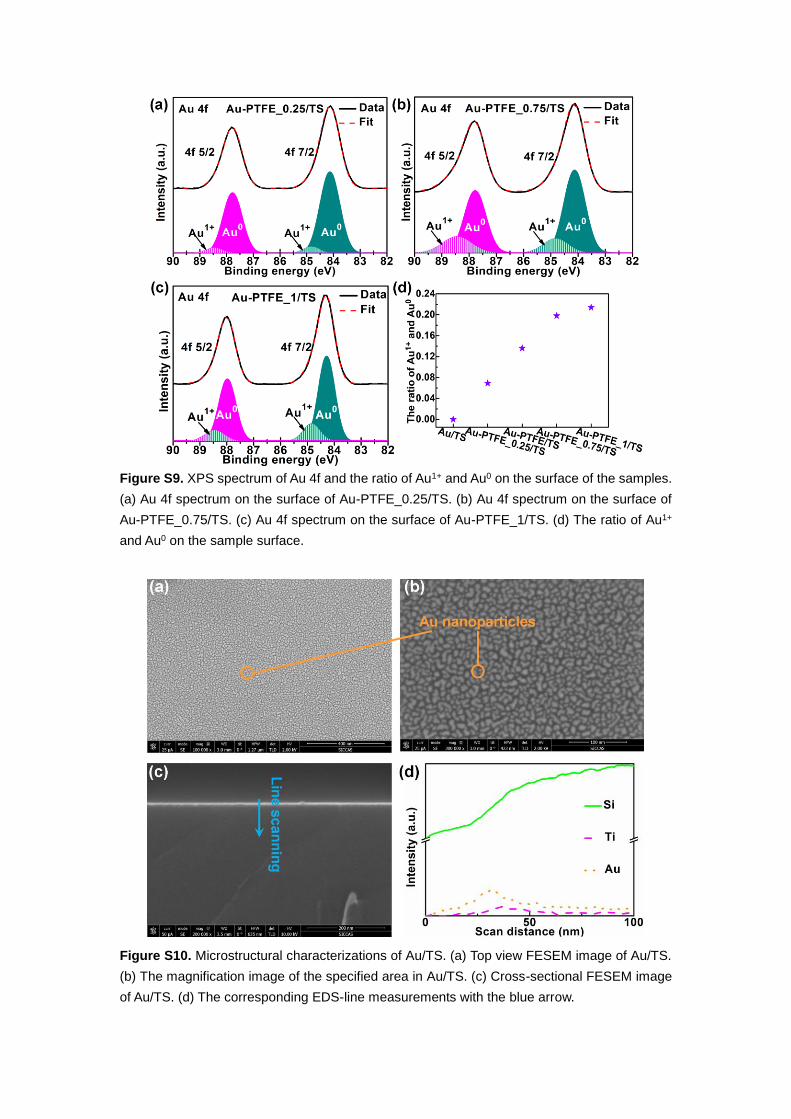
Figure S9. XPS spectrum of Au 4f and the ratio of Au1+ and Au0 on the surface of the samples.
(a) Au 4f spectrum on the surface of Au-PTFE_0.25/TS. (b) Au 4f spectrum on the surface of
Au-PTFE_0.75/TS. (c) Au 4f spectrum on the surface of Au-PTFE_1/TS. (d) The ratio of Au1+
and Au0 on the sample surface.
Figure S10. Microstructural characterizations of Au/TS. (a) Top view FESEM image of Au/TS.
(b) The magnification image of the specified area in Au/TS. (c) Cross-sectional FESEM image
of Au/TS. (d) The corresponding EDS-line measurements with the blue arrow.
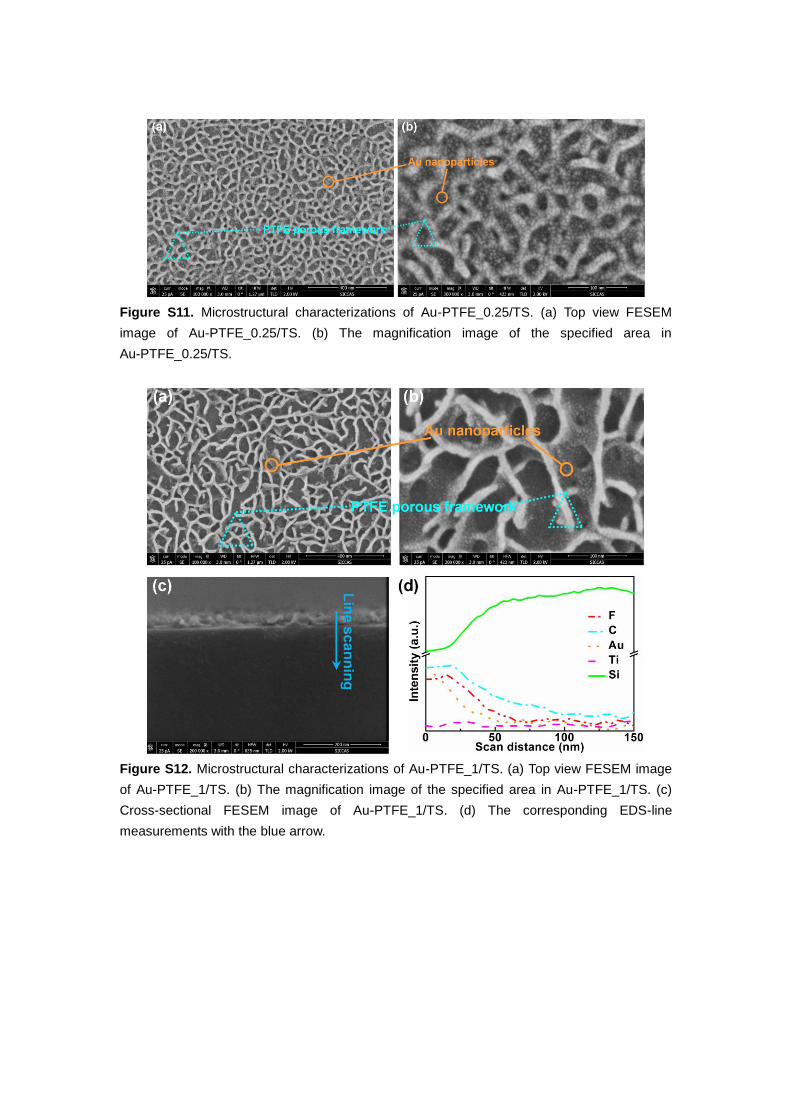
Figure S11. Microstructural characterizations of Au-PTFE_0.25/TS. (a) Top view FESEM
image of Au-PTFE_0.25/TS. (b) The magnification image of the specified area in
Au-PTFE_0.25/TS.
Figure S12. Microstructural characterizations of Au-PTFE_1/TS. (a) Top view FESEM image
of Au-PTFE_1/TS. (b) The magnification image of the specified area in Au-PTFE_1/TS. (c)
Cross-sectional FESEM image of Au-PTFE_1/TS. (d) The corresponding EDS-line
measurements with the blue arrow.
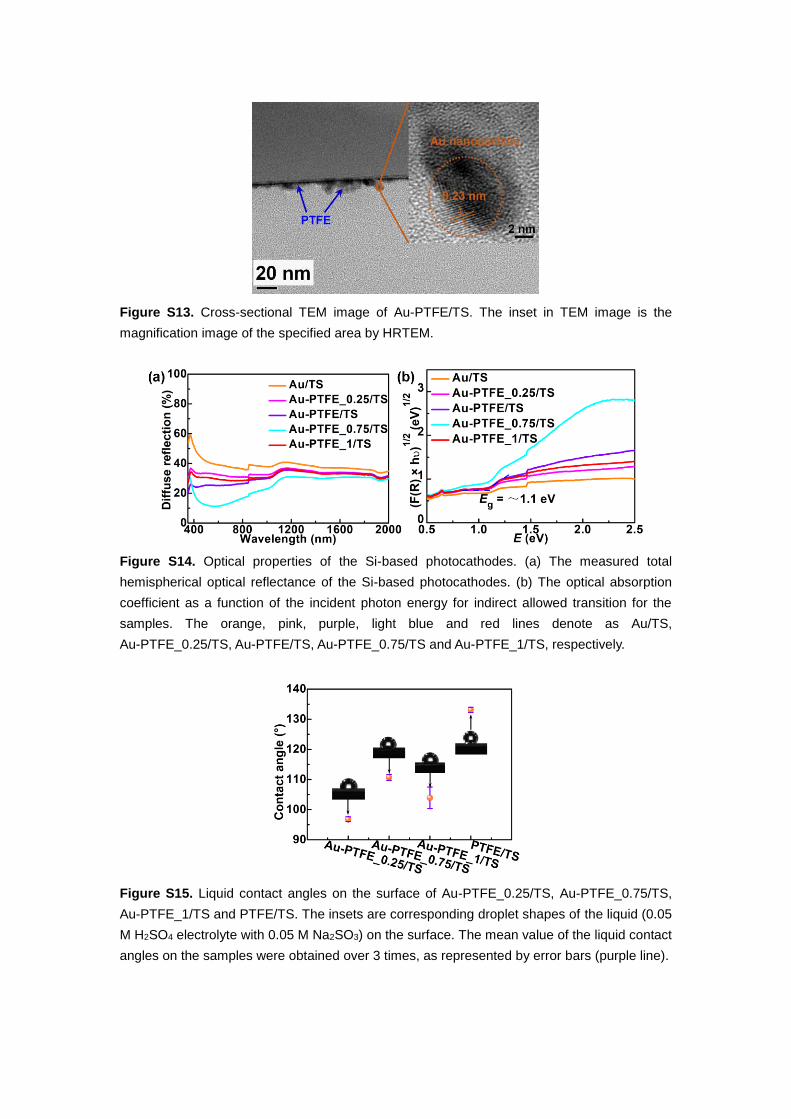
Figure S13. Cross-sectional TEM image of Au-PTFE/TS. The inset in TEM image is the
magnification image of the specified area by HRTEM.
Figure S14. Optical properties of the Si-based photocathodes. (a) The measured total
hemispherical optical reflectance of the Si-based photocathodes. (b) The optical absorption
coefficient as a function of the incident photon energy for indirect allowed transition for the
samples. The orange, pink, purple, light blue and red lines denote as Au/TS,
Au-PTFE_0.25/TS, Au-PTFE/TS, Au-PTFE_0.75/TS and Au-PTFE_1/TS, respectively.
Figure S15. Liquid contact angles on the surface of Au-PTFE_0.25/TS, Au-PTFE_0.75/TS,
Au-PTFE_1/TS and PTFE/TS. The insets are corresponding droplet shapes of the liquid (0.05
M H2SO4 electrolyte with 0.05 M Na2SO3) on the surface. The mean value of the liquid contact
angles on the samples were obtained over 3 times, as represented by error bars (purple line).
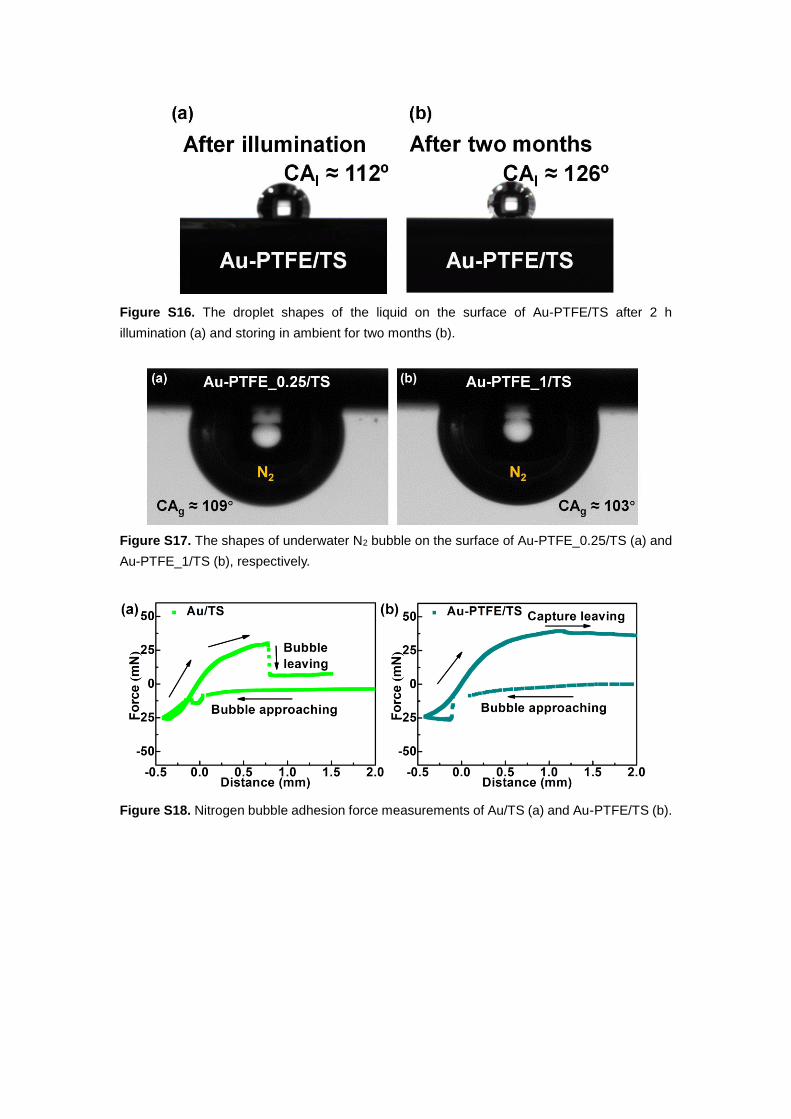
Figure S16. The droplet shapes of the liquid on the surface of Au-PTFE/TS after 2 h
illumination (a) and storing in ambient for two months (b).
Figure S17. The shapes of underwater N2 bubble on the surface of Au-PTFE_0.25/TS (a) and
Au-PTFE_1/TS (b), respectively.
Figure S18. Nitrogen bubble adhesion force measurements of Au/TS (a) and Au-PTFE/TS (b).
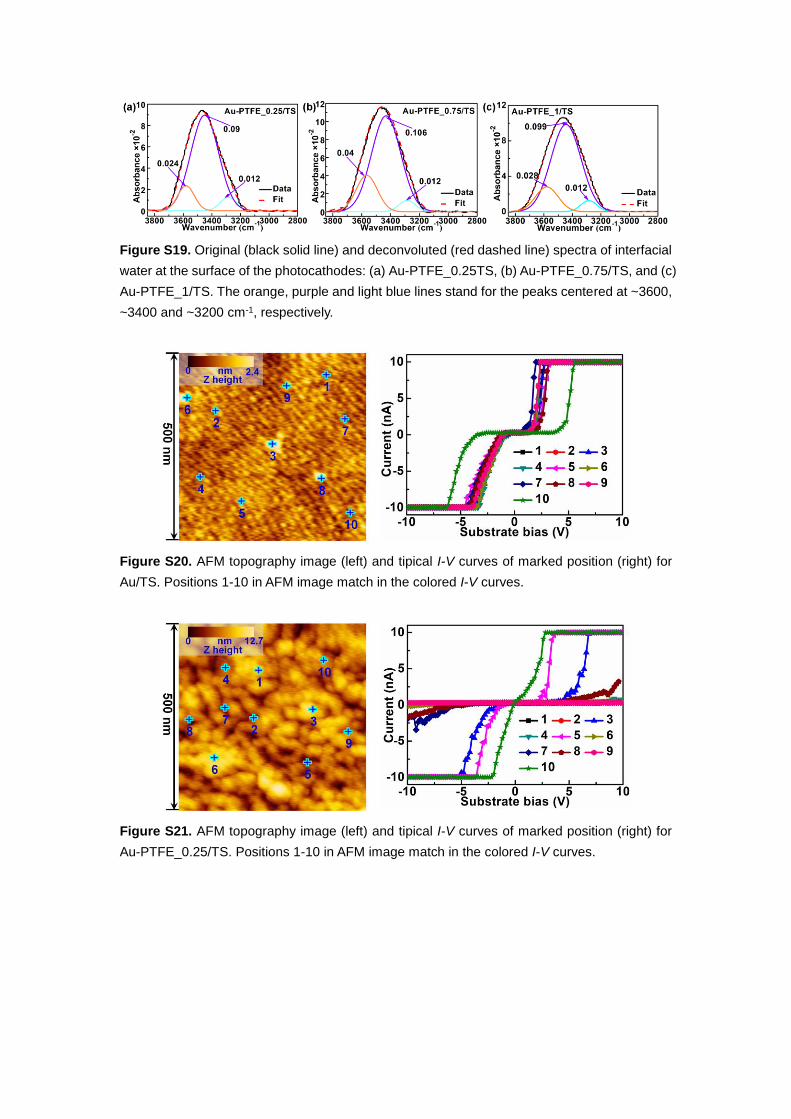
Figure S19. Original (black solid line) and deconvoluted (red dashed line) spectra of interfacial
water at the surface of the photocathodes: (a) Au-PTFE_0.25TS, (b) Au-PTFE_0.75/TS, and (c)
Au-PTFE_1/TS. The orange, purple and light blue lines stand for the peaks centered at ~3600,
~3400 and ~3200 cm-1, respectively.
Figure S20. AFM topography image (left) and tipical I-V curves of marked position (right) for
Au/TS. Positions 1-10 in AFM image match in the colored I-V curves.
Figure S21. AFM topography image (left) and tipical I-V curves of marked position (right) for
Au-PTFE_0.25/TS. Positions 1-10 in AFM image match in the colored I-V curves.

Figure S22. AFM topography image (left) and tipical I-V curves of marked position (right) for
Au-PTFE_0.75/TS. Positions 1-10 in AFM image match in the colored I-V curves.
Figure S23. AFM topography image (left) and tipical I-V curves of marked position (right) for
Au-PTFE_1/TS. Positions 1-10 in AFM image match in the colored I-V curves.
Figure S24. AFM topography image (left) and tipical I-V curves of marked position (right) for
PTFE/TS. Positions 1-10 in AFM image match in the colored I-V curves.
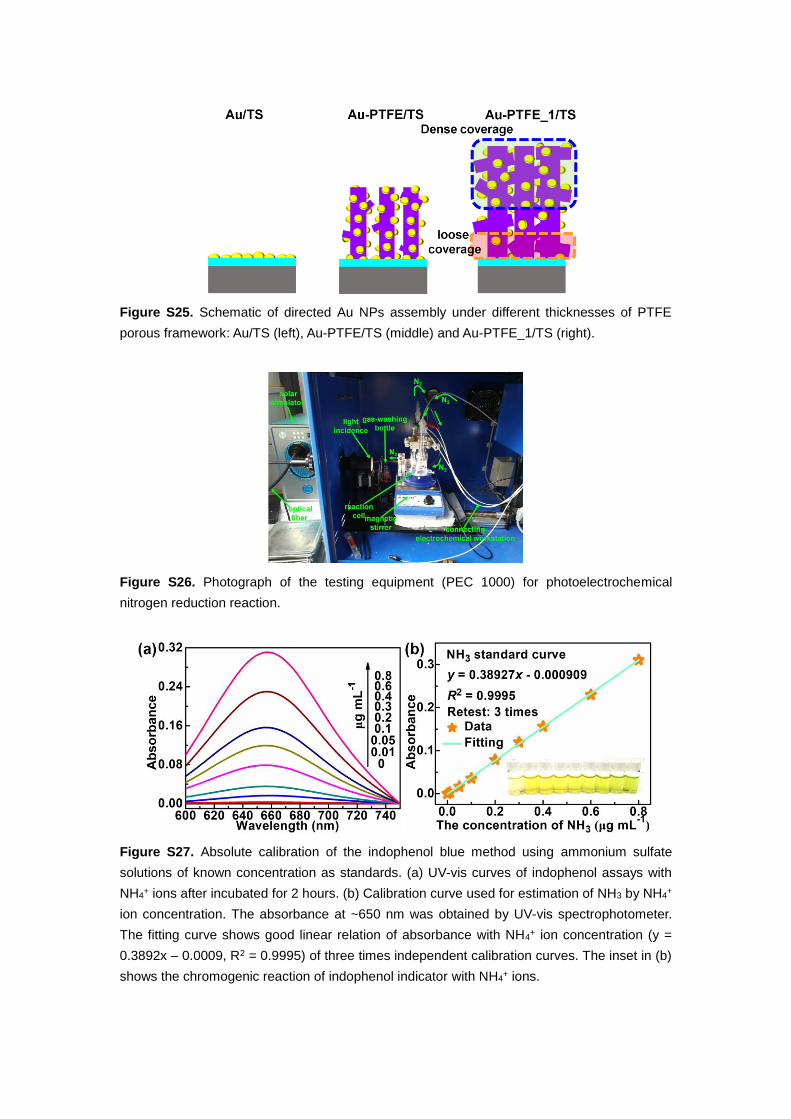
Figure S25. Schematic of directed Au NPs assembly under different thicknesses of PTFE
porous framework: Au/TS (left), Au-PTFE/TS (middle) and Au-PTFE_1/TS (right).
Figure S26. Photograph of the testing equipment (PEC 1000) for photoelectrochemical
nitrogen reduction reaction.
Figure S27. Absolute calibration of the indophenol blue method using ammonium sulfate
solutions of known concentration as standards. (a) UV-vis curves of indophenol assays with
NH4+ ions after incubated for 2 hours. (b) Calibration curve used for estimation of NH3 by NH4
+
ion concentration. The absorbance at ~650 nm was obtained by UV-vis spectrophotometer.
The fitting curve shows good linear relation of absorbance with NH4+ ion concentration (y =
0.3892x – 0.0009, R2 = 0.9995) of three times independent calibration curves. The inset in (b)
shows the chromogenic reaction of indophenol indicator with NH4+ ions.
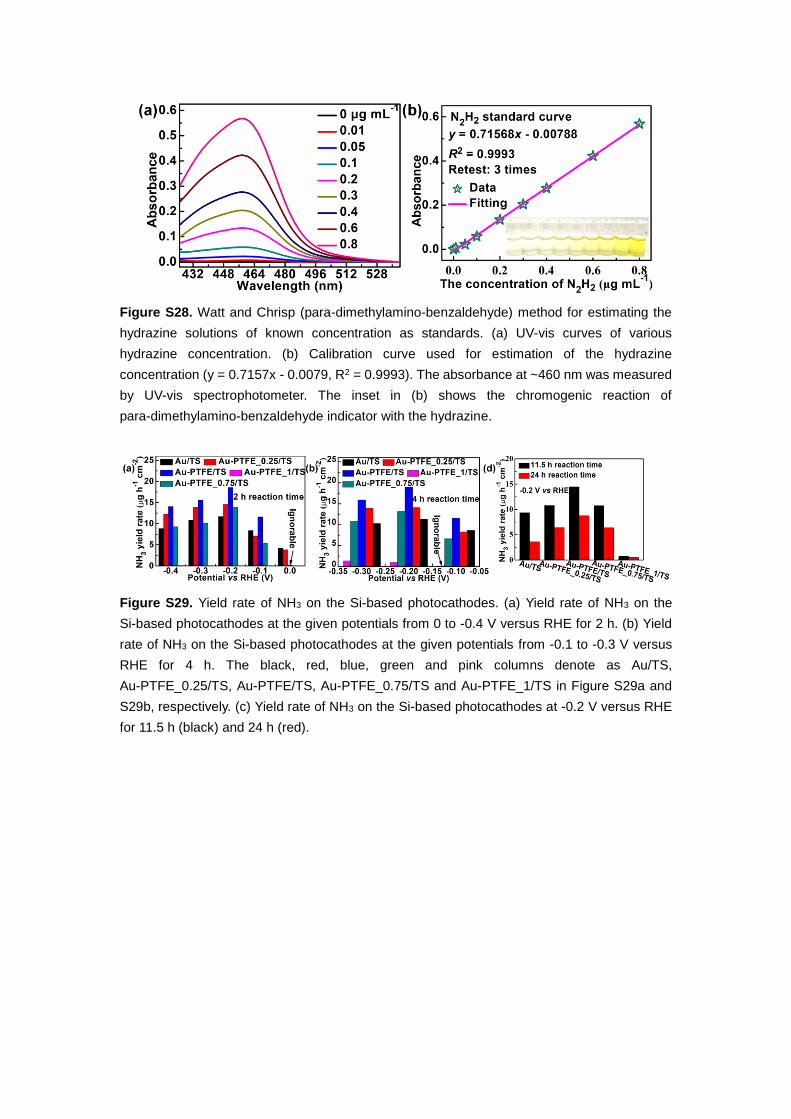
Figure S28. Watt and Chrisp (para-dimethylamino-benzaldehyde) method for estimating the
hydrazine solutions of known concentration as standards. (a) UV-vis curves of various
hydrazine concentration. (b) Calibration curve used for estimation of the hydrazine
concentration (y = 0.7157x - 0.0079, R2 = 0.9993). The absorbance at ~460 nm was measured
by UV-vis spectrophotometer. The inset in (b) shows the chromogenic reaction of
para-dimethylamino-benzaldehyde indicator with the hydrazine.
Figure S29. Yield rate of NH3 on the Si-based photocathodes. (a) Yield rate of NH3 on the
Si-based photocathodes at the given potentials from 0 to -0.4 V versus RHE for 2 h. (b) Yield
rate of NH3 on the Si-based photocathodes at the given potentials from -0.1 to -0.3 V versus
RHE for 4 h. The black, red, blue, green and pink columns denote as Au/TS,
Au-PTFE_0.25/TS, Au-PTFE/TS, Au-PTFE_0.75/TS and Au-PTFE_1/TS in Figure S29a and
S29b, respectively. (c) Yield rate of NH3 on the Si-based photocathodes at -0.2 V versus RHE
for 11.5 h (black) and 24 h (red).
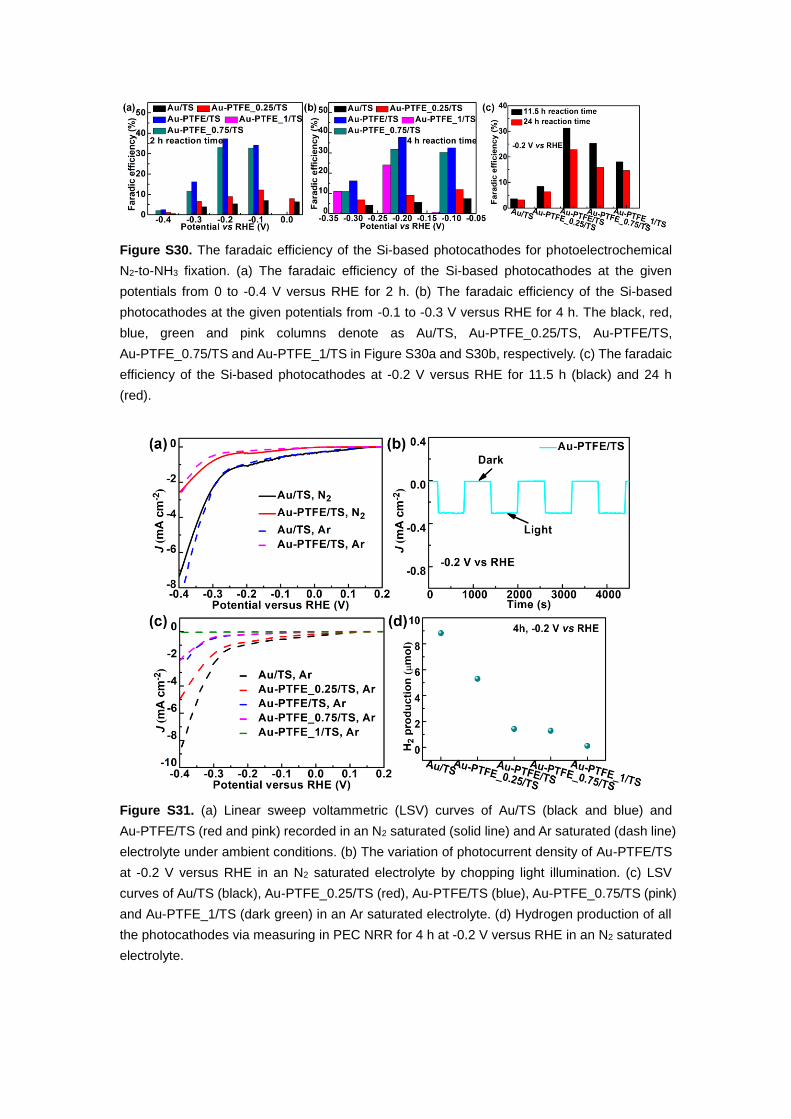
Figure S30. The faradaic efficiency of the Si-based photocathodes for photoelectrochemical
N2-to-NH3 fixation. (a) The faradaic efficiency of the Si-based photocathodes at the given
potentials from 0 to -0.4 V versus RHE for 2 h. (b) The faradaic efficiency of the Si-based
photocathodes at the given potentials from -0.1 to -0.3 V versus RHE for 4 h. The black, red,
blue, green and pink columns denote as Au/TS, Au-PTFE_0.25/TS, Au-PTFE/TS,
Au-PTFE_0.75/TS and Au-PTFE_1/TS in Figure S30a and S30b, respectively. (c) The faradaic
efficiency of the Si-based photocathodes at -0.2 V versus RHE for 11.5 h (black) and 24 h
(red).
Figure S31. (a) Linear sweep voltammetric (LSV) curves of Au/TS (black and blue) and
Au-PTFE/TS (red and pink) recorded in an N2 saturated (solid line) and Ar saturated (dash line)
electrolyte under ambient conditions. (b) The variation of photocurrent density of Au-PTFE/TS
at -0.2 V versus RHE in an N2 saturated electrolyte by chopping light illumination. (c) LSV
curves of Au/TS (black), Au-PTFE_0.25/TS (red), Au-PTFE/TS (blue), Au-PTFE_0.75/TS (pink)
and Au-PTFE_1/TS (dark green) in an Ar saturated electrolyte. (d) Hydrogen production of all
the photocathodes via measuring in PEC NRR for 4 h at -0.2 V versus RHE in an N2 saturated
electrolyte.

Figure S32. The time-dependence of NH3 yield obtained from Au-PTFE/TS with N2 as the
feeding gas in the light (black line with squares), Au-PTFE/TS with Ar as the feeding gas in the
light (red line with dots), Au-PTFE/TS with N2 as the feeding gas in the dark (blue line with
regular triangles), and PTFE/TS with N2 as the feeding gas in the light (pink line with inverted
triangles).
Figure S33. Photoelectrochemical nitrogen reduction reaction of the Si-based photocathodes
at -0.2 V versus RHE for 24 h. (a) Chronoamperometry results of the Si-based photocathodes
at -0.2 V versus RHE for 24 h. (b) UV-vis curves of the post-electrolysis electrolyte measured
on various Si-based photocathodes. The orange, purple, light blue, pink and green lines
denote as Au/TS, Au-PTFE/TS, Au-PTFE_0.25/TS, Au-PTFE_0.75/TS and Au-PTFE_1/TS,
respectively.
Figure S34. FTIR diagram of Au-PTFE/TS after 11.5 h electrolysis.
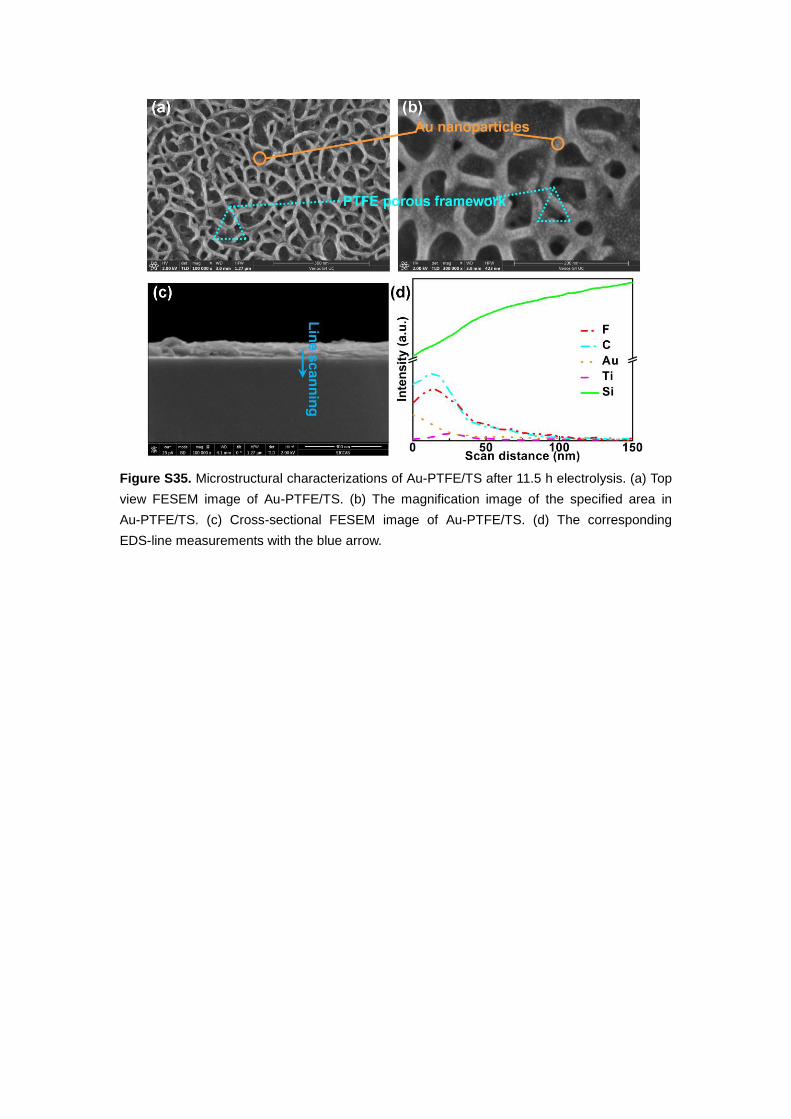
Figure S35. Microstructural characterizations of Au-PTFE/TS after 11.5 h electrolysis. (a) Top
view FESEM image of Au-PTFE/TS. (b) The magnification image of the specified area in
Au-PTFE/TS. (c) Cross-sectional FESEM image of Au-PTFE/TS. (d) The corresponding
EDS-line measurements with the blue arrow.
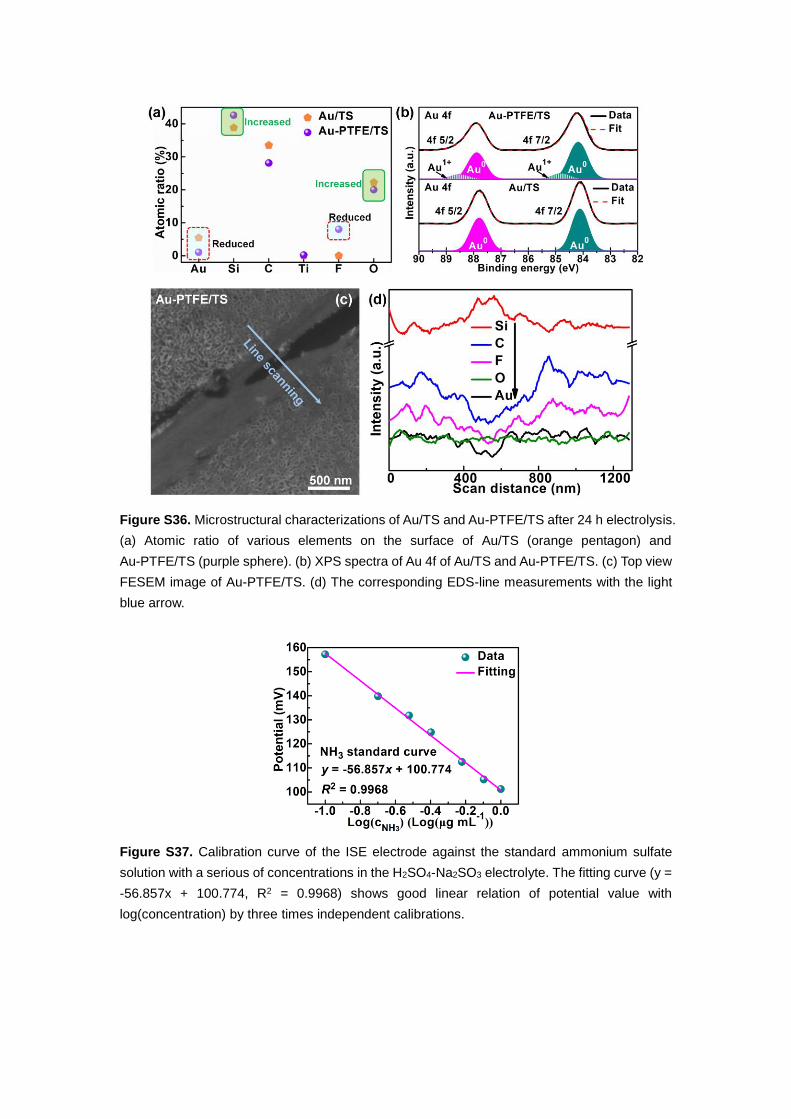
Figure S36. Microstructural characterizations of Au/TS and Au-PTFE/TS after 24 h electrolysis.
(a) Atomic ratio of various elements on the surface of Au/TS (orange pentagon) and
Au-PTFE/TS (purple sphere). (b) XPS spectra of Au 4f of Au/TS and Au-PTFE/TS. (c) Top view
FESEM image of Au-PTFE/TS. (d) The corresponding EDS-line measurements with the light
blue arrow.
Figure S37. Calibration curve of the ISE electrode against the standard ammonium sulfate
solution with a serious of concentrations in the H2SO4-Na2SO3 electrolyte. The fitting curve (y =
-56.857x + 100.774, R2 = 0.9968) shows good linear relation of potential value with
log(concentration) by three times independent calibrations.
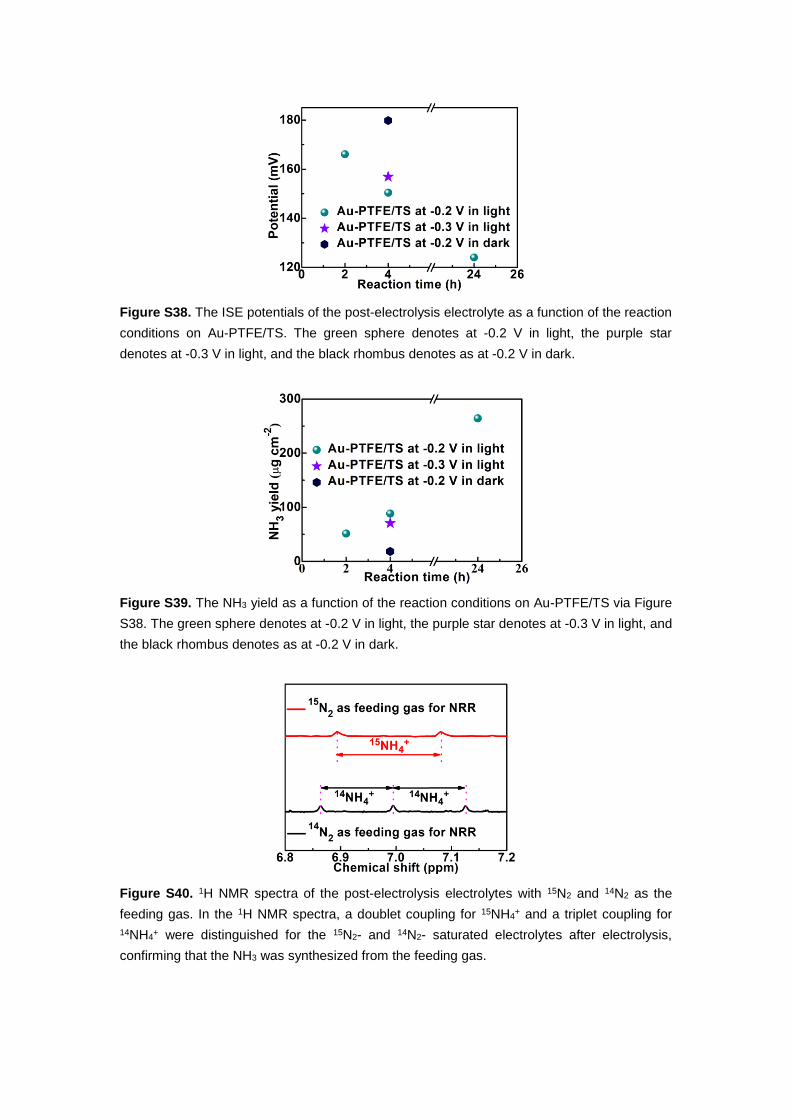
Figure S38. The ISE potentials of the post-electrolysis electrolyte as a function of the reaction
conditions on Au-PTFE/TS. The green sphere denotes at -0.2 V in light, the purple star
denotes at -0.3 V in light, and the black rhombus denotes as at -0.2 V in dark.
Figure S39. The NH3 yield as a function of the reaction conditions on Au-PTFE/TS via Figure
S38. The green sphere denotes at -0.2 V in light, the purple star denotes at -0.3 V in light, and
the black rhombus denotes as at -0.2 V in dark.
Figure S40. 1H NMR spectra of the post-electrolysis electrolytes with 15N2 and 14N2 as the
feeding gas. In the 1H NMR spectra, a doublet coupling for 15NH4+ and a triplet coupling for
14NH4+ were distinguished for the 15N2- and 14N2- saturated electrolytes after electrolysis,
confirming that the NH3 was synthesized from the feeding gas.
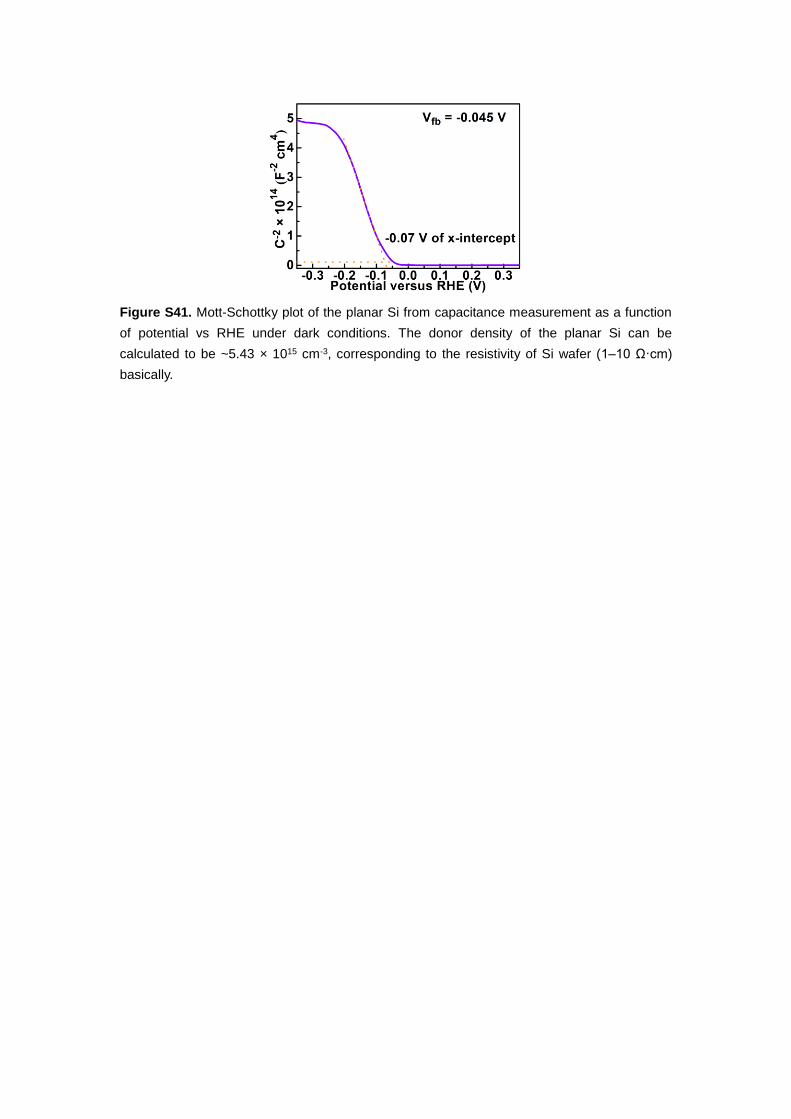
Figure S41. Mott-Schottky plot of the planar Si from capacitance measurement as a function
of potential vs RHE under dark conditions. The donor density of the planar Si can be
calculated to be ~5.43 × 1015 cm-3, corresponding to the resistivity of Si wafer (1‒10 Ω·cm)
basically.
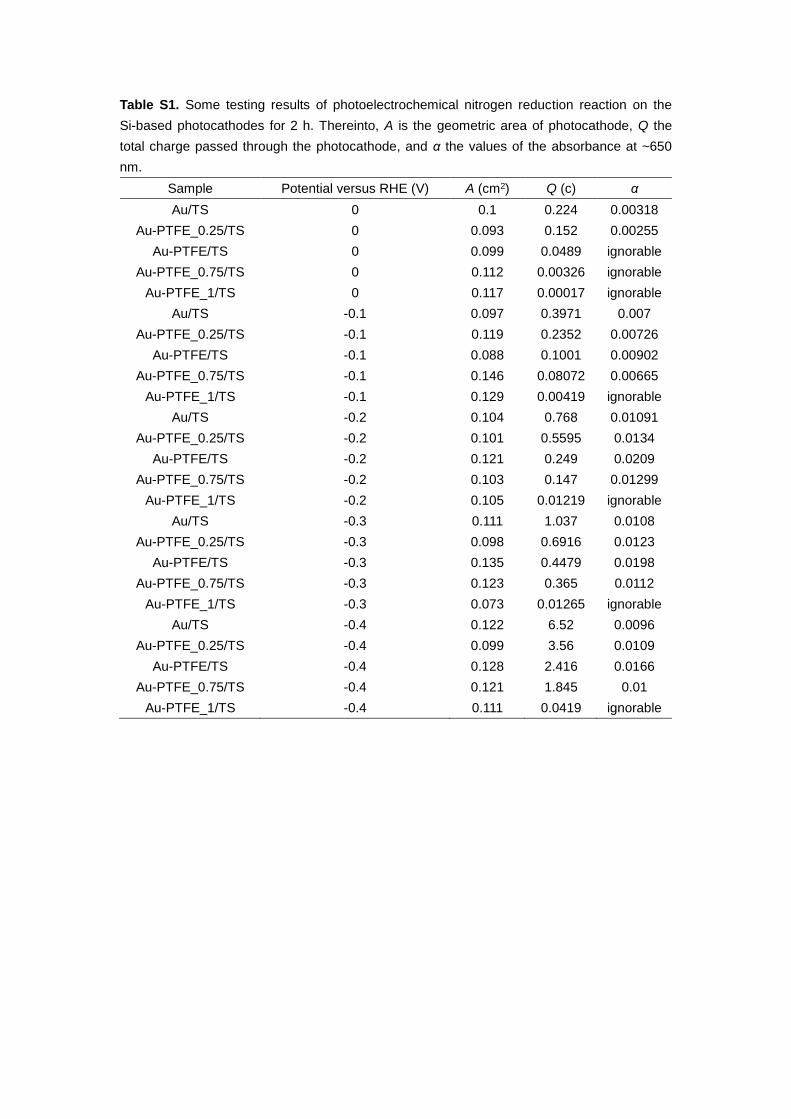
Table S1. Some testing results of photoelectrochemical nitrogen reduction reaction on the
Si-based photocathodes for 2 h. Thereinto, A is the geometric area of photocathode, Q the
total charge passed through the photocathode, and α the values of the absorbance at ~650
nm.
Sample Potential versus RHE (V) A (cm2) Q (c) α
Au/TS 0 0.1 0.224 0.00318
Au-PTFE_0.25/TS 0 0.093 0.152 0.00255
Au-PTFE/TS 0 0.099 0.0489 ignorable
Au-PTFE_0.75/TS 0 0.112 0.00326 ignorable
Au-PTFE_1/TS 0 0.117 0.00017 ignorable
Au/TS -0.1 0.097 0.3971 0.007
Au-PTFE_0.25/TS -0.1 0.119 0.2352 0.00726
Au-PTFE/TS -0.1 0.088 0.1001 0.00902
Au-PTFE_0.75/TS -0.1 0.146 0.08072 0.00665
Au-PTFE_1/TS -0.1 0.129 0.00419 ignorable
Au/TS -0.2 0.104 0.768 0.01091
Au-PTFE_0.25/TS -0.2 0.101 0.5595 0.0134
Au-PTFE/TS -0.2 0.121 0.249 0.0209
Au-PTFE_0.75/TS -0.2 0.103 0.147 0.01299
Au-PTFE_1/TS -0.2 0.105 0.01219 ignorable
Au/TS -0.3 0.111 1.037 0.0108
Au-PTFE_0.25/TS -0.3 0.098 0.6916 0.0123
Au-PTFE/TS -0.3 0.135 0.4479 0.0198
Au-PTFE_0.75/TS -0.3 0.123 0.365 0.0112
Au-PTFE_1/TS -0.3 0.073 0.01265 ignorable
Au/TS -0.4 0.122 6.52 0.0096
Au-PTFE_0.25/TS -0.4 0.099 3.56 0.0109
Au-PTFE/TS -0.4 0.128 2.416 0.0166
Au-PTFE_0.75/TS -0.4 0.121 1.845 0.01
Au-PTFE_1/TS -0.4 0.111 0.0419 ignorable
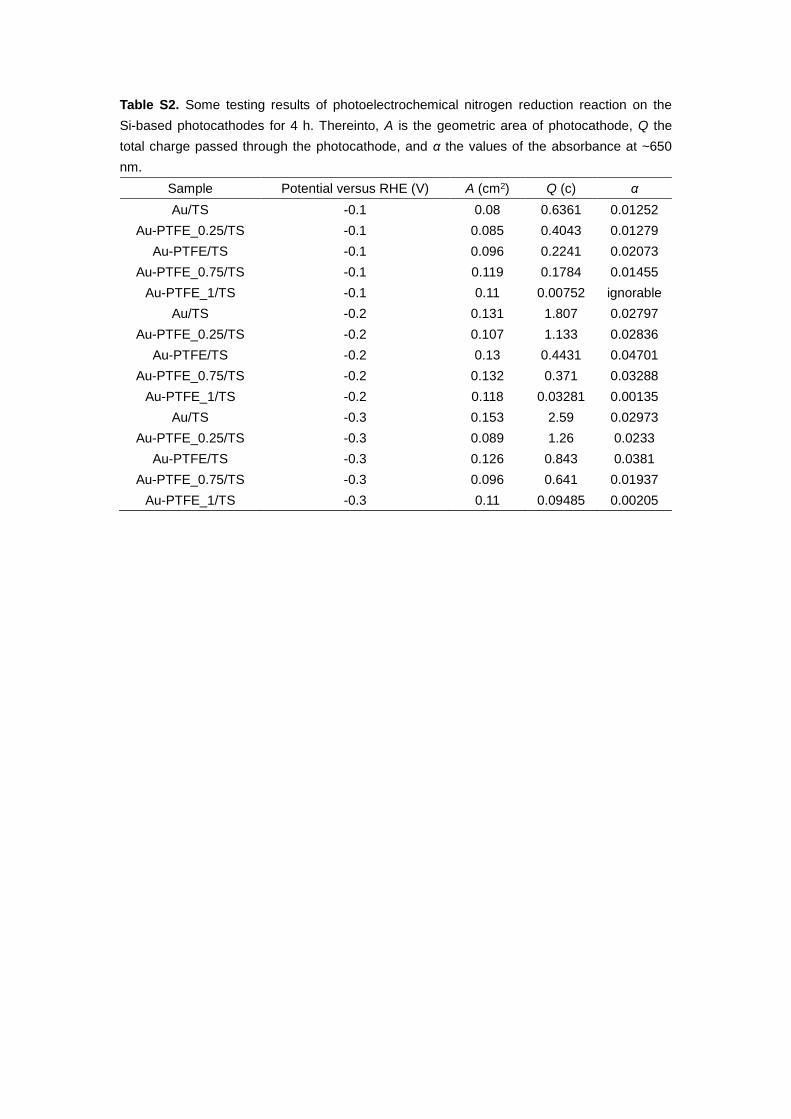
Table S2. Some testing results of photoelectrochemical nitrogen reduction reaction on the
Si-based photocathodes for 4 h. Thereinto, A is the geometric area of photocathode, Q the
total charge passed through the photocathode, and α the values of the absorbance at ~650
nm.
Sample Potential versus RHE (V) A (cm2) Q (c) α
Au/TS -0.1 0.08 0.6361 0.01252
Au-PTFE_0.25/TS -0.1 0.085 0.4043 0.01279
Au-PTFE/TS -0.1 0.096 0.2241 0.02073
Au-PTFE_0.75/TS -0.1 0.119 0.1784 0.01455
Au-PTFE_1/TS -0.1 0.11 0.00752 ignorable
Au/TS -0.2 0.131 1.807 0.02797
Au-PTFE_0.25/TS -0.2 0.107 1.133 0.02836
Au-PTFE/TS -0.2 0.13 0.4431 0.04701
Au-PTFE_0.75/TS -0.2 0.132 0.371 0.03288
Au-PTFE_1/TS -0.2 0.118 0.03281 0.00135
Au/TS -0.3 0.153 2.59 0.02973
Au-PTFE_0.25/TS -0.3 0.089 1.26 0.0233
Au-PTFE/TS -0.3 0.126 0.843 0.0381
Au-PTFE_0.75/TS -0.3 0.096 0.641 0.01937
Au-PTFE_1/TS -0.3 0.11 0.09485 0.00205
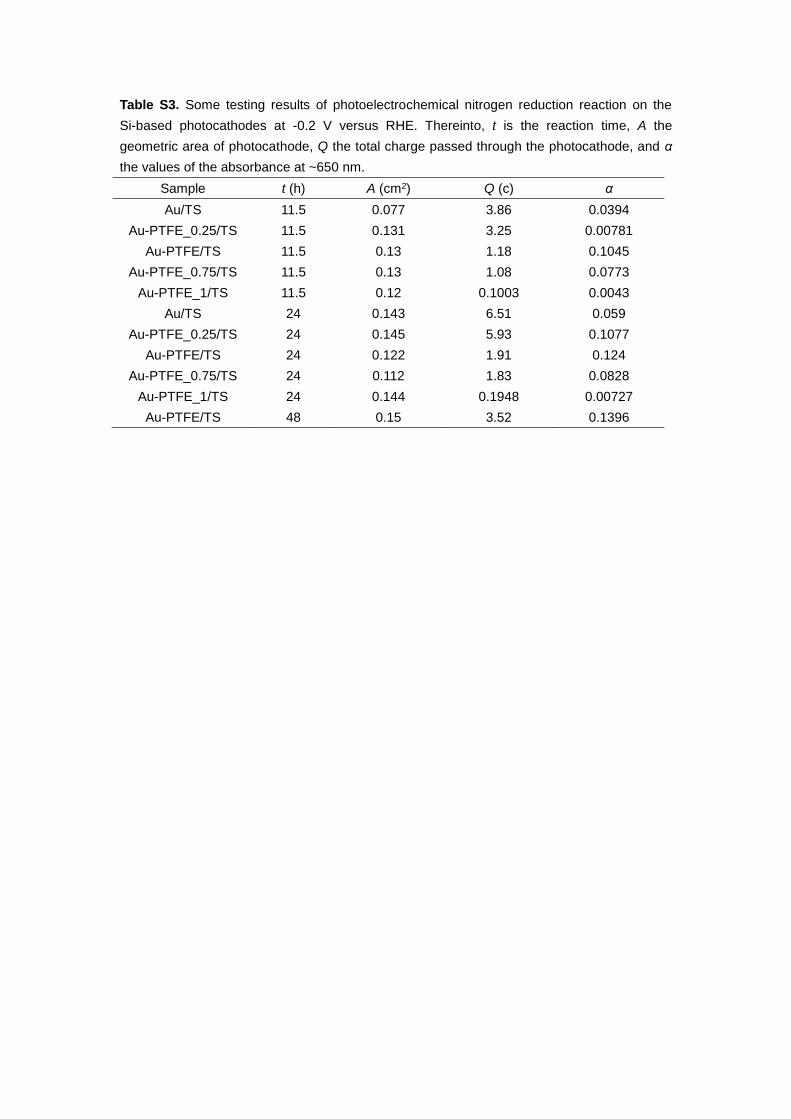
Table S3. Some testing results of photoelectrochemical nitrogen reduction reaction on the
Si-based photocathodes at -0.2 V versus RHE. Thereinto, t is the reaction time, A the
geometric area of photocathode, Q the total charge passed through the photocathode, and α
the values of the absorbance at ~650 nm.
Sample t (h) A (cm2) Q (c) α
Au/TS 11.5 0.077 3.86 0.0394
Au-PTFE_0.25/TS 11.5 0.131 3.25 0.00781
Au-PTFE/TS 11.5 0.13 1.18 0.1045
Au-PTFE_0.75/TS 11.5 0.13 1.08 0.0773
Au-PTFE_1/TS 11.5 0.12 0.1003 0.0043
Au/TS 24 0.143 6.51 0.059
Au-PTFE_0.25/TS 24 0.145 5.93 0.1077
Au-PTFE/TS 24 0.122 1.91 0.124
Au-PTFE_0.75/TS 24 0.112 1.83 0.0828
Au-PTFE_1/TS 24 0.144 0.1948 0.00727
Au-PTFE/TS 48 0.15 3.52 0.1396
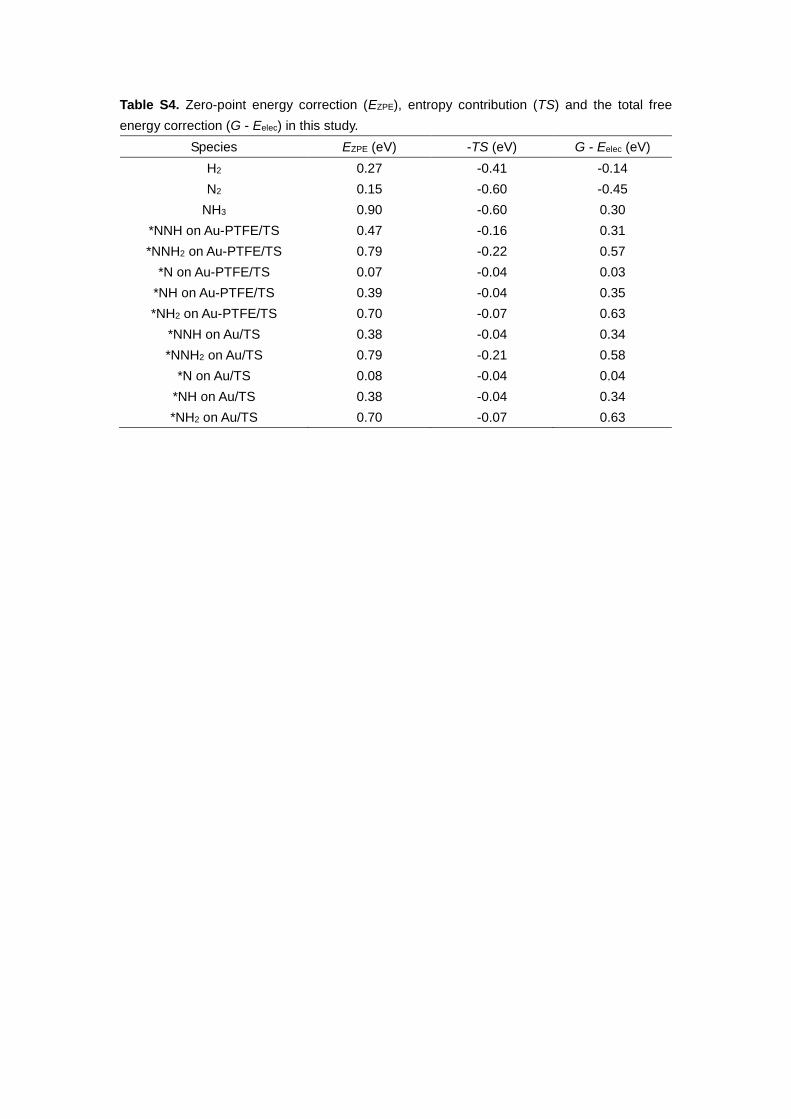
Table S4. Zero-point energy correction (EZPE), entropy contribution (TS) and the total free
energy correction (G - Eelec) in this study.
Species EZPE (eV) -TS (eV) G - Eelec (eV)
H2 0.27 -0.41 -0.14
N2 0.15 -0.60 -0.45
NH3 0.90 -0.60 0.30
*NNH on Au-PTFE/TS 0.47 -0.16 0.31
*NNH2 on Au-PTFE/TS 0.79 -0.22 0.57
*N on Au-PTFE/TS 0.07 -0.04 0.03
*NH on Au-PTFE/TS 0.39 -0.04 0.35
*NH2 on Au-PTFE/TS 0.70 -0.07 0.63
*NNH on Au/TS 0.38 -0.04 0.34
*NNH2 on Au/TS 0.79 -0.21 0.58
*N on Au/TS 0.08 -0.04 0.04
*NH on Au/TS 0.38 -0.04 0.34
*NH2 on Au/TS 0.70 -0.07 0.63
Related Documents