Photochemical Water Oxidation The Beneficial Interaction of SrTiO 3 Nanoparticles and TiO 2 Nanotubes Utilizing a Co 3 O 4 Spinel Catalyst 2011 Peter Lobaccaro University of Notre Dame Department of Chemical Engineering 5/2/2011

Welcome message from author
This document is posted to help you gain knowledge. Please leave a comment to let me know what you think about it! Share it to your friends and learn new things together.
Transcript

Photochemical Water
Oxidation The Beneficial Interaction of SrTiO3 Nanoparticles
and TiO2 Nanotubes Utilizing a Co3O4 Spinel
Catalyst
2011
Peter Lobaccaro
University of Notre Dame
Department of Chemical Engineering
5/2/2011

SPECIAL THANKS TO: Prof. Prashant Kamat
Ben Meekins
The Center for Undergraduate Scholarly Engagement
Notre Dame Center for Nano Science and Technology
Forgash Fellowship for Undergraduate
Research in Solar Energy
Prof. Paul McGinn
Ying Jin
Vidhya Chakrapani
Members of the Radiation Laboratory
1
1.0 ABSTRACT
Current energy infrastructure in the United States and around the world will not be
sufficient to meet growing future demand. The motivation for this research was to create better
components for a photochemical water oxidation device. The properties of titanium dioxide
(TiO2), strontium titantate(SrTiO3), and cobalt oxide (Co3O4) were explored in depth. It was
found that SrTiO3 could not be used to replace TiO2 as a substrate for quantum dot solar cells
due the higher rate of recombination in SrTiO3. However, a heterostructure of SrTiO3 and TiO2
created physical charge separation that led to increased photovoltaic properties. Using PLD as
the deposition technique for the SrTiO3, as opposed to the previously explored hydrothermal
process, onto a TiO2 nanotube substrate it was found that both the photocurrent and photovoltage
could be increased to a maximum at a SrTiO3 film thickness of 155nm.
A simple yet robust air brush technique was used to deposit Co3O4 dispersed in
conductive carbon paint on FTO to create an electrode for electrochemical testing of the
catalyst’s water oxidation activity. This method of deposition was capable of producing turn-
over frequencies (mol O2/mol Co/hr) similar to those produced by a three dimensional nickel
foam electrode with Co3O4 chemisorbed to the surface. This cathode also produced turn-over
frequencies of the same order as the in-solution photoactive Clark electrode Ru(II) bipyradine
assay which this electrode was meant to replace.
Ongoing and future work will be to combine this photoactive SrTiO3/TiO2 nanotube
heterostructure with the cobalt oxide water oxidation catalyst to produce a photochemical water
oxidation device. Two potential issues that have arisen are a back transfer of electrons from the

2
heterostructure to the Co3O4 hindering the activity of the overall system and the opacity of the
Co3O4 layer impeding front side illumination of the sample. One way to address the first issue is
to use a wide band gap semi conductor like ZnS which has been used to block back transfer of
electrons in quantum dot solar cells. The second issue could be addressed via backside
illumination of transparent electrodes such as FTO instead of titanium metal.

3
2.0 TABLE OF CONTENTS
1.0 ABSTRACT ............................................................................................................................ 0
2.0 TABLE OF CONTENTS ...................................................................................................... 3
3.0 INTRODUCTION ................................................................................................................. 5
3.1 WHY HYDROGEN? ................................................................................................................ 6
3.2 PHOTOCHEMICAL WATER SPLITTING .................................................................................. 7
3.3 TITANIUM DIOXIDE .............................................................................................................. 9
3.4 TITANIUM DIOXIDE SENSITIZING/COUPLING .................................................................... 11
3.5 WATER OXIDATION CATALYSTS ....................................................................................... 13
3.6 PULSE LASER DEPOSITION ................................................................................................. 15
4.0 THIN FILM TIO2/SRTIO3 AND QUANTUM DOTS ................................................... 17
4.1 EXPERIMENTAL ................................................................................................................... 17
Materials and Preparation ................................................................................................... 17
Characterization ................................................................................................................... 19
4.2 RESULTS/DISCUSSION ........................................................................................................ 20
Examination of Strontium Titanate ....................................................................................... 20
Effect of Thin Film Thickness: .............................................................................................. 22
4.3 CONCLUSION/FUTURE WORK ............................................................................................ 23
5.0 CATHODE FABRICATION FOR CO3O4 SPINEL ...................................................... 24
5.1 EXPERIMENTAL ................................................................................................................... 24
Spinel Synthesis ..................................................................................................................... 24
Nickel Foam Preparation ..................................................................................................... 25
Conductive Paint Preparation .............................................................................................. 25
Electrochemical Analysis ...................................................................................................... 25
5.2 RESULTS/DISCUSSION ........................................................................................................ 26
Synthetic Procedure Comparison ......................................................................................... 26
Nickel Foam Electrode ......................................................................................................... 27
Conductive Paint (Carbon) ................................................................................................... 29
Turn Over Frequency ............................................................................................................ 31
Note on Stability .................................................................................................................... 34
5.3 CONCLUSION/FUTURE WORK ............................................................................................ 35
6.0 EFFECTS OF PLD OF SRTIO3 ONTO TIO2 NANOTUBES ..................................... 36
6.1 EXPERIMENTAL ................................................................................................................... 36
Materials and Preparation ................................................................................................... 36

4
Characterization ................................................................................................................... 37
6.2 RESULTS/DISCUSSION ........................................................................................................ 38
SEM Analysis of Film Morphology ....................................................................................... 38
Effect of Post Deposition Annealing ..................................................................................... 39
Improved Photo Response ..................................................................................................... 40
6.3 CONCLUSION/FUTURE WORK ............................................................................................ 44
7.0 TIO2/SRTIO3/CO3O4 PHOTOCHEMICAL WATER OXIDATION ......................... 45
7.1 EXPERIMENTAL ................................................................................................................... 46
Spinel Synthesis ..................................................................................................................... 46
TiO2/SrTiO3 Nanotube Substrate .......................................................................................... 46
TiO2 nanoparticle substrate .................................................................................................. 46
Characterization ................................................................................................................... 47
7.2 RESULTS/DISCUSSION ........................................................................................................ 47
7.3 CONCLUSION/FUTURE WORK ............................................................................................ 53
8.0 CONCLUSION .................................................................................................................... 54
9.0 SUPPORTING INFORMATION ..................................................................................... 56
9.1 THIN FILM TIO2/SRTIO3 AND QUANTUM DOTS SI ........................................................... 56
9.2 THIN FILM TIO2/SRTIO3 AND QUANTUM DOTS SI ........................................................... 58
10.0 REFERENCES .................................................................................................................. 59

5
3.0 INTRODUCTION
Current energy infrastructure in the United States and around the world will not be
sufficient to meet growing future demand. Some predictions say that more than 10 terawatts
(TW) of new power will be needed over the next forty years to maintain current lifestyles.1 The
World Coal Institute has reported that if current rates of consumption are maintained, current
reasonably recoverable coal reserves will run out in 130 years, natural gas in 60 years, and oil in
42 years.2 The World Nuclear Association reports that at current consumption rates in
conventional reactors, only 80 years of reasonably recoverable world uranium remains.3 With
breeder technology this lifetime could potentially be extended to a couple hundred years. While
these numbers may indicate some security, none of them compensate for the continually
increasing demand for energy. In the long term picture, coal, natural gas, oil, and nuclear will all
be exhausted. This leaves us asking where we will turn to, to find energy?
The only long term solution is renewable sources of energy such as wind, hydrothermal,
and solar power. Of these options, solar represents the largest potential source of power with
1000 watts of power hitting each square meter of the Earth’s surface. That amounts to 82,000
TW total, with total world energy consumption reaching only 15 TW. Despite the vast amount
of power solar can provide, it is inherently diffuse, which makes it difficult to use in many
situations, particularly mobile applications such as vehicles. Finding a process to store solar
energy in a chemical fashion – a form of artificial photosynthesis – could solve all our energy
needs. In one such process, sunlight is absorbed and converted to an electrochemical potential,
which is then used to drive the splitting reaction of water to oxygen and hydrogen. Hydrogen is
6
an energy carrier which could be used to replace fossil fuels in mobile applications where direct
solar isn’t feasible.
The reasons why hydrogen provides one of the most promising replacements to fossil
fuels will be detailed below. In order to improve the photochemical water oxidation system
described above, improvements in both solar cell technology and water splitting catalysts must
be achieved. Over the past two years the effects of strontium titanate (SrTiO3) on titanium
dioxide, as a light absorbing semi-conductor metal, have been explored. The nanoparticulate
cobalt oxide spinel (Co3O4) has also been examined for its activity as a novel water oxidation
catalyst. Together these two arms of research have been utilized to attempt to create a water
splitting system powered by light.
3.1 WHY HYDROGEN?
Most types of renewable energy are too diffuse (i.e. their energy densities are too low) to
be useful in many applications. Wind farms, solar towers, and nuclear plants are all suitable
replacements for coal-fired and natural gas power plants. However, to power a 150 horsepower
car off of sunlight alone would require a little over 110 m2 of land at a solar energy conversion
rate of 100%. In comparison, the top surface area of a Toyota Prius is a little under 8 m2.4 The
inherent intermittency of solar and wind power also makes them ill-suited for mobile
applications. While nuclear power isn’t intermittent, it is unlikely that mini reactors are going to
power the cars of the future. Thus, a method for storing the energy produced by these renewable
sources is a necessity and several options are available: biofuels, batteries, and hydrogen.
7
Hydrogen is the best of these options because it is a renewable energy carrier. Biofuels,
such as corn ethanol, require valuable farming land that is needed to produce food. Batteries are
materials and processing intensive, requiring metals for cathodes, an electrolyte, and housing.
They also suffer from short lifetimes (new electric vehicle battery packs are only guaranteed for
8-10 years) and low energy densities. Li-ion batteries, for example, have a volumetric energy
density of 0.36 MJ/L, as opposed to the 10 MJ/L for liquefied hydrogen.5 Batteries also require
long recharging periods while hydrogen can be refueled in an automobile like gasoline.
Hydrogen can be produced from the limitless supply of water using solar power via electrolysis
or photolysis. It can then be burned in modified internal combustion engines, rather than in
expensive fuel cells.
3.2 PHOTOCHEMICAL WATER SPLITTING
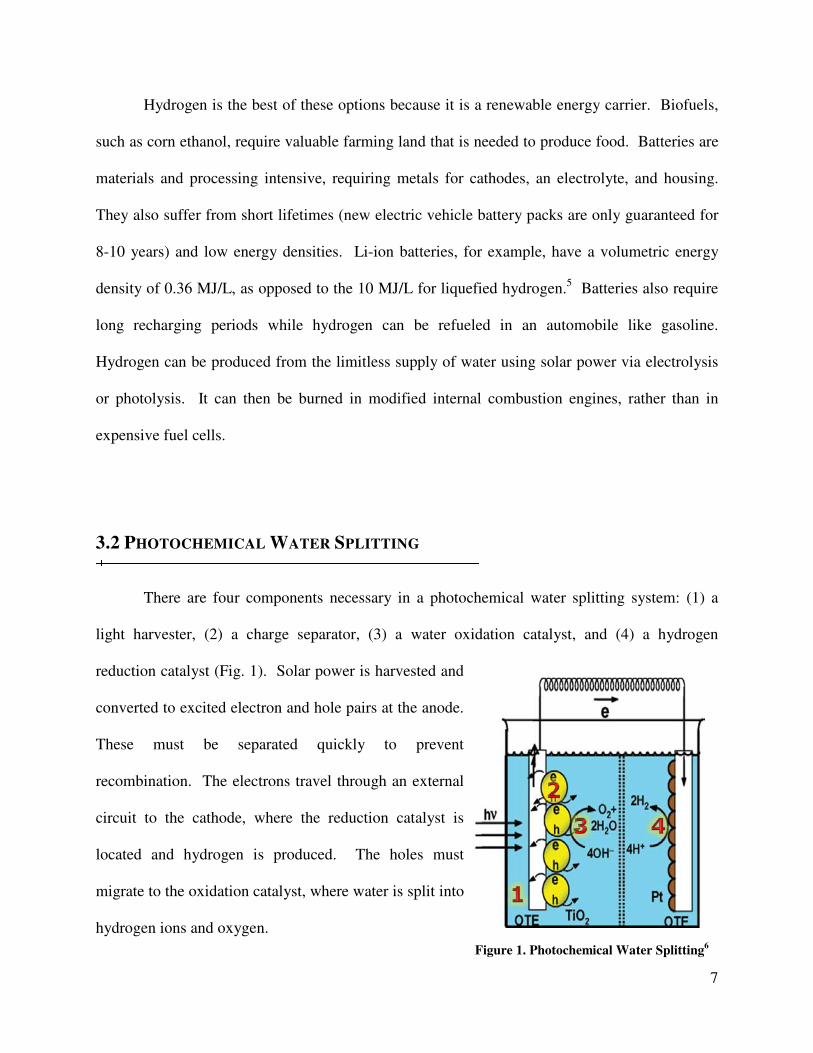
There are four components necessary in a photochemical water splitting system: (1) a
light harvester, (2) a charge separator, (3) a water oxidation catalyst, and (4) a hydrogen
reduction catalyst (Fig. 1). Solar power is harvested and
converted to excited electron and hole pairs at the anode.
These must be separated quickly to prevent
recombination. The electrons travel through an external
circuit to the cathode, where the reduction catalyst is
located and hydrogen is produced. The holes must
migrate to the oxidation catalyst, where water is split into
hydrogen ions and oxygen.
Figure 1. Photochemical Water Splitting6
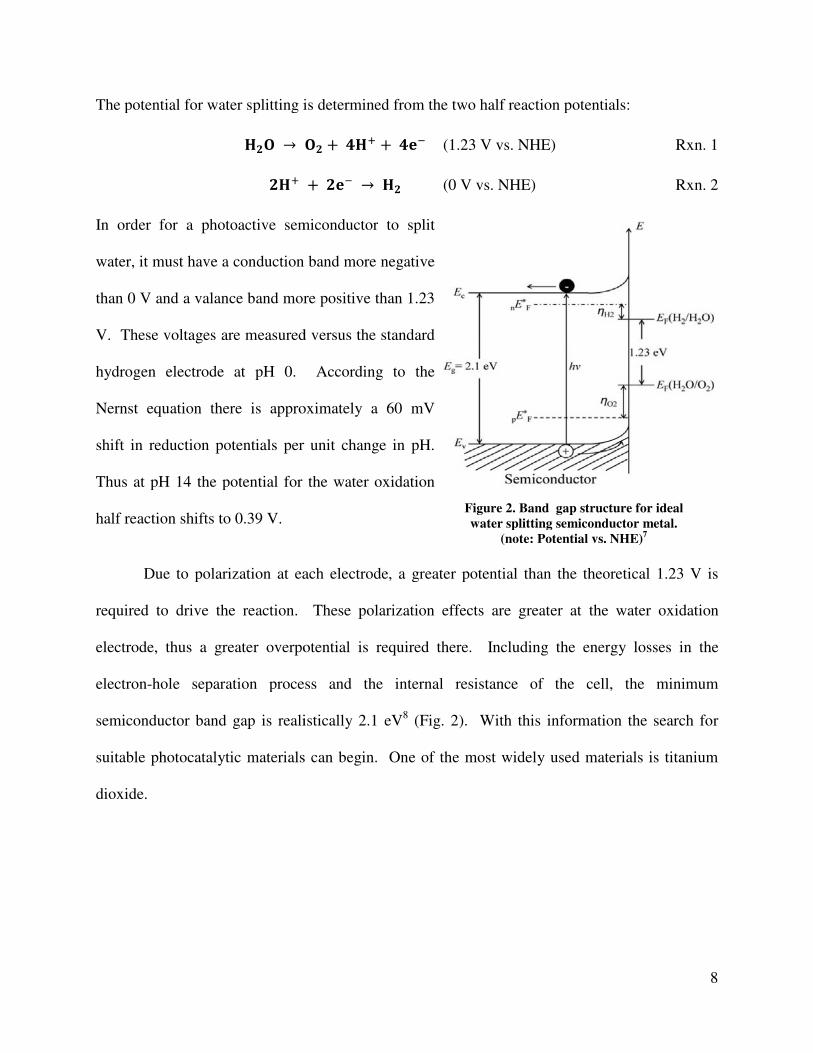
The potential for water splitting is determined from the two half reaction potentials:
��� →
���
In order for a photoactive semiconductor
water, it must have a conduction band more negative
than 0 V and a valance band more positive than
V. These voltages are measured versus the standard
hydrogen electrode at pH 0. According to the
Nernst equation there is approximately a 60 mV
shift in reduction potentials per
Thus at pH 14 the potential for the
half reaction shifts to 0.39 V.
Due to polarization at each electrode
required to drive the reaction. These polarization effects are greater at the water oxidation
electrode, thus a greater overpotential is required there. Including the energy losses in the
electron-hole separation process and the internal resistance
semiconductor band gap is realistically 2.1 eV
suitable photocatalytic materials can begin. One of the most widely used materials
dioxide.
The potential for water splitting is determined from the two half reaction potentials:
�� � ��� � � (1.23 V vs. NHE)
� � → �� (0 V vs. NHE)
semiconductor to split
ction band more negative
V and a valance band more positive than 1.23
These voltages are measured versus the standard
hydrogen electrode at pH 0. According to the
Nernst equation there is approximately a 60 mV
shift in reduction potentials per unit change in pH.
Thus at pH 14 the potential for the water oxidation
Due to polarization at each electrode, a greater potential than the theoretical 1.23
required to drive the reaction. These polarization effects are greater at the water oxidation
electrode, thus a greater overpotential is required there. Including the energy losses in the
hole separation process and the internal resistance of the cell,
semiconductor band gap is realistically 2.1 eV8 (Fig. 2). With this information the search for
suitable photocatalytic materials can begin. One of the most widely used materials
Figure 2. Band gap structure for ideal
water splitting semiconductor metal
(note: Potential vs. NHE)
8
The potential for water splitting is determined from the two half reaction potentials:
Rxn. 1
Rxn. 2
a greater potential than the theoretical 1.23 V is
required to drive the reaction. These polarization effects are greater at the water oxidation
electrode, thus a greater overpotential is required there. Including the energy losses in the
the cell, the minimum
(Fig. 2). With this information the search for
suitable photocatalytic materials can begin. One of the most widely used materials is titanium
gap structure for ideal
water splitting semiconductor metal.
(note: Potential vs. NHE)7

9
3.3 TITANIUM DIOXIDE
The photocatalytic activity of titanium dioxide (TiO2) has been known since the early 20th
century with papers dating back to 1938.9 The ability of TiO2 to photo-oxidize water was first
reported in 1972 using UV-light and a platinum electrode.10
It was found that when light of
wavelengths less than 415nm (~3.0 eV) irradiated the TiO2 electrode, water oxidation occurred.
The reduction reaction, or hydrogen evolution reaction, occurred at the platinum electrode. The
overall reaction proceeds as follows:11
���� � � → � �� Rxn. 3
��� � ��� → �� � ��
� Rxn. 4
��� � � → �� Rxn. 5
Where h+ represents positive “holes” left by excited electrons. Reactions 3 and 4 occur at the
TiO2 electrode while Reaction 5 occurs at the platinum electrode.
Due to the high recombination of the generated electron/hole pairs in TiO2, it is difficult
to produce hydrogen from distilled water.12
Fujishima and Honda originally reported a quantum
efficiency of only 0.1 percent.13
It has been discovered, however, that certain physical
characteristics of TiO2 increase its photocatalytic activity. The anatase phase of TiO2 has been
found to be more photoactive than the rutile phase. The main reason for this is the reduced rated
of recombination in comparison to rutile due to the 10-fold greater rate of hole trapping in the
anatase phase.14
The anatase phase also has a larger band gap than the rutile phase (EBG = 3.2 eV
versus EBG = 3.0 eV) as well as the more negative position of the anatase’s conduction band
edge.15
It has also been found that the charge transfer through oriented TiO2 nanotube

10
frameworks, as opposed to TiO2
nanoparticle assemblies, is faster.16
Thus nanotubes can be used as a basis to
build more efficient photochemical
water splitting systems.
TiO2 is able to oxidize water
because of the position of its band gap
around the chemical potential of the reaction. However, because the band gap is so large it can
only absorb light in the ultraviolent region. This is problematic because a very limited amount of
the sun’s solar energy reaching the surface of the Earth is in this region (Fig. 317
). A significant
portion of the solar energy hitting the Earth is in the visible spectrum. The potential for water
splitting is low enough that photons in the visible region have enough energy to drive the
reaction, even with the necessary overpotentials (Fig. 4). In order to extend the absorption of
TiO2 into the visible region many different approaches have been attempted, but can be broken
into two main catagories: doping and sensitizing /coupling. Sensitizing/coupling was the main
focus of the research done in the past two years, and some of the approaches already investigated
will be elucidated below. An
additional benefit of this method is
that it decreases the amount of
recombination in TiO2 via physical
charge separation.
Figure 3. Solar radiation spectrum
Figure 4. Energy of Incident Photons

11
3.4 TITANIUM DIOXIDE SENSITIZING/COUPLING
Sensitizing refers to the attachment of a narrow band gap material that extends the
absorption range of composite material. Coupling is the attachment of another semi-conductor to
the surface of TiO2 to increase charge separation, thereby reducing recombination, and
increasing efficiency. In some cases the addition can satisfy both of these components such as
with quantum dots. This enhancement occurs because of the positions of the conduction and
valance bands of TiO2 and the sensitizing material. The conduction band of the sensitizing
material must be at a more negative potential than the conduction band of TiO2. The photons are
absorbed by the sensitizer, producing electron/hole pairs. The electrons will fall down to the less
negative potential of the TiO2 conduction band, while the holes will stay in the valence band of
the sensitizer. This physical separation of electron and hole is what reduces the amount of
recombination (Fig. 5). The decreased band gap of the sensitizing material is what allows for
absorption of visible light.
Since the breakthrough in efficiency was demonstrated by O’Regan and Gratzel in 1991,
there has been a major push to utilize dyes as
sensitizer in solar cells.18
Interest in ruthenium(II)
complex dyes has existed since the early 80’s19
and
utilization of Ru(byp)32+
has continued since
then20
. However these ruthenium and other
transition-metal dyes are fairly expensive and
metal-free dyes, such as porphine and melocyanine
dyes, have been sought after to replace them. Of Figure 5. Graphical representation of
TiO2 and SrTiO3 band gaps with flow
of electrons and holes

12
particular note is Eosin Y, which as a sensitizer to various titanium dioxide substrates has
produced quantum yields higher than 10% at 420 nm.21
The instability and generally high cost
of this method of sensitization has led to exploration of other possible sensitizers.
Quantum dots are a group of semiconductor nanoparticles that have tunable band gaps.
These materials have proven to be viable alternatives to dyes for harvesting visible light. In
particular, cadmium sulfide (CdS) and cadmium selenide (CdSe) have been shown to be capable
of injecting electrons into TiO222,23
. The advantage of quantum dots is that their band gap can be
selected by controlling the growth time in wet synthesis24
or by controlling the number of dips in
the SILAR method25
. One can then imagine a cell, decorated with quantum dots of all different
sizes, that absorbs efficiently all across the visible spectrum. While this goal has not yet been
reached, work here has shown it is possible to lay down a monolayer of single-size quantum
dots, via a linker molecule, to increase the absorption of a thin film of TiO2 nanoparticles.
Other semiconductor metals, such as strontium titanate (SrTiO3), have been coupled to
TiO2. SrTiO3 has been shown to be an effective electrode in water splitting application by
itself.26
However this research has shown that much higher recombination occurs in SrTiO3 than
in TiO2, thus making it more suited as a coupling material. SrTiO3 can only provide a process
for electron-hole separation as it absorbs light in the same region as TiO2. The conduction band
and valance band of SrTiO3 are 200 mV more negative than the corresponding TiO2 bands, thus
allowing for the separation described in Figure 5. Our group has demonstrated previously that a
SrTiO3-TiO2 nanotube array composite prepared by a hydrothermal method has better
photovoltaic properties than TiO2 nanotube arrays alone.27
The hydrothermal reaction proceeds
with a strontium precursor reacting with the TiO2 to form SrTiO3. As the reaction time was

13
increased, the photovoltage increased due to the higher conduction band of the SrTiO3, but the
photocurrent decreased significantly due to the consumption of the underlying TiO2 nanotube
substrate. The replacement of TiO2 in the nanotubes was undesirable and a focus of this research
was the use of an alternate technique, pulse laser deposition, to deposit SrTiO3 onto TiO2.
Despite the improved photovoltaic properties sensitized/coupled TiO2 has, a co-catalyst to
facilitate the water splitting reaction is often used.
3.5 WATER OXIDATION CATALYSTS
The low activity of TiO2 for water oxidation (WO) necessitates the addition of co-
catalysts to increase the reaction kinetics. In some cases the sensitizing agents mentioned in the
previous section, which increase the efficiency with which the TiO2/sensitizer heterostructure
absorbs light, also increase the heterostructures overall activity for WO. For instance, many
ruthenium-based compounds have been found to also be active for WO28,29
. A common metal
oxide used for WO is iridium oxide (IrO2) which is also highly active. In 2007 colloidal IrO2
was self adsorbed onto a conductive indium tin oxide (ITO) substrate. Measurements taken in
0.1 M KNO3 found that IrO2 had a turn-over-frequency (TOF) of 2.3-2.5 * 104 mol O2/mol
IrO2/hr which is 16-fold higher than the TOF for a Ru-red/Pt-black system under the same
conditions.30
Due to the high cost of iridium and ruthenium, other common-earth metals have
been sought out for WO activity.
Nature can often serve as a strong model for scientific endeavor because years of
evolution have already perfected methods we as scientists want to utilize. In nature an inorganic
catalyst composed of calcium and manganese(IV) acts as the center for energy conversion in the
photosystem II process.31
The prevalence of this catalyst in nature makes it an obvious target for

14
reproduction as a catalyst to be
used in man-driven
electrolysis of water. This
catalyst’s structure forms a
distorted cube, which was
successfully mimicked in the
Mn-oxo cubane ([Mn4O4L6]+ where L = (MeOPh)2PO2) and shown to be active for water
oxidation. With this precedent, further development of cubic like catalysts led to the naturally
common spinel structure. The cobalt oxide spinel (Co3O4) was used as a cathode material for
lithium ion batteries32
. However, it was also found to be active for water oxidation and there has
since been research into mixed spinels to find higher activities.33
The low cost and simplicity to
synthesize Co3O4 are favorable attributes.
In order to create a photochemical water oxidation system utilizing the Mn-oxo cubane, it
was doped into a Nafion membrane. This membrane was layered on top of transparent
fluorinated tin oxide glass covered with a TiO2 nanoparticle film sensitized with Ru(byp)32+
(Fig.
6). The average TOF for this system was found to be 47 ±10 mol O2/cubane/hr which is 10
times the baseline TiO2 result.35
This Nafion system is a poorly understood system and is not
very efficient due to the dependence on diffusion within the Nafion membrane.
Currently the Co3O4 spinel and many other catalysts like it are tested for catalytic activity
in solution.36,37
In this system a light absorbing dye creates the electron/hole pairs to drive
photolysis, with persulfate acting as a terminal electron acceptor. This is an impractical system
however because real world applications require the formation of a complete circuit. This
Figure 6. Photochemical system for Mn-oxo cubane34

15
system is also limited by diffusion of the spinel to the dye surface, thus placing a limit on the
maximum measurable turn-over frequency. For both of these reasons it is desirable to create an
electrode which has intimate chemical contact with the desired catalyst. The electrode will
eliminate the electron diffusion limit placed on the in-solution system by facilitating electron
transport away from the spinel through an external circuit. The electrode system for testing the
activity of Co3O4 was also a project in this research.
3.6 PULSE LASER DEPOSITION
Pulse laser deposition (PLD) was chosen as the technique to deposit SrTiO3 onto the TiO2
nanotubes because it is not destructive to the substrate. PLD is used primarily in the fabrication
of thin films. A high energy—on the order of J/cm2—laser pulse repeatedly strikes the target
disk and vaporizes it upon impact. This plume then rises through a high-vacuum (10-3
to 10-6
torr) chamber to the sample suspended above the target and deposits on the substrate (Fig. 7).
The target materials are often metals38
or metal oxides,39,40
which can also be doped41,42
with
other materials. Depending
on the gas used to maintain
the back pressure in the
reaction chamber, it is
possible to generate new
materials by reaction with
the gas during the
deposition of the target
material, such as TiN43
. By
Figure 7. Graphical Representation of PLD Apparatus

creating the SrTiO3-TiO2 surface interaction without consuming
photovoltage and photocurrent of the cell were
PLD can be used to deposit gradient films, where the thickness of the thin film deposited
is greatest at the bottom and decreases to near zero at the top. It can also be used to lay down
uniform thickness films, by rotating the sample stage during the dep
used to create heterogeneous mixtures by laying down alternating layers of two metal oxides,
like TiO2 and SrTiO3 for example.
shown in Figure 8, which will then uniformly mix vertically but not horizontally after annealing.
The result is a thin film which varies in mixture from 100% TiO
can be used to test libraries of combinatorial heterogeneous
Figure 8. Representation of TiO
surface interaction without consuming the TiO2 nanotubes
photovoltage and photocurrent of the cell were observed to increase.
PLD can be used to deposit gradient films, where the thickness of the thin film deposited
is greatest at the bottom and decreases to near zero at the top. It can also be used to lay down
uniform thickness films, by rotating the sample stage during the deposition. Finally it can be
used to create heterogeneous mixtures by laying down alternating layers of two metal oxides,
for example. PLD can deposit alternating gradient films
shown in Figure 8, which will then uniformly mix vertically but not horizontally after annealing.
which varies in mixture from 100% TiO2 to 100% SrTiO
can be used to test libraries of combinatorial heterogeneous thin films in an efficient manner.
Representation of TiO2 - SrTiO3 gradient heterostructure assembly
16
nanotubes both the
PLD can be used to deposit gradient films, where the thickness of the thin film deposited
is greatest at the bottom and decreases to near zero at the top. It can also be used to lay down
osition. Finally it can be
used to create heterogeneous mixtures by laying down alternating layers of two metal oxides,
alternating gradient films of 5 microns as
shown in Figure 8, which will then uniformly mix vertically but not horizontally after annealing.
to 100% SrTiO3. This method
thin films in an efficient manner.
gradient heterostructure assembly

17
4.0 THIN FILM TIO2/SrTIO3 AND QUANTUM DOTS
In this initial project the goal was three-fold: 1.) Become familiar with standard practices
with titanium dioxide nanoparticle thin film solar cells sensitized with quantum dots. 2.)
Examine the efficacy of strontium titanate as an electron transport layer in place of TiO2. 3.)
Explore the effects thin film thickness of the TiO2 layer has on the electron injection and
transport properties of the quantum dot (QD) solar cell. It was theorized that due to the more
negative band gap of SrTiO3, it should provide a solar cell with increased photovoltage as
compared to the TiO2 cell. The thickness of the electron transport layer also plays an important
part in the efficiency of the solar cell. If it is too thick, it will hinder electron transport and
recombination will result. If it is too thin, too little light will be absorbed by the layer decreasing
the total amount of possible current that could flow.
4.1 EXPERIMENTAL
Materials and Preparation: Quantum dots were synthesized via the hot injection method.44
The CdSe precursors utilized were cadmium oxide (CdO, Alfa, 99.998%), tetradecylphosphonic
acid (TDPA, PCI Synthesis), trioctylphosphine oxide (TOPO, Acros, 99%), selenium (Se,
Aldrich, 99.5+%), trioctylphosphine (TOP, Aldrich, 90%), and dodecylamine (DDA, Alfa,
98+%) – all used as supplied. 2 grams of TOPO were added to 0.3 grams of TDPA and 0.05
grams of CdO in a 150 mL round bottom flask. Depending on the size of dots desired 0.05 to 1
gram of DDA was also added; 0.5 grams were used here to synthesize medium size dots. DDA
is added to slow down the reaction and better control the size of the dots. The entire procedure
was conducted under nitrogen until the synthesis was complete. The round bottom is then heated

to 300oC at which point a mixture of 0.25 mL 1M TOPSe (Se dissolved in TOP) and 4 mL TOP
is added via syringe into the round bottom. The reaction is then monitored until the desired color
is reached and heat is removed. Once the liquid has cooled to 100
to completely quench the reaction. The resulting solution of dots is cleaned via centrifugation
and washing with toluene several times. The final clean dots are re
capped in a nitrogen purged vial.
A TiO2 nanoparticle paste obtained from DyeSol
(FTO) were used to create the doctor bladed TiO
mask out the FTO slide, the thin film thickness was
annealed at 450oC for one and a half hours before use.
Mercaptopropionic acid (MPA, 99+% purity) was
obtained from Aldrich to act as the linker between the
TiO2 nanoparticles and the QD. A 0.1 M solution was
used to sensitize the slides overnight before the slides were
solution overnight again (Fig. 9).
Due to the unavailability of SrTiO
TiO2 nanoparticle thin films, another type of cell had to be used. Gradient thin films of TiO
SrTiO3 were deposited via PLD in Prof. Paul McGinn’s lab onto FTO and were used for the
desired comparison. These films
thin films were amorphous. They were then sensitized in the same fash
cells. These gradient thin films were also used to explore the effect of thin film thickness.
C at which point a mixture of 0.25 mL 1M TOPSe (Se dissolved in TOP) and 4 mL TOP
is added via syringe into the round bottom. The reaction is then monitored until the desired color
and heat is removed. Once the liquid has cooled to 100oC, 10 mL of toluene is added
to completely quench the reaction. The resulting solution of dots is cleaned via centrifugation
and washing with toluene several times. The final clean dots are re-suspended in toluene and
capped in a nitrogen purged vial.
nanoparticle paste obtained from DyeSol and fluorine doped tin oxide glass
(FTO) were used to create the doctor bladed TiO2 nanoparticle solar cells. Using scotch tape to
mask out the FTO slide, the thin film thickness was approximately 5 microns. These slides were
C for one and a half hours before use.
Mercaptopropionic acid (MPA, 99+% purity) was
to act as the linker between the
nanoparticles and the QD. A 0.1 M solution was
used to sensitize the slides overnight before the slides were washed and placed in a diluted QD
.
Due to the unavailability of SrTiO3 nanoparticles to make a direct comparison to the
nanoparticle thin films, another type of cell had to be used. Gradient thin films of TiO
were deposited via PLD in Prof. Paul McGinn’s lab onto FTO and were used for the
desired comparison. These films were annealed at 450oC for three hours because the as received
They were then sensitized in the same fashion as the doctor bladed
These gradient thin films were also used to explore the effect of thin film thickness.
Figure 9. TiO2 thin film sensitized
with quantum dots
18
C at which point a mixture of 0.25 mL 1M TOPSe (Se dissolved in TOP) and 4 mL TOP
is added via syringe into the round bottom. The reaction is then monitored until the desired color
C, 10 mL of toluene is added
to completely quench the reaction. The resulting solution of dots is cleaned via centrifugation
ended in toluene and
and fluorine doped tin oxide glass
Using scotch tape to
microns. These slides were
washed and placed in a diluted QD
nanoparticles to make a direct comparison to the
nanoparticle thin films, another type of cell had to be used. Gradient thin films of TiO2 and
were deposited via PLD in Prof. Paul McGinn’s lab onto FTO and were used for the
C for three hours because the as received
ion as the doctor bladed
These gradient thin films were also used to explore the effect of thin film thickness.
thin film sensitized
with quantum dots
19
Characterization: Chronoamperometric, open circuit potential, and current-voltage (IV)
measurements were taken using a Princeton Applied Research PARstat 2273 potentiostat in a 2-
electrode cell with a platinum mesh counter electrode, using 1 M sodium sulfide as the
electrolyte. The cell was irradiated with a 300 W xenon lamp using a CuSO4/water filter to
mimic natural sunlight. The incident power of the light was maintained at 100 mW/cm2.
In order to measure the effects of thickness across the gradient thin films, two new
instrumentation set ups had to be devised. These set ups were also created with the
combinatorial heterogeneous thin films in mind. Using the Ocean Optics 2000 UV-Vis
instrument, a cuvette on a movable platform was used to slide the test cell up and down to get
incremental measurements of absorption over the length of the cell. The instrument used a 1 mm
diameter light spot to take its measurements, which insured only the desired position on the plate
was being tested (see picture in supplemental information 9.1.1). In order to take the
photochemical measurements at differential positions on the plate, a fiber optic cable was used to
focus the light source down to a single 2 mm diameter point (see picture in supplemental
information 9.1.2). The incident light power measured from this optical cable was found to be
1.5 mW.

20
4.2 RESULTS/DISCUSSION
Examination of Strontium Titanate: The size of the dots was determined via UV-vis
spectroscopy (Fig. 10). The max absorption was found to be at 540 nm which corresponds to
dots of 3.68 nm diameter. Using
Beer’s Law (Eq. 1), the
concentration of the dots solution
was found to be 8.45*10-6
M. Three
doctor bladed TiO2 nanoparticle
cells were made to provide
baselines for comparison to the PLD
technique, which had never been
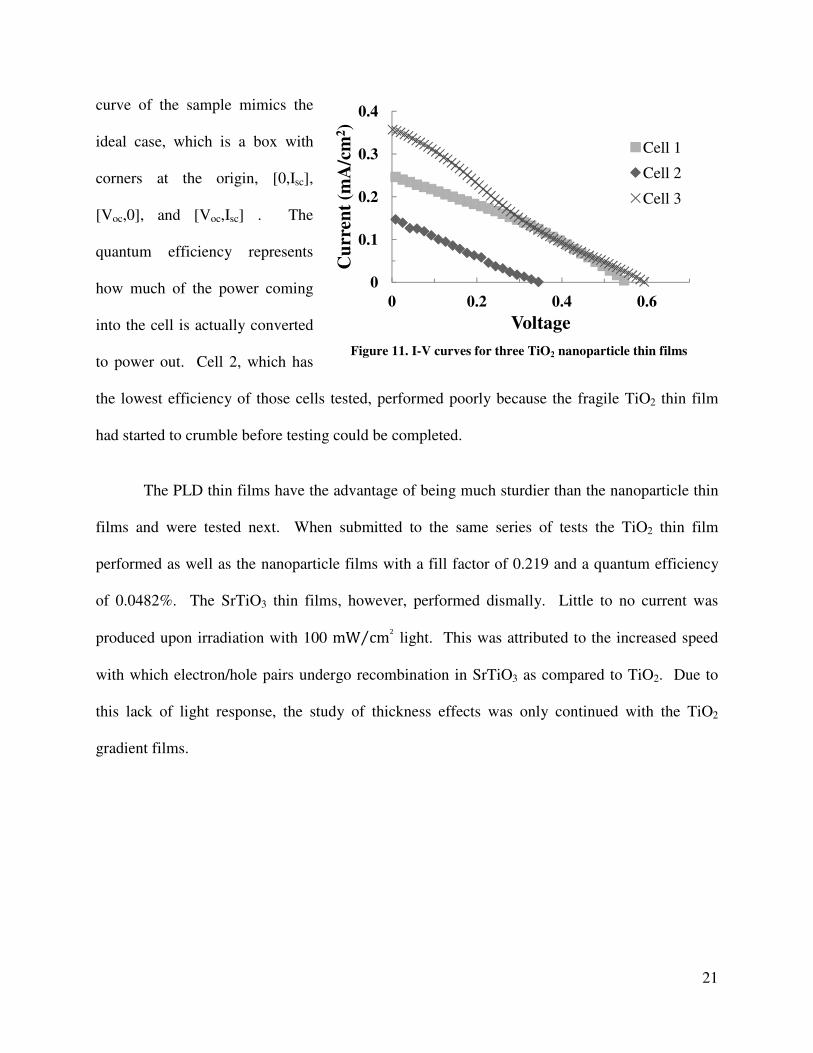
used for this purpose before. The fill factor (FF) and quantum efficiency (η) were calculated
from the IV curves (Fig. 11) utilizing the equations 2 and 3, and are tabulated in Table 1:
� = � ∗ � ∗ � Eq. 1
�� = ��������� ∗ ������������ ∗ � �
Eq. 2
! = ��� ∗ � �"#$�#%�$& '#( &
∗ �� ∗ )** Eq. 3
Note that Vmaxpower and Imaxpower come from the point on the IV curve
where the cell is outputting the most power. Voc is the point on the
IV curve where the current flow is zero and the Isc is the point where
the voltage is zero. The fill factor represents how closely the IV
Figure 10. UV Vis Absorption curve for synthesized QD
Table 1. Properties of TiO2
nanoparticle thin films
FF η
Cell 1 .321 .0436
Cell 2 .237 .0125
Cell 3 .221 .0471
0
1
2
3
500 600 700 800
Ab
s
Wavelength (nm)
21
curve of the sample mimics the
ideal case, which is a box with
corners at the origin, [0,Isc],
[Voc,0], and [Voc,Isc] . The
quantum efficiency represents
how much of the power coming
into the cell is actually converted
to power out. Cell 2, which has
the lowest efficiency of those cells tested, performed poorly because the fragile TiO2 thin film
had started to crumble before testing could be completed.
The PLD thin films have the advantage of being much sturdier than the nanoparticle thin
films and were tested next. When submitted to the same series of tests the TiO2 thin film
performed as well as the nanoparticle films with a fill factor of 0.219 and a quantum efficiency
of 0.0482%. The SrTiO3 thin films, however, performed dismally. Little to no current was
produced upon irradiation with 100 mW cm2
⁄ light. This was attributed to the increased speed
with which electron/hole pairs undergo recombination in SrTiO3 as compared to TiO2. Due to
this lack of light response, the study of thickness effects was only continued with the TiO2
gradient films.
Figure 11. I-V curves for three TiO2 nanoparticle thin films
0
0.1
0.2
0.3
0.4
0 0.2 0.4 0.6
Cu
rren
t (m
A/c
m2)
Voltage
Cell 1
Cell 2
Cell 3

Effect of Thin Film Thickness
metal oxide deposit across the surface of the FTO slide.
approximately linear. The thickness of this wedge was found using the Profilometer in the clean
room of the engineering building. From
sensitization (Fig. 12). Thus the SrTiO
optimum film thickness to maximize current.
In order to confirm this
hypothesis, differential UV-Vis
absorption spectra were taken at 5
mm intervals on the TiO2 and
SrTiO3 cell (Fig. 13). It was
expected that this absorption
should be constant over the
thickness of the thin film.
However, it was found that absorption did increase slightly with increasin
although the increase is fairly small.
layer.
Chronoamperometric, open circuit potential, and IV measurement
mm across the surface of the TiO
Figure 12. Hypothesized uniform QD deposition
ffect of Thin Film Thickness: The method of laser ablation deposition creates a gradient of
metal oxide deposit across the surface of the FTO slide. This gradient was assumed to be
linear. The thickness of this wedge was found using the Profilometer in the clean
room of the engineering building. From a previous study by Vidhya
Chakrapani, it was hypothesized that regardless of the
thickness of the metal oxide, there would be
an even layer of CdSe deposit
). Thus the SrTiO3 and the TiO2 thin films were ideally set up to find the
optimum film thickness to maximize current.
In order to confirm this
Vis
absorption spectra were taken at 5
and
cell (Fig. 13). It was
expected that this absorption
should be constant over the
thickness of the thin film.
However, it was found that absorption did increase slightly with increasing thin film thickness;
the increase is fairly small. This confirmed relatively well that CdSe forms an even
Chronoamperometric, open circuit potential, and IV measurements were taken every 5
mm across the surface of the TiO2 thin film. It was expected that Voc would stay constant across
Figure 13. UV-Vis Absorption at 540 nm across
0
0.2
0.4
0.6
0.8
0 1000 2000
Ab
sorb
an
ce
Thickness of thin film (nm)
. Hypothesized uniform QD deposition
22
The method of laser ablation deposition creates a gradient of
his gradient was assumed to be
linear. The thickness of this wedge was found using the Profilometer in the clean
previous study by Vidhya
that regardless of the
thickness of the metal oxide, there would be
an even layer of CdSe deposited during
thin films were ideally set up to find the
g thin film thickness;
nfirmed relatively well that CdSe forms an even
were taken every 5
would stay constant across
Vis Absorption at 540 nm across film thickness
3000Thickness of thin film (nm)
TiO2
SrTiO3 cell 1
SrTiO3 cell 2

23
the cell, but that Isc would increase with increasing thin film thickness to a maximum and then
fall off at high thin film thickness. The results of this analysis were inconclusive. One of the
cells used showed some correlation with a peak photocurrent appearing at a thickness of 1.2
micrometers. However, the other sample cell showed little change in photocurrent across the
varying thickness.
4.3 CONCLUSION/FUTURE WORK
After examining both TiO2 and SrTiO3 thin films, it can be concluded that strontium
titanate is not a viable alternative to titanium dioxide as the electron transport layer of a thin film
solar cell. SrTiO3 only provided minimal photocurrents and proved to be a fairly unstable
substrate. The thickness analysis, on the other hand, requires more attention. There could be a
correlation, but the data presented here is insufficient to make any conclusion. Further thin films
will need to be tested to obtain reproducible and reliable data. The thin film itself should be
examined by SEM to confirm if there is a uniform layer of QDs present on the surface. Finally
this process should be extended to the combinatorial heterogeneous thin films described in
section 3.6. A film like this of SrTiO3 and TiO2 could be easily tested using the apparatuses
developed here for the ideal mixture of the two oxides that produces the most efficient QD solar
cell.
This work was conducted at the Universtiy of Notre Dame with the assistance of Vidhya
Chakrapani under the guidance of Prof. Prashant Kamat.
Related Documents
![Dielectric collapse at the LaAlO3/SrTiO3 (001 ... · Dielectric collapse at the LaAlO3/SrTiO3 (001) heterointerface under applied electric field. Scientific Reports, 7, [9516]. DOI:](https://static.cupdf.com/doc/110x72/5bbaa21f09d3f241268b477a/dielectric-collapse-at-the-laalo3srtio3-001-dielectric-collapse-at-the.jpg)