Applied Catalysis B: Environmental 32 (2001) 49–61 Photocatalytic degradation of formic acid using Fe/TiO 2 catalysts: the role of Fe 3+ /Fe 2+ ions in the degradation mechanism J. Araña, O. González D´ ıaz, M. Miranda Saracho, J.M. Doña Rodr´ ıguez ∗ , J.A. Herrera Melián, J. Pérez Peña Departamento de Qu´ ımica, Universidad de Las Palmas de Gran Canaria, Campus de Tafira, E-35017 Gran Canaria, Spain Received 10 August 2000; received in revised form 25 November 2000; accepted 12 December 2000 Abstract The photocatalytic degradation of formic acid by Fe-doped (0.5, 2 and 5% w/w in Fe) and calcined (773 and 1073 K) TiO 2 has been studied. For 773 K calcined catalyst, results suggest that Fe is extracted through the formation of a [Fe–OOCH] 2+ complex by which formic acid degrades. Fe 2+ ions that remain in solution after formic acid degradation go back to the catalyst surface and are oxidized by photogenerated holes. In this way the catalyst is reactivated becoming ready for a new degradation process. The formation of hydrogen-carbonates on the TiO 2 catalyst through OH radicals insertion has been detected by FTIR. This way the formic acid degradation by OH insertion is inhibited and the formation of [Fe–OOCH] 2+ complex is favored. On the other hand, a markedly lower capacity for the formic acid degradation has been determined for the 1073 K calcined catalysts. This behavior can be attributed to the lower surface area and the major presence of lower active phases such as rutile and Fe 2 TiO 5 . © 2001 Elsevier Science B.V. All rights reserved. Keywords: Photocatalysis; Mixed catalysts; Degradation mechanism; FTIR; Complexes; Fe; TiO 2 1. Introduction The preparation process of a catalyst will deter- mine its physical–chemical characteristics and hence its photocatalytic behavior. Research developed on this topic in the last years confirms this statement [1–5]. TiO 2 photocatalytic characteristics can be modified by doping it with metals, such as iron and chromium to make it more active [6–8]. It has been proposed that TiO 2 doping with lower valence cations results in decreased water cleavage rates because of the shift of the flat-band potential to a more anodic position and the enhancement of the depletion layer thickness ∗ Corresponding author. Tel.: +34-928-45-44-37; fax: +34-928-45-29-22. E-mail address: [email protected] (J.M. Doña Rodr´ ıguez). [9]. Also the activity increase found for some re- actions with Fe-doped titania has been attributed to a faster diffusion of reaction intermediates in com- parison to pure TiO 2 . Otherwise, the observed low activity of Cr(III)-doped catalysts is supposed to be due to the slower diffusion of such intermediates [10–13]. Propanone degradation by rutile-containing-TiO 2 in which Ti has been partially substituted by Sn has been compared with pure TiO 2 . Results show that the Sn-doped TiO 2 catalysts degrade this ketone more readily. These studies indicate that on the contrary of the general believe the rutile low activity is not due to the absence of hydroxyl groups on the catalyst sur- face but to the faster electron-hole recombination. The addition of Sn atoms to the TiO 2 lattice reduces the charge carriers recombination rate [14]. 0926-3373/01/$ – see front matter © 2001 Elsevier Science B.V. All rights reserved. PII:S0926-3373(00)00289-7

Welcome message from author
This document is posted to help you gain knowledge. Please leave a comment to let me know what you think about it! Share it to your friends and learn new things together.
Transcript
Applied Catalysis B: Environmental 32 (2001) 49–61
Photocatalytic degradation of formic acid using Fe/TiO2 catalysts:the role of Fe3+/Fe2+ ions in the degradation mechanism
J. Araña, O. González Dı́az, M. Miranda Saracho, J.M. Doña Rodrı́guez∗,J.A. Herrera Melián, J. Pérez Peña
Departamento de Quı́mica, Universidad de Las Palmas de Gran Canaria, Campus de Tafira, E-35017 Gran Canaria, Spain
Received 10 August 2000; received in revised form 25 November 2000; accepted 12 December 2000
Abstract
The photocatalytic degradation of formic acid by Fe-doped (0.5, 2 and 5% w/w in Fe) and calcined (773 and 1073 K) TiO2
has been studied. For 773 K calcined catalyst, results suggest that Fe is extracted through the formation of a [Fe–OOCH]2+complex by which formic acid degrades. Fe2+ ions that remain in solution after formic acid degradation go back to the catalystsurface and are oxidized by photogenerated holes. In this way the catalyst is reactivated becoming ready for a new degradationprocess. The formation of hydrogen-carbonates on the TiO2 catalyst through OH radicals insertion has been detected by FTIR.This way the formic acid degradation by OH insertion is inhibited and the formation of [Fe–OOCH]2+ complex is favored.On the other hand, a markedly lower capacity for the formic acid degradation has been determined for the 1073 K calcinedcatalysts. This behavior can be attributed to the lower surface area and the major presence of lower active phases such as rutileand Fe2TiO5. © 2001 Elsevier Science B.V. All rights reserved.
Keywords: Photocatalysis; Mixed catalysts; Degradation mechanism; FTIR; Complexes; Fe; TiO2
1. Introduction
The preparation process of a catalyst will deter-mine its physical–chemical characteristics and henceits photocatalytic behavior. Research developed on thistopic in the last years confirms this statement [1–5].
TiO2 photocatalytic characteristics can be modifiedby doping it with metals, such as iron and chromiumto make it more active [6–8]. It has been proposedthat TiO2 doping with lower valence cations resultsin decreased water cleavage rates because of the shiftof the flat-band potential to a more anodic positionand the enhancement of the depletion layer thickness
∗ Corresponding author. Tel.: +34-928-45-44-37;fax: +34-928-45-29-22.E-mail address: [email protected] (J.M. Doña Rodrı́guez).
[9]. Also the activity increase found for some re-actions with Fe-doped titania has been attributed toa faster diffusion of reaction intermediates in com-parison to pure TiO2. Otherwise, the observed lowactivity of Cr(III)-doped catalysts is supposed to bedue to the slower diffusion of such intermediates[10–13].
Propanone degradation by rutile-containing-TiO2 inwhich Ti has been partially substituted by Sn hasbeen compared with pure TiO2. Results show thatthe Sn-doped TiO2 catalysts degrade this ketone morereadily. These studies indicate that on the contrary ofthe general believe the rutile low activity is not dueto the absence of hydroxyl groups on the catalyst sur-face but to the faster electron-hole recombination. Theaddition of Sn atoms to the TiO2 lattice reduces thecharge carriers recombination rate [14].
0926-3373/01/$ – see front matter © 2001 Elsevier Science B.V. All rights reserved.PII: S0 9 2 6 -3 3 73 (00 )00289 -7
50 J. Araña et al. / Applied Catalysis B: Environmental 32 (2001) 49–61
In this sense, the photochemical adsorption oforganometallic complexes onto the surface of solidshas attracted much attention as a new process forpreparation of catalysts [15]. In addition to these com-plexes surface adsorptions, interactions among metal-lic complexes intermediates formed during irradiationand surface modifications due to the photochemicalprocess have been of interest [16,17].
As it has been indicated factors affecting activityof doped catalyst are many. Degradation of a certainorganic molecule will depend not only on its chemi-cal properties, such as its capacity for chemisorptionand reacting with photogenerated radicals, but on thecatalyst properties and affinity for the molecule andits degradation intermediates. For instance, catalystsshowing a very high degradation activity for certainspecies may be inactive for others or its intermediates.
In this paper we show results about the degradationof formic acid. We consider this study of interest be-cause this compound is probably the last one duringdegradation of majority of organic compounds beforebeing finally mineralized to CO2. Formic acid degra-dation has been attempted by using TiO2 doped withdifferent iron concentrations (0, 0.5, 2 and 5% w/w)and calcined at 773 and 1073 K in our laboratory.
2. Experimental
2.1. Catalysts preparation
TiO2 was Degussa P-25 (80% anatase). Doping wasperformed by impregnation of TiO2 with aqueous so-lutions of Fe(NO3)3 by an incipient wetness impreg-nation method [18] at 298 K as follows. The mixture(TiO2 and Fe(NO3)3) was stirred during 48 h. Later,water was evaporated by heating at 393 K during 24 h.Finally, the catalysts were calcined at 773 or 1073 K.Table 1 shows the nomenclature used for the so-treatedcatalysts according to their iron content and treatmenttemperature (Degussa P-25 TiO2 characteristics hasbeen included for comparative purposes).
2.2. Experimental conditions
The following experimental conditions wereemployed for all experiments: 250 ml glass vessels
Table 1Catalysts nomenclature and surface area according to Fe contentand calcined temperature
Catalyst Fe(wt.%)
Calcinatingtemperature (K)
Surface area(m2 g−1)
TiO2 298a 0 – 50.0TiO2 773 0 773 49.40.5Fe–TiO2 773 0.5 773 47.32Fe–TiO2 773 2 773 49.65Fe–TiO2 773 5 773 46.8TiO2 1073 0 1073 8.00.5Fe–TiO2 1073 0.5 1073 8.52Fe–TiO2 1073 2 1073 9.95Fe–TiO2 1073 5 1073 10.4
a Bare TiO2 (Degussa P-25).
reactors, formic acid (50 ppm) and catalysts (2 g l−1)concentrations, formic acid-catalysts suspensionswere continuously stirred and air-bubbled (100 mlmin−1). Also, before switching the UV-lamp on thesuspension was air-bubbled and stirred for 15 minin order to favor the organic chemisorption onto thecatalyst surface.
2.3. Equipments
An 800 W xenon UV-lamp (Solarium Facial UV-AHPA 8068, 210–380 nm, ENCO) was employed asUV light source. Remaining formic acid (Aldrich)concentrations at different reaction times were HPLCmeasured by using a reverse phase column (C18) Zor-bax ODS 5µ (Jones chromatography) and a 0.2 Mphosphoric acid mobile phase, using a UV detector(λ = 210 nm). Total organic carbon (TOC), total car-bon (TC) and inorganic carbon (IC) were measured byusing a TOC Shimadzu 5000-A. Dissolved iron hasbeen quantified by atomic absorption spectrophotom-etry with a Varian equipment model Zeeman providedwith an automatic dispersor and a graphite furnace.
BET surface area of the catalysts has been mea-sured by using a Gemini III 2375 surface area ana-lyzer (micromeritics). Samples of the catalysts (0.2 g)were placed in glass tubes (15 cm long×0.8 cm wide)and treated with N2 at 373 K for 24 h before mea-suring. Then a vacuum pump was used to extract N2and the catalyst free space was determined by usingHe gas. Adsorption–desorption curves containing 25points each with N2 at 78 K were employed for sur-face area measurements.
J. Araña et al. / Applied Catalysis B: Environmental 32 (2001) 49–61 51
Catalysts were impregnated with (1:1 w/w) formicacid–water mixtures for FTIR experiments. After15 min catalysts were placed between two CaF2 win-dows for the spectral analysis. A FTIR spectropho-tometer model RS/1 (UNICAM) was used. Intervalsof 2000–1000 cm−1, a resolution of 2 cm−1 and aforward and reverse moving mirrors speed of 10 and6.2 kHz, respectively, were used. Water referencespectrum has been subtracted to all spectra. X-raydiffraction (XRD) patterns were obtained by using aSiemens D-500 difractometer (Cu K�, λ = 1.5432 Å).
3. Results and discussion
3.1. X-ray diffraction
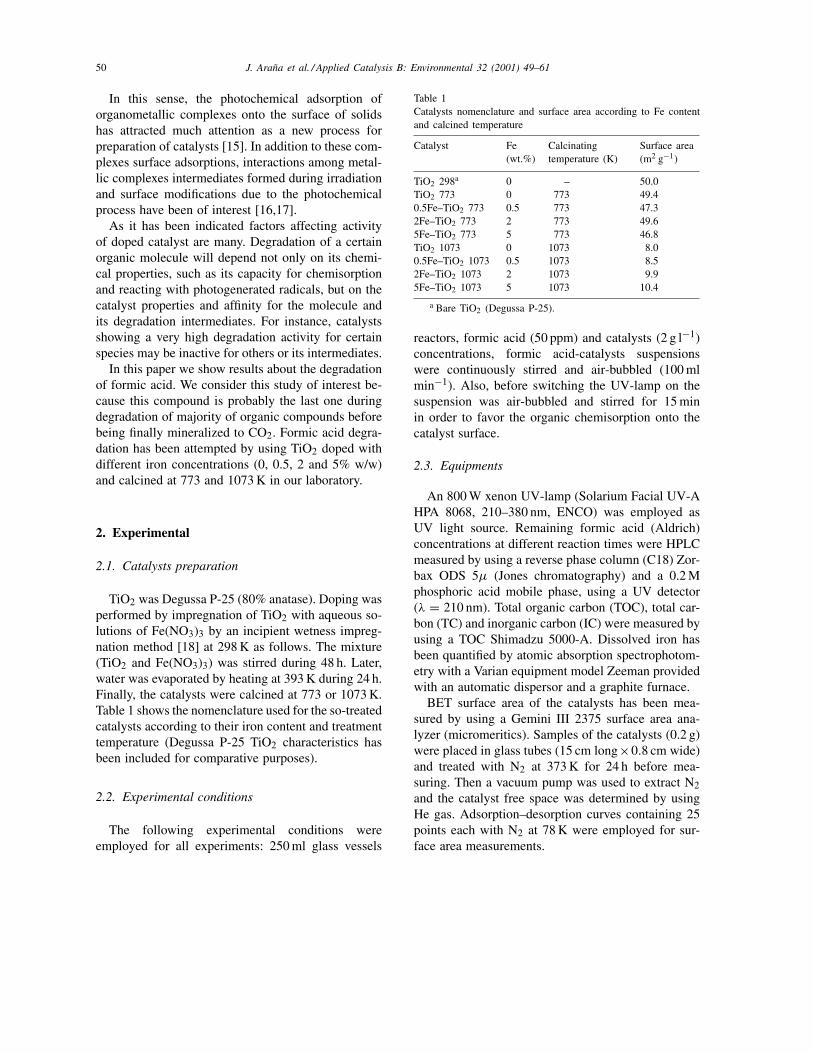
After thermal treatments the catalysts crystallo-graphic phases were identified by XRD. Figs. 1 and 2show X-ray patterns of catalysts calcined at 773 and1073 K, respectively. Anatase (a) in a larger extent,and rutile (r) phases have been identified in 773 Kcatalysts (Fig. 1). Catalysts with a higher Fe content
Fig. 1. XRD patterns of calcined catalysts at 773 K (r, rutile phase; a, anatase phase; h, hematite phase).
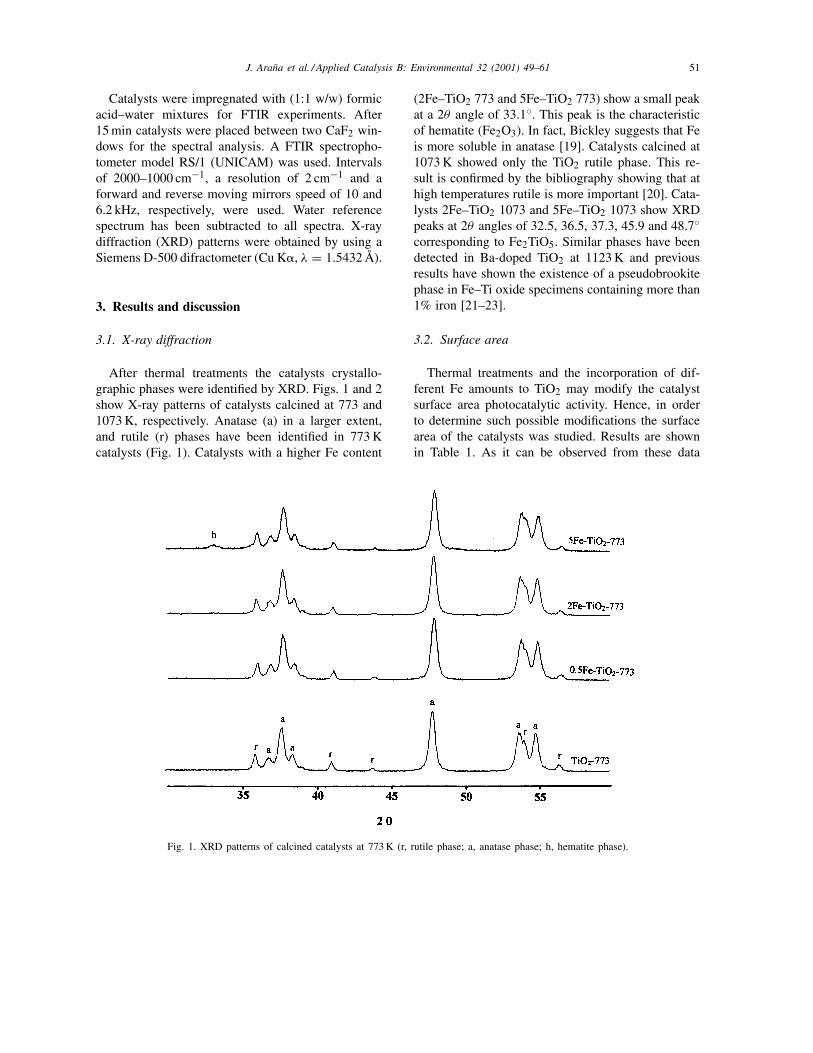
(2Fe–TiO2 773 and 5Fe–TiO2 773) show a small peakat a 2θ angle of 33.1◦. This peak is the characteristicof hematite (Fe2O3). In fact, Bickley suggests that Feis more soluble in anatase [19]. Catalysts calcined at1073 K showed only the TiO2 rutile phase. This re-sult is confirmed by the bibliography showing that athigh temperatures rutile is more important [20]. Cata-lysts 2Fe–TiO2 1073 and 5Fe–TiO2 1073 show XRDpeaks at 2θ angles of 32.5, 36.5, 37.3, 45.9 and 48.7◦corresponding to Fe2TiO5. Similar phases have beendetected in Ba-doped TiO2 at 1123 K and previousresults have shown the existence of a pseudobrookitephase in Fe–Ti oxide specimens containing more than1% iron [21–23].
3.2. Surface area
Thermal treatments and the incorporation of dif-ferent Fe amounts to TiO2 may modify the catalystsurface area photocatalytic activity. Hence, in orderto determine such possible modifications the surfacearea of the catalysts was studied. Results are shownin Table 1. As it can be observed from these data
52 J. Araña et al. / Applied Catalysis B: Environmental 32 (2001) 49–61
Fig. 2. XRD patterns of calcined catalysts at 1073 K (r, rutile phase; b, Fe2TiO5 phase).
at 1073 K, the surface area is five times reduced. At773 K, the presence of Fe in the TiO2 lattice seemsnot to affect the surface area but catalysts treatedat 1073 K show a slightly surface area increment athigher Fe contents. Other authors, who suggested thatthe presence of Fe can result in a surface area andporosity increment yielding inhomogeneous solids,have noticed this effect [12,19,24]. These resultsclearly indicate that variations of the catalytic activityof calcined catalysts at the same temperature cannotbe attributed to different surface areas.
3.3. FTIR study
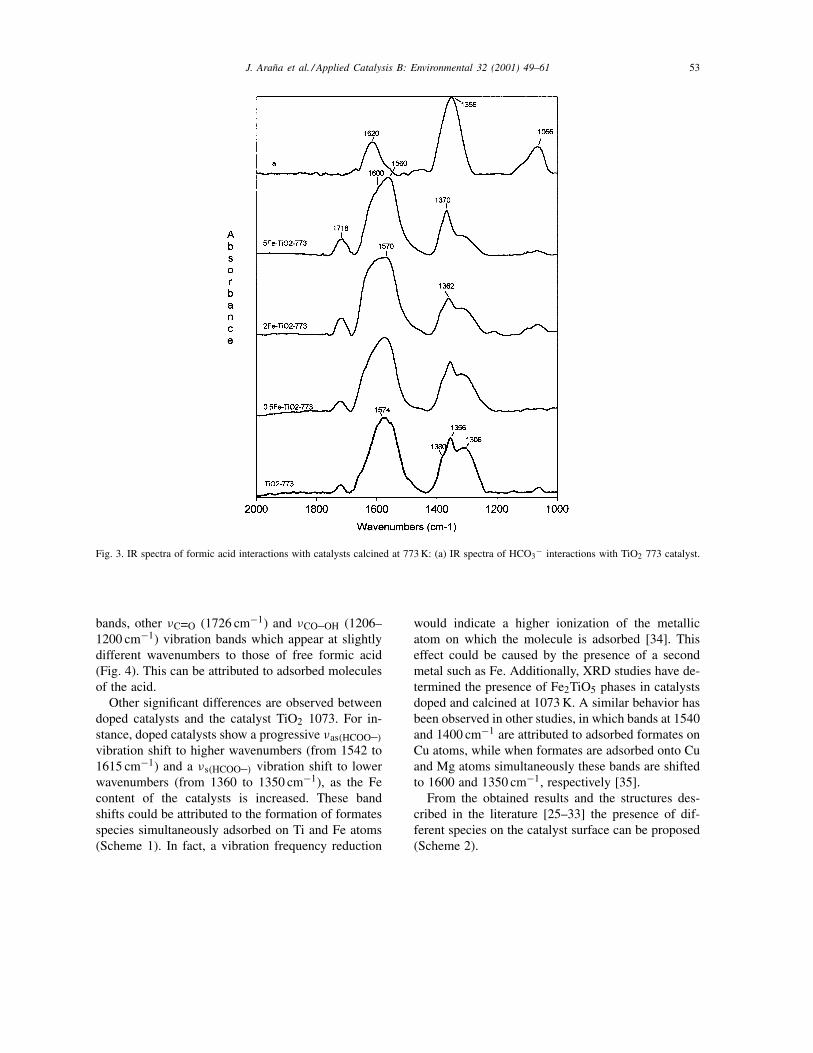
Formic acid molecule interactions with the differ-ent catalysts surfaces have been determined by FTIRanalyses. Figs. 3 and 4 show spectra obtained after15 min of the 773 and 1073 K calcined catalysts im-pregnation with the formic acid–water solution.
Formic acid molecules are converted into for-mates by the 773 K calcined catalysts. This canbe deduced because formic acid vibrations ν(C=O)
at 1730 cm−1 and ν(CO–OH) at 1200 cm−1 (Fig. 4)
disappear and νas(HCOO–) and νs(HCOO–) formatecharacteristic vibrations [25–33] between 1600–1560and 1370–1306 cm−1, respectively, are now visible.
The shoulder-like band at 1380 cm−1, observed forall catalysts is attributed to the δ(CH) vibration, thatfor free formic acid is found at higher wavenumbers(1396 cm−1, Fig. 4). In the catalyst TiO2 773, theνs(HCOO–) vibration band is observed at 1356 cm−1
but in doped catalysts as their Fe content is in-creased, it appears at higher wavenumbers, about1362 and 1370 cm−1. Similarly, in doped catalysts anew shoulder-like band at 1600 cm−1 attributable tothe νas(HCOO–) vibration is observed. Formic acid–Fecomplexes have been described in the literature show-ing νas(HCOO–) and νs(HCOO–) vibrations at 1590and 1370 cm−1 [27,32]. Consequently, these shiftsof the carboxylic group symmetric and asymmetricvibrations bands can be attributed to that kind of com-plexes. Also, the presence of hydrogen carbonatesshowing bands at 1620, 1356 and 1066 cm−1 (Fig. 3)are observed, particularly in the catalyst TiO2 773.
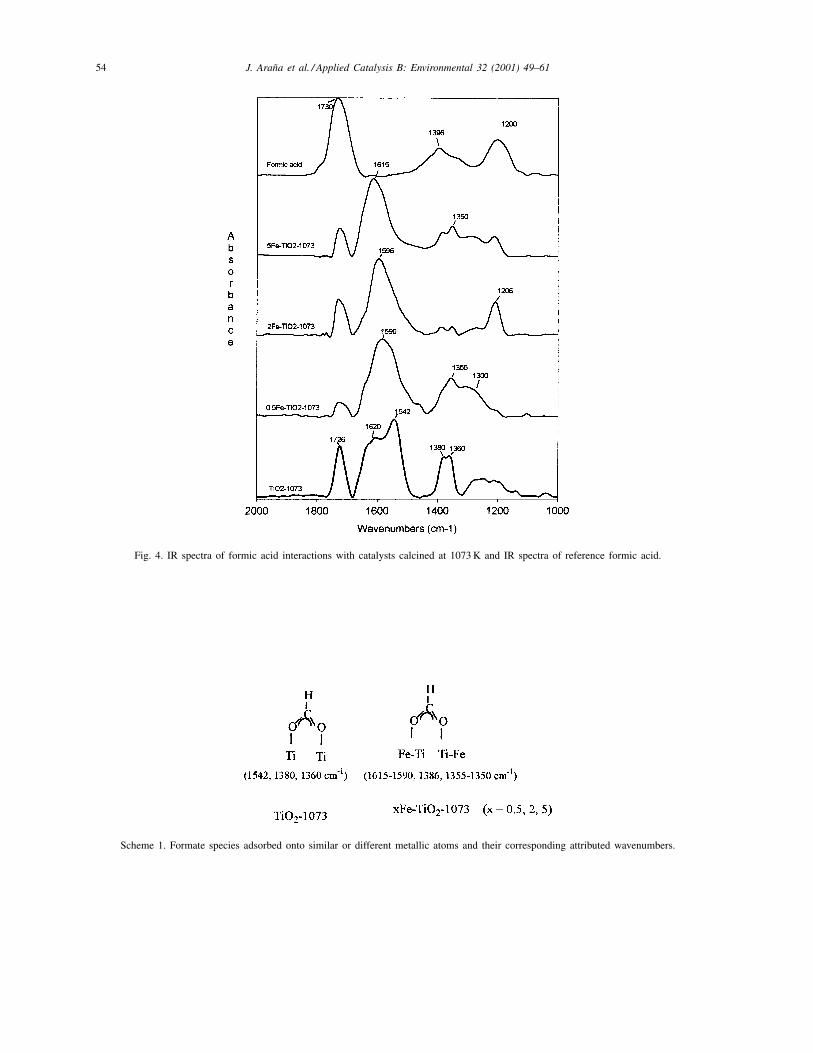
Interactions between formic acid and catalystscalcined at 1073 K show, in addition to formate
J. Araña et al. / Applied Catalysis B: Environmental 32 (2001) 49–61 53
Fig. 3. IR spectra of formic acid interactions with catalysts calcined at 773 K: (a) IR spectra of HCO3− interactions with TiO2 773 catalyst.
bands, other νC=O (1726 cm−1) and νCO–OH (1206–1200 cm−1) vibration bands which appear at slightlydifferent wavenumbers to those of free formic acid(Fig. 4). This can be attributed to adsorbed moleculesof the acid.
Other significant differences are observed betweendoped catalysts and the catalyst TiO2 1073. For in-stance, doped catalysts show a progressive νas(HCOO–)
vibration shift to higher wavenumbers (from 1542 to1615 cm−1) and a νs(HCOO–) vibration shift to lowerwavenumbers (from 1360 to 1350 cm−1), as the Fecontent of the catalysts is increased. These bandshifts could be attributed to the formation of formatesspecies simultaneously adsorbed on Ti and Fe atoms(Scheme 1). In fact, a vibration frequency reduction
would indicate a higher ionization of the metallicatom on which the molecule is adsorbed [34]. Thiseffect could be caused by the presence of a secondmetal such as Fe. Additionally, XRD studies have de-termined the presence of Fe2TiO5 phases in catalystsdoped and calcined at 1073 K. A similar behavior hasbeen observed in other studies, in which bands at 1540and 1400 cm−1 are attributed to adsorbed formates onCu atoms, while when formates are adsorbed onto Cuand Mg atoms simultaneously these bands are shiftedto 1600 and 1350 cm−1, respectively [35].
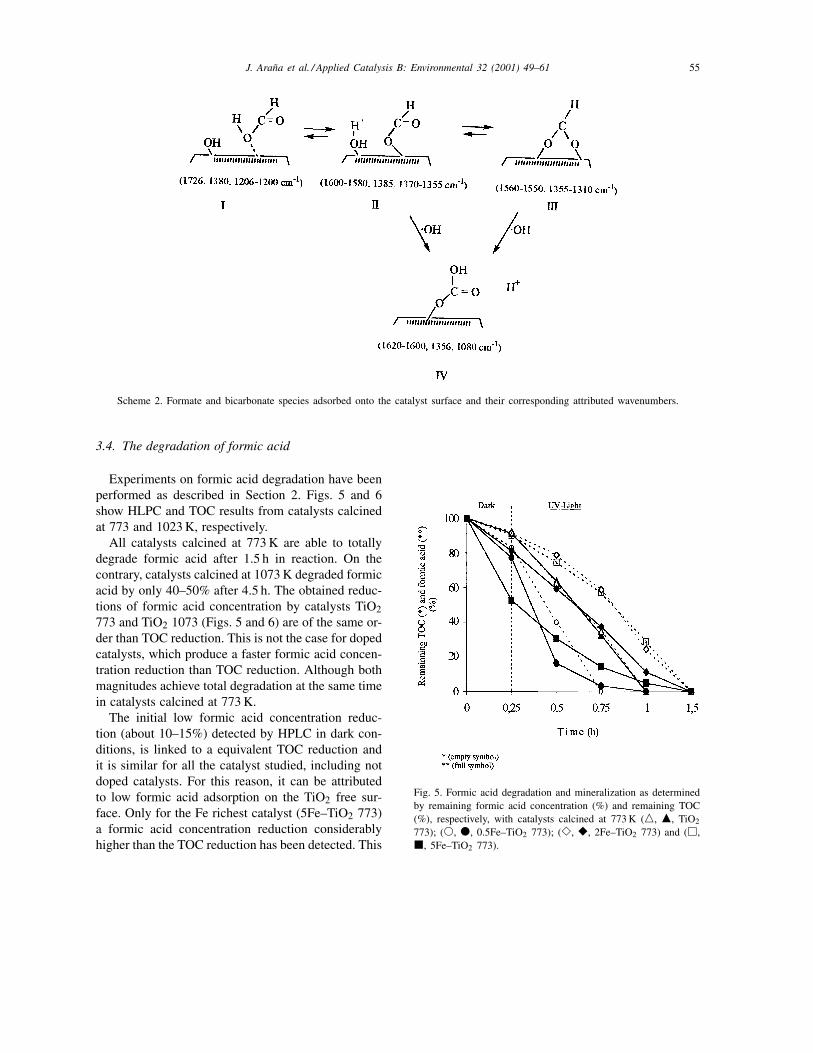
From the obtained results and the structures des-cribed in the literature [25–33] the presence of dif-ferent species on the catalyst surface can be proposed(Scheme 2).
54 J. Araña et al. / Applied Catalysis B: Environmental 32 (2001) 49–61
Fig. 4. IR spectra of formic acid interactions with catalysts calcined at 1073 K and IR spectra of reference formic acid.
Scheme 1. Formate species adsorbed onto similar or different metallic atoms and their corresponding attributed wavenumbers.
J. Araña et al. / Applied Catalysis B: Environmental 32 (2001) 49–61 55
Scheme 2. Formate and bicarbonate species adsorbed onto the catalyst surface and their corresponding attributed wavenumbers.
3.4. The degradation of formic acid
Experiments on formic acid degradation have beenperformed as described in Section 2. Figs. 5 and 6show HLPC and TOC results from catalysts calcinedat 773 and 1023 K, respectively.
All catalysts calcined at 773 K are able to totallydegrade formic acid after 1.5 h in reaction. On thecontrary, catalysts calcined at 1073 K degraded formicacid by only 40–50% after 4.5 h. The obtained reduc-tions of formic acid concentration by catalysts TiO2773 and TiO2 1073 (Figs. 5 and 6) are of the same or-der than TOC reduction. This is not the case for dopedcatalysts, which produce a faster formic acid concen-tration reduction than TOC reduction. Although bothmagnitudes achieve total degradation at the same timein catalysts calcined at 773 K.
The initial low formic acid concentration reduc-tion (about 10–15%) detected by HPLC in dark con-ditions, is linked to a equivalent TOC reduction andit is similar for all the catalyst studied, including notdoped catalysts. For this reason, it can be attributedto low formic acid adsorption on the TiO2 free sur-face. Only for the Fe richest catalyst (5Fe–TiO2 773)a formic acid concentration reduction considerablyhigher than the TOC reduction has been detected. This
Fig. 5. Formic acid degradation and mineralization as determinedby remaining formic acid concentration (%) and remaining TOC(%), respectively, with catalysts calcined at 773 K (�, �, TiO2
773); (�, �, 0.5Fe–TiO2 773); (�, �, 2Fe–TiO2 773) and (�,�, 5Fe–TiO2 773).
56 J. Araña et al. / Applied Catalysis B: Environmental 32 (2001) 49–61
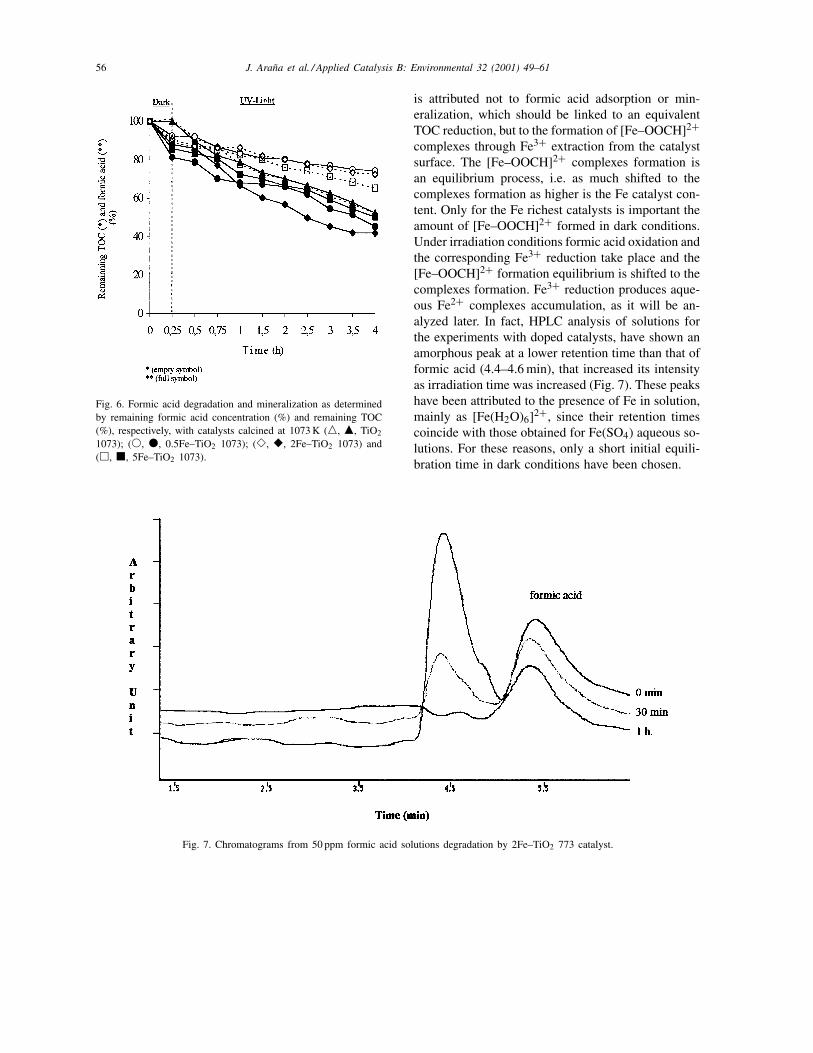
Fig. 6. Formic acid degradation and mineralization as determinedby remaining formic acid concentration (%) and remaining TOC(%), respectively, with catalysts calcined at 1073 K (�, �, TiO2
1073); (�, �, 0.5Fe–TiO2 1073); (�, �, 2Fe–TiO2 1073) and(�, �, 5Fe–TiO2 1073).
Fig. 7. Chromatograms from 50 ppm formic acid solutions degradation by 2Fe–TiO2 773 catalyst.
is attributed not to formic acid adsorption or min-eralization, which should be linked to an equivalentTOC reduction, but to the formation of [Fe–OOCH]2+complexes through Fe3+ extraction from the catalystsurface. The [Fe–OOCH]2+ complexes formation isan equilibrium process, i.e. as much shifted to thecomplexes formation as higher is the Fe catalyst con-tent. Only for the Fe richest catalysts is important theamount of [Fe–OOCH]2+ formed in dark conditions.Under irradiation conditions formic acid oxidation andthe corresponding Fe3+ reduction take place and the[Fe–OOCH]2+ formation equilibrium is shifted to thecomplexes formation. Fe3+ reduction produces aque-ous Fe2+ complexes accumulation, as it will be an-alyzed later. In fact, HPLC analysis of solutions forthe experiments with doped catalysts, have shown anamorphous peak at a lower retention time than that offormic acid (4.4–4.6 min), that increased its intensityas irradiation time was increased (Fig. 7). These peakshave been attributed to the presence of Fe in solution,mainly as [Fe(H2O)6]2+, since their retention timescoincide with those obtained for Fe(SO4) aqueous so-lutions. For these reasons, only a short initial equili-bration time in dark conditions have been chosen.
J. Araña et al. / Applied Catalysis B: Environmental 32 (2001) 49–61 57
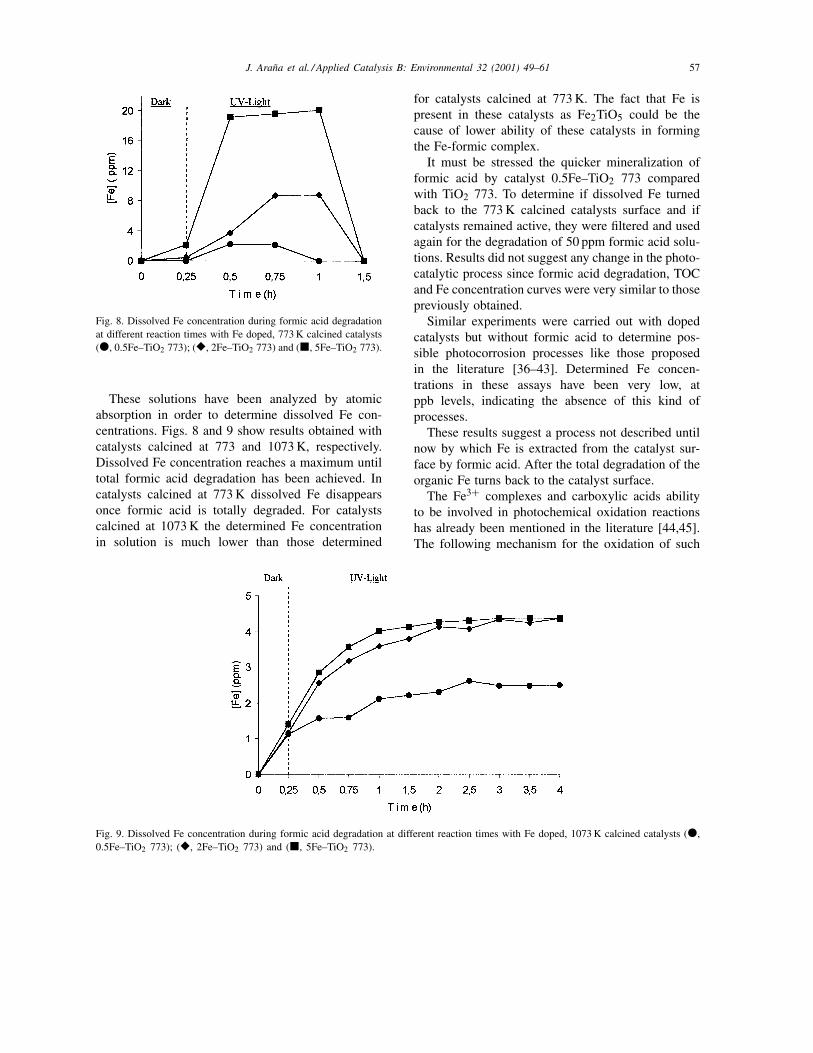
Fig. 8. Dissolved Fe concentration during formic acid degradationat different reaction times with Fe doped, 773 K calcined catalysts(�, 0.5Fe–TiO2 773); (�, 2Fe–TiO2 773) and (�, 5Fe–TiO2 773).
These solutions have been analyzed by atomicabsorption in order to determine dissolved Fe con-centrations. Figs. 8 and 9 show results obtained withcatalysts calcined at 773 and 1073 K, respectively.Dissolved Fe concentration reaches a maximum untiltotal formic acid degradation has been achieved. Incatalysts calcined at 773 K dissolved Fe disappearsonce formic acid is totally degraded. For catalystscalcined at 1073 K the determined Fe concentrationin solution is much lower than those determined
Fig. 9. Dissolved Fe concentration during formic acid degradation at different reaction times with Fe doped, 1073 K calcined catalysts (�,0.5Fe–TiO2 773); (�, 2Fe–TiO2 773) and (�, 5Fe–TiO2 773).
for catalysts calcined at 773 K. The fact that Fe ispresent in these catalysts as Fe2TiO5 could be thecause of lower ability of these catalysts in formingthe Fe-formic complex.
It must be stressed the quicker mineralization offormic acid by catalyst 0.5Fe–TiO2 773 comparedwith TiO2 773. To determine if dissolved Fe turnedback to the 773 K calcined catalysts surface and ifcatalysts remained active, they were filtered and usedagain for the degradation of 50 ppm formic acid solu-tions. Results did not suggest any change in the photo-catalytic process since formic acid degradation, TOCand Fe concentration curves were very similar to thosepreviously obtained.
Similar experiments were carried out with dopedcatalysts but without formic acid to determine pos-sible photocorrosion processes like those proposedin the literature [36–43]. Determined Fe concen-trations in these assays have been very low, atppb levels, indicating the absence of this kind ofprocesses.
These results suggest a process not described untilnow by which Fe is extracted from the catalyst sur-face by formic acid. After the total degradation of theorganic Fe turns back to the catalyst surface.
The Fe3+ complexes and carboxylic acids abilityto be involved in photochemical oxidation reactionshas already been mentioned in the literature [44,45].The following mechanism for the oxidation of such
58 J. Araña et al. / Applied Catalysis B: Environmental 32 (2001) 49–61
complexes has been proposed.
[RCO2–Fe]2+ hν→R• + CO2 + Fe2+R• + O2 + H2O → ROH + HO2
•H+ + HO2
• + e− → H2O2
(a1)
Other authors have suggested similar processeswith carbonilic metallic compounds [46] indicatingthat photogenerated holes are occupied by complexessuch as M(CO)6 (M, metal atom) adsorbed onto TiO2particles, inducing a decarbonylation.
TiO2 + hν → e− + h+ (a2)
M(CO)6(ads) + h+ → [M(CO)5]+(ads) + CO (a3)
Photogenerated electrons in the conduction bandcause the adsorption of molecular oxygen onto TiO2particles [47,48] giving adsorbed superoxide radicals,•O2
−(ads), that are considered to be very suitable forrepeatedly reacting with [M(CO)5]+(ads) and giving avariety of oxocarbonyl species as intermediates whichfinally yield MO3 [49–52].
Ti4+ + e− → Ti3+
Ti3+ + O2 → O2−(ads) + Ti4+ (a4)
[M(CO)5]+(ads) + O2−(ads) → M(CO)4(O)2(ads)
+ CO → · · · → MO3(ads) (a5)
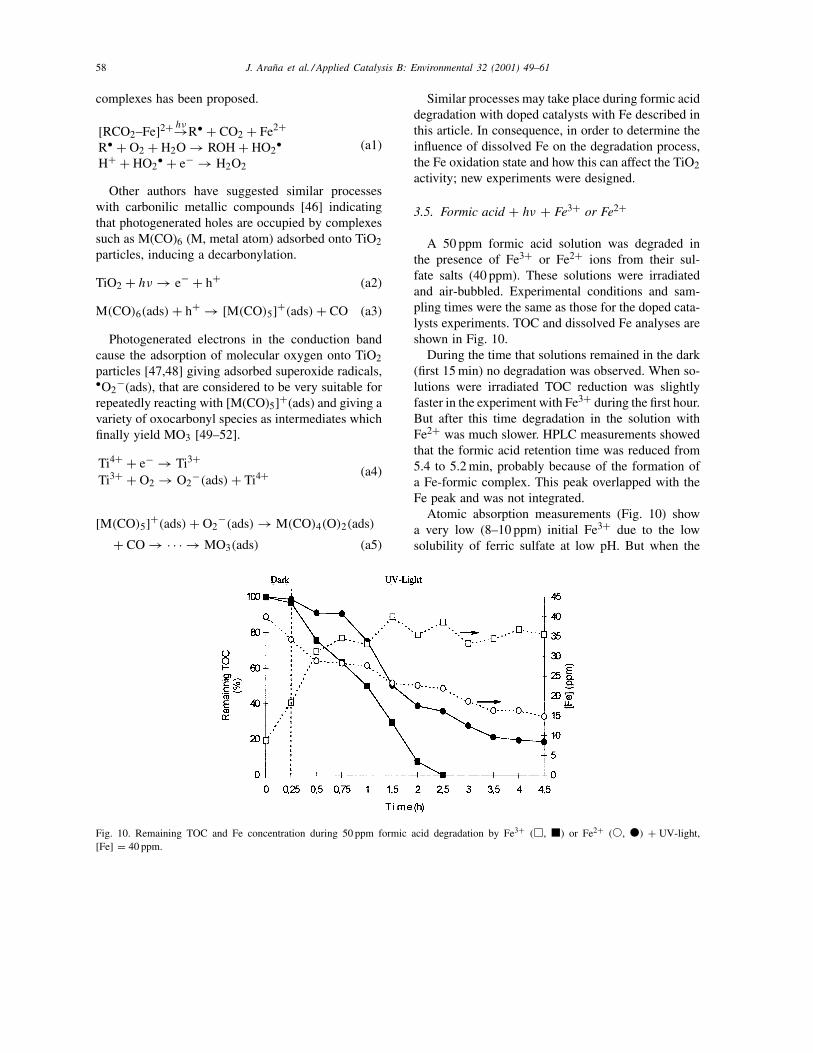
Fig. 10. Remaining TOC and Fe concentration during 50 ppm formic acid degradation by Fe3+ (�, �) or Fe2+ (�, �) + UV-light,[Fe] = 40 ppm.
Similar processes may take place during formic aciddegradation with doped catalysts with Fe described inthis article. In consequence, in order to determine theinfluence of dissolved Fe on the degradation process,the Fe oxidation state and how this can affect the TiO2activity; new experiments were designed.
3.5. Formic acid + hν + Fe3+ or Fe2+
A 50 ppm formic acid solution was degraded inthe presence of Fe3+ or Fe2+ ions from their sul-fate salts (40 ppm). These solutions were irradiatedand air-bubbled. Experimental conditions and sam-pling times were the same as those for the doped cata-lysts experiments. TOC and dissolved Fe analyses areshown in Fig. 10.
During the time that solutions remained in the dark(first 15 min) no degradation was observed. When so-lutions were irradiated TOC reduction was slightlyfaster in the experiment with Fe3+ during the first hour.But after this time degradation in the solution withFe2+ was much slower. HPLC measurements showedthat the formic acid retention time was reduced from5.4 to 5.2 min, probably because of the formation ofa Fe-formic complex. This peak overlapped with theFe peak and was not integrated.
Atomic absorption measurements (Fig. 10) showa very low (8–10 ppm) initial Fe3+ due to the lowsolubility of ferric sulfate at low pH. But when the
J. Araña et al. / Applied Catalysis B: Environmental 32 (2001) 49–61 59
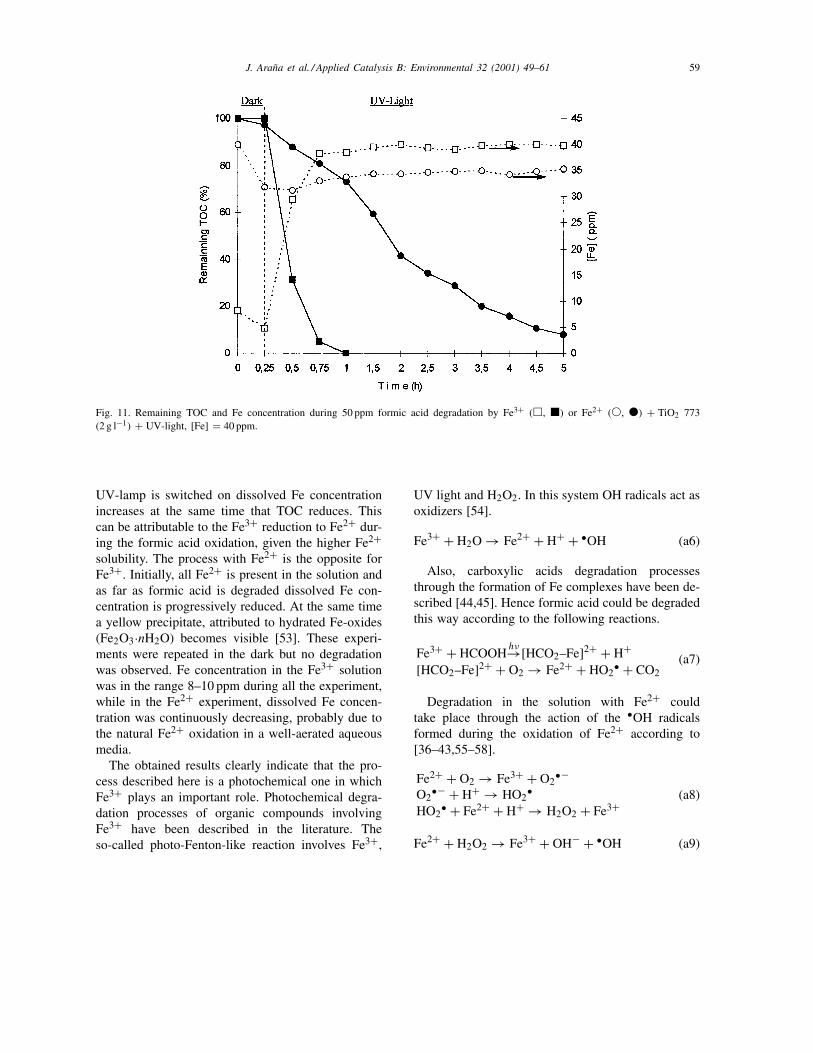
Fig. 11. Remaining TOC and Fe concentration during 50 ppm formic acid degradation by Fe3+ (�, �) or Fe2+ (�, �) + TiO2 773(2 g l−1) + UV-light, [Fe] = 40 ppm.
UV-lamp is switched on dissolved Fe concentrationincreases at the same time that TOC reduces. Thiscan be attributable to the Fe3+ reduction to Fe2+ dur-ing the formic acid oxidation, given the higher Fe2+solubility. The process with Fe2+ is the opposite forFe3+. Initially, all Fe2+ is present in the solution andas far as formic acid is degraded dissolved Fe con-centration is progressively reduced. At the same timea yellow precipitate, attributed to hydrated Fe-oxides(Fe2O3·nH2O) becomes visible [53]. These experi-ments were repeated in the dark but no degradationwas observed. Fe concentration in the Fe3+ solutionwas in the range 8–10 ppm during all the experiment,while in the Fe2+ experiment, dissolved Fe concen-tration was continuously decreasing, probably due tothe natural Fe2+ oxidation in a well-aerated aqueousmedia.
The obtained results clearly indicate that the pro-cess described here is a photochemical one in whichFe3+ plays an important role. Photochemical degra-dation processes of organic compounds involvingFe3+ have been described in the literature. Theso-called photo-Fenton-like reaction involves Fe3+,
UV light and H2O2. In this system OH radicals act asoxidizers [54].
Fe3+ + H2O → Fe2+ + H+ + •OH (a6)
Also, carboxylic acids degradation processesthrough the formation of Fe complexes have been de-scribed [44,45]. Hence formic acid could be degradedthis way according to the following reactions.
Fe3+ + HCOOHhν→[HCO2–Fe]2+ + H+
[HCO2–Fe]2+ + O2 → Fe2+ + HO2• + CO2
(a7)
Degradation in the solution with Fe2+ couldtake place through the action of the •OH radicalsformed during the oxidation of Fe2+ according to[36–43,55–58].
Fe2+ + O2 → Fe3+ + O2•−
O2•− + H+ → HO2
•HO2
• + Fe2+ + H+ → H2O2 + Fe3+(a8)
Fe2+ + H2O2 → Fe3+ + OH− + •OH (a9)
60 J. Araña et al. / Applied Catalysis B: Environmental 32 (2001) 49–61
3.6. Formic acid + hν + TiO2 773 + Fe3+ or Fe2+
Finally, formic acid degradation was attempted in asolution containing 40 ppm Fe2+ or Fe3+ and 2 g l−1
catalyst TiO2 773. Irradiating time was 5 h. Resultsfrom TOC and atomic absorption measurements areshown in Fig. 11. While the solution was in the darkno organic carbon reduction was observed. The samething happened for solutions with only Fe2+ or Fe3+.But when the solution with Fe3+ and the catalyst TiO2773 is irradiated, the organic carbon concentrationdiminishes much faster than in the experiment withonly Fe3+ and even in the experiment with only TiO2773 (Fig. 5), but similarly to the experiments with0.5Fe–TiO2 773. On the other hand, the solution con-taining Fe2+ and the catalyst TiO2 773 behave simi-larly that the solution with only Fe2+ (Fig. 9). In otherwords, the acid is degraded at a much lower speedthan that obtained in the solution containing only thecatalyst TiO2 773. This clearly shows the inhibitingeffect of Fe2+ ions on catalytic ability of TiO2 773.
It is noticeable that in the TiO2 773 + Fe3+ + hν
experiments, all the initial Fe is present in the solutionas Fe2+ (Fig. 11), at the end of the process, indicatingthat it is not possible to recover the Fe3+ as Fe2O3 onthe TiO2 surface, when bare TiO2 is initially used.
4. Conclusions
Results obtained in this research show that formicacid degradation mechanism by Fe-containing TiO2is different from that resulting from Fe-free TiO2. InFe-free TiO2 degradation probably occurs through•OH radical insertion in adsorbed formic acidmolecules yielding hydrogen carbonates.
Furthermore, results from the formic acid degrada-tion by doped catalysts have shown an Fe3+ ions inter-action with the acid that produces Fe3+ ions extractionfrom the catalyst surface as dissolved [Fe–OOCH]2+complexes. This complex undergoes total degrada-tion to CO2 and Fe2+ (a7). These catalysts have a‘memory’ that allows Fe2+ ions to return to the cat-alyst surface, where part of the initially deposited Feremains, after formic degradation as Fe3+ through
Fe2+ + h+ → [Fe3+]ads (a10)
After this, the catalyst surface is ready to be usedagain. This memory can be explained by consideringthat the presence of remaining Fe2O3 deposits thathave not been extracted from the catalyst surface dur-ing the formic acid degradation acts as crystallizationnuclei that facilitate the dissolved Fe return as Fe2O3.
In other words, Fe doped TiO2 shows a similar cat-alytic behavior as Fe3+ in the photo-Fenton reaction(a6), but when degradation is finished Fe turns backto the catalyst surface. After this the catalyst may bereused again. Contrary to the photo-Fenton reaction, inwhich Fe remains in solution after the photocatalyticdegradation and H2O2 must be added, Fe is recuper-ated adsorbed on the catalyst particles and no H2O2is consumed.
Catalysts calcined at 1073 K show a considerablereduced ability to degrade formic acid than 773 cata-lysts. The presence of rutile phases and Fe2TiO5 de-posits and the lower surface area of TiO2 1073 cata-lysts seem to be the causes of such a worse catalyticactivity. Fe2TiO5 phases seem to be less prone to Feextraction from the catalyst surface. The presence ofrutile phase showing a described faster h+/e− recom-bination [14] in addition to the lack of Fe2O3 nucleihamper the Fe return to the catalyst surface.
It is worthwhile to stress that the best results havebeen obtained with the catalyst with the lowest Fecontent and calcined at 773 K, the 0.5Fe–TiO2 773catalyst. In this case the amount of surfacial Fe2O3acting as a ‘memory’ is lower than in those catalystscontaining higher Fe concentrations. However, morefree TiO2 surface producing holes will exist that willpromote reaction (a10). In fact, current studies devel-oped by our group indicate that Fe-doped catalysts atconcentrations between 0.15 and 0.5% (w/w) show animproved catalytic ability to that of TiO2 773 at de-grading this kind of acids. This may be attributed tothe facility of Fe extraction and return to the surfaceof those catalysts.
Acknowledgements
We are grateful to Consejerı́a de Educación del Gob-ierno Autónomo de Canarias, Fundación Universitariade Las Palmas, Agencia de Española de ColaboraciónIberoamericana (AECI) and Ministerio de Educacióny Cultura by their financial support.
J. Araña et al. / Applied Catalysis B: Environmental 32 (2001) 49–61 61
References
[1] T. Kasuga, M. Hiramatsu, M. Hirano, A. Hoson, J. Mater.Res. 12 (3) (1997) 607.
[2] M.K. Akhtar, S.E. Pratsinis, S.V.R. Mastrangelo, J. Am.Ceram. Soc. 75 (1992) 3408.
[3] G. Dagan, M. Tomkiewicz, J. Phys. Chem. 97 (1993) 12651.[4] L.K. Campbel, B.K. Na, E.I. Ko, Chem. Mater. 4 (1992)
1329.[5] M. Toba, F. Mizukami, S. Niwa, T. Sano, K. Maeda, A.
Annila, V. Kamppa, J. Mol. Catal. 277 (1994) 91.[6] J.A. Navı́o, G. Colón, M. Macı́as, C. Real, M.I. Litter, Appl.
Catal. A: Gen. 177 (1999) 111.[7] M.I. Litter, J.A. Navı́o, J. Photoch. Photobiol. A: Chem. 98
(1996) 171.[8] J.A. Navı́o, M. Macı́as, M. González-Catalán, A. Justo, J.
Mater. Sci. 27 (1992) 3036.[9] K.E. Karakitsou, X.E. Verykios, J. Phys. Chem. 97 (1993)
1184.[10] M. Schiavello, A. Sclafani, in: M. Schiavello (Ed.),
Photoelectrochemistry, Photocatalysis and Photo-Reactors,NATO-ASI Series, Series C, Vol. 146, Reidel, Dordrecht,1985, p. 503.
[11] L. Palmisano, V. Augugliaro, A. Sclafani, M. Schiavello, J.Phys. Chem. 92 (1988) 6710.
[12] L. Palmisano, M. Schiavello, A. Sclafani, C. Martin, I. Martin,V. Rives, Catal. Lett. 24 (1994) 303.
[13] H.P. Maruska, A.K. Ghosh, Solar Energy Mater. 1 (1979) 237.[14] J. Lin, J.C. Yu, D. Lo, S.K. Lam, J. Catal. 183 (1999) 368.[15] H.D. Gafney, Stud. Surf. Sci. Catal. 47 (1989) 272.[16] R.L. Jackson, M.R. Thrusheim, J. Am. Chem. Soc. 104 (1982)
6590.[17] M.S. Darsillo, H.D. Gafney, M.S. Paqutt, J. Am. Chem. Soc.
109 (1987) 3275.[18] R.I. Bickley, J.S. Lees, R.J.D. Tilley, L. Palmisano, M.
Schiavello, J. Chem. Soc., Faraday Trans. 88 (1992) 377.[19] R.T. Bickley, T. González-Caralro, L. Palmisano, in:
Proceedings of the 4th International Symposium on ScientificBases for the Preparation of Heterogeneus Catalysts, Belgium,1986.
[20] E. Leyva, E. Moctezuma, M.G. Ruı́z, L. Torres Martı́nez,Catal. Today 40 (1998) 367.
[21] V. Augugliaro, F. D’Alba, L. Rizzutti, M.A. Schiavello, A.Sclafani, Int. J. Hydrogen Energy 7 (1982) 851.
[22] V. Augugliaro, L. Palmisano, in: M.A. Schiavello (Ed.),Photocatalysis and Environmente, NATO ASI Series, SeriesC, Vol. 237, Kluwer Academic Publishers, Dordrecht, 1988,p. 425.
[23] J.C. Conesa, J. Soria, V. Augugliaro, L. Palmisano, in: C.Morterm, A. Zekina, A. Costa (Eds.), Studies in SurfaceScience and Catalysis: Structure and Reactivity of Surfaces,Vol. 40.
[24] A. Nobile Jr., M.W. Davis Jr., J. Catal. 116 (1989) 383.[25] C. Sut, D.L. Suarez, Catal. Clay Minerals 45 (6) (1997) 814.[26] V.D. Branco, S. Doronzo, M. Gallo, Inorg. Nucl. Chem. Lett.
16 (1980) 97.
[27] R. Eisenberg, D. E, Hendrikson, Adv. Catal. 28 (1979) 79.[28] R.P.A. Sneeden, L’Actualité Chimique, 22 February 1979.[29] C.J. Nyman, C.E. Wymore, G. Wilkinson, J. Chem. Soc. A
(1978) 561.[30] I.S. Kolomnikow, M.Kh. Grigoryan, Russ. Chem. Rev.
(English transition) 47 (1978) 334.[31] M. Aresta, C.F. Nobile, Inorg. Chim. Acta 24 (1977) 149.[32] M.E. Volpin, I.S. Kolomnikov, in: E. Becker, M. Tsutsui
(Eds.), Organometallic Reactions, Vol. 5, Interscience, NewYork, 1975, p. 313.
[33] V.D. Branco, S. Doronzo, M. Rossi, J. Organomet. Chem. 35(1972) 337.
[34] K. Nakamoto, Infrared Spectra of Inorganic and CoordintatioCompounds, Mir, Moscow, 1966 (in Russian).
[35] A.A. Davydov, A.A. Budneva, T.M. Yur’eva, An investigationof surface compounds in carbon monoxide conversion onsolid solutions of CuO–MgO by the infrared spectroscopicmethod, in: Proceedings of the All-Union Conference on theMechanism of Heterogeneous Catalytic Reactions, Instituteof Chemical Physics, Vol. 39, Moscow, 1974 (preprint).
[36] M.I. Litter, E.L. Baumgartner, G.A. Urrutia, M.A. Blesa,Environ. Sci. Technol. 25 (1991) 1907.
[37] M.I. Litter, M.A. Blesa, Can. J. Chem. 70 (1992) 2502.[38] M.I. Litter, M. Villegas, M.A. Blesa, Can. J. Chem. 72 (1994)
2037.[39] C. Siffert, B. Sulzberger, Langmuir 7 (1991) 1627.[40] M.I. Litter, M.A. Blesa, J. Colloid Interface Sci. 125 (1988)
679.[41] M.I. Litter, M.A. Blesa, Can. J. Chem. 68 (1990) 728.[42] B.C. Faust, M.R. Hoffmann, D.W. Bahnemann, J. Phys.
Chem. 93 (1989) 6371.[43] B.C. Faust, M.R. Hoffmann, Environ. Sci. Technol. 20 (1986)
943.[44] Y. Sun, J.J. Pignatello, Environ. Sci. Technol. 27 (1993) 304.[45] R.G. Zepp, B.C. Faust, J. Hoigné, Environ. Sci. Technol. 26
(1992) 313.[46] Y. Okamoto, Y. Kobayashi, Y. Teraoka, S. Shobu, S. Kagawa,
J. Chem. Soc., Faraday Trans. 93 (15) (1997) 2561.[47] A.L. Liesebigler, L. Guangquan, J.T. Yates Jr., Chem. Rev.
95 (1995) 735.[48] A. González-Elipre, G. Munuera, J. Soria, J. Chem. Soc.,
Faraday Trans. 1 (75) (1979) 749.[49] J.A. Crayston, M.J. Almond, A.J. Downs, M. Poliakoff, J.J.
Turner, Inorg. Chem. 23 (1984) 3051.[50] M.J. Almond, J.A. Crayton, A.J. Downs, M. Poliakoff, J.J.
Turner, Inorg. Chem. 25 (1986) 19.[51] M.J. Almond, A.J. Downs, J. Chem. Soc., Dalton Trans.
(1994) 809.[52] M.J. Almond, Chem. Soc. Rev., 1994, p. 309.[53] F.A. Cotton, G. Wilkinson, Quı́mica Inorgánica Avanzada,
Limusa, 1986.[54] H.J.H. Fenton, J. Chem. Soc. 65 (1984) 899.[55] Y. Zuo, J. Hoigné, Environ. Sci. Technol. 26 (1992) 1014.[56] D.L. Sedlak, J. Hoigne, J. Am. Environ. 27 (1993) 2173.[57] Y. Zuo, J. Hoigné, J. Am. Environ. 28 (1994) 1231.[58] C.B. Faust, J. Hoigne, J. Am. Environ. 24 (1990) 79.
Related Documents


![Fenton-like degradation of Bisphenol A catalyzed by ...iranarze.ir/wp-content/uploads/2016/10/E1136.pdf · [12]. Fe-ZSM-5 [13], Fe(II)/meso-Al2O3 [14], Fe(III) oxide/carbon ... Corresponding](https://static.cupdf.com/doc/110x72/5adf78cc7f8b9a1c248c0f16/fenton-like-degradation-of-bisphenol-a-catalyzed-by-12-fe-zsm-5-13-feiimeso-al2o3.jpg)


