Photo: PBIC Image Library Bike Share Feasibility Study Environmental Assessment La Crosse, Wisconsin Jack Zabrowski, Matthew Christen, Jill Miller

Welcome message from author
This document is posted to help you gain knowledge. Please leave a comment to let me know what you think about it! Share it to your friends and learn new things together.
Transcript
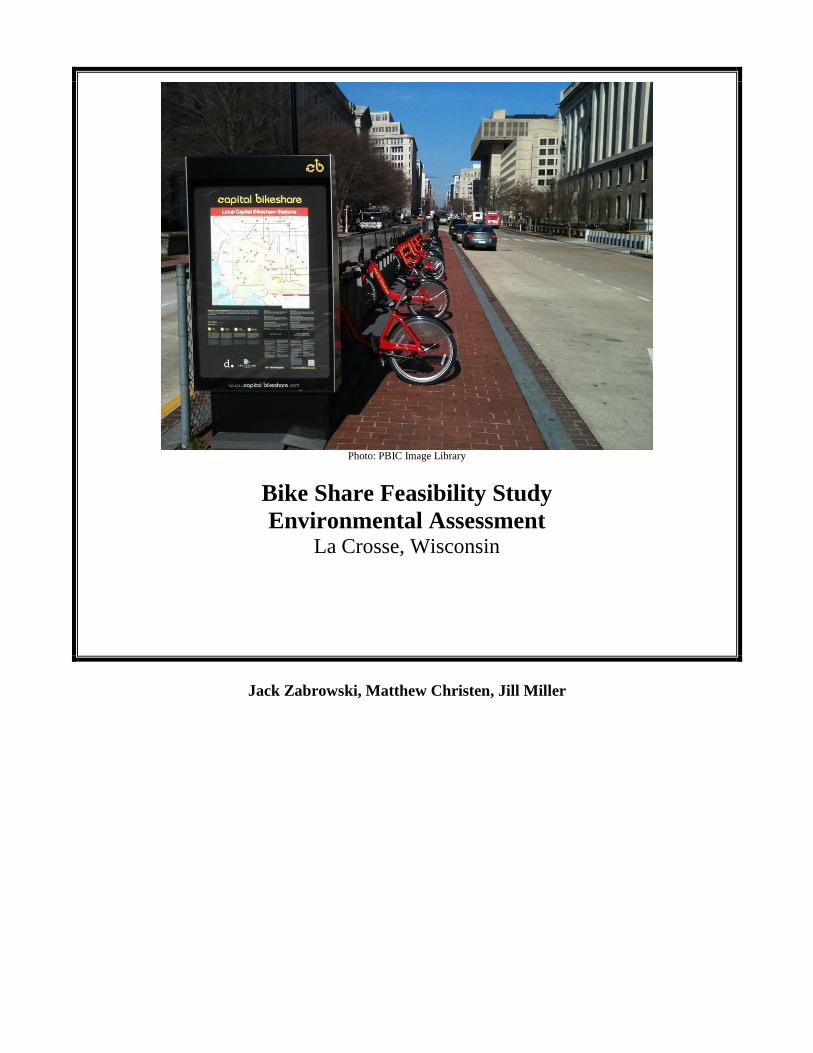
Photo: PBIC Image Library
Bike Share Feasibility Study
Environmental Assessment
La Crosse, Wisconsin
Jack Zabrowski, Matthew Christen, Jill Miller
2
Acknowledgements
Bike-ability Field survey:
Atticus Jaramillo
Carolyn Dvorak
Chuck Lee
Erica Black
Jacob Sciammas
Lewis Kuhlman
Linda Lee
Matthew Christen
Tim Acklin
Literature Review:
Carolyn Dvorak
Dennis Rodenberg
Erica Black
Jill Miller
Lewis Kuhlman
Matthew Christen
Financial Contributors:
City of La Crosse
Gundersen Health System
La Crosse Area Planning Commission
Logistics Health Incorporated
Three Sixty Real Estate Solutions
Mayo Clinic Health System-La Crosse
YMCA of La Crosse
Pioneering Healthy Communities
Move More Committee:
Brenda Maxwell
Brenda Rooney
Carolyn Dvorak
Dennis Rodenberg
Erica Black
Joyce Mlsna
Linda Larson
Matthew Christen
Rebecca Lakowske
Susan Lundsten
Virginia Loehr
Heat Map creation and GIS analysis:
Jason Buck City of La Crosse
Bicycle and Pedestrian Crash Map:
T.Y. Lin International
City of La Crosse Planning Department:
Amy Peterson
Jacob Larow
Larry Kirch
Lewis Kuhlman
Nathan Patros
Tim Acklin
3
Bike Share Feasibility Study
Table of Contents
Page
Executive Summary ………………………………………………………………………………… 3
Introduction ...……….……………………………………………………………………………… 4
Methods …….……………………………………………………………………………………… 5
Results ……………………………………………………………………………………………… 8
Discussion ………………………………………………………………………………………….. 16
Conclusion and Recommendations ………………………………………………………………… 21
Annotated Bibliography ……………………………………………………………………………. 22
Case Studies ………………………………………………………………………………………… 24
Appendices …………………………………………………………………………………………. 27
Executive Summary
As successful bike sharing programs explode all over the world in cities such as Paris, New York, Minneapolis
and Chicago, the question emerges, “Can these models work on a smaller scale with less population density?”
The purpose of this study is to assess if the physical environment of La Crosse, Wisconsin can support and grow
a bike share program. A two-pronged approach to environmental assessment was employed; field studies and
the creation of a heat map using a weighted raster analysis of census tract data. Field studies indicate an
average of 3.14 or Moderately High, or C Level of Service on the Federal Highway Administration Bicycle
Compatibility Index. Average scores from volunteer bike-ability surveys were 3.435 Satisfactory, on a 1-poor
and 5-excellent scale. Arterial roads through the city, which were identified by survey respondents as barriers
to physical activity and mobility will need to be overcome and minimized in the future.
The heat map clearly demonstrates that the University of Wisconsin-La Crosse Campus and downtown La
Crosse score highly in the indicators for bicycle sharing success with a high concentration of: bicycle
infrastructure, mixed use development, and contiguously high scoring census tracts. This corridor should be the
first implementation area or Phase 1. Phase 1 has a Western border at the Mississippi River, Northern-La
Crosse St., Southern-Cass St., and Eastern-Losey Blvd. Future phases 2, 3 and 4 will build on Phase 1 success.
La Crosse has an adequate environment: bicycle infrastructure and geo-demographic density to support
bike share, but to succeed and grow in the future, infrastructure improvements will be necessary before
implementation. Infrastructure improvements should be prioritized in the Phase 1 area.

4
Introduction
As successful bike sharing programs explode all over the world in cities such as Paris, New York, Minneapolis,
and Chicago, the question emerges, “Can these models work on a smaller scale with less population density?”
La Crosse, Wisconsin is a unique community in that it has areas of high density mixed use development akin to
larger population centers. This type of development lends itself to bike sharing. La Crosse presents many
opportunities for travel by bicycle: a nearly intact turn of the century traffic grid, relatively flat topography
around trip generators, and compact mixed use development. The bicycle is an optimal tool for traveling within
a system with these features. A crucial, but sometimes overlooked, component of a successful bike share is a
safe, robust, and connected bicycle infrastructure network with few barriers to movement. These barriers could
be La Crosse's greatest challenge to successful a bike share program.
La Crosse on the Rise
La Crosse has recently been voted number 11 in Outside Magazine’s “16 Greatest Places to Live in America”
(Outside Magazine September 2014). In 2012, La Crosse achieved a Silver Designation from the League of
American Bicyclists Bicycle Friendly Community Program. La Crosse has realized a seven fold increase in
bicycle and pedestrian infrastructure from 2010-2013. Recent bike counts have demonstrated a doubling or
100% increase in the number of people riding bicycles in the city of La Crosse6.
What is Bike Sharing?
Bike Sharing is an innovative transportation program which is ideal for short distance point to point trips.4
Users can pick up a bicycle at self service stations throughout a network and return it to any other station.
Many payment types and plans are available, options range from annual memberships to hourly, daily or weekly
rental.
Why Bike Sharing?
Bike sharing provides another low cost transportation option to your community. Survey results show that 93%
of La Crosse respondents stated it was (very important 66% to somewhat important 27%) to have transportation
options other than an automobile. Benefits of bike share can be separated into two categories; benefits to the
city/region and benefits to the user/society.13
Transportation benefits to the city/region include the following:13
● Does not create pollution, or contribute to global warming ● Does not add to congestion ● Is less expensive to purchase and maintain than other modes (rail, bus, auto) ● Requires less infrastructure investment than other modes ● Allows low-cost expansion of existing transportation services ● Promotes greater transit use through modal integration
Transportation benefits to the user/society include the following:13
● Provides low-cost, on-demand transportation (typically offered 24 hours a day, seven days a week) ● Serves as the “final mile” of commute ● More bicycles on the road increases the safety of other cyclists ● Offers physical exercise for the user ● Makes a city more livable and neighborly
5
Methods
A two-pronged approach to environmental assessment was employed to predict the probability of successful
bike share in La Crosse; field studies and the creation of a heat map using a weighted raster analysis of census
tract data.
Field Study
Lack of bicycle infrastructure and dense mixed-use development were cited in previous studies2
as reasons for
delaying the introduction of bike share. Existing on-road bicycle infrastructure was assessed using two
methods; the Federal Highway Administration’s Bicycle Compatibility Index7 tool and bicycle surveys by
volunteers.
Heat Map
In order to determine where bike share would have the highest probability of success, nine indicators were
compiled by Jason Buck of City of La Crosse Information Services Department staff for the metro area:
Population Density, Non-Institutional Group Population, Job Density, Retail Job Density, Trip Generators,
Parks, Transit Stations (Grand River Station and Amtrak), Existing Bike Infrastructure, PAT Stops (Bus
stations).
Below are the values used to create a weighted raster analysis “heat map.” These indicators are similar to
values used in the Feasibility Study for a Pittsburgh Bike Share1. Our map differs in that elevation was
eliminated due to lack of topography in the city of La Crosse and train stations and the Grand River Station
were altered to reflect a value similar but slightly more than other transit stations.
● Population Density – 18.53%
● Non-Institutional Group Population – 10.83%
● Job Density – 9.55%
● Retail Job Density – 9.55%
● Trip Generators – 9.55%
● Parks – 4.42%
● Transit Stations (Grand River Station and Amtrak) – 13.33%
● Existing Bike Infrastructure – 12.12%
● PAT Stops (Bus stations) – 12.12%
“Hot Spots” or pockets where all these indicators aligned to predict success were identified using GIS analysis
tools in ArcGIS. These hot spots indicate where environmental conditions are most favorable for bike sharing
success.1 Connections of hotspots through improved bicycle infrastructure would help bike share to succeed and
expand throughout the community.
Field Study Methods
In order to verify adequate bicycle infrastructure existed in La Crosse, the bicycle compatibility of the proposed
first phase was assessed using two methods: a bike-ability survey by groups of volunteer bicyclists and two
person field survey using the Federal Highway Administration’s Bicycle Compatibility Index (BCI).
6
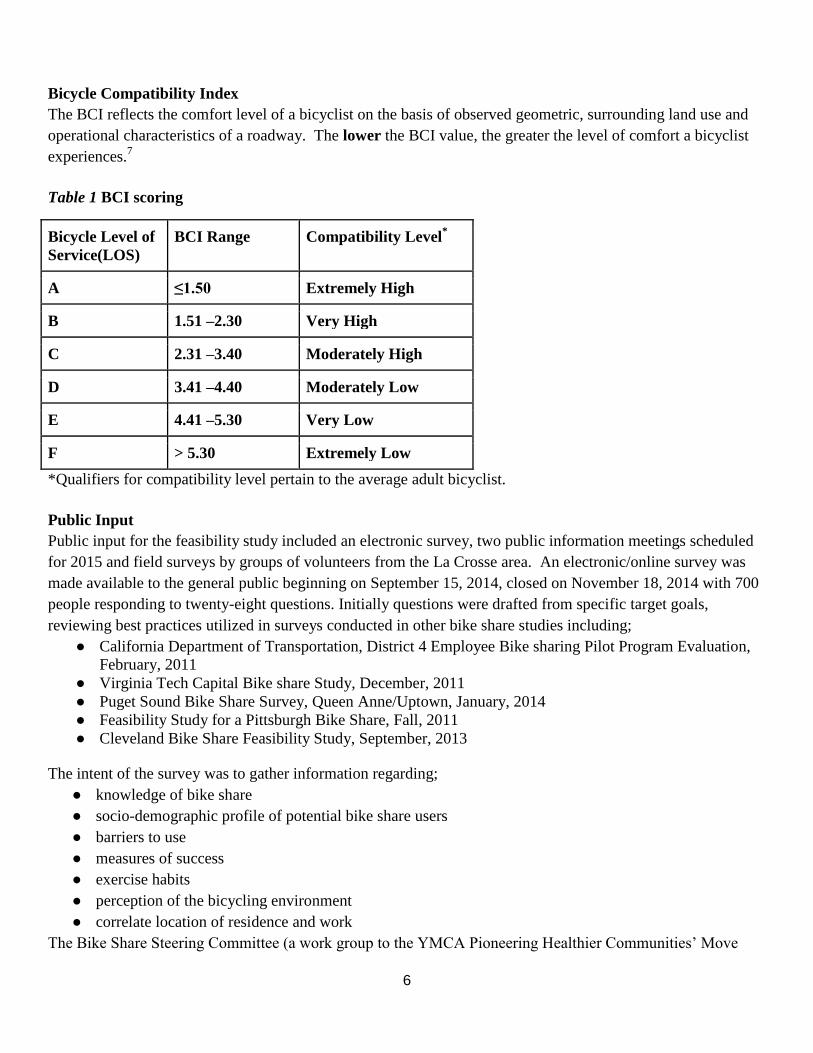
Bicycle Compatibility Index
The BCI reflects the comfort level of a bicyclist on the basis of observed geometric, surrounding land use and
operational characteristics of a roadway. The lower the BCI value, the greater the level of comfort a bicyclist
experiences.7
Table 1 BCI scoring
Bicycle Level of
Service(LOS)
BCI Range Compatibility Level*
A ≤1.50 Extremely High
B 1.51 –2.30 Very High
C 2.31 –3.40 Moderately High
D 3.41 –4.40 Moderately Low
E 4.41 –5.30 Very Low
F > 5.30 Extremely Low
*Qualifiers for compatibility level pertain to the average adult bicyclist.
Public Input
Public input for the feasibility study included an electronic survey, two public information meetings scheduled
for 2015 and field surveys by groups of volunteers from the La Crosse area. An electronic/online survey was
made available to the general public beginning on September 15, 2014, closed on November 18, 2014 with 700
people responding to twenty-eight questions. Initially questions were drafted from specific target goals,
reviewing best practices utilized in surveys conducted in other bike share studies including;
● California Department of Transportation, District 4 Employee Bike sharing Pilot Program Evaluation,
February, 2011 ● Virginia Tech Capital Bike share Study, December, 2011 ● Puget Sound Bike Share Survey, Queen Anne/Uptown, January, 2014 ● Feasibility Study for a Pittsburgh Bike Share, Fall, 2011 ● Cleveland Bike Share Feasibility Study, September, 2013
The intent of the survey was to gather information regarding;
● knowledge of bike share
● socio-demographic profile of potential bike share users
● barriers to use
● measures of success
● exercise habits
● perception of the bicycling environment
● correlate location of residence and work
The Bike Share Steering Committee (a work group to the YMCA Pioneering Healthier Communities’ Move

7
More Committee and community stakeholders), reviewed and edited a draft survey. Committee members sent
out emails and posted information to existing websites to direct people to the survey. The YMCA posted an
invitation on their website. Local businesses involved employees on a volunteer basis. The administrators of
the survey took steps to maintain the anonymity and confidentiality of participants. Data used will not be linked
to any information that could personally identify participants. No compensation of any kind is provided or
inferred to survey subject/participants. All participants had freedom to withdraw from answering questions in
part, or in whole, during the course of the survey. All participants randomly chose to complete all or part of the
survey.

8
Figure1. Bike Share Heat Map

9
Results
The heat map clearly demonstrates that the University of Wisconsin-La Crosse Campus scores highly in the
indicators for bicycle sharing success, with “spokes” radiating north to “Old Town” La Crosse and West to
downtown La Crosse. Given the concentration of; bicycle infrastructure, mixed use development, contiguously
high scoring tracts and relatively small geographic area. Phase 1 has a Western border at the Mississippi River,
Northern-La Crosse St., Southern-Cass St. and Eastern-Losey Blvd/Hwy 16. This corridor, as illustrated in
light blue on Figure 2, should be the epicenter of the initial phase of bike share in La Crosse.
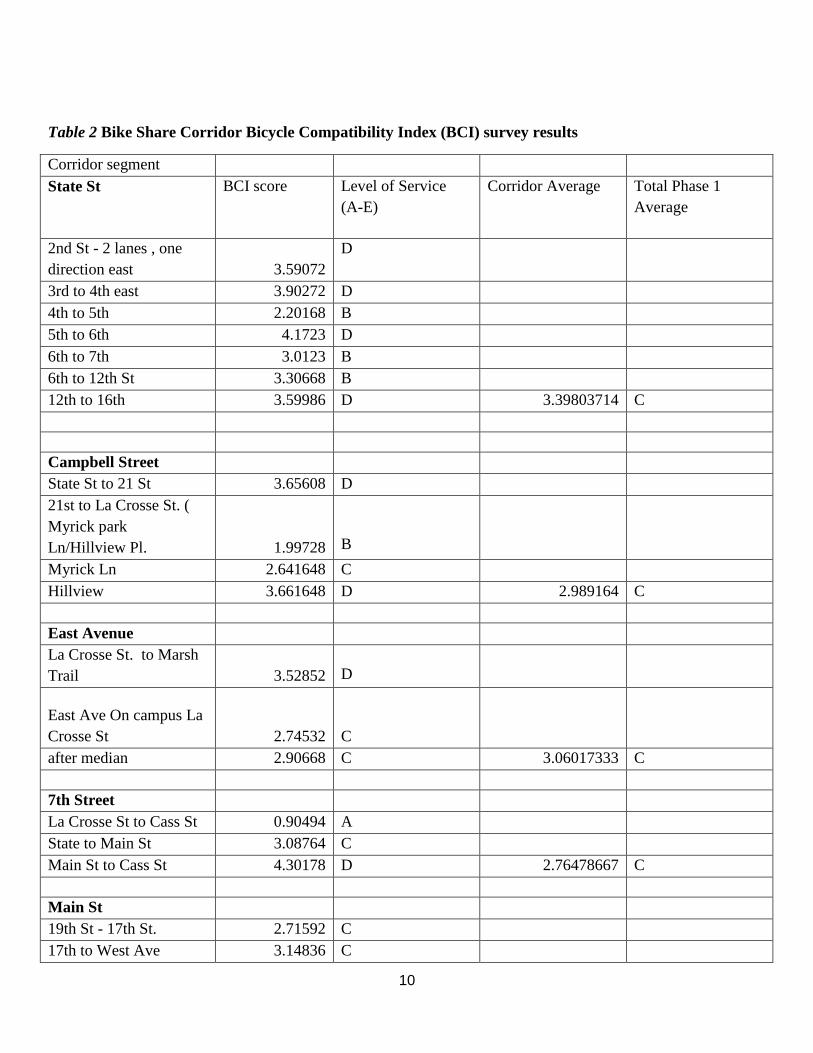
Bicycle Compatibility Assessment
Specific corridors connecting Phase 1 hot spots were examined using the BCI and community volunteer field
surveys to assess their ability to support bike share. The block by block score is given under BCI score, the
corridor average is the score of the entire segment (e.g. State St 2nd
st-16th
St). The corridor averages were
tabulated to conclude a Total Average for all of Phase 1. The BCI yielded a 3.137 average score for the entire
Phase 1 area on a 1 to 5 scale, the lower the BCI value the greater the level of comfort a bicyclist experiences.7
10
Table 2 Bike Share Corridor Bicycle Compatibility Index (BCI) survey results
Corridor segment
State St BCI score Level of Service
(A-E)
Corridor Average Total Phase 1
Average
2nd St - 2 lanes , one
direction east 3.59072
D
3rd to 4th east 3.90272 D
4th to 5th 2.20168 B
5th to 6th 4.1723 D
6th to 7th 3.0123 B
6th to 12th St 3.30668 B
12th to 16th 3.59986 D 3.39803714 C
Campbell Street
State St to 21 St 3.65608 D
21st to La Crosse St. (
Myrick park
Ln/Hillview Pl. 1.99728
B
Myrick Ln 2.641648 C
Hillview 3.661648 D 2.989164 C
East Avenue
La Crosse St. to Marsh
Trail 3.52852
D
East Ave On campus La
Crosse St 2.74532
C
after median 2.90668 C 3.06017333 C
7th Street
La Crosse St to Cass St 0.90494 A
State to Main St 3.08764 C
Main St to Cass St 4.30178 D 2.76478667 C
Main St
19th St - 17th St. 2.71592 C
17th to West Ave 3.14836 C

11
West Ave to 7th 3.0776 C
7th to 4th 4.08684 D 3.25718 C
16th
State St - Cass St. 2.77744 C 2.77744 3.13745255
C Moderately
High
Table 3 Bike-ability Volunteer Survey
Corridor Route Origin Terminus n=
1-poor,
2-fair,
3-
satisfactory,
4-good,
5-excellent
Phase 1 average
score
7th St
Downtown to
Gundersen 7th and Cass Gundersen 7 3.14
7th
UW-Western-
Downtown La Crosse St Cass St 7 3.78
Campbell St UW - Marsh
Campbell and
State St Marsh 7 3.28
State St
UW -
Downtown 2nd St 16th 4 3.125
East Ave UW- Marsh Pine St Marsh 7 3.28
Main St
UW –
Downtown* 4th 19th 7 3.71
3.435-Satisfactory
16th St
UW -
Gundersen
16th + State
St Green Bay St 9 3.71
* Phase 1 corridors are in red text
Electronic Survey Results
The depth of information gathered in the survey goes beyond the scope of this study. The information gathered
will serve to guide future planning phases for bike share La Crosse.
● knowledge of bike share
● socio-demographic profile of potential bike share users
● barriers to use
● measures of success
● exercise habits
● perception of the bicycling environment
● correlate location of residence and work
12
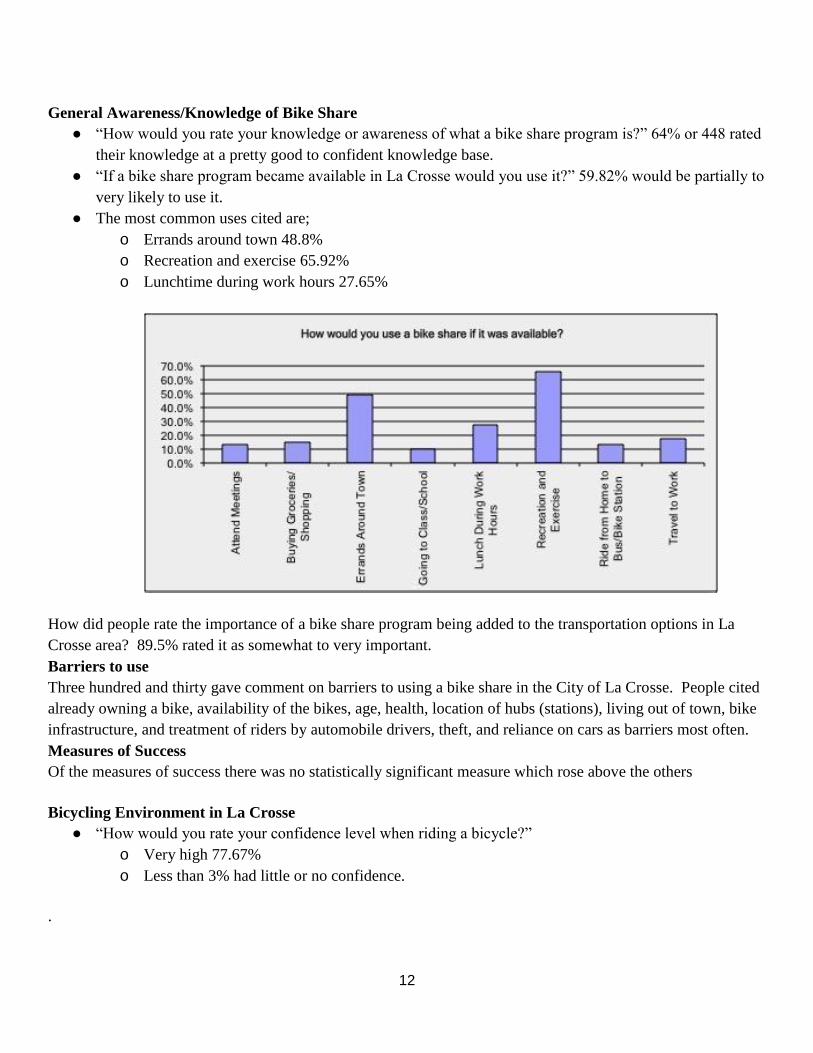
General Awareness/Knowledge of Bike Share
● “How would you rate your knowledge or awareness of what a bike share program is?” 64% or 448 rated
their knowledge at a pretty good to confident knowledge base.
● “If a bike share program became available in La Crosse would you use it?” 59.82% would be partially to
very likely to use it.
● The most common uses cited are;
o Errands around town 48.8%
o Recreation and exercise 65.92%
o Lunchtime during work hours 27.65%
How did people rate the importance of a bike share program being added to the transportation options in La
Crosse area? 89.5% rated it as somewhat to very important.
Barriers to use
Three hundred and thirty gave comment on barriers to using a bike share in the City of La Crosse. People cited
already owning a bike, availability of the bikes, age, health, location of hubs (stations), living out of town, bike
infrastructure, and treatment of riders by automobile drivers, theft, and reliance on cars as barriers most often.
Measures of Success
Of the measures of success there was no statistically significant measure which rose above the others
Bicycling Environment in La Crosse
● “How would you rate your confidence level when riding a bicycle?”
o Very high 77.67%
o Less than 3% had little or no confidence.
.
13
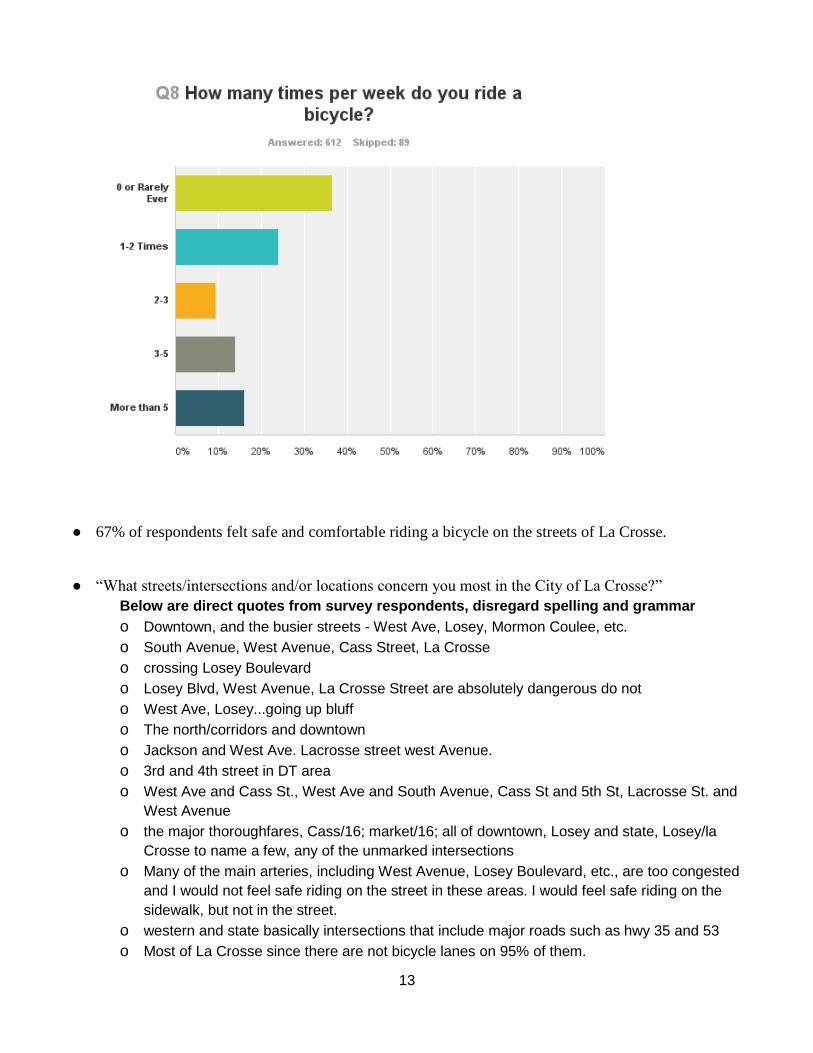
● 67% of respondents felt safe and comfortable riding a bicycle on the streets of La Crosse.
● “What streets/intersections and/or locations concern you most in the City of La Crosse?”
Below are direct quotes from survey respondents, disregard spelling and grammar
o Downtown, and the busier streets - West Ave, Losey, Mormon Coulee, etc.
o South Avenue, West Avenue, Cass Street, La Crosse
o crossing Losey Boulevard
o Losey Blvd, West Avenue, La Crosse Street are absolutely dangerous do not
o West Ave, Losey...going up bluff
o The north/corridors and downtown
o Jackson and West Ave. Lacrosse street west Avenue.
o 3rd and 4th street in DT area
o West Ave and Cass St., West Ave and South Avenue, Cass St and 5th St, Lacrosse St. and
West Avenue
o the major thoroughfares, Cass/16; market/16; all of downtown, Losey and state, Losey/la
Crosse to name a few, any of the unmarked intersections
o Many of the main arteries, including West Avenue, Losey Boulevard, etc., are too congested
and I would not feel safe riding on the street in these areas. I would feel safe riding on the
sidewalk, but not in the street.
o western and state basically intersections that include major roads such as hwy 35 and 53
o Most of La Crosse since there are not bicycle lanes on 95% of them.

14
o West Avenue, 3rd Street, Hwy 16, Hwy 35, Hwy 53 La Crosse Street, Rose Street, George
Street, major intersections
● “Would you ride a bicycle more if there were safer places to ride?”
o 74.17% said yes
● Which statement best describes riding a bicycle in the city of La Crosse?
o Riding a bike in La Crosse is too dangerous ~ 6.75%
o It is only safe to ride on bike paths or trails ~ 8.60%
o Some streets are ok, but I don’t feel safe crossing all the busy/multi lane roads (West Ave, Losey
Blvd., 3rd
St., 4th
St., etc.) ~ 47%
o If someone is cautious and confident around traffic, you can get where you want to go ~ 35%
o La Crosse is a Bicyclist’s paradise ~ 2.19%
Demographics
The remaining 15 questions defined the demographics of the survey participants.
● 63% were female and 37% were male.
● median age of the sample group was 30-39, with 67% overall between the ages of 30-59
● Income $75,000 and $99,999
● 90% owning a bike and 86% owning a car, 41% also owned a truck or SUV.
● Exercise habits; 2 to 4 days a week 41.83%, with 5-7 days a week 35.50%
● 8% full or part time students of which 88% commuted and lived off campus.
● Location of work
o 74% La Crosse
15
o 10% in Onalaska
o 10% other areas
● Location of residence
o 63% in La Crosse
o 15.34% in Onalaska
o 6.34% in Shelby
o 4.91% in Holmen.
● “I normally get to work and/or school which of the following ways?”
o 70% of respondents drive alone to work
o 18.62% bicycle
o 3.55% walk
o 3.54% car pool
o less than 1% take the MTU/bus
● “How often do you ride the MTU or city bus?”
o 82.84% never
o 13.34% sometimes
o 1.91% very often
● “In your opinion how important is it to have options other than an automobile to get around?”
o 66% very important
o 26.46% somewhat important
Overall 92.43% stating it was at least somewhat important to very important.
Challenges:
The number of single occupant vehicles coming into the city for working purposes.
High bike ownership with low bike “ridership” rarely riding for transportation, exercise, or recreation.
Perceptions about obstacles to using a bike share.
Physical barriers of crossing busy streets identified by respondents.
Improving bike lanes and protected bike lanes within arterial or convenient travel routes.
How likely people would be to use the bike share.
Perception of an unsafe environment to ride a bicycle, high number of people who stated “they would
ride more if safer places to ride existed.”
Opportunities:
92% of respondents want options other than an automobile to get around.
The overall confidence level in bicycle riding of respondents.
The use of a bike share for errands, lunch, and recreation/exercise is a base to build off of for initial use
and program development.
Overall knowledge base of respondents about a bike share program.
Broad range of income earners demonstrated interest in bike share.
High number of people who would ride more if safer places to ride were available.
16
The majority of respondents feel riding a bicycle in the City of La Crosse is ok, and you can get to
where you want to go if you are cautious and confident around traffic.
Discussion
Heat Map
When compared to other cities’ bike share studies such as Pittsburgh1 and Seattle
3, La Crosse has a comparable
environmental mix to support successful bike share as evidenced in the heat map; highly scoring contiguous
tracts with dense mixed use development in a geographically small area of less than 2 square miles. La
Crosse’s unique geography has dictated development which is beneficial for bike sharing. We are
recommending a phased approach to bike share implementation. Phase 1 has the highest potential for success
(Fig.2), has a high density of college students age 18-34 who are heavy users of bike share4. This population
may help to “buoy” times of low demand from other user groups. A geographic square is the most beneficial
shape for bike sharing, but due to barriers to the North Phase 1 takes on a rectangular shape.
17
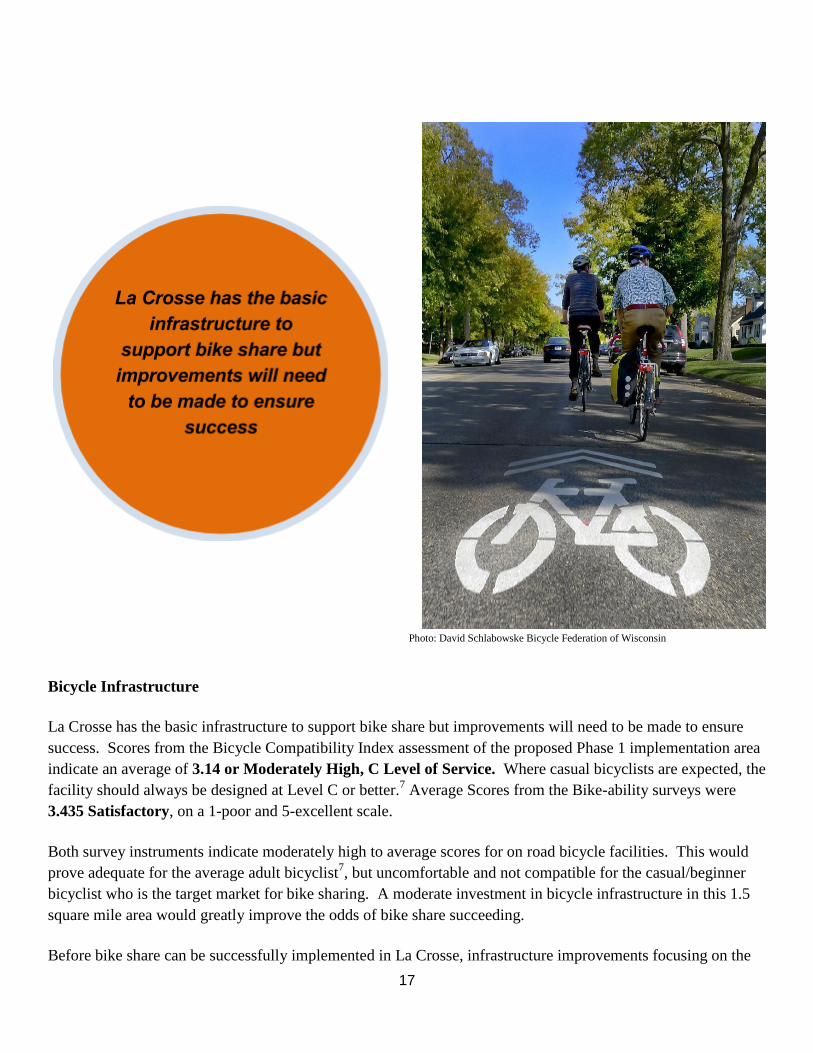
Photo: David Schlabowske Bicycle Federation of Wisconsin
Bicycle Infrastructure
La Crosse has the basic infrastructure to support bike share but improvements will need to be made to ensure
success. Scores from the Bicycle Compatibility Index assessment of the proposed Phase 1 implementation area
indicate an average of 3.14 or Moderately High, C Level of Service. Where casual bicyclists are expected, the
facility should always be designed at Level C or better.7 Average Scores from the Bike-ability surveys were
3.435 Satisfactory, on a 1-poor and 5-excellent scale.
Both survey instruments indicate moderately high to average scores for on road bicycle facilities. This would
prove adequate for the average adult bicyclist7, but uncomfortable and not compatible for the casual/beginner
bicyclist who is the target market for bike sharing. A moderate investment in bicycle infrastructure in this 1.5
square mile area would greatly improve the odds of bike share succeeding.
Before bike share can be successfully implemented in La Crosse, infrastructure improvements focusing on the
18
Phase 1 (Downtown – University of Wisconsin-La Crosse) Implementation area should be completed. More
specifically: (recommendations taken from La Crosse Bicycle and Pedestrian Master Plan)11
1. Bicycle boulevards on 17th
St and King St.
2. Sharrows on Cass St
3. Bike lanes on 2nd
, 3rd
and 4th
and Cross St, Campbell St.
4. Continue bike lane on La Crosse St West Ave to 4th
St.
5. Bike Lane on King St from 7th
St West to Front St.
6. Repaint sharrows on Main, 16th
, 7th
and Pine
Barriers to Mobility and Physical Activity
The man-made or built environment around us can promote or discourage physical activity and mobility. When
survey respondents were asked to choose a statement that best describes bicycling in La Crosse 47% of
respondents (n=588) chose the below statement.
“Some streets are ok, but I don’t feel safe crossing all the busy/multi lane roads (West Ave, Losey Blvd, 3rd,
4th St, etc...) ~ survey respondent
Most people can safely navigate the City of La Crosse by bicycle until they reach one of the barriers that exist:
high volume (>15,000 AADT- average annual daily traffic), high speed arterial roads which traverse through
numerous densely populated neighborhoods. These arterials (see map below) injure and kill Vulnerable Users:
children, seniors, people using wheelchairs, bicyclists and pedestrians at a much higher rate than other roads.10
The following list of arterial roads represent almost all of the crashes in La Crosse.11
These same roads were repetitively identified in our survey as areas of concern when riding a bicycle in La
Crosse. They represent barriers to physical activity and mobility which must be overcome in order for bike
share to succeed in La Crosse.
● Losey Boulevard/Highway 16
● West Avenue/ Lang Drive/Highway 35
● 3rd
Street/Hwy 53
● 4th
Street/South Avenue/Hwy 14
● Jackson St/Highway 33
● La Crosse St.
*This is a list of frequently identified roads/intersections from our survey which were areas of concern.

19
Figure 2 La Crosse Crash Map

20
Figure 3 Phases of Implementation
21
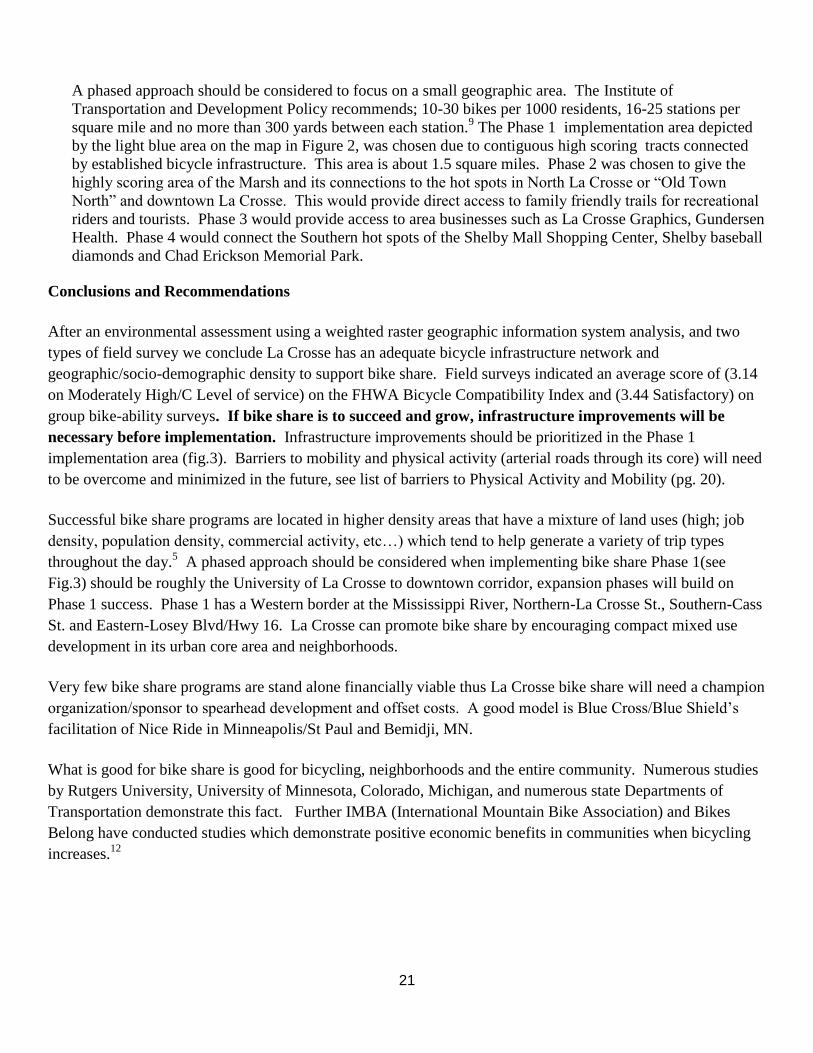
A phased approach should be considered to focus on a small geographic area. The Institute of
Transportation and Development Policy recommends; 10-30 bikes per 1000 residents, 16-25 stations per
square mile and no more than 300 yards between each station.9 The Phase 1 implementation area depicted
by the light blue area on the map in Figure 2, was chosen due to contiguous high scoring tracts connected
by established bicycle infrastructure. This area is about 1.5 square miles. Phase 2 was chosen to give the
highly scoring area of the Marsh and its connections to the hot spots in North La Crosse or “Old Town
North” and downtown La Crosse. This would provide direct access to family friendly trails for recreational
riders and tourists. Phase 3 would provide access to area businesses such as La Crosse Graphics, Gundersen
Health. Phase 4 would connect the Southern hot spots of the Shelby Mall Shopping Center, Shelby baseball
diamonds and Chad Erickson Memorial Park.
Conclusions and Recommendations
After an environmental assessment using a weighted raster geographic information system analysis, and two
types of field survey we conclude La Crosse has an adequate bicycle infrastructure network and
geographic/socio-demographic density to support bike share. Field surveys indicated an average score of (3.14
on Moderately High/C Level of service) on the FHWA Bicycle Compatibility Index and (3.44 Satisfactory) on
group bike-ability surveys. If bike share is to succeed and grow, infrastructure improvements will be
necessary before implementation. Infrastructure improvements should be prioritized in the Phase 1
implementation area (fig.3). Barriers to mobility and physical activity (arterial roads through its core) will need
to be overcome and minimized in the future, see list of barriers to Physical Activity and Mobility (pg. 20).
Successful bike share programs are located in higher density areas that have a mixture of land uses (high; job
density, population density, commercial activity, etc…) which tend to help generate a variety of trip types
throughout the day.5
A phased approach should be considered when implementing bike share Phase 1(see
Fig.3) should be roughly the University of La Crosse to downtown corridor, expansion phases will build on
Phase 1 success. Phase 1 has a Western border at the Mississippi River, Northern-La Crosse St., Southern-Cass
St. and Eastern-Losey Blvd/Hwy 16. La Crosse can promote bike share by encouraging compact mixed use
development in its urban core area and neighborhoods.
Very few bike share programs are stand alone financially viable thus La Crosse bike share will need a champion
organization/sponsor to spearhead development and offset costs. A good model is Blue Cross/Blue Shield’s
facilitation of Nice Ride in Minneapolis/St Paul and Bemidji, MN.
What is good for bike share is good for bicycling, neighborhoods and the entire community. Numerous studies
by Rutgers University, University of Minnesota, Colorado, Michigan, and numerous state Departments of
Transportation demonstrate this fact. Further IMBA (International Mountain Bike Association) and Bikes
Belong have conducted studies which demonstrate positive economic benefits in communities when bicycling
increases.12
22
Annotated Bibliography
Feasibility Studies:
1. Heinz Synthesis Team; Clayton S., Farber C., Green S., Kitzerow E., Markfield M., Song I., White
C., Yang Y., Zavacky G. (2011) Feasibility Study for Pittsburgh Bike Share
The report concludes that Pittsburgh meets most of the general criteria that have been indicative of the success
of bike share systems in other cities. The populations most likely to take part in bike sharing are in place and
growing, transportation habits of people in Pittsburgh align with those of people in cities with successful
programs, and the area being considered is an appropriate starting point. Demand and cost estimates predict
that, upon the acquisition of capital investment, a Pittsburgh bike‐sharing system can be financially sustainable,
as revenues from user fees will exceed annual operating costs under some, but not all, likely
scenarios. Necessary choices that decision makers will need to make will include the management structure of
the program, the source of start‐up capital and the strategies to gain non‐user generated revenues such as
advertisers or sponsors. In the past ten years, the overall population in the target neighborhoods grew, with
significant gains in the 18‐34 age group, a group that has high potential for bike share use. Studies conducted in
France, Denmark and Norway indicates that potential bike share customers are likely to be younger individuals
in their twenties and thirties.
2. Nelson Niggard Consulting Associates Incorporated Rochester Bike Share Feasibility Study and
Business Plan. Rochester, MN: Rochester Olmsted Planning Department.
Rochester the third largest city in Minnesota wanted to know if it could support a station based system similar
to Nice Ride currently operating in Minneapolis/ St. Paul. Significant barriers were found; low residential
density and a safe bicycle infrastructure network (“a network that traverses a safe environment”). However
“likely financial support from employers and weekday commuters would overcome low residential density and
lack of a transportation network.” Nice Ride Director Bill Dossett said, “To improve viability of a bike share
program in Rochester, the study recommends urban residential development, wayfinding and bikeway
development and increased programming throughout parks and open spaces.” Those conclusions are based on
population density today, Dossett said, but the "DMC(Destination Medical Clinic) team has a vision that is very
different from that."
Rochester’s proposed system would encompass a 1.1-square-mile area in the downtown core and include 23
stations and 243 bicycles, according to a new feasibility study from the Minneapolis-based nonprofit group.
Bemidji Nice Ride Center is mentioned as a possible model for the Rochester system. This variation of Nice
Ride bike share offers low cost long term rentals by the hour, day and week. A Nice Ride Center would cost
$230,000 up front and $150,000 to operate annually.
3. Jennifer Gregerson, Max Hepp-Buchanan, Daniel Rowe, John Vander Sluis, Erica Wygonik,
Michael Xenakis, Professor Ed McCormack Bike-Share Studio Department of Urban Design & Planning
College of Built Environments University of Washington Seattle Bike Share Feasibility Study Web. 13 Dec.
2011.
This study identified and explained in detail the indicators for a successful bike share which were then used to
create a weighted sum raster analysis of the city of La Crosse. This data was then used to create Heat Maps
identifying hot spots of demand. See Appendix A for detailed explanation of these indicators. This report
further examines the feasibility of a bike-share system for Seattle Washington based on demand estimates using
Bike Share modal diversion rates(Krykewycz et al., who used survey data from three existing bike-share
programs in Europe (Lyon, Paris, and Barcelona) to indicate the relative attractiveness of bike-share to the users
of various modes. Once identified, the diversion rates were applied to Seattle travel data. Seattle travel data was

23
provided by the PSRC Travel Demand Model, representing trip production and trip attraction characteristics at
the TAZ level from 2006 base year data. In this manner they had access to the trip-level data necessary, when
combined with diversion rates, to estimate bike share trips for each TAZ. This further analysis and cross
reference were not possible for La Crosse due to lack of historic bicycle and walking trip data collection. There
was significant difficulty in acquiring any Travel Demand model data for the La Crosse area. This report
recommended a square-shaped bike share implementation area opposed to a long, thin rectangle.
General Bike Share
4. Toole Design Group and the Pedestrian and Bicycle Information Center prepared for United
States Department of Transportation and Federal Highway Administration. Bike Sharing in the United
States, September 2012
Toole Design Group explains what bike sharing is and the steps to take to creating a successful bike share in
your community. “Bike sharing is an innovative transportation program, ideal for short distance point-to-point
trips providing users the ability to pick up a bicycle at any self-serve bike station and return it to any bike
station located within the system’s service area.” This study identifies a feasibility study as the first step to
implementing a bike share program They further explains what goals to set for your bike share
program. “Which of the following existing community goals are important to your community?” Promotion of
healthy living, Increasing bicycling visibility, Integration with transit network, Promote financial sustainability,
Increased access for underserved communities.
Demand Estimates
5. Frade, I., & Ribeiro, A. (2014). Bicycle sharing system demands. Procedia Social and Behavioral
Sciences, (111), 518-527.
This article proposed novel methods of estimating demand for bike share other than survey use which was
limited by sample and user group. Coimbra, Portugal external characteristics were assessed to determine
bicycle usage and territorial distribution of bike share. “It is risky and complex to predict number of bicycle
trips and therefore demand in cities where the bicycle is not widely used.” This data further reinforces a
geodemographic analysis of La Crosse.
Infrastructure
6. Zabrowski, J. (2012, September 11). Bike Counts Double in La Crosse. Retrieved September 17, 2014,
from http://wisconsinbikefed.org/2012/09/11/bike-counts-double-in-la-crosse/
This study was part of a grant evaluation, four locations in the La Crosse were examined area where bicycle
infrastructure improvements were to be made. Bikes were counted over a twelve hour period. At all four
locations bike counts increased and the overall count doubled in three years. This proves that if the city of La
Crosse makes even tiny investments in infrastructure, large increases in the number of people riding bikes can
be realized.
7. The Bicycle Compatibility Index: A level of Service Concept (98-095 ed., Vol. FHWA-RD). (1998).
Federal Highway Administration.
24
8. How Hot Spot Analysis Works. Retrieved November 4, 2014, from
http://resources.arcgis.com/en/help/main/10.2/index.html#/How_Hot_Spot_Analysis_Getis_Ord_Gi_works/005
p00000011000000/
9. Gauthier, A., Hughes, C., Kost, C., & Al, E. (n.d.). The Bike Share Planning Guide. Institute for
Transportation Policy and Development.
10. Pedestrian Safety Strategic Plan: Background Report. February 1, 2013 US Department of Transportation-
Federal Highway Administration Retrieved November 10, 2014, from
http://safety.fhwa.dot.gov/ped_bike/pssp/background/psafety.cfm
11. T.Y. LIN International. Fall 2012 The City of La Crosse Bicycle and Pedestrian Mater Plan. Existing
Conditions pg. 1-13
12. Economic Benefits of Bicycle Facilities and Transportation Retrieved November 17, 2014
http://www.peopleforbikes.org/statistics/category/economic-statistics
13. Eric Britton, “Public Bikes in Latin American Cities: Great idea but what next?” (Cuernavaca: World
Streets, July 2, 2009).
Case Studies
Bemidji
Bemidji Nice Ride is not a bike share program like the one operated by Nice Ride in the twin cities. It is a more
tourist friendly system which accommodates long term (hourly - weekly) rentals. Bikes can be rented to anyone
over the age of 16, discounts are offered to Bemidji residents Monday through Thursday. The equipment is
lighter and better equipped for longer recreational rides. Rental season ends in October. Data is forthcoming on
the success of this system. This could be a good option for La Crosse if data from the La Crosse Area Visitors
and Convention Bureau supports a need.
http://bemidji.niceridemn.org/
Madison
Madison B-Cycle is part of a private-public partnership between Trek’s B-Cycle and the City of
Madison. There are 35 B-cycle stations with 350 bikes throughout Madison's downtown
Memberships:
$5 a day
$65 annually
$7.99 a month automatically renewing
Corporate and UW transportation memberships are available.
Usage Fees:
0-30 minutes-free
31-60 minutes = +$2
for each additional 30 minutes = +$5
+ $75 max. daily
Annual and Monthly members get B-card to swipe at dock rather than waiting at kiosk
Metric of Success: Membership jumped from 470 to over 2,000 between 2011 to 2012, an increase in over
25
300%
Best Practices:
● Versatility of staff members; it is important that the techs who are out in the field doing maintenance can
be a smiling face for B-Cycle ● Engaging and interacting with the public and being available for events. ● Partnership with UW which offers a highly reduced memberships to students, staff, and faculty
increased the total membership and engaged a large active portion of the community. ● Support from the City of Madison allows to expedite processes ● With John Burke in Madison, the B-Cycle management is conscientious about the operation and
functionality of the system
Boulder4
BOULDER B-CYCLE Jurisdiction Boulder, Colorado Opened date May 20, 2011
Website boulder.bcycle.com
Service Area: 4.69 sq mi.
Station Density: 3.20 stations per square mile in service area
Bikes (start/current): 110/110
Stations (start/current): 15/15
Docks per station range: 1 to 15
Solar vs. Wired : Solar and wired
Operation: Seasonal (Closed December through March)
Number of members
Annual 1,171 members
Casual 6,200 users
Service Area demographics (per sq. mi); Employment 1,787 jobs Median Household Income $51,767 Housing
Density 2,294 units
Equipment Ownership: Nonprofit owned Operator name: Boulder B-cycle Equipment provider: B-cycle
Business model: Nonprofit owned and operated Funding sources: Sources not specified.
Sponsorships - 22% Grants - 56% Gifts - 10% Membership and usage fees - 12%
City’s denomination(League of American Bicyclists) Platinum
Reported bike thefts 0
Reported bike share crashes 0
Bike facility characteristics: 300+ miles of bike lanes, routes, designated shoulders and paths Membership and
usage fees: $50 annual; $15 - 7 day; $5 -24 hours
No fee first 60 min; $4 for every half-hour thereafter
Spartanburg4
SPARTANBURG B-CYCLE Jurisdiction Spartanburg, SC Opening date July 7, 2011
Website spartanburg.bcycle.com Size

26
Service Area: 1.42 sq mi.
Station Density: 1.41 stations per square mile in service area
Bikes (start/current): 14/14
Stations (start/current): 2/2 Docks per station range: 9 to 11
Solar vs. Wired : Solar and wired
Operation: Year round
Number of members; Annual 127 members, Casual 828 members
Service Area demographics (per sq. mi); Employment 2,513 jobs Median Household Income $24,540 Housing
Density 5,801 units
Equipment Ownership: Non profit owned Operator name: Partners for Active Living
Equipment provider: B-cycle
Business model: Nonprofit owned and managed
Funding sources: Local Grants: City of Spartanburg, Mary Black Foundation, and JM Smith Foundation,
Membership and usage fees
City’s denomination(League of American Bicyclists) Bronze
Reported bike thefts 0
Reported bike share crashes 0
Bike facilities characteristics;
3.6 miles of bike lanes and signed routes; 2.7 miles of sharrows; 24.38 miles of trails; 7 miles of mountain bike
trails; 172 Bike Racks
Membership and usage fees:
$30 annual; $15 - 30 days;$5 - 24 hours; No fee first
60 min; $1 for each additional 30 min
Minneapolis Nice Ride
Saint Paul and Minneapolis
MN Opening date June 10, 2010 Website niceridemn.org Size
Service Area: 33.30 sq mi.
Station Density: 3.30 stations per square mile in service area
Bikes (start/current): 1200/1300
Stations (startt/current): 116/145
Docks per station range: 11 to 39
Solar vs. Wired : Solar
Operation: Seasonal (closed November through March)
Number of members Annual 3,521 members Casual 37,103 subscriptions
Service Area demographics (per sq. mi)
Employment 3,137 jobs Median Household Income $44,011 Housing Density 3,838 units

27
Equipment Ownership: Nonprofit owned Operator name: Nice Ride MN
Equipment provider: PBSC Urban Solutions
Business model: Nonprofit owned and managed
Funding sources: Federal: FHWA funds through local program,
Private: Blue Cross-Blue Shield, other private/nonprofit investors, and station sponsorships Membership and
usage fees
City’s denomination (League of American Bicyclists) Gold
Reported bike thefts 0
Reported bike share crashes 2
Bike facilities characteristics; 40 miles on street bike lanes when program started
and 80 miles by the end of the year
Membership and usage fees: $65 annual/ $55 student; $30 30 days; $5 24 hours;
No fee first 30Min; $1.50 - 30-60 min; $4.50 60-90 min; $6 for every half-hour thereafter

28
Appendix
A. Indicators – This appendix taken verbatim from the Seattle Bike Share Feasibility Study3
to explain
each one of the indicators and how they have been historically used to determine bike share’s probability of
success, which were used to create the La Crosse’ Heat map.
Jennifer Gregerson, Max Hepp-Buchanan, Daniel Rowe, John Vander Sluis, Erica Wygonik, Michael
Xenakis, Professor Ed McCormack Bike-Share Studio Department of Urban Design & Planning College
of Built Environments University of Washington Seattle Bike Share Feasibility Study Web. 13 Dec. 2011.
Residential Population Density
Residential density supports bike-share demand by providing a pool of potential users. Even the simplest bike-
share analyses have included this indicator. Higher density improves accessibility, which reduces travel
distances and makes non-motorized travel more feasible. Residential density also indicates the number of off-
peak trips that might be taken. In particular, personal business and social/recreational trips can be estimated on
the basis of residential population density. Off-peak use increases demand for a bike-share system through the
day, with the added benefit of helping to balance bicycle inventories across the city. Higher population densities
also correlate with less automobile dependence and higher use of alternative transportation choices.
Non-Institutionalized Group Quarter Population
Density (University Housing)
University housing was included with general residential population density, but we also chose to include it as a
second factor to increase its weight as an indicator. Student populations are a likely market for bike sharing
because of their average age and large transit mode share. In addition, the structure is in place for education
about bike-share and transportation choices because students regularly use the same spaces, and colleges
already have systems in place to market programs and share information. These marketing systems are similar
to Commute Trip Reduction companies, discussed in further detail below. This indicator captured housing at the
University of Washington, Seattle Pacific University, and Seattle University. Any group housing, whether on
campus or not, was also included. It did not include institutionalized or incarcerated housing. While college
students’ ages vary, 76 percent of students are between 18 and 29. According to surveys, university students fit
the profile of bike-share users, who are most likely to be “18-34 years in age [with a] high level of
education.”25 This makes university housing density a good indicator because university students offer a great
market for new bike-share users. Another factor is that at Seattle’s universities, transit mode-share is high,
meaning that a large number of the population ends their trips with the last mile not accommodated by transit.
These students are potential users of bike-share.
Job Density
At a basic level, job density measurements indicate where people are during the day. As with most
transportation infrastructure, higher density yields greater efficiency in service provision. According to surveys,
university students fit the profile of bike share users, who are most likely to be “18-34 years in age [with a] high

29
level of education.” demand analysis
Employment Density
Measures the intensity of morning commute attractors and midday trip origins. Previous research has indicated
that employment density is one of the primary predictors of bicycle use. For example, Frank and Pivo found that
job density has a greater impact on commute mode choice than residential density, particularly when workplace
density reaches 50 to 75 employees per acre.
Retail Job Density
Retail density was included in the demand analysis because of its function as a trip attractor. In addition to
being a way for commuters to travel “the last mile” from their transit endpoint to their employer’s door, bike-
sharing has been envisioned as a way for users to complete their errands before, during, and after the workday.
Therefore, the presence of dense retail should provide trip destinations for bike-share users who live or work
nearby. When analyzed in conjunction with population density and general employment density, this indicator
helps show land use mixing, which “tends to reduce travel distances, and allows more trips to be made by
walking and cycling…Employees who work in mixed-use commercial areas are more likely to commute by
alternative modes.” This was confirmed by Cervero, who found that “having appreciable retail/service activities
within a 1-mile radius of a person’s origin generally encouraged that person to bicycle.” Cervero also reported
that “for every 1,000 retail workers within a half mile of a person’s home, the likelihood a person will bike or
walk to non-work activities goes up by 7 percent.” However, not all retail is created equal; some may generate
a greater number of trips than others. Using the number of establishments or square footage may over-weight
large but low-intensity uses such as furniture warehouse outlets; therefore, we used the number of retail jobs to
measure intensity of retail use.Frank and Pivo found that job density has a greater impact on commute mode
choice than residential density, particularly when workplace density reaches 50 to 75 employees per acre.
Commute Trip Reduction
Commute Trip Reduction (CTR) is a law that mandates larger employers to manage the transportation demands
of their employees. Businesses with more than 100 employees in any one location are required to implement a
CTR plan. The City of Seattle works with over 250 employers with a total of over 55,000 employees, a number
that includes the City itself as a major employer. Participating companies must provide an Employee
Transportation Coordinator for the program, develop a plan to reduce drive-alone commute trips, submit the
plan and an employee survey every two years, and exercise good faith efforts to reduce drive alone commute
trips. This indicator was not included in the Philadelphia feasibility study but was added as an indicator here as
a beneficial feature in Seattle. Transportation demand management programs like CTR use incentives to
encourage use of alternative transportation. The programs do not require employees to change habits, but they
do create the support structure to make those choices easier.
Tourist Attractions
Tourist attractions are destinations for bike-share users. The degree to which the presence of a tourist attraction
affects bike-share ridership will vary on the basis of whether the business model allows short-term
memberships. The Vélib’ program in Paris was specifically designed and priced to support tourist travel. It
allows purchase of daily and weekly memberships in addition to annual memberships. Daily memberships cost
1 Euro (approximately $1.40, or 3 percent of the cost of an annual membership) and weekly memberships cost 5

30
Euros (approximately $6.90, or 17 percent of an annual pass)—in addition to the hourly rate. This allows
tourists to purchase short-term memberships at kiosks with their credit cards. Day passes have been relatively
popular; in its first year Vélib’ generated 198,913 annual subscriptions and 3,683,174 one-day subscriptions.38
Programs being designed in Philadelphia and Minneapolis are also taking this approach. In contrast, the Bicing
program in Barcelona does not offer memberships shorter than one week, and these, like the annual
memberships, are restricted to residents of Spain. This decision was made to avoid draining business from
private tourist-oriented bicycle rental companies.
Parks
Parks are a bike-friendly land use; cyclists are comfortable biking in parks. Parks serve as a destination for both
residents and tourists in Seattle. However, we used a half weight for parks because bike-sharing will likely
serve more work, shopping, and social trips than recreational trips. In fact, experiences in other cities have
indicated that modern bike-share systems are not used for recreational purposes. In Barcelona, 57 percent of
Bicing users made trips for work reasons. Data from Washington, D.C., showed similar results: Smart Bike DC
riders used bike-share primarily for social purposes: 26.2 percent; work: 22.2 percent; and shopping: 20.0
percent.42 A 2007 survey of Paris users showed that 67 percent of weekday riders used bike-share for work
purposes. This emphasis on non-recreational riding means that bike-sharing is less likely to be used inside
parks, though parks do serve as possible destinations. One of the primary goals of a bike-share program is to
encourage non-motorized transportation and increased bicycle use. Although categorizing parks as bike-share
destinations was consistent, our analysis excluded the idea of placing stations within parks, as this would
change the focus of bike sharing to a recreational activity.
Topography
Though the available literature on the effect that urban topography has on rates of cycling is limited, there are a
few main points worth noting that heavily influenced our use of topography as an indicator. A recent study on
the determinants of bicycle mode share for journey to work trips found that hilliness is a very significant
indicator of the proportion of people that cycle to work. Furthermore, ridership is elastic in response to hills,
with a 10 percent increase in the degree of hilliness linked to a 10 to 15 percent reduction in the proportion of
people cycling to work. Tyler Benson, “Public Use Bike Share Feasibility Study: Volume Two: Demand
Analysis,” demand analysis. It is clear from a review of the literature that steep hills can be a major impediment
to cycling. However, this is especially true in the case of bike sharing because the bicycles are typically heavier
than average and utilize fewer gears. In addition, a higher proportion of novice cyclists or occasional riders are
likely to use the system in comparison to regular cyclists or bicycle commuters in the city. Therefore,
topography should be considered very carefully when the potential demand of a program and location of
implementation are analyzed.
Transit Network
Regional and local transit stops have been selected as an indicator because they provide a ready population of
people traveling to destinations. Bike-sharing can provide on-demand “last mile” transportation for these transit
customers, creating a seamless transportation experience. It is likely that bike-sharing will become a part of the
variety of choices available to commuters. In other cities, once bike-sharing has been implemented, many bike-
share trips are trips diverted from transit. However, research has shown that these are likely just segments of a
trip partially completed on transit, where bike-share serves as one more travel choice. In Lyon, more than 50
31
percent of bike-share trips were diverted from transit, but there was very little reduction in the number of transit
passes purchased. These bike-share users “diverted” from transit were likely still using transit and then using
bike-share to complete the last mile of their journey in a more convenient manner. The transit network category
was divided into separate indicators: regional transit and local transit.
Regional Transit
Regional transit was defined as stations or stops serving Amtrak, Washington State Ferries, King County
Ferries, Sound Transit Link light rail, Sound Transit Commuter Rail, Sound Transit Express Bus Service, and
other transit that crosses city lines. People arriving in Seattle via regional transit are ideal customers for bike
sharing. They are heading to a destination within Seattle but likely have an additional segment to complete, the
“last mile.” Bike-sharing can provide a quick and convenient mode to get them there.
Local Transit
Local transit is a separate indicator because trips made by King County Metro local bus service and City of
Seattle South Lake Union Streetcar are typically shorter than trips made by regional transit. Although King
County Metro also provides regional trips, it is the main provider of local transit. New users may be attracted by
the increased travel options that bike-sharing offers, and existing transit users may be retained when they can
quickly move between transit and a bicycle. Some local bus trips have the potential to be highly complimented
by bike sharing on both the origin and destination sides of the trip. Studies have shown that the wait time
between buses or during transfers is perceived to be two to three times longer than the actual time. Any
reduction in perceived wait times will help attract riders. Thus, new users may be attracted by the increased
travel options that bike-sharing offers, and existing transit users may be retained when they can quickly move
between transit and a bicycle. In rare cases, local transit trips may be replaced entirely by bike sharing if the trip
is short enough.
Bicycle Infrastructure
Several studies in the United States have found that the presence of bicycle lanes and paths is correlated with
higher rates of bicycling or willingness to cycle. Few studies, however, provide data on what specific types of
bicycle infrastructure (bicycle lanes, off-street trails, shared-lane markings) will be most effective at
encouraging bicycle commuting among the general population. Indeed, most large sample surveys do not
include questions about routes or facility preferences. Several simple, stated-preference studies have found that
people prefer bicycle paths and lanes or indicate that having such infrastructure would encourage them to
bicycle more.48 In addition, a national survey found that while frequent bicyclists preferred bicycle lanes rather
than recreational paths, infrequent bicyclists were more likely to want more bicycle paths rather than lanes.
A recent study in Portland, Oregon, documented the travel patterns of 166 cyclists for one week by using GPS
technology. The researcher found that about half of all the miles of bicycle travel recorded by the GPS units
occurred on roads with bicycle lanes, paths, or bicycle boulevards—even though these facilities made up only
about 8 percent of the Portland street network available to cyclists. For our purposes, these facilities can be
classified as “bicycle friendly streets.” Of the 52 percent of bicycle travel that occurred on “bicycle friendly
streets,” over half of those miles traveled took place on streets with defined bicycle lanes. The conclusions of
the Portland study included the following: a supportive bicycle environment appears necessary to encourage

32
bicycling for everyday travel; a network of different types of infrastructure appears necessary to attract new
people to bicycling; and the areas where the highest levels of bicycling occur also have a well-connected street
grid and mix of By taking into consideration the proximity to “bicycle friendly streets” (including streets with
bicycle lanes), as well as the proximity to streets with actual bicycle lanes, we essentially “double-counted,” or
weighted more heavily, the presence of on-street bicycle infrastructure in our analysis. This was done
intentionally to take into account the impact of on-street bicycle infrastructure on rates of cycling, as noted in
the literature on the subject.

33
Figure 4 Detailed Bicycle Facilities
34
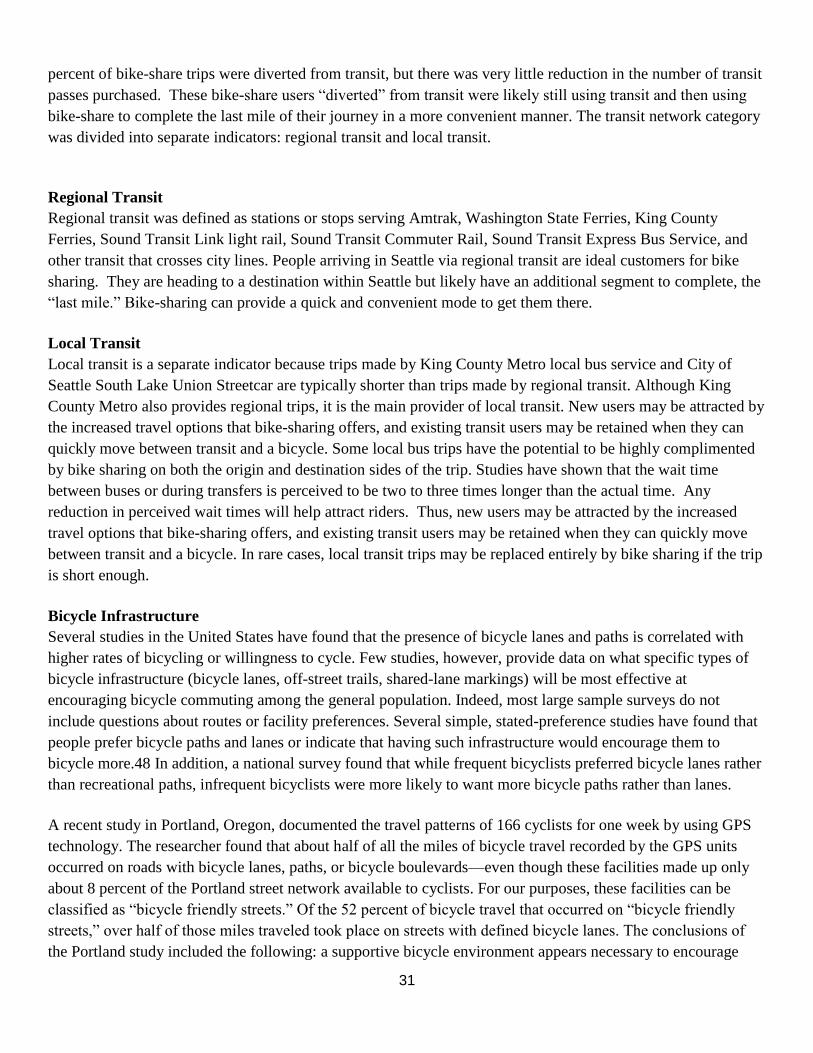
Figure 5 Simplified Bicycle Facilities
Related Documents


