Biophysical Journal, Volume 97 Supporting Material Phosphorylation Facilitates Filamin’s Integrin Binding Under Force Harvey S. Chen, Kevin Sohail Kolahi, and Mohammad R. K. Mofrad

Welcome message from author
This document is posted to help you gain knowledge. Please leave a comment to let me know what you think about it! Share it to your friends and learn new things together.
Transcript
Biophysical Journal, Volume 97
Supporting Material
Phosphorylation Facilitates Filamin’s Integrin Binding Under Force
Harvey S. Chen, Kevin Sohail Kolahi, and Mohammad R. K. Mofrad
Supplementary Material “Binding of the bacteriophage P22 N-peptide to the boxB RNA motif studied by molecular dynamics simulations “ (Bahadur, Kannan, and Zacharias)
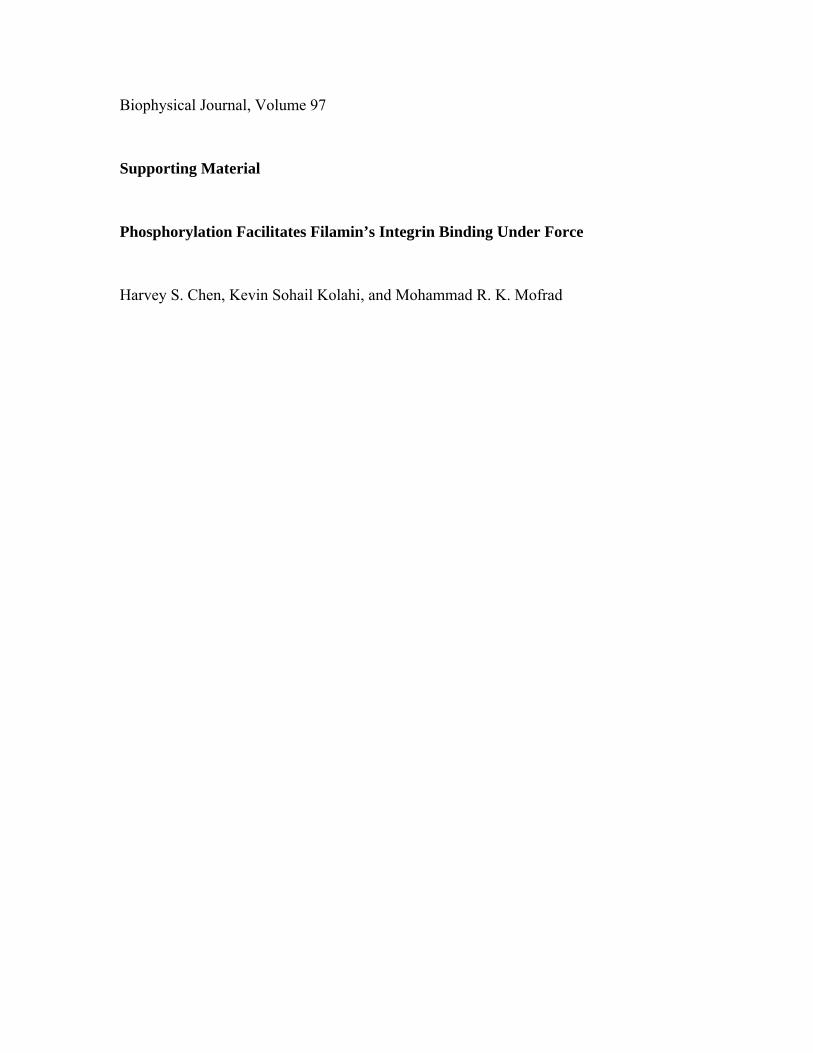
Molecular mechanics/Poisson-Boltzmann (MMPBSA) calculations
Binding free energy were calculated from 2500 snapshots of the last 10 ns of the
simulations of complex and isolated partners using the equation (1, 2):
ΔΔGbinding = ΔGcomplex – (ΔGrna + ΔGpeptide)
The free energies of complex (ΔGcomplex), RNA (ΔGrna) and peptide (ΔGpeptide) were
calculated for the snapshots form the MD trajectories using the equation.
ΔG = ΔGgas + ΔGsolvation
The gas phase energies or molecular mechanics (MM) energies for the complex, RNA
and N-peptide were computed using the parm99 force field (3) in AMBER9 (4). The MM
energies represent the internal bonded energy (energy of bonds+ angles+dihedrals) as
well as the non-bonded van der Waals, and Coulomb energies. An infinite cutoff for all
interactions was used. The solvation (Gsolvation) free energy was calculated from the
equation:
ΔGsolvation = ΔGPB/GB + ΔGnonpolar
The electrostatic contribution or polar contribution for the solvation free energy was
calculated with both the Generalized Born (GB) and finite-difference Poisson-Boltzmann
(FDPB) model. In the GB model, the igb=5 option in the Amber was used, and for the
FDPB model, we used either the implementation in Amber9 (linearized PB) or the
adaptive Poisson-Boltzmann Solver (APBS) to solve the full non-linear PB equation (5).
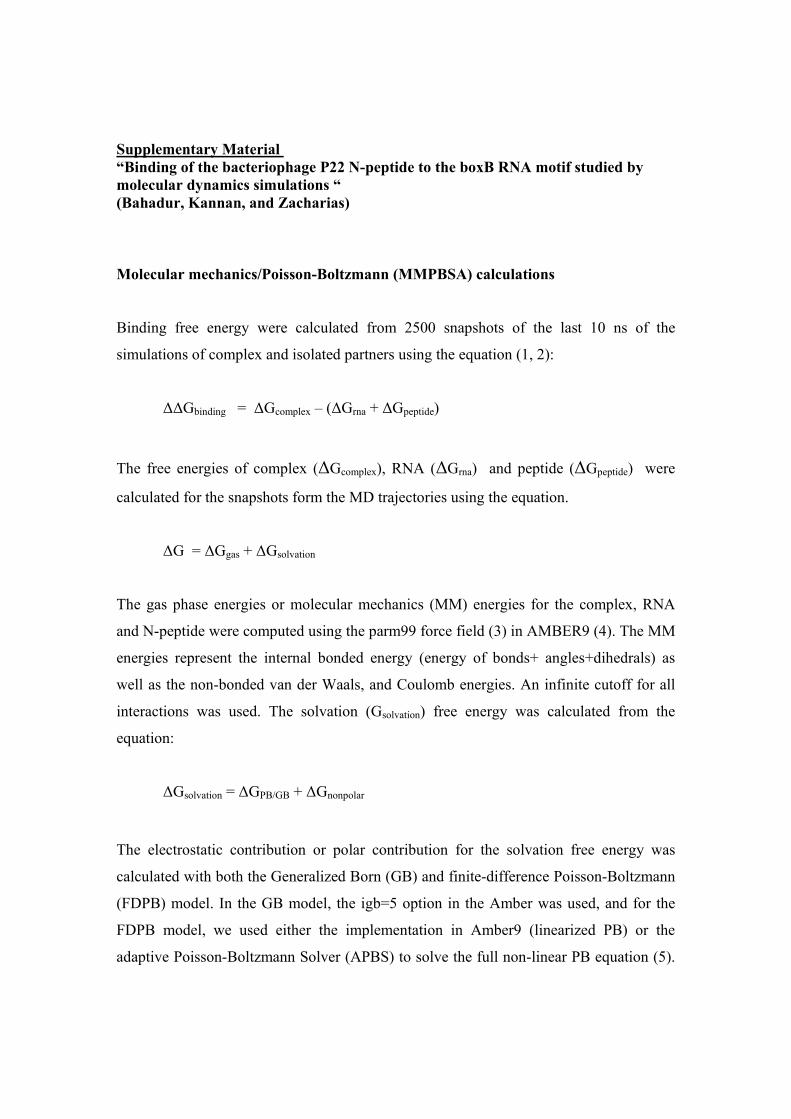
The solute and solvent were assigned a dielectric constant of 1 and 80, respectively. The
mbondi2 set of radii and atomic charges from parm99 were used for all calculations. The
nonpolar contribution for the solvation free energy was estimated using the equation,
ΔGnonpolar = γ * SASA + b
where the solvent accessible surface area (SASA) was calculated with the linear
combination of pairwise overlaps (LCOP) method (6). The surface tension
proportionality constant γ and the free energy of nonpolar solvation for a point solute b
were set to 0.0072 kcal·mol-1·Ǻ-2 and 6.08 kcal·mol-1, respectively. The radius of the
sphere used to calculate SASA was set to 1.4 Ǻ.
For the calculation of the salt dependence nonlinear FDPB calculations at
different salt concentrations: 0.001 M, 0.01 M, 0.1 M, 0.2 M, 0.5 M and 1.0 M were
performed on snapshots from the last 10 ns of the simulations.
1. Srinivasan, J., T. E. Cheatham, P. Cieplak, et al. 1998. Continuum solvent studies of
the stability of DNA, RNA, and phosphoramidate - DNA helices. J. Amer. Chem. Soc.
120:9401-9409.
2. Massova, I., and P. A. Kollman. 1999. Computational alanine scanning to probe
protein-protein interactions: a novel approach to evaluate binding free energies. J.
Amer. Chem. Soc. 121:8133-8143.
3. Wang, J. Cieplak, P. Kollman, P. A. 2000. How well does a restrained electrostatic
potential (RESP) model perform in calculating conformational energies of organic
and biological molecules. J. Comput. Chem. 21:1049-1074.
4. Case, D. A., T. E. Cheatham 3rd, T. Darden, H. Gohlke, R. Luo, K. M. Jr. Merz, A.
Onufriev, C. Simmerling, B. Wang, and R. J. Woods. 2005. The Amber biomolecular
simulation programs. J. Comput. Chem. 26:1668-1688.
5. Baker, N. A., D. Sept, S. Joseph, M. J. Holst, and J. A. McCammon. 2001.
Electrostatics of nanosystems: application to microtubules and the ribosome. Proc.
Natl. Acad. Sci. U S A. 98:10037-10041.
6. Weiser, J., P.S. Shenkin, and W. C. Still. 1999. Approximate atomic surfaces from
linear combinations of pair-wise overlaps (LCPO). J. Comput. Chem. 20:217-230.
Figure legends (suppl. Material):
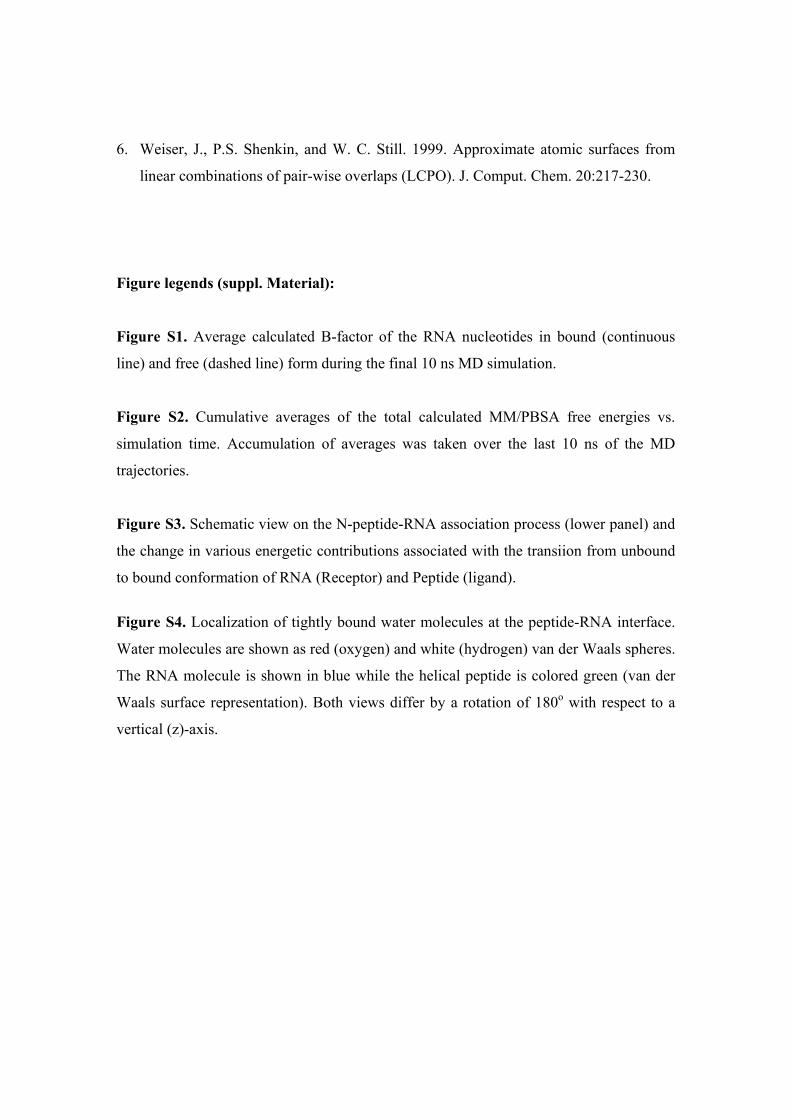
Figure S1. Average calculated B-factor of the RNA nucleotides in bound (continuous
line) and free (dashed line) form during the final 10 ns MD simulation.
Figure S2. Cumulative averages of the total calculated MM/PBSA free energies vs.
simulation time. Accumulation of averages was taken over the last 10 ns of the MD
trajectories.
Figure S3. Schematic view on the N-peptide-RNA association process (lower panel) and
the change in various energetic contributions associated with the transiion from unbound
to bound conformation of RNA (Receptor) and Peptide (ligand).
Figure S4. Localization of tightly bound water molecules at the peptide-RNA interface.
Water molecules are shown as red (oxygen) and white (hydrogen) van der Waals spheres.
The RNA molecule is shown in blue while the helical peptide is colored green (van der
Waals surface representation). Both views differ by a rotation of 180o with respect to a
vertical (z)-axis.
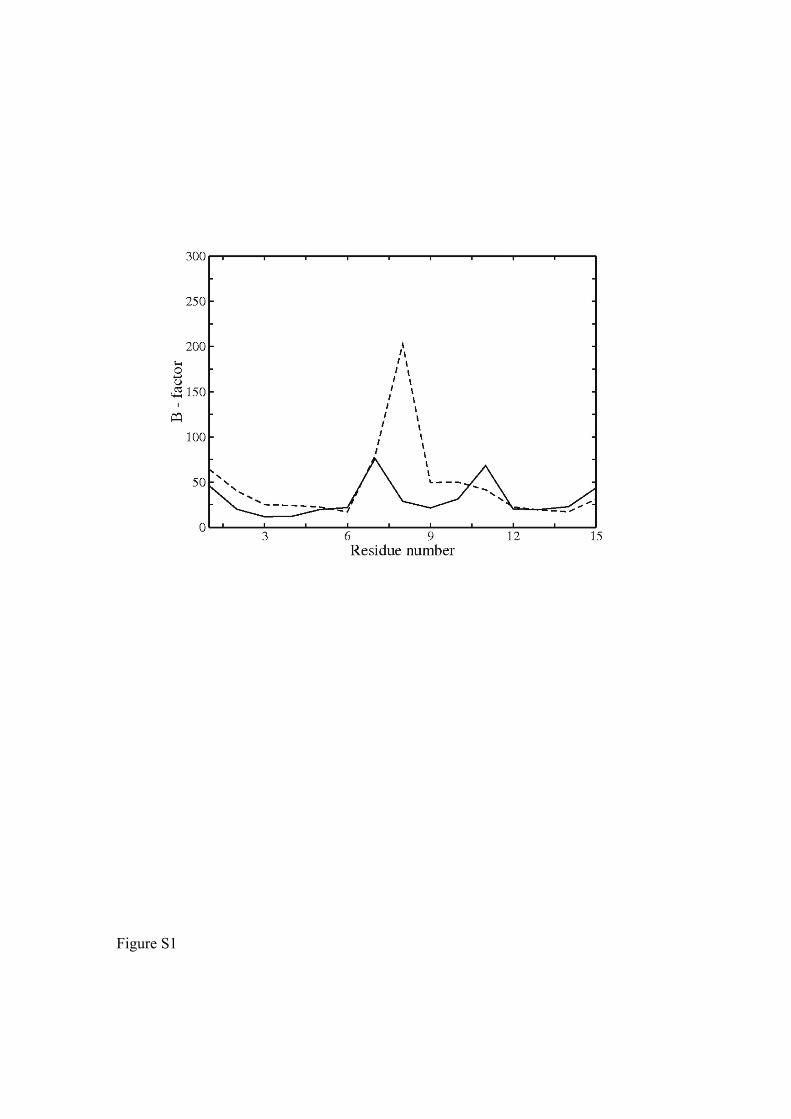
Figure S1
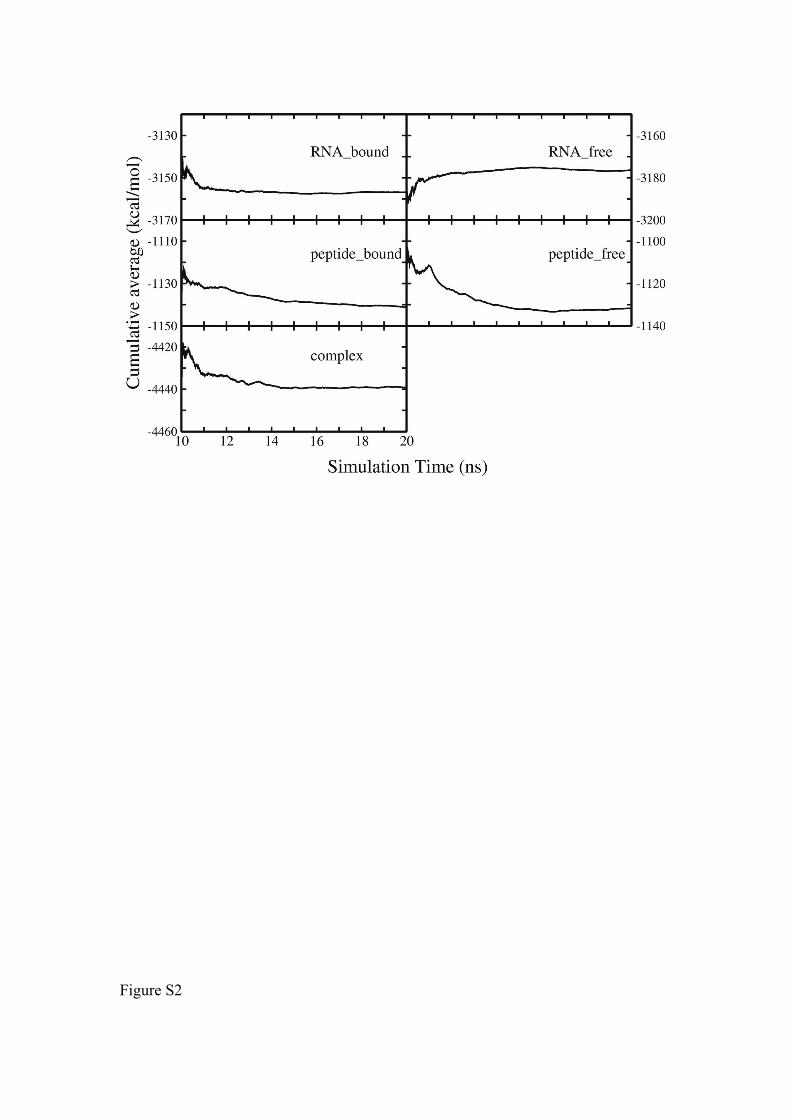
Figure S2
Figure S3
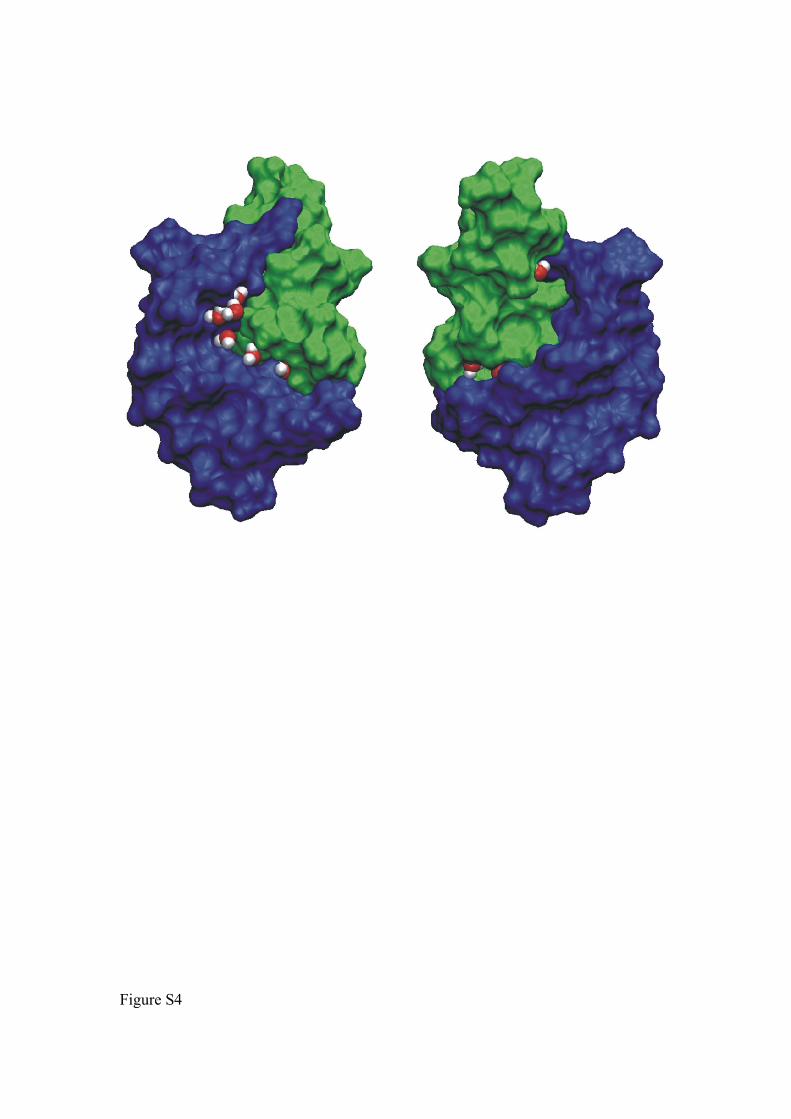
Figure S4
Related Documents