Phosphorus retention and movement across an ombrotrophic-minerotrophic peatland gradient LAURIE E. KELLOGG* and SCOTT D. BRIDGHAM Department of Biological Sciences, University of Notre Dame, Notre Dame, IN 46556–0369, USA; *Au- thor for correspondence (e-mail: [email protected]; phone: (219) 631–4921; fax: (219) 631–7413) Received 21 May 2001; accepted in revised form 2 April 2002 Key words: 32 P, Ecosystem function, Peatland, Phosphorus cycling, Phosphorus retention, Radioiso- tope Abstract. An understanding of the mechanisms controlling nutrient availability and retention in and across ecosystems allows for a greater understanding of the role of nutrients in maintaining ecosystem structure and function. To examine the underlying mechanisms of phosphorus (P) cycling in northern peatlands, we compared the retention and movement of P across a natural hydrologic/pH gradient in nine peatlands by applying as a light rain an in situ tracer amount of 32 PO 4 -3 to track changes in P pools (vegetation, soil, microbial) over 30 days. The 31 P concentrations of available P, microbial P, and the root P at 10–20 cm did not differ across the gradient, although total soil P and aboveground vegetation P content (gm -2 ) increased from bog to rich fen. Total retention of 32 P in the first 24 hours of appli- cation was greatest in the bogs and intermediate fens (90–100%) and was very low (20–50%) in the rich fens. Retention of P in the different pools was dependent on the type of peatland and changed with time. In the first 24 hours in the bogs and intermediate fens, the microbial pool contained the largest amount of 32 P, but by the seventh day, the aboveground vegetation contained the largest amount. In the rich fen, the recovered 32 P was almost equally divided between the aboveground vegetation and the litter layer with very little in other pools. Therefore, although bogs and intermediate fens have a small total P pool, they have similar P availability to rich fens because of rapid cycling and efficient retention of P. Introduction The most limiting nutrient to ecosystem production is theorized to be tightly con- trolled and retained in order to maintain ecosystem stability (Aerts 1999). How- ever, increasing anthropogenic nutrient loading directly affects ecosystems through alterations in primary production (Davis 1989; Berg and Tamm 1991; Chapin 1998), nutrient cycling, nutrient retention (Richardson and Qian 1999), and plant commu- nity dynamics (Craft and Richardson 1997; Jonasson et al. 1999). A knowledge of mechanisms and interactions governing nutrient cycling and retention within a sys- tem can lead to better predictions of consequences to anthropogenic disturbances and potential extrapolation to a more general theory (Hedin et al. 1995; Jonasson et al. 1999). Greater clarification of ecosystem nutrient cycling will be gained through the analysis of the least impacted sites and utilizing this as a reference point to further study (Hedin et al. 1995). Biogeochemistry 63: 299–315, 2003. © 2003 Kluwer Academic Publishers. Printed in the Netherlands.

Welcome message from author
This document is posted to help you gain knowledge. Please leave a comment to let me know what you think about it! Share it to your friends and learn new things together.
Transcript
Phosphorus retention and movement across anombrotrophic-minerotrophic peatland gradient
LAURIE E. KELLOGG* and SCOTT D. BRIDGHAMDepartment of Biological Sciences, University of Notre Dame, Notre Dame, IN 46556–0369, USA; *Au-thor for correspondence (e-mail: [email protected]; phone: (219) 631–4921; fax: (219) 631–7413)
Received 21 May 2001; accepted in revised form 2 April 2002
Key words: 32P, Ecosystem function, Peatland, Phosphorus cycling, Phosphorus retention, Radioiso-tope
Abstract. An understanding of the mechanisms controlling nutrient availability and retention in andacross ecosystems allows for a greater understanding of the role of nutrients in maintaining ecosystemstructure and function. To examine the underlying mechanisms of phosphorus (P) cycling in northernpeatlands, we compared the retention and movement of P across a natural hydrologic/pH gradient innine peatlands by applying as a light rain an in situ tracer amount of 32PO4
−3 to track changes in P pools(vegetation, soil, microbial) over 30 days. The 31P concentrations of available P, microbial P, and theroot P at 10–20 cm did not differ across the gradient, although total soil P and aboveground vegetationP content (�g m−2) increased from bog to rich fen. Total retention of 32P in the first 24 hours of appli-cation was greatest in the bogs and intermediate fens (90–100%) and was very low (20–50%) in the richfens. Retention of P in the different pools was dependent on the type of peatland and changed with time.In the first 24 hours in the bogs and intermediate fens, the microbial pool contained the largest amountof 32P, but by the seventh day, the aboveground vegetation contained the largest amount. In the rich fen,the recovered 32P was almost equally divided between the aboveground vegetation and the litter layerwith very little in other pools. Therefore, although bogs and intermediate fens have a small total P pool,they have similar P availability to rich fens because of rapid cycling and efficient retention of P.
Introduction
The most limiting nutrient to ecosystem production is theorized to be tightly con-trolled and retained in order to maintain ecosystem stability (Aerts 1999). How-ever, increasing anthropogenic nutrient loading directly affects ecosystems throughalterations in primary production (Davis 1989; Berg and Tamm 1991; Chapin 1998),nutrient cycling, nutrient retention (Richardson and Qian 1999), and plant commu-nity dynamics (Craft and Richardson 1997; Jonasson et al. 1999). A knowledge ofmechanisms and interactions governing nutrient cycling and retention within a sys-tem can lead to better predictions of consequences to anthropogenic disturbancesand potential extrapolation to a more general theory (Hedin et al. 1995; Jonasson etal. 1999). Greater clarification of ecosystem nutrient cycling will be gained throughthe analysis of the least impacted sites and utilizing this as a reference point tofurther study (Hedin et al. 1995).
Biogeochemistry 63: 299–315, 2003.© 2003 Kluwer Academic Publishers. Printed in the Netherlands.
Most nutrient cycling and retention studies in wetlands have focused on the roleof nitrogen (Bowden 1987; Golterman 1995; Hedin et al. 1998). Although nitrogenlimits ecosystem production in most terrestrial (Vitousek and Howarth 1991) andsome wetland ecosystems (Bedford et al. 1999), primary production in many wet-lands, including peatlands, in North America has been found to be limited by phos-phorus availability (Bridgham et al. 1996; Chapin 1998; Bedford et al. 1999).However, the mechanisms that control the cycling of P, and therefore the availabil-ity of P, within peatlands are still poorly understood. For example, in a fertilizationstudy in the Everglades, Chiang et al. (2000) found that increasing P input did notnecessarily significantly increase easily exchangeable phosphorus. As in all ecosys-tems, this is primarily due to the complex interactions between geochemical andbiological processes that control the cycling of P (Chapin et al. 1978; Walbridge1991; Walbridge and Struthers 1993; Bridgham et al. 2001).
Peatlands are a diverse group of ecosystems structured by the amount and sourceof hydrologic inputs (Moore and Bellamy 1974; Bridgham et al. 1996). Om-brotrophic bogs receive only atmospheric inputs of nutrients, basic cations, andwater and consequently have poorly buffered, low pH soils. They are dominated byplant species typically thought to reflect nutrient poor conditions, e.g., Sphagnummosses, ericaceous shrubs and Picea mariana. Minerotrophic fens receive groundwater and/or surface flow from the surrounding watershed, maintaining a higherpH and receiving a much higher input of nutrients than bogs. Because nutrient in-puts are less in ombrotrophic bogs, the assumption has been that nutrient retentionshould be higher in bogs than fens (Damman 1988). Retention of nutrients is con-trolled by geochemical, microbial, and vegetative interactions (Pomeroy 1970; Ri-chardson and Marshall 1986; Walbridge 1991; Walbridge and Struthers 1993; vanBreemen and Finzi 1998); therefore the expectation is that these interactions wouldmore tightly control nutrients within the bog ecosystem.
Since increased ground-water inputs must be accompanied by increased nutrientinputs, it has been assumed that availability of nutrients to vegetation and micro-bial communities is much higher in minerotrophic peatlands (cf. Damman (1986)and Bridgham et al. (1996)). Some studies have found that total soil nutrients poolsare smaller in ombrotrophic bogs than in minerotrophic fens (Vermeer and Ber-endse 1983; Bridgham et al. (1998, 2001)), whereas other studies have found nodifference (Vitt 1990). However, mineralization rates and soil extractions show thatnutrient availability in bogs can be as high as or higher than in rich fens (Verho-even et al. 1990; Walbridge 1991; Bridgham et al. 1998; Chapin 1998). A compari-son of a large number of different nutrient availability indices in a variety of wet-lands found consistently higher N availability in minerotrophic peatlands, but re-sults for P were contradictory and depended strongly on the method used (Bridghamet al. 2001). Thus, the assumption that availability of nutrients correlates with hy-drologic inputs is a more complex issue than originally thought and remains in dis-pute, particularly for P.
We used in situ applications of 32PO4−2 to: 1) quantify the retention and parti-
tioning of P within different peatland types, and 2) compare changes in P availabil-ity across the ombrotrophic-minerotrophic gradient. In this experiment, we tested
300
three major hypotheses: 1) ombrotrophic bogs, with their lower nutrient inputs,have higher retention of P; 2) biotic components, such as vegetation and microor-ganisms, are more important in P retention in bogs than in fens because of bogs’lower mineral content; and 3) P availability is higher in bogs than in fens becauseof less geochemical control in the bogs and high microbial turnover.
Methods
Site description
Sites were located in the Upper Peninsula of Michigan in Gogebic County (46° N,89° W) at the University of Notre Dame Environmental Research Center (UN-DERC) and the Ottawa National Forest. In May of 1997, based on plant commu-nities and pH, we selected three rich fens, three intermediate fens and three bogs(Table 1). The vegetation in the rich fens (pH = 6.0) was dominated by Carex spp.,Calamagrostis canadensis and scattered Alder rubrus and Salix spp. Water levelsin the rich fen remained above the surface of the peat for the duration of this study(June 1 to July 15, 1998). The dominant vegetation in the intermediate fens (pH =4.9) was Carex spp., Eriophorum vaginatum, E. virginicum, and Sphagnum spp.mosses. Ericaceous shrubs such as Ledum palustre and Chamaedaphne calyculatawere also present. In June the water levels in the intermediate fens were above thesurface of the peat, but by July 15 the water levels had dropped to the surface. Thedominant vegetation in the bogs (pH = 3.8) was Sphagnum spp. and ericaceousshrubs such as Vaccinium spp., Ledum palustre, and Chamaedaphne calyculata. InJune the water level in the bogs was at the surface of the Sphagnum carpet but was5 to 10 cm below the surface by the end of July.
32P application and sample collection
We chose a 4-m2 treeless plot within each peatland. The plot was enclosed withgalvanized steel roofing sheets that spanned 0.5 m above and below the surface ofthe soil. These remained in place for the duration of the growing season to mini-mize horizontal movement of the radiotracer, but they did not impede vertical wa-ter flux. Although retention time of water within these wetlands was not measured,there was no discernable surface flow even within the rich fens. In mid-June, weapplied 9.25 × 10⁴ MBq m−2 of carrier-free KH32PO3 (<3.0 mM) as a radioactivetracer dissolved in 2 l of filtered water from the site. The mixture was sprayed ontothe plot with a pump sprayer simulating a light rain.
At 1, 7, 14, and 30 days after 32P application, we collected soil and plantsamples. Also at each sampling period we measured radioactivity outside of theplots with a Geiger counter and did not have detectable radioactivity. At each timeperiod we collected three soil cores from each plot to a depth of 20 cm using 7-cmdiameter PVC pipes. These cores were then cut into two 10-cm sections. The sec-
301
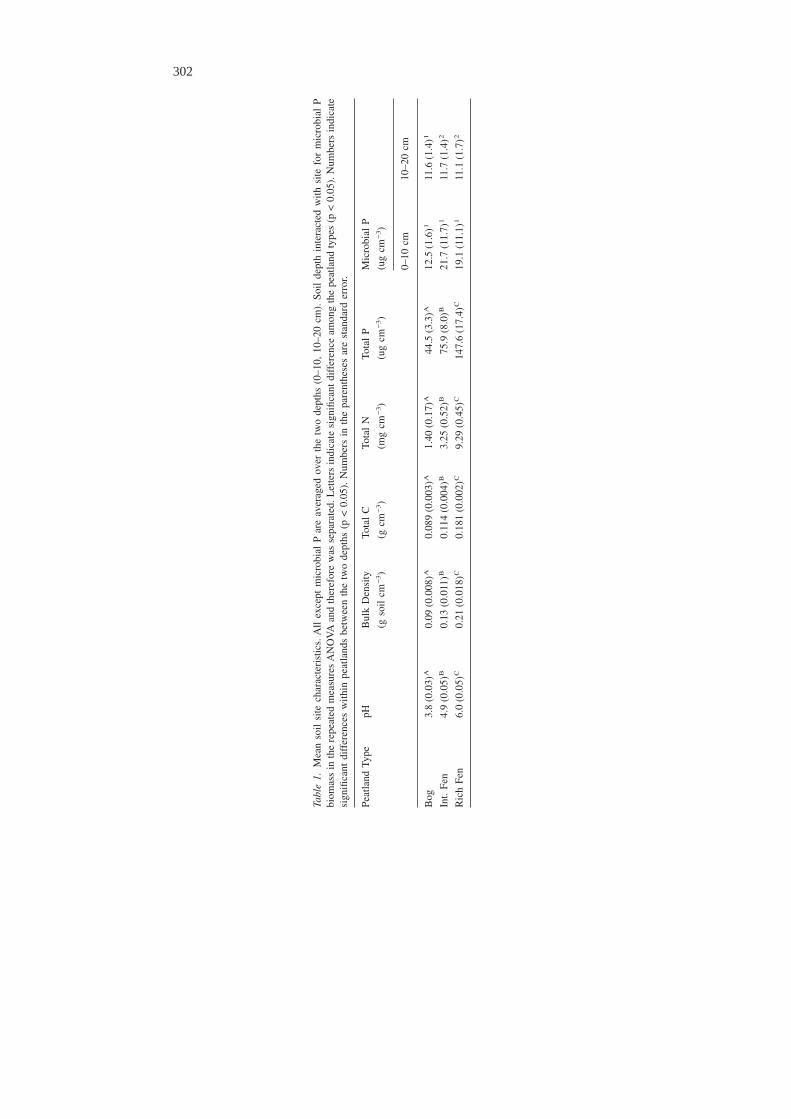
Tabl
e1.
Mea
nso
ilsi
tech
arac
teri
stic
s.A
llex
cept
mic
robi
alP
are
aver
aged
over
the
two
dept
hs(0
–10,
10–2
0cm
).So
ilde
pth
inte
ract
edw
ithsi
tefo
rm
icro
bial
Pbi
omas
sin
the
repe
ated
mea
sure
sA
NO
VA
and
ther
efor
ew
asse
para
ted.
Let
ters
indi
cate
sign
ifica
ntdi
ffer
ence
amon
gth
epe
atla
ndty
pes
(p<
0.05
).N
umbe
rsin
dica
tesi
gnifi
cant
diff
eren
ces
with
inpe
atla
nds
betw
een
the
two
dept
hs(p
<0.
05).
Num
bers
inth
epa
rent
hese
sar
est
anda
rder
ror.
Peat
land
Type
pHB
ulk
Den
sity
Tota
lC
Tota
lN
Tota
lP
Mic
robi
alP
(gso
ilcm
−3)
(gcm
−3)
(mg
cm−
3)
(ug
cm−
3)
(ug
cm−
3)
0–10
cm10
–20
cm
Bog
3.8
(0.0
3)A
0.09
(0.0
08)A
0.08
9(0
.003
)A1.
40(0
.17)
A44
.5(3
.3)A
12.5
(1.6
)111
.6(1
.4)1
Int.
Fen
4.9
(0.0
5)B
0.13
(0.0
11)B
0.11
4(0
.004
)B3.
25(0
.52)
B75
.9(8
.0)B
21.7
(11.
7)1
11.7
(1.4
)2
Ric
hFe
n6.
0(0
.05)
C0.
21(0
.018
)C0.
181
(0.0
02)C
9.29
(0.4
5)C
147.
6(1
7.4)
C19
.1(1
1.1)
111
.1(1
.7)2
302
tions were placed on ice and processed within 24 hours. Total aboveground veg-etation was clipped to ground level in three 49-cm2 subplots within each main plot.The litter layer was also collected within the 49-cm2 subplots.
Sample analysis
Living roots were handpicked from each core section, and roots and abovegroundvegetation were dried at 65 °C for 24 hours to determine belowground and above-ground biomass. Subsamples of the root-free soil were dried at 65 °C for 48 hoursto determine moisture content and bulk density. A subsample of roots, root-free soil,and aboveground vegetation were ground using a Udy mill to pass a 2-mm sieve(Udy Corporation, Fort Collins, Colorado). The ground subsamples were then di-gested using a sulfuric acid/hydrogen peroxide solution (Lowther 1980) and ana-lyzed for total P.
We determined available soil PO4-P for each 10-cm depth using a dilute acid-fluoride (AF) extraction on 5-g wet-weight subsamples (Olsen and Sommers 1982).Microbial P was calculated as the increase in AF-extractable P after chloroform-fumigation of subsamples using an efficiency factor (kp) of 0.4 to correct for in-complete recovery of the microbial biomass (Brookes et al. 1984; Walbridge 1991).Fifteen grams of wet-weight soil was sealed in a vacuum desiccator with chloro-form and incubated for 24 hours (Brookes et al. 1984).
A molybdate colorimetric method was used on a Lachat QuikChem 8000 Au-toanalyzer to analyze all phosphorus fractions (Lachat #10–465, Milwaukee, WI).Nitrogen and carbon concentrations for soil, plant and root solid samples were de-termined on a Carlo-Erba CHN elemental analyzer/mass spectrophotometer. Wedetermined 32P contents of all P fractions using Cerenkov liquid scintillation. Be-fore radioactive analysis for the AF-extractable P, we partitioned the dissolved or-ganic 32P from the inorganic 32P using a butanol/molybdate separation and countedonly the inorganic P fraction (Jayachandran et al. 1992).
Statistical analysis
For 31P and 32P concentrations within the aboveground vegetation and the litterlayer, we used repeated measures analysis of variance (ANOVAR) to test for inter-actions between time and peatland type. For analyses with a significant interactionbetween peatland type and time (p < 0.05), we examined the differences among thepeatland types within each time period and then determined the differences acrosstime for each peatland type (Zar 1996). For 31P and 32P concentrations within theroot and soil fractions, we used ANOVAR to test for interactions between time,depth, and peatland type. For analyses with a significant interaction (p < 0.05), wedetermined depth and time differences within each peatland type and then exam-ined the differences among peatland types within each depth and time period (Zar1996). To determine pairwise comparisons, we used a Tukey post hoc test.
303
Results
31P pools
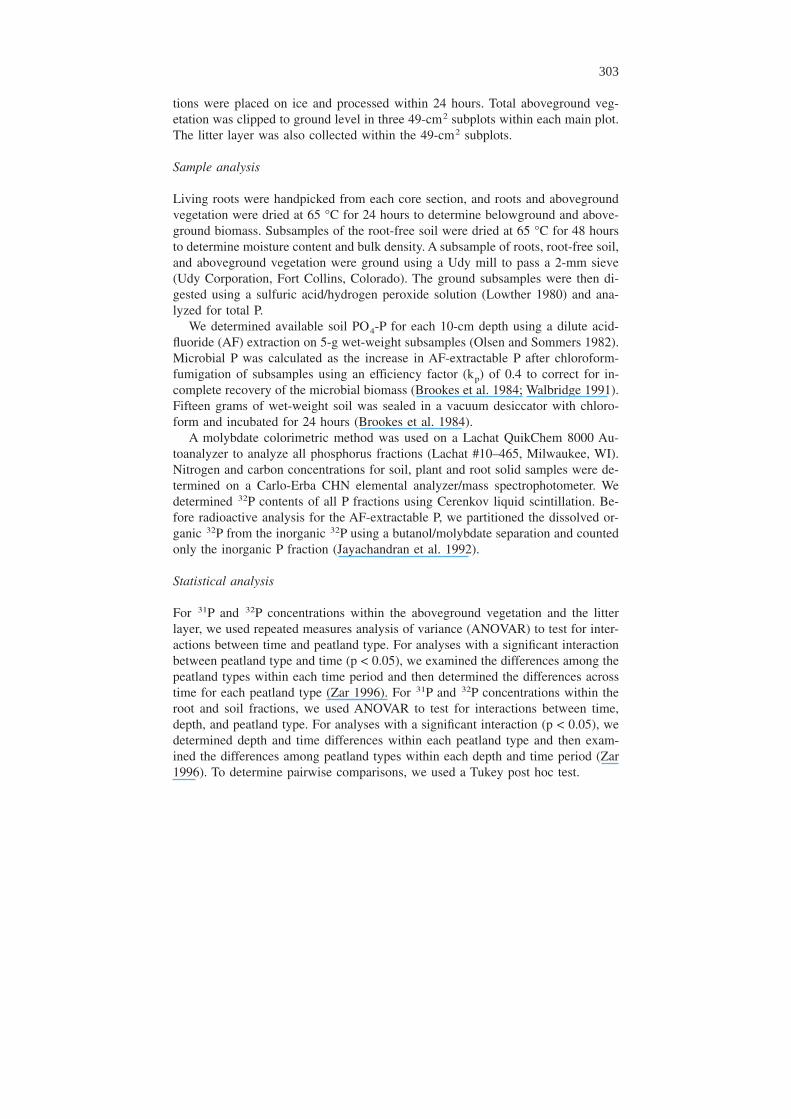
Neither available soil P (Figure 1) nor microbial soil P pool sizes (Table 1) differedacross the gradient, although the total soil P concentration increased from bog tofen (ANOVAR p = 0.001, Table 1). Within the intermediate fens and the rich fens,the microbial soil P pool was larger in the 0–10 cm depth than in the 10–20 cmdepth (ANOVAR 0.029, Table 1) but there was no depth effect for the bogs.
Although total aboveground vegetation 31P concentration (mg g−1 of vegetation)and biomass did not significantly differ across the gradient, total aboveground veg-etation 31P content (g m−2) doubled from bog to rich fen and remained consistentthrough time (ANOVAR 0.025, Table 2). The same pattern occurred in the litter,with litter 31P concentration (mg g−1) equivalent across the gradient, but biomassand 31P content (g m−2) increasing from bog to rich fen (Table 2).
Differences in root biomass depended on both peatland type and depth (ANO-VAR type × depth interaction p = 0.027, Table 2). Root biomass was higher in the0–10 cm depth than in the 10–20 cm depth in the intermediate and rich fens(ANOVA p = 0.015, 0.001 respectively). Conversely, bogs had higher root biomassin the 10–20 cm depth than the 0–10 cm depth (Tukey p = 0.025). In the 0–10 cmdepth, root biomass was lowest in the bog and similar in the intermediate and richfens (Table 2). Root biomass in the 10–20 cm depth in the bog and intermediatefen was more than twice that of the rich fen.
Belowground 31P concentration (mg g−1 root) across the gradient interacted withdepth (ANOVAR peatland type × depth p = 0.001, Table 2), with no differenceamong peatland types in the 0–10 cm depth but greater 31P concentration in therich fen in the 10–20 cm depth (Tukey p = 0.01). Root 31P content (g m−2) differedbased on depth and site (ANOVAR type × depth interaction p = 0.001, Table 2). Inthe 0–10 cm depth, the intermediate and rich fens were higher than the bog (Tukey
Figure 1. Available P (�g*cm−3) pool across time. Day 14 was significantly higher in all peatland types(p < 0.05). Error bars are 1 standard error.
304
p = 0.042, 0.015 respectively). In the 10–20 cm depth, the sites did not signifi-cantly differ.
Bulk density and total soil carbon more than doubled from bog to rich fen(ANOVA p � 0.001, Table 1). One of the more dramatic differences was in totalsoil nitrogen, which was almost nine times higher in the rich fen than in the bog(ANOVA p = 0.013, Table 1). Bulk density, total soil carbon, and total soil nitrogendid not differ over the incubation period.
32P dynamics
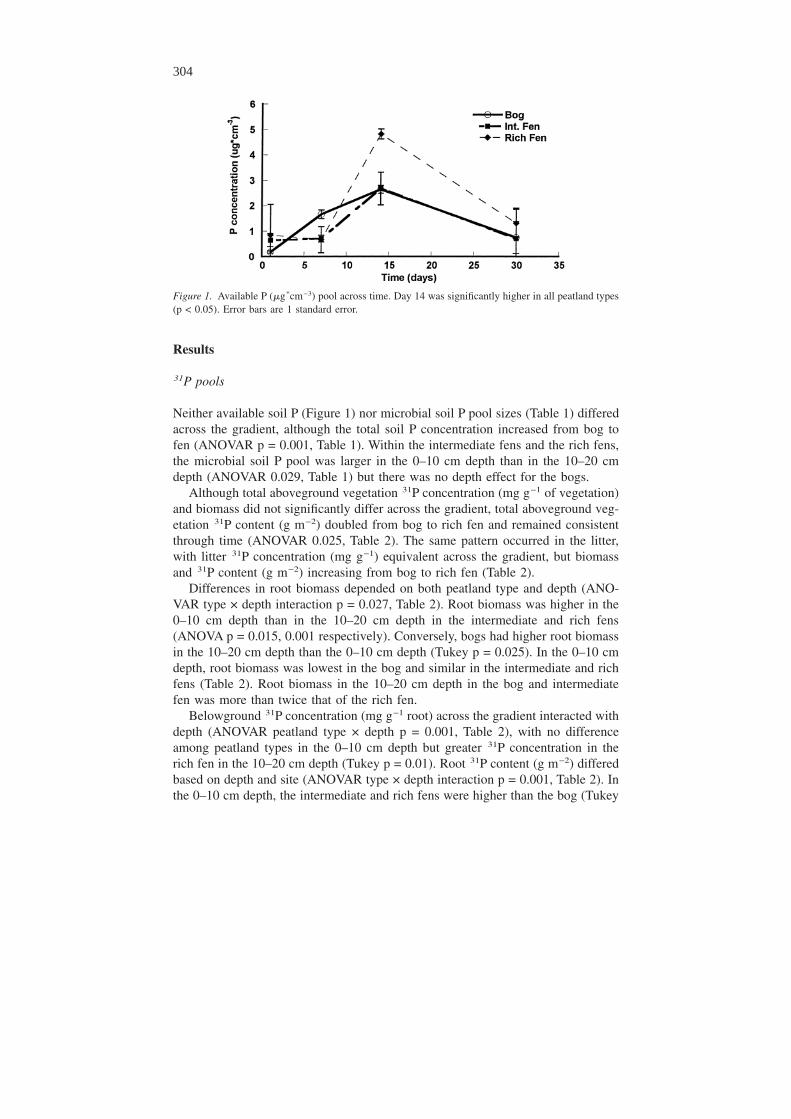
The total retention of 32P was higher in the bogs and intermediate fens than in therich fens over the entire 30-day incubation period, but there was no difference inretention between the bogs and intermediate fens (Figure 2). However, retention
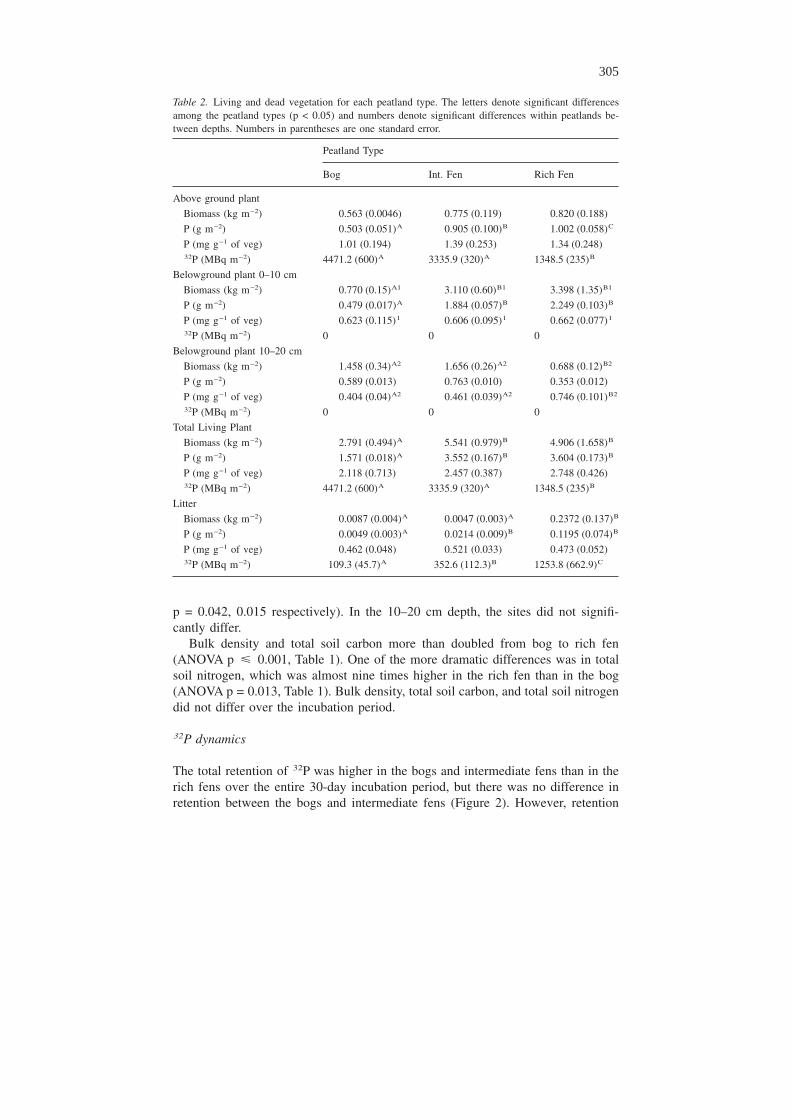
Table 2. Living and dead vegetation for each peatland type. The letters denote significant differencesamong the peatland types (p < 0.05) and numbers denote significant differences within peatlands be-tween depths. Numbers in parentheses are one standard error.
Peatland Type
Bog Int. Fen Rich Fen
Above ground plant
Biomass (kg m−2) 0.563 (0.0046) 0.775 (0.119) 0.820 (0.188)
P (g m−2) 0.503 (0.051)A 0.905 (0.100)B 1.002 (0.058)C
P (mg g−1 of veg) 1.01 (0.194) 1.39 (0.253) 1.34 (0.248)32P (MBq m−2) 4471.2 (600)A 3335.9 (320)A 1348.5 (235)B
Belowground plant 0–10 cm
Biomass (kg m−2) 0.770 (0.15)A1 3.110 (0.60)B1 3.398 (1.35)B1
P (g m−2) 0.479 (0.017)A 1.884 (0.057)B 2.249 (0.103)B
P (mg g−1 of veg) 0.623 (0.115)1 0.606 (0.095)1 0.662 (0.077)1
32P (MBq m−2) 0 0 0
Belowground plant 10–20 cm
Biomass (kg m−2) 1.458 (0.34)A2 1.656 (0.26)A2 0.688 (0.12)B2
P (g m−2) 0.589 (0.013) 0.763 (0.010) 0.353 (0.012)
P (mg g−1 of veg) 0.404 (0.04)A2 0.461 (0.039)A2 0.746 (0.101)B2
32P (MBq m−2) 0 0 0
Total Living Plant
Biomass (kg m−2) 2.791 (0.494)A 5.541 (0.979)B 4.906 (1.658)B
P (g m−2) 1.571 (0.018)A 3.552 (0.167)B 3.604 (0.173)B
P (mg g−1 of veg) 2.118 (0.713) 2.457 (0.387) 2.748 (0.426)32P (MBq m−2) 4471.2 (600)A 3335.9 (320)A 1348.5 (235)B
Litter
Biomass (kg m−2) 0.0087 (0.004)A 0.0047 (0.003)A 0.2372 (0.137)B
P (g m−2) 0.0049 (0.003)A 0.0214 (0.009)B 0.1195 (0.074)B
P (mg g−1 of veg) 0.462 (0.048) 0.521 (0.033) 0.473 (0.052)32P (MBq m−2) 109.3 (45.7)A 352.6 (112.3)B 1253.8 (662.9)C
305
decreased between Day 1 and Day 7 in the bog and intermediate fen sites but notin the rich fen sites (ANOVAR type × time interaction p = 0.001). Retention in thebog and intermediate fen was close to 100% at Day 1 but fell to 63% by Day 7 andremained relatively constant thereafter (Figure 2). The total percentage of recov-ered 32P in the rich fen was relatively constant over the 30-day sampling period at30–45% (Figure 2).
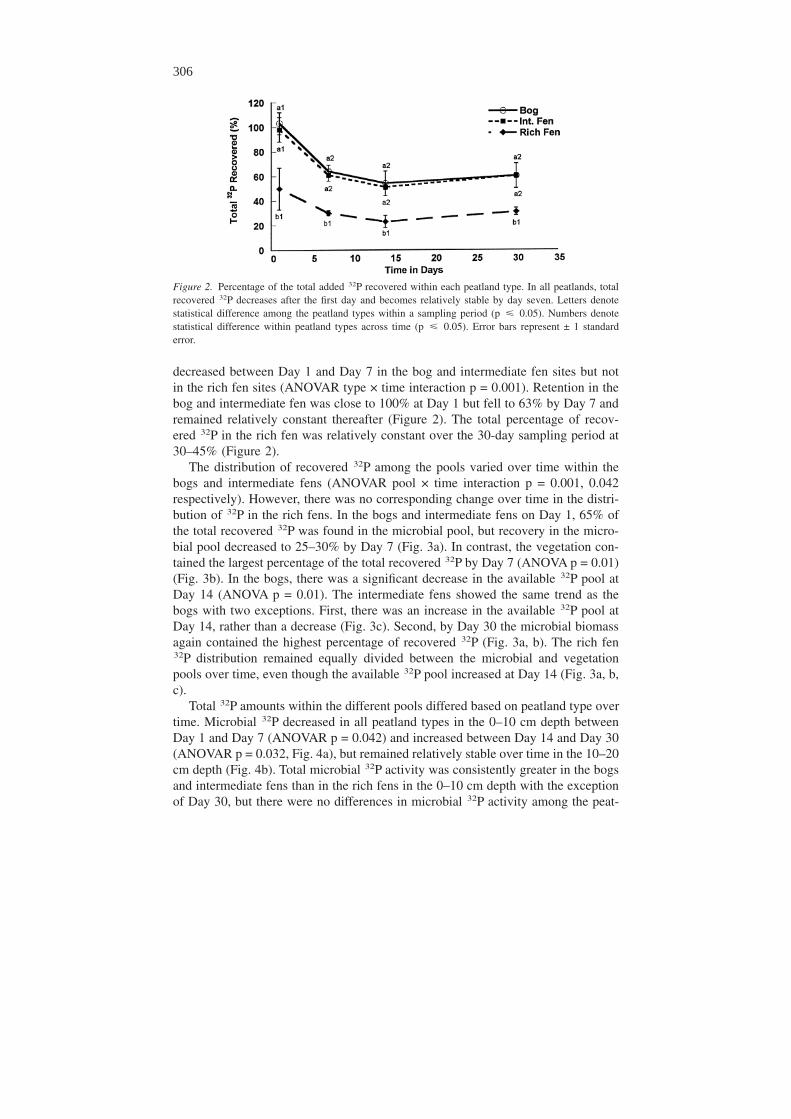
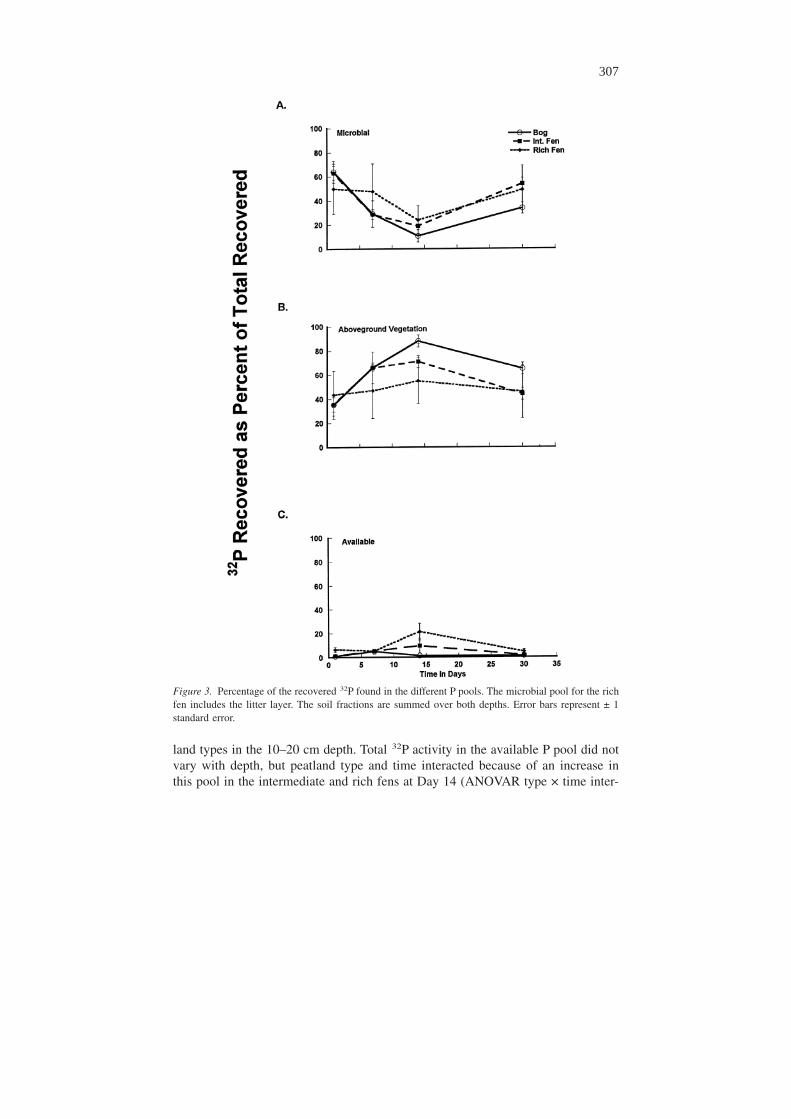
The distribution of recovered 32P among the pools varied over time within thebogs and intermediate fens (ANOVAR pool × time interaction p = 0.001, 0.042respectively). However, there was no corresponding change over time in the distri-bution of 32P in the rich fens. In the bogs and intermediate fens on Day 1, 65% ofthe total recovered 32P was found in the microbial pool, but recovery in the micro-bial pool decreased to 25–30% by Day 7 (Fig. 3a). In contrast, the vegetation con-tained the largest percentage of the total recovered 32P by Day 7 (ANOVA p = 0.01)(Fig. 3b). In the bogs, there was a significant decrease in the available 32P pool atDay 14 (ANOVA p = 0.01). The intermediate fens showed the same trend as thebogs with two exceptions. First, there was an increase in the available 32P pool atDay 14, rather than a decrease (Fig. 3c). Second, by Day 30 the microbial biomassagain contained the highest percentage of recovered 32P (Fig. 3a, b). The rich fen32P distribution remained equally divided between the microbial and vegetationpools over time, even though the available 32P pool increased at Day 14 (Fig. 3a, b,c).
Total 32P amounts within the different pools differed based on peatland type overtime. Microbial 32P decreased in all peatland types in the 0–10 cm depth betweenDay 1 and Day 7 (ANOVAR p = 0.042) and increased between Day 14 and Day 30(ANOVAR p = 0.032, Fig. 4a), but remained relatively stable over time in the 10–20cm depth (Fig. 4b). Total microbial 32P activity was consistently greater in the bogsand intermediate fens than in the rich fens in the 0–10 cm depth with the exceptionof Day 30, but there were no differences in microbial 32P activity among the peat-
Figure 2. Percentage of the total added 32P recovered within each peatland type. In all peatlands, totalrecovered 32P decreases after the first day and becomes relatively stable by day seven. Letters denotestatistical difference among the peatland types within a sampling period (p � 0.05). Numbers denotestatistical difference within peatland types across time (p � 0.05). Error bars represent ± 1 standarderror.
306
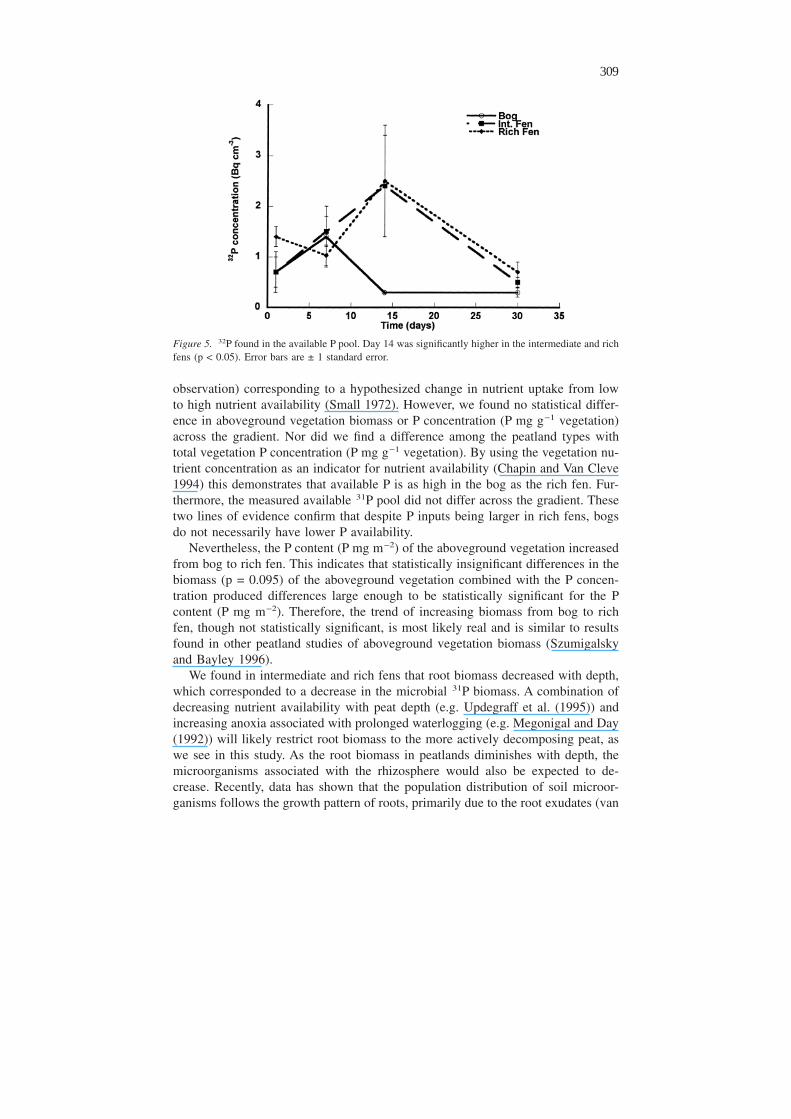
land types in the 10–20 cm depth. Total 32P activity in the available P pool did notvary with depth, but peatland type and time interacted because of an increase inthis pool in the intermediate and rich fens at Day 14 (ANOVAR type × time inter-
Figure 3. Percentage of the recovered 32P found in the different P pools. The microbial pool for the richfen includes the litter layer. The soil fractions are summed over both depths. Error bars represent ± 1standard error.
307
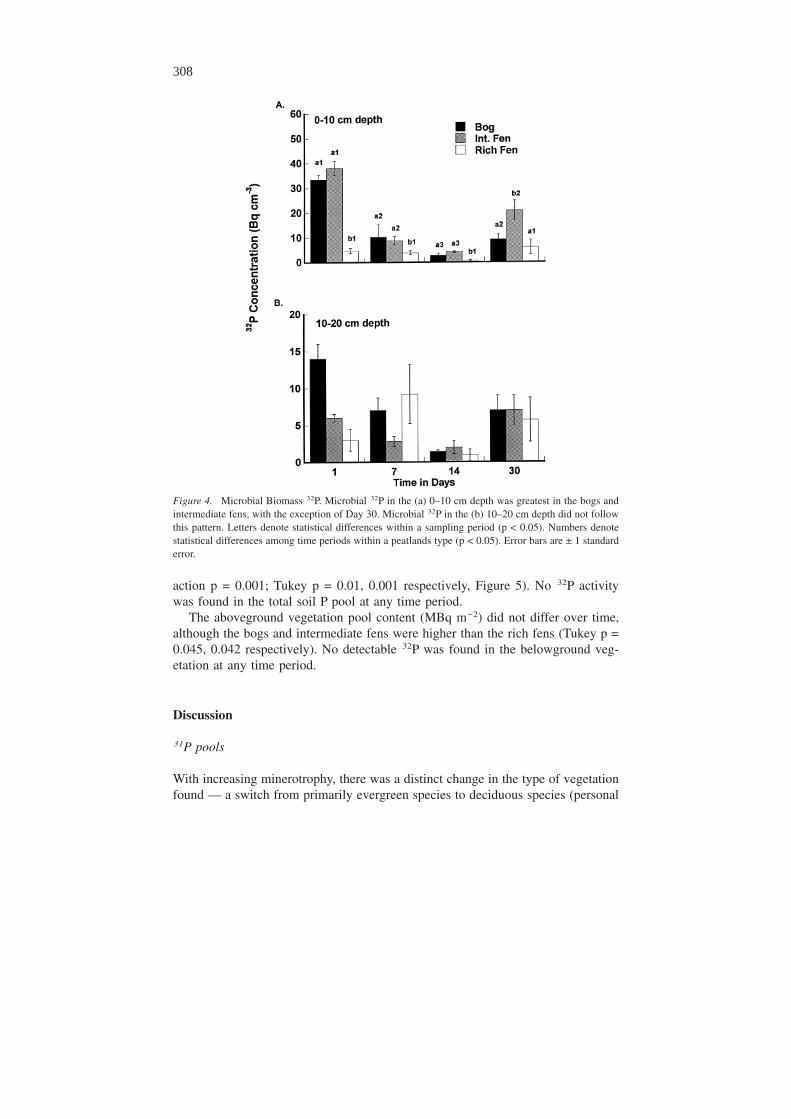
action p = 0.001; Tukey p = 0.01, 0.001 respectively, Figure 5). No 32P activitywas found in the total soil P pool at any time period.
The aboveground vegetation pool content (MBq m−2) did not differ over time,although the bogs and intermediate fens were higher than the rich fens (Tukey p =0.045, 0.042 respectively). No detectable 32P was found in the belowground veg-etation at any time period.
Discussion
31P pools
With increasing minerotrophy, there was a distinct change in the type of vegetationfound — a switch from primarily evergreen species to deciduous species (personal
Figure 4. Microbial Biomass 32P. Microbial 32P in the (a) 0–10 cm depth was greatest in the bogs andintermediate fens, with the exception of Day 30. Microbial 32P in the (b) 10–20 cm depth did not followthis pattern. Letters denote statistical differences within a sampling period (p < 0.05). Numbers denotestatistical differences among time periods within a peatlands type (p < 0.05). Error bars are ± 1 standarderror.
308
observation) corresponding to a hypothesized change in nutrient uptake from lowto high nutrient availability (Small 1972). However, we found no statistical differ-ence in aboveground vegetation biomass or P concentration (P mg g−1 vegetation)across the gradient. Nor did we find a difference among the peatland types withtotal vegetation P concentration (P mg g−1 vegetation). By using the vegetation nu-trient concentration as an indicator for nutrient availability (Chapin and Van Cleve1994) this demonstrates that available P is as high in the bog as the rich fen. Fur-thermore, the measured available 31P pool did not differ across the gradient. Thesetwo lines of evidence confirm that despite P inputs being larger in rich fens, bogsdo not necessarily have lower P availability.
Nevertheless, the P content (P mg m−2) of the aboveground vegetation increasedfrom bog to rich fen. This indicates that statistically insignificant differences in thebiomass (p = 0.095) of the aboveground vegetation combined with the P concen-tration produced differences large enough to be statistically significant for the Pcontent (P mg m−2). Therefore, the trend of increasing biomass from bog to richfen, though not statistically significant, is most likely real and is similar to resultsfound in other peatland studies of aboveground vegetation biomass (Szumigalskyand Bayley 1996).
We found in intermediate and rich fens that root biomass decreased with depth,which corresponded to a decrease in the microbial 31P biomass. A combination ofdecreasing nutrient availability with peat depth (e.g. Updegraff et al. (1995)) andincreasing anoxia associated with prolonged waterlogging (e.g. Megonigal and Day(1992)) will likely restrict root biomass to the more actively decomposing peat, aswe see in this study. As the root biomass in peatlands diminishes with depth, themicroorganisms associated with the rhizosphere would also be expected to de-crease. Recently, data has shown that the population distribution of soil microor-ganisms follows the growth pattern of roots, primarily due to the root exudates (van
Figure 5. 32P found in the available P pool. Day 14 was significantly higher in the intermediate and richfens (p < 0.05). Error bars are ± 1 standard error.
309
Bruggen et al. 2000). Further, with increasing depth, peat becomes more recalci-trant (Hogg 1993; Updegraff et al. 1995). This combination of decreasing root bio-mass and more recalcitrant carbon in the peat depth would be expected to cause adecrease in microbial 31P biomass, which we see in the intermediate and rich fens.
Conversely, in bogs, root biomass doubled with increasing depth, which has alsobeen seen in pine bogs (Håland and Brække 1989). In contrast, the 31P concentra-tion (mg g−1 vegetation) decreased. Furthermore, unlike the intermediate and richfens, the bog microbial 31P biomass did not decrease with depth. Because root bio-mass provides soil microorganisms labile carbon and nutrients in the form of rootexudates and habitats through the alteration of the soil medium, the increase in rootsat 10–20 cm depth in the bogs may have maintained the microbial biomass, eventhough decomposition and nutrients decrease with depth (Vitt 1990; Hogg 1993).However, the decreased nutrient concentration of the belowground vegetation com-bined with increasing recalcitrant material may limit microbial 31P biomass. Theequivalent microbial 31P pools with depth demonstrate that there are limitationsother than belowground vegetation restricting microorganism growth.
32P dynamics
In this study, the short-term retention of P was mediated in all peatland types pri-marily by biotic components. As in other studies in peatlands (Richardson andMarshall 1986; Walbridge 1991), the microbial pool was important for initial up-take of P, in some cases accounting for up to 75% of the total added 32P (Fig. 3a).However, microbial retention and its importance depended on peatland type. If weassume that 32P recovered in the litter layer was primarily associated with attachedmicrobial biomass (cf. Richardson and Marshall (1986)), then the soil microbialpool constituted half of the recovered 32P in the rich fens even though the 31P mi-crobial pool represented only 9–13% of the total soil 31P pool. Our results implythat microbial P uptake in minerotrophic wetlands is more important than previ-ously believed (Walbridge 1991; Walbridge and Struthers 1993).
However, the low recovery (<50% in most cases, Figure 2) of 32P in the richfens indicates either a loss from the system or adsorption to physical exchange sites,both of which could be geochemically driven. Although 32P was below our detec-tion limit in total soil P, we cannot rule out that some of the missing 32P in theminerotrophic peatlands may have been due to soil adsorption. The dilution causedby the digestion for total soil P combined with the disintegration of 32P beforecounting limited our ability to detect low levels of adsorbed 32P and could corre-spond to up to 15% of the original addition of 32P. Furthermore, the 31P pool in therich fen sites is three times higher than bogs and double the amount in the inter-mediate fens; therefore, we are confident that geochemical controls are active inthe rich fens. However, acid-fluoride promotes dissolution of aluminum phosphates(Susuki et al. 1963), and the low levels of 32P in this fraction suggests that alumi-num phosphates, even in the rich fens, were not a dominant geochemical P sinkover the 30 day incubation period.
310
The microbial pool was the dominant pool in the bog and intermediate fen sitesfor uptake and retention of P. Unlike the rich fens, the bog and intermediate fensites had very little surface litter. The behavior of the microbial pool has major im-plications for the maintenance of available P at higher than expected levels in themore ombrotrophic sites. This is illustrated by the high rate of initial microbial up-take, subsequent turnover, and reuptake that occurred in both the bogs and inter-mediate fens (Fig. 3a).
As in other studies in peatlands, the microbial pool in the bog and intermediatefen sites rapidly sequestered a large majority of the added 32P (Richardson andMarshall 1986; Walbridge and Vitousek 1987; Walbridge 1991). However, this ini-tial uptake was quickly (7 days) followed by a large release of 32P, which by Day30 had begun to be taken up again (Fig. 3a). Microbial activity has long been as-sumed to be lower in bogs than in the more minerotrophic systems due to pH re-strictions (Waughman 1980; Runge 1983), low nutrient levels (Fauci and Dick1994), and recalcitrant carbon (Clymo and Hayward 1982; Wilson and Fitter 1984;Bridgham et al. 1998; Chapin 1998). In this study, we have shown not only thatmicrobial biomass 31P was similar across the gradient, but also, microbial activityas P uptake was higher in the more ombrotrophic sites. Higher net mineralizationof P has also been found in peat from ombrotrophic peatlands (Verhoeven et al.1990; Bridgham et al. 1998). This high turnover rate insures greater than expectedvalues of available P in the soil solution within the more ombrotrophic sites eventhough P inputs may be low.
Aboveground vegetation also proved to be an important sink, which was con-sistent across the gradient. The percentage of the recovered 32P found in the veg-etation was approximately 50%, although in the bog this rose to 80% by Day 14(Fig. 3b) while the 31P vegetation pool was the second largest pool in all sites (totalsoil 31P being the largest). In all peatland types, we found no evidence that P wastranslocated from the aboveground plant parts to the roots or soil during the studyperiod that encompassed the early part of the growing season (June 1 to July 15).The initial uptake of the aerially applied 32P by aboveground vegetation was highin all the sites. Although uptake of aerially introduced nutrients is hypothesized tobe limited to the moss functional group (Malmer 1993; Bridgham et al. 1996), be-cause mosses were either absent or limited in the rich fens, we have shown that thevascular plants play a substantial role in aerial uptake.
Richardson and Marshall (1986) found that although under natural conditionsplants played an important role in P retention, microorganisms and adsorption weremore important. These findings contrast with this study in which the plant and mi-croorganisms appear to play equally important parts in uptake. However, the veg-etation may provide a stronger sink when P is introduced aerially by potentiallyalleviating competition between roots and microorganisms. This is especially im-portant in areas where dry and wet deposition of P may be a significant input inregions with oceanic aerosols, intense agricultural, wind-blown erosion, and burn-ing (Redfield 1998).
The function of the vegetation in bogs and intermediate fens in retention of Pwas both direct and indirect. The absolute amount of 32P found in the vegetation
311
did not change; therefore the vegetation effectively absorbed and retained the ap-plied 32P. However, due to changes in other pools, the percentage of the total re-covered 32P in vegetation differed with time. In the bog and intermediate fen sites,the percentage of the total recovered 32P found in the vegetation increased overtime until Day 14, after which there was a decrease caused by increasing uptake inmicrobial biomass (Figure 3). Thus, during our study, the vegetation tightly heldthe applied 32P, but the microbial pool was much more dynamic temporally.
Conclusions
From the results of this study, we conclude that the mechanisms controlling Pavailability and cycling do not necessarily respond to pH and hydrologic changesalong a gradient in a coordinated way. In agreement with our first hypothesis, wefound that P retention was greatest in sites with less input, although the intermedi-ate fens in this study acted similar to the bogs. This similarity may be caused bythe similarity of vegetation between the bog and intermediate fen sites. We dem-onstrated that retention is controlled primarily by vegetation and microorganismsin the bogs and intermediate fens, which correspond to the largest 31P pools also.
Our second hypothesis was partially confirmed in that we demonstrated that Pcycling in the bogs and intermediate fens is a closed cycle with primarily bioticretention mechanisms, as suggested by Richardson and Marshall (1986). However,retention of P in the rich fen was also greatly affected by the vegetation and mi-crobial pools. As percentages of the total recovered 32P, the vegetation and micro-bial pools in the rich fens were in the same range as the intermediate fens and bogs.But the rich fens seem to be responding to different mechanisms as shown by theoverall lower P retention. However, we may have underestimated phosphate ad-sorption to soil particles in the rich fens because of methodological limitations (i.e.,sample dilution and isotope disintegration), but at the maximum it would have rep-resented 15% of the added 32P. If this had been the case with the maximum amountadded into our findings, then retention of P within the rich fens would then havebeen divided equally among the total soil, vegetation, and microbial P pools, dem-onstrating that biotic control is still important in the more minerotrophic wetlands.
Finally, our third hypothesis of greater P availability in the more ombrotrophicsites was not supported in this study. The availability of P did not differ across thegradient, despite the larger P pools in the more minerotrophic sites. We found thatmicrobial biomass was highly dynamic within bogs and intermediate fens. Becauseof this constant turnover, P mineralization of microbial biomass is likely to be high,maintaining the observed availability of P. In conclusion, the P cycle in these peat-lands is controlled by factors that are not easily predicted from the hydrogeochemi-cal gradient of ombrotrophy to minerotrophy, but instead are controlled by subtledifferences in biota among the sites.
312
Acknowledgements
We would like to thank Dr Ronald Hellenthal, the Director of UNDERC, for boththe use of equipment and sites and Dennis Birdsell, the manager of the Center forEnvironmental Science and Technology at Notre Dame, for equipment and time.We also thank the Ottawa National Forest for the use of sites, and Kathrine Bart-nizak, Remster Bingham, Peter Weishampel, and Carmen Chapin for enduring longhours in both the field and lab. We are grateful to Mark Walbridge and ChevKellogg for helpful comments on experimental design, interpretation, and previousdrafts of this manuscript. This research was funded through an NSF Career grant(DEB9629415) to Scott Bridgham and a Bayer Fellowship administered throughthe Center for Environmental Science and Technology at the University of NotreDame to Laurie Kellogg.
References
Aerts R. 1999. Interspecific competition in natural plant communities: mechanisms, trade-offs andplant-soil feedbacks. Journal of Experimental Botany 50: 29–37.
Bedford B.L., Walbridge M.R. and Aldous A. 1999. Patterns in nutrient availability and plant diversityof temperate North American wetlands. Ecology 80: 2151–2169.
Berg B. and Tamm C.O. 1991. Decomposition and nutrient dynamics of litter in log-term optimum nu-trition experiments. I. Organic matter decomposition in Picea abies needle litter. Scandinavian Jour-nal of Forest Research 6: 305–321.
Bowden W.B. 1987. The biogeochemistry of nitrogen in freshwater wetlands. Biogeochemistry 4: 313–348.
Bridgham S.D., Updegraff K. and Pastor J. 2001. A comparison of nutrient availability indices along anombrotrophic-minerotrophic gradient in Minnesota wetlands. Soil Sci. Soc. of Am. J. 65: 259–269.
Bridgham S.D., Updegraff K. and Pastor J. 1998. Carbon, nitrogen, phosphorus mineralization in north-ern wetlands. Ecology 79: 1545–1561.
Bridgham S.D., Pastor J., Janssens J.A., Chapin C.T. and Malterer J. 1996. Multiple limiting gradientsin peatlads: A call for a new paradigm. Wetlands 16: 45–65.
Brookes P.C., Powlson D.S. and Jenkinson D.S. 1984. Phosphorus in the soil microbial biomass. SoilBiology and Biochemistry 16: 169–175.
Chapin C.T. 1998. Plant community response and nutrient dynamics as a result of manipulations of pHand nutrients in a bog and fen in northeastern Minnesota. PhD Dissertation, University of NotreDame, Notre Dame, USA.
Chapin F.S. III and Van Cleve K. 1994. Approaches to studying nutrient uptake, use and loss in plants.In: Pearcy R.W., Ehleringer J., Mooney H.A. and Rundel P.W. (eds), Plant Physiological Ecology.Chapman and Hall, London.
Chapin F.S. III, Barsdale R.J. and Barel D. 1978. Phosphorus cycling in Alaska coastal tundra: a hypo-thesis for the regulation of nutrient cycling. Oikos 31: 188–199.
Chiang C., Craft C.B., Rogers D.W. and Richardson C.J. 2000. Effects of 4 years of nitrogen and phos-phorus additions on Everglades plant communities. Aquatic Botany 68: 61–78.
Clymo R.S. and Hayward P.M. 1982. Chapter 8: The ecology of Sphagnum. In: Smith A.J.E. (ed.),Bryophyte Ecology. Chapman & Hall, London.
Craft C.B. and Richardson C.J. 1997. Relationship between soil nutrients and plant species compositionin Everglades peatlands. J. Environ. Qual. 26: 224–232.
Damman A.W.H. 1986. Hydrology, development and biogeochemistry of ombrogenous peat bogs withspecial reference to nutrient allocations in a western Newfoundland bog. Can. J. Bot. 64: 384–394.
313
Damman A.W.H. 1988. Regulation of nitrogen removal and retention in Sphagnum bogs and other peat-lands. Oikos 51: 291–305.
Davis S.M. 1989. Sawgrass and cattail production in relation to nutrient supply in the Everglades. In:Sharitz R.R. and Gibbins J.W. (eds), Freshwater Wetlands and Wildlife. CONF-8603101, DOE sym-posium series no. 61. USDOE Office of Scientific and Technical Information, Oak Ridge, TN, USA.
Fauci M.F. and Dick R.P. 1994. Soil microbial dynamics: Short- and long-term effects of inorganic andorganic nitrogen. Soil Sci. Soc. Am. J. 58: 801–806.
Golterman H.L. 1995. The labyrinth of nutrient cycles and buffers in wetlands: results based on researchin the Camargue (southern France). Hydrobiologia 315: 39–58.
Håland B. and Brække F.H. 1989. Distribution of root biomass in a low-shrub pine bog. Scand. J. ofForest Research 4: 307–316.
Hedin L.O., von Fischer J.C., Ostrom N.E., Kennedy B.P., Brown M.G. and Robertson G.P. 1998. Ther-modynamic constraints on nitrogen transformations and other biogeochemical processes at soil-stream interfaces. Ecology 79: 684–703.
Hedin L.O., Armesto J.J. and Johnson A.H. 1995. Patterns of nutrient loss from unpolluted old-growthtemperate forests: Evaluation of biogeochemical theory. Ecology 76: 493–509.
Hogg E.H. 1993. Decay potential of hummock and hollow Sphagnum peats at different depths in aSwedish raised bog. Oikos 66: 269–278.
Jayachandran K., Schwab A.P. and Hetrick B.A.D. 1992. Partitioning dissolved inorganic and organicphosphorus using acidified molybdate and isobutanol. Soil Science Society of America Journal 56:762–765.
Jonasson S., Michelsen A., Schmidt I.K. and Nielsen E.V. 1999. Responses in microbes and plants tochanged temperature, nutrient, and light regimes in the arctic. Ecology 80: 1828–1843.
Lowther J.R. 1980. Use of a single sulfuric acid and hydrogen peroxide digest for the analysis of Pinusradiata needles. Comm. Soils Sci. Plant Analysis 11: 1785–1788.
Malmer N. 1993. Mineral nutrients in vegetation and surface layers of Sphagnum-dominated peat-form-ing systems. Adv. Bryology. 5: 223–248.
Megonigal J.P. and Day F.P. 1992. Effects of flooding on root and shoot production of bald cypress inlarge experimental enclosures. Ecology 4: 1182–1193.
Moore P.D. and Bellamy D.J. 1974. Peatlands. Springer-Verlag, New York, NY, USA.Olsen S.R. and Sommers L.E. 1982. Phosphorus. In: Miller R.H. and Keeney D.R. (eds), Methods of
Soil Analysis. Part 2. Chemical and Microbiological Properties. 2nd edn. American Society ofAgronomy, Madison, WI, USA, pp. 403–430.
Pomeroy L.R. 1970. The strategy of mineral cycling. Annu. Rev. of Ecol. Syst. 1: 171–190.Redfield G.W. 1998. Quantifying atmospheric deposition of phosphorus: a conceptual model and litera-
ture review for environmental management. Technical publication WRE #360. South Florida WaterManagement District, West Palm Beach, FL, USA.
Richardson C.J. and Marshall P.E. 1986. Processes controlling movement, storage, and export of phos-phorus in a fen peatland. Ecological Monographs 56: 279–302.
Richardson C.J. and Qian S.S. 1999. Long-term phosphorus assimilative capacity in freshwater wet-lands: A new paradigm for sustaining ecosystem structure and function. Environ. Sci. Technol. 33:1545–1551.
Runge M. 1983. Chapter 5: Physiology and Ecology of Nitrogen Nutrition. In: Lange O.L., Nobel P.S.,Osmond C.B. and Ziegler H. (eds), Physiological Plant Ecology III: Response to the chemical andbiological environment. Springer-Verlag, Berlin, pp. 163–200.
Small E. 1972. Photosynthetic rates in relation to nitrogen recycling as an adaptation to nutrient defi-ciency in peat bog plants. Canadian Journal of Botany. 50: 2227–2233.
Susuki A.K., Lawton K. and Doll E.C. 1963. Phosphorus uptake and soil tests as related to forms ofphosphorus in some Michigan soils. Soil Sci. Soc. Am. J. 31: 752–756.
Szumigalsky A.R. and Bayley S.E. 1996. Net above-ground primary production along a bog-rich fengradient in central Alberta, Canada. Wetlands 4: 467–476.
Updegraff K., Pastor J., Bridgham S.D. and Johnson C.A. 1995. Environmental and substrate controlsover carbon and nitrogen mineralization in northern wetlands. Ecological Applications 5: 151–163.
314
van Breemen N. and Finzi A.C. 1998. Plant-soil interactions: ecological aspects and evolutionary im-plications. Biogeochemistry 42: 1–19.
van Bruggen A.H.C., Semenov A.M. and Zelenev V.V. 2000. Wavelike distributions of microbial popu-lations along an artificial root moving through soil. Microbial Ecology 40: 250–259.
Verhoeven J.T.A., Maltby E. and Schmitz M.B. 1990. Nitrogen and phosphorus mineralization in fensand bogs. Journal of Ecology 78: 713–726.
Vermeer J.G. and Berendse F. 1983. The relationship between nutrient availability, shoot biomass andspecies richness in grassland and wetland communities. Vegetatio 53: 121–126.
Vitt D.H. 1990. Growth and production dynamics of boreal mosses over climatic, chemical and topo-graphic gradients. Botannical Journal of the Linnean Society 104: 35–59.
Vitousek P.M. and Howarth R.W. 1991. Nitrogen limitation on land and in the sea: How can it occur?Biogeochemistry 13: 87–115.
Vitousek P.M. and Matson P.A. 1991. Gradient Analysis of Ecosystems. In: Cole J., Lovett G. and Find-lay S. (eds), Comparative Analyses of Ecosystems: Patterns, mechanisms, and theories. Springer-Verlag, New York, NY, USA, pp. 287–297.
Vitousek P.M., Aber J.D., Howarth R.W., Likens G.E., Matson P.A., Schindler D.W. et al. 1997. Humanalteration of the global nitrogen cycle: Sources and consequences. Ecological Applications 7: 737–750.
Walbridge M.R. 1991. Phosphorous availability in acid organic soils of the lower North Carolina coastalplain. Ecology 72: 2083–2100.
Walbridge M.R. and Struthers J.P. 1993. Phosphorus retention in non-tidal palustrine forested wetlandsof the mid-Atlantic region. Wetlands 13: 84–94.
Walbridge M.R. and Vitousek P.M. 1987. Phosphorus mineralization potentials in acid organic soils:Processes affecting 32PO4
−3 isotope dilution measurements. Soil Biol. Biochem. 19: 709–717.Waughman G.J. 1980. Chemical aspects of the ecology of some south German peatlands. Journal of
Ecology 68: 1025–1046.Wilson K.A. and Fitter A.H. 1984. The role of phosphorus in vegetational differentiation in a small
valley mire. Journal of Ecology 72: 463–473.Zar J.H. 1996. Biostatistical Analysis. Prentice Hall, Upper Saddle River, NJ, USA.
315

Related Documents