MSA PROFESSIONAL SERVICES, INC. | More ideas. Better Solutions. © 2014 by MSA Professional Services Presentation prepared for: Wisconsin Wastewater Operator Association 2015 Wisc. Dells October 8 th , 2015 | Mark Lundgren Phosphorus Removal Going from 1 ppm to 0.075 ppm in Cumberland, WI

Welcome message from author
This document is posted to help you gain knowledge. Please leave a comment to let me know what you think about it! Share it to your friends and learn new things together.
Transcript

MSA PROFESSIONAL SERVICES, INC. | More ideas. Better Solutions. © 2014 by MSA Professional Services
Presentation prepared for: Wisconsin Wastewater Operator Association 2015 Wisc. Dells October 8th, 2015 | Mark Lundgren
Phosphorus Removal Going from 1 ppm to 0.075 ppm in
Cumberland, WI

MSA PROFESSIONAL SERVICES, INC. | More ideas. Better Solutions. © 2014 by MSA Professional Services
What is your current P Limit?

MSA PROFESSIONAL SERVICES, INC. | More ideas. Better Solutions. © 2014 by MSA Professional Services
Cumberland, WI
Population: 2,152 Phosphorus Effluent Limit: 0.075 mg/l
MSA PROFESSIONAL SERVICES, INC. | More ideas. Better Solutions. © 2014 by MSA Professional Services
Agenda » State of Nutrient Regulations + Policy » Cumberland WI Story » Q & A

MSA PROFESSIONAL SERVICES, INC. | More ideas. Better Solutions. © 2014 by MSA Professional Services
Nutrient Pollution – Why Care?


MSA PROFESSIONAL SERVICES, INC. | More ideas. Better Solutions. © 2014 by MSA Professional Services

MSA PROFESSIONAL SERVICES, INC. | More ideas. Better Solutions. © 2014 by MSA Professional Services
Children playing in cyanobacterial bloom

MSA PROFESSIONAL SERVICES, INC. | More ideas. Better Solutions. © 2014 by MSA Professional Services
What does that mean for my plant?

MSA PROFESSIONAL SERVICES, INC. | More ideas. Better Solutions. © 2014 by MSA Professional Services
PERMIT

MSA PROFESSIONAL SERVICES, INC. | More ideas. Better Solutions. © 2014 by MSA Professional Services
Why low limits in WI?

MSA PROFESSIONAL SERVICES, INC. | More ideas. Better Solutions. © 2014 by MSA Professional Services

MSA PROFESSIONAL SERVICES, INC. | More ideas. Better Solutions. © 2014 by MSA Professional Services
Wisconsin Level
» 2009 - Environmental Groups file lawsuit » 2010 – EPA Sends warning to WDNR to adopt
new phosphorus standards by 2010 and nitrogen standards by 2013
» Dec 1, 2010 WI Phosphorus Water Quality Standards updated • Created water quality standards in surface waters • WPDES permits issued to point sources • Tightened Ag performance standards
» 2012 EPA approves WI phosphorus program

MSA PROFESSIONAL SERVICES, INC. | More ideas. Better Solutions. © 2014 by MSA Professional Services
National Level - EPA Lawsuit » 2005 – Mississippi River Collaborative (MRC) is formed.
• Includes Minnesota Center for Environmental Advocacy » 2008 – MRC files petition to force EPA to act on
hypoxia. » 2011 – EPA denies petition. » 2012 – MRC files lawsuit against EPA denial. » 2013 – Court rules for MRC. EPA must respond to
original hypoxia petition in 6 months. » 2013 – EPA appeals court decision. Granted stay of
deadline to respond. » More to come . . . .

MSA PROFESSIONAL SERVICES, INC. | More ideas. Better Solutions. © 2014 by MSA Professional Services
Comprehensive National Mississippi Nutrient Regulations
Coming?

MSA PROFESSIONAL SERVICES, INC. | More ideas. Better Solutions. © 2014 by MSA Professional Services
Cumberland WWTP - Existing

MSA PROFESSIONAL SERVICES, INC. | More ideas. Better Solutions. © 2014 by MSA Professional Services
Cumberland WI WWTP - Phosphorus
» Design Flow 0.4 MGD » Typical Flow 0.18 MGD » No major upgrade since 1980 » Current Plant Effluent Average
• 9 lbs / day total P (2.7 mg/l) » Previous Permit
• 1 mg/l P (1,218 lbs total per year) • City did NOT meet limits • Participated in Red Cedar River Phosphorus Trading
Program 2 to 1 trade with Ag Sources ~4000 lbs /yr trade (~$16,000 per year in payments)

MSA PROFESSIONAL SERVICES, INC. | More ideas. Better Solutions. © 2014 by MSA Professional Services
2010 WDNR Phosphorus Rules
» Added Water Quality Based Effluent Limit (WQBEL) to TMDL for Hay River
» New limit 0.075 mg/l P (91 lbs / yr) • City would have to offset 3,200 lbs / yr through
trading
» Two options for offsetting P: • Adaptive Management • P Trading

MSA PROFESSIONAL SERVICES, INC. | More ideas. Better Solutions. © 2014 by MSA Professional Services
P Trading
» Trading reduced to upstream only partners in 2010 rules update

MSA PROFESSIONAL SERVICES, INC. | More ideas. Better Solutions. © 2014 by MSA Professional Services
Adaptive Management
» Adaptive management requires 5:1 trade • 16,000 lbs/yr would need to be offset to meet
permit • $64,000 / yr in offsets $1.2 million over 20 year lifespan
• Improvement in instream P levels MUST be seen over 10 year permit cycle No guarantee for no further action
» Neither P Trading or Adaptive Mgmt works for Cumberland

MSA PROFESSIONAL SERVICES, INC. | More ideas. Better Solutions. © 2014 by MSA Professional Services
How to meet 0.075 mg / L P Limit?
» “Typical” Influent = 4.0 – 12.0 mg/L » Some P is removed in biological treatment process
• About 2% of cell biomass is phosphorus • Ponds & Lagoons = less TP removed • Activated sludge = more TP removed
2005 MPCA study of 59 activated sludge treatment plants found an average removal of 47%
» Cumberland RBC poor P removal efficiency • ~25% removal of influent P • 20+ years old
» Cumberland needs additional P treatment

MSA PROFESSIONAL SERVICES, INC. | More ideas. Better Solutions. © 2014 by MSA Professional Services
Decision Time
» City decides to go for upgrade • High cost of payments to farmers • No guarantee that adaptive management will
meet permit requirements
» Options to meet limits • Oxidation Ditch w tertiary filter • Membrane Bioreactor

MSA PROFESSIONAL SERVICES, INC. | More ideas. Better Solutions. © 2014 by MSA Professional Services
Oxidation Ditch Pros: Easy to Operate. Less Cost. Less Equipment.
Cons: Provides 1mg/l P in Effluent. Provides 0.5 mg/l P with Chemical Addition. Requires Additional Treatment.
MSA PROFESSIONAL SERVICES, INC. | More ideas. Better Solutions. © 2014 by MSA Professional Services
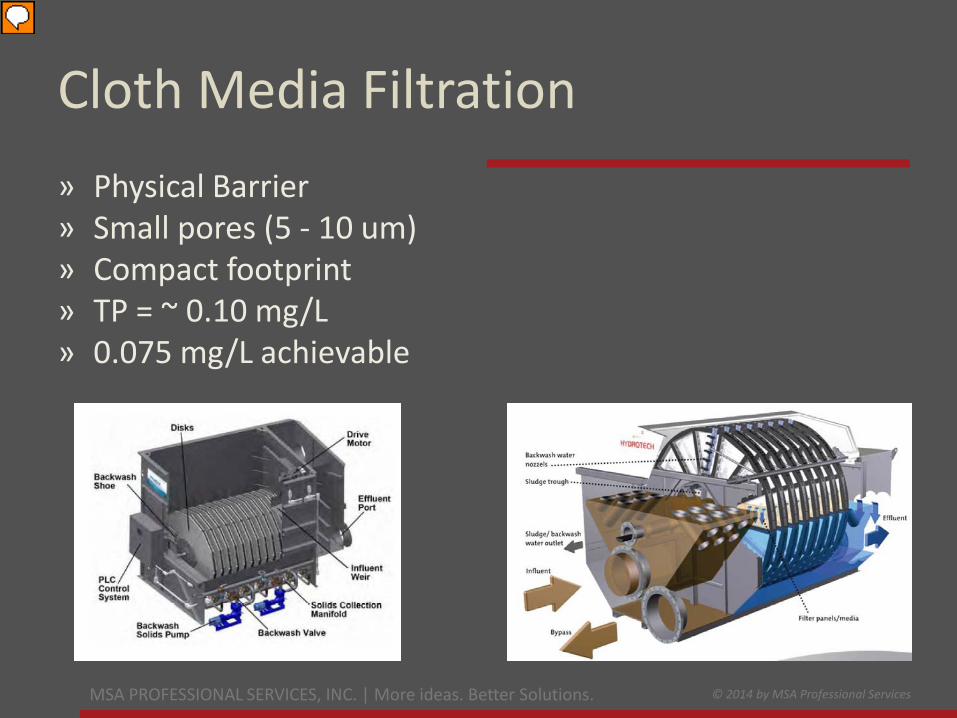
» Physical Barrier » Small pores (5 - 10 um) » Compact footprint » TP = ~ 0.10 mg/L » 0.075 mg/L achievable
Cloth Media Filtration
Presenter
Presentation Notes
Filtration Mode • Inlet wastewater enters filter • Cloth media is completely submerged • Disks are stationary • Solids deposit on outside of cloth media forming a mat as filtrate flows through the media • Tank liquid level rises • Flow enters the filter by gravity and filtrate is collected inside the disks and discharged • Heavier solids settle to tank bottom Backwash Mode • Solids are backwashed at a predetermined liquid level or time • Backwash shoes contact the media directly and solids are removed by vacuum pressure of the backwash pump • Two disks are backwashed at a time (unless a single disk is utilized) • Disks rotate slowly • Filtration is not interrupted • Backwash water is directed to headworks Solids Wasting Mode • Heavier solids on the tank bottom are removed on an intermittent basis • Solids are pumped back to the headworks, digester or other solids collection area of the treatment plant

MSA PROFESSIONAL SERVICES, INC. | More ideas. Better Solutions. © 2014 by MSA Professional Services
» Deep Bed Sand
Filters » Filtration of TP » Filtration +
Adsorption • Can add Hydrous
Ferric Oxide (HFO) Coating to sand to gather more P
» Larger footprint » TP = ~ 0.05 – 0.10
mg/L » 3 ft headloss per
filter » 6 ft headloss in
series
2-Stage Upflow Sand Filtration
Presenter
Presentation Notes
Influent enters the center of the filter through a central feed chamber. The central feed chamber has a series of radial arms to evenly distribute the influent flow to the media bed near the bottom of the filter. As the water flows upward through the filter media suspended and colloidal solids are removed. Filtrate exits the filter near the top and flows over a fixed weir plate that maintains a constant level. The solids that are captured in the filter media are drawn downward into a recessed chamber located below the lower cone by the suction of the airlift pump. The high energy, turbulent upward flow inside the airlift provides a scrubbing action that effectively separates the sand and the captured solids before discharging them in the washbox at the top of the filter. The washbox is a baffled chamber that allows for counter-current washing and gravity separation of the filter media and the captured solids. Media cleaning is accomplished utilizing filtered water from the upper chamber of the filter. Regenerated filter media is returned to the top of the filter bed as it falls by gravity from the counter-current washer. An adjustable V-notch weir directs the reject flow out of the filter carrying concentrated captured solids to a suitable disposal point.

MSA PROFESSIONAL SERVICES, INC. | More ideas. Better Solutions. © 2014 by MSA Professional Services
Pros: Effluent 0.075 mg/l P. Modular Units. No Additional Treatment Needed. Flexibility for Future Regs.
MEMBRANE BIO REACTOR (MBR)
Cons: Higher Cost. Proprietary. More Equipment, Single Source Vendor. “New” Technology.

MSA PROFESSIONAL SERVICES, INC. | More ideas. Better Solutions. © 2014 by MSA Professional Services
» Greatest Degree of Solids Separation » MicroFiltration (MF)
• 0.1 – 3.0 um » UltraFiltration (UF)
• 0.01 – 0.1 um
Membranes

MSA PROFESSIONAL SERVICES, INC. | More ideas. Better Solutions. © 2014 by MSA Professional Services
» TP < 0.05 mg/L » Small Footprint » Energy Intensive » Typically not gravity flow
• Permeate suction pumps
Membranes

MSA PROFESSIONAL SERVICES, INC. | More ideas. Better Solutions. © 2014 by MSA Professional Services
» Operate at elevated MLSS » Membranes used instead of final clarifiers » Metal Salt addition to MLSS ahead of membranes » TP < 0.05 mg/L possible » Requires excellent (redundant) fine screening
• < 3 mm (0.12 in)
Membrane Bioreactors (MBRs)

MSA PROFESSIONAL SERVICES, INC. | More ideas. Better Solutions. © 2014 by MSA Professional Services
Cumberland WWTP Cost Analysis: Cost Consideration
Oxidation Ditch W Tertiary Filter Membrane Bio Rector
2014 Capital Cost $1,582,000 $2,196,000
2019 Capital Cost $600,000 $223,000
2015-2025 Annual O&M Cost $49,000 $49,000
2025-2035 Annual O&M Cost $49,000 $49,000
Total Cost 2015 thru 2035 $3,320,000 $3,396,000

MSA PROFESSIONAL SERVICES, INC. | More ideas. Better Solutions. © 2014 by MSA Professional Services

MSA PROFESSIONAL SERVICES, INC. | More ideas. Better Solutions. © 2014 by MSA Professional Services
» Enhanced Biological Phosphorus Removal » Chemical Addition (Optional) » MBR » Total P = 0.03 mg/l (Modeled)
What are we doing in Cumberland?
MBR MBR
Anoxic
Anaerobic
INFLUENT
EFFLUENT
FINE SCREENS
CHEMICAL ADDITION
CHEMICAL ADDITION

MSA PROFESSIONAL SERVICES, INC. | More ideas. Better Solutions. © 2014 by MSA Professional Services
» Capital Cost Similar to Oxidation Ditch with Tertiary
Filter » More reliable effluent quality » More flexibility to meet future regulations
Main Reasons for MBR

MSA PROFESSIONAL SERVICES, INC. | More ideas. Better Solutions. © 2014 by MSA Professional Services
Ovivo Membrane System

MSA PROFESSIONAL SERVICES, INC. | More ideas. Better Solutions. © 2014 by MSA Professional Services

MSA PROFESSIONAL SERVICES, INC. | More ideas. Better Solutions. © 2014 by MSA Professional Services

MSA PROFESSIONAL SERVICES, INC. | More ideas. Better Solutions. © 2014 by MSA Professional Services
» $7.6 Million Upgrade
• New screening • New MBR Building • Misc Equipment Replacements • Anaerobic Digesters Aerobic Digesters
» Average Residential User Charge for Cumberland • $39.25 $55 / month (40% increase)
Cost?

MSA PROFESSIONAL SERVICES, INC. | More ideas. Better Solutions. © 2014 by MSA Professional Services
Thank You! Questions?

MSA PROFESSIONAL SERVICES, INC. | More ideas. Better Solutions. © 2014 by MSA Professional Services
National Nutrient Regulation
» EPA • Gives states technical guidance to states on how
to deal with nutrient pollution • Helps States develop water quality criteria for
incorporating nutrient regulations into state policy • Helps States develop TMDLs (Total Maximum Daily
Load) allocations for nutrients
» States • Figure out the details and implementation

MSA PROFESSIONAL SERVICES, INC. | More ideas. Better Solutions. © 2014 by MSA Professional Services
Minnesota – Watershed Approach » Step 1. Monitor water
bodies and collect data » Step 2. Assess the data » Step 3. Develop strategies
to restore and protect the watershed's water bodies
» Step 4. Conduct restoration and protection projects in the watershed
Wisconsin Approach very similar . . .

MSA PROFESSIONAL SERVICES, INC. | More ideas. Better Solutions. © 2014 by MSA Professional Services
» Use a “ballast”
• Create ‘heavy’ floc • Micro-Sand/Lamella Clarifier • Magnetite/Circular Clarifier
» Fast Settling • Small Footprint
» Capture and Reuse Ballast » Fair amount of moving parts » TP = ~0.05 – 0.1 mg/L » Many demonstration tests
in WI (2012-2014) • < 0.05 mg/L achievable
» ~ 1 ft headloss
Ballasted Clarification

MSA PROFESSIONAL SERVICES, INC. | More ideas. Better Solutions. © 2014 by MSA Professional Services
Ballasted Clarification

MSA PROFESSIONAL SERVICES, INC. | More ideas. Better Solutions. © 2014 by MSA Professional Services
Ballasted Clarification

MSA PROFESSIONAL SERVICES, INC. | More ideas. Better Solutions. © 2014 by MSA Professional Services
» Adsorption-enhanced
filtration may yield lower chemical use
» Hydrous Ferric Oxide (HFO) Coating • P is adsorbed onto sand • HFO and P abraded
during backwash • Sand re-charged with
HFO
Reactive Upflow Sand Filtration
Presenter
Presentation Notes
HFO = Hydrous Ferric Oxide floc; scanning electron microscopy – X-ray fluorescence

MSA PROFESSIONAL SERVICES, INC. | More ideas. Better Solutions. © 2014 by MSA Professional Services
Coagulation Tank Contents

MSA PROFESSIONAL SERVICES, INC. | More ideas. Better Solutions. © 2014 by MSA Professional Services
Flocculation Tank Contents

MSA PROFESSIONAL SERVICES, INC. | More ideas. Better Solutions. © 2014 by MSA Professional Services
» Dose coagulant after secondary clarifier, ahead of filter » Rapid Mix » Coagulation » Flocculation » Add Polymer at Flocculation Stage
Cloth Media Filtration – Flow Diagram

MSA PROFESSIONAL SERVICES, INC. | More ideas. Better Solutions. © 2014 by MSA Professional Services
» Goal
• Convert phosphorus to a form that can be separated from the final effluent (settling or filtration)
» How?
• Chemical addition to make dissolved P settleable or filterable
• Biological Treatment to Increase P in waste sludge • Advanced P Removal Technologies
Additional P Removal

MSA PROFESSIONAL SERVICES, INC. | More ideas. Better Solutions. © 2014 by MSA Professional Services
Options for Cumberland

MSA PROFESSIONAL SERVICES, INC. | More ideas. Better Solutions. © 2014 by MSA Professional Services
Phosphorus Speciation (Effluent)
» Soluble Reactive P • “Reactive” with metal salts to form precipitate
» Soluble Non-reactive P • Passes through treatment • Typically small fraction (0.01 – 0.03 mg/L)
Ortho-P
Total Phosphorus (TP)
Soluble Reactive P (sRP)
Soluble Non-reactive P (sNRP)
Colloidal P
Particulate P

MSA PROFESSIONAL SERVICES, INC. | More ideas. Better Solutions. © 2014 by MSA Professional Services
» Add a metal salt to bind with soluble reactive phosphate
• Calcium-based (lime) • Iron-based (Ferric Chloride, Ferrous Sulfate) • Aluminum-based (Alum, Polyaluminum Chloride)
Chemical Phosphorus Removal

MSA PROFESSIONAL SERVICES, INC. | More ideas. Better Solutions. © 2014 by MSA Professional Services
» The lower you go, the greater the dosage rate
required • Need greater chemical concentration in water to “find” the
remaining phosphorus
» Molar Ratios (moles of metal:moles of Phosphorus) • 5 mg/L 0.8 mg/L : Molar Ratio ~ 1.2:1 to 1.5:1 • 0.8 mg/L 0.5 mg/L: Molar Ratio ~ 1.5:1 to 3.5:1 • 0.5 mg/L 0.2 mg/L: Molar Ratios ~ 3.5:1 to 10:1 • 0.2 mg/L 0.04 mg/L: Molar Ratios ~10:1 to >30:1
Chemical Phosphorus Removal

MSA PROFESSIONAL SERVICES, INC. | More ideas. Better Solutions. © 2014 by MSA Professional Services
Molar Ratios Getting from 6 mg/L to 0.8 mg/L

MSA PROFESSIONAL SERVICES, INC. | More ideas. Better Solutions. © 2014 by MSA Professional Services
Molar Ratios Getting from 0.8 mg/L to 0.4 mg/L!

MSA PROFESSIONAL SERVICES, INC. | More ideas. Better Solutions. © 2014 by MSA Professional Services
» Inject at head of primary and/or secondary clarifiers
• Well-mixed area yields best results
» Chemically bound TP solids are settled and removed » Typical Dosing Molar Ratios (Metal:TP) = 1.2 to 2.0 » Final effluent TP = 0.5 mg/L » Increased sludge production from chemical addition
Chemical Phosphorus Removal

MSA PROFESSIONAL SERVICES, INC. | More ideas. Better Solutions. © 2014 by MSA Professional Services
» Create conditions to grow specific biomass (PAO’s)
• Cycle between anaerobic and aerobic phase • PAOs consume VFAs and release stored polyphosphate in anaerobic conditions, building up
carbon reserves • In aerobic conditions, PAOs multiply and take up more phosphate than was released in the
anaerobic phase • RAS returns the PAOs to the anaerobic stage to build up the population and keep the process
running
Biological Phosphorus Removal

MSA PROFESSIONAL SERVICES, INC. | More ideas. Better Solutions. © 2014 by MSA Professional Services
» Need specific influent conditions for Bio-P
• BOD:P Ratio = 15:1 to 25:1 (the higher the better) • Enough Volatile Fatty Acids (VFAs) for PAO’s to compete
with other biology
» Final effluent TP = 0.4 mg/L to >1.0 mg/L
» Upsets common in some facilities » Effluent TSS must be kept low
Biological Phosphorus Removal

MSA PROFESSIONAL SERVICES, INC. | More ideas. Better Solutions. © 2014 by MSA Professional Services
ARGGGG!!!! (Bored Yet???)

MSA PROFESSIONAL SERVICES, INC. | More ideas. Better Solutions. © 2014 by MSA Professional Services
Cumberland WWTP 4 Phosphorus Considerations: DNR REQUIREMENTS: Oxidation Ditch: MBR: 2016 Establish Effluent P 2015 MBR On-line *2017 P = 1mg/l No P Trading *2016 Meet 0.075 mg/l P 2018 P Options: Review Filtration, Storm Water, MBR, Bio P with Chemicals, Trading in Effluent 2019 Implement Option: e.g. MBR or Trading * Based on 9/3/13 correspondence with Kathy Bartilson @DNR

MSA PROFESSIONAL SERVICES, INC. | More ideas. Better Solutions. © 2014 by MSA Professional Services
It’ll get better…
MSA PROFESSIONAL SERVICES, INC. | More ideas. Better Solutions. © 2014 by MSA Professional Services
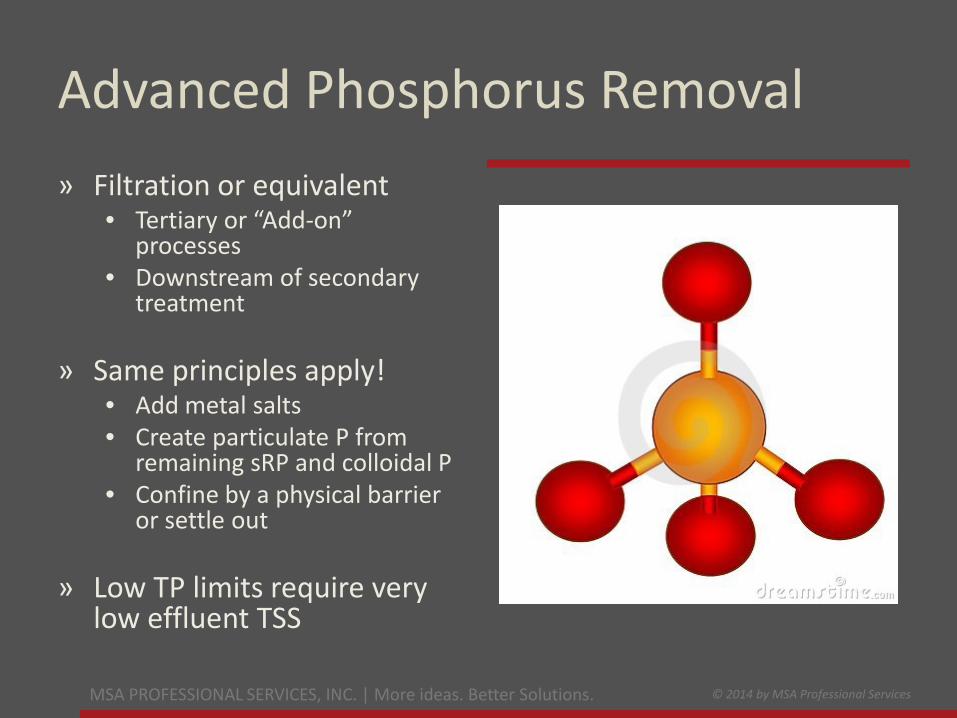
» Filtration or equivalent
• Tertiary or “Add-on” processes
• Downstream of secondary treatment
» Same principles apply! • Add metal salts • Create particulate P from
remaining sRP and colloidal P • Confine by a physical barrier
or settle out
» Low TP limits require very low effluent TSS
Advanced Phosphorus Removal

MSA PROFESSIONAL SERVICES, INC. | More ideas. Better Solutions. © 2014 by MSA Professional Services
» Cloth Media Filtration (pile cloth, micro-screens)
» Sand Filtration (2-stage upflow, 2-stage reactive) » Membrane Filtration (microfiltration, ultrafiltration,
MBR)
Advanced Phosphorus Removal

MSA PROFESSIONAL SERVICES, INC. | More ideas. Better Solutions. © 2014 by MSA Professional Services
» How Strict* is your Limit?
• 0.5 – 1.0 mg/L – “standard” Chem-P, EPBR, EPBR + Chem P • 0.3 – 0.5 mg/L – sand filtration, CMF • 0.3 – 0.1 mg/L – CMF, 2SUSF • 0.075 – 1.0 mg/L – CMF?, R2SUSF • 0.04 - 0.075 mg/L –R2SUSF, 2SUSF, MF, UF, MBR • <0.040 – R2SUSF, UF, MBR, RO
What Technologies to Consider?
CMF = Cloth Media Filtration MF = Microfiltration
2SUSF = 2 Stage Upflow Sand Filtration UF = Ultrafiltration
RO = Reverse Osmosis MBR = Membrane BioReactor
EBPR = Enhanced Biological Phosphorus Removal Chem-P = Chemical Phosphorus Removal
R2SUSF = Reactive 2 Stage Upflow Sand Filtration *Limits and corresponding technologies indicated are the author’s opinion. They are provided as a possible starting point for evaluation and cost effectiveness determination.
Related Documents


![China MSA Futures Professional Engagement MSA Scenarios V14 US.pdf[CHINA MSA PROFESSIONAL ENGAGEMENT] February 17, 2016 3 This is a plausible future scenario, part of a composite set](https://static.cupdf.com/doc/110x72/5ee25ee0ad6a402d666cdf06/china-msa-futures-professional-engagement-msa-scenarios-v14-uspdf-china-msa-professional.jpg)