Food Security Assessment Palo, Tanauan, Santa Fe and Pastrana Municipalities Leyte Province, Philippines February 13, 2014

PHL_LEYTE_FS_ASSESSMENT_SP_FEB_2014_FINAL
Jul 19, 2015
Welcome message from author
This document is posted to help you gain knowledge. Please leave a comment to let me know what you think about it! Share it to your friends and learn new things together.
Transcript

Food Security Assessment
Palo, Tanauan, Santa Fe and Pastrana Municipalities
Leyte Province, Philippines
February 13, 2014

2014 Food Security Assessment, Leyte Province, Philippines 1
ACKNOWLEDGMENTS
Special appreciation should be given to the Samaritan’s Purse (SP) field teams in the Philippines
for their cooperation and diligence in carrying out the household surveys. Without their
endurance and commitment, it would not have been possible to formulate this report.
Samaritan’s Purse is especially grateful to all the interviewees who took time to respond to the
questionnaire and graciously welcomed staff into their homes.

2014 Food Security Assessment, Leyte Province, Philippines 2
TABLE OF CONTENTS
1. EXECUTIVE SUMMARY……………………………………………………………....3
2. INTRODUCTION………………………………………………………………………..4
3. METHODOLOGY…………………………………………………………………….....4
4. GENERAL FINDINGS………………………………………………………………......6
4.1 Household Demographics…………………………………………………........6
4.2 Displacement…………………………………………………………………….7
5. FOOD SECURITY FINDINGS………………………………………………………....7
5.1 Food Assistance………………………………………………………………….7
5.2 Food Consumption Score………………………………………………………8
5.3 Food Security…………………………………………………………………..10
5.4 Household Income and Expenditure…………………………………...…….12
5.5 Markets……………………………………………………………………........16
6. CONCLUSION…………………………………………………………………….…16
7. RECOMMENDATIONS…………………………………………………………….17
APPENDIX 1—HOUSEHOLD ASSESSMENT QUESTIONNAIRE…………………18

2014 Food Security Assessment, Leyte Province, Philippines 3
1. EXECUTIVE SUMMARY
Between January and early February of 2014, Samaritan’s Purse (SP) undertook an assessment
of the Palo, Pastrana, Santa Fe, and Tanauan municipalities in Philippines's Leyte Province.
Leyte, part of the Eastern Visayas region of the Philippines, underwent devastation of
catastrophic proportion caused by Typhoon Haiyan on November 8th
, 2013. The four
municipalities SP selected to assess were areas of operation which have an ongoing joint
SP/WFP general food distribution program (as well as an organizational multi-sectoral response).
Samaritan’s Purse carried out this assessment in order to determine the impact of food aid (rice)
received in the municipalities, as well as to clearly determine the current food security situation
in these areas.
For this assessment, SP staff undertook a Household (HH) survey using the cluster survey
methodology with 805 HHs. The first stage of the sampling utilized a proportional stratified
random sampling at the barangay level within the four selected municipalities. Then, simple
random sampling was carried out within each barangay.
The main findings were:
31% of the population remains displaced from their usual residence.
44% of HHs reported having at least one vulnerable person living in their home.
99% of HHs in the four municipalities received food assistance last month.
28% of HHs have “unacceptable” (poor and borderline) Food Consumption Scores (FCS).
12% of HHs report that they have food stocks that will last them less than one week.
86% of HHs have access to a local market.
A total of three municipalities (Palo, Tanauan and Santa Fe) reported that their income stayed
the same or increased following Typhoon Yolanda, however 49% of reported income came
from charity/humanitarian aid.
Only 14% of income in Pastrana came from humanitarian aid indicating significantly less
overall assistance.
The average HH income in Pastrana decreased by 63% following Typhoon Haiyan.
Finally, 87% of HHs in all municipalities report that they do not maintain the same level of food
security as they did prior to the typhoon due to lack of funds and assets.
2014 Food Security Assessment, Leyte Province, Philippines 4
2. INTRODUCTION
Typhoon Haiyan, known as “Yolanda” in the Philippines, made landfall on November 8, 2013.
Region VIII was especially hard hit, and the latest government reports (DSWD) state that
Typhoon Haiyan affected around 14.1 million people and displaced around 4.1 million people. 1
There are also an estimated 1 million homes which were damaged.
With the Philippines being a major coconut producer on the global market, the loss of around 33
million coconut trees has had a profound effect on the income of around 1 million local farmers.
Many others have also lost their livelihoods, their assets, and loved ones. Reports estimate 6,201
are dead with another 1,785 people missing2. With 5.6 million people in need of food assistance
and agricultural support, the Philippines face a long road ahead towards recovery3.
To date, 2.8 million have been reached through WFP interventions (food, nutrition and cash
interventions). Samaritan’s Purse was able to partner with WFP in order to implement General
Food Distributions (GFD) in four municipalities (Palo, Pastrana, Santa Fe and Tanauan),
reaching approximately 184,000 individuals. Every individual of each HH was entitled to receive
10 kilograms (kg) of rice per month between December and February. Samaritan’s Purse
undertook the assessment in order to measure the extent and severity of the ongoing food
security needs in these municipalities. The assessment also sought to uncover the impact of the
GFD that SP/WFP implemented, as well as provide relevant information that could be used in
the development of future humanitarian interventions for this population.
3. METHODOLOGY
This assessment utilizing HH surveys was conducted between late January and early February,
2014 by trained SP staff.
A two-stage cluster sampling system was employed for this exercise. Barangays were used as the
sampling unit because of the availability of population data at that level.
An adjusted sample size of 805 was adopted for this survey (383 sample size x 2 for design
effect x 1.05 for error/non-respondent) in order that the data would be representative of the entire
population. A two-stage sampling scheme of “30x27” was used with a Confidence Interval (CI)
1 UNOCHA (2014) Philippines: Typhoon Haiyan Situation Report No. 34 [Online]. Available from:
http://reliefweb.int/sites/reliefweb.int/files/resources/OCHAPhilippinesTyphoonHaiyanSitrepNo.34.28Jan2014.pdf
(Accessed: 10th
Feb 2014). 2 Ibid.
3 Philippines Humanitarian Country Team (2013) Typhoon Haiyan: Strategic Response Plan [Online]. Available
from: http://reliefweb.int/sites/reliefweb.int/files/resources/Strategic%20Response%20Plan%20-
%20Philippines%2010-Dec-2013.pdf (Accessed: 13th
Feb 2013).

2014 Food Security Assessment, Leyte Province, Philippines 5
of 95%. This resulted in 30 barangays being randomly selected from the sampling framework,
and 27 HHs being interviewed in each of the barangays. For each of the barangays, the surveyors
randomly selected the first house to be surveyed, using the pencil spin method, which was
popularized by UNICEF. Surveyors then continued to administer the survey in every fourth
house until 27 houses had been surveyed.
Surveyors used a structured questionnaire for each of the HHs surveyed, which was designed to
capture key data, including demographics; HH vulnerabilities, access to local markets,
availability of food commodities, meals per day, food stocks, barriers to achieving food security,
food consumption scores, income/ expenses, and displacement data.
For the HH surveys, a minimum of 27 HHs were surveyed in each barangay. In total, 897
interviews were conducted by SP trained staff.
Below is a map displaying the locations of all HHs surveyed.

2014 Food Security Assessment, Leyte Province, Philippines 6
4. GENERAL FINDINGS
4.1 Household Demographics
Data from the assessment showed that the average HH size within the four municipalities is six
people. The average breakdown by municipality is as listed in the table below.
Municipality Average Household Size
Palo 6.2 Pastrana 5.5 Santa Fe 5.4 Tanauan 5.6
Within the HHs, there was found to be a large number of traditionally vulnerable people.
Specifically, respondents were asked if they had any of the following members in their HH:
displaced persons, orphan/vulnerable children, pregnant/lactating women, disabled/handicapped
persons, elderly persons, or a female head of HH. Of those asked, 44% reported having at least
one of the listed vulnerable persons in their HH. As seen in the graph below, there were a large
number of families that declared having displaced people in their HHs (30%), followed by senior
citizens (30%), pregnant or lactating women (19%), female as head of HH (8%), disabled
individuals (7%), and orphans/vulnerable children (6%).
30%
8%
6% 19%
7%
30%
Household Vulnerabilities
Displaced
Female Headed HH
Orphan/Vulnerable Child
Pregnant/Lactating woman
Disability/handicap
Senior Citizen
2014 Food Security Assessment, Leyte Province, Philippines 7
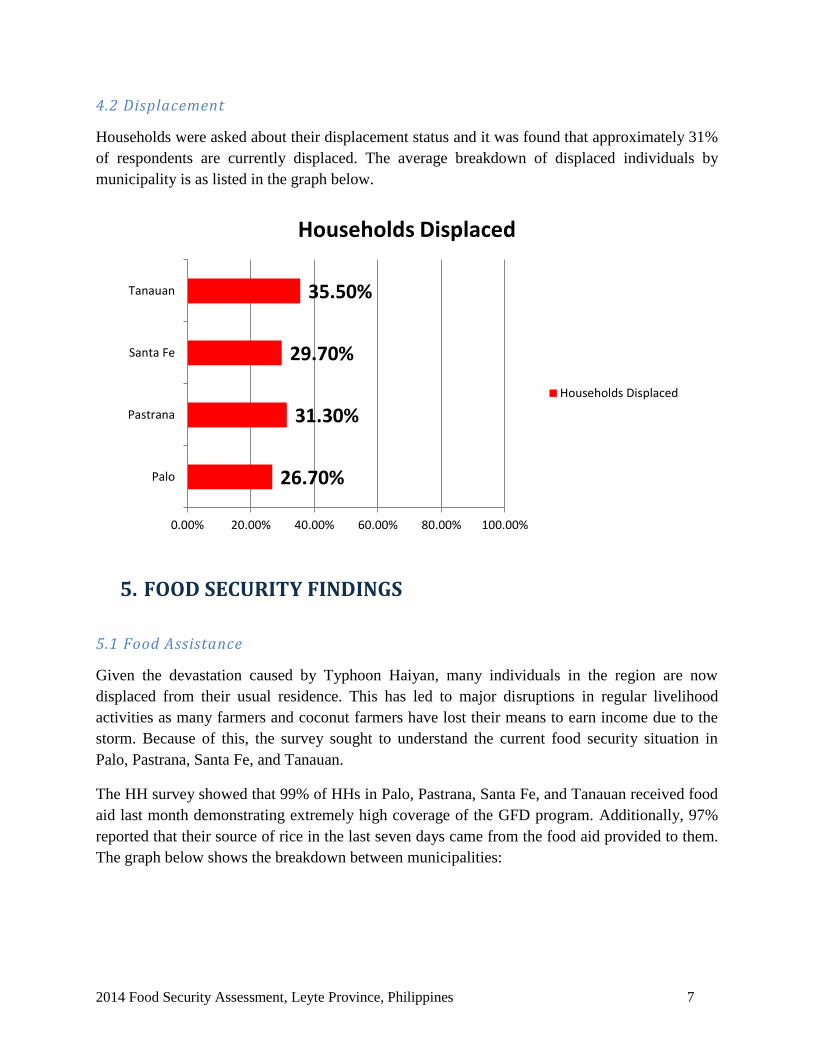
4.2 Displacement
Households were asked about their displacement status and it was found that approximately 31%
of respondents are currently displaced. The average breakdown of displaced individuals by
municipality is as listed in the graph below.
5. FOOD SECURITY FINDINGS
5.1 Food Assistance
Given the devastation caused by Typhoon Haiyan, many individuals in the region are now
displaced from their usual residence. This has led to major disruptions in regular livelihood
activities as many farmers and coconut farmers have lost their means to earn income due to the
storm. Because of this, the survey sought to understand the current food security situation in
Palo, Pastrana, Santa Fe, and Tanauan.
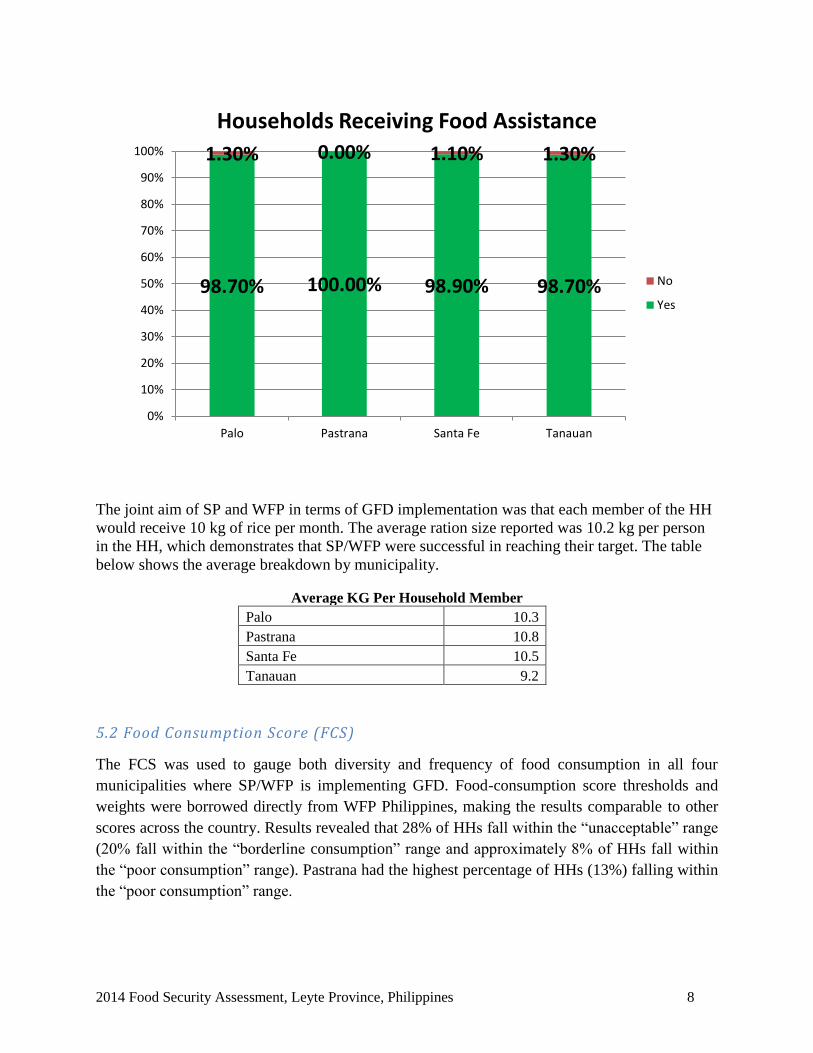
The HH survey showed that 99% of HHs in Palo, Pastrana, Santa Fe, and Tanauan received food
aid last month demonstrating extremely high coverage of the GFD program. Additionally, 97%
reported that their source of rice in the last seven days came from the food aid provided to them.
The graph below shows the breakdown between municipalities:
26.70%
31.30%
29.70%
35.50%
0.00% 20.00% 40.00% 60.00% 80.00% 100.00%
Palo
Pastrana
Santa Fe
Tanauan
Households Displaced
Households Displaced
2014 Food Security Assessment, Leyte Province, Philippines 8
The joint aim of SP and WFP in terms of GFD implementation was that each member of the HH
would receive 10 kg of rice per month. The average ration size reported was 10.2 kg per person
in the HH, which demonstrates that SP/WFP were successful in reaching their target. The table
below shows the average breakdown by municipality.
Average KG Per Household Member
Palo 10.3 Pastrana 10.8 Santa Fe 10.5 Tanauan 9.2
5.2 Food Consumption Score (FCS)
The FCS was used to gauge both diversity and frequency of food consumption in all four
municipalities where SP/WFP is implementing GFD. Food-consumption score thresholds and
weights were borrowed directly from WFP Philippines, making the results comparable to other
scores across the country. Results revealed that 28% of HHs fall within the “unacceptable” range
(20% fall within the “borderline consumption” range and approximately 8% of HHs fall within
the “poor consumption” range). Pastrana had the highest percentage of HHs (13%) falling within
the “poor consumption” range.
98.70% 100.00% 98.90% 98.70%
1.30% 0.00% 1.10% 1.30%
0%
10%
20%
30%
40%
50%
60%
70%
80%
90%
100%
Palo Pastrana Santa Fe Tanauan
Households Receiving Food Assistance
No
Yes

2014 Food Security Assessment, Leyte Province, Philippines 9
Food Consumption Scores had very little variation when comparing displaced versus non-
displaced HHs.
The following breakdown shows the average number of days that each food item was consumed
across all municipalities. Rice or another cereal was consumed almost every day of the week as
is anticipated with the continuing GFD program.
Palo Pastrana Santa Fe Tanauan
Poor 7.31% 13.04% 3.30% 5.92%
Borderline 14.88% 25.22% 19.78% 21.05%
Acceptable 77.81% 61.74% 76.92% 73.03%
0%
10%
20%
30%
40%
50%
60%
70%
80%
90%
100%
Food Consumption Scores
Poor
Borderline
Acceptable
74% 75%
18% 19%
8% 6%
0%
10%
20%
30%
40%
50%
60%
70%
80%
90%
100%
Not Displaced Displaced
FCS: Displacement
Poor
Borderline
Acceptable

2014 Food Security Assessment, Leyte Province, Philippines 10
5.3 Food Security
The assessment revealed that average meals consumed per day was 2.9 and varied very little
between municipalities. The table below demonstrates the breakdown by municipality.
Average Meals Per Day
Palo 3
Pastrana 2.9
Santa Fe 2.9 Tanauan 2.9
The majority of HHs reported that the food stocks in their homes would last them more than one
week, as shown in the graph below. On average, only 12% of HHs in all four municipalities
reported that their current food stocks would last them one week or less with the lowest food
stocks being in Palo and Pastrana.
6.9
0.7
3.3
1.2
5.5
1.7
5.1 4.7
0
1
2
3
4
5
6
7
8
FCS: Average Number of Days Food Items Consumed Per Week

2014 Food Security Assessment, Leyte Province, Philippines 11
When asked about barriers to achieving food security, the majority of the HHs (87%) mentioned
that “lack of money and assets” was the main reason that they have not enjoyed the same level of
food security that they did before the typhoon. The graph below shows the breakdown of barriers
including: “No Seeds,” “Insecurity,” “No Money/Assets,” “No Functioning Market” and “No
Barrier.”
Palo Pastrana Santa Fe Tanauan
> 1 month 28.95% 20.87% 52.75% 38.28%
1 week - 1 month 50.79% 60.00% 41.76% 60.73%
< 1 week 20.26% 19.13% 5.49% 0.99%
0%
10%
20%
30%
40%
50%
60%
70%
80%
90%
100%
Household Food Stocks
No Seeds 1%
Insecurity 1%
No Money/Assets 87%
No Functioning Market
1% No Barrier
10%
Barriers to Achieving Food Security
2014 Food Security Assessment, Leyte Province, Philippines 12
Overall, FCS indicators reveal that food gaps exist for approximately 28% of the population
surveyed with the highest vulnerability being located in Pastrana. It should be kept in mind that
these indicators are heavily influenced by on-going food distribution programming as 97% of
respondents reported that their main source of rice over the previous seven days came from food
assistance.
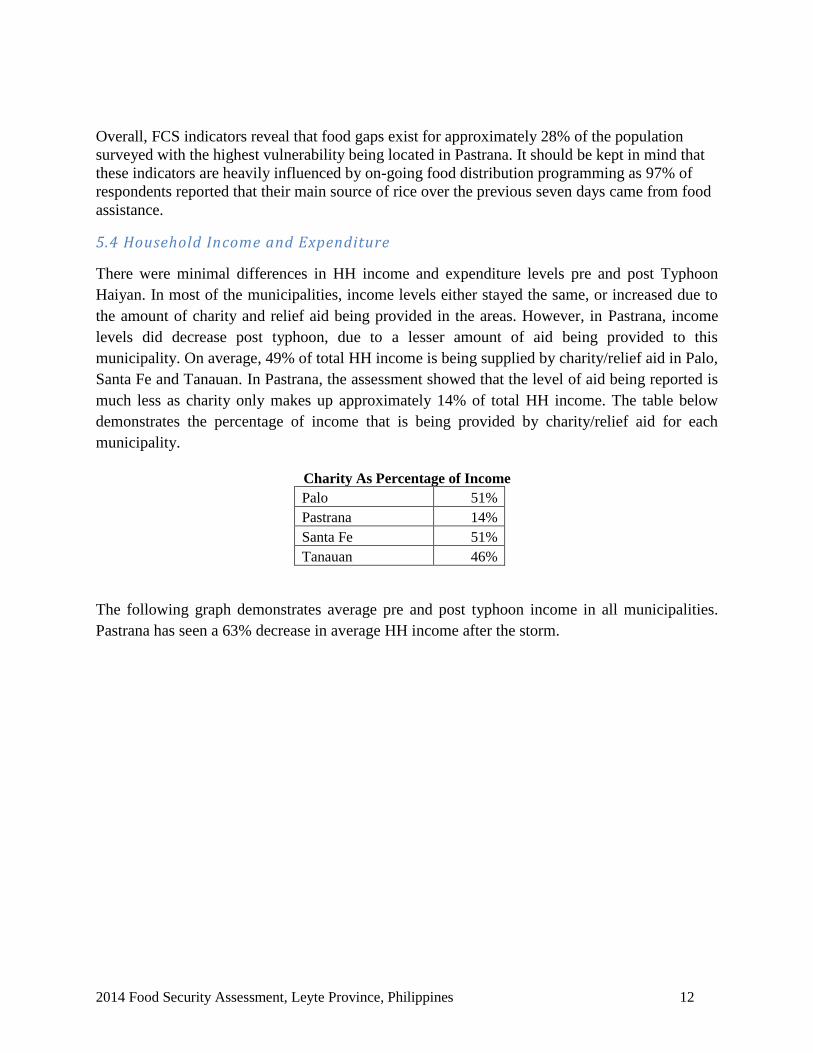
5.4 Household Income and Expenditure
There were minimal differences in HH income and expenditure levels pre and post Typhoon
Haiyan. In most of the municipalities, income levels either stayed the same, or increased due to
the amount of charity and relief aid being provided in the areas. However, in Pastrana, income
levels did decrease post typhoon, due to a lesser amount of aid being provided to this
municipality. On average, 49% of total HH income is being supplied by charity/relief aid in Palo,
Santa Fe and Tanauan. In Pastrana, the assessment showed that the level of aid being reported is
much less as charity only makes up approximately 14% of total HH income. The table below
demonstrates the percentage of income that is being provided by charity/relief aid for each
municipality.
Charity As Percentage of Income
Palo 51% Pastrana 14% Santa Fe 51% Tanauan 46%
The following graph demonstrates average pre and post typhoon income in all municipalities.
Pastrana has seen a 63% decrease in average HH income after the storm.

2014 Food Security Assessment, Leyte Province, Philippines 13
Additionally, all municipalities have seen an increase in expenditures post Typhoon Haiyan, as
seen in the graph below.
The following graph demonstrates the current situation in terms of HH income and expenditures
as broken down by municipality. Again, Pastrana is the only municipality where current average
income does not meet HH expenditure needs. This can be accredited to a lack of sufficient
assistance in the area.
0
2000
4000
6000
8000
10000
12000
Palo Pastrana Santa Fe Tanauan
Pre and Post Typhoon Income
Average Pre-Typhoon Income
Average Post-Typhoon Income
0
1000
2000
3000
4000
5000
6000
7000
Palo Pastrana Santa Fe Tanauan
Pre and Post Typhoon Expenses
Average Pre-Typhoon Expenses
Average Post-Typhoon Expenses
2014 Food Security Assessment, Leyte Province, Philippines 14
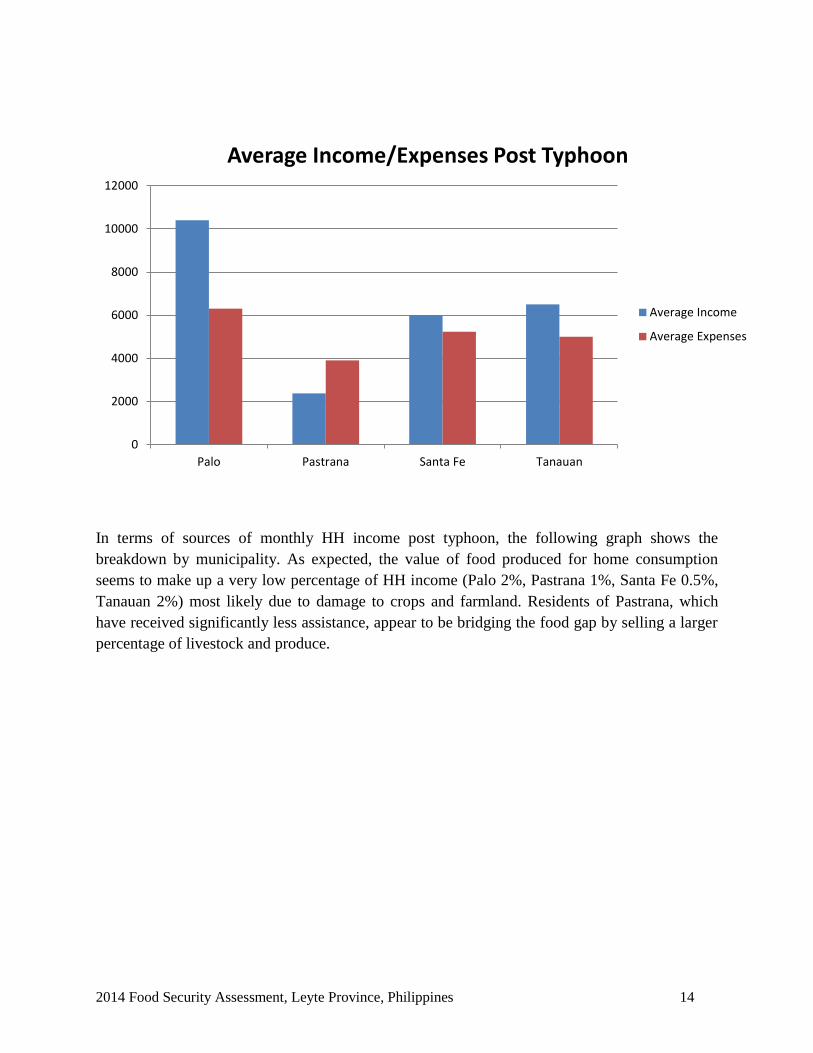
In terms of sources of monthly HH income post typhoon, the following graph shows the
breakdown by municipality. As expected, the value of food produced for home consumption
seems to make up a very low percentage of HH income (Palo 2%, Pastrana 1%, Santa Fe 0.5%,
Tanauan 2%) most likely due to damage to crops and farmland. Residents of Pastrana, which
have received significantly less assistance, appear to be bridging the food gap by selling a larger
percentage of livestock and produce.
0
2000
4000
6000
8000
10000
12000
Palo Pastrana Santa Fe Tanauan
Average Income/Expenses Post Typhoon
Average Income
Average Expenses

2014 Food Security Assessment, Leyte Province, Philippines 15
The graph below shows monthly HH expenditures by municipality. All HHs are spending a large
portion of their income (average 54%) on housing/rent costs. This is to be expected considering
“home maintenance/repairs” was included within this expense line.
0%
10%
20%
30%
40%
50%
60%
70%
80%
90%
100%
Palo Pastrana Santa Fe Tanauan
Household Income
Sale of Assets
Loans
Value of Charity Received
Remittances
Salary/Wages
Earnings From Small Business
Sale of Own SurplusProduce/Livestock
Value of Food Produced forHome Consumption
0%
10%
20%
30%
40%
50%
60%
70%
80%
90%
100%
Palo Pastrana Santa Fe Tanauan
Household Expenditures
Housing/Rent
Travel
Farm/Livestock Inputs
Medical
Fuel/Charcoal
Own Grown Food
Food Purchased

2014 Food Security Assessment, Leyte Province, Philippines 16
5.5 Markets
The assessment contained a brief section related to markets in order to examine accessibility and
commodity availability. On average, 86% of HHs reported having access to a local market.
Additionally, of those reporting access to a local market, the majority (64%) report that rice is
available in their local market and that the average price per kg of rice is 40 Filipino Pesos
(PHP). The graph below demonstrates access to local markets in all municipalities surveyed.
Where rice was available in the market, information on prices was collected. The currency used
was Filipino Pesos (PHP), and the unit of measure for rice was 1 kilogram (kg).
Average Price of 1 KG Rice
Palo 41.1
Pastrana 36.7
Santa Fe 42.1
Tanauan 41.3
6. CONCLUSION
Overall, the findings demonstrate that nearly a third of the population remains displaced although
this status has not impacted food security. This could partially be as a result of the large scale
assistance which has been successful in meeting emergency needs and comprises nearly 50% of
HH income in most of the municipalities surveyed. The majority of HHs claim to have market
0%
10%
20%
30%
40%
50%
60%
70%
80%
90%
100%
Palo Pastrana Santa Fe Tanauan
Access to Local Market
No
Yes

2014 Food Security Assessment, Leyte Province, Philippines 17
access and there appears to be little price inflation on rice. However, the assessment did not seek
to quantify regional availability. The FCS indicates a significant portion of the population (28%)
in need of assistance to maintain or achieve food security. Of particular concern is Pastrana
where indicators show less HH income, poorer FCS and less humanitarian assistance. Special
attention should be given to ensure that aid is equitably distributed and that Pastrana receives
opportunities for livelihoods recovery. A total of 87% report that they don’t have enough
funds/assets to establish the same level of food security that they maintained before the storm
and as such, programs should seek to improve food access and restore HH and community
assets.
7. RECOMMENDATIONS
1. Targeted conditional assistance with the dual objective to restore livelihoods and provide
access to food. Only specific segments of the population report to have poor or borderline
FCS and therefore programming should be targeted to the most vulnerable.
2. The majority of HHs report markets are functioning; utilization of cash should be considered
a priority as this will further help revive markets and spur on private sector growth.
3. Unconditional assistance should be provided to those HHs classified as severely food
insecure and do not have an able bodied family member to participate in conditional
programs.
2014 Food Security Assessment, Leyte Province, Philippines 18
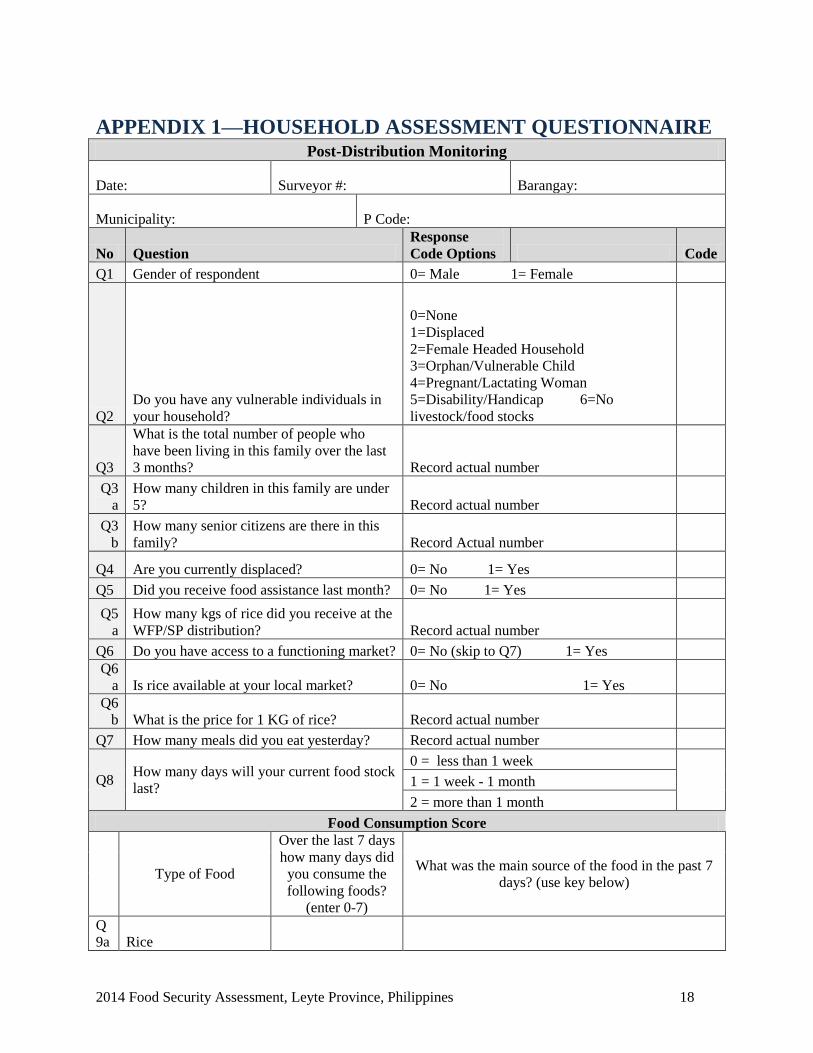
APPENDIX 1—HOUSEHOLD ASSESSMENT QUESTIONNAIRE Post-Distribution Monitoring
Date: Surveyor #: Barangay:
Municipality: P Code:
No Question Response
Code Options Code
Q1 Gender of respondent 0= Male 1= Female
Q2 Do you have any vulnerable individuals in
your household?
0=None
1=Displaced 2=Female Headed Household
3=Orphan/Vulnerable Child
4=Pregnant/Lactating Woman
5=Disability/Handicap 6=No
livestock/food stocks
Q3
What is the total number of people who
have been living in this family over the last
3 months? Record actual number
Q3
a How many children in this family are under
5? Record actual number
Q3
b How many senior citizens are there in this
family? Record Actual number
Q4 Are you currently displaced? 0= No 1= Yes
Q5 Did you receive food assistance last month? 0= No 1= Yes
Q5
a How many kgs of rice did you receive at the
WFP/SP distribution? Record actual number
Q6 Do you have access to a functioning market? 0= No (skip to Q7) 1= Yes Q6
a Is rice available at your local market? 0= No 1= Yes Q6
b What is the price for 1 KG of rice? Record actual number
Q7 How many meals did you eat yesterday? Record actual number
Q8 How many days will your current food stock
last?
0 = less than 1 week
1 = 1 week - 1 month
2 = more than 1 month
Food Consumption Score
Type of Food
Over the last 7 days
how many days did
you consume the
following foods?
(enter 0-7)
What was the main source of the food in the past 7
days? (use key below)
Q
9a Rice
2014 Food Security Assessment, Leyte Province, Philippines 19
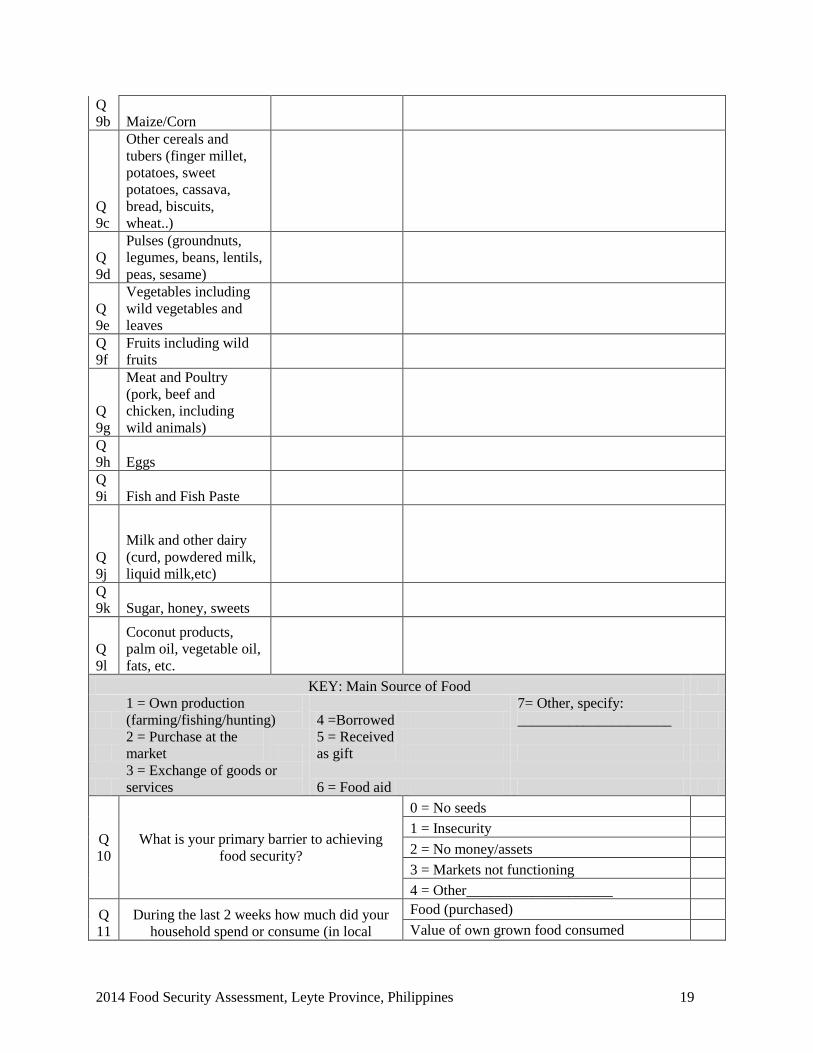
Q
9b Maize/Corn
Q
9c
Other cereals and
tubers (finger millet,
potatoes, sweet
potatoes, cassava,
bread, biscuits,
wheat..)
Q
9d
Pulses (groundnuts,
legumes, beans, lentils,
peas, sesame)
Q
9e
Vegetables including
wild vegetables and
leaves Q
9f Fruits including wild
fruits
Q
9g
Meat and Poultry
(pork, beef and
chicken, including
wild animals) Q
9h Eggs Q
9i Fish and Fish Paste
Q
9j
Milk and other dairy
(curd, powdered milk,
liquid milk,etc) Q
9k Sugar, honey, sweets
Q
9l
Coconut products,
palm oil, vegetable oil,
fats, etc.
KEY: Main Source of Food
1 = Own production
(farming/fishing/hunting) 4 =Borrowed 7= Other, specify:
_____________________
2 = Purchase at the
market 5 = Received
as gift
3 = Exchange of goods or
services 6 = Food aid
Q
10 What is your primary barrier to achieving
food security?
0 = No seeds
1 = Insecurity
2 = No money/assets
3 = Markets not functioning
4 = Other____________________
Q
11 During the last 2 weeks how much did your
household spend or consume (in local
Food (purchased)
Value of own grown food consumed

2014 Food Security Assessment, Leyte Province, Philippines 20
currency or converted) Fuel (charcoal, firewood)
Health / Medical
Farm / Livestock inputs
Travel / transport
Housing (maintenance / rent)
Q
12
During the last 2 weeks what were your
major sources of income and their value (in
local currency or converted)
Value of food produced for home
consumption
Sale of own surplus produce (crops/livestock)
Earnings from small business
Salary or wages
Remittances Received
Value of charity / relief aid
Loans Received
Sale of assets (livestock) Q
13 Monthly expenses before the typhoon? Record actual number Q
14 Monthly income before the typhoon? Record actual number