Page | 1 | PHILLIP SECURITIES RESEARCH (SINGAPORE) Ref. No.: SG2021_0001 Phillip 2021 Singapore Strategy Equities in a sweet spot SINGAPORE | STRATEGY 21 January 2021 Review: The STI was down 11.8% in 2020. It was the worst performer in Asia, coinciding with Singapore’s worst GDP contraction on record of -6% to -6.5% in 2020. The pandemic triggered consensus earnings to be slashed around 27% this year. The worst-hit sectors were the pandemic epicentres of transportation (-30%) and hospitality REITs (-20%). Sectors that managed to clock gains were industrials (+9%), industrial REITs (+10%) and healthcare (+30%). Outlook: We believe Singapore’s equity market is in a sweet spot. Our containment of the pandemic will lead to an earlier and more pronounced economic rebound than many countries, where the pandemic is still raging on. Globally, new COVID-19 cases average 561k per day. In Singapore, community cases averaged one per day over the past week. Phase 3 reopening should add to the economic momentum as bigger group activities resume. Other conditions conducive for an equity rally include low interest rates, undemanding valuations and attractive dividend yields. Vaccines and populist fiscal stimulus offer downside protection to global growth, in our view. Approval of Moderna’s and Pfizer’s vaccines can support 1.8bn doses for 900mn people in 2021. If all the 10 leading vaccines are approved, there is capacity for 9.3bn dosses in 2021, enough to cover two-thirds of the global population and most of the developed markets. Vaccines can bend the infection curve in 2021. Yes, risks remain. The most obvious are vaccine failures to tame mutations of the virus, their side effects or even inefficacy. Other factors that could unsettle markets are monetary-policy misjudgements by the Fed or foreign- policy faux pas by the new U.S. administration. But we think the likelihood of such pitfalls is low. Recommendation: Sectors we favour in 2021 are hospitality, banks and REITs. We are taking a longer-term stance on hospitality. Pent-up demand for travel is likely to result in a prolonged upcycle for the hospitality industry. Airline stocks may be tantalising after their steep drops amid expectations of a return of travel but we have our concerns. Firstly, competition in the industry has not abated due to support from governments. Secondly, airlines are now even more leveraged than before the crisis. In the banking sector, we expect multiple headwinds to change direction. As our economy comes out of lockdown and loan moratorium ends, we expect the aggressive pre-emptive provisioning to reverse. The next positive could be the MAS’ removal of dividend caps. This has already come to pass in some jurisdictions. A corollary tailwind will be better loans growth as economic uncertainties recede. Where REITs are concerned, the pandemic has introduced unwonted volatility for risk-averse yield investors. Both asset values and dividend payments suffered in 2020. With global negative bonds at a record US$17.7tr, the search for yield remains integral to our equity strategy. Our preference is U.S. REITs for their attractive 9% yields. While work-from-home trends had already taken root in the U.S. before the pandemic, average leases of five years should anchor near-term yields, even if some tenants shift more aggressively and permanently to home-based work arrangements. 2020 performance Figure 1: 40% of the STI was in the red Figure 2: Pandemic-related selling Figure 3: Restructuring and digital Source for Figs 1-3: PSR, Bloomberg Paul Chew (+65 6212 1851) Head of Research [email protected] The Phillip Absolute 10 Model Portfolio Source: Bloomberg, PSR; * prices as at 31 December 2020, average performance is for illustration purposes only. It is an equal-weighted portfolio of 10 stocks and excludes the cost of monthly rebalancing, transaction fees and dividend income. -3.2% -8.4% -14.5% DBS OCBC UOB -35.0% -32.8% -31.5% Jardine C & C SIA Singtel 48.2% 35.1% 19.9% Sembcorp Industries Keppel DC REIT Venture Corp. Company 1M 3M YTD Rating Target Px (S$) Share Px (S$) Upside Mkt Cap (US$m) Dvd. Yield Yield Ascott REIT (New) 3.8% 21.3% -18.8% Buy 1.15 1.080 6% 2,542 3.7% Asian PayTV -0.8% -4.0% -29.6% Buy 0.15 0.119 26% 163 8.8% Manulife US REIT 0.0% 0.7% -25.5% Buy 0.92 0.745 23% 1,179 8.6% Dividend / Earnings Growth Frasers Centrepoint Tr. 6.0% 3.2% -12.2% Buy 2.79 2.46 13% 3,163 5.4% PropNex 13.0% 31.1% 51.5% Buy 0.85 0.78 9% 219 5.1% Thai Beverage -0.7% 21.5% -17.4% Buy 0.86 0.74 17% 13,980 3.2% Re-rating Plays CapitaLand 4.8% 21.0% -12.5% Buy 3.82 3.28 16% 12,899 3.7% ComfortDelgro 1.2% 18.4% -29.8% Buy 1.83 1.67 10% 2,740 3.9% Keppel Corp. (New) 6.1% 20.9% -20.5% Buy 6.12 5.38 14% 7,405 1.7% Yoma 3.6% 1.8% -17.1% Buy 0.46 0.29 59% 491 0.0% Average 3.70% 12.7% -12.6% 21% 42,239 4.5%

Welcome message from author
This document is posted to help you gain knowledge. Please leave a comment to let me know what you think about it! Share it to your friends and learn new things together.
Transcript
Page | 1 | PHILLIP SECURITIES RESEARCH (SINGAPORE) Ref. No.: SG2021_0001
Phillip 2021 Singapore Strategy
Equities in a sweet spot
SINGAPORE | STRATEGY
21 January 2021
Review: The STI was down 11.8% in 2020. It was the worst performer in Asia, coinciding with
Singapore’s worst GDP contraction on record of -6% to -6.5% in 2020. The pandemic triggered
consensus earnings to be slashed around 27% this year. The worst-hit sectors were the
pandemic epicentres of transportation (-30%) and hospitality REITs (-20%). Sectors that
managed to clock gains were industrials (+9%), industrial REITs (+10%) and healthcare (+30%).
Outlook: We believe Singapore’s equity market is in a sweet spot. Our containment of the
pandemic will lead to an earlier and more pronounced economic rebound than many countries,
where the pandemic is still raging on. Globally, new COVID-19 cases average 561k per day. In
Singapore, community cases averaged one per day over the past week. Phase 3 reopening
should add to the economic momentum as bigger group activities resume. Other conditions
conducive for an equity rally include low interest rates, undemanding valuations and attractive
dividend yields. Vaccines and populist fiscal stimulus offer downside protection to global
growth, in our view. Approval of Moderna’s and Pfizer’s vaccines can support 1.8bn doses for
900mn people in 2021. If all the 10 leading vaccines are approved, there is capacity for 9.3bn
dosses in 2021, enough to cover two-thirds of the global population and most of the developed
markets. Vaccines can bend the infection curve in 2021. Yes, risks remain. The most obvious are
vaccine failures to tame mutations of the virus, their side effects or even inefficacy. Other
factors that could unsettle markets are monetary-policy misjudgements by the Fed or foreign-
policy faux pas by the new U.S. administration. But we think the likelihood of such pitfalls is low.
Recommendation: Sectors we favour in 2021 are hospitality, banks and REITs. We are taking a longer-term stance on hospitality. Pent-up demand for travel is likely to result in a prolonged upcycle for the hospitality industry. Airline stocks may be tantalising after their steep drops amid expectations of a return of travel but we have our concerns. Firstly, competition in the industry has not abated due to support from governments. Secondly, airlines are now even more leveraged than before the crisis. In the banking sector, we expect multiple headwinds to change direction. As our economy comes out of lockdown and loan moratorium ends, we expect the aggressive pre-emptive provisioning to reverse. The next positive could be the MAS’ removal of dividend caps. This has already come to pass in some jurisdictions. A corollary tailwind will be better loans growth as economic uncertainties recede. Where REITs are concerned, the pandemic has introduced unwonted volatility for risk-averse yield investors. Both asset values and dividend payments suffered in 2020. With global negative bonds at a record US$17.7tr, the search for yield remains integral to our equity strategy. Our preference is U.S. REITs for their attractive 9% yields. While work-from-home trends had already taken root in the U.S. before the pandemic, average leases of five years should anchor near-term yields, even if some tenants shift more aggressively and permanently to home-based work arrangements.
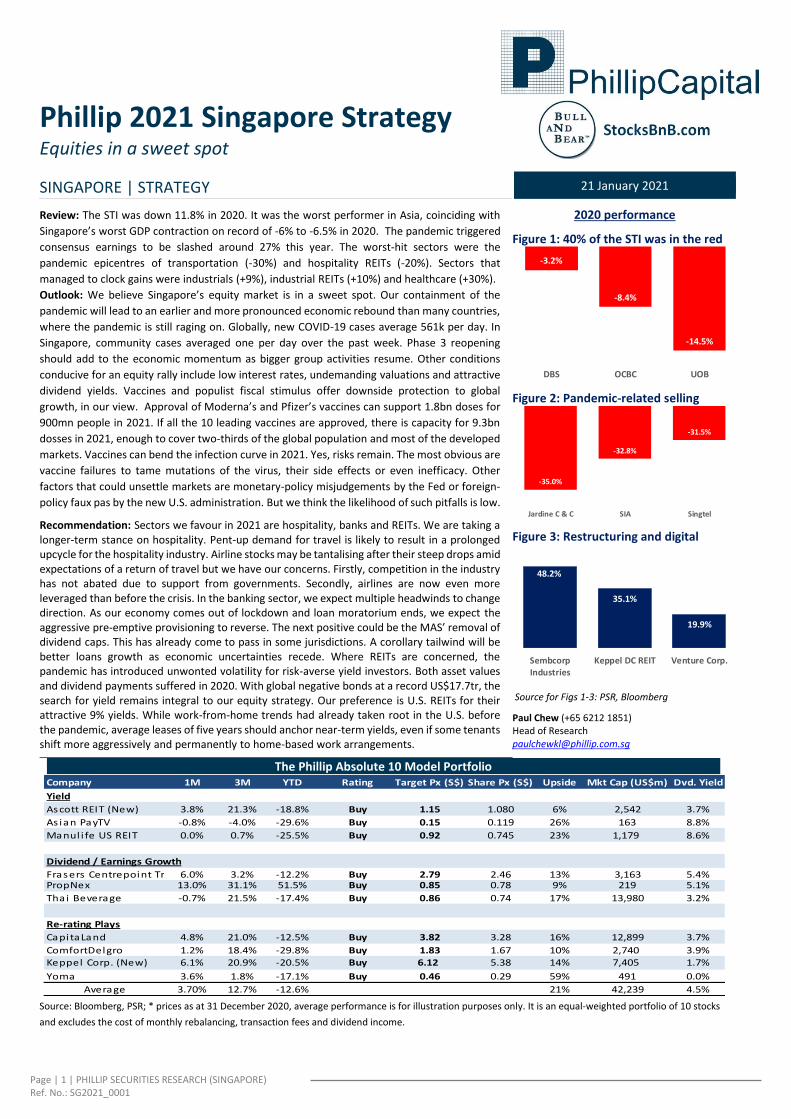
2020 performance
Figure 1: 40% of the STI was in the red
Figure 2: Pandemic-related selling
Figure 3: Restructuring and digital
Source for Figs 1-3: PSR, Bloomberg
Paul Chew (+65 6212 1851) Head of Research [email protected]
The Phillip Absolute 10 Model Portfolio
Source: Bloomberg, PSR; * prices as at 31 December 2020, average performance is for illustration purposes only. It is an equal-weighted portfolio of 10 stocks
and excludes the cost of monthly rebalancing, transaction fees and dividend income.
-3.2%
-8.4%
-14.5%
DBS OCBC UOB
-35.0%
-32.8%
-31.5%
Jardine C & C SIA Singtel
48.2%
35.1%
19.9%
SembcorpIndustries
Keppel DC REIT Venture Corp.
Company 1M 3M YTD Rating Target Px (S$) Share Px (S$) Upside Mkt Cap (US$m) Dvd. Yield
Yield
Ascott REIT (New) 3.8% 21.3% -18.8% Buy 1.15 1.080 6% 2,542 3.7%
As ian PayTV -0.8% -4.0% -29.6% Buy 0.15 0.119 26% 163 8.8%
Manul i fe US REIT 0.0% 0.7% -25.5% Buy 0.92 0.745 23% 1,179 8.6%
Dividend / Earnings Growth
Frasers Centrepoint Tr. 6.0% 3.2% -12.2% Buy 2.79 2.46 13% 3,163 5.4%PropNex 13.0% 31.1% 51.5% Buy 0.85 0.78 9% 219 5.1%
Thai Beverage -0.7% 21.5% -17.4% Buy 0.86 0.74 17% 13,980 3.2%
Re-rating Plays
CapitaLand 4.8% 21.0% -12.5% Buy 3.82 3.28 16% 12,899 3.7%
ComfortDelgro 1.2% 18.4% -29.8% Buy 1.83 1.67 10% 2,740 3.9%Keppel Corp. (New) 6.1% 20.9% -20.5% Buy 6.12 5.38 14% 7,405 1.7%
Yoma 3.6% 1.8% -17.1% Buy 0.46 0.29 59% 491 0.0%
Average 3.70% 12.7% -12.6% 21% 42,239 4.5%
Page | 2 | PHILLIP SECURITIES RESEARCH (SINGAPORE)
2021 OUTLOOK STRATEGY
2020 REVIEW
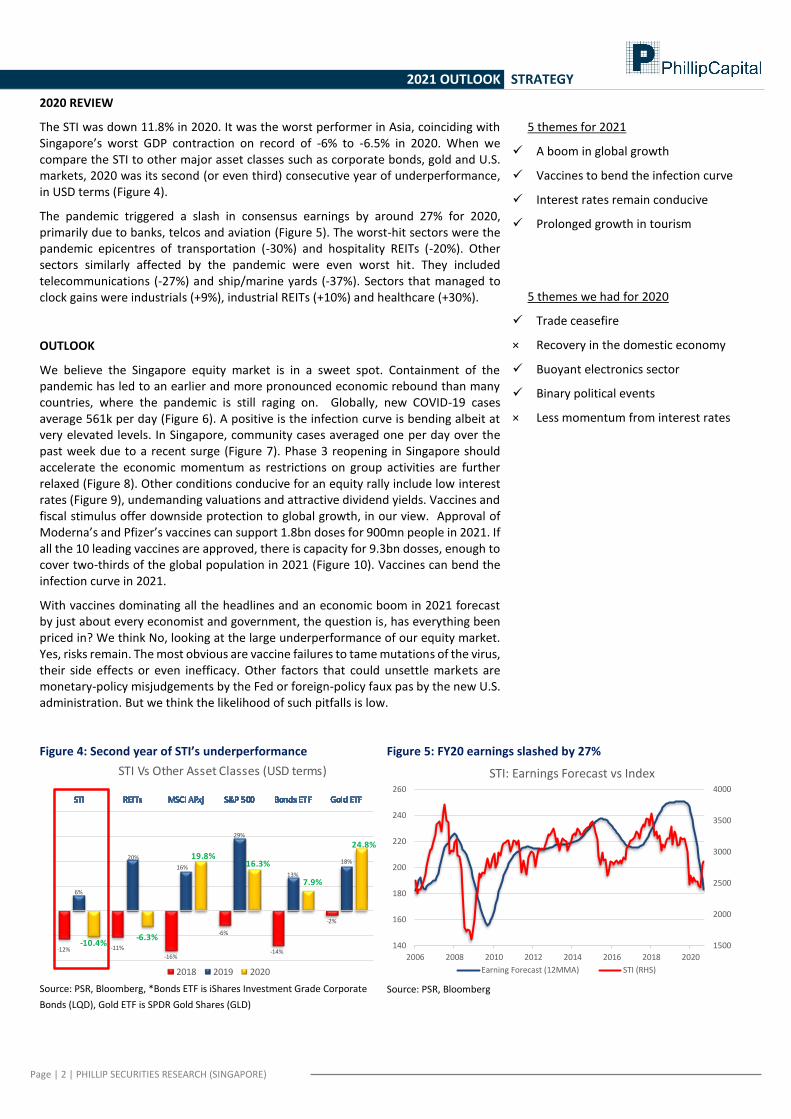
The STI was down 11.8% in 2020. It was the worst performer in Asia, coinciding with Singapore’s worst GDP contraction on record of -6% to -6.5% in 2020. When we compare the STI to other major asset classes such as corporate bonds, gold and U.S. markets, 2020 was its second (or even third) consecutive year of underperformance, in USD terms (Figure 4).
The pandemic triggered a slash in consensus earnings by around 27% for 2020, primarily due to banks, telcos and aviation (Figure 5). The worst-hit sectors were the pandemic epicentres of transportation (-30%) and hospitality REITs (-20%). Other sectors similarly affected by the pandemic were even worst hit. They included telecommunications (-27%) and ship/marine yards (-37%). Sectors that managed to clock gains were industrials (+9%), industrial REITs (+10%) and healthcare (+30%).
OUTLOOK
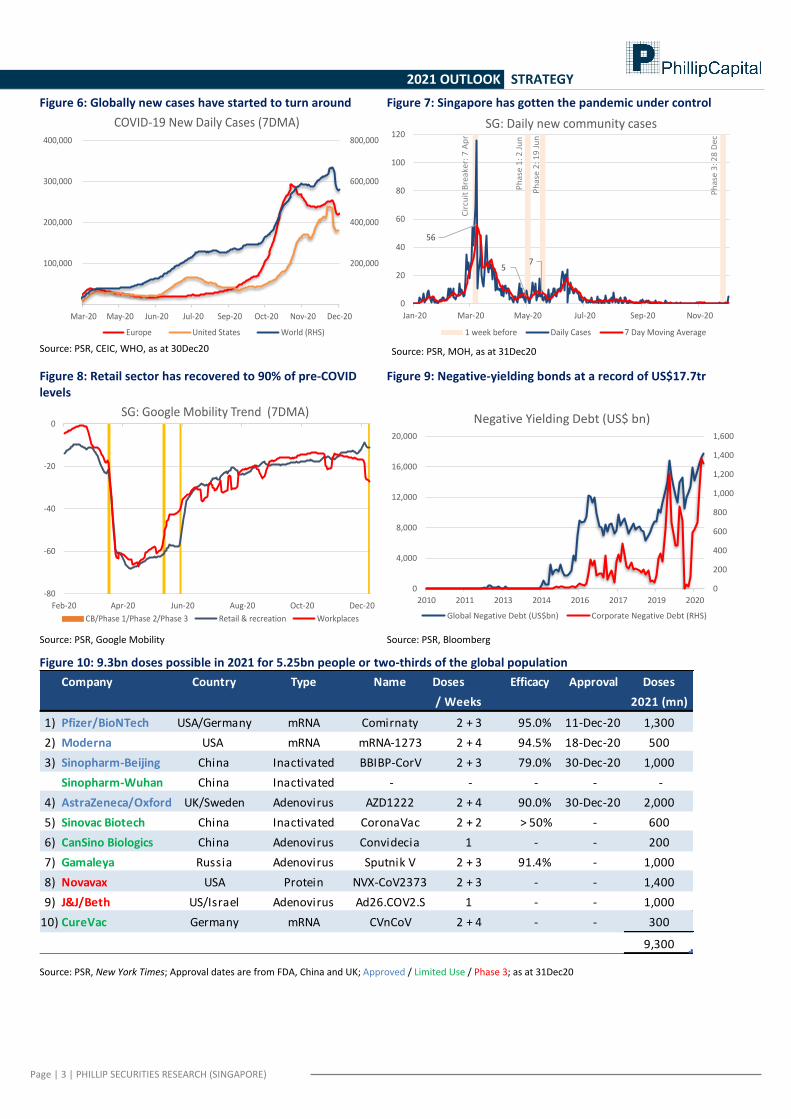
We believe the Singapore equity market is in a sweet spot. Containment of the pandemic has led to an earlier and more pronounced economic rebound than many countries, where the pandemic is still raging on. Globally, new COVID-19 cases average 561k per day (Figure 6). A positive is the infection curve is bending albeit at very elevated levels. In Singapore, community cases averaged one per day over the past week due to a recent surge (Figure 7). Phase 3 reopening in Singapore should accelerate the economic momentum as restrictions on group activities are further relaxed (Figure 8). Other conditions conducive for an equity rally include low interest rates (Figure 9), undemanding valuations and attractive dividend yields. Vaccines and fiscal stimulus offer downside protection to global growth, in our view. Approval of Moderna’s and Pfizer’s vaccines can support 1.8bn doses for 900mn people in 2021. If all the 10 leading vaccines are approved, there is capacity for 9.3bn dosses, enough to cover two-thirds of the global population in 2021 (Figure 10). Vaccines can bend the infection curve in 2021.
With vaccines dominating all the headlines and an economic boom in 2021 forecast by just about every economist and government, the question is, has everything been priced in? We think No, looking at the large underperformance of our equity market. Yes, risks remain. The most obvious are vaccine failures to tame mutations of the virus, their side effects or even inefficacy. Other factors that could unsettle markets are monetary-policy misjudgements by the Fed or foreign-policy faux pas by the new U.S. administration. But we think the likelihood of such pitfalls is low.
5 themes for 2021
✓ A boom in global growth
✓ Vaccines to bend the infection curve
✓ Interest rates remain conducive
✓ Prolonged growth in tourism
5 themes we had for 2020
✓ Trade ceasefire
× Recovery in the domestic economy
✓ Buoyant electronics sector
✓ Binary political events
× Less momentum from interest rates
Figure 4: Second year of STI’s underperformance
Source: PSR, Bloomberg, *Bonds ETF is iShares Investment Grade Corporate
Bonds (LQD), Gold ETF is SPDR Gold Shares (GLD)
Figure 5: FY20 earnings slashed by 27%
Source: PSR, Bloomberg
-12% -11%
-16%
-6%
-14%
-2%
6%
20%
16%
29%
13%
18%
-10.4%-6.3%
19.8%16.3%
7.9%
24.8%
STI Vs Other Asset Classes (USD terms)
2018 2019 2020
1500
2000
2500
3000
3500
4000
140
160
180
200
220
240
260
2006 2008 2010 2012 2014 2016 2018 2020
STI: Earnings Forecast vs Index
Earning Forecast (12MMA) STI (RHS)
Page | 3 | PHILLIP SECURITIES RESEARCH (SINGAPORE)
2021 OUTLOOK STRATEGY
Figure 6: Globally new cases have started to turn around
Source: PSR, CEIC, WHO, as at 30Dec20
Figure 7: Singapore has gotten the pandemic under control
Source: PSR, MOH, as at 31Dec20
Figure 8: Retail sector has recovered to 90% of pre-COVID levels
Source: PSR, Google Mobility
Figure 9: Negative-yielding bonds at a record of US$17.7tr
Source: PSR, Bloomberg
Figure 10: 9.3bn doses possible in 2021 for 5.25bn people or two-thirds of the global population
Source: PSR, New York Times; Approval dates are from FDA, China and UK; Approved / Limited Use / Phase 3; as at 31Dec20
200,000
400,000
600,000
800,000
100,000
200,000
300,000
400,000
Mar-20 May-20 Jun-20 Jul-20 Sep-20 Oct-20 Nov-20 Dec-20
COVID-19 New Daily Cases (7DMA)
Europe United States World (RHS)
56
57
0
20
40
60
80
100
120
Jan-20 Mar-20 May-20 Jul-20 Sep-20 Nov-20
SG: Daily new community cases
1 week before Daily Cases 7 Day Moving Average
Cir
cuit
Bre
ake
r: 7
Ap
r
Ph
ase
1: 2
Ju
n
Ph
ase
2: 1
9 J
un
Ph
ase
3: 2
8 D
ec
-80
-60
-40
-20
0
Feb-20 Apr-20 Jun-20 Aug-20 Oct-20 Dec-20
SG: Google Mobility Trend (7DMA)
CB/Phase 1/Phase 2/Phase 3 Retail & recreation Workplaces
0
200
400
600
800
1,000
1,200
1,400
1,600
0
4,000
8,000
12,000
16,000
20,000
2010 2011 2013 2014 2016 2017 2019 2020
Negative Yielding Debt (US$ bn)
Global Negative Debt (US$bn) Corporate Negative Debt (RHS)
Company Country Type Name Doses Efficacy Approval Doses
/ Weeks 2021 (mn)
1) Pfizer/BioNTech USA/Germany mRNA Comirnaty 2 + 3 95.0% 11-Dec-20 1,300
2) Moderna USA mRNA mRNA-1273 2 + 4 94.5% 18-Dec-20 500
3) Sinopharm-Beijing China Inactivated BBIBP-CorV 2 + 3 79.0% 30-Dec-20 1,000
Sinopharm-Wuhan China Inactivated - - - - -
4) AstraZeneca/Oxford UK/Sweden Adenovirus AZD1222 2 + 4 90.0% 30-Dec-20 2,000
5) Sinovac Biotech China Inactivated CoronaVac 2 + 2 > 50% - 600
6) CanSino Biologics China Adenovirus Convidecia 1 - - 200
7) Gamaleya Russia Adenovirus Sputnik V 2 + 3 91.4% - 1,000
8) Novavax USA Protein NVX-CoV2373 2 + 3 - - 1,400
9) J&J/Beth US/Israel Adenovirus Ad26.COV2.S 1 - - 1,000
10) CureVac Germany mRNA CVnCoV 2 + 4 - - 300
9,300
Page | 4 | PHILLIP SECURITIES RESEARCH (SINGAPORE)
2021 OUTLOOK STRATEGY
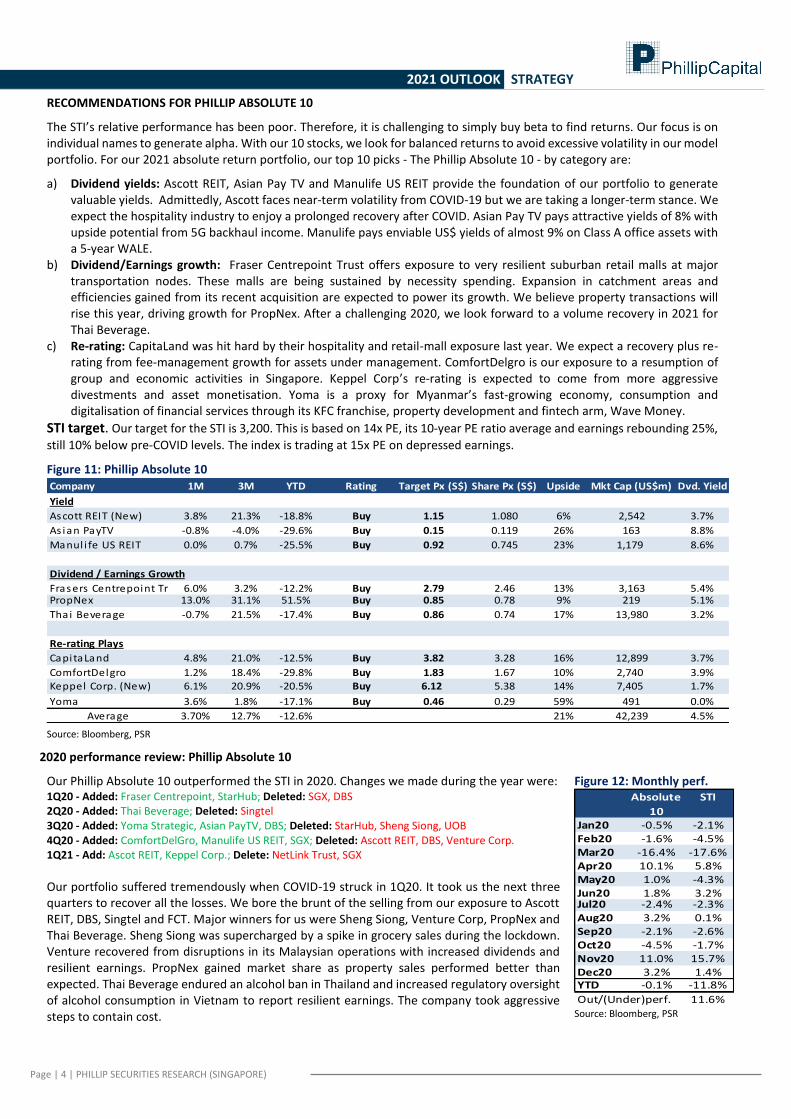
RECOMMENDATIONS FOR PHILLIP ABSOLUTE 10
The STI’s relative performance has been poor. Therefore, it is challenging to simply buy beta to find returns. Our focus is on individual names to generate alpha. With our 10 stocks, we look for balanced returns to avoid excessive volatility in our model portfolio. For our 2021 absolute return portfolio, our top 10 picks - The Phillip Absolute 10 - by category are:
a) Dividend yields: Ascott REIT, Asian Pay TV and Manulife US REIT provide the foundation of our portfolio to generate valuable yields. Admittedly, Ascott faces near-term volatility from COVID-19 but we are taking a longer-term stance. We expect the hospitality industry to enjoy a prolonged recovery after COVID. Asian Pay TV pays attractive yields of 8% with upside potential from 5G backhaul income. Manulife pays enviable US$ yields of almost 9% on Class A office assets with a 5-year WALE.
b) Dividend/Earnings growth: Fraser Centrepoint Trust offers exposure to very resilient suburban retail malls at major transportation nodes. These malls are being sustained by necessity spending. Expansion in catchment areas and efficiencies gained from its recent acquisition are expected to power its growth. We believe property transactions will rise this year, driving growth for PropNex. After a challenging 2020, we look forward to a volume recovery in 2021 for Thai Beverage.
c) Re-rating: CapitaLand was hit hard by their hospitality and retail-mall exposure last year. We expect a recovery plus re-rating from fee-management growth for assets under management. ComfortDelgro is our exposure to a resumption of group and economic activities in Singapore. Keppel Corp’s re-rating is expected to come from more aggressive divestments and asset monetisation. Yoma is a proxy for Myanmar’s fast-growing economy, consumption and digitalisation of financial services through its KFC franchise, property development and fintech arm, Wave Money.
STI target. Our target for the STI is 3,200. This is based on 14x PE, its 10-year PE ratio average and earnings rebounding 25%,
still 10% below pre-COVID levels. The index is trading at 15x PE on depressed earnings.
Figure 11: Phillip Absolute 10
Source: Bloomberg, PSR
2020 performance review: Phillip Absolute 10
Our Phillip Absolute 10 outperformed the STI in 2020. Changes we made during the year were: 1Q20 - Added: Fraser Centrepoint, StarHub; Deleted: SGX, DBS 2Q20 - Added: Thai Beverage; Deleted: Singtel 3Q20 - Added: Yoma Strategic, Asian PayTV, DBS; Deleted: StarHub, Sheng Siong, UOB 4Q20 - Added: ComfortDelGro, Manulife US REIT, SGX; Deleted: Ascott REIT, DBS, Venture Corp. 1Q21 - Add: Ascot REIT, Keppel Corp.; Delete: NetLink Trust, SGX
Our portfolio suffered tremendously when COVID-19 struck in 1Q20. It took us the next three quarters to recover all the losses. We bore the brunt of the selling from our exposure to Ascott REIT, DBS, Singtel and FCT. Major winners for us were Sheng Siong, Venture Corp, PropNex and Thai Beverage. Sheng Siong was supercharged by a spike in grocery sales during the lockdown. Venture recovered from disruptions in its Malaysian operations with increased dividends and resilient earnings. PropNex gained market share as property sales performed better than expected. Thai Beverage endured an alcohol ban in Thailand and increased regulatory oversight of alcohol consumption in Vietnam to report resilient earnings. The company took aggressive steps to contain cost.
Figure 12: Monthly perf.
Source: Bloomberg, PSR
Company 1M 3M YTD Rating Target Px (S$) Share Px (S$) Upside Mkt Cap (US$m) Dvd. Yield
Yield
Ascott REIT (New) 3.8% 21.3% -18.8% Buy 1.15 1.080 6% 2,542 3.7%
As ian PayTV -0.8% -4.0% -29.6% Buy 0.15 0.119 26% 163 8.8%
Manul i fe US REIT 0.0% 0.7% -25.5% Buy 0.92 0.745 23% 1,179 8.6%
Dividend / Earnings Growth
Frasers Centrepoint Tr. 6.0% 3.2% -12.2% Buy 2.79 2.46 13% 3,163 5.4%PropNex 13.0% 31.1% 51.5% Buy 0.85 0.78 9% 219 5.1%
Thai Beverage -0.7% 21.5% -17.4% Buy 0.86 0.74 17% 13,980 3.2%
Re-rating Plays
CapitaLand 4.8% 21.0% -12.5% Buy 3.82 3.28 16% 12,899 3.7%
ComfortDelgro 1.2% 18.4% -29.8% Buy 1.83 1.67 10% 2,740 3.9%Keppel Corp. (New) 6.1% 20.9% -20.5% Buy 6.12 5.38 14% 7,405 1.7%
Yoma 3.6% 1.8% -17.1% Buy 0.46 0.29 59% 491 0.0%
Average 3.70% 12.7% -12.6% 21% 42,239 4.5%
Absolute STI
10Jan20 -0.5% -2.1%Feb20 -1.6% -4.5%Mar20 -16.4% -17.6%Apr20 10.1% 5.8%May20 1.0% -4.3%Jun20 1.8% 3.2%Jul20 -2.4% -2.3%Aug20 3.2% 0.1%Sep20 -2.1% -2.6%Oct20 -4.5% -1.7%Nov20 11.0% 15.7%Dec20 3.2% 1.4%YTD -0.1% -11.8%
Out/(Under)perf. 11.6%
Page | 5 | PHILLIP SECURITIES RESEARCH (SINGAPORE)
2021 OUTLOOK STRATEGY
Sector Narratives
1. Consumer: Macro conditions are weak for the Singapore consumer, with a drop in income and record job losses. Stock picks are critical. We prefer essential consumer products such as groceries and affordable F&B.
2. Finance: We think banks can be re-rated upwards and outperform. This is premised on an economic recovery and a removal of the asset-quality overhang when loan moratoriums are lifted. It will trigger MAS to roll back dividend caps and pre-emptive bad-debt provisioning in 2020/21.
3. Healthcare: Hospital and specialist admissions could remain sub-par without foreign patients as our international borders stay closed. However, elective treatments such as health screening, aesthethics and dental have rebounded strongly due to better health awareness and shift in spend from travel to healthcare. Glove makers face uncertainties over glove demand after the pandemic. The market is already pricing in a decline in glove profits, though profits should still be elevated as hygiene practices by healthcare workers have changed. Other industries are also adopting the use of gloves, for instance, air travel, F&B, etc.
4. Property: Demand for property has been resilient through the recession. Some reasons are stable prices after the introduction of the total debt servicing ratio in 2013, rising income and a growing pool of HDB upgraders.
5. REITs: Volatility in dividends has shaken confidence in the sector. But we believe the elusive search for yields will draw investors back to REITs, especially with strong Singapore or U.S. currencies backing these payouts.
6. Technology: The electronics sector is undergoing a structural boom. Multiple drivers for hardware technology products include more cars using more electronics to meet new emission standards and increased usage of automated driving. 5G rollout is also expected to raise demand for infrastructure and smartphones. A work-from-home economy has led to more cloud spending on communication. Elsewhere, memory demand is supported by the insatiable consumption of streaming entertainment, data analytics and storage.
7. Telecommunications: Loss of inbound and outbound roaming revenue has led to the overnight disappearance of 20% of high-margin mobile revenue. The silver lining is, the market has priced in this loss and sector valuations are turning more attractive.
8. Transportation: Cancelled holidays and business trips sum up the airline industry this year. We believe air travel will only resume gradually as the pandemic is still raging in many countries and most are not willing to risk imported cases. Our preference is land transportation where the recovery is more evident and there is less reliance on international travellers.
Paul Chew (+65 6212 1851) Head of Research
Page | 6 | PHILLIP SECURITIES RESEARCH (SINGAPORE)
2021 OUTLOOK STRATEGY
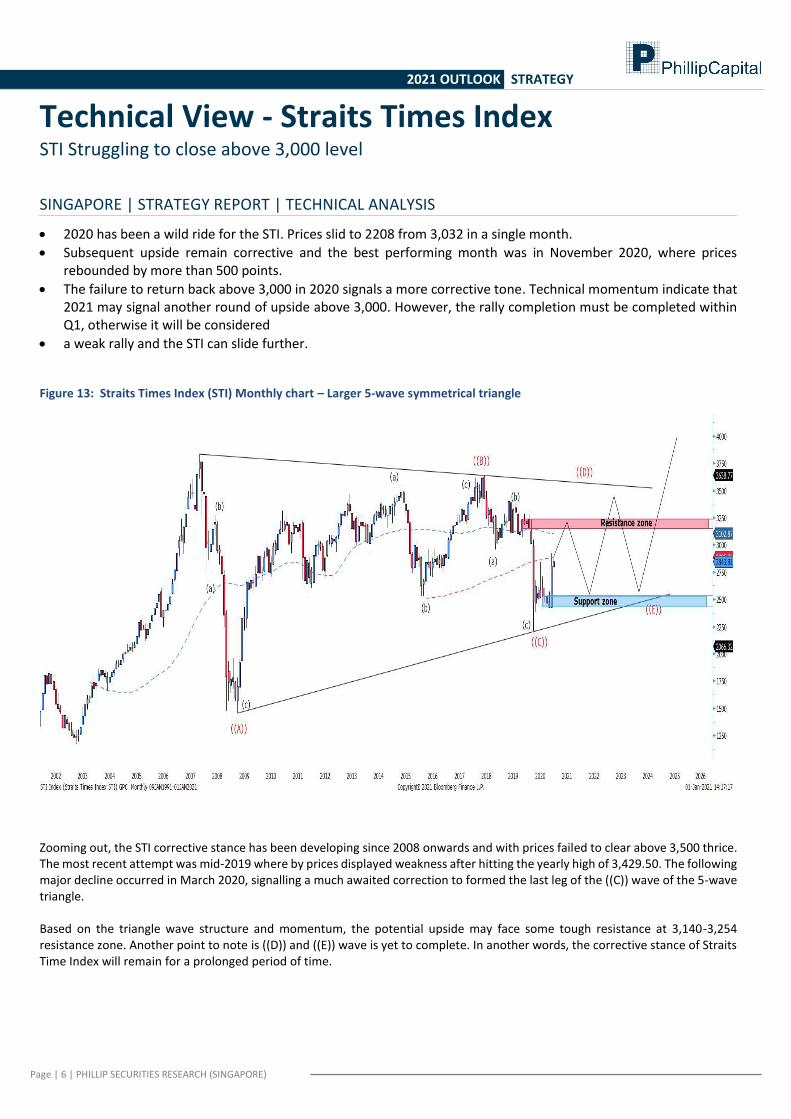
Technical View - Straits Times Index STI Struggling to close above 3,000 level
SINGAPORE | STRATEGY REPORT | TECHNICAL ANALYSIS
• 2020 has been a wild ride for the STI. Prices slid to 2208 from 3,032 in a single month.
• Subsequent upside remain corrective and the best performing month was in November 2020, where prices rebounded by more than 500 points.
• The failure to return back above 3,000 in 2020 signals a more corrective tone. Technical momentum indicate that 2021 may signal another round of upside above 3,000. However, the rally completion must be completed within Q1, otherwise it will be considered
• a weak rally and the STI can slide further. Figure 13: Straits Times Index (STI) Monthly chart – Larger 5-wave symmetrical triangle
Zooming out, the STI corrective stance has been developing since 2008 onwards and with prices failed to clear above 3,500 thrice. The most recent attempt was mid-2019 where by prices displayed weakness after hitting the yearly high of 3,429.50. The following major decline occurred in March 2020, signalling a much awaited correction to formed the last leg of the ((C)) wave of the 5-wave triangle. Based on the triangle wave structure and momentum, the potential upside may face some tough resistance at 3,140-3,254 resistance zone. Another point to note is ((D)) and ((E)) wave is yet to complete. In another words, the corrective stance of Straits Time Index will remain for a prolonged period of time.
Page | 7 | PHILLIP SECURITIES RESEARCH (SINGAPORE)
2021 OUTLOOK STRATEGY
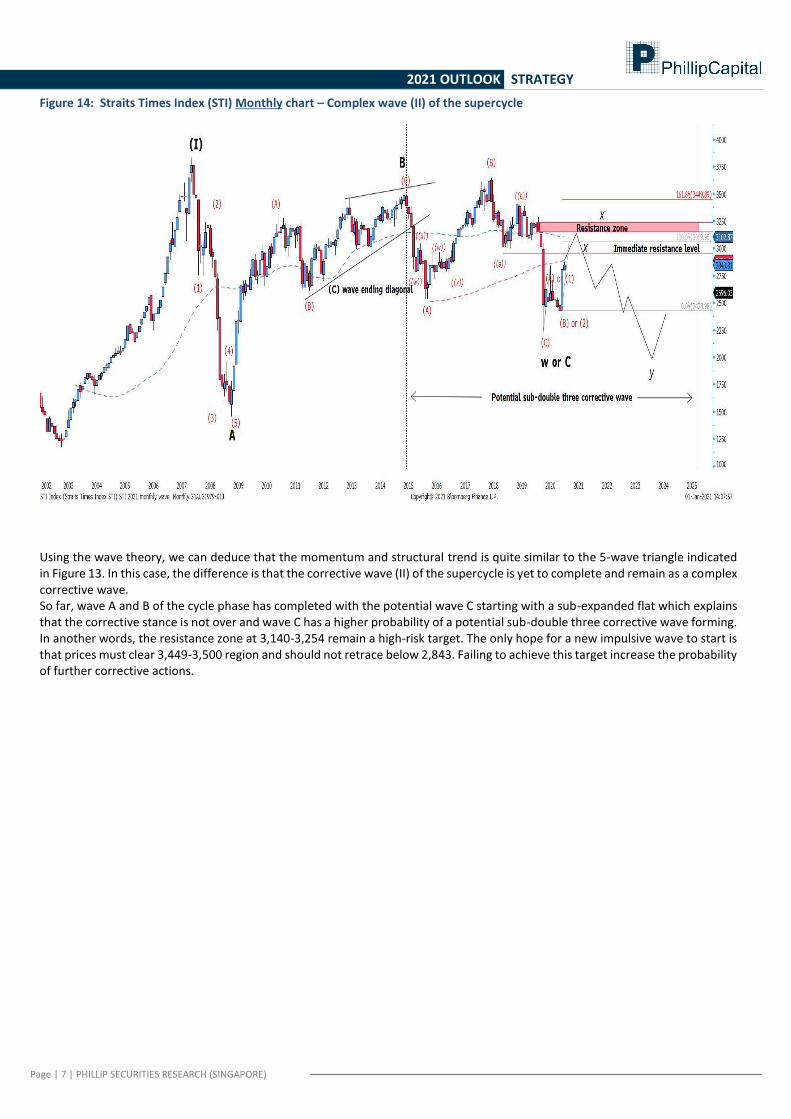
Figure 14: Straits Times Index (STI) Monthly chart – Complex wave (II) of the supercycle
Using the wave theory, we can deduce that the momentum and structural trend is quite similar to the 5-wave triangle indicated in Figure 13. In this case, the difference is that the corrective wave (II) of the supercycle is yet to complete and remain as a complex corrective wave. So far, wave A and B of the cycle phase has completed with the potential wave C starting with a sub-expanded flat which explains that the corrective stance is not over and wave C has a higher probability of a potential sub-double three corrective wave forming. In another words, the resistance zone at 3,140-3,254 remain a high-risk target. The only hope for a new impulsive wave to start is that prices must clear 3,449-3,500 region and should not retrace below 2,843. Failing to achieve this target increase the probability of further corrective actions.
Page | 8 | PHILLIP SECURITIES RESEARCH (SINGAPORE)
2021 OUTLOOK STRATEGY
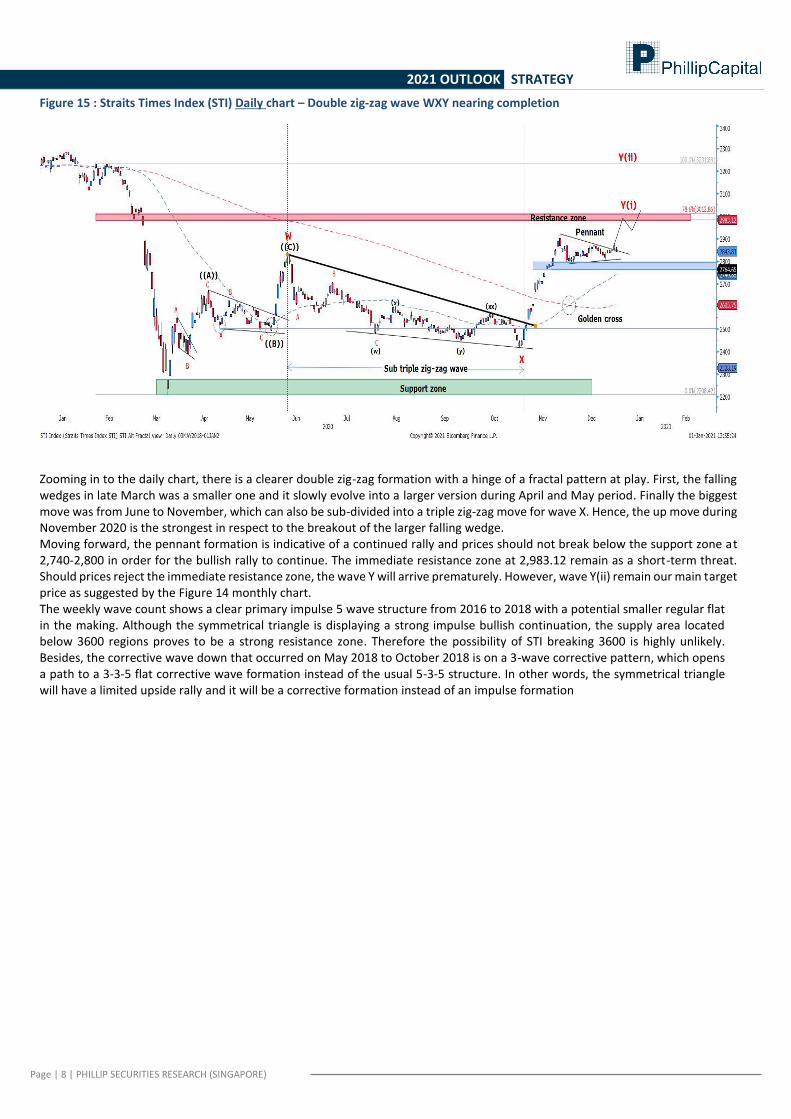
Figure 15 : Straits Times Index (STI) Daily chart – Double zig-zag wave WXY nearing completion
Zooming in to the daily chart, there is a clearer double zig-zag formation with a hinge of a fractal pattern at play. First, the falling wedges in late March was a smaller one and it slowly evolve into a larger version during April and May period. Finally the biggest move was from June to November, which can also be sub-divided into a triple zig-zag move for wave X. Hence, the up move during November 2020 is the strongest in respect to the breakout of the larger falling wedge. Moving forward, the pennant formation is indicative of a continued rally and prices should not break below the support zone at 2,740-2,800 in order for the bullish rally to continue. The immediate resistance zone at 2,983.12 remain as a short-term threat. Should prices reject the immediate resistance zone, the wave Y will arrive prematurely. However, wave Y(ii) remain our main target price as suggested by the Figure 14 monthly chart. The weekly wave count shows a clear primary impulse 5 wave structure from 2016 to 2018 with a potential smaller regular flat in the making. Although the symmetrical triangle is displaying a strong impulse bullish continuation, the supply area located below 3600 regions proves to be a strong resistance zone. Therefore the possibility of STI breaking 3600 is highly unlikely. Besides, the corrective wave down that occurred on May 2018 to October 2018 is on a 3-wave corrective pattern, which opens a path to a 3-3-5 flat corrective wave formation instead of the usual 5-3-5 structure. In other words, the symmetrical triangle will have a limited upside rally and it will be a corrective formation instead of an impulse formation
Page | 9 | PHILLIP SECURITIES RESEARCH (SINGAPORE)
2021 OUTLOOK STRATEGY
Consumer OVERWEIGHT
• Stellar jump in 2020 grocery sales. Year to October sales catapulted 32%, a 30-fold rise from their historical 5-year CAGR of 1.3%.
• Income dipped 0.6% YoY for the year ended Jun 2020, the worst in more than a decade • Household wealth still rising despite record GDP contraction, thanks to increased savings of cash and financial assets. • Overweight Singapore consumer sector, particularly essential products. 2020 Review
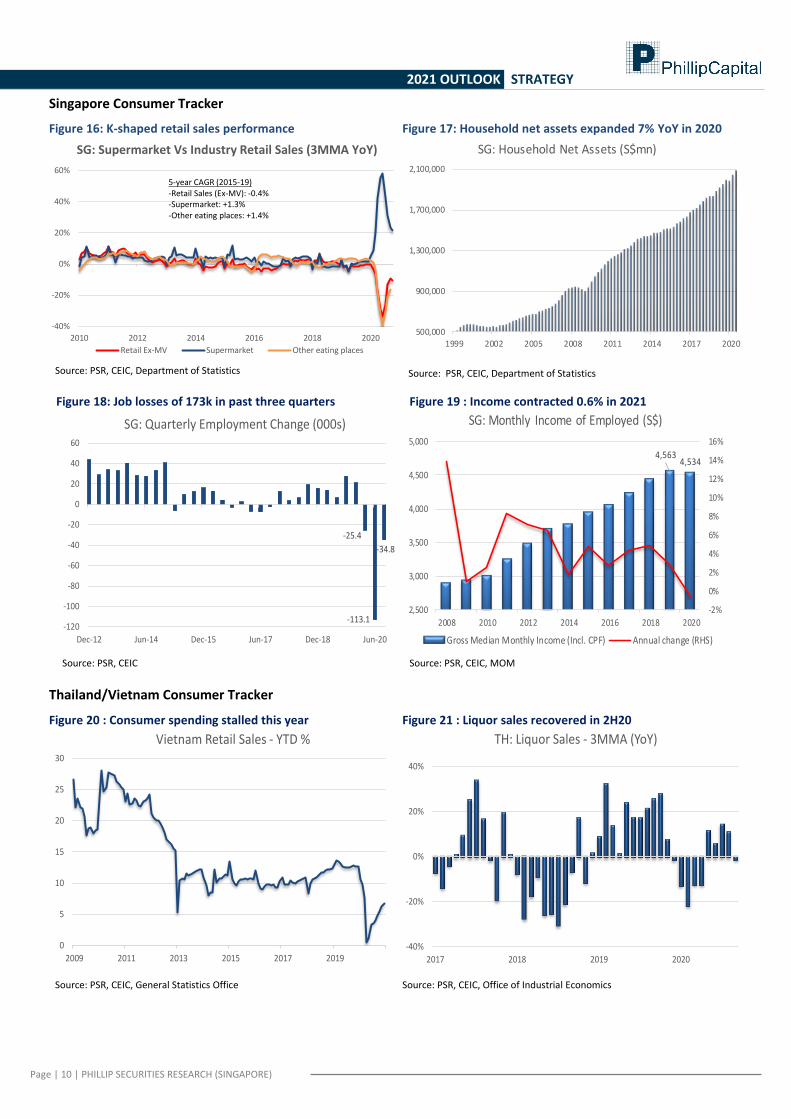
2020 was the year of pantry-loading and panic-buying of groceries (Figure 16). April’s supermarket sales skyrocketed 75%. When Singapore entered Phase 2 reopening, supermarket sales remained robust. October sales grew 22% YoY. Supermarket CAGR in the past five years (2015-19) was only 1.3%. This implies growth rates were still trending 22x faster than the last five years as we entered 4Q20. Working from home has meant more meals being consumed at home. Eating places’ sales contracted another 18% YoY in October.
Still, Singapore’s consumer stocks were down 15.1% in 2020, dragged down by Dairy Farm (-27.0%), SPH (-48.2%) and Thai Beverage (-17.4%). Sheng Siong stood out with a gain of 25.0%. Its 9M20 net earnings surged 70% YoY - excluding government grants - to S$95mn.
Outlook
It was a dismal year for retail sales in 2020. Year to October, retail sales excluding motor vehicles shrank 16% YoY. May 2020 was the worst month on record, with a collapse of 45% as the country entered circuit breaker. Although we expect improvements in 2021, spending is unlikely to return to pre-pandemic levels. Without tourist arrivals and with weak macro conditions, retail spending would remain tepid. Other factors impinging on consumption include unemployment (Figure 18). Job losses in the past three quarters totalled 173,000. This was equivalent to more than five years of job gains. The service industry shed the most jobs, namely from the retail and F&B segments. Another impediment to spending is a decline in income levels (Figure 19). Our Overweight position is premised on essential consumption which should benefit stocks such as Koufu and Sheng Siong.
Recommendations
We Overweight the consumer sector. As the overall environment remains soft, we recommend selective stock-picking:
• Koufu’s (BUY/TP: S$0.77) revenue and footfall at its food courts and coffee shops are expected to recover in 2021. Another growth propeller would be its new central kitchen at Woodland. This is expected to generate new income streams such as rental and ingredients and cost efficiencies from scaling up food processing and preparation for its retail stores.
• Sheng Siong (NEUTRAL/TP: S$1.71) continues to gain market share in groceries from mall-operated chains and wet markets. We expect revenue to contract in 2021 after unprecedented growth last year. But the company’s fundamental merits are intact, namely high pre-pandemic ROEs of 28% and record net cash of S$180mn.
• Thai Beverage (BUY/TP: S$0.86) cut costs aggressively in FY9/20 to protect its net profits amid pandemic closures. Its key spirit volume only rose 0.2% in FY9/20 but net earnings were up 15%. We expect FY9/21 volumes to return to growth of 3-4% on the back of economic recovery and absence of the alcohol that occurred in April 2020. We continue to peg valuations to its five-year historical average of 18x PE.
Paul Chew (+65 6212 1851) Head of Research
Page | 10 | PHILLIP SECURITIES RESEARCH (SINGAPORE)
2021 OUTLOOK STRATEGY
Singapore Consumer Tracker
Figure 16: K-shaped retail sales performance
Source: PSR, CEIC, Department of Statistics
Figure 17: Household net assets expanded 7% YoY in 2020
Source: PSR, CEIC, Department of Statistics
Figure 18: Job losses of 173k in past three quarters
Source: PSR, CEIC
Figure 19 : Income contracted 0.6% in 2021
Source: PSR, CEIC, MOM
Thailand/Vietnam Consumer Tracker
Figure 20 : Consumer spending stalled this year
Source: PSR, CEIC, General Statistics Office
Figure 21 : Liquor sales recovered in 2H20
Source: PSR, CEIC, Office of Industrial Economics
-40%
-20%
0%
20%
40%
60%
2010 2012 2014 2016 2018 2020
Retail Ex-MV Supermarket Other eating places
SG: Supermarket Vs Industry Retail Sales (3MMA YoY)
5-year CAGR (2015-19)-Retail Sales (Ex-MV): -0.4%-Supermarket: +1.3%-Other eating places: +1.4%
500,000
900,000
1,300,000
1,700,000
2,100,000
1999 2002 2005 2008 2011 2014 2017 2020
SG: Household Net Assets (S$mn)
-25.4
-113.1
-34.8
-120
-100
-80
-60
-40
-20
0
20
40
60
Dec-12 Jun-14 Dec-15 Jun-17 Dec-18 Jun-20
SG: Quarterly Employment Change (000s)
4,5634,534
-2%
0%
2%
4%
6%
8%
10%
12%
14%
16%
2,500
3,000
3,500
4,000
4,500
5,000
2008 2010 2012 2014 2016 2018 2020
SG: Monthly Income of Employed (S$)
Gross Median Monthly Income (Incl. CPF) Annual change (RHS)
0
5
10
15
20
25
30
2009 2011 2013 2015 2017 2019
Vietnam Retail Sales - YTD %
-40%
-20%
0%
20%
40%
2017 2018 2019 2020
TH: Liquor Sales - 3MMA (YoY)
Page | 11 | PHILLIP SECURITIES RESEARCH (SINGAPORE)
2021 OUTLOOK STRATEGY
Conglomerate OVERWEIGHT
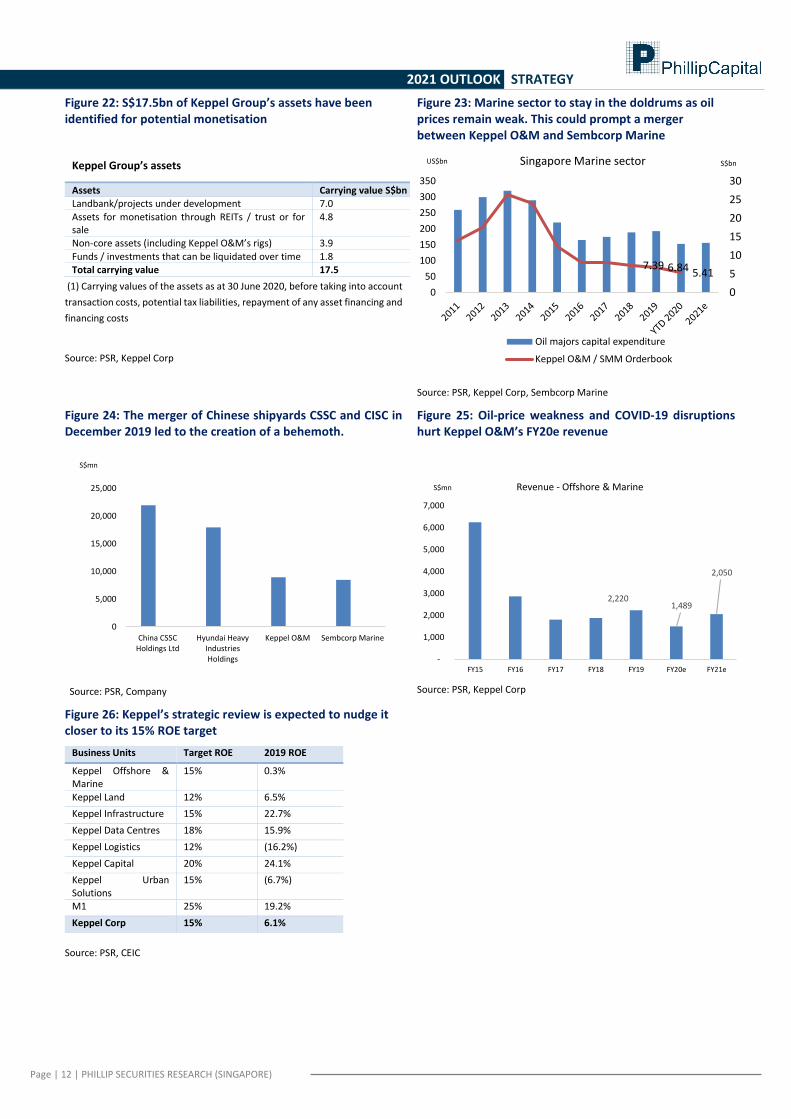
• Keppel has identified S$17.5bn of assets for monetisation over time.
• Its 100-day programme is expected to provide clarity on Keppel O&M and remove key overhang.
• Longer-term ROE target of 15% reaffirmed.
• OVERWEIGHT Keppel in the sector.
2020 Review Singapore investment company Temasek’s withdrawal of its S$4.1bn partial offer in August this year for Keppel Corp sent its shares 24% lower. Temasek said it did this after Keppel breached a material adverse change clause. Its offer had mandated that Keppel’s profit after tax must not fall by more than 20%, over the cumulative four quarters from the third quarter ended September 2019. However, the clause was breached with Keppel’s latest results. Its cumulative loss after tax for the year to end-June came in at S$165mn, impacted by S$919mn in provisions for Keppel O&M’s contract assets, doubtful debt, as well as share of impairment provision arising from its associate, Floatel. On the bright side, Keppel has launched a strategic review of its O&M unit. An announcement of the review results is expected in mid-January 2021. Ability to provide a clear resolution of its O&M unit would bring stability to the Keppel Group and remove its current overhang. Outlook Divestments of Keppel’s assets will likely be speeded up in 2021, in line with Keppel’s Vision 2030. This will allow the Group to unlock capital for reallocation to new growth areas. In December 2020, Keppel divested its remaining 30% interest in Dong Nai Waterfront City for about 1.95 trillion dong or S$115.9mn in cash. It followed this up with a divestment of its interest in Keppel Bay Tower to Keppel REIT. The agreed valuation was S$657.2mn. Gains from the transaction are estimated at S$14.6mn, for potential booking in FY2021. We believe Keppel will hasten the divestment of other non-core assets, possibly amounting to S$3-5bn in the next three years. Elsewhere, its shipyards that had been affected by COVID-19 disruptions have resumed work. We expect operations to improve in FY21e, underpinned by a strong orderbook. We see the divestment of Keppel O&M to Sembcorp Marine (Non-rated) as the most likely outcome of its strategic review and believe this will lead to a re-rating of its shares.
Recommendation We are OVERWEIGHT on Keppel in the sector, being positive on its long-term outlook. Catalysts are expected from a removal of its O&M overhang.
Terence Chua (+65 6212 1852) Senior Research Analyst
Page | 12 | PHILLIP SECURITIES RESEARCH (SINGAPORE)
2021 OUTLOOK STRATEGY
Figure 22: S$17.5bn of Keppel Group’s assets have been identified for potential monetisation
Keppel Group’s assets
Assets Carrying value S$bn (1) Landbank/projects under development 7.0
Assets for monetisation through REITs / trust or for sale
4.8
Non-core assets (including Keppel O&M’s rigs) 3.9
Funds / investments that can be liquidated over time 1.8 Total carrying value 17.5
(1) Carrying values of the assets as at 30 June 2020, before taking into account
transaction costs, potential tax liabilities, repayment of any asset financing and
financing costs
Source: PSR, Keppel Corp
Figure 23: Marine sector to stay in the doldrums as oil prices remain weak. This could prompt a merger between Keppel O&M and Sembcorp Marine
Source: PSR, Keppel Corp, Sembcorp Marine
Figure 24: The merger of Chinese shipyards CSSC and CISC in December 2019 led to the creation of a behemoth.
Source: PSR, Company
Figure 25: Oil-price weakness and COVID-19 disruptions hurt Keppel O&M’s FY20e revenue
Source: PSR, Keppel Corp
Figure 26: Keppel’s strategic review is expected to nudge it closer to its 15% ROE target
Business Units Target ROE 2019 ROE
Keppel Offshore & Marine
15% 0.3%
Keppel Land 12% 6.5%
Keppel Infrastructure 15% 22.7%
Keppel Data Centres 18% 15.9%
Keppel Logistics 12% (16.2%)
Keppel Capital 20% 24.1%
Keppel Urban Solutions
15% (6.7%)
M1 25% 19.2%
Keppel Corp 15% 6.1%
Source: PSR, CEIC
7.39 6.84 5.41
0
5
10
15
20
25
30
0
50
100
150
200
250
300
350
Singapore Marine sector
Oil majors capital expenditure
Keppel O&M / SMM Orderbook
S$bnUS$bn
0
5,000
10,000
15,000
20,000
25,000
China CSSCHoldings Ltd
Hyundai HeavyIndustriesHoldings
Keppel O&M Sembcorp Marine
S$mn
2,220 1,489
2,050
-
1,000
2,000
3,000
4,000
5,000
6,000
7,000
FY15 FY16 FY17 FY18 FY19 FY20e FY21e
Revenue - Offshore & MarineS$mn
Page | 13 | PHILLIP SECURITIES RESEARCH (SINGAPORE)
2021 OUTLOOK STRATEGY
Finance NEUTRAL
• Fed’s 150bp rate cut in March 2020 felled NIMs for banks. Return of low interest rates to weigh on NII in FY21. • Loans growth to remain weak as economies exit loan moratoriums. • Tapering of allowances to ease earnings pressure but normalisation expected only in FY22. • Lift of dividend cap may boost yields to pre-pandemic 5-6%. • SGX’s 2H20 earnings grew 27% YoY on the back of volatile markets. Stability expected in FY21 following sustained
volatility and acquisitions complementing existing businesses. • Remain NEUTRAL on banks. For sector exposure, prefer SGX and UOB on swifter recovery potential.
2020 Review
Banks entered 2020 expecting thinner margins and weak loans growth. These were to be compensated by fee and other non-interest income from wealth management, deals and bonds. However, COVID-19 drastically weakened the operating environment. To cope with the economic stress, the Fed instituted two unplanned rate cuts totalling 150bps in March. Interest rates plunged from 1.77%/1.57% at the start of the year to the current 0.41%/0.22% for 3M SIBOR/SOR. With such low interest rates, banks’ NIMs slipped 27bps from 1.80% to 1.53% by 3Q20, levels last seen in 2013.
Circuit breaker in Singapore in 2Q20 to curb the spread of COVID-19 forced banks to close physical branches. This hurt their fee and other non-interest income. The economy screeched to a halt and the quality of loans came under scrutiny. Banks began taking pre-emptive provisions, which ate into their earnings by 24-33% in 9M20. The MAS also asked banks to cut their dividends by 40% to ensure they had sufficient capital to weather the economic fallout.
Market volatility benefitted SGX, whose earnings were up 27% in 2H20. Sustained market activities are expected to hold up its FY21e earnings. An unexpected announcement of the termination of MSCI equity index futures contracts for February 2021 was also promptly followed up with a new licence agreement with FTSE to replace expiring contracts.
Outlook
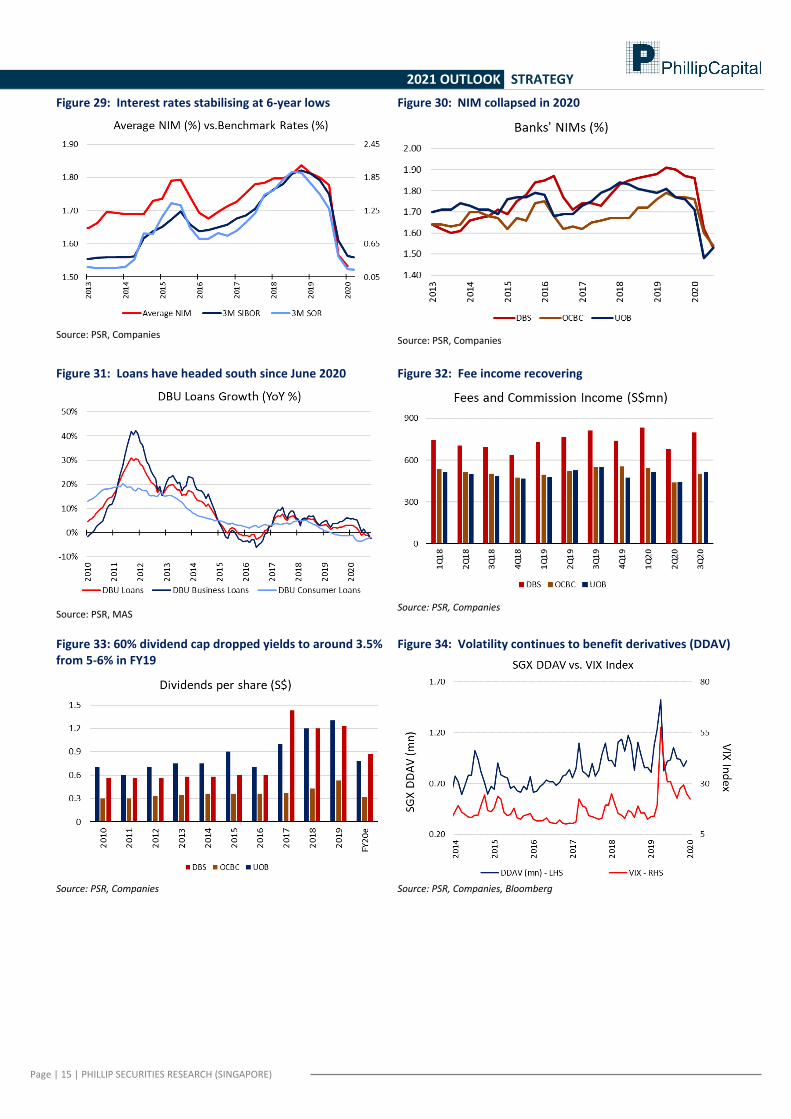
Operating conditions for banks remain weak heading into 2021: 1) Low interest rates. SIBOR and SOR have stabilised at their 6-year lows but we do not expect any rate hikes in the short
term (Figure 29). 2) Weak loans growth. Loans fell by 2.32% YoY in November while we had modelled low-single-digit growth for FY20 at the
beginning of the year. Although consumer loans have improved for four consecutive months, business loans have fallen for eight months straight. We are expecting 2-3% loans growth in FY21e as the Singapore economy gradually recovers.
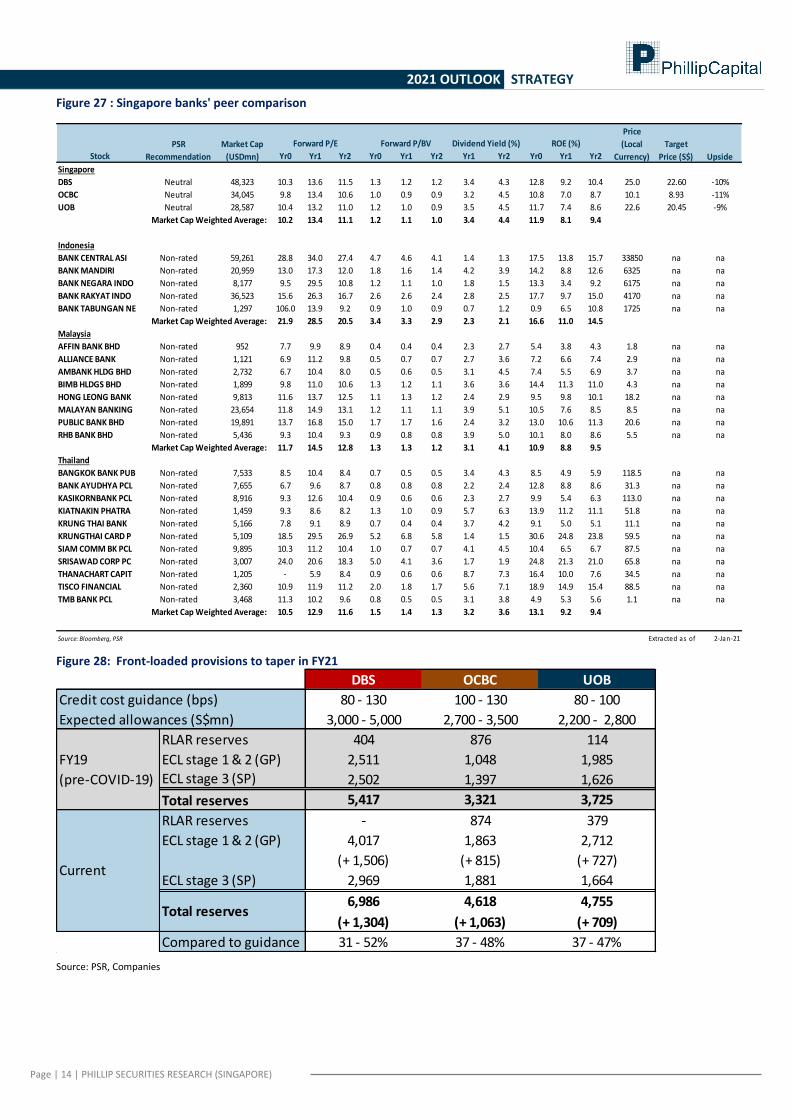
3) Heightened credit costs. At the start of COVID-19, banks guided for 80-130bps of credit costs for FY20-21. Although they front-loaded credit costs by 68-77bps in 9M20, we expect 40-60 bps in FY21e, in accordance with guidance provided by the banks. This is comparable to the peak of a typical credit cycle.
4) Market activities may taper off. SGX has benefited from increased market participation in the past year (Figure 34). While monthly SDAV and DDAV continue to grow by double digits YoY, we think the high benchmark set in 2020 will be harder to top in 2021.
Recommendation Remain NEUTRAL. While an economic recovery is underway, we expect earnings to return to pre-pandemic levels only in FY22. That said, possible re-rating catalysts include a swifter economic recovery which can benefit non-interest income and an upgrade in asset quality as Singapore exits loan moratoriums. The latter would normalise allowances and could lead to more lending by the banks. A lift in dividend cap by the MAS could also boost their yield appeal.
We like SGX (SGX SP, ACCUMULATE, TP: S$9.45) in the sector as new acquisitions could potentially catalyse growth. Current businesses are also likely to hold steady as in the past year. A higher quarterly DPS of 8 cents, from 7.5 cents, has enhanced its attractiveness. For exposure to banks, we prefer UOB (UOB SP, NEUTRAL, TP: S$21.10) due to its lower SPs and better credit quality outlook, which may lead to a faster earnings recovery in FY21.
Tay Wee Kuang (+65 6212 1853)
Research Analyst [email protected]
Page | 14 | PHILLIP SECURITIES RESEARCH (SINGAPORE)
2021 OUTLOOK STRATEGY
Figure 27 : Singapore banks' peer comparison
Figure 28: Front-loaded provisions to taper in FY21
Source: PSR, Companies
Stock Yr0 Yr1 Yr2 Yr0 Yr1 Yr2 Yr1 Yr2 Yr0 Yr1 Yr2
Singapore
DBS Neutral 48,323 10.3 13.6 11.5 1.3 1.2 1.2 3.4 4.3 12.8 9.2 10.4 25.0 22.60 -10%
OCBC Neutral 34,045 9.8 13.4 10.6 1.0 0.9 0.9 3.2 4.5 10.8 7.0 8.7 10.1 8.93 -11%
UOB Neutral 28,587 10.4 13.2 11.0 1.2 1.0 0.9 3.5 4.5 11.7 7.4 8.6 22.6 20.45 -9%
Market Cap Weighted Average: 10.2 13.4 11.1 1.2 1.1 1.0 3.4 4.4 11.9 8.1 9.4
Indonesia
BANK CENTRAL ASI Non-rated 59,261 28.8 34.0 27.4 4.7 4.6 4.1 1.4 1.3 17.5 13.8 15.7 33850 na na
BANK MANDIRI Non-rated 20,959 13.0 17.3 12.0 1.8 1.6 1.4 4.2 3.9 14.2 8.8 12.6 6325 na na
BANK NEGARA INDO Non-rated 8,177 9.5 29.5 10.8 1.2 1.1 1.0 1.8 1.5 13.3 3.4 9.2 6175 na na
BANK RAKYAT INDO Non-rated 36,523 15.6 26.3 16.7 2.6 2.6 2.4 2.8 2.5 17.7 9.7 15.0 4170 na na
BANK TABUNGAN NE Non-rated 1,297 106.0 13.9 9.2 0.9 1.0 0.9 0.7 1.2 0.9 6.5 10.8 1725 na na
Market Cap Weighted Average: 21.9 28.5 20.5 3.4 3.3 2.9 2.3 2.1 16.6 11.0 14.5
Malaysia
AFFIN BANK BHD Non-rated 952 7.7 9.9 8.9 0.4 0.4 0.4 2.3 2.7 5.4 3.8 4.3 1.8 na na
ALLIANCE BANK Non-rated 1,121 6.9 11.2 9.8 0.5 0.7 0.7 2.7 3.6 7.2 6.6 7.4 2.9 na na
AMBANK HLDG BHD Non-rated 2,732 6.7 10.4 8.0 0.5 0.6 0.5 3.1 4.5 7.4 5.5 6.9 3.7 na na
BIMB HLDGS BHD Non-rated 1,899 9.8 11.0 10.6 1.3 1.2 1.1 3.6 3.6 14.4 11.3 11.0 4.3 na na
HONG LEONG BANK Non-rated 9,813 11.6 13.7 12.5 1.1 1.3 1.2 2.4 2.9 9.5 9.8 10.1 18.2 na na
MALAYAN BANKING Non-rated 23,654 11.8 14.9 13.1 1.2 1.1 1.1 3.9 5.1 10.5 7.6 8.5 8.5 na na
PUBLIC BANK BHD Non-rated 19,891 13.7 16.8 15.0 1.7 1.7 1.6 2.4 3.2 13.0 10.6 11.3 20.6 na na
RHB BANK BHD Non-rated 5,436 9.3 10.4 9.3 0.9 0.8 0.8 3.9 5.0 10.1 8.0 8.6 5.5 na na
Market Cap Weighted Average: 11.7 14.5 12.8 1.3 1.3 1.2 3.1 4.1 10.9 8.8 9.5
Thailand
BANGKOK BANK PUB Non-rated 7,533 8.5 10.4 8.4 0.7 0.5 0.5 3.4 4.3 8.5 4.9 5.9 118.5 na na
BANK AYUDHYA PCL Non-rated 7,655 6.7 9.6 8.7 0.8 0.8 0.8 2.2 2.4 12.8 8.8 8.6 31.3 na na
KASIKORNBANK PCL Non-rated 8,916 9.3 12.6 10.4 0.9 0.6 0.6 2.3 2.7 9.9 5.4 6.3 113.0 na na
KIATNAKIN PHATRA Non-rated 1,459 9.3 8.6 8.2 1.3 1.0 0.9 5.7 6.3 13.9 11.2 11.1 51.8 na na
KRUNG THAI BANK Non-rated 5,166 7.8 9.1 8.9 0.7 0.4 0.4 3.7 4.2 9.1 5.0 5.1 11.1 na na
KRUNGTHAI CARD P Non-rated 5,109 18.5 29.5 26.9 5.2 6.8 5.8 1.4 1.5 30.6 24.8 23.8 59.5 na na
SIAM COMM BK PCL Non-rated 9,895 10.3 11.2 10.4 1.0 0.7 0.7 4.1 4.5 10.4 6.5 6.7 87.5 na na
SRISAWAD CORP PC Non-rated 3,007 24.0 20.6 18.3 5.0 4.1 3.6 1.7 1.9 24.8 21.3 21.0 65.8 na na
THANACHART CAPIT Non-rated 1,205 - 5.9 8.4 0.9 0.6 0.6 8.7 7.3 16.4 10.0 7.6 34.5 na na
TISCO FINANCIAL Non-rated 2,360 10.9 11.9 11.2 2.0 1.8 1.7 5.6 7.1 18.9 14.9 15.4 88.5 na na
TMB BANK PCL Non-rated 3,468 11.3 10.2 9.6 0.8 0.5 0.5 3.1 3.8 4.9 5.3 5.6 1.1 na na
Market Cap Weighted Average: 10.5 12.9 11.6 1.5 1.4 1.3 3.2 3.6 13.1 9.2 9.4
Source: Bloomberg, PSR Extracted as of 2-Jan-21
PSR
Recommendation
Market Cap
(USDmn)
Dividend Yield (%)Forward P/BVForward P/E ROE (%)
Price
(Local
Currency)
Target
Price (S$) Upside
DBS OCBC UOB
80 - 130 100 - 130 80 - 100
3,000 - 5,000 2,700 - 3,500 2,200 - 2,800
RLAR reserves 404 876 114
ECL stage 1 & 2 (GP) 2,511 1,048 1,985
ECL stage 3 (SP) 2,502 1,397 1,626
Total reserves 5,417 3,321 3,725
RLAR reserves - 874 379
ECL stage 1 & 2 (GP) 4,017 1,863 2,712
(+ 1,506) (+ 815) (+ 727)
ECL stage 3 (SP) 2,969 1,881 1,664
6,986 4,618 4,755
(+ 1,304) (+ 1,063) (+ 709)
Compared to guidance 31 - 52% 37 - 48% 37 - 47%
Credit cost guidance (bps)
Expected allowances (S$mn)
FY19
(pre-COVID-19)
Current
Total reserves
Page | 15 | PHILLIP SECURITIES RESEARCH (SINGAPORE)
2021 OUTLOOK STRATEGY
Figure 29: Interest rates stabilising at 6-year lows
Source: PSR, Companies
Figure 30: NIM collapsed in 2020
Source: PSR, Companies
Figure 31: Loans have headed south since June 2020
Source: PSR, MAS
Figure 32: Fee income recovering
Source: PSR, Companies
Figure 33: 60% dividend cap dropped yields to around 3.5% from 5-6% in FY19
Source: PSR, Companies
Figure 34: Volatility continues to benefit derivatives (DDAV)
Source: PSR, Companies, Bloomberg
Page | 16 | PHILLIP SECURITIES RESEARCH (SINGAPORE)
2021 OUTLOOK STRATEGY
Healthcare NEUTRAL
• COVID-19 threw industry into disarray, diverting resources to fighting the health crisis.
• Unknown nature of the virus deterred patient visits for elective and non-essential treatments.
• Travel restrictions hurt medical tourism and upended supply chains for medical supplies distributors.
• Successful containment of virus and development of vaccines to bring back patients in 2021.
• Upgrade healthcare sector to ACCUMULATE from NEUTRAL. Top picks are iX Biopharma (IXBIO SP, BUY, TP: S$0.455) and UG Healthcare (UGHC SP, BUY, TP: S$1.35).
2020 Review
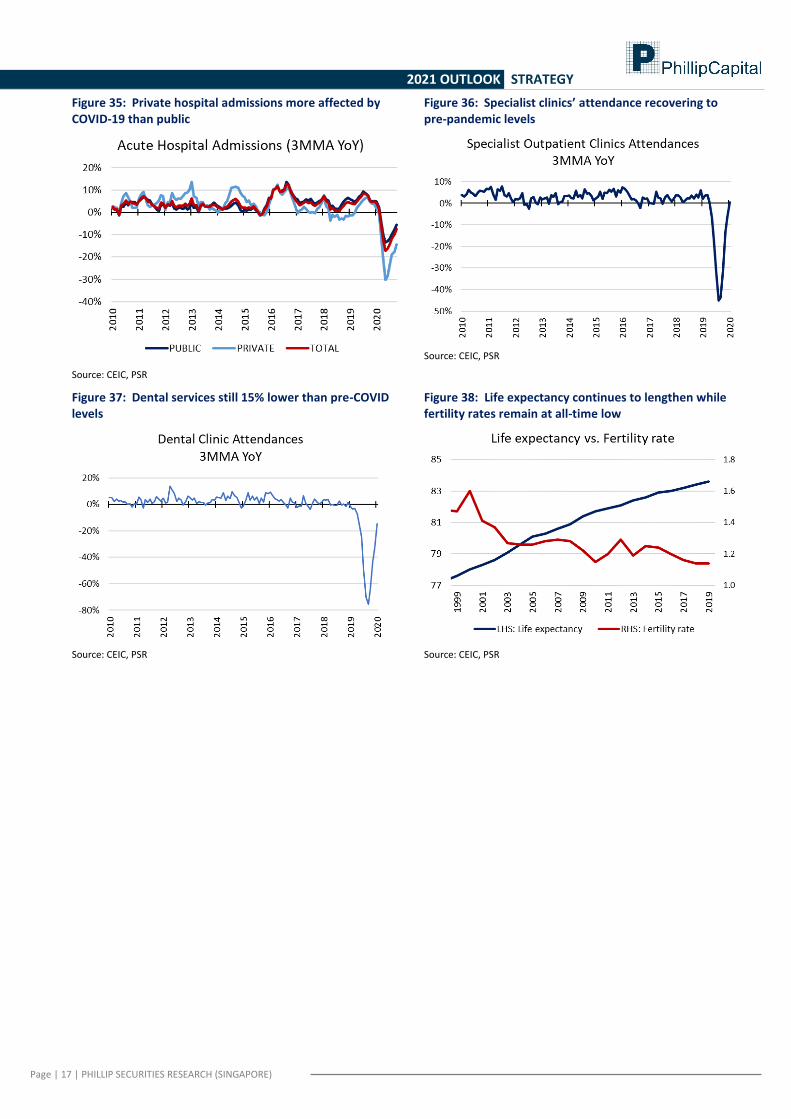
COVID-19 stressed the healthcare industry like never before. A lack of understanding of the new virus created aversion to hospital and clinic visits for fear of contracting the virus in medical facilities. Healthcare providers were affected as many elective and non-essential treatments were deferred. Travel restrictions compounded the problem, as medical tourism ground to a halt in Singapore.
Medical supplies distributors, too, were affected by lower demand for medical services and hiccups in their supply chains, which led to higher costs. The initial rush for essential medical supplies such as surgical masks and hand sanitisers also resulted in pre-emptive stocking up at higher costs due to supply shortages.
The pandemic, however, did throw up some winners, as with most crises. The essential nature of medical PPE such as gloves and overalls led to a meteoric spike in demand. This translated to rising average selling prices and order backlogs for manufacturers of medical PPE and COVID-19 test kits.
As COVID-19 came under control in Singapore, patients have started to trickle back to hospitals and clinics for elective, chronic and other non-essential treatments.
Outlook
Successful development of COVID-19 vaccines is expected to improve the operating environment for the industry in 2021:
1. Pent-up demand for medical services. Apart from patients returning for deferred treatments, there has been an uptick in aesthetic treatments as well. Patients who may have developed chronic conditions over the past year may also stream into clinics and hospitals as risk aversion to medical facilities subsides.
2. Telemedicine gains traction. Digitalisation efforts by healthcare providers may begin to pay off. Telemedicine can offer greater efficiencies through queue management, online consultations etc. These complement existing healthcare services.
3. Possible recovery of medical tourism. A potential lifting of travel restrictions may bring back foreign patients, especially with the government’s plans to vaccinate the local population by 3Q21.
4. Demand for medical PPE and test kits to normalise. FY20 was a bumper year for medical PPE and test-kit manufacturers. While 2021 could be a more normal year, order backlogs should still bolster FY21 earnings.
Recommendation
Upgrade healthcare sector to ACCUMULATE. A return of patients should benefit healthcare providers and distributors alike. Business plans that were halted during the pandemic will likely resume, which can provide additional tailwinds to the sector. Our top picks are as follow:
• iX Biopharma (IXBIO SP, BUY, TP: S$0.455): potential out-licensing deal for Phase 3 of Wafermine™ development and scheduled capacity increase as part of commercialisation efforts may see iX Biopharma achieve breakeven in FY21.
• UG Healthcare (UGHC SP, BUY, TP: S$1.35): we value UGHC on more normalised earnings in FY22e. We already incorporate a 24% decline in ASPs and 25% point drop in GP margins. Volume growth is expected to be its major earnings driver that year.
Tay Wee Kuang (+65 6212 1853) Research Analyst
Page | 17 | PHILLIP SECURITIES RESEARCH (SINGAPORE)
2021 OUTLOOK STRATEGY
Figure 35: Private hospital admissions more affected by COVID-19 than public
Source: CEIC, PSR
Figure 36: Specialist clinics’ attendance recovering to pre-pandemic levels
Source: CEIC, PSR
Figure 37: Dental services still 15% lower than pre-COVID levels
Source: CEIC, PSR
Figure 38: Life expectancy continues to lengthen while fertility rates remain at all-time low
Source: CEIC, PSR
Page | 18 | PHILLIP SECURITIES RESEARCH (SINGAPORE)
2021 OUTLOOK STRATEGY
Real Estate Investment Trusts (REITs) NEUTRAL
• FTSE SREITs’ returns fell 3.6% in 2020. Weakness across sub-sectors, with Keppel DC REIT being the top performer (+38.4%) and First REIT the worst (-74.6%).
• Sector yield spread of 339bps over benchmark 10-year SGS remained close to -0.12 SD. • Nevertheless, maintain OVERWEIGHT on REITs, with catalysts expected from economic reopening and acquisitions in this
lower-interest-rate environment. Sub-sector preferences are Retail and Hospitality. Top picks are Manulife US REIT (MUST SP, Buy, TP US$0.92), Frasers Centrepoint Trust (FCT SP, Buy, TP S$2.79), Ascendas REIT (AREIT SP, Buy, TP S$3.61) and Ascott Residence Trust (ART SP, Buy, TP S$1.36).
2020 Review SREITs were not spared the brutal market selldown in March. At its trough, the FTSE S-REIT Index shed 35%. COVID-19 and the accompanying economic mayhem cast a pall on SREITS in the first half of 2020. Earnings were eroded by the double whammy of government-mandated/voluntary rental rebates to tenants and weaker sales from mandated business closures during the lockdown. Most businesses turned to remote working while the closure of non-essential businesses pushed consumers towards online shopping. Only the Healthcare and Industrial sub-sectors were resilient, as the majority of their tenants operate in essential services and faced less business disruption than Retail, Commercial and Hospitality. Capital, rental and transaction markets were lacklustre, as real-estate players adopted a wait-and-see approach. The uncertainties widened credit spreads, wiping out savings from lower interest rates. Phase 2 reopening of the economy returned short-term visibility to the market in 2H20. Fund-raising and transactions picked up. Despite the uncertainties and evolving real-estate landscape, S-REITs raised S$7.8bn from capital markets (2019: S$9.5bn) and S$1.7bn from debt markets (2019: S$3.4bn). M&As were less pronounced in 2020, owing to more volatile market conditions, but picked up towards the end of the year. The merger of CapitaLand Mall Trust (formerly CT SP) and CapitaLand Commercial Trust (formerly CCT SP) to form CapitaLand Integrated Commercial Trust (CICT SP) was completed in September. The ESR-Sabana merger fell through while unitholders of SoilBuild Business Space REIT (SBREIT SP, NR) were offered privatisation. Low interest rates were conducive for REITs, as maturing debt was refinanced at lower rates. Recovery was uneven, with Healthcare and Industrial leading the way. They had recouped their pre-pandemic price levels by June 2020. Retail, Commercial and Diversified SREITs traded in the -25% to -17% range. Hospitality was the most severely hit, weighed down by border closures. The sub-sector traded at a 35% discount to pre-pandemic levels. Occupancies and rents dipped across the board, reflecting weak business sentiment. 2020 will go down as the year that sped up digital adoption and transformation. COVID-19 accelerated the digital transformation of companies, diminishing the role of offices, retail space and business travel while elevating the importance of data centres and logistics assets. Real-estate players will have to acclimatise themselves to the new landscape. Retail. Daytime catchment increased for suburban malls, due to work-from-home arrangements throughout 2H20, in line with government recommendations. Central malls were hit on multiple fronts, by their higher percentage of discretionary trade, the disappearance of office workers and an absence of tourist spending. Rental rebates and government wage support helped to defray costs for retailers. Still, weaker sales throughout the year forced some to consider consolidating their operations or moving to a pure e-commerce model. Tenant sales have improved to -10% of 2019 levels although shopper footfall is still down 30% from normal times due to density control. E-commerce cannibalisation has doubled from 7% to 14%. Retail operators have used the downtime to ramp up their digital offerings. They have launched online marketplaces and food-ordering platforms, riding on their existing loyalty programmes. These offer their tenants an omnichannel advantage. Office. The success of remote working has spurred companies to reconsider their space needs. Financial firms started accepting permanent hybrid work arrangements in October, allowing employees to work remotely up to 40% of the time. Office REIT managers say tenants have reduced leasing space by 10-30% upon renewal. Physical occupancy hovers at 30% in Phase 3. Industrial. Industrial rents slipped despite an uptick in occupancy. Warehouse occupancies were lifted by stockpiling demand in 1H20 and new demand by 3PLs in 2H20 owing to higher e-commerce volumes. Higher digital adoption solidified the resilience of data centres as future-proof assets, compressing yields further. Industrial assets - excluding business parks - maintained high physical occupancies of 60-70% during the lockdown. Construction slippages delayed the delivery of new supply to 2021, helping to support rents. Hospitality. Hotel RevPARs dived as countries all over shuttered borders. Monthly international tourist arrivals in Singapore have been down by 99% YoY since March. Most Hospitality S-REITs benefitted from government block-booking of their assets
Page | 19 | PHILLIP SECURITIES RESEARCH (SINGAPORE)
2021 OUTLOOK STRATEGY
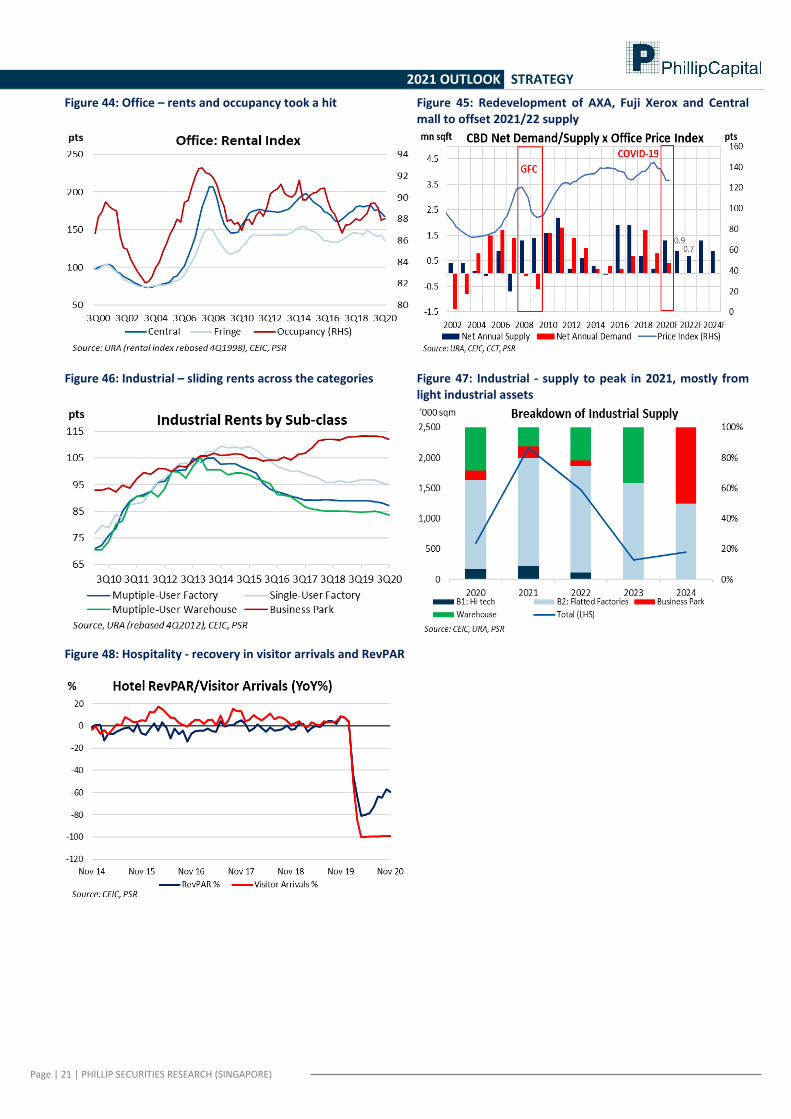
for use as quarantine facilities for returning residents, work permit holders and inbound business travellers. This alternative source of revenue has tapered off in tandem with dwindling returning residents. Hoteliers are looking to fill vacancies with staycation guests, after Singapore gave the green light for staycations. They will be aided by SingapoRediscovers vouchers. Hotels’ event-related business such as wedding banquets and MICE bookings have yet to recover fully from capacity restrictions, with many organisers still using video conferencing tools. Despite the establishment of travel agreements with several countries, tourist arrivals remain muted as companies reserve international travel as a last resort, relying on virtual meetings in the interim. Outlook All sectors face rental pressure from weaker demand and caution in the market. With interest rates likely to remain low, more acquisitions and fund-raising can be expected in 2021. Two themes have emerged: the search for yields overseas and the chase after scale. Given tight cap rates, REITs have started look abroad for acquisitions. Scale bestows REITs with a wider investible universe and larger debt headroom for development. Retail (OVERWEIGHT). Weaker demand and lower rents are expected as tenants rationalise costs. Suburban malls should be resilient, as more firms announce permanent hybrid work arrangements. Dominant central and suburban malls, which are located near transport nodes, will be prioritised when retailers consolidate stores. Retail malls are expected to remain a crucial piece of commercial-property infrastructure, providing essential goods and services and a place for people to socialise. F&B sales will be lifted by a relaxation of group size and capacity restrictions under Phase 3, with central malls experiencing a more pronounced recovery due to returning office crowds. Although the lower cost of selling online and consolidation among retailers have dampened demand for retail space, certain trade categories appear to face less e-commerce risks. Landlords are also getting creative with their mall offerings and experiential concepts in order to draw more tenants and shopper footfall. Office (NEUTRAL). Lacklustre demand and downsizing from the adoption of permanent hybrid work arrangements will likely result in oversupply in the office market in the near term. Rents could remain under pressure. Oversupply will be mitigated by low supply coming online of 0.9mn sq ft on average each year in the next five years. This is below the 10-year average of 1mn sq ft. Additionally, the redevelopment of AXA Towers, Fuji Xerox and the Central mall will take almost 1.2mn sq ft off supply in the central area in 2020/2021. The long-term outlook of the office market is still good as Singapore remains one of the top cities for the location of regional headquarters. This is largely attributed to its political and operational stability, business-friendly policies and educated workforce. Industrial (NEUTRAL). The outlook for data centres, hi-spec and business parks remains favourable. These asset classes are supported by a growing technology sector and low supply under construction. Warehouses have been benefitting from higher demand from logistics players, given a higher percentage of online sales. Leasing of light industrial factory space may still be muted as global demand is only starting to recover. The outlook for factory assets remains challenging given considerable new supply. Hospitality (OVERWEIGHT). The hospitality sector faces a long road to recovery. We estimate that the industry may only return to pre-COVID levels in 2023/24, in line with the Singapore Tourism Board’s expectation of a 3-5-year recovery timeline. We think that international borders will remain largely closed in 1H21. Economies with sizeable domestic demand such as China, the UK, France, Australia and the US will be the first to recover, in our view. Business travel will be less frequent, as companies may elect to hold business meetings virtually to save costs. MICE demand will likely return, as certain aspects of business engagement and networking cannot be replicated by virtual meetings. Digital adoption has resulted in leaner cost and operating structures for hoteliers, resulting in higher profit margins. Approval of Moderna and Pfizer-BioNTech vaccines have lifted the cloud of uncertainty and provided a visible timeline to recovery. Hospitality counters are still trading at depressed levels and are positioned for a recovery, in our view. A clearer recovery timeline is expected to lift the price overhang for Hospitality REITs.
Recommendation Remain OVERWEIGHT on SREITs, with sub-sector preferences being Retail and Hospitality on the back of economic reopening. Our least preferred sub-sector is Commercial. We think that the Commercial sector is facing a structural decline due to the greater adoption of remote/hybrid working, which has resulted in office downsizing. Our key recommendations are: ▪ Manulife US REIT (MUST SP, Buy, TP US$0.92)
▪ Frasers Centrepoint Trust (FCT SP, Buy, TP S$2.79)
▪ Ascendas REIT (AREIT SP, Buy, TP S$3.61)
▪ Ascott Residence Trust (ART SP, Buy, TP S$1.15)
Natalie Ong (+65 6212 1849) Research Analyst
Page | 20 | PHILLIP SECURITIES RESEARCH (SINGAPORE)
2021 OUTLOOK STRATEGY
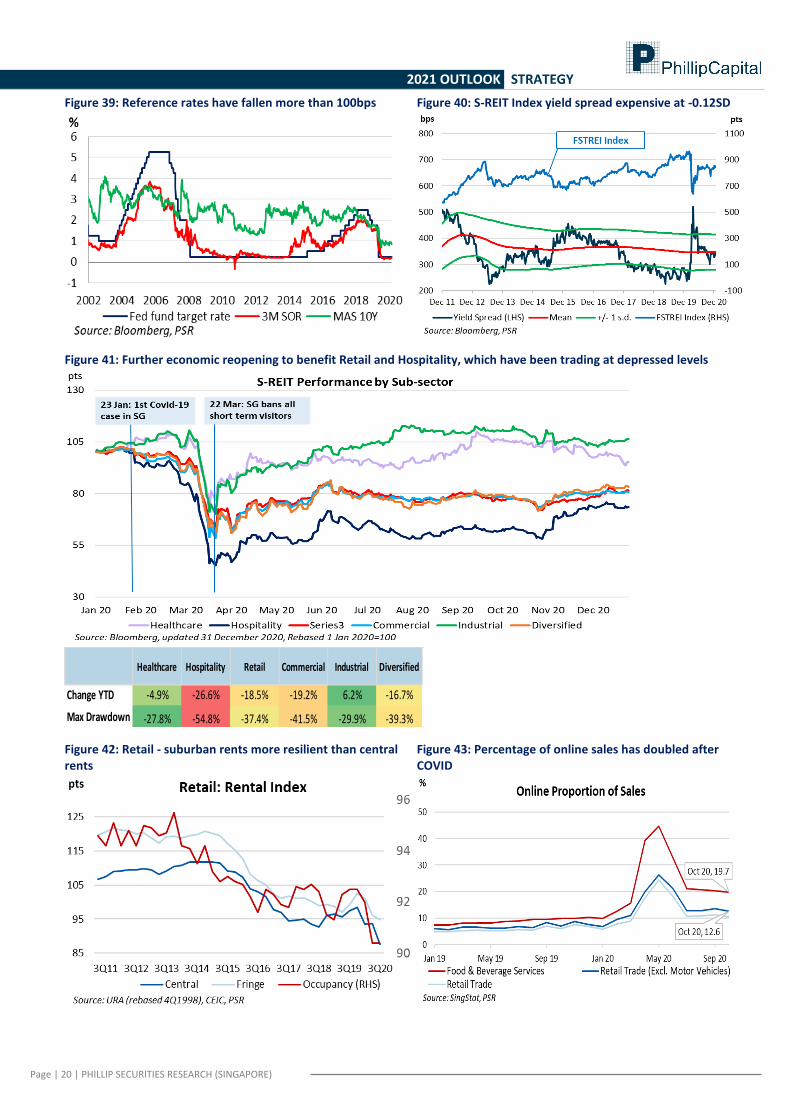
Figure 39: Reference rates have fallen more than 100bps
Figure 40: S-REIT Index yield spread expensive at -0.12SD
Figure 41: Further economic reopening to benefit Retail and Hospitality, which have been trading at depressed levels
Figure 42: Retail - suburban rents more resilient than central rents
Figure 43: Percentage of online sales has doubled after COVID
Healthcare Hospitality Retail Commercial Industrial Diversified
Change YTD -4.9% -26.6% -18.5% -19.2% 6.2% -16.7%
Max Drawdown -27.8% -54.8% -37.4% -41.5% -29.9% -39.3%
Page | 21 | PHILLIP SECURITIES RESEARCH (SINGAPORE)
2021 OUTLOOK STRATEGY
Figure 44: Office – rents and occupancy took a hit
Figure 45: Redevelopment of AXA, Fuji Xerox and Central mall to offset 2021/22 supply
Figure 46: Industrial – sliding rents across the categories
Figure 47: Industrial - supply to peak in 2021, mostly from light industrial assets
Figure 48: Hospitality - recovery in visitor arrivals and RevPAR
Page | 22 | PHILLIP SECURITIES RESEARCH (SINGAPORE)
2021 OUTLOOK STRATEGY
Technology (Hardware) OVERWEIGHT
• Strong outperformance with gains of 23% in 2020. • Electronic hardware fared well with work-at-home demand for entertainment, shopping, working and communication.
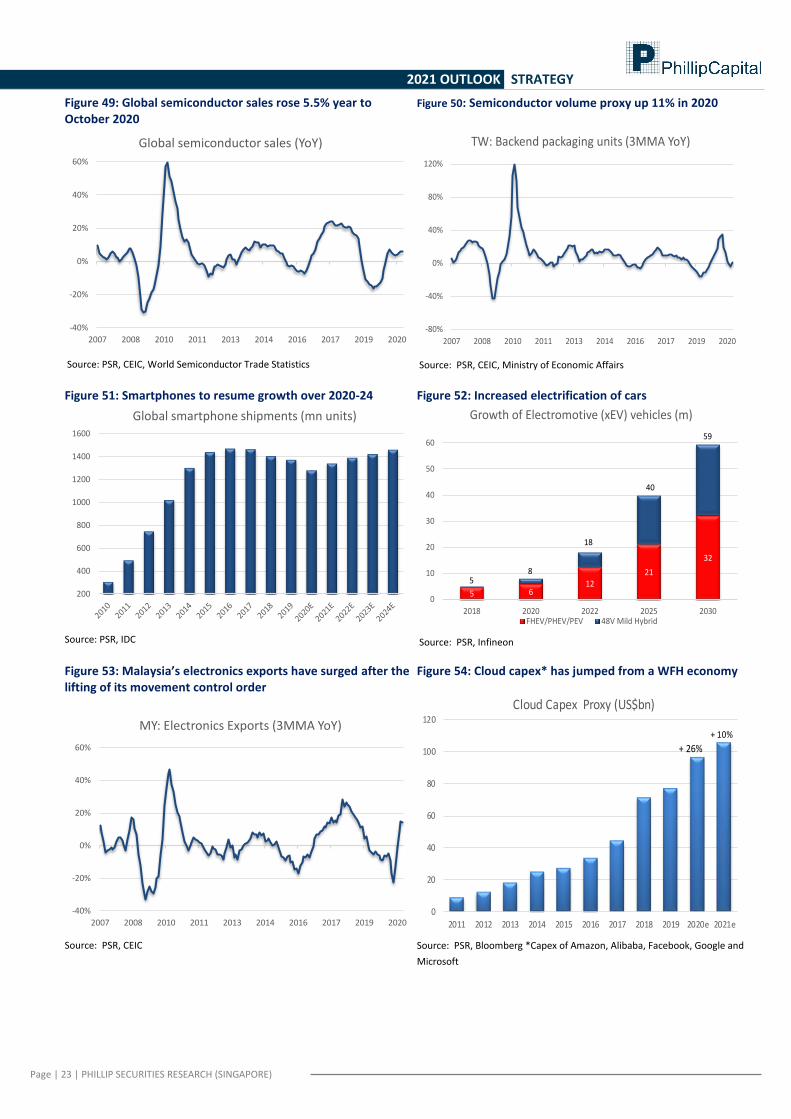
Consumer spending also shifted from services to goods. • Other secular drivers include 5G rollout, data implosion, electrification of cars and cloud computing. • Maintain Overweight on tech sector in Singapore. 2020 Review Despite the global recession, semiconductor demand in 2020 was up 5.5% (Figure 55). When the pandemic struck in China, the supply chain tripped as several factories had to be temporarily closed. As the virus spread to Southeast Asia, especially Malaysia, movement control only allowed the production of essential products. By late 2Q20, most of the production restrictions had been lifted (Figure 59). Meanwhile, demand for electronics surged as work from home meant huge demand for mobile devices for entertainment, shopping, working and communicating. Another driver was a shift in consumer wallets from services to goods as international borders were shut. As more services and products were consumed or purchased online, capex on cloud computing jumped. Electronics stocks performed well in the year, with large gains for AEM (+70.8%), Micro-Mechanics (+45.9%), Hi-P International (+31.4%) and Venture Corp. (+19.9%). Stocks that suffered were trade-war-related namely Valuetronics (-28.0%). Outlook The outlook for technology is promising, with multiple potential sources of growth.
5G: Global smartphone sales are expected to recover after four years of decline. Sales are expected to increase by a 3% CAGR from 2021 to 2024 (Figure 57. Demand is to be supported by 5G adoption and emerging markets. IDC expects 5G smartphones to account for 29% of all shipments by 2024.
Automotive: With tightening emission standards, more vehicles will need electrification. Electric cars could more than double by 2022 (Figure 58), led by growth in 48V mild hybrid vehicles. Chip content will jump 44%/111% from consumers’ migration from non-powertrain cars to mild hybrid/EV cars. Other demand for more electronics in cars includes automated driving, infotainment, sensors, cameras, LED lights, heated seating, etc.
Memory. The memory capacity of DRAM in smartphones is expected to leap from 4GB in 2019 to 8GB in 2025. To support surging processing demand for entertainment, gaming, security and camera images, much larger DRAM capacity would be needed. Demand for NAND in data analytics and storage in phones, consoles and servers is expected to rise 30-35% p.a. from 2019 to 2025 (source: Samsung).
Recommendations Venture Corp. (NEUTRAL; TP S$18.60) pays dividend yields of 4%, backed by its net cash of S$829mn. We are, however, neutral as earnings have been flat since peaking in 2017. Our target price is based on 16x FY21e PE, its average in the past five years. Micro-Mechanics (BUY; TP S$2.93) pays dividend yields of almost 5%, supported by net cash of S$25mn and ROEs of 33%. Earnings growth is coming from a recovery in semiconductor sales and new projects from front-end semiconductor customers. Our target price of 18x FY6/21 PE is based on the average of global back-end semiconductor equipment comparables. JEP Holdings’ (REDUCE; TP S$0.158) exposure to aviation has stalled its new orders. To restructure its cost base, JEP is moving more production to Malaysia. It will also pivot to the semiconductor business with the support of parent, UMS Holdings.
Paul Chew (+65 6212 1851) Head of Research
Page | 23 | PHILLIP SECURITIES RESEARCH (SINGAPORE)
2021 OUTLOOK STRATEGY
Figure 49: Global semiconductor sales rose 5.5% year to October 2020
Source: PSR, CEIC, World Semiconductor Trade Statistics
Figure 50: Semiconductor volume proxy up 11% in 2020
Source: PSR, CEIC, Ministry of Economic Affairs
Figure 51: Smartphones to resume growth over 2020-24
Source: PSR, IDC
Figure 52: Increased electrification of cars
Source: PSR, Infineon
Figure 53: Malaysia’s electronics exports have surged after the lifting of its movement control order
Source: PSR, CEIC
Figure 54: Cloud capex* has jumped from a WFH economy
Source: PSR, Bloomberg *Capex of Amazon, Alibaba, Facebook, Google and
Microsoft
-40%
-20%
0%
20%
40%
60%
2007 2008 2010 2011 2013 2014 2016 2017 2019 2020
Global semiconductor sales (YoY)
-80%
-40%
0%
40%
80%
120%
2007 2008 2010 2011 2013 2014 2016 2017 2019 2020
TW: Backend packaging units (3MMA YoY)
200
400
600
800
1000
1200
1400
1600
Global smartphone shipments (mn units)
5 612
21
32
0
10
20
30
40
50
60
2018 2020 2022 2025 2030
Growth of Electromotive (xEV) vehicles (m)
FHEV/PHEV/PEV 48V Mild Hybrid
18
85
40
59
-40%
-20%
0%
20%
40%
60%
2007 2008 2010 2011 2013 2014 2016 2017 2019 2020
MY: Electronics Exports (3MMA YoY)
0
20
40
60
80
100
120
2021e2020e201920182017201620152014201320122011
Cloud Capex Proxy (US$bn)
+ 26%
+ 10%
Page | 24 | PHILLIP SECURITIES RESEARCH (SINGAPORE)
2021 OUTLOOK STRATEGY
Telecommunications NEUTRAL
• Accounting for around 20% of mobile revenue, loss of high-margin roaming was the largest drag on telcos’ earnings. • Optus’ earnings collapsed 86% in 1HFY21 from weak mobile revenue and stubborn operating costs. • Valuations turning more attractive after the sector’s 27% decline in 2020. 2020 Review
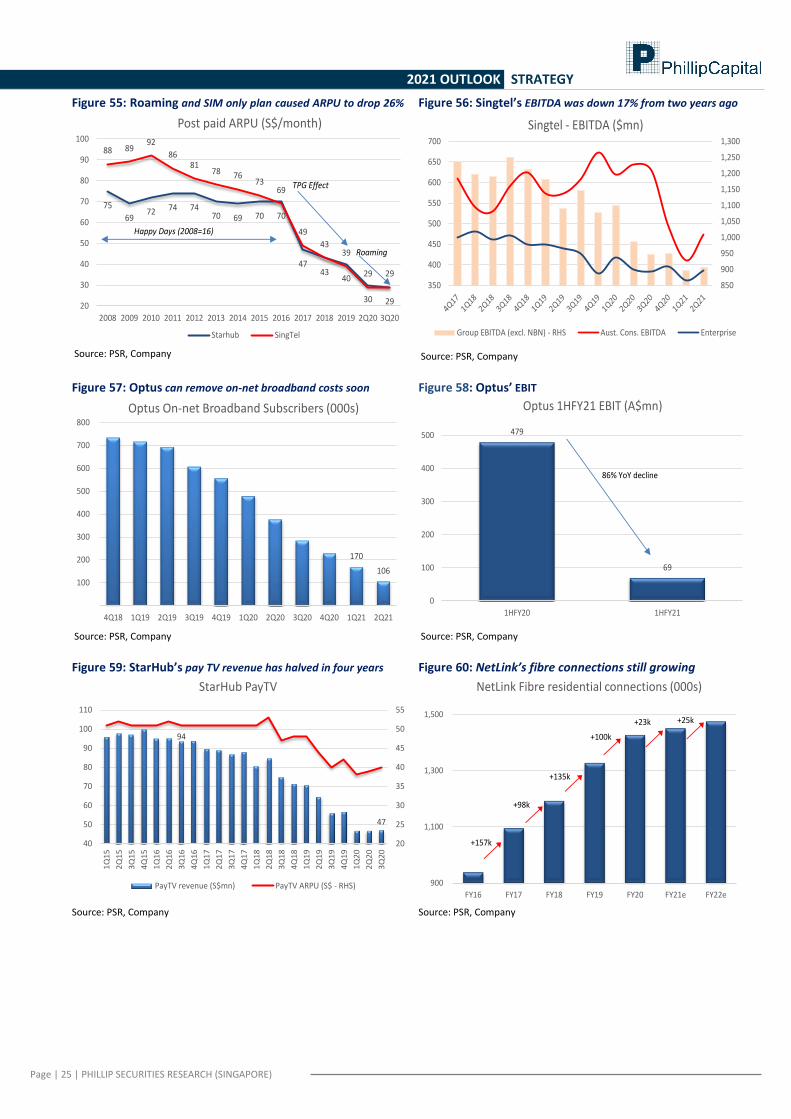
The year started with worries over mobile competition in Singapore and 5G licensing. Such concerns fell wayside with the arrival of COVID-19. The pandemic and resulting closure of international borders led to the loss of high-margin roaming revenue. Roaming is around 20% of mobile service revenue, with outbound traffic to ASEAN and China being the largest contributors. Slower phone sales also meant weak equipment revenue. These factors culminated in a 26% decline in postpaid ARPU to a record low (Figure 61). Prepaid revenue equally stumbled as the majority of customers were foreign workers; some had to leave the country due to the pandemic. Enterprise revenue also fell from execution delays with the lockdown and corporates’ delays in IT spending due to the weak economic environment. Pay-TV revenue for StarHub halved in the past four years due to price competition, piracy and over-the-top substitutes (e.g. Netflix) (Figure 65). Revenue started to stabilise after the end of aggressive price promotions and major renewal of 2-year contracts during StarHub’s 2019 switch from cable to fibre.
In Australia, Singtel faced earnings pressure as broadband customers that used Optus’ network (on-net) shifted to the government-owned NBN. This meant a loss in operating leverage and the burden of running a broadband network with dwindling customers that were transitioning to NBN (Figure 63). As a result of margin loss from on-net to NBN, Optus’ earnings were savaged. Its EBIT fell 86% in 1HFY21 (Figure 64).
Due to poor earnings and dividend cuts, Singtel’s stock collapsed 31.5%. StarHub’s declined by 7.7%. NetLink fared better with a modest gain of 2.1%. Singtel cut its 1HFY21 dividend by 25% to 5.1 cents. StarHub slashed its 1H20 dividend by 45% but guided that full-year dividends would be at least 5 cents.
Outlook
2021 should be a more stable year for telcos. Roaming revenue should mend with a gradual resumption of international travel. Benefits, however, would be partially erased by a loss of government grants. In Australia, a positive will be the removal of costs from Singtel/Optus’ existing broadband network. This can materialise as its number of on-net customers is shrinking fast. There is no incentive for telcos to rush their 5G rollout as major use cases remain elusive. 5G’s core value proposition is only its faster speed and lower latency. Connectivity is a commoditised service and prices may suffer when there is excess capacity created from 5G. Enterprises are expected to take the lead in 5G and telcos are dedicating much more resources to building up their IT and industry knowledge. With only two stand-alone 5G operators in Singapore, there is opportunity for a more conducive price environment if there is no irrationality from the oligopoly. We are neutral on the sector due to expected lacklustre earnings in 2021. That said, valuations are turning more attractive, especially with the support of dividends.
Recommendations
Singtel’s (NEUTRAL; TP S$2.44) earnings are unlikely to excite in FY21 due to its roaming and NBN pain points. Dividends could surprise on the upside from the disposal of towers by associate Telkomsel, which may lead to a special dividend.
StarHub’s (NEUTRAL; TP S$1.24) dividend yield is 4% at trough earnings. We expect FY21 earnings to stay weak, though valuations are turning attractive, especially with an undervalued and fast-growing cybersecurity business.
NetLink NBN Trust (NEUTRAL; TP S$1.03) is expected to a beacon of stability for the sector in 2021. There were temporary disruptions in installing net fibre connections during the circuit breaker but revenue is well supported by a stable base of 1.43mn residential connections.
Paul Chew (+65 6212 1851) Head of Research
Page | 25 | PHILLIP SECURITIES RESEARCH (SINGAPORE)
2021 OUTLOOK STRATEGY
Figure 55: Roaming and SIM only plan caused ARPU to drop 26%
Source: PSR, Company
Figure 56: Singtel’s EBITDA was down 17% from two years ago
Source: PSR, Company
Figure 57: Optus can remove on-net broadband costs soon
Source: PSR, Company
Figure 58: Optus’ EBIT
Source: PSR, Company
Figure 59: StarHub’s pay TV revenue has halved in four years
Source: PSR, Company
Figure 60: NetLink’s fibre connections still growing
Source: PSR, Company
75
6972 74 74
70 69 70 70
4743
40
30 29
88 8992
8681
78 7673
69
49
4339
29 29
20
30
40
50
60
70
80
90
100
2008 2009 2010 2011 2012 2013 2014 2015 2016 2017 2018 2019 2Q20 3Q20
Post paid ARPU (S$/month)
Starhub SingTel
Happy Days (2008=16)
TPG Effect
Roaming
850
900
950
1,000
1,050
1,100
1,150
1,200
1,250
1,300
350
400
450
500
550
600
650
700
Singtel - EBITDA ($mn)
Group EBITDA (excl. NBN) - RHS Aust. Cons. EBITDA Enterprise
170
106
100
200
300
400
500
600
700
800
4Q18 1Q19 2Q19 3Q19 4Q19 1Q20 2Q20 3Q20 4Q20 1Q21 2Q21
Optus On-net Broadband Subscribers (000s)
479
69
0
100
200
300
400
500
1HFY20 1HFY21
Optus 1HFY21 EBIT (A$mn)
86% YoY decline
94
47
20
25
30
35
40
45
50
55
40
50
60
70
80
90
100
110
1Q
15
2Q
15
3Q
15
4Q
15
1Q
16
2Q
16
3Q
16
4Q
16
1Q
17
2Q
17
3Q
17
4Q
17
1Q
18
2Q
18
3Q
18
4Q
18
1Q
19
2Q
19
3Q
19
4Q
19
1Q
20
2Q
20
3Q
20
StarHub PayTV
PayTV revenue (S$mn) PayTV ARPU (S$ - RHS) 900
1,100
1,300
1,500
FY16 FY17 FY18 FY19 FY20 FY21e FY22e
NetLink Fibre residential connections (000s)
+135k
+98k
+157k
+25k
+100k
+23k
Page | 26 | PHILLIP SECURITIES RESEARCH (SINGAPORE)
2021 OUTLOOK STRATEGY
Transportation – Land NEUTRAL
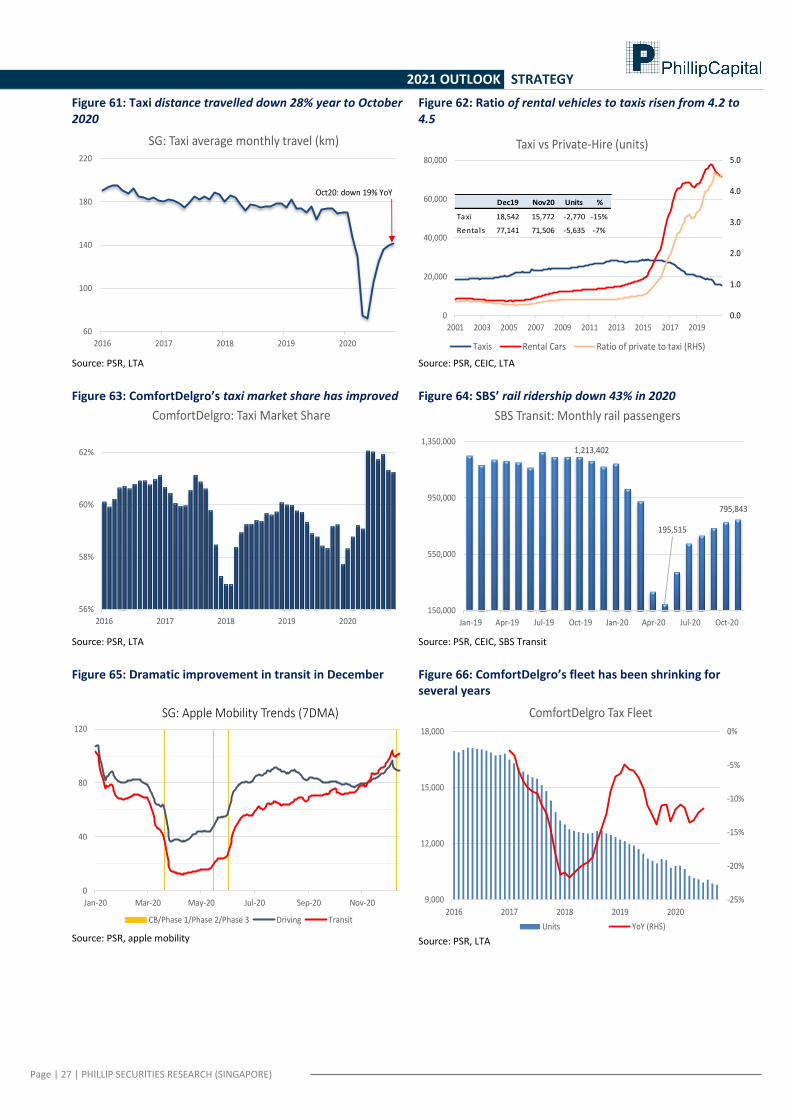
▪ Year to November 2020, SBS’ rail ridership was down 43%. In its worst month of April, ridership plunged 84% YoY. ▪ Average distance travelled by taxis still down 19% YoY but indications of a recovery in December.
▪ Taxi fleet was down 15% year to November 2020, worse than the 7% decline in private hire vehicles.
2020 Review Lockdown and restrictions of group activities meant less transport to offices, religious gatherings, weddings, meetings, conferences, etc. Border closure worsened traffic levels with a loss of tourist arrivals. Average taxi driving activity or distance declined by 28% in the year (Figure 67). Rail fared worse, with ridership for SBS Transit down 43% from January to November 2020 (Figure 70).
ComfortDelgro spent around S$120mn on rental rebates to its taxi drivers. The government chipped in another S$188mn in subsidies for both taxis and private hire drivers. Despite the multiple subsidies, the industry’s fleet of taxis was down 15% to 15.7k (Figure 68).
Outlook The bulk of the restrictions on group gatherings were only lifted from October, followed by Phase 3 on 28 December. We expect transportation to improve as bigger group activities return. The latest mobility data from Apple show a dramatic rise in transit or rail activity in December, back to pre-COVID levels (Figure 71). Even then, we are not expecting transport volumes to return completely as international borders are still shut and many are still working from home. Competition from private hire vehicles has intensified this year. The ratio of the private rental fleet to taxis has risen from 4.2 in early 2020 to 4.5. The taxi fleet has shrunken 15% compared to 7% for rented vehicles (Figure 68). Recommendation We have an ACCUMULATE rating for ComfortDelGro (TP: S$1.83). Its share price was down 29.8% in 2020. We believe the market has not priced in an expected rebound in ridership in 2021 and higher fuel prices, which will raise margins for its bus operations. Despite the year’s torrid conditions and rental rebates, Comfort generated S$383mn of operating cash flows in the first nine months of 2020.
Paul Chew (+65 6212 1851) Head of Research
Page | 27 | PHILLIP SECURITIES RESEARCH (SINGAPORE)
2021 OUTLOOK STRATEGY
Figure 61: Taxi distance travelled down 28% year to October 2020
Source: PSR, LTA
Figure 62: Ratio of rental vehicles to taxis risen from 4.2 to 4.5
Source: PSR, CEIC, LTA
Figure 63: ComfortDelgro’s taxi market share has improved
Source: PSR, LTA
Figure 64: SBS’ rail ridership down 43% in 2020
Source: PSR, CEIC, SBS Transit
Figure 65: Dramatic improvement in transit in December
Source: PSR, apple mobility
Figure 66: ComfortDelgro’s fleet has been shrinking for several years
Source: PSR, LTA
60
100
140
180
220
2016 2017 2018 2019 2020
SG: Taxi average monthly travel (km)
Oct20: down 19% YoY
0.0
1.0
2.0
3.0
4.0
5.0
0
20,000
40,000
60,000
80,000
2001 2003 2005 2007 2009 2011 2013 2015 2017 2019
Taxi vs Private-Hire (units)
Taxis Rental Cars Ratio of private to taxi (RHS)
Dec19 Nov20 Units %
Taxi 18,542 15,772 -2,770 -15%
Rentals 77,141 71,506 -5,635 -7%
56%
58%
60%
62%
2016 2017 2018 2019 2020
ComfortDelgro: Taxi Market Share
1,213,402
195,515
795,843
150,000
550,000
950,000
1,350,000
Jan-19 Apr-19 Jul-19 Oct-19 Jan-20 Apr-20 Jul-20 Oct-20
SBS Transit: Monthly rail passengers
0
40
80
120
Jan-20 Mar-20 May-20 Jul-20 Sep-20 Nov-20
SG: Apple Mobility Trends (7DMA)
CB/Phase 1/Phase 2/Phase 3 Driving Transit
-25%
-20%
-15%
-10%
-5%
0%
9,000
12,000
15,000
18,000
2016 2017 2018 2019 2020
ComfortDelgro Tax Fleet
Units YoY (RHS)
Page | 28 | PHILLIP SECURITIES RESEARCH (SINGAPORE)
2021 OUTLOOK STRATEGY
Transportation – Aviation NEUTRAL
▪ Year of disaster for aviation with the virtual disappearance of passenger traffic. ▪ Cargo fared better as consumption shifted to goods and e-commerce. ▪ According to IATA, a full recovery in air traffic can be expected only in 2024. Some recovery in 2022. 2020 Review It was a 100-year pandemic that swept the commercial airline industry into historical losses. Based on IATA forecasts, airlines will loss US$118.5bn in 2020. Losses will reduce to US$38.7bn in 2021. A full recovery to 2019 pre-pandemic air travel is only expected in 2024. When 9/11 struck, it took 22 months for US passenger travel to recover (Figure 75). Visitor arrivals to Singapore average a measly 12,524 per month in November against pre-COVID levels of 1.5mn per month a year ago (Figure 73). Passengers carried by SIA are 40x lower than pre-COVID levels (Figure 74). Share prices reflect the haemorrhaging losses, with SIA shedding 32.8%, followed by SIA Engineering’s -30.1% and SATS’ -29.8%. Outlook We are not optimistic that air travel will recover in any meaningful way in 2021. Our borders remain shut to minimise imported cases. Our view is to avoid this sector due to the large uncertainty. However, positive news flow can admittedly drive momentum in share prices. SIA raised S$8.8bn in its recent rights issue of ordinary shares (S$5.3bn) and mandatory convertible bonds (S$3.5bn) in June 2020. Around S$1bn was used to refund tickets and S$2bn to repay a loan to DBS. With our estimated burn rate of S$900mn a month, S$5bn has likely been used. SIA is looking to raise more cash through debt and the leaseback of its aircraft. Even if we exit pandemic woes, the airline industry has not consolidated and competition remains rampant. What’s worse is airlines are even more leveraged than before COVID 19. Recommendation We are NEUTRAL on SATS (TP: S$4.40). Its recovery has been slow. SATS benefitted from a huge S$152mn government relief in 1HFY21, equivalent to its FY20e PATMI of S$168mn. Any recovery in air travel will only be replaced by a reduction in government grants, in our estimation. The company has cut costs aggressively to cope with this crisis. Headcount is down 24%, with staff costs declining S$167mn or 36% in 1HFY21. We do not expect the handling of vaccines to meaningfully impact earnings.
Paul Chew (+65 6212 1851) Head of Research
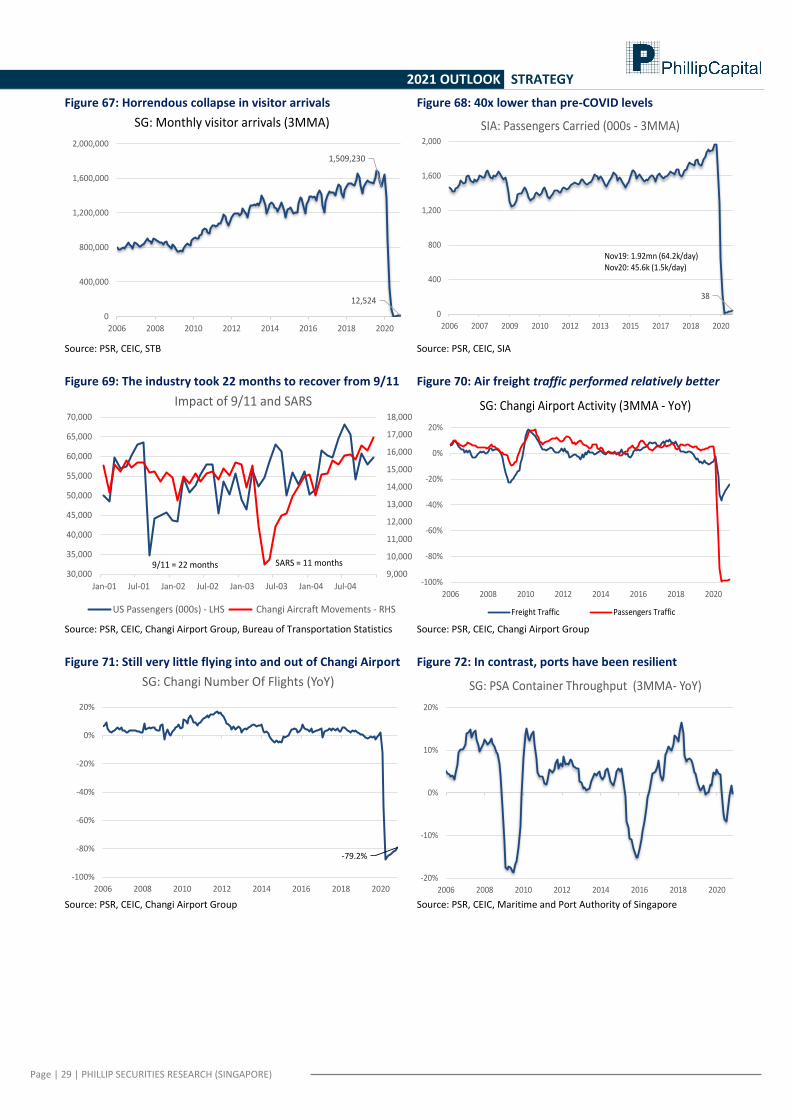
Page | 29 | PHILLIP SECURITIES RESEARCH (SINGAPORE)
2021 OUTLOOK STRATEGY
Figure 67: Horrendous collapse in visitor arrivals
Source: PSR, CEIC, STB
Figure 68: 40x lower than pre-COVID levels
Source: PSR, CEIC, SIA
Figure 69: The industry took 22 months to recover from 9/11
Source: PSR, CEIC, Changi Airport Group, Bureau of Transportation Statistics
Figure 70: Air freight traffic performed relatively better
Source: PSR, CEIC, Changi Airport Group
Figure 71: Still very little flying into and out of Changi Airport
Source: PSR, CEIC, Changi Airport Group
Figure 72: In contrast, ports have been resilient
Source: PSR, CEIC, Maritime and Port Authority of Singapore
1,509,230
12,524
0
400,000
800,000
1,200,000
1,600,000
2,000,000
2006 2008 2010 2012 2014 2016 2018 2020
SG: Monthly visitor arrivals (3MMA)
38
0
400
800
1,200
1,600
2,000
2006 2007 2009 2010 2012 2013 2015 2017 2018 2020
SIA: Passengers Carried (000s - 3MMA)
Nov19: 1.92mn (64.2k/day)Nov20: 45.6k (1.5k/day)
9,000
10,000
11,000
12,000
13,000
14,000
15,000
16,000
17,000
18,000
30,000
35,000
40,000
45,000
50,000
55,000
60,000
65,000
70,000
Jan-01 Jul-01 Jan-02 Jul-02 Jan-03 Jul-03 Jan-04 Jul-04
Impact of 9/11 and SARS
US Passengers (000s) - LHS Changi Aircraft Movements - RHS
SARS = 11 months9/11 = 22 months
-100%
-80%
-60%
-40%
-20%
0%
20%
2006 2008 2010 2012 2014 2016 2018 2020
Freight Traffic Passengers Traffic
SG: Changi Airport Activity (3MMA - YoY)
-79.2%
-100%
-80%
-60%
-40%
-20%
0%
20%
2006 2008 2010 2012 2014 2016 2018 2020
SG: Changi Number Of Flights (YoY)
-20%
-10%
0%
10%
20%
2006 2008 2010 2012 2014 2016 2018 2020
SG: PSA Container Throughput (3MMA- YoY)
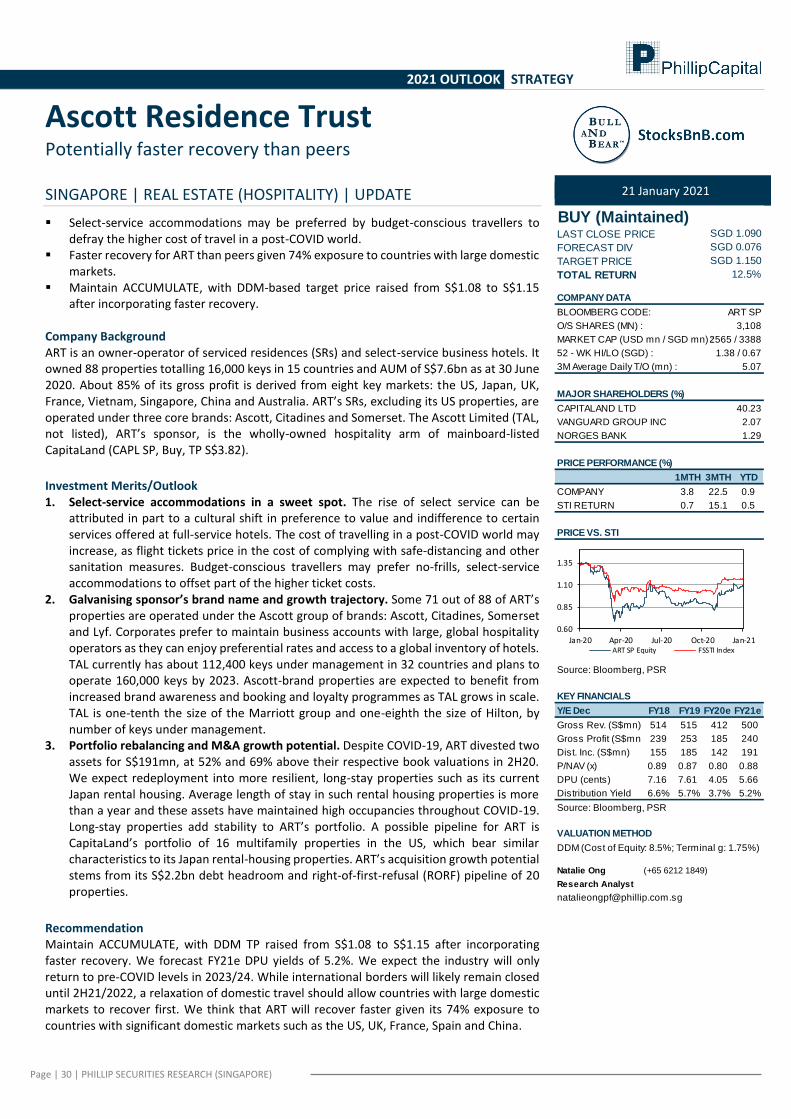
Page | 30 | PHILLIP SECURITIES RESEARCH (SINGAPORE)
2021 OUTLOOK STRATEGY
Ascott Residence Trust Potentially faster recovery than peers
SINGAPORE | REAL ESTATE (HOSPITALITY) | UPDATE
▪ Select-service accommodations may be preferred by budget-conscious travellers to defray the higher cost of travel in a post-COVID world.
▪ Faster recovery for ART than peers given 74% exposure to countries with large domestic markets.
▪ Maintain ACCUMULATE, with DDM-based target price raised from S$1.08 to S$1.15 after incorporating faster recovery.
Company Background ART is an owner-operator of serviced residences (SRs) and select-service business hotels. It owned 88 properties totalling 16,000 keys in 15 countries and AUM of S$7.6bn as at 30 June 2020. About 85% of its gross profit is derived from eight key markets: the US, Japan, UK, France, Vietnam, Singapore, China and Australia. ART’s SRs, excluding its US properties, are operated under three core brands: Ascott, Citadines and Somerset. The Ascott Limited (TAL, not listed), ART’s sponsor, is the wholly-owned hospitality arm of mainboard-listed CapitaLand (CAPL SP, Buy, TP S$3.82).
Investment Merits/Outlook 1. Select-service accommodations in a sweet spot. The rise of select service can be
attributed in part to a cultural shift in preference to value and indifference to certain services offered at full-service hotels. The cost of travelling in a post-COVID world may increase, as flight tickets price in the cost of complying with safe-distancing and other sanitation measures. Budget-conscious travellers may prefer no-frills, select-service accommodations to offset part of the higher ticket costs.
2. Galvanising sponsor’s brand name and growth trajectory. Some 71 out of 88 of ART’s properties are operated under the Ascott group of brands: Ascott, Citadines, Somerset and Lyf. Corporates prefer to maintain business accounts with large, global hospitality operators as they can enjoy preferential rates and access to a global inventory of hotels. TAL currently has about 112,400 keys under management in 32 countries and plans to operate 160,000 keys by 2023. Ascott-brand properties are expected to benefit from increased brand awareness and booking and loyalty programmes as TAL grows in scale. TAL is one-tenth the size of the Marriott group and one-eighth the size of Hilton, by number of keys under management.
3. Portfolio rebalancing and M&A growth potential. Despite COVID-19, ART divested two assets for S$191mn, at 52% and 69% above their respective book valuations in 2H20. We expect redeployment into more resilient, long-stay properties such as its current Japan rental housing. Average length of stay in such rental housing properties is more than a year and these assets have maintained high occupancies throughout COVID-19. Long-stay properties add stability to ART’s portfolio. A possible pipeline for ART is CapitaLand’s portfolio of 16 multifamily properties in the US, which bear similar characteristics to its Japan rental-housing properties. ART’s acquisition growth potential stems from its S$2.2bn debt headroom and right-of-first-refusal (RORF) pipeline of 20 properties.
Recommendation Maintain ACCUMULATE, with DDM TP raised from S$1.08 to S$1.15 after incorporating faster recovery. We forecast FY21e DPU yields of 5.2%. We expect the industry will only return to pre-COVID levels in 2023/24. While international borders will likely remain closed until 2H21/2022, a relaxation of domestic travel should allow countries with large domestic markets to recover first. We think that ART will recover faster given its 74% exposure to countries with significant domestic markets such as the US, UK, France, Spain and China.
21 January 2021
BUY (Maintained)LAST CLOSE PRICE
FORECAST DIV
TARGET PRICE
TOTAL RETURN
COMPANY DATA
BLOOMBERG CODE: ART SP
O/S SHARES (MN) : 3,108
MARKET CAP (USD mn / SGD mn) :2565 / 3388
52 - WK HI/LO (SGD) : 1.38 / 0.67
3M Average Daily T/O (mn) : 5.07
MAJOR SHAREHOLDERS (%)
40.23
VANGUARD GROUP INC 2.07
NORGES BANK 1.29
PRICE PERFORMANCE (%)
1MTH 3MTH YTD
COMPANY 3.8 22.5 0.9
STI RETURN 0.7 15.1 0.5
PRICE VS. STI
Source: Bloomberg, PSR
KEY FINANCIALS
Y/E Dec FY18 FY19 FY20e FY21e
Gross Rev. (S$mn) 514 515 412 500
Gross Profit (S$mn) 239 253 185 240
Dist. Inc. (S$mn) 155 185 142 191
P/NAV (x) 0.89 0.87 0.80 0.88
DPU (cents) 7.16 7.61 4.05 5.66
Distribution Yield 6.6% 5.7% 3.7% 5.2%
Source: Bloomberg, PSR
VALUATION METHOD
DDM (Cost of Equity: 8.5%; Terminal g: 1.75%)
Natalie Ong (+65 6212 1849)
Research Analyst
12.5%
CAPITALAND LTD
SGD 1.090
SGD 0.076
SGD 1.150
0.60
0.85
1.10
1.35
Jan-20 Apr-20 Jul-20 Oct-20 Jan-21ART SP Equity FSSTI Index
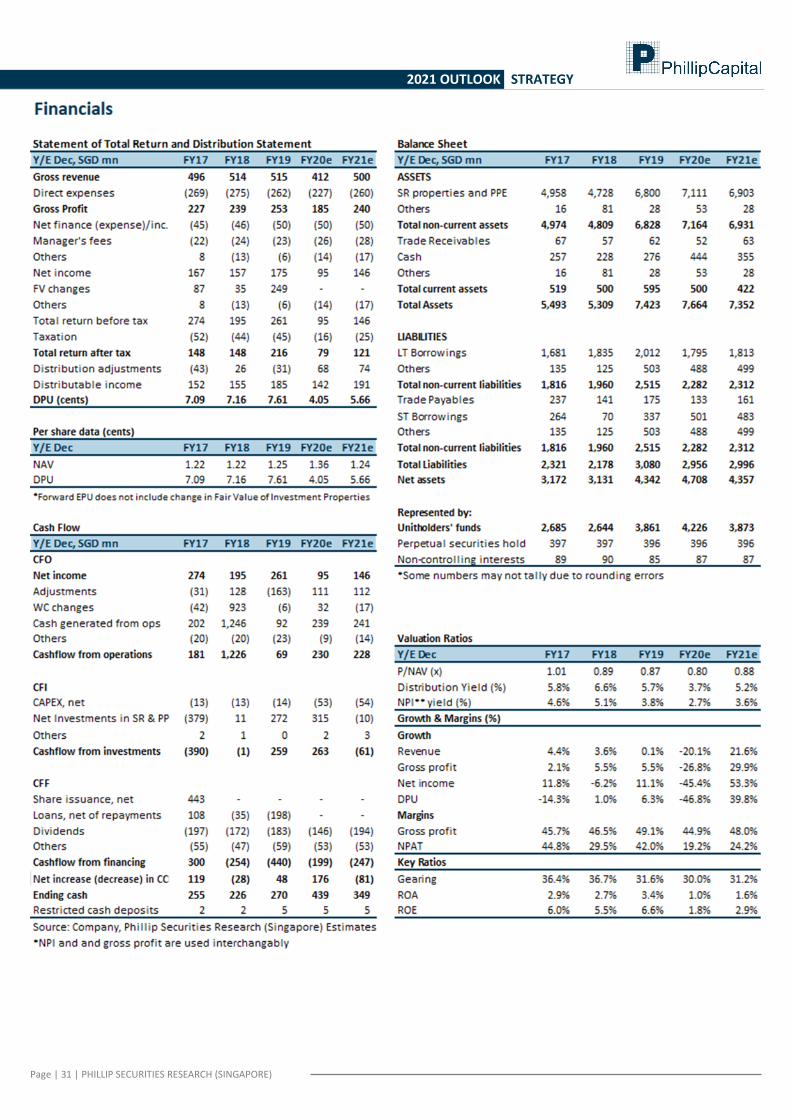
Page | 31 | PHILLIP SECURITIES RESEARCH (SINGAPORE)
2021 OUTLOOK STRATEGY
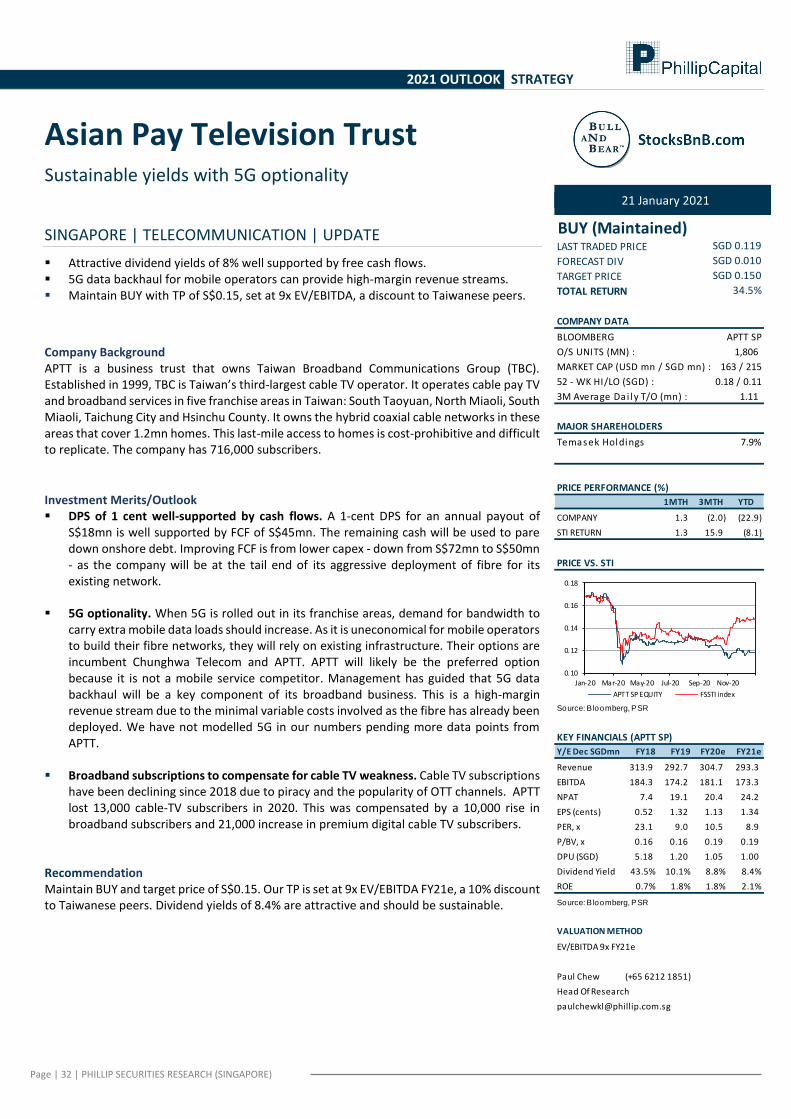
Page | 32 | PHILLIP SECURITIES RESEARCH (SINGAPORE)
2021 OUTLOOK STRATEGY
Asian Pay Television Trust Sustainable yields with 5G optionality
SINGAPORE | TELECOMMUNICATION | UPDATE
▪ Attractive dividend yields of 8% well supported by free cash flows. ▪ 5G data backhaul for mobile operators can provide high-margin revenue streams. ▪ Maintain BUY with TP of S$0.15, set at 9x EV/EBITDA, a discount to Taiwanese peers.
Company Background APTT is a business trust that owns Taiwan Broadband Communications Group (TBC). Established in 1999, TBC is Taiwan’s third-largest cable TV operator. It operates cable pay TV and broadband services in five franchise areas in Taiwan: South Taoyuan, North Miaoli, South Miaoli, Taichung City and Hsinchu County. It owns the hybrid coaxial cable networks in these areas that cover 1.2mn homes. This last-mile access to homes is cost-prohibitive and difficult to replicate. The company has 716,000 subscribers.
Investment Merits/Outlook ▪ DPS of 1 cent well-supported by cash flows. A 1-cent DPS for an annual payout of
S$18mn is well supported by FCF of S$45mn. The remaining cash will be used to pare down onshore debt. Improving FCF is from lower capex - down from S$72mn to S$50mn - as the company will be at the tail end of its aggressive deployment of fibre for its existing network.
▪ 5G optionality. When 5G is rolled out in its franchise areas, demand for bandwidth to carry extra mobile data loads should increase. As it is uneconomical for mobile operators to build their fibre networks, they will rely on existing infrastructure. Their options are incumbent Chunghwa Telecom and APTT. APTT will likely be the preferred option because it is not a mobile service competitor. Management has guided that 5G data backhaul will be a key component of its broadband business. This is a high-margin revenue stream due to the minimal variable costs involved as the fibre has already been deployed. We have not modelled 5G in our numbers pending more data points from APTT.
▪ Broadband subscriptions to compensate for cable TV weakness. Cable TV subscriptions have been declining since 2018 due to piracy and the popularity of OTT channels. APTT lost 13,000 cable-TV subscribers in 2020. This was compensated by a 10,000 rise in broadband subscribers and 21,000 increase in premium digital cable TV subscribers.
Recommendation Maintain BUY and target price of S$0.15. Our TP is set at 9x EV/EBITDA FY21e, a 10% discount to Taiwanese peers. Dividend yields of 8.4% are attractive and should be sustainable.
21 January 2021
BUY (Maintained)LAST TRADED PRICE
FORECAST DIV
TARGET PRICE
TOTAL RETURN
COMPANY DATA
BLOOMBERG APTT SP
O/S UNITS (MN) : 1,806
MARKET CAP (USD mn / SGD mn) : 163 / 215
52 - WK HI/LO (SGD) : 0.18 / 0.11
3M Average Dai ly T/O (mn) : 1.11
MAJOR SHAREHOLDERS
7.9%
PRICE PERFORMANCE (%)
1MTH 3MTH YTD
COMPANY 1.3 (2.0) (22.9)
STI RETURN 1.3 15.9 (8.1)
PRICE VS. STI
Source: B loomberg, PSR
KEY FINANCIALS (APTT SP)
Y/E Dec SGDmn FY18 FY19 FY20e FY21e
Revenue 313.9 292.7 304.7 293.3
EBITDA 184.3 174.2 181.1 173.3
NPAT 7.4 19.1 20.4 24.2
EPS (cents) 0.52 1.32 1.13 1.34
PER, x 23.1 9.0 10.5 8.9
P/BV, x 0.16 0.16 0.19 0.19
DPU (SGD) 5.18 1.20 1.05 1.00
Dividend Yield 43.5% 10.1% 8.8% 8.4%
ROE 0.7% 1.8% 1.8% 2.1%
Source: B loomberg, PSR
VALUATION METHOD
EV/EBITDA 9x FY21e
Paul Chew (+65 6212 1851)
Head Of Research
Temasek Holdings
34.5%
SGD 0.119
SGD 0.010
SGD 0.150
0.10
0.12
0.14
0.16
0.18
Jan-20 Mar-20 May-20 Jul-20 Sep-20 Nov-20
APTT SP EQUITY FSSTI index
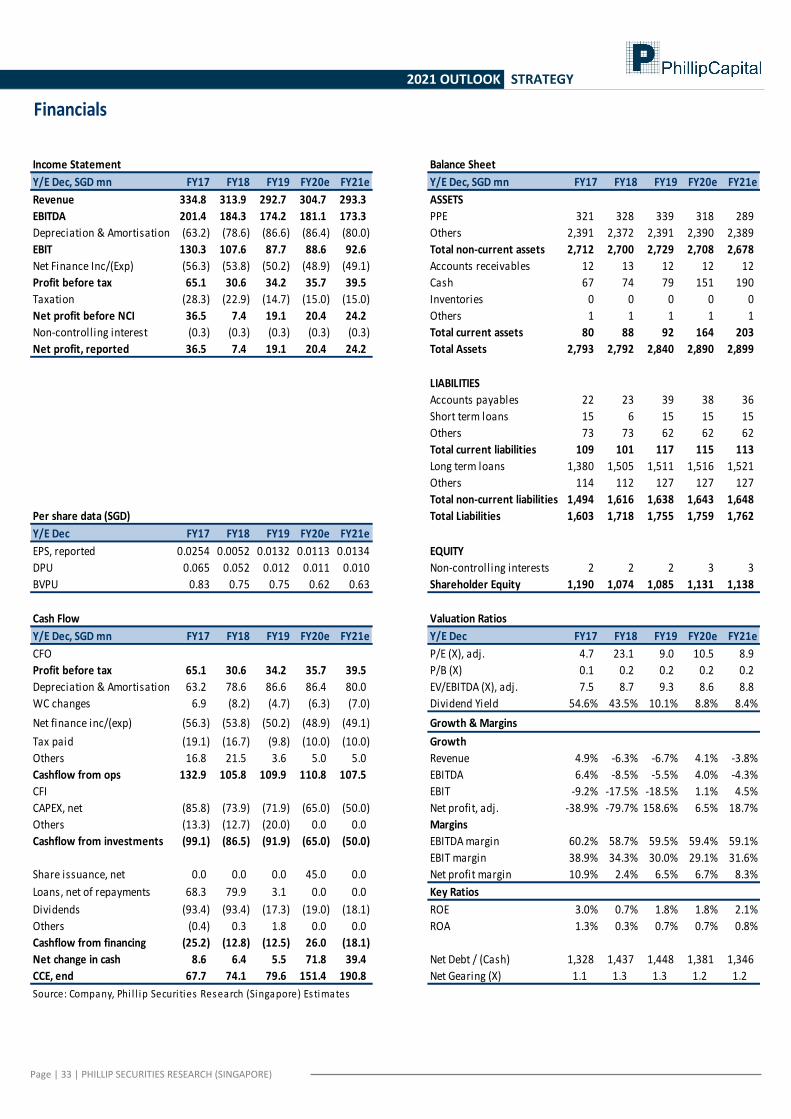
Page | 33 | PHILLIP SECURITIES RESEARCH (SINGAPORE)
2021 OUTLOOK STRATEGY
Financials
Income Statement Balance Sheet
Y/E Dec, SGD mn FY17 FY18 FY19 FY20e FY21e Y/E Dec, SGD mn FY17 FY18 FY19 FY20e FY21e
Revenue 334.8 313.9 292.7 304.7 293.3 ASSETS
EBITDA 201.4 184.3 174.2 181.1 173.3 PPE 321 328 339 318 289
Depreciation & Amortisation (63.2) (78.6) (86.6) (86.4) (80.0) Others 2,391 2,372 2,391 2,390 2,389
EBIT 130.3 107.6 87.7 88.6 92.6 Total non-current assets 2,712 2,700 2,729 2,708 2,678
Net Finance Inc/(Exp) (56.3) (53.8) (50.2) (48.9) (49.1) Accounts receivables 12 13 12 12 12
Profit before tax 65.1 30.6 34.2 35.7 39.5 Cash 67 74 79 151 190
Taxation (28.3) (22.9) (14.7) (15.0) (15.0) Inventories 0 0 0 0 0
Net profit before NCI 36.5 7.4 19.1 20.4 24.2 Others 1 1 1 1 1
Non-controlling interest (0.3) (0.3) (0.3) (0.3) (0.3) Total current assets 80 88 92 164 203
Net profit, reported 36.5 7.4 19.1 20.4 24.2 Total Assets 2,793 2,792 2,840 2,890 2,899
LIABILITIES
Accounts payables 22 23 39 38 36
Short term loans 15 6 15 15 15
Others 73 73 62 62 62
Total current liabilities 109 101 117 115 113
Long term loans 1,380 1,505 1,511 1,516 1,521
Others 114 112 127 127 127
Total non-current liabilities 1,494 1,616 1,638 1,643 1,648
Per share data (SGD) Total Liabilities 1,603 1,718 1,755 1,759 1,762
Y/E Dec FY17 FY18 FY19 FY20e FY21e
EPS, reported 0.0254 0.0052 0.0132 0.0113 0.0134 EQUITY
DPU 0.065 0.052 0.012 0.011 0.010 Non-controlling interests 2 2 2 3 3
BVPU 0.83 0.75 0.75 0.62 0.63 Shareholder Equity 1,190 1,074 1,085 1,131 1,138
Cash Flow Valuation Ratios
Y/E Dec, SGD mn FY17 FY18 FY19 FY20e FY21e Y/E Dec FY17 FY18 FY19 FY20e FY21e
CFO P/E (X), adj. 4.7 23.1 9.0 10.5 8.9
Profit before tax 65.1 30.6 34.2 35.7 39.5 P/B (X) 0.1 0.2 0.2 0.2 0.2
Depreciation & Amortisation 63.2 78.6 86.6 86.4 80.0 EV/EBITDA (X), adj. 7.5 8.7 9.3 8.6 8.8
WC changes 6.9 (8.2) (4.7) (6.3) (7.0) Dividend Yield 54.6% 43.5% 10.1% 8.8% 8.4%
Net finance inc/(exp) (56.3) (53.8) (50.2) (48.9) (49.1) Growth & Margins
Tax paid (19.1) (16.7) (9.8) (10.0) (10.0) Growth
Others 16.8 21.5 3.6 5.0 5.0 Revenue 4.9% -6.3% -6.7% 4.1% -3.8%
Cashflow from ops 132.9 105.8 109.9 110.8 107.5 EBITDA 6.4% -8.5% -5.5% 4.0% -4.3%
CFI EBIT -9.2% -17.5% -18.5% 1.1% 4.5%
CAPEX, net (85.8) (73.9) (71.9) (65.0) (50.0) Net profit, adj. -38.9% -79.7% 158.6% 6.5% 18.7%
Others (13.3) (12.7) (20.0) 0.0 0.0 Margins
Cashflow from investments (99.1) (86.5) (91.9) (65.0) (50.0) EBITDA margin 60.2% 58.7% 59.5% 59.4% 59.1%
EBIT margin 38.9% 34.3% 30.0% 29.1% 31.6%
Share issuance, net 0.0 0.0 0.0 45.0 0.0 Net profit margin 10.9% 2.4% 6.5% 6.7% 8.3%
Loans, net of repayments 68.3 79.9 3.1 0.0 0.0 Key Ratios
Dividends (93.4) (93.4) (17.3) (19.0) (18.1) ROE 3.0% 0.7% 1.8% 1.8% 2.1%
Others (0.4) 0.3 1.8 0.0 0.0 ROA 1.3% 0.3% 0.7% 0.7% 0.8%
Cashflow from financing (25.2) (12.8) (12.5) 26.0 (18.1)
Net change in cash 8.6 6.4 5.5 71.8 39.4 Net Debt / (Cash) 1,328 1,437 1,448 1,381 1,346
CCE, end 67.7 74.1 79.6 151.4 190.8 Net Gearing (X) 1.1 1.3 1.3 1.2 1.2
Source: Company, Phi l l ip Securi ties Research (Singapore) Estimates
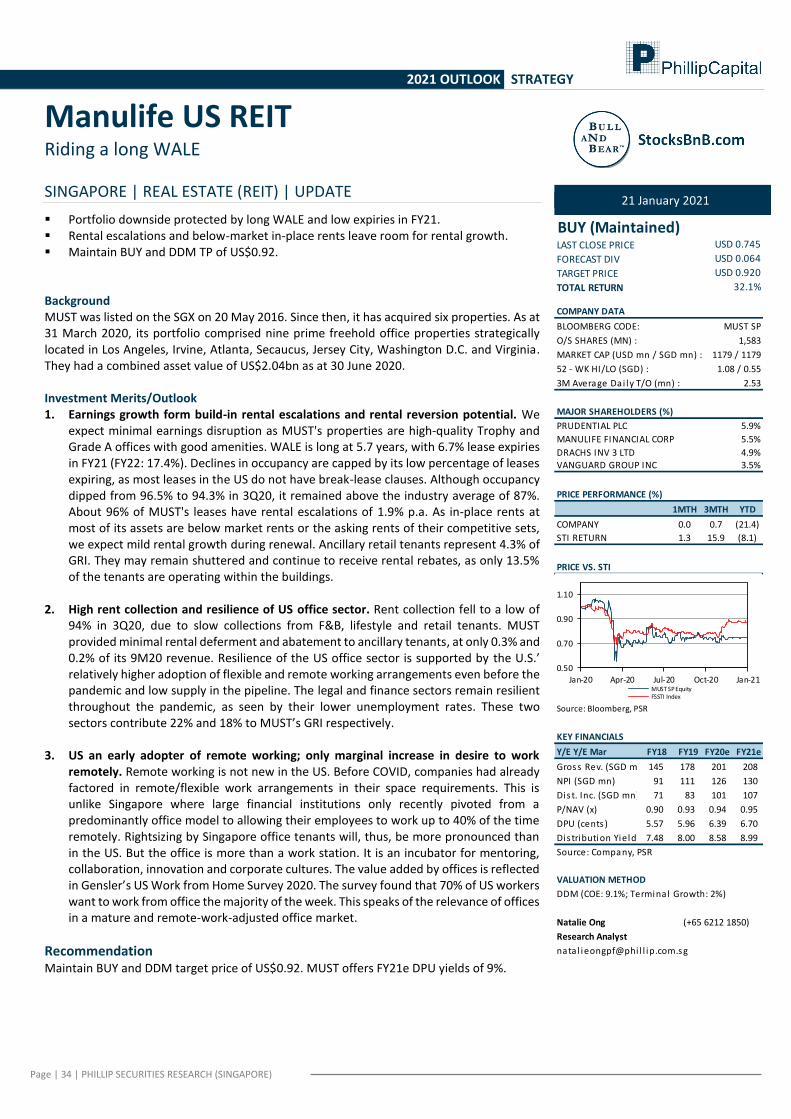
Page | 34 | PHILLIP SECURITIES RESEARCH (SINGAPORE)
2021 OUTLOOK STRATEGY
Manulife US REIT Riding a long WALE
SINGAPORE | REAL ESTATE (REIT) | UPDATE
▪ Portfolio downside protected by long WALE and low expiries in FY21. ▪ Rental escalations and below-market in-place rents leave room for rental growth. ▪ Maintain BUY and DDM TP of US$0.92. Background MUST was listed on the SGX on 20 May 2016. Since then, it has acquired six properties. As at 31 March 2020, its portfolio comprised nine prime freehold office properties strategically located in Los Angeles, Irvine, Atlanta, Secaucus, Jersey City, Washington D.C. and Virginia. They had a combined asset value of US$2.04bn as at 30 June 2020. Investment Merits/Outlook 1. Earnings growth form build-in rental escalations and rental reversion potential. We
expect minimal earnings disruption as MUST's properties are high-quality Trophy and Grade A offices with good amenities. WALE is long at 5.7 years, with 6.7% lease expiries in FY21 (FY22: 17.4%). Declines in occupancy are capped by its low percentage of leases expiring, as most leases in the US do not have break-lease clauses. Although occupancy dipped from 96.5% to 94.3% in 3Q20, it remained above the industry average of 87%. About 96% of MUST's leases have rental escalations of 1.9% p.a. As in-place rents at most of its assets are below market rents or the asking rents of their competitive sets, we expect mild rental growth during renewal. Ancillary retail tenants represent 4.3% of GRI. They may remain shuttered and continue to receive rental rebates, as only 13.5% of the tenants are operating within the buildings.
2. High rent collection and resilience of US office sector. Rent collection fell to a low of
94% in 3Q20, due to slow collections from F&B, lifestyle and retail tenants. MUST provided minimal rental deferment and abatement to ancillary tenants, at only 0.3% and 0.2% of its 9M20 revenue. Resilience of the US office sector is supported by the U.S.’ relatively higher adoption of flexible and remote working arrangements even before the pandemic and low supply in the pipeline. The legal and finance sectors remain resilient throughout the pandemic, as seen by their lower unemployment rates. These two sectors contribute 22% and 18% to MUST’s GRI respectively.
3. US an early adopter of remote working; only marginal increase in desire to work
remotely. Remote working is not new in the US. Before COVID, companies had already factored in remote/flexible work arrangements in their space requirements. This is unlike Singapore where large financial institutions only recently pivoted from a predominantly office model to allowing their employees to work up to 40% of the time remotely. Rightsizing by Singapore office tenants will, thus, be more pronounced than in the US. But the office is more than a work station. It is an incubator for mentoring, collaboration, innovation and corporate cultures. The value added by offices is reflected in Gensler’s US Work from Home Survey 2020. The survey found that 70% of US workers want to work from office the majority of the week. This speaks of the relevance of offices in a mature and remote-work-adjusted office market.
Recommendation Maintain BUY and DDM target price of US$0.92. MUST offers FY21e DPU yields of 9%.
21 January 2021
BUY (Maintained)LAST CLOSE PRICE
FORECAST DIV
TARGET PRICE
TOTAL RETURN
COMPANY DATA
BLOOMBERG CODE: MUST SP
O/S SHARES (MN) : 1,583
MARKET CAP (USD mn / SGD mn) : 1179 / 1179
52 - WK HI/LO (SGD) : 1.08 / 0.55
3M Average Dai ly T/O (mn) : 2.53
MAJOR SHAREHOLDERS (%)
PRUDENTIAL PLC 5.9%
MANULIFE FINANCIAL CORP 5.5%
DRACHS INV 3 LTD 4.9%
VANGUARD GROUP INC 3.5%
PRICE PERFORMANCE (%)
1MTH 3MTH YTD
COMPANY 0.0 0.7 (21.4)
STI RETURN 1.3 15.9 (8.1)
PRICE VS. STI
Source: Bloomberg, PSR
KEY FINANCIALS
Y/E Y/E Mar FY18 FY19 FY20e FY21e
Gross Rev. (SGD mn) 145 178 201 208
NPI (SGD mn) 91 111 126 130
Dis t. Inc. (SGD mn) 71 83 101 107
P/NAV (x) 0.90 0.93 0.94 0.95
DPU (cents ) 5.57 5.96 6.39 6.70
Dis tribution Yield (%)7.48 8.00 8.58 8.99
Source: Company, PSR
VALUATION METHOD
DDM (COE: 9.1%; Termina l Growth: 2%)
Natalie Ong (+65 6212 1850)
Research Analyst
nata l ieongpf@phi l l ip.com.sg
32.1%
USD 0.745
USD 0.064
USD 0.920
0.50
0.70
0.90
1.10
Jan-20 Apr-20 Jul-20 Oct-20 Jan-21MUST SP EquityFSSTI Index
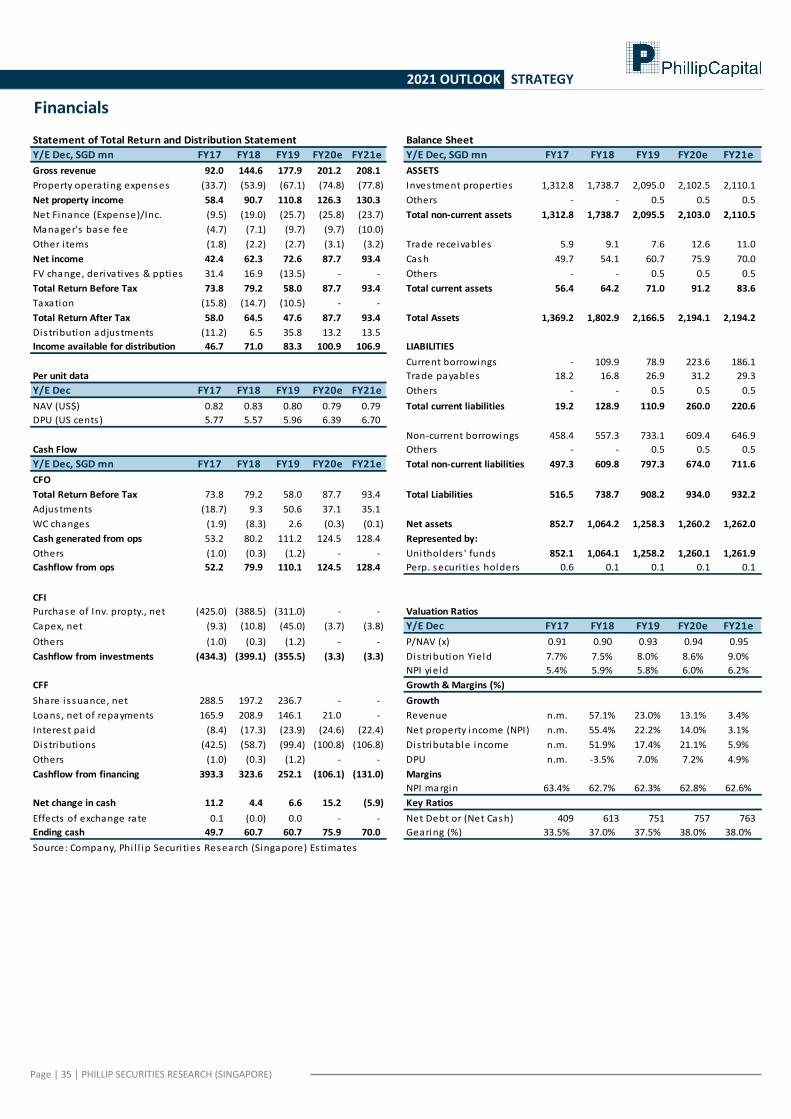
Page | 35 | PHILLIP SECURITIES RESEARCH (SINGAPORE)
2021 OUTLOOK STRATEGY
Financials
Statement of Total Return and Distribution Statement Balance Sheet
Y/E Dec, SGD mn FY17 FY18 FY19 FY20e FY21e Y/E Dec, SGD mn FY17 FY18 FY19 FY20e FY21e
Gross revenue 92.0 144.6 177.9 201.2 208.1 ASSETS
Property operating expenses (33.7) (53.9) (67.1) (74.8) (77.8) Investment properties 1,312.8 1,738.7 2,095.0 2,102.5 2,110.1
Net property income 58.4 90.7 110.8 126.3 130.3 Others - - 0.5 0.5 0.5
Net Finance (Expense)/Inc. (9.5) (19.0) (25.7) (25.8) (23.7) Total non-current assets 1,312.8 1,738.7 2,095.5 2,103.0 2,110.5
Manager's base fee (4.7) (7.1) (9.7) (9.7) (10.0)
Other i tems (1.8) (2.2) (2.7) (3.1) (3.2) Trade receivables 5.9 9.1 7.6 12.6 11.0
Net income 42.4 62.3 72.6 87.7 93.4 Cash 49.7 54.1 60.7 75.9 70.0
FV change, derivatives & ppties 31.4 16.9 (13.5) - - Others - - 0.5 0.5 0.5
Total Return Before Tax 73.8 79.2 58.0 87.7 93.4 Total current assets 56.4 64.2 71.0 91.2 83.6
Taxation (15.8) (14.7) (10.5) - -
Total Return After Tax 58.0 64.5 47.6 87.7 93.4 Total Assets 1,369.2 1,802.9 2,166.5 2,194.1 2,194.2
Distribution adjustments (11.2) 6.5 35.8 13.2 13.5
Income available for distribution 46.7 71.0 83.3 100.9 106.9 LIABILITIES
Current borrowings - 109.9 78.9 223.6 186.1
Per unit data Trade payables 18.2 16.8 26.9 31.2 29.3
Y/E Dec FY17 FY18 FY19 FY20e FY21e Others - - 0.5 0.5 0.5
NAV (US$) 0.82 0.83 0.80 0.79 0.79 Total current liabilities 19.2 128.9 110.9 260.0 220.6
DPU (US cents ) 5.77 5.57 5.96 6.39 6.70
Non-current borrowings 458.4 557.3 733.1 609.4 646.9
Cash Flow Others - - 0.5 0.5 0.5
Y/E Dec, SGD mn FY17 FY18 FY19 FY20e FY21e Total non-current liabilities 497.3 609.8 797.3 674.0 711.6
CFO
Total Return Before Tax 73.8 79.2 58.0 87.7 93.4 Total Liabilities 516.5 738.7 908.2 934.0 932.2
Adjustments (18.7) 9.3 50.6 37.1 35.1
WC changes (1.9) (8.3) 2.6 (0.3) (0.1) Net assets 852.7 1,064.2 1,258.3 1,260.2 1,262.0
Cash generated from ops 53.2 80.2 111.2 124.5 128.4 Represented by:
Others (1.0) (0.3) (1.2) - - Unitholders ' funds 852.1 1,064.1 1,258.2 1,260.1 1,261.9
Cashflow from ops 52.2 79.9 110.1 124.5 128.4 Perp. securi ties holders 0.6 0.1 0.1 0.1 0.1
CFI
Purchase of Inv. propty., net (425.0) (388.5) (311.0) - - Valuation Ratios
Capex, net (9.3) (10.8) (45.0) (3.7) (3.8) Y/E Dec FY17 FY18 FY19 FY20e FY21e
Others (1.0) (0.3) (1.2) - - P/NAV (x) 0.91 0.90 0.93 0.94 0.95
Cashflow from investments (434.3) (399.1) (355.5) (3.3) (3.3) Distribution Yield 7.7% 7.5% 8.0% 8.6% 9.0%
NPI yield 5.4% 5.9% 5.8% 6.0% 6.2%
CFF Growth & Margins (%)
Share i ssuance, net 288.5 197.2 236.7 - - Growth
Loans , net of repayments 165.9 208.9 146.1 21.0 - Revenue n.m. 57.1% 23.0% 13.1% 3.4%
Interest pa id (8.4) (17.3) (23.9) (24.6) (22.4) Net property income (NPI) n.m. 55.4% 22.2% 14.0% 3.1%
Distributions (42.5) (58.7) (99.4) (100.8) (106.8) Dis tributable income n.m. 51.9% 17.4% 21.1% 5.9%
Others (1.0) (0.3) (1.2) - - DPU n.m. -3.5% 7.0% 7.2% 4.9%
Cashflow from financing 393.3 323.6 252.1 (106.1) (131.0) Margins
NPI margin 63.4% 62.7% 62.3% 62.8% 62.6%
Net change in cash 11.2 4.4 6.6 15.2 (5.9) Key Ratios
Effects of exchange rate 0.1 (0.0) 0.0 - - Net Debt or (Net Cash) 409 613 751 757 763
Ending cash 49.7 60.7 60.7 75.9 70.0 Gearing (%) 33.5% 37.0% 37.5% 38.0% 38.0%
Source: Company, Phi l l ip Securi ties Research (Singapore) Estimates
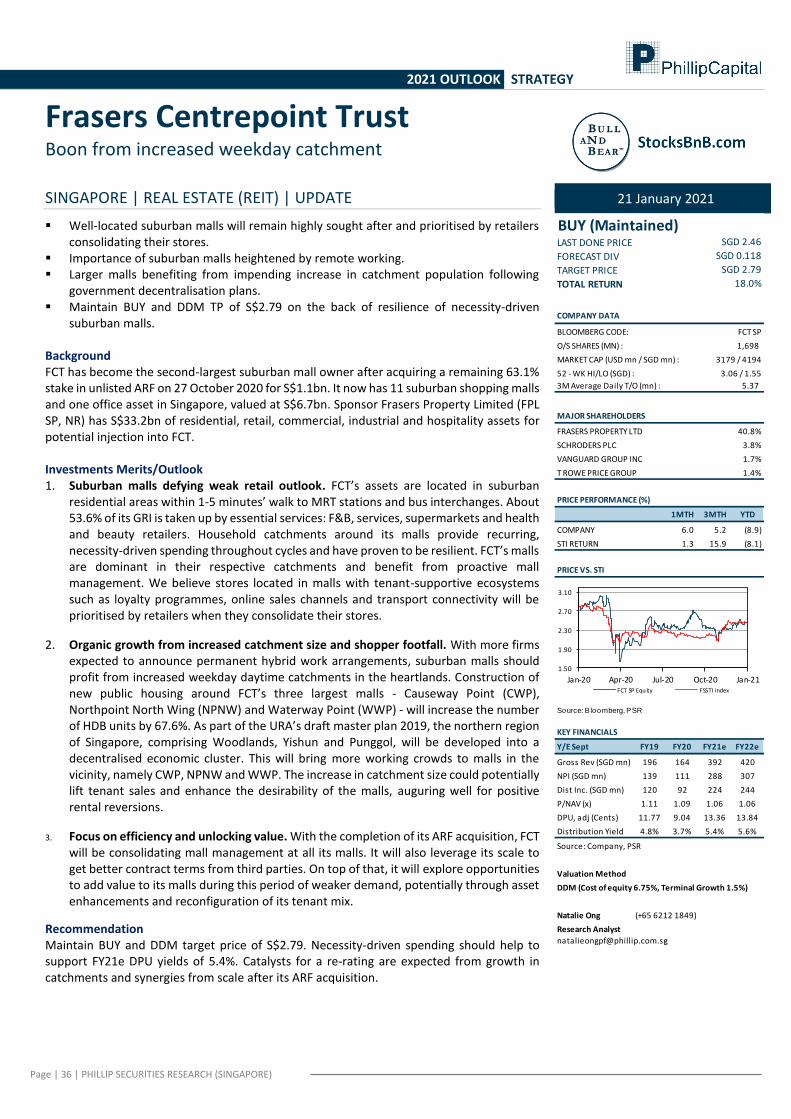
Page | 36 | PHILLIP SECURITIES RESEARCH (SINGAPORE)
2021 OUTLOOK STRATEGY
Frasers Centrepoint Trust Boon from increased weekday catchment
SINGAPORE | REAL ESTATE (REIT) | UPDATE
▪ Well-located suburban malls will remain highly sought after and prioritised by retailers consolidating their stores.
▪ Importance of suburban malls heightened by remote working. ▪ Larger malls benefiting from impending increase in catchment population following
government decentralisation plans. ▪ Maintain BUY and DDM TP of S$2.79 on the back of resilience of necessity-driven
suburban malls.
Background FCT has become the second-largest suburban mall owner after acquiring a remaining 63.1% stake in unlisted ARF on 27 October 2020 for S$1.1bn. It now has 11 suburban shopping malls and one office asset in Singapore, valued at S$6.7bn. Sponsor Frasers Property Limited (FPL SP, NR) has S$33.2bn of residential, retail, commercial, industrial and hospitality assets for potential injection into FCT. Investments Merits/Outlook 1. Suburban malls defying weak retail outlook. FCT’s assets are located in suburban
residential areas within 1-5 minutes’ walk to MRT stations and bus interchanges. About 53.6% of its GRI is taken up by essential services: F&B, services, supermarkets and health and beauty retailers. Household catchments around its malls provide recurring, necessity-driven spending throughout cycles and have proven to be resilient. FCT’s malls are dominant in their respective catchments and benefit from proactive mall management. We believe stores located in malls with tenant-supportive ecosystems such as loyalty programmes, online sales channels and transport connectivity will be prioritised by retailers when they consolidate their stores.
2. Organic growth from increased catchment size and shopper footfall. With more firms expected to announce permanent hybrid work arrangements, suburban malls should profit from increased weekday daytime catchments in the heartlands. Construction of new public housing around FCT’s three largest malls - Causeway Point (CWP), Northpoint North Wing (NPNW) and Waterway Point (WWP) - will increase the number of HDB units by 67.6%. As part of the URA’s draft master plan 2019, the northern region of Singapore, comprising Woodlands, Yishun and Punggol, will be developed into a decentralised economic cluster. This will bring more working crowds to malls in the vicinity, namely CWP, NPNW and WWP. The increase in catchment size could potentially lift tenant sales and enhance the desirability of the malls, auguring well for positive rental reversions.
3. Focus on efficiency and unlocking value. With the completion of its ARF acquisition, FCT will be consolidating mall management at all its malls. It will also leverage its scale to get better contract terms from third parties. On top of that, it will explore opportunities to add value to its malls during this period of weaker demand, potentially through asset enhancements and reconfiguration of its tenant mix.
Recommendation Maintain BUY and DDM target price of S$2.79. Necessity-driven spending should help to support FY21e DPU yields of 5.4%. Catalysts for a re-rating are expected from growth in catchments and synergies from scale after its ARF acquisition.
21 January 2021
BUY (Maintained)LAST DONE PRICE
FORECAST DIV
TARGET PRICE
TOTAL RETURN
COMPANY DATA
BLOOMBERG CODE: FCT SP
O/S SHARES (MN) : 1,698
MARKET CAP (USD mn / SGD mn) : 3179 / 4194
52 - WK HI/LO (SGD) : 3.06 / 1.55
3M Average Daily T/O (mn) : 5.37
MAJOR SHAREHOLDERS
40.8%
SCHRODERS PLC 3.8%
VANGUARD GROUP INC 1.7%
T ROWE PRICE GROUP 1.4%
PRICE PERFORMANCE (%)
1MTH 3MTH YTD
COMPANY 6.0 5.2 (8.9)
STI RETURN 1.3 15.9 (8.1)
PRICE VS. STI
Source: B loomberg, PSR
KEY FINANCIALS
Y/E Sept FY19 FY20 FY21e FY22e
Gross Rev (SGD mn) 196 164 392 420
NPI (SGD mn) 139 111 288 307
Dist Inc. (SGD mn) 120 92 224 244
P/NAV (x) 1.11 1.09 1.06 1.06
DPU, adj (Cents) 11.77 9.04 13.36 13.84
Distribution Yield 4.8% 3.7% 5.4% 5.6%
Source: Company, PSR
Valuation Method
DDM (Cost of equity 6.75%, Terminal Growth 1.5%)
Natalie Ong (+65 6212 1849)
Research Analyst
18.0%
FRASERS PROPERTY LTD
SGD 2.46
SGD 0.118
SGD 2.79
1.50
1.90
2.30
2.70
3.10
Jan-20 Apr-20 Jul-20 Oct-20 Jan-21FCT SP Equity FSSTI index
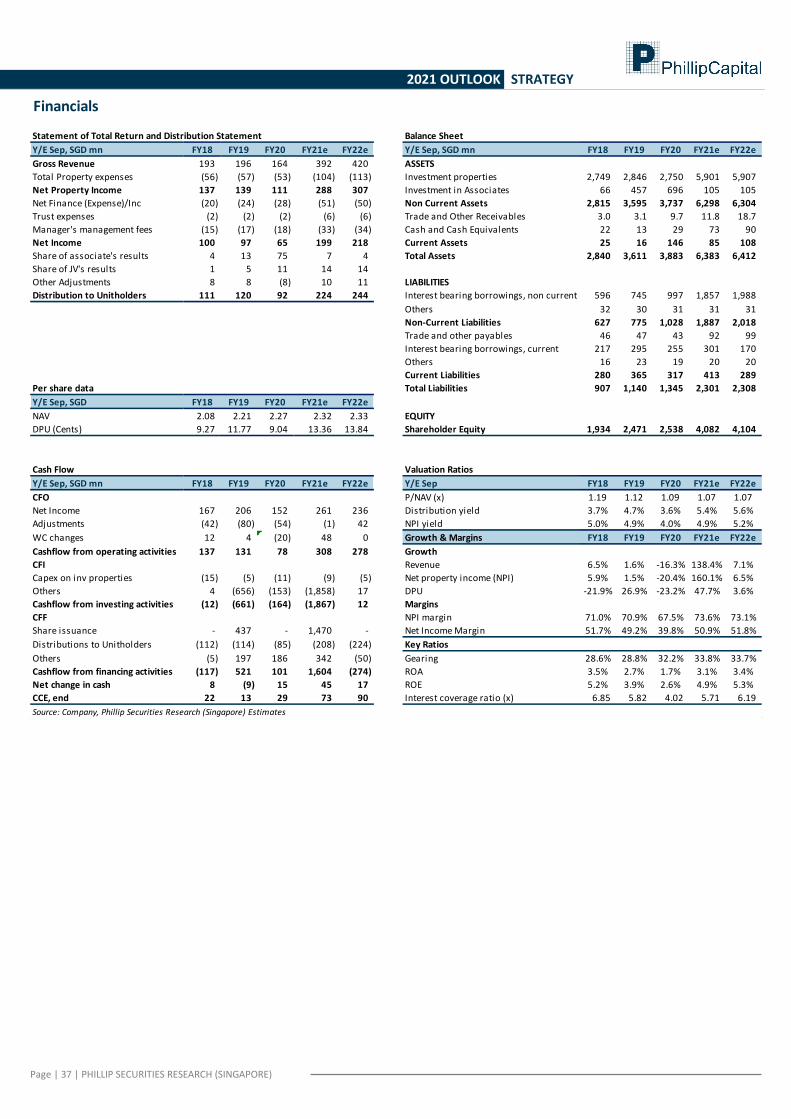
Page | 37 | PHILLIP SECURITIES RESEARCH (SINGAPORE)
2021 OUTLOOK STRATEGY
Financials
Statement of Total Return and Distribution Statement Balance Sheet
Y/E Sep, SGD mn FY18 FY19 FY20 FY21e FY22e Y/E Sep, SGD mn FY18 FY19 FY20 FY21e FY22e
Gross Revenue 193 196 164 392 420 ASSETS
Total Property expenses (56) (57) (53) (104) (113) Investment properties 2,749 2,846 2,750 5,901 5,907
Net Property Income 137 139 111 288 307 Investment in Associates 66 457 696 105 105
Net Finance (Expense)/Inc (20) (24) (28) (51) (50) Non Current Assets 2,815 3,595 3,737 6,298 6,304
Trust expenses (2) (2) (2) (6) (6) Trade and Other Receivables 3.0 3.1 9.7 11.8 18.7
Manager's management fees (15) (17) (18) (33) (34) Cash and Cash Equivalents 22 13 29 73 90
Net Income 100 97 65 199 218 Current Assets 25 16 146 85 108
Share of associate's results 4 13 75 7 4 Total Assets 2,840 3,611 3,883 6,383 6,412
Share of JV's results 1 5 11 14 14
Other Adjustments 8 8 (8) 10 11 LIABILITIES
Distribution to Unitholders 111 120 92 224 244 Interest bearing borrowings, non current 596 745 997 1,857 1,988
Others 32 30 31 31 31
Non-Current Liabilities 627 775 1,028 1,887 2,018
Trade and other payables 46 47 43 92 99
Interest bearing borrowings, current 217 295 255 301 170
Others 16 23 19 20 20
Current Liabilities 280 365 317 413 289
Per share data Total Liabilities 907 1,140 1,345 2,301 2,308
Y/E Sep, SGD FY18 FY19 FY20 FY21e FY22e
NAV 2.08 2.21 2.27 2.32 2.33 EQUITY
DPU (Cents) 9.27 11.77 9.04 13.36 13.84 Shareholder Equity 1,934 2,471 2,538 4,082 4,104
Cash Flow Valuation Ratios
Y/E Sep, SGD mn FY18 FY19 FY20 FY21e FY22e Y/E Sep FY18 FY19 FY20 FY21e FY22e
CFO P/NAV (x) 1.19 1.12 1.09 1.07 1.07
Net Income 167 206 152 261 236 Distribution yield 3.7% 4.7% 3.6% 5.4% 5.6%
Adjustments (42) (80) (54) (1) 42 NPI yield 5.0% 4.9% 4.0% 4.9% 5.2%
WC changes 12 4 (20) 48 0 Growth & Margins FY18 FY19 FY20 FY21e FY22e
Cashflow from operating activities 137 131 78 308 278 Growth
CFI Revenue 6.5% 1.6% -16.3% 138.4% 7.1%
Capex on inv properties (15) (5) (11) (9) (5) Net property income (NPI) 5.9% 1.5% -20.4% 160.1% 6.5%
Others 4 (656) (153) (1,858) 17 DPU -21.9% 26.9% -23.2% 47.7% 3.6%
Cashflow from investing activities (12) (661) (164) (1,867) 12 Margins
CFF NPI margin 71.0% 70.9% 67.5% 73.6% 73.1%
Share issuance - 437 - 1,470 - Net Income Margin 51.7% 49.2% 39.8% 50.9% 51.8%
Distributions to Unitholders (112) (114) (85) (208) (224) Key Ratios
Others (5) 197 186 342 (50) Gearing 28.6% 28.8% 32.2% 33.8% 33.7%
Cashflow from financing activities (117) 521 101 1,604 (274) ROA 3.5% 2.7% 1.7% 3.1% 3.4%
Net change in cash 8 (9) 15 45 17 ROE 5.2% 3.9% 2.6% 4.9% 5.3%
CCE, end 22 13 29 73 90 Interest coverage ratio (x) 6.85 5.82 4.02 5.71 6.19
Source: Company, Phillip Securities Research (Singapore) Estimates
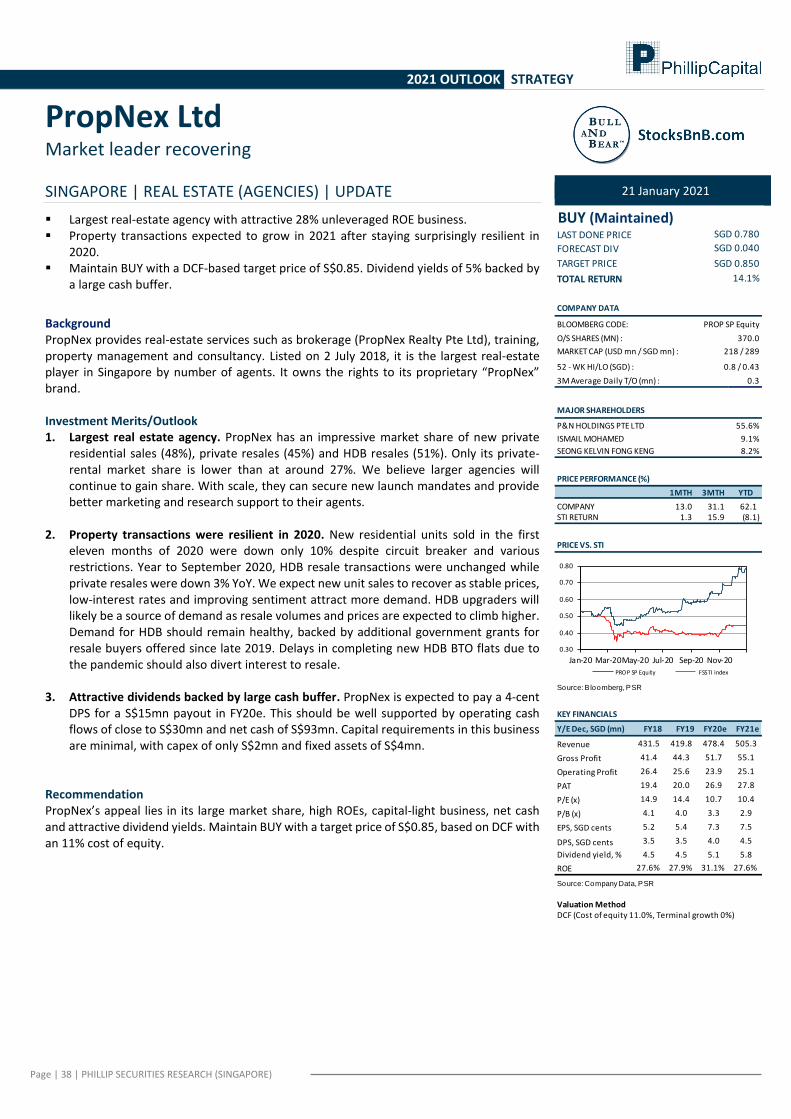
Page | 38 | PHILLIP SECURITIES RESEARCH (SINGAPORE)
2021 OUTLOOK STRATEGY
PropNex Ltd Market leader recovering
SINGAPORE | REAL ESTATE (AGENCIES) | UPDATE
▪ Largest real-estate agency with attractive 28% unleveraged ROE business. ▪ Property transactions expected to grow in 2021 after staying surprisingly resilient in
2020. ▪ Maintain BUY with a DCF-based target price of S$0.85. Dividend yields of 5% backed by
a large cash buffer.
Background PropNex provides real-estate services such as brokerage (PropNex Realty Pte Ltd), training, property management and consultancy. Listed on 2 July 2018, it is the largest real-estate player in Singapore by number of agents. It owns the rights to its proprietary “PropNex” brand.
Investment Merits/Outlook 1. Largest real estate agency. PropNex has an impressive market share of new private
residential sales (48%), private resales (45%) and HDB resales (51%). Only its private-rental market share is lower than at around 27%. We believe larger agencies will continue to gain share. With scale, they can secure new launch mandates and provide better marketing and research support to their agents.
2. Property transactions were resilient in 2020. New residential units sold in the first
eleven months of 2020 were down only 10% despite circuit breaker and various restrictions. Year to September 2020, HDB resale transactions were unchanged while private resales were down 3% YoY. We expect new unit sales to recover as stable prices, low-interest rates and improving sentiment attract more demand. HDB upgraders will likely be a source of demand as resale volumes and prices are expected to climb higher. Demand for HDB should remain healthy, backed by additional government grants for resale buyers offered since late 2019. Delays in completing new HDB BTO flats due to the pandemic should also divert interest to resale.
3. Attractive dividends backed by large cash buffer. PropNex is expected to pay a 4-cent
DPS for a S$15mn payout in FY20e. This should be well supported by operating cash flows of close to S$30mn and net cash of S$93mn. Capital requirements in this business are minimal, with capex of only S$2mn and fixed assets of S$4mn.
Recommendation PropNex’s appeal lies in its large market share, high ROEs, capital-light business, net cash and attractive dividend yields. Maintain BUY with a target price of S$0.85, based on DCF with an 11% cost of equity.
21 January 2021
BUY (Maintained)LAST DONE PRICE
FORECAST DIV
TARGET PRICE
TOTAL RETURN
COMPANY DATA
BLOOMBERG CODE: PROP SP Equity
O/S SHARES (MN) : 370.0
MARKET CAP (USD mn / SGD mn) : 218 / 289
52 - WK HI/LO (SGD) : 0.8 / 0.43
3M Average Daily T/O (mn) : 0.3
MAJOR SHAREHOLDERS
55.6%
ISMAIL MOHAMED 9.1%
SEONG KELVIN FONG KENG 8.2%
PRICE PERFORMANCE (%)
1MTH 3MTH YTD
COMPANY 13.0 31.1 62.1 STI RETURN 1.3 15.9 (8.1)
PRICE VS. STI
Source: Bloomberg, PSR
KEY FINANCIALS
Y/E Dec, SGD (mn) FY18 FY19 FY20e FY21e
Revenue 431.5 419.8 478.4 505.3
Gross Profit 41.4 44.3 51.7 55.1
Operating Profit 26.4 25.6 23.9 25.1
PAT 19.4 20.0 26.9 27.8
P/E (x) 14.9 14.4 10.7 10.4
P/B (x) 4.1 4.0 3.3 2.9
EPS, SGD cents 5.2 5.4 7.3 7.5
DPS, SGD cents 3.5 3.5 4.0 4.5
Dividend yield, % 4.5 4.5 5.1 5.8
ROE 27.6% 27.9% 31.1% 27.6%
Source: Company Data, PSR
Valuation MethodDCF (Cost of equity 11.0%, Terminal growth 0%)
SGD 0.780
SGD 0.040
SGD 0.850
14.1%
P&N HOLDINGS PTE LTD
0.30
0.40
0.50
0.60
Jan-20 Mar-20 May-20 Jul-20 Sep-20 Nov-20
PROP SP Equity FSSTI index
0.30
0.40
0.50
0.60
0.70
0.80
Jan-20 Mar-20May-20 Jul-20 Sep-20 Nov-20
PROP SP Equity FSSTI index
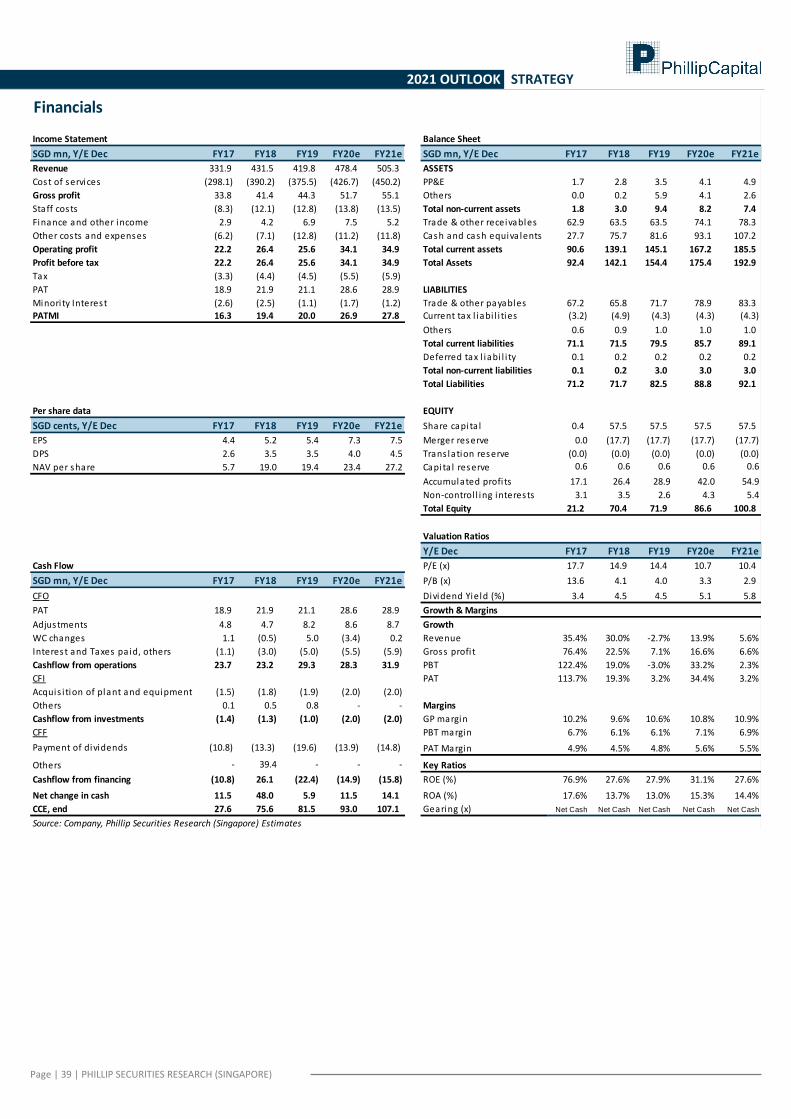
Page | 39 | PHILLIP SECURITIES RESEARCH (SINGAPORE)
2021 OUTLOOK STRATEGY
Financials
Income Statement Balance Sheet
SGD mn, Y/E Dec FY17 FY18 FY19 FY20e FY21e SGD mn, Y/E Dec FY17 FY18 FY19 FY20e FY21e
Revenue 331.9 431.5 419.8 478.4 505.3 ASSETS
Cost of services (298.1) (390.2) (375.5) (426.7) (450.2) PP&E 1.7 2.8 3.5 4.1 4.9
Gross profit 33.8 41.4 44.3 51.7 55.1 Others 0.0 0.2 5.9 4.1 2.6
Staff costs (8.3) (12.1) (12.8) (13.8) (13.5) Total non-current assets 1.8 3.0 9.4 8.2 7.4
Finance and other income 2.9 4.2 6.9 7.5 5.2 Trade & other receivables 62.9 63.5 63.5 74.1 78.3
Other costs and expenses (6.2) (7.1) (12.8) (11.2) (11.8) Cash and cash equiva lents 27.7 75.7 81.6 93.1 107.2
Operating profit 22.2 26.4 25.6 34.1 34.9 Total current assets 90.6 139.1 145.1 167.2 185.5
Profit before tax 22.2 26.4 25.6 34.1 34.9 Total Assets 92.4 142.1 154.4 175.4 192.9
Tax (3.3) (4.4) (4.5) (5.5) (5.9)
PAT 18.9 21.9 21.1 28.6 28.9 LIABILITIES
Minori ty Interest (2.6) (2.5) (1.1) (1.7) (1.2) Trade & other payables 67.2 65.8 71.7 78.9 83.3PATMI 16.3 19.4 20.0 26.9 27.8 Current tax l iabi l i ties (3.2) (4.9) (4.3) (4.3) (4.3)
Others 0.6 0.9 1.0 1.0 1.0
Total current liabilities 71.1 71.5 79.5 85.7 89.1
Deferred tax l iabi l i ty 0.1 0.2 0.2 0.2 0.2
Total non-current liabilities 0.1 0.2 3.0 3.0 3.0
Total Liabilities 71.2 71.7 82.5 88.8 92.1
Per share data EQUITY
SGD cents, Y/E Dec FY17 FY18 FY19 FY20e FY21e Share capita l 0.4 57.5 57.5 57.5 57.5
EPS 4.4 5.2 5.4 7.3 7.5 Merger reserve 0.0 (17.7) (17.7) (17.7) (17.7)
DPS 2.6 3.5 3.5 4.0 4.5 Trans lation reserve (0.0) (0.0) (0.0) (0.0) (0.0)
NAV per share 5.7 19.0 19.4 23.4 27.2 Capita l reserve 0.6 0.6 0.6 0.6 0.6
Accumulated profi ts 17.1 26.4 28.9 42.0 54.9
Non-control l ing interests 3.1 3.5 2.6 4.3 5.4
Total Equity 21.2 70.4 71.9 86.6 100.8
Valuation Ratios
Y/E Dec FY17 FY18 FY19 FY20e FY21e
Cash Flow P/E (x) 17.7 14.9 14.4 10.7 10.4
SGD mn, Y/E Dec FY17 FY18 FY19 FY20e FY21e P/B (x) 13.6 4.1 4.0 3.3 2.9
CFO Dividend Yield (%) 3.4 4.5 4.5 5.1 5.8
PAT 18.9 21.9 21.1 28.6 28.9 Growth & Margins
Adjustments 4.8 4.7 8.2 8.6 8.7 Growth
WC changes 1.1 (0.5) 5.0 (3.4) 0.2 Revenue 35.4% 30.0% -2.7% 13.9% 5.6%
Interest and Taxes pa id, others (1.1) (3.0) (5.0) (5.5) (5.9) Gross profi t 76.4% 22.5% 7.1% 16.6% 6.6%
Cashflow from operations 23.7 23.2 29.3 28.3 31.9 PBT 122.4% 19.0% -3.0% 33.2% 2.3%
CFI PAT 113.7% 19.3% 3.2% 34.4% 3.2%
Acquis i tion of plant and equipment (1.5) (1.8) (1.9) (2.0) (2.0)
Others 0.1 0.5 0.8 - - Margins
Cashflow from investments (1.4) (1.3) (1.0) (2.0) (2.0) GP margin 10.2% 9.6% 10.6% 10.8% 10.9%
CFF PBT margin 6.7% 6.1% 6.1% 7.1% 6.9%
Payment of dividends (10.8) (13.3) (19.6) (13.9) (14.8) PAT Margin 4.9% 4.5% 4.8% 5.6% 5.5%
Others - 39.4 - - - Key Ratios
Cashflow from financing (10.8) 26.1 (22.4) (14.9) (15.8) ROE (%) 76.9% 27.6% 27.9% 31.1% 27.6%
Net change in cash 11.5 48.0 5.9 11.5 14.1 ROA (%) 17.6% 13.7% 13.0% 15.3% 14.4%
CCE, end 27.6 75.6 81.5 93.0 107.1 Gearing (x) Net Cash Net Cash Net Cash Net Cash Net Cash
Source: Company, Phillip Securities Research (Singapore) Estimates
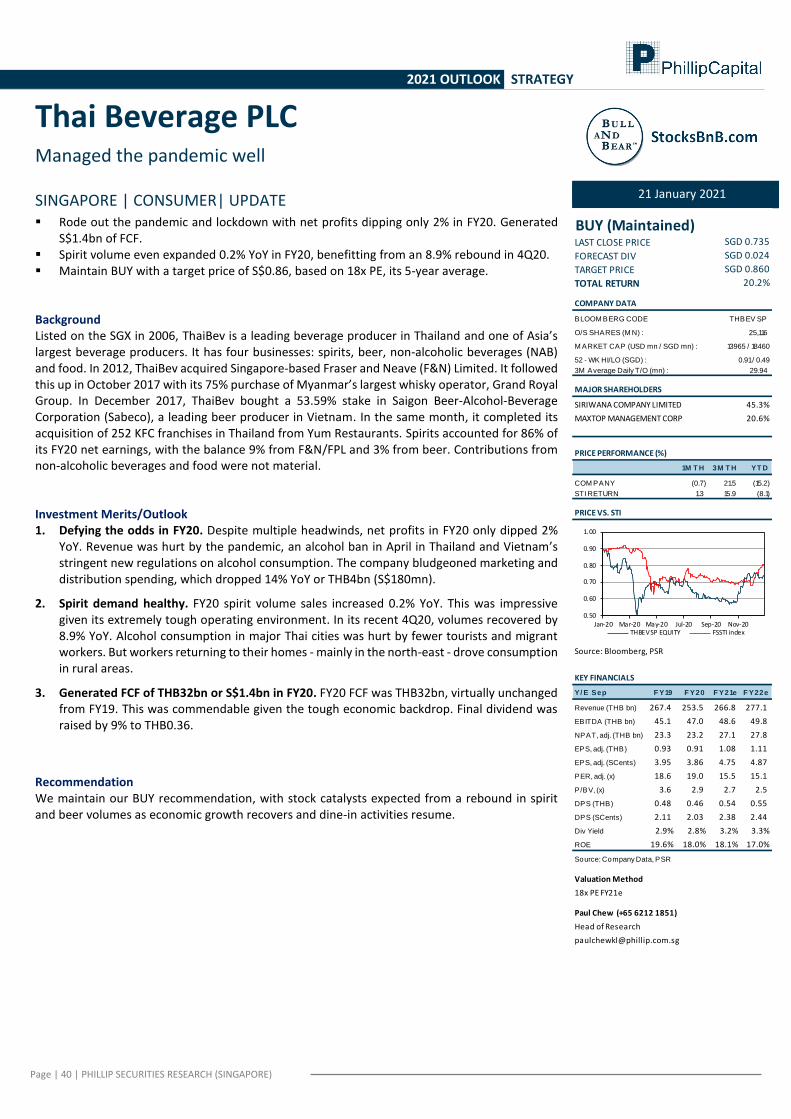
Page | 40 | PHILLIP SECURITIES RESEARCH (SINGAPORE)
2021 OUTLOOK STRATEGY
Thai Beverage PLC Managed the pandemic well
SINGAPORE | CONSUMER| UPDATE
21 January 2021
▪ Rode out the pandemic and lockdown with net profits dipping only 2% in FY20. Generated
S$1.4bn of FCF. ▪ Spirit volume even expanded 0.2% YoY in FY20, benefitting from an 8.9% rebound in 4Q20. ▪ Maintain BUY with a target price of S$0.86, based on 18x PE, its 5-year average.
Background Listed on the SGX in 2006, ThaiBev is a leading beverage producer in Thailand and one of Asia’s largest beverage producers. It has four businesses: spirits, beer, non-alcoholic beverages (NAB) and food. In 2012, ThaiBev acquired Singapore-based Fraser and Neave (F&N) Limited. It followed this up in October 2017 with its 75% purchase of Myanmar’s largest whisky operator, Grand Royal Group. In December 2017, ThaiBev bought a 53.59% stake in Saigon Beer-Alcohol-Beverage Corporation (Sabeco), a leading beer producer in Vietnam. In the same month, it completed its acquisition of 252 KFC franchises in Thailand from Yum Restaurants. Spirits accounted for 86% of its FY20 net earnings, with the balance 9% from F&N/FPL and 3% from beer. Contributions from non-alcoholic beverages and food were not material.
Investment Merits/Outlook 1. Defying the odds in FY20. Despite multiple headwinds, net profits in FY20 only dipped 2%
YoY. Revenue was hurt by the pandemic, an alcohol ban in April in Thailand and Vietnam’s stringent new regulations on alcohol consumption. The company bludgeoned marketing and distribution spending, which dropped 14% YoY or THB4bn (S$180mn).
2. Spirit demand healthy. FY20 spirit volume sales increased 0.2% YoY. This was impressive given its extremely tough operating environment. In its recent 4Q20, volumes recovered by 8.9% YoY. Alcohol consumption in major Thai cities was hurt by fewer tourists and migrant workers. But workers returning to their homes - mainly in the north-east - drove consumption in rural areas.
3. Generated FCF of THB32bn or S$1.4bn in FY20. FY20 FCF was THB32bn, virtually unchanged from FY19. This was commendable given the tough economic backdrop. Final dividend was raised by 9% to THB0.36.
Recommendation We maintain our BUY recommendation, with stock catalysts expected from a rebound in spirit and beer volumes as economic growth recovers and dine-in activities resume.
BUY (Maintained)LAST CLOSE PRICE
FORECAST DIV
TARGET PRICE
TOTAL RETURN
COMPANY DATA
BLOOM BERG CODE THBEV SP
O/S SHARES (M N) : 25,116
M ARKET CAP (USD mn / SGD mn) : 13965 / 18460
52 - WK HI/LO (SGD) : 0.91 / 0.49
3M Average Daily T/O (mn) : 29.94
MAJOR SHAREHOLDERS
45.3%
MAXTOP MANAGEMENT CORP 20.6%
PRICE PERFORMANCE (%)
1M T H 3M T H YT D
COM PANY (0.7) 21.5 (15.2)
STI RETURN 1.3 15.9 (8.1)
PRICE VS. STI
Source: Bloomberg, PSR
KEY FINANCIALS
Y/ E Sep F Y19 F Y20 F Y21e F Y22e
Revenue (THB bn) 267.4 253.5 266.8 277.1
EBITDA (THB bn) 45.1 47.0 48.6 49.8
NPAT, adj. (THB bn) 23.3 23.2 27.1 27.8
EPS, adj. (THB) 0.93 0.91 1.08 1.11
EPS, adj. (SCents) 3.95 3.86 4.75 4.87
PER, adj. (x) 18.6 19.0 15.5 15.1
P/BV, (x) 3.6 2.9 2.7 2.5
DPS (THB) 0.48 0.46 0.54 0.55
DPS (SCents) 2.11 2.03 2.38 2.44
Div Yield 2.9% 2.8% 3.2% 3.3%
ROE 19.6% 18.0% 18.1% 17.0%
Source: Company Data, PSR
Valuation Method
18x PE FY21e
Paul Chew (+65 6212 1851)
Head of Research
20.2%
SIRIWANA COMPANY LIMITED
SGD 0.735
SGD 0.024
SGD 0.860
0.50
0.60
0.70
0.80
0.90
1.00
Jan-20 Mar-20 May-20 Jul-20 Sep-20 Nov-20THBEV SP EQUITY FSSTI index
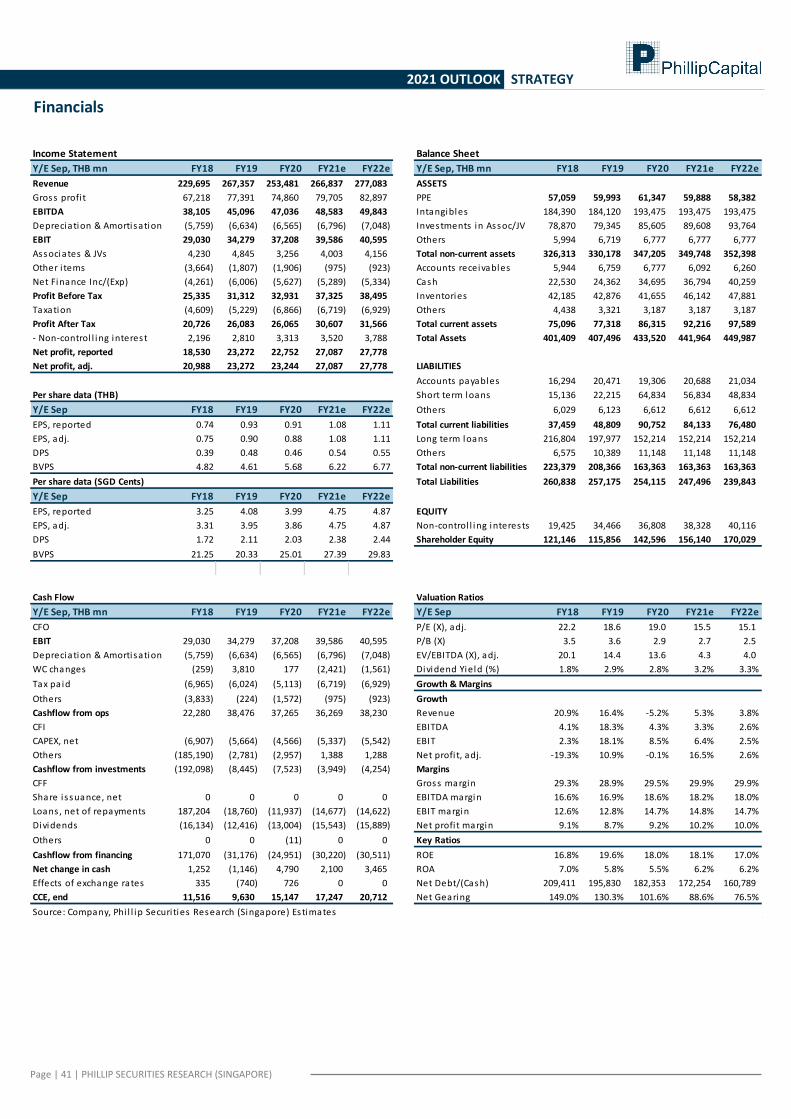
Page | 41 | PHILLIP SECURITIES RESEARCH (SINGAPORE)
2021 OUTLOOK STRATEGY
Financials
Income Statement Balance Sheet
Y/E Sep, THB mn FY18 FY19 FY20 FY21e FY22e Y/E Sep, THB mn FY18 FY19 FY20 FY21e FY22e
Revenue 229,695 267,357 253,481 266,837 277,083 ASSETS
Gross profi t 67,218 77,391 74,860 79,705 82,897 PPE 57,059 59,993 61,347 59,888 58,382
EBITDA 38,105 45,096 47,036 48,583 49,843 Intangibles 184,390 184,120 193,475 193,475 193,475
Depreciation & Amortisation (5,759) (6,634) (6,565) (6,796) (7,048) Investments in Assoc/JV 78,870 79,345 85,605 89,608 93,764
EBIT 29,030 34,279 37,208 39,586 40,595 Others 5,994 6,719 6,777 6,777 6,777
Associates & JVs 4,230 4,845 3,256 4,003 4,156 Total non-current assets 326,313 330,178 347,205 349,748 352,398
Other i tems (3,664) (1,807) (1,906) (975) (923) Accounts receivables 5,944 6,759 6,777 6,092 6,260
Net Finance Inc/(Exp) (4,261) (6,006) (5,627) (5,289) (5,334) Cash 22,530 24,362 34,695 36,794 40,259
Profit Before Tax 25,335 31,312 32,931 37,325 38,495 Inventories 42,185 42,876 41,655 46,142 47,881
Taxation (4,609) (5,229) (6,866) (6,719) (6,929) Others 4,438 3,321 3,187 3,187 3,187
Profit After Tax 20,726 26,083 26,065 30,607 31,566 Total current assets 75,096 77,318 86,315 92,216 97,589
- Non-control l ing interest 2,196 2,810 3,313 3,520 3,788 Total Assets 401,409 407,496 433,520 441,964 449,987
Net profit, reported 18,530 23,272 22,752 27,087 27,778
Net profit, adj. 20,988 23,272 23,244 27,087 27,778 LIABILITIES
Accounts payables 16,294 20,471 19,306 20,688 21,034
Per share data (THB) Short term loans 15,136 22,215 64,834 56,834 48,834
Y/E Sep FY18 FY19 FY20 FY21e FY22e Others 6,029 6,123 6,612 6,612 6,612
EPS, reported 0.74 0.93 0.91 1.08 1.11 Total current liabilities 37,459 48,809 90,752 84,133 76,480
EPS, adj. 0.75 0.90 0.88 1.08 1.11 Long term loans 216,804 197,977 152,214 152,214 152,214
DPS 0.39 0.48 0.46 0.54 0.55 Others 6,575 10,389 11,148 11,148 11,148
BVPS 4.82 4.61 5.68 6.22 6.77 Total non-current liabilities 223,379 208,366 163,363 163,363 163,363
Per share data (SGD Cents) Total Liabilities 260,838 257,175 254,115 247,496 239,843
Y/E Sep FY18 FY19 FY20 FY21e FY22e
EPS, reported 3.25 4.08 3.99 4.75 4.87 EQUITY
EPS, adj. 3.31 3.95 3.86 4.75 4.87 Non-control l ing interests 19,425 34,466 36,808 38,328 40,116
DPS 1.72 2.11 2.03 2.38 2.44 Shareholder Equity 121,146 115,856 142,596 156,140 170,029
BVPS 21.25 20.33 25.01 27.39 29.83
*Exchange rate (THB/SGD) 22.70 22.7 22.7 22.7 22.7
Cash Flow Valuation Ratios
Y/E Sep, THB mn FY18 FY19 FY20 FY21e FY22e Y/E Sep FY18 FY19 FY20 FY21e FY22e
CFO P/E (X), adj. 22.2 18.6 19.0 15.5 15.1
EBIT 29,030 34,279 37,208 39,586 40,595 P/B (X) 3.5 3.6 2.9 2.7 2.5
Depreciation & Amortisation (5,759) (6,634) (6,565) (6,796) (7,048) EV/EBITDA (X), adj. 20.1 14.4 13.6 4.3 4.0
WC changes (259) 3,810 177 (2,421) (1,561) Dividend Yield (%) 1.8% 2.9% 2.8% 3.2% 3.3%
Tax paid (6,965) (6,024) (5,113) (6,719) (6,929) Growth & Margins
Others (3,833) (224) (1,572) (975) (923) Growth
Cashflow from ops 22,280 38,476 37,265 36,269 38,230 Revenue 20.9% 16.4% -5.2% 5.3% 3.8%
CFI EBITDA 4.1% 18.3% 4.3% 3.3% 2.6%
CAPEX, net (6,907) (5,664) (4,566) (5,337) (5,542) EBIT 2.3% 18.1% 8.5% 6.4% 2.5%
Others (185,190) (2,781) (2,957) 1,388 1,288 Net profi t, adj. -19.3% 10.9% -0.1% 16.5% 2.6%
Cashflow from investments (192,098) (8,445) (7,523) (3,949) (4,254) Margins
CFF Gross margin 29.3% 28.9% 29.5% 29.9% 29.9%
Share i ssuance, net 0 0 0 0 0 EBITDA margin 16.6% 16.9% 18.6% 18.2% 18.0%
Loans , net of repayments 187,204 (18,760) (11,937) (14,677) (14,622) EBIT margin 12.6% 12.8% 14.7% 14.8% 14.7%
Dividends (16,134) (12,416) (13,004) (15,543) (15,889) Net profi t margin 9.1% 8.7% 9.2% 10.2% 10.0%
Others 0 0 (11) 0 0 Key Ratios
Cashflow from financing 171,070 (31,176) (24,951) (30,220) (30,511) ROE 16.8% 19.6% 18.0% 18.1% 17.0%
Net change in cash 1,252 (1,146) 4,790 2,100 3,465 ROA 7.0% 5.8% 5.5% 6.2% 6.2%
Effects of exchange rates 335 (740) 726 0 0 Net Debt/(Cash) 209,411 195,830 182,353 172,254 160,789
CCE, end 11,516 9,630 15,147 17,247 20,712 Net Gearing 149.0% 130.3% 101.6% 88.6% 76.5%
Source: Company, Phi l l ip Securi ties Research (Singapore) Estimates
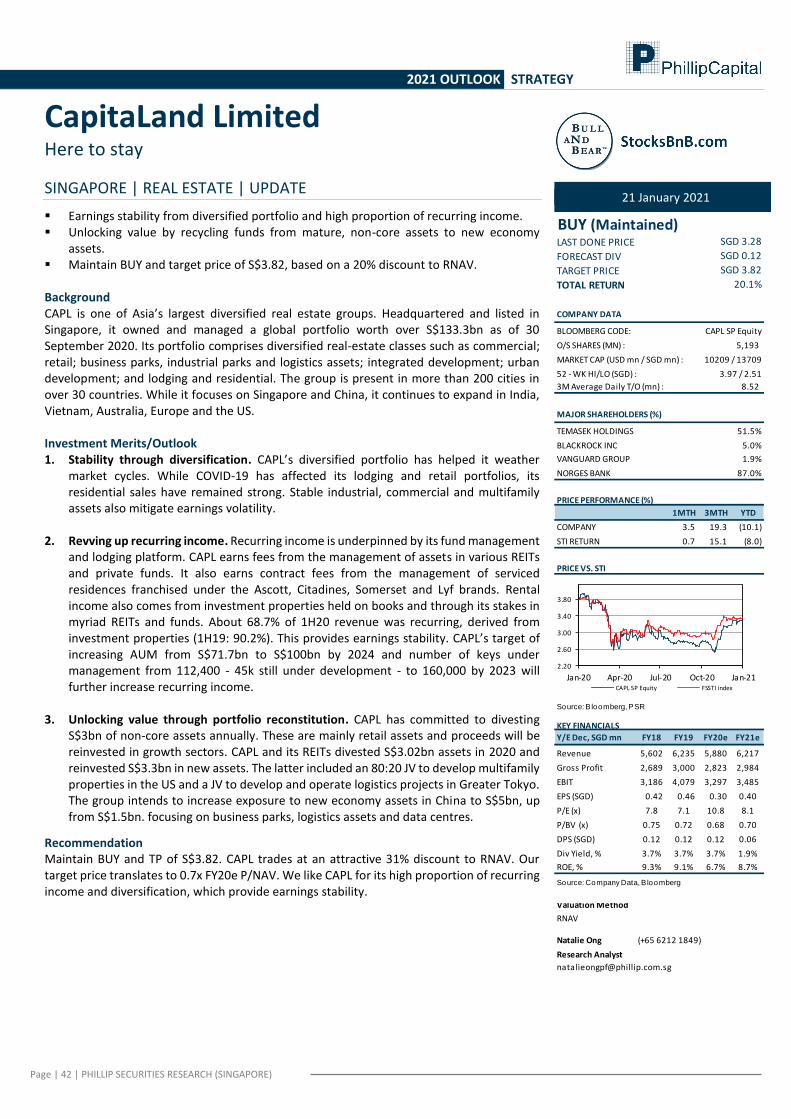
Page | 42 | PHILLIP SECURITIES RESEARCH (SINGAPORE)
2021 OUTLOOK STRATEGY
CapitaLand Limited Here to stay
SINGAPORE | REAL ESTATE | UPDATE
▪ Earnings stability from diversified portfolio and high proportion of recurring income. ▪ Unlocking value by recycling funds from mature, non-core assets to new economy
assets. ▪ Maintain BUY and target price of S$3.82, based on a 20% discount to RNAV.
Background CAPL is one of Asia’s largest diversified real estate groups. Headquartered and listed in Singapore, it owned and managed a global portfolio worth over S$133.3bn as of 30 September 2020. Its portfolio comprises diversified real-estate classes such as commercial; retail; business parks, industrial parks and logistics assets; integrated development; urban development; and lodging and residential. The group is present in more than 200 cities in over 30 countries. While it focuses on Singapore and China, it continues to expand in India, Vietnam, Australia, Europe and the US. Investment Merits/Outlook 1. Stability through diversification. CAPL’s diversified portfolio has helped it weather
market cycles. While COVID-19 has affected its lodging and retail portfolios, its residential sales have remained strong. Stable industrial, commercial and multifamily assets also mitigate earnings volatility.
2. Revving up recurring income. Recurring income is underpinned by its fund management
and lodging platform. CAPL earns fees from the management of assets in various REITs and private funds. It also earns contract fees from the management of serviced residences franchised under the Ascott, Citadines, Somerset and Lyf brands. Rental income also comes from investment properties held on books and through its stakes in myriad REITs and funds. About 68.7% of 1H20 revenue was recurring, derived from investment properties (1H19: 90.2%). This provides earnings stability. CAPL’s target of increasing AUM from S$71.7bn to S$100bn by 2024 and number of keys under management from 112,400 - 45k still under development - to 160,000 by 2023 will further increase recurring income.
3. Unlocking value through portfolio reconstitution. CAPL has committed to divesting
S$3bn of non-core assets annually. These are mainly retail assets and proceeds will be reinvested in growth sectors. CAPL and its REITs divested S$3.02bn assets in 2020 and reinvested S$3.3bn in new assets. The latter included an 80:20 JV to develop multifamily properties in the US and a JV to develop and operate logistics projects in Greater Tokyo. The group intends to increase exposure to new economy assets in China to S$5bn, up from S$1.5bn. focusing on business parks, logistics assets and data centres.
Recommendation Maintain BUY and TP of S$3.82. CAPL trades at an attractive 31% discount to RNAV. Our target price translates to 0.7x FY20e P/NAV. We like CAPL for its high proportion of recurring income and diversification, which provide earnings stability.
21 January 2021
BUY (Maintained)LAST DONE PRICE
FORECAST DIV
TARGET PRICE
TOTAL RETURN
COMPANY DATA
BLOOMBERG CODE: CAPL SP Equity
O/S SHARES (MN) : 5,193
MARKET CAP (USD mn / SGD mn) : 10209 / 13709
52 - WK HI/LO (SGD) : 3.97 / 2.51
3M Average Daily T/O (mn) : 8.52
MAJOR SHAREHOLDERS (%)
TEMASEK HOLDINGS 51.5%
BLACKROCK INC 5.0%
VANGUARD GROUP 1.9%
NORGES BANK 87.0%
PRICE PERFORMANCE (%)
1MTH 3MTH YTD
COMPANY 3.5 19.3 (10.1)
STI RETURN 0.7 15.1 (8.0)
PRICE VS. STI
Source: B loomberg, PSR
KEY FINANCIALS
Y/E Dec, SGD mn FY18 FY19 FY20e FY21e
Revenue 5,602 6,235 5,880 6,217
Gross Profit 2,689 3,000 2,823 2,984
EBIT 3,186 4,079 3,297 3,485
EPS (SGD) 0.42 0.46 0.30 0.40
P/E (x) 7.8 7.1 10.8 8.1
P/BV (x) 0.75 0.72 0.68 0.70
DPS (SGD) 0.12 0.12 0.12 0.06
Div Yield, % 3.7% 3.7% 3.7% 1.9%
ROE, % 9.3% 9.1% 6.7% 8.7%
Source: Company Data, B loomberg
Valuation Method
RNAV
Natalie Ong (+65 6212 1849)
Research Analyst
SGD 0.12
SGD 3.82
20.1%
SGD 3.28
2.20
2.60
3.00
3.40
3.80
Jan-20 Apr-20 Jul-20 Oct-20 Jan-21CAPL SP Equity FSSTI index
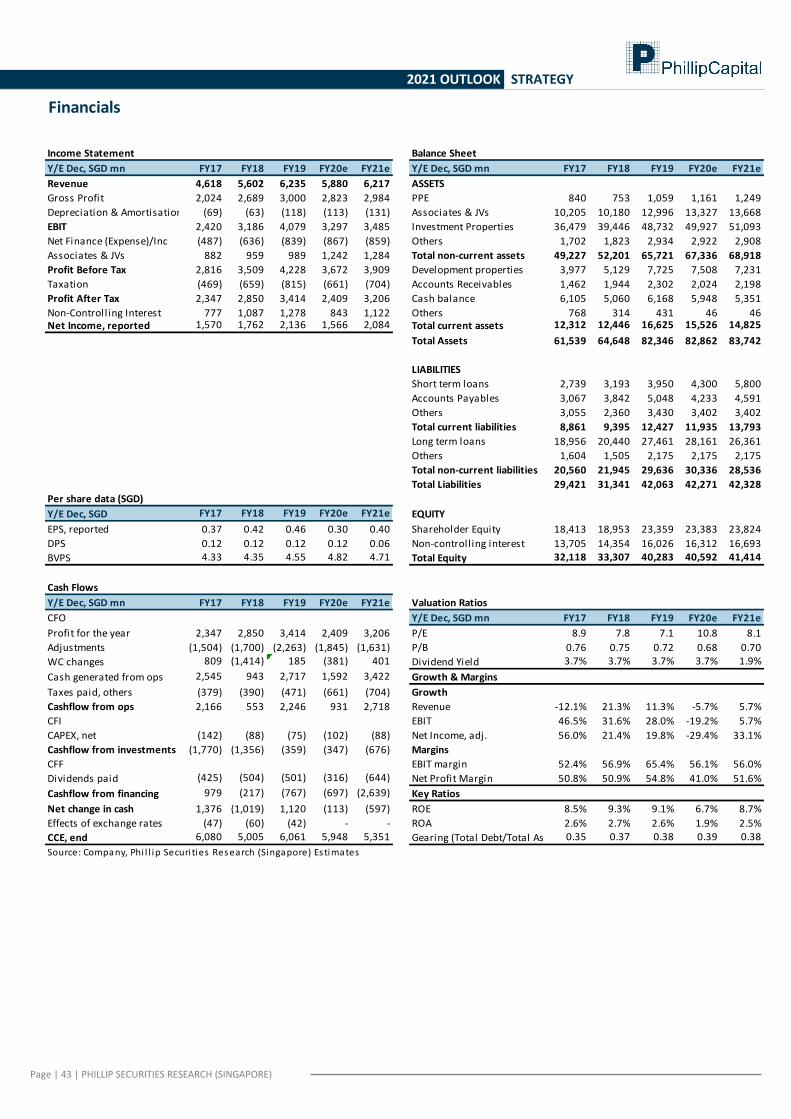
Page | 43 | PHILLIP SECURITIES RESEARCH (SINGAPORE)
2021 OUTLOOK STRATEGY
Financials
Income Statement Balance Sheet
Y/E Dec, SGD mn FY17 FY18 FY19 FY20e FY21e Y/E Dec, SGD mn FY17 FY18 FY19 FY20e FY21e
Revenue 4,618 5,602 6,235 5,880 6,217 ASSETS
Gross Profit 2,024 2,689 3,000 2,823 2,984 PPE 840 753 1,059 1,161 1,249
Depreciation & Amortisation (69) (63) (118) (113) (131) Associates & JVs 10,205 10,180 12,996 13,327 13,668
EBIT 2,420 3,186 4,079 3,297 3,485 Investment Properties 36,479 39,446 48,732 49,927 51,093
Net Finance (Expense)/Inc (487) (636) (839) (867) (859) Others 1,702 1,823 2,934 2,922 2,908
Associates & JVs 882 959 989 1,242 1,284 Total non-current assets 49,227 52,201 65,721 67,336 68,918
Profit Before Tax 2,816 3,509 4,228 3,672 3,909 Development properties 3,977 5,129 7,725 7,508 7,231
Taxation (469) (659) (815) (661) (704) Accounts Receivables 1,462 1,944 2,302 2,024 2,198
Profit After Tax 2,347 2,850 3,414 2,409 3,206 Cash balance 6,105 5,060 6,168 5,948 5,351
Non-Controlling Interest 777 1,087 1,278 843 1,122 Others 768 314 431 46 46 Net Income, reported 1,570 1,762 2,136 1,566 2,084 Total current assets 12,312 12,446 16,625 15,526 14,825
Total Assets 61,539 64,648 82,346 82,862 83,742
LIABILITIES
Short term loans 2,739 3,193 3,950 4,300 5,800
Accounts Payables 3,067 3,842 5,048 4,233 4,591
Others 3,055 2,360 3,430 3,402 3,402
Total current liabilities 8,861 9,395 12,427 11,935 13,793
Long term loans 18,956 20,440 27,461 28,161 26,361
Others 1,604 1,505 2,175 2,175 2,175
Total non-current liabilities 20,560 21,945 29,636 30,336 28,536
Total Liabilities 29,421 31,341 42,063 42,271 42,328
Per share data (SGD)
Y/E Dec, SGD FY17 FY18 FY19 FY20e FY21e EQUITY
EPS, reported 0.37 0.42 0.46 0.30 0.40 Shareholder Equity 18,413 18,953 23,359 23,383 23,824
DPS 0.12 0.12 0.12 0.12 0.06 Non-controlling interest 13,705 14,354 16,026 16,312 16,693
BVPS 4.33 4.35 4.55 4.82 4.71 Total Equity 32,118 33,307 40,283 40,592 41,414
Cash Flows
Y/E Dec, SGD mn FY17 FY18 FY19 FY20e FY21e Valuation Ratios
CFO Y/E Dec, SGD mn FY17 FY18 FY19 FY20e FY21e
Profit for the year 2,347 2,850 3,414 2,409 3,206 P/E 8.9 7.8 7.1 10.8 8.1
Adjustments (1,504) (1,700) (2,263) (1,845) (1,631) P/B 0.76 0.75 0.72 0.68 0.70
WC changes 809 (1,414) 185 (381) 401 Dividend Yield 3.7% 3.7% 3.7% 3.7% 1.9%
Cash generated from ops 2,545 943 2,717 1,592 3,422 Growth & Margins
Taxes paid, others (379) (390) (471) (661) (704) Growth
Cashflow from ops 2,166 553 2,246 931 2,718 Revenue -12.1% 21.3% 11.3% -5.7% 5.7%
CFI EBIT 46.5% 31.6% 28.0% -19.2% 5.7%
CAPEX, net (142) (88) (75) (102) (88) Net Income, adj. 56.0% 21.4% 19.8% -29.4% 33.1%
Cashflow from investments (1,770) (1,356) (359) (347) (676) Margins
CFF EBIT margin 52.4% 56.9% 65.4% 56.1% 56.0%
Dividends paid (425) (504) (501) (316) (644) Net Profit Margin 50.8% 50.9% 54.8% 41.0% 51.6%
Cashflow from financing 979 (217) (767) (697) (2,639) Key Ratios
Net change in cash 1,376 (1,019) 1,120 (113) (597) ROE 8.5% 9.3% 9.1% 6.7% 8.7%
Effects of exchange rates (47) (60) (42) - - ROA 2.6% 2.7% 2.6% 1.9% 2.5%
CCE, end 6,080 5,005 6,061 5,948 5,351 Gearing (Total Debt/Total Assets)0.35 0.37 0.38 0.39 0.38
Source: Company, Phi l l ip Securi ties Research (Singapore) Estimates
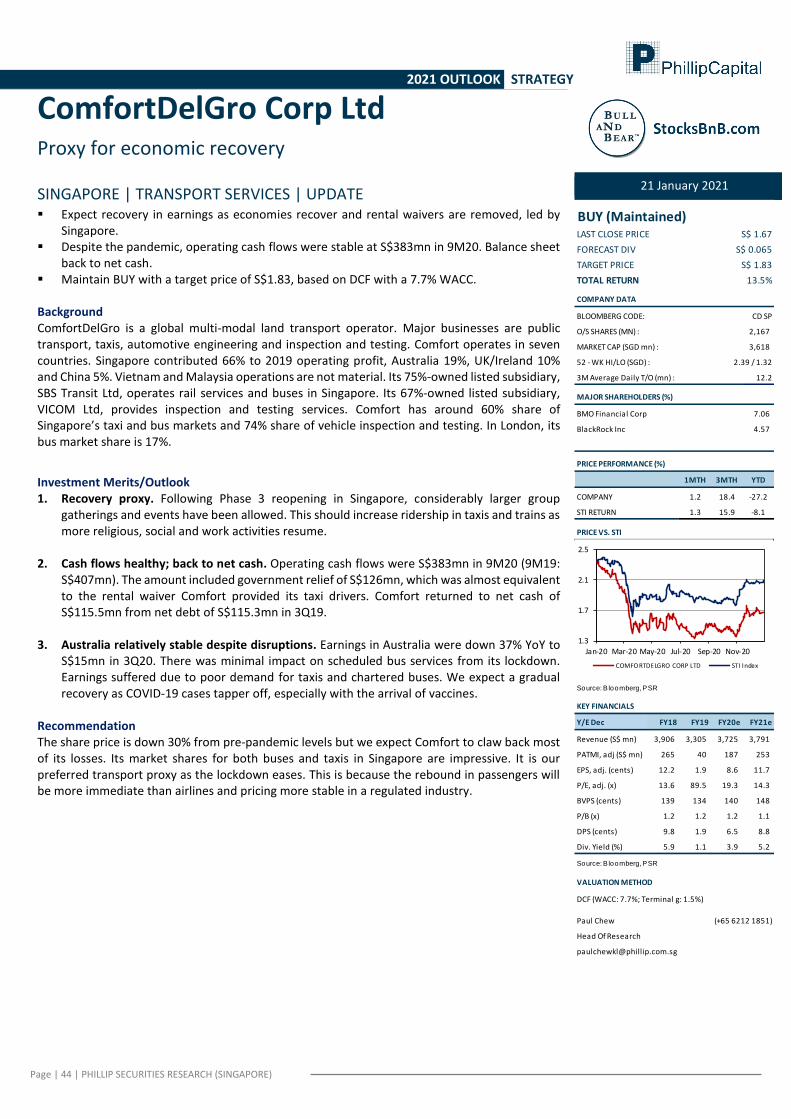
Page | 44 | PHILLIP SECURITIES RESEARCH (SINGAPORE)
2021 OUTLOOK STRATEGY
ComfortDelGro Corp Ltd Proxy for economic recovery
SINGAPORE | TRANSPORT SERVICES | UPDATE
21 January 2021
▪ Expect recovery in earnings as economies recover and rental waivers are removed, led by
Singapore. ▪ Despite the pandemic, operating cash flows were stable at S$383mn in 9M20. Balance sheet
back to net cash. ▪ Maintain BUY with a target price of S$1.83, based on DCF with a 7.7% WACC. Background ComfortDelGro is a global multi-modal land transport operator. Major businesses are public transport, taxis, automotive engineering and inspection and testing. Comfort operates in seven countries. Singapore contributed 66% to 2019 operating profit, Australia 19%, UK/Ireland 10% and China 5%. Vietnam and Malaysia operations are not material. Its 75%-owned listed subsidiary, SBS Transit Ltd, operates rail services and buses in Singapore. Its 67%-owned listed subsidiary, VICOM Ltd, provides inspection and testing services. Comfort has around 60% share of Singapore’s taxi and bus markets and 74% share of vehicle inspection and testing. In London, its bus market share is 17%.
Investment Merits/Outlook 1. Recovery proxy. Following Phase 3 reopening in Singapore, considerably larger group
gatherings and events have been allowed. This should increase ridership in taxis and trains as more religious, social and work activities resume.
2. Cash flows healthy; back to net cash. Operating cash flows were S$383mn in 9M20 (9M19: S$407mn). The amount included government relief of S$126mn, which was almost equivalent to the rental waiver Comfort provided its taxi drivers. Comfort returned to net cash of S$115.5mn from net debt of S$115.3mn in 3Q19.
3. Australia relatively stable despite disruptions. Earnings in Australia were down 37% YoY to
S$15mn in 3Q20. There was minimal impact on scheduled bus services from its lockdown. Earnings suffered due to poor demand for taxis and chartered buses. We expect a gradual recovery as COVID-19 cases tapper off, especially with the arrival of vaccines.
Recommendation The share price is down 30% from pre-pandemic levels but we expect Comfort to claw back most of its losses. Its market shares for both buses and taxis in Singapore are impressive. It is our preferred transport proxy as the lockdown eases. This is because the rebound in passengers will be more immediate than airlines and pricing more stable in a regulated industry.
BUY (Maintained)LAST CLOSE PRICE
FORECAST DIV
TARGET PRICE
TOTAL RETURN
COMPANY DATA
BLOOMBERG CODE: CD SP
O/S SHARES (MN) : 2,167
MARKET CAP (SGD mn) : 3,618
52 - WK HI/LO (SGD) : 2.39 / 1.32
3M Average Daily T/O (mn) : 12.2
MAJOR SHAREHOLDERS (%)
7.06
4.57
PRICE PERFORMANCE (%)
1MTH 3MTH YTD
COMPANY 1.2 18.4 -27.2
STI RETURN 1.3 15.9 -8.1
PRICE VS. STI
Source: B loomberg, PSR
KEY FINANCIALS
Y/E Dec FY18 FY19 FY20e FY21e
Revenue (S$ mn) 3,906 3,305 3,725 3,791
PATMI, adj (S$ mn) 265 40 187 253
EPS, adj. (cents) 12.2 1.9 8.6 11.7
P/E, adj. (x) 13.6 89.5 19.3 14.3
BVPS (cents) 139 134 140 148
P/B (x) 1.2 1.2 1.2 1.1
DPS (cents) 9.8 1.9 6.5 8.8
Div. Yield (%) 5.9 1.1 3.9 5.2
Source: B loomberg, PSR
VALUATION METHOD
DCF (WACC: 7.7%; Terminal g: 1.5%)
Paul Chew (+65 6212 1851)
Head Of Research
BlackRock Inc
S$ 1.67
S$ 0.065
S$ 1.83
13.5%
BMO Financial Corp
1.3
1.7
2.1
2.5
Jan-20 Mar-20 May-20 Jul-20 Sep-20 Nov-20
COMFO RTDELGRO CORP LTD STI Index
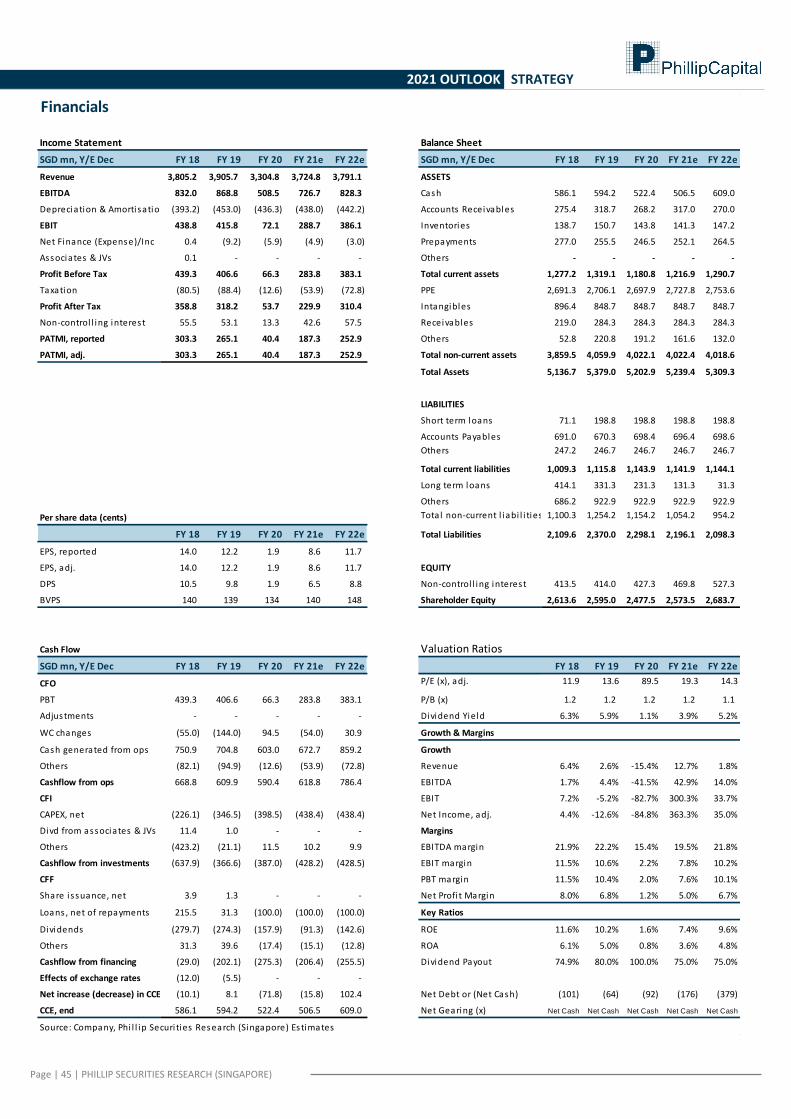
Page | 45 | PHILLIP SECURITIES RESEARCH (SINGAPORE)
2021 OUTLOOK STRATEGY
Financials
Income Statement Balance Sheet
SGD mn, Y/E Dec FY 18 FY 19 FY 20 FY 21e FY 22e SGD mn, Y/E Dec FY 18 FY 19 FY 20 FY 21e FY 22e
Revenue 3,805.2 3,905.7 3,304.8 3,724.8 3,791.1 ASSETS
EBITDA 832.0 868.8 508.5 726.7 828.3 Cash 586.1 594.2 522.4 506.5 609.0
Depreciation & Amortisation (393.2) (453.0) (436.3) (438.0) (442.2) Accounts Receivables 275.4 318.7 268.2 317.0 270.0
EBIT 438.8 415.8 72.1 288.7 386.1 Inventories 138.7 150.7 143.8 141.3 147.2
Net Finance (Expense)/Inc 0.4 (9.2) (5.9) (4.9) (3.0) Prepayments 277.0 255.5 246.5 252.1 264.5
Associates & JVs 0.1 - - - - Others - - - - -
Profit Before Tax 439.3 406.6 66.3 283.8 383.1 Total current assets 1,277.2 1,319.1 1,180.8 1,216.9 1,290.7
Taxation (80.5) (88.4) (12.6) (53.9) (72.8) PPE 2,691.3 2,706.1 2,697.9 2,727.8 2,753.6
Profit After Tax 358.8 318.2 53.7 229.9 310.4 Intangibles 896.4 848.7 848.7 848.7 848.7
Non-control l ing interest 55.5 53.1 13.3 42.6 57.5 Receivables 219.0 284.3 284.3 284.3 284.3
PATMI, reported 303.3 265.1 40.4 187.3 252.9 Others 52.8 220.8 191.2 161.6 132.0
PATMI, adj. 303.3 265.1 40.4 187.3 252.9 Total non-current assets 3,859.5 4,059.9 4,022.1 4,022.4 4,018.6
Total Assets 5,136.7 5,379.0 5,202.9 5,239.4 5,309.3
LIABILITIES
Short term loans 71.1 198.8 198.8 198.8 198.8
Accounts Payables 691.0 670.3 698.4 696.4 698.6
Others 247.2 246.7 246.7 246.7 246.7
Total current liabilities 1,009.3 1,115.8 1,143.9 1,141.9 1,144.1
Long term loans 414.1 331.3 231.3 131.3 31.3
Others 686.2 922.9 922.9 922.9 922.9
Per share data (cents) Total non-current l iabi l i ties 1,100.3 1,254.2 1,154.2 1,054.2 954.2
FY 18 FY 19 FY 20 FY 21e FY 22e Total Liabilities 2,109.6 2,370.0 2,298.1 2,196.1 2,098.3
EPS, reported 14.0 12.2 1.9 8.6 11.7
EPS, adj. 14.0 12.2 1.9 8.6 11.7 EQUITY
DPS 10.5 9.8 1.9 6.5 8.8 Non-control l ing interest 413.5 414.0 427.3 469.8 527.3
BVPS 140 139 134 140 148 Shareholder Equity 2,613.6 2,595.0 2,477.5 2,573.5 2,683.7
Cash Flow Valuation Ratios
SGD mn, Y/E Dec FY 18 FY 19 FY 20 FY 21e FY 22e FY 18 FY 19 FY 20 FY 21e FY 22e
CFO P/E (x), adj. 11.9 13.6 89.5 19.3 14.3
PBT 439.3 406.6 66.3 283.8 383.1 P/B (x) 1.2 1.2 1.2 1.2 1.1
Adjustments - - - - - Dividend Yield 6.3% 5.9% 1.1% 3.9% 5.2%
WC changes (55.0) (144.0) 94.5 (54.0) 30.9 Growth & Margins
Cash generated from ops 750.9 704.8 603.0 672.7 859.2 Growth
Others (82.1) (94.9) (12.6) (53.9) (72.8) Revenue 6.4% 2.6% -15.4% 12.7% 1.8%
Cashflow from ops 668.8 609.9 590.4 618.8 786.4 EBITDA 1.7% 4.4% -41.5% 42.9% 14.0%
CFI EBIT 7.2% -5.2% -82.7% 300.3% 33.7%
CAPEX, net (226.1) (346.5) (398.5) (438.4) (438.4) Net Income, adj. 4.4% -12.6% -84.8% 363.3% 35.0%
Divd from associates & JVs 11.4 1.0 - - - Margins
Others (423.2) (21.1) 11.5 10.2 9.9 EBITDA margin 21.9% 22.2% 15.4% 19.5% 21.8%
Cashflow from investments (637.9) (366.6) (387.0) (428.2) (428.5) EBIT margin 11.5% 10.6% 2.2% 7.8% 10.2%
CFF PBT margin 11.5% 10.4% 2.0% 7.6% 10.1%
Share i ssuance, net 3.9 1.3 - - - Net Profi t Margin 8.0% 6.8% 1.2% 5.0% 6.7%
Loans , net of repayments 215.5 31.3 (100.0) (100.0) (100.0) Key Ratios
Dividends (279.7) (274.3) (157.9) (91.3) (142.6) ROE 11.6% 10.2% 1.6% 7.4% 9.6%
Others 31.3 39.6 (17.4) (15.1) (12.8) ROA 6.1% 5.0% 0.8% 3.6% 4.8%
Cashflow from financing (29.0) (202.1) (275.3) (206.4) (255.5) Dividend Payout 74.9% 80.0% 100.0% 75.0% 75.0%
Effects of exchange rates (12.0) (5.5) - - -
Net increase (decrease) in CCE (10.1) 8.1 (71.8) (15.8) 102.4 Net Debt or (Net Cash) (101) (64) (92) (176) (379)
CCE, end 586.1 594.2 522.4 506.5 609.0 Net Gearing (x) Net Cash Net Cash Net Cash Net Cash Net Cash
Source: Company, Phi l l ip Securi ties Research (Singapore) Estimates
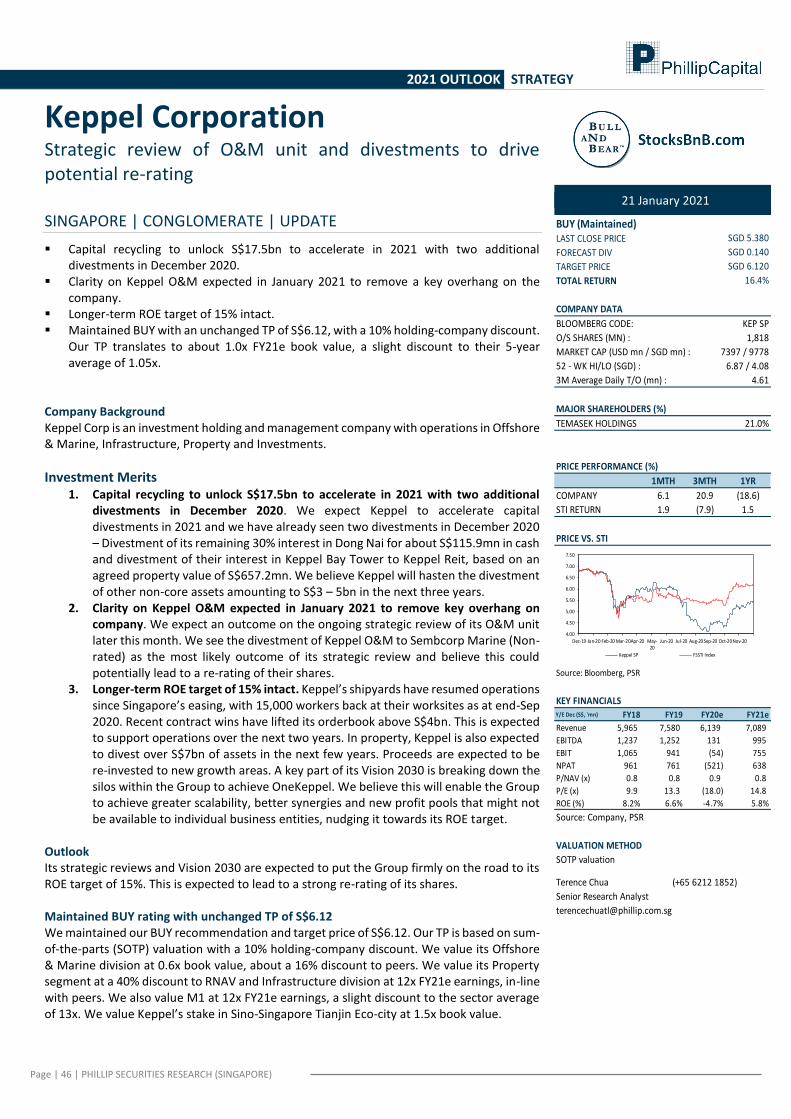
Page | 46 | PHILLIP SECURITIES RESEARCH (SINGAPORE)
2021 OUTLOOK STRATEGY
Keppel Corporation Strategic review of O&M unit and divestments to drive potential re-rating SINGAPORE | CONGLOMERATE | UPDATE
▪ Capital recycling to unlock S$17.5bn to accelerate in 2021 with two additional divestments in December 2020.
▪ Clarity on Keppel O&M expected in January 2021 to remove a key overhang on the company.
▪ Longer-term ROE target of 15% intact. ▪ Maintained BUY with an unchanged TP of S$6.12, with a 10% holding-company discount.
Our TP translates to about 1.0x FY21e book value, a slight discount to their 5-year average of 1.05x.
Company Background Keppel Corp is an investment holding and management company with operations in Offshore & Marine, Infrastructure, Property and Investments.
Investment Merits 1. Capital recycling to unlock S$17.5bn to accelerate in 2021 with two additional
divestments in December 2020. We expect Keppel to accelerate capital divestments in 2021 and we have already seen two divestments in December 2020 – Divestment of its remaining 30% interest in Dong Nai for about S$115.9mn in cash and divestment of their interest in Keppel Bay Tower to Keppel Reit, based on an agreed property value of S$657.2mn. We believe Keppel will hasten the divestment of other non-core assets amounting to S$3 – 5bn in the next three years.
2. Clarity on Keppel O&M expected in January 2021 to remove key overhang on company. We expect an outcome on the ongoing strategic review of its O&M unit later this month. We see the divestment of Keppel O&M to Sembcorp Marine (Non-rated) as the most likely outcome of its strategic review and believe this could potentially lead to a re-rating of their shares.
3. Longer-term ROE target of 15% intact. Keppel’s shipyards have resumed operations since Singapore’s easing, with 15,000 workers back at their worksites as at end-Sep 2020. Recent contract wins have lifted its orderbook above S$4bn. This is expected to support operations over the next two years. In property, Keppel is also expected to divest over S$7bn of assets in the next few years. Proceeds are expected to be re-invested to new growth areas. A key part of its Vision 2030 is breaking down the silos within the Group to achieve OneKeppel. We believe this will enable the Group to achieve greater scalability, better synergies and new profit pools that might not be available to individual business entities, nudging it towards its ROE target.
Outlook Its strategic reviews and Vision 2030 are expected to put the Group firmly on the road to its ROE target of 15%. This is expected to lead to a strong re-rating of its shares. Maintained BUY rating with unchanged TP of S$6.12 We maintained our BUY recommendation and target price of S$6.12. Our TP is based on sum-of-the-parts (SOTP) valuation with a 10% holding-company discount. We value its Offshore & Marine division at 0.6x book value, about a 16% discount to peers. We value its Property segment at a 40% discount to RNAV and Infrastructure division at 12x FY21e earnings, in-line with peers. We also value M1 at 12x FY21e earnings, a slight discount to the sector average of 13x. We value Keppel’s stake in Sino-Singapore Tianjin Eco-city at 1.5x book value.
21 January 2021
BUY (Maintained)LAST CLOSE PRICE
FORECAST DIV
TARGET PRICE
TOTAL RETURN
COMPANY DATA
BLOOMBERG CODE: KEP SP
O/S SHARES (MN) : 1,818
MARKET CAP (USD mn / SGD mn) : 7397 / 9778
52 - WK HI/LO (SGD) : 6.87 / 4.08
3M Average Daily T/O (mn) : 4.61
MAJOR SHAREHOLDERS (%)
TEMASEK HOLDINGS 21.0%
PRICE PERFORMANCE (%)
1MTH 3MTH 1YR
COMPANY 6.1 20.9 (18.6)
STI RETURN 1.9 (7.9) 1.5
PRICE VS. STI
Source: Bloomberg, PSR
KEY FINANCIALSY/E Dec (S$, 'mn) FY18 FY19 FY20e FY21e
Revenue 5,965 7,580 6,139 7,089
EBITDA 1,237 1,252 131 995
EBIT 1,065 941 (54) 755
NPAT 961 761 (521) 638
P/NAV (x) 0.8 0.8 0.9 0.8
P/E (x) 9.9 13.3 (18.0) 14.8
ROE (%) 8.2% 6.6% -4.7% 5.8%
Source: Company, PSR
VALUATION METHOD
SOTP valuation
Terence Chua (+65 6212 1852)
Senior Research Analyst
16.4%
SGD 5.380
SGD 0.140
SGD 6.120
4.00
4.50
5.00
5.50
6.00
6.50
7.00
7.50
Dec-19 Jan-20 Feb-20 Mar-20Apr-20 May-20
Jun-20 Jul-20 Aug-20 Sep-20 Oct-20Nov-20
Keppel SP FSSTI Index
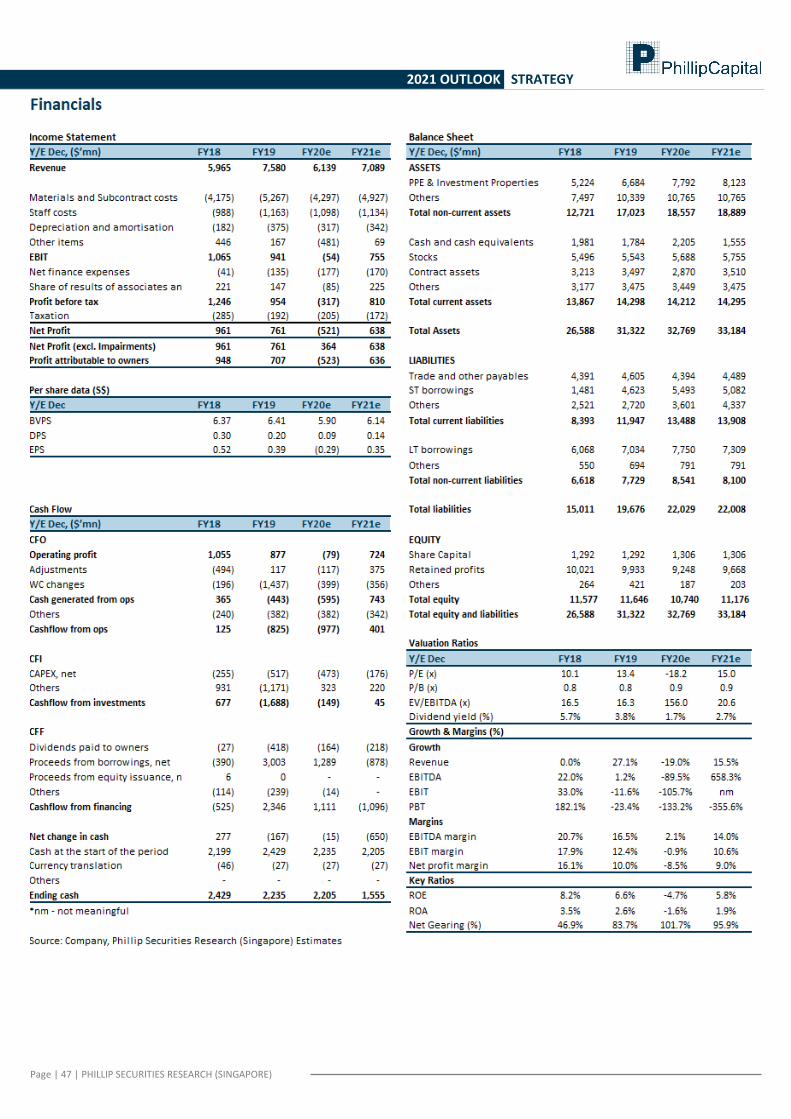
Page | 47 | PHILLIP SECURITIES RESEARCH (SINGAPORE)
2021 OUTLOOK STRATEGY
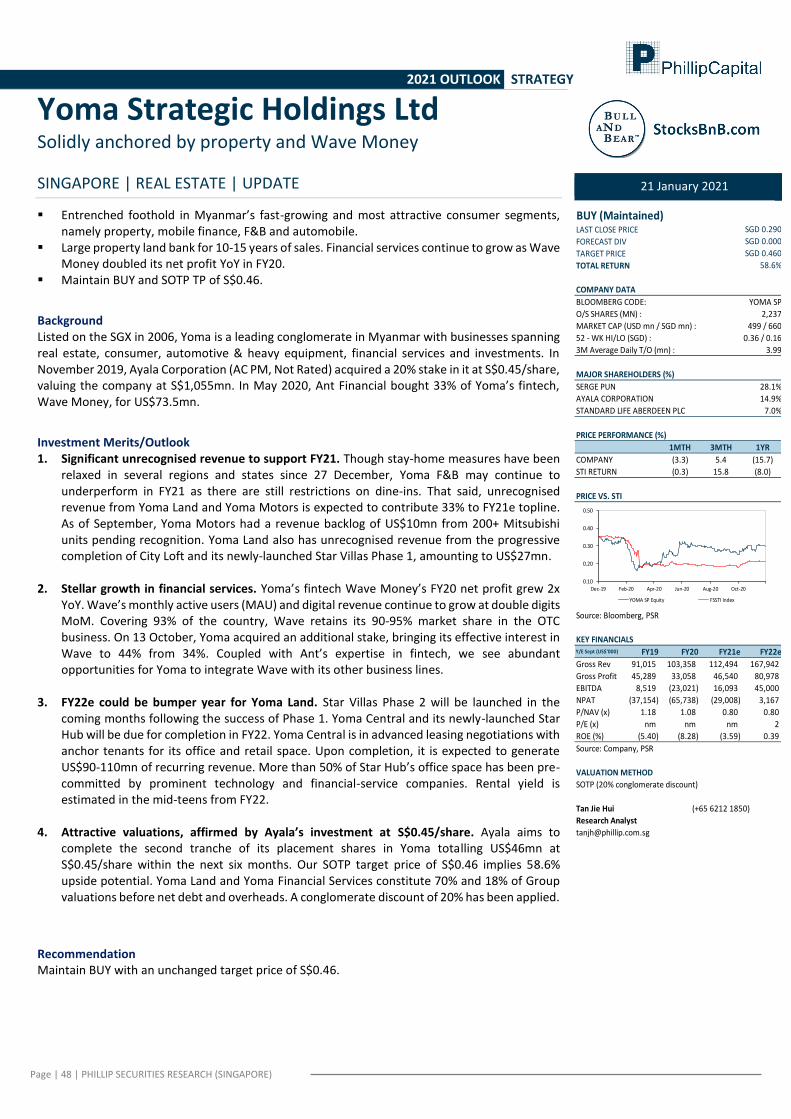
Page | 48 | PHILLIP SECURITIES RESEARCH (SINGAPORE)
2021 OUTLOOK STRATEGY
Yoma Strategic Holdings Ltd Solidly anchored by property and Wave Money
SINGAPORE | REAL ESTATE | UPDATE
21 January 2021
▪ Entrenched foothold in Myanmar’s fast-growing and most attractive consumer segments,
namely property, mobile finance, F&B and automobile. ▪ Large property land bank for 10-15 years of sales. Financial services continue to grow as Wave
Money doubled its net profit YoY in FY20. ▪ Maintain BUY and SOTP TP of S$0.46.
Background Listed on the SGX in 2006, Yoma is a leading conglomerate in Myanmar with businesses spanning real estate, consumer, automotive & heavy equipment, financial services and investments. In November 2019, Ayala Corporation (AC PM, Not Rated) acquired a 20% stake in it at S$0.45/share, valuing the company at S$1,055mn. In May 2020, Ant Financial bought 33% of Yoma’s fintech, Wave Money, for US$73.5mn.
Investment Merits/Outlook 1. Significant unrecognised revenue to support FY21. Though stay-home measures have been
relaxed in several regions and states since 27 December, Yoma F&B may continue to underperform in FY21 as there are still restrictions on dine-ins. That said, unrecognised revenue from Yoma Land and Yoma Motors is expected to contribute 33% to FY21e topline. As of September, Yoma Motors had a revenue backlog of US$10mn from 200+ Mitsubishi units pending recognition. Yoma Land also has unrecognised revenue from the progressive completion of City Loft and its newly-launched Star Villas Phase 1, amounting to US$27mn.
2. Stellar growth in financial services. Yoma’s fintech Wave Money’s FY20 net profit grew 2x YoY. Wave’s monthly active users (MAU) and digital revenue continue to grow at double digits MoM. Covering 93% of the country, Wave retains its 90-95% market share in the OTC business. On 13 October, Yoma acquired an additional stake, bringing its effective interest in Wave to 44% from 34%. Coupled with Ant’s expertise in fintech, we see abundant opportunities for Yoma to integrate Wave with its other business lines.
3. FY22e could be bumper year for Yoma Land. Star Villas Phase 2 will be launched in the coming months following the success of Phase 1. Yoma Central and its newly-launched Star Hub will be due for completion in FY22. Yoma Central is in advanced leasing negotiations with anchor tenants for its office and retail space. Upon completion, it is expected to generate US$90-110mn of recurring revenue. More than 50% of Star Hub’s office space has been pre-committed by prominent technology and financial-service companies. Rental yield is estimated in the mid-teens from FY22.
4. Attractive valuations, affirmed by Ayala’s investment at S$0.45/share. Ayala aims to complete the second tranche of its placement shares in Yoma totalling US$46mn at S$0.45/share within the next six months. Our SOTP target price of S$0.46 implies 58.6% upside potential. Yoma Land and Yoma Financial Services constitute 70% and 18% of Group valuations before net debt and overheads. A conglomerate discount of 20% has been applied.
Recommendation Maintain BUY with an unchanged target price of S$0.46.
BUY (Maintained)LAST CLOSE PRICE
FORECAST DIV
TARGET PRICE
TOTAL RETURN
COMPANY DATA
BLOOMBERG CODE: YOMA SP
O/S SHARES (MN) : 2,237
MARKET CAP (USD mn / SGD mn) : 499 / 660
52 - WK HI/LO (SGD) : 0.36 / 0.16
3M Average Daily T/O (mn) : 3.99
MAJOR SHAREHOLDERS (%)
SERGE PUN 28.1%
AYALA CORPORATION 14.9%
STANDARD LIFE ABERDEEN PLC 7.0%
PRICE PERFORMANCE (%)
1MTH 3MTH 1YR
COMPANY (3.3) 5.4 (15.7)
STI RETURN (0.3) 15.8 (8.0)
PRICE VS. STI
Source: Bloomberg, PSR
KEY FINANCIALSY/E Sept (US$'000) FY19 FY20 FY21e FY22e
Gross Rev 91,015 103,358 112,494 167,942
Gross Profit 45,289 33,058 46,540 80,978
EBITDA 8,519 (23,021) 16,093 45,000
NPAT (37,154) (65,738) (29,008) 3,167
P/NAV (x) 1.18 1.08 0.80 0.80
P/E (x) nm nm nm 2
ROE (%) (5.40) (8.28) (3.59) 0.39
Source: Company, PSR
VALUATION METHOD
SOTP (20% conglomerate discount)
Tan Jie Hui (+65 6212 1850)
Research Analyst
58.6%
SGD 0.290
SGD 0.000
SGD 0.460
0.10
0.20
0.30
0.40
0.50
Dec-19 Feb-20 Apr-20 Jun-20 Aug-20 Oct-20
YOMA SP Equity FSSTI Index
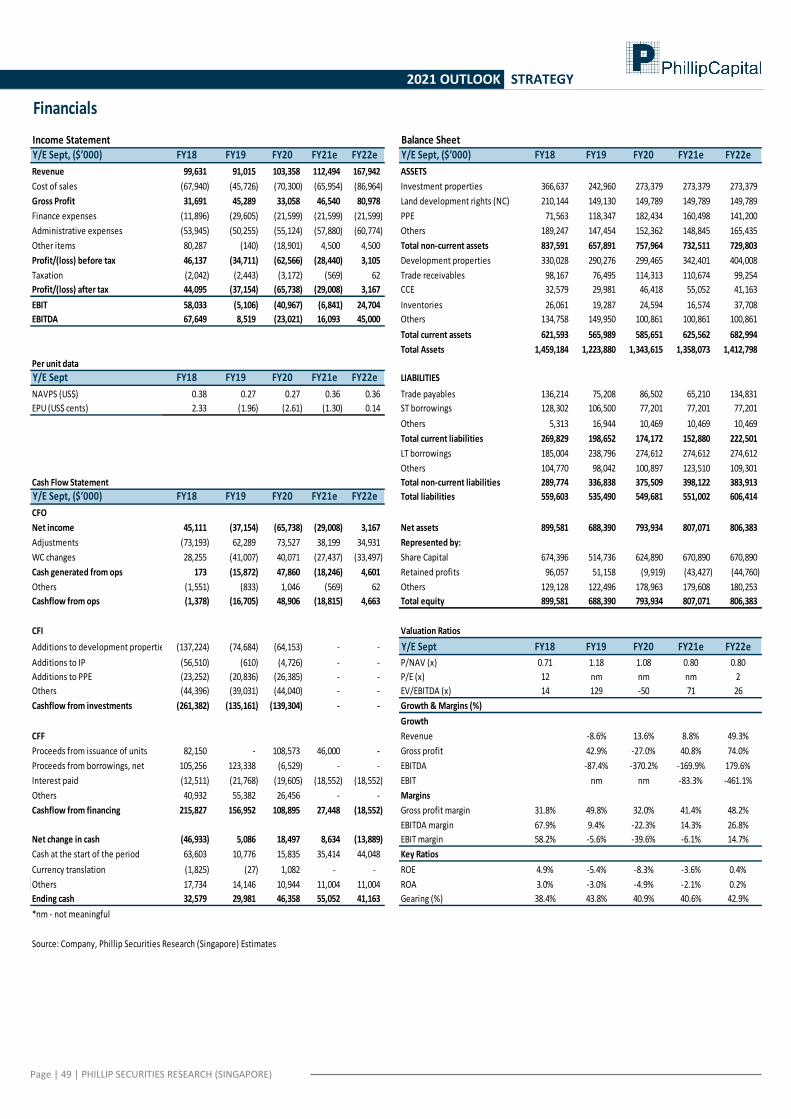
Page | 49 | PHILLIP SECURITIES RESEARCH (SINGAPORE)
2021 OUTLOOK STRATEGY
Financials
Income Statement Balance SheetY/E Sept, ($’000) FY18 FY19 FY20 FY21e FY22e Y/E Sept, ($’000) FY18 FY19 FY20 FY21e FY22e
Revenue 99,631 91,015 103,358 112,494 167,942 ASSETS
Cost of sales (67,940) (45,726) (70,300) (65,954) (86,964) Investment properties 366,637 242,960 273,379 273,379 273,379
Gross Profit 31,691 45,289 33,058 46,540 80,978 Land development rights (NC) 210,144 149,130 149,789 149,789 149,789
Finance expenses (11,896) (29,605) (21,599) (21,599) (21,599) PPE 71,563 118,347 182,434 160,498 141,200
Administrative expenses (53,945) (50,255) (55,124) (57,880) (60,774) Others 189,247 147,454 152,362 148,845 165,435
Other items 80,287 (140) (18,901) 4,500 4,500 Total non-current assets 837,591 657,891 757,964 732,511 729,803
Profit/(loss) before tax 46,137 (34,711) (62,566) (28,440) 3,105 Development properties 330,028 290,276 299,465 342,401 404,008
Taxation (2,042) (2,443) (3,172) (569) 62 Trade receivables 98,167 76,495 114,313 110,674 99,254
Profit/(loss) after tax 44,095 (37,154) (65,738) (29,008) 3,167 CCE 32,579 29,981 46,418 55,052 41,163
EBIT 58,033 (5,106) (40,967) (6,841) 24,704 Inventories 26,061 19,287 24,594 16,574 37,708
EBITDA 67,649 8,519 (23,021) 16,093 45,000 Others 134,758 149,950 100,861 100,861 100,861
Total current assets 621,593 565,989 585,651 625,562 682,994
Total Assets 1,459,184 1,223,880 1,343,615 1,358,073 1,412,798
Per unit data
Y/E Sept FY18 FY19 FY20 FY21e FY22e LIABILITIES
NAVPS (US$) 0.38 0.27 0.27 0.36 0.36 Trade payables 136,214 75,208 86,502 65,210 134,831
EPU (US$ cents) 2.33 (1.96) (2.61) (1.30) 0.14 ST borrowings 128,302 106,500 77,201 77,201 77,201
Others 5,313 16,944 10,469 10,469 10,469
Total current liabilities 269,829 198,652 174,172 152,880 222,501
LT borrowings 185,004 238,796 274,612 274,612 274,612
Others 104,770 98,042 100,897 123,510 109,301
Cash Flow Statement Total non-current liabilities 289,774 336,838 375,509 398,122 383,913
Y/E Sept, ($’000) FY18 FY19 FY20 FY21e FY22e Total liabilities 559,603 535,490 549,681 551,002 606,414
CFO
Net income 45,111 (37,154) (65,738) (29,008) 3,167 Net assets 899,581 688,390 793,934 807,071 806,383
Adjustments (73,193) 62,289 73,527 38,199 34,931 Represented by:
WC changes 28,255 (41,007) 40,071 (27,437) (33,497) Share Capital 674,396 514,736 624,890 670,890 670,890
Cash generated from ops 173 (15,872) 47,860 (18,246) 4,601 Retained profits 96,057 51,158 (9,919) (43,427) (44,760)
Others (1,551) (833) 1,046 (569) 62 Others 129,128 122,496 178,963 179,608 180,253
Cashflow from ops (1,378) (16,705) 48,906 (18,815) 4,663 Total equity 899,581 688,390 793,934 807,071 806,383
CFI Valuation Ratios
Additions to development properties (137,224) (74,684) (64,153) - - Y/E Sept FY18 FY19 FY20 FY21e FY22e
Additions to IP (56,510) (610) (4,726) - - P/NAV (x) 0.71 1.18 1.08 0.80 0.80
Additions to PPE (23,252) (20,836) (26,385) - - P/E (x) 12 nm nm nm 2
Others (44,396) (39,031) (44,040) - - EV/EBITDA (x) 14 129 -50 71 26
Cashflow from investments (261,382) (135,161) (139,304) - - Growth & Margins (%)
Growth
CFF Revenue -8.6% 13.6% 8.8% 49.3%
Proceeds from issuance of units 82,150 - 108,573 46,000 - Gross profit 42.9% -27.0% 40.8% 74.0%
Proceeds from borrowings, net 105,256 123,338 (6,529) - - EBITDA -87.4% -370.2% -169.9% 179.6%
Interest paid (12,511) (21,768) (19,605) (18,552) (18,552) EBIT nm nm -83.3% -461.1%
Others 40,932 55,382 26,456 - - Margins
Cashflow from financing 215,827 156,952 108,895 27,448 (18,552) Gross profit margin 31.8% 49.8% 32.0% 41.4% 48.2%
EBITDA margin 67.9% 9.4% -22.3% 14.3% 26.8%
Net change in cash (46,933) 5,086 18,497 8,634 (13,889) EBIT margin 58.2% -5.6% -39.6% -6.1% 14.7%
Cash at the start of the period 63,603 10,776 15,835 35,414 44,048 Key Ratios
Currency translation (1,825) (27) 1,082 - - ROE 4.9% -5.4% -8.3% -3.6% 0.4%
Others 17,734 14,146 10,944 11,004 11,004 ROA 3.0% -3.0% -4.9% -2.1% 0.2%
Ending cash 32,579 29,981 46,358 55,052 41,163 Gearing (%) 38.4% 43.8% 40.9% 40.6% 42.9%
*nm - not meaningful
Source: Company, Phillip Securities Research (Singapore) Estimates

Page | 50 | PHILLIP SECURITIES RESEARCH (SINGAPORE)
2021 OUTLOOK STRATEGY
Contact Information (Singapore Research Team) Head of Research Research Admin Paul Chew – [email protected] Siti Nursyazwina - [email protected]
Property | REITs Small-Mid Cap Consumer |Industrial Natalie Ong - [email protected] Tan Jie Hui - [email protected] Terence Chua - [email protected] Banking & Finance | Healthcare Small-Mid Cap US Equity Tay Wee Kuang – [email protected] Vivian Ye Qianwei - [email protected] Yeap Jun Rong – [email protected] Technical Analyst Credit Analyst (Bonds) Chua Wei Ren – [email protected] Timothy Ang – [email protected]
Contact Information (Regional Member Companies) SINGAPORE
Phillip Securities Pte Ltd Raffles City Tower
250, North Bridge Road #06-00 Singapore 179101 Tel +65 6533 6001 Fax +65 6535 6631
Website: www.poems.com.sg
MALAYSIA Phillip Capital Management Sdn Bhd
B-3-6 Block B Level 3 Megan Avenue II, No. 12, Jalan Yap Kwan Seng, 50450
Kuala Lumpur Tel +603 2162 8841 Fax +603 2166 5099
Website: www.poems.com.my
HONG KONG Phillip Securities (HK) Ltd
11/F United Centre 95 Queensway Hong Kong
Tel +852 2277 6600 Fax +852 2868 5307
Websites: www.phillip.com.hk
JAPAN
Phillip Securities Japan, Ltd. 4-2 Nihonbashi Kabuto-cho Chuo-ku,
Tokyo 103-0026 Tel +81-3 3666 2101 Fax +81-3 3666 6090
Website: www.phillip.co.jp
INDONESIA PT Phillip Securities Indonesia
ANZ Tower Level 23B, Jl Jend Sudirman Kav 33A Jakarta 10220 – Indonesia
Tel +62-21 5790 0800 Fax +62-21 5790 0809
Website: www.phillip.co.id
CHINA Phillip Financial Advisory (Shanghai) Co Ltd
No 550 Yan An East Road, Ocean Tower Unit 2318,
Postal code 200001 Tel +86-21 5169 9200 Fax +86-21 6351 2940
Website: www.phillip.com.cn
THAILAND Phillip Securities (Thailand) Public Co. Ltd
15th Floor, Vorawat Building, 849 Silom Road, Silom, Bangrak,
Bangkok 10500 Thailand Tel +66-2 6351700 / 22680999
Fax +66-2 22680921 Website www.phillip.co.th
FRANCE King & Shaxson Capital Limited
3rd Floor, 35 Rue de la Bienfaisance 75008 Paris France
Tel +33-1 45633100 Fax +33-1 45636017
Website: www.kingandshaxson.com
UNITED KINGDOM King & Shaxson Capital Limited
6th Floor, Candlewick House, 120 Cannon Street, London, EC4N 6AS
Tel +44-20 7426 5950 Fax +44-20 7626 1757
Website: www.kingandshaxson.com
UNITED STATES Phillip Capital Inc
141 W Jackson Blvd Ste 3050 The Chicago Board of Trade Building
Chicago, IL 60604 USA Tel +1-312 356 9000 Fax +1-312 356 9005
Website: www.phillipusa.com
AUSTRALIA Phillip Capital Limited
Level 10, 330 Collins Street Melbourne, Victoria 3000, Australia
Tel +61-03 8633 9803 Fax +61-03 8633 9899
Website: www.phillipcapital.com.au
CAMBODIA Phillip Bank Plc
Ground Floor of B-Office Centre,#61-64, Norodom Blvd Corner Street 306,Sangkat Boeung Keng Kang 1, Khan Chamkamorn,
Phnom Penh, Cambodia Tel: 855 (0) 7796 6151/855 (0) 1620 0769
Website: www.phillipbank.com.kh
INDIA PhillipCapital (India) Private Limited
No.1, 18th Floor, Urmi Estate 95, Ganpatrao Kadam Marg
Lower Parel West, Mumbai 400-013 Maharashtra, India
Tel: +91-22-2300 2999 / Fax: +91-22-2300 2969 Website: www.phillipcapital.in
TURKEY PhillipCapital Menkul Degerler
Dr. Cemil Bengü Cad. Hak Is Merkezi No. 2 Kat. 6A Caglayan 34403 Istanbul, Turkey
Tel: 0212 296 84 84 Fax: 0212 233 69 29
Website: www.phillipcapital.com.tr
DUBAI Phillip Futures DMCC
Member of the Dubai Gold and Commodities Exchange (DGCX)
Unit No 601, Plot No 58, White Crown Bldg, Sheikh Zayed Road, P.O.Box 212291
Dubai-UAE Tel: +971-4-3325052 / Fax: + 971-4-3328895
Page | 51 | PHILLIP SECURITIES RESEARCH (SINGAPORE)
2021 OUTLOOK STRATEGY
Important Information
This report is prepared and/or distributed by Phillip Securities Research Pte Ltd ("Phillip Securities Research"), which is a holder of a financial adviser’s license under the Financial Advisers Act, Chapter 110 in Singapore.
By receiving or reading this report, you agree to be bound by the terms and limitations set out below. Any failure to comply with these terms and limitations may constitute a violation of law. This report has been provided to you for personal use only and shall not be reproduced, distributed or published by you in whole or in part, for any purpose. If you have received this report by mistake, please delete or destroy it, and notify the sender immediately.
The information and any analysis, forecasts, projections, expectations and opinions (collectively, the “Research”) contained in this report has been obtained from public sources which Phillip Securities Research believes to be reliable. However, Phillip Securities Research does not make any representation or warranty, express or implied that such information or Research is accurate, complete or appropriate or should be relied upon as such. Any such information or Research contained in this report is subject to change, and Phillip Securities Research shall not have any responsibility to maintain or update the information or Research made available or to supply any corrections, updates or releases in connection therewith.
Any opinions, forecasts, assumptions, estimates, valuations and prices contained in this report are as of the date indicated and are subject to change at any time without prior notice. Past performance of any product referred to in this report is not indicative of future results.
This report does not constitute, and should not be used as a substitute for, tax, legal or investment advice. This report should not be relied upon exclusively or as authoritative, without further being subject to the recipient’s own independent verification and exercise of judgment. The fact that this report has been made available constitutes neither a recommendation to enter into a particular transaction, nor a representation that any product described in this report is suitable or appropriate for the recipient. Recipients should be aware that many of the products, which may be described in this report involve significant risks and may not be suitable for all investors, and that any decision to enter into transactions involving such products should not be made, unless all such risks are understood and an independent determination has been made that such transactions would be appropriate. Any discussion of the risks contained herein with respect to any product should not be considered to be a disclosure of all risks or a complete discussion of such risks.
Nothing in this report shall be construed to be an offer or solicitation for the purchase or sale of any product. Any decision to purchase any product mentioned in this report should take into account existing public information, including any registered prospectus in respect of such product.
Phillip Securities Research, or persons associated with or connected to Phillip Securities Research, including but not limited to its officers, directors, employees or persons involved in the issuance of this report, may provide an array of financial services to a large number of corporations in Singapore and worldwide, including but not limited to commercial / investment banking activities (including sponsorship, financial advisory or underwriting activities), brokerage or securities trading activities. Phillip Securities Research, or persons associated with or connected to Phillip Securities Research, including but not limited to its officers, directors, employees or persons involved in the issuance of this report, may have participated in or invested in transactions with the issuer(s) of the securities mentioned in this report, and may have performed services for or solicited business from such issuers. Additionally, Phillip Securities Research, or persons associated with or connected to Phillip Securities Research, including but not limited to its officers, directors, employees or persons involved in the issuance of this report, may have provided advice or investment services to such companies and investments or related investments, as may be mentioned in this report.
Phillip Securities Research or persons associated with or connected to Phillip Securities Research, including but not limited to its officers, directors, employees or persons involved in the issuance of this report may, from time to time maintain a long or short position in securities referred to herein, or in related futures or options, purchase or sell, make a market in, or engage in any other transaction involving such securities, and earn brokerage or other compensation in respect of the foregoing. Investments will be denominated in various currencies including US dollars and Euro and thus will be subject to any fluctuation in exchange rates between US dollars and Euro or foreign currencies and the currency of your own jurisdiction. Such fluctuations may have an adverse effect on the value, price or income return of the investment.
To the extent permitted by law, Phillip Securities Research, or persons associated with or connected to Phillip Securities Research, including but not limited to its officers, directors, employees or persons involved in the issuance of this report, may at any time engage in any of the above activities as set out above or otherwise hold an interest, whether material or not, in respect of companies and investments or related investments, which may be mentioned in this report. Accordingly, information may be available to Phillip Securities Research, or persons associated with or connected to Phillip Securities Research, including but not limited to its officers, directors, employees or persons involved in the issuance of this report, which is not reflected in this report, and Phillip Securities Research, or persons associated with or connected to Phillip Securities Research, including but not limited to its officers, directors, employees or persons involved in the issuance of this report, may, to the extent permitted by law, have acted upon or used the information prior to or immediately following its publication. Phillip Securities Research, or persons associated with or connected to Phillip Securities Research, including but not limited its officers, directors, employees or persons involved in the issuance of this report, may have issued other material that is inconsistent with, or reach different conclusions from, the contents of this report.
The information, tools and material presented herein are not directed, intended for distribution to or use by, any person or entity in any jurisdiction or country where such distribution, publication, availability or use would be contrary to the applicable law or regulation or which would subject Phillip Securities Research to any registration or licensing or other requirement, or penalty for contravention of such requirements within such jurisdiction.
This report is intended for general circulation only and does not take into account the specific investment objectives, financial situation or particular needs of any particular person. The products mentioned in this report may not be suitable for all investors and a person receiving or reading this report should seek advice from a professional and financial adviser regarding the legal, business, financial, tax and other aspects including the suitability of such products, taking into account the specific investment objectives, financial situation or particular needs of that person, before making a commitment to invest in any of such products.
This report is not intended for distribution, publication to or use by any person in any jurisdiction outside of Singapore or any other jurisdiction as Phillip Securities Research may determine in its absolute discretion. IMPORTANT DISCLOSURES FOR INCLUDED RESEARCH ANALYSES OR REPORTS OF FOREIGN RESEARCH HOUSES Where the report contains research analyses or reports from a foreign research house, please note:
i. recipients of the analyses or reports are to contact Phillip Securities Research (and not the relevant foreign research house) in Singapore at 250 North Bridge Road, #06-00 Raffles City Tower, Singapore 179101, telephone number +65 6533 6001, in respect of any matters arising from, or in connection with, the analyses or reports; and
ii. to the extent that the analyses or reports are delivered to and intended to be received by any person in Singapore who is not an accredited investor, expert investor or institutional investor, Phillip Securities Research accepts legal responsibility for the contents of the analyses or reports.
Related Documents