Copyright 2017 | Philippine Engineering Journal Phil. Eng’g J. 2017; 38(2): 1-16 Oscar Victor M. Antonio, Jr. and Dan Mari D.V. Estanislao Institute of Civil Engineering, University of the Philippines, Diliman, Philippines Abstract— This study aims to generate a digital and analytical model of Melchor Hall using the program SAP2000 together with the details obtained from the Melchor Hall as-built plans, 1949 Palma Hall plans which substituted for the original 1949 Melchor Hall plans, and the results obtained from the three non-destructive tests – Rebar Scanning Tests, Schmidt Rebound Hammer Test and Ultrasonic Pulse Velocity Test. These non-destructive tests were conducted to determine the material and section properties primarily targeting the current concrete compressive strength and rebar configuration of the structural members such as beams and columns. The said model was subjected to Nonlinear Static Pushover Analysis while applying dead and live loads prescribed by the National Structural Code of the Philippines 2010 and lateral earthquake loads based on the Uniform Building Code 97. The said analysis monitored 12 joints on the topmost portions of the model along its length to obtain the pushover curves that determined if the structure’s capacity meets its demand. The research showed that analytical models can still be created for old reinforced concrete structures with the help of non-destructive tests. Material properties of old reinforced concrete members were also evaluated using research and non-destructive testing. It was proven through non-destructive testing that the structural elements of both Melchor Hall and Palma Hall are similar. Analysis of the generated analytical model showed that the structure can withstand earthquake loads defined using the UBC 97. However, retrofitting measures are still needed by the structure in order to prevent the formation of plastic hinges that can put the lives of the people occupying the structure at high risk. Keywords—non-destrucive testing; ultrasonic pulse velocity; nonlinear static pushover analysis 1. INTRODUCTION Old structures, especially those with ages greater than fifty years, pose a great threat to their occupants. Therefore, analysis of these old structures is quite important to determine whether they can or cannot withstand the effects of different natural calamities such as earthquakes. Melchor Hall (Figure 1), one of the oldest structures in the University of the Philippines Diliman, is still used as the main building of the College of Engineering and is occupied by several hundred people including students, professors, and administration staff. It is approximately 2.0 kilometers from the West Valley Fault – a seismic source type A that can generate an earthquake with a magnitude of 7.0 or higher. Hairline cracks are currently visible in the structure which may be an indication of the effects of seismic activities to the structure. Therefore, it is critical that the structure is assessed and analyzed to determine if it has the strength and capacity to withstand any loads or forces generated by earthquakes in order to lessen the risk to those occupying the structure. Unfortunately, the structural plans of the building no longer exist. Thus, the use of non-destructive tests together with the plans of its twin structure is the only way in determining the properties of the different structural members and materials that are necessary for the analysis and assessment of the structure. PHILIPPINE ENGINEERING JOURNAL PEJ 2017; Vol. 38, No. 2: 1-16 Analytical Modelling of Melchor Hall Using Non-Destructive Tests

Welcome message from author
This document is posted to help you gain knowledge. Please leave a comment to let me know what you think about it! Share it to your friends and learn new things together.
Transcript

1
Copyright 2017 | Philippine Engineering Journal Phil. Eng’g J. 2017; 38(2): 1-16
ANALYTICAL MODELLING OF MELCHOR HALL USING NON-DESTRUCTIVE TESTS
.
Oscar Victor M. Antonio, Jr. and Dan Mari D.V. Estanislao Institute of Civil Engineering,
University of the Philippines, Diliman, Philippines
Abstract— This study aims to generate a digital and analytical model of Melchor Hall using the program SAP2000 together
with the details obtained from the Melchor Hall as-built plans, 1949 Palma Hall plans which substituted for the original 1949
Melchor Hall plans, and the results obtained from the three non-destructive tests – Rebar Scanning Tests, Schmidt Rebound
Hammer Test and Ultrasonic Pulse Velocity Test. These non-destructive tests were conducted to determine the material and
section properties primarily targeting the current concrete compressive strength and rebar configuration of the structural
members such as beams and columns. The said model was subjected to Nonlinear Static Pushover Analysis while applying dead
and live loads prescribed by the National Structural Code of the Philippines 2010 and lateral earthquake loads based on the
Uniform Building Code 97. The said analysis monitored 12 joints on the topmost portions of the model along its length to obtain
the pushover curves that determined if the structure’s capacity meets its demand. The research showed that analytical models can
still be created for old reinforced concrete structures with the help of non-destructive tests. Material properties of old reinforced
concrete members were also evaluated using research and non-destructive testing. It was proven through non-destructive testing
that the structural elements of both Melchor Hall and Palma Hall are similar. Analysis of the generated analytical model showed
that the structure can withstand earthquake loads defined using the UBC 97. However, retrofitting measures are still needed by the
structure in order to prevent the formation of plastic hinges that can put the lives of the people occupying the structure at high
risk.
Keywords—non-destrucive testing; ultrasonic pulse velocity; nonlinear static pushover analysis
1. INTRODUCTION
Old structures, especially those with ages greater than fifty years, pose a great threat to their
occupants. Therefore, analysis of these old structures is quite important to determine whether they can or cannot withstand the effects of different natural calamities such as earthquakes. Melchor Hall (Figure 1), one of the oldest structures in the University of the Philippines Diliman, is still used as the main building of the College of Engineering and is occupied by several hundred people including students, professors, and administration staff. It is approximately 2.0 kilometers from the West Valley Fault – a seismic source type A that can generate an earthquake with a magnitude of 7.0 or higher. Hairline cracks are currently visible in the structure which may be an indication of the effects of seismic activities to the structure. Therefore, it is critical that the structure is assessed and analyzed to determine if it has the strength and capacity to withstand any loads or forces generated by earthquakes in order to lessen the risk to those occupying the structure. Unfortunately, the structural plans of the building no longer exist. Thus, the use of non-destructive tests together with the plans of its twin structure is the only way in determining the properties of the different structural members and materials that are necessary for the analysis and assessment of the structure.
PHILIPPINE ENGINEERING JOURNAL
PEJ 2017; Vol. 38, No. 2: 1-16
Analytical Modelling of Melchor Hall Using
Non-Destructive Tests

2
Copyright 2017 | Philippine Engineering Journal Phil. Eng’g J. 2017; 38(2): 1-16
O. V. M. Antonio, Jr. and D. M. D.V. Estanislao
Figure 1. Melchor Hall (by Oscar Victor M. Antonio, Jr.)
This study aims to generate a digital and analytical model for Melchor Hall using the program
SAP2000 by Computers and Structures, Incorporated. Specifically, this study aims to determine the structural capacity, current concrete compressive strength and reinforcement bar configuration of the different beams and columns of Melchor Hall using Non-Destructive Tests (NDT). The PUNDIT Lab (Portable Ultrasonic Non-destructive Digital Indicating Tester) will be used for Ultrasonic Pulse Velocity Tests; the Profometer 5+ for Rebar Scanning Test; and the Silver Schmidt for Rebound Hammer Test. This study analyzes the Melchor Hall model when subjected to loads and identifies the critical sections of the structure. Lastly, this study aims to provide an assessment of Melchor Hall by conducting Static Pushover Analysis in SAP2000. This study can serve as a basis for determining whether Melchor Hall needs retrofitting measures or not. Also, this study can serve as a reference for further studies and analyses of other old structures in the country especially in the University of the Philippines such as the Palma Hall, Benitez Hall, and Malcolm Hall.
Non-destructive tests are quite famous for their ability to evaluate and assess the condition of a
structure and to determine the properties of its structural members without inflicting severe damage to the structure. Among all of the non-destructive tests used worldwide, there are three tests that are quite famous for their ability to easily determine or detect the important material properties of structural members that are needed for the analysis and evaluation of the structure. These three are the Schmidt Rebound Hammer Test, Ultrasonic Pulse Velocity Test and Rebar Scanning Test (Figure 2).
Figure 2. Non-destructive testing instruments:
2a. Schmidt Rebound Hammer test; 2b. Ultrasonic Pulse Velocity test; 2c. Rebar Scanning test
2a.
2b.
2c.

3
Copyright 2017 | Philippine Engineering Journal Phil. Eng’g J. 2017; 38(2): 1-16
ANALYTICAL MODELLING OF MELCHOR HALL USING NON-DESTRUCTIVE TESTS
The Schmidt Rebound Hammer Test determines the surface hardness of the concrete which is a parameter that helps in the determination of the compressive strength of the concrete. It works on the principle that the rebound of an elastic mass depends on the hardness of the surface against which the mass impinges. Though, there is little apparent theoretical relationship between the strength of concrete and the rebound number of the hammer [1]. NDT tools such as the Rebound Hammer is heavily affected by the properties of the concrete surface. Therefore, the surface of the concrete samples that will be tested by this method requires to be cleaned from external materials such as claddings and paints. In order to have a more precise and accurate results, scraping some part of the concrete cover is recommended. However, the authors were not given permission to remove the concrete cover and paint of the structural members tested. The surfaces were cleaned and tested without altering the physical appearance.
The Ultrasonic Pulse Velocity Test has the ability to determine the mechanical properties of
concrete including its compressive strength, Poisson’s ratio and modulus of elasticity. In this test, a pulse of longitudinal vibrations is produced by an electro-acoustical transducer, which is held in contact with one surface of the concrete under test. When the pulse generated is transmitted into the concrete from the transducer using a liquid coupling material such as grease or cellulose paste, it undergoes multiple reflections and refractions at the boundaries of the different material phases within the concrete. A complex system of elastic stress waves develops, which include both longitudinal (also known as P-wave) and shear waves (also known as S-wave), and propagates through the concrete. The first elastic waves to reach the receiving transducer are the longitudinal waves, which are converted into an electrical signal by a second electro-acoustical transducer [1]. There are three different set-ups for the said test which depends on the location of the transducers, the transmitter and the receiver. The test is direct when the concrete sample being tested is between the transducers, indirect when the transducers are placed side-by-side in the same side of the concrete sample and semi-direct when the transducers are placed in two faces of the concrete sample forming a right angle. Indirect test are commonly used when the other side of a concrete sample is not accessible. The frequency that will be used in ultrasonic pulse velocity test depends on the concrete sample. It is preferable to use high frequency transducers for short path lengths and low frequency transducers for long path lengths. High frequency pulses have a well-defined onset but, as they pass through the concrete, become attenuated more rapidly than pulses of lower frequency.
The Rebar Scanning Test detects the presence of steel reinforcing bars and steel sections inside the
reinforced concrete and composite members, respectively. It also determines the depth of the concrete cover and diameter of these reinforcing bars. This test uses a covermeter which utilizes the effects of eddy current. Currents in a search coil set up eddy currents in the reinforcement which in turn cause a change in the measured impedance of the search coil. Instruments working on this principle operate at frequencies above 1 kHz and are thus sensitive to the presence of any conducting metal in the vicinity of the search head [1].
2. METHODOLOGY In creating the analytical model of a structure, one must determine first the general details of the
structure. Details such as the general design and plan of the structure are necessary in order to layout the necessary nodes to be defined in the model. These can be obtained from plans used in creating the structure specifically its construction, architectural, structural and as-built plans. Details can be checked and verified through manual measurements and reconnaissance which also provides additional details of the structure. Structural members such as beams, columns, slabs and walls are to be defined in the model so its dimensions, positions and connections must be determined from the plans. Specific details of the structural members such as reinforcing bar diameters, spacing and concrete covers are required in the
4
Copyright 2017 | Philippine Engineering Journal Phil. Eng’g J. 2017; 38(2): 1-16
O. V. M. Antonio, Jr. and D. M. D.V. Estanislao
model. After gathering these sets of data, one can now define the axes, determine section and material properties and assign node positions in the model.
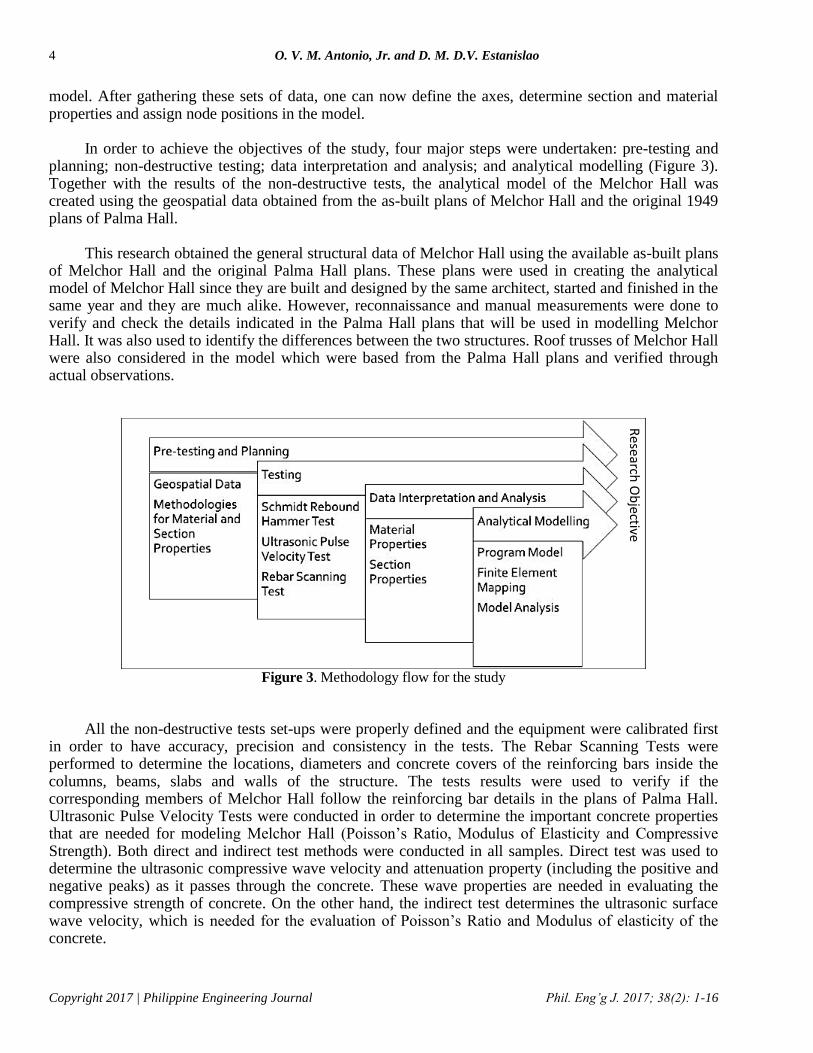
In order to achieve the objectives of the study, four major steps were undertaken: pre-testing and
planning; non-destructive testing; data interpretation and analysis; and analytical modelling (Figure 3). Together with the results of the non-destructive tests, the analytical model of the Melchor Hall was created using the geospatial data obtained from the as-built plans of Melchor Hall and the original 1949 plans of Palma Hall.
This research obtained the general structural data of Melchor Hall using the available as-built plans
of Melchor Hall and the original Palma Hall plans. These plans were used in creating the analytical model of Melchor Hall since they are built and designed by the same architect, started and finished in the same year and they are much alike. However, reconnaissance and manual measurements were done to verify and check the details indicated in the Palma Hall plans that will be used in modelling Melchor Hall. It was also used to identify the differences between the two structures. Roof trusses of Melchor Hall were also considered in the model which were based from the Palma Hall plans and verified through actual observations.
Figure 3. Methodology flow for the study
All the non-destructive tests set-ups were properly defined and the equipment were calibrated first
in order to have accuracy, precision and consistency in the tests. The Rebar Scanning Tests were performed to determine the locations, diameters and concrete covers of the reinforcing bars inside the columns, beams, slabs and walls of the structure. The tests results were used to verify if the corresponding members of Melchor Hall follow the reinforcing bar details in the plans of Palma Hall. Ultrasonic Pulse Velocity Tests were conducted in order to determine the important concrete properties that are needed for modeling Melchor Hall (Poisson’s Ratio, Modulus of Elasticity and Compressive Strength). Both direct and indirect test methods were conducted in all samples. Direct test was used to determine the ultrasonic compressive wave velocity and attenuation property (including the positive and negative peaks) as it passes through the concrete. These wave properties are needed in evaluating the compressive strength of concrete. On the other hand, the indirect test determines the ultrasonic surface wave velocity, which is needed for the evaluation of Poisson’s Ratio and Modulus of elasticity of the concrete.
Rese
arch O
bjective
5
Copyright 2017 | Philippine Engineering Journal Phil. Eng’g J. 2017; 38(2): 1-16
ANALYTICAL MODELLING OF MELCHOR HALL USING NON-DESTRUCTIVE TESTS
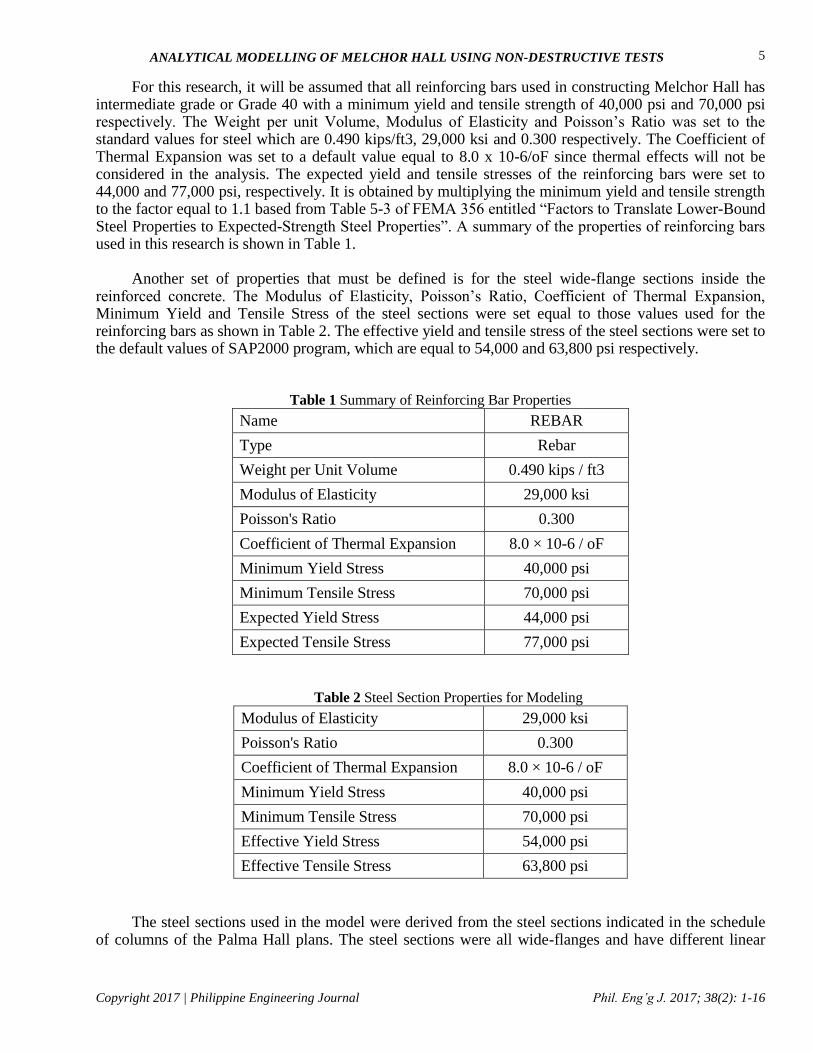
For this research, it will be assumed that all reinforcing bars used in constructing Melchor Hall has intermediate grade or Grade 40 with a minimum yield and tensile strength of 40,000 psi and 70,000 psi respectively. The Weight per unit Volume, Modulus of Elasticity and Poisson’s Ratio was set to the standard values for steel which are 0.490 kips/ft3, 29,000 ksi and 0.300 respectively. The Coefficient of Thermal Expansion was set to a default value equal to 8.0 x 10⁻⁶/oF since thermal effects will not be considered in the analysis. The expected yield and tensile stresses of the reinforcing bars were set to 44,000 and 77,000 psi, respectively. It is obtained by multiplying the minimum yield and tensile strength to the factor equal to 1.1 based from Table 5-3 of FEMA 356 entitled “Factors to Translate Lower-Bound Steel Properties to Expected-Strength Steel Properties”. A summary of the properties of reinforcing bars used in this research is shown in Table 1.
Another set of properties that must be defined is for the steel wide-flange sections inside the
reinforced concrete. The Modulus of Elasticity, Poisson’s Ratio, Coefficient of Thermal Expansion, Minimum Yield and Tensile Stress of the steel sections were set equal to those values used for the reinforcing bars as shown in Table 2. The effective yield and tensile stress of the steel sections were set to the default values of SAP2000 program, which are equal to 54,000 and 63,800 psi respectively.
Table 1 Summary of Reinforcing Bar Properties
Name REBAR
Type Rebar
Weight per Unit Volume 0.490 kips / ft3
Modulus of Elasticity 29,000 ksi
Poisson's Ratio 0.300
Coefficient of Thermal Expansion 8.0 × 10⁻⁶ / oF
Minimum Yield Stress 40,000 psi
Minimum Tensile Stress 70,000 psi
Expected Yield Stress 44,000 psi
Expected Tensile Stress 77,000 psi
Table 2 Steel Section Properties for Modeling
Modulus of Elasticity 29,000 ksi
Poisson's Ratio 0.300
Coefficient of Thermal Expansion 8.0 × 10⁻⁶ / oF
Minimum Yield Stress 40,000 psi
Minimum Tensile Stress 70,000 psi
Effective Yield Stress 54,000 psi
Effective Tensile Stress 63,800 psi
The steel sections used in the model were derived from the steel sections indicated in the schedule
of columns of the Palma Hall plans. The steel sections were all wide-flanges and have different linear
6
Copyright 2017 | Philippine Engineering Journal Phil. Eng’g J. 2017; 38(2): 1-16
O. V. M. Antonio, Jr. and D. M. D.V. Estanislao
masses. Therefore, the weight per unit volume of the steel sections entered in the model was evaluated from the different linear mass of the steel sections in the Palma Hall plans.
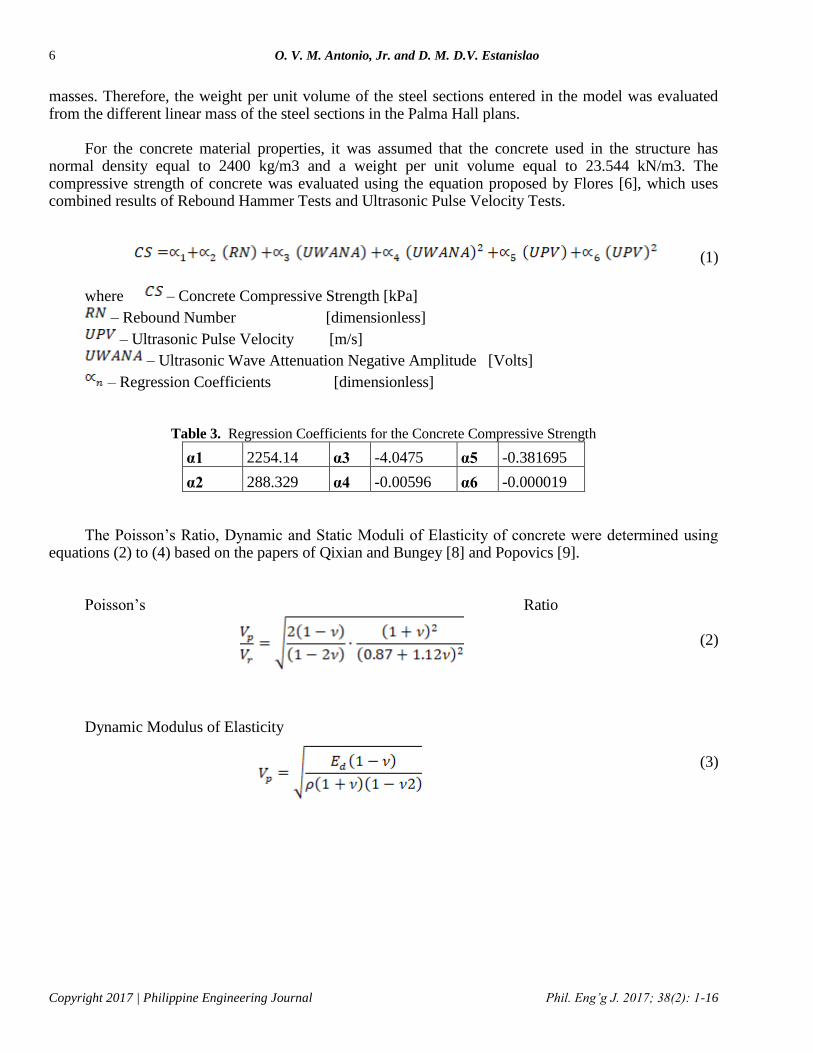
For the concrete material properties, it was assumed that the concrete used in the structure has
normal density equal to 2400 kg/m3 and a weight per unit volume equal to 23.544 kN/m3. The compressive strength of concrete was evaluated using the equation proposed by Flores [6], which uses combined results of Rebound Hammer Tests and Ultrasonic Pulse Velocity Tests.
(1)
where – Concrete Compressive Strength [kPa]
– Rebound Number [dimensionless]
– Ultrasonic Pulse Velocity [m/s]
– Ultrasonic Wave Attenuation Negative Amplitude [Volts]
– Regression Coefficients [dimensionless]
Table 3. Regression Coefficients for the Concrete Compressive Strength
α1 2254.14 α3 -4.0475 α5 -0.381695
α2 288.329 α4 -0.00596 α6 -0.000019
The Poisson’s Ratio, Dynamic and Static Moduli of Elasticity of concrete were determined using
equations (2) to (4) based on the papers of Qixian and Bungey [8] and Popovics [9]. Poisson’s Ratio
(2) Dynamic Modulus of Elasticity
(3)

7
Copyright 2017 | Philippine Engineering Journal Phil. Eng’g J. 2017; 38(2): 1-16
ANALYTICAL MODELLING OF MELCHOR HALL USING NON-DESTRUCTIVE TESTS
Static Modulus of Elasticity
(4)
where – Poisson’s Ratio
– constant equal to 0.23
– Compressive Wave Velocity (54 kHz)
– Surface Wave Velocity (54 kHz)
– Static Modulus of Elasticity of Concrete
– Dynamic Modulus of Elasticity of Concrete
– Density of Concrete
The analytical model of Melchor Hall was created using SAP2000 since this program has a
“Section Designer” function which enables its user to manipulate the entire cross section of the structural members. Furthermore, this function enables its user to adjust the dimensions, shape and size of the reinforced concrete section and adjust the rebar pattern freely.
The first step in creating the analytical model of the structure is the definition of the coordinate
systems, materials, sections and area sections. The coordinate system defines the locations of the structural nodes that signify the connections of the frame system of the structure. Due to the irregular shape of Melchor Hall (both in plan and elevation), especially the Library and Theater, several coordinate systems were utilized in creating the model. The coordinate axes were evaluated using the measurements in English units used in the original Palma Hall plan. Distances between columns, lengths of beams, and distances between each floor were considered in the coordinate axes. The materials for reinforcing bars, concrete, steel sections and wood were defined using the “Material Property Data” from in the Define Menu under the Materials Section of the program.
For the definition of section properties, steel wide flange and pipe sections must be imported first
from the AISC 13 database stored in the program and the reinforcing bar dimensions must also be defined. All beams, columns and truss elements were defined as sections and were all based from the Palma Hall plans except for Column 00 (C-00) which was based from the results of non-destructive tests. It should be noted that Column 00 (C-00) refers to the circular columns found at the ground floor of Melchor Hall, which do not exist in Palma Hall. Also, it is important to note that beams with different designs for the support and center portions were defined separately, which were denoted with the “-s” and “-c” in the last portion of the defined names.
Slabs and walls were modeled as area section using the “Shell Section Layer Definition Form” as
layered and nonlinear shell sections. In-plane and out-of-plane components were set to have nonlinear behavior. Also, layers of reinforcing bars were modeled in the shell area sections. In addition, all shear walls and all walls that can resist lateral forces along the global y-direction were modeled. Details of the area sections were obtained from the Palma Hall plans.
For second-order analysis, material on linearity, member curvature and lateral drift, duration of
loads, shrinkage and creep, and interaction with the supporting foundation must be considered. Therefore, stiffness modification factors were applied to the moments of inertia of the columns, beams, slabs and walls equal to 0.70, 0.35, 0.27, and 0.70 respectively, which are based on Section 410.12.3 of NSCP 2010
8
Copyright 2017 | Philippine Engineering Journal Phil. Eng’g J. 2017; 38(2): 1-16
O. V. M. Antonio, Jr. and D. M. D.V. Estanislao
for Magnified Moments in Nonlinear Second-Order Analysis. All columns were set to have pinned supports.
After defining all coordinate axes, material properties, frame sections, and area sections, all beams,
columns, slabs, walls and trusses were made by connecting joints using the coordinate axes and the “Draw Frame/Cable”, “Draw Poly Area” and “Draw Rectangular Area” tools. In drawing the frame system, the line object type was set to “Straight Frame” and moment releases to “Continuous” always while the section differs depending on the member being drawn. The primary basis for drawing the frame and area sections were the floor framing plans in the 1949 Palma Hall plans. The second floor framing plan was used for the third and second floor of the Melchor hall model. After drawing all frame and area sections, the joints connected to the supports were selected and assigned with restraints for the translation to x, y and z-axes.
The structural analysis takes part after the completion of the model. However, for this research the
roof trusses were analyzed separately. The trusses were assumed to have pinned and fixed supports, and the support reactions obtained from the truss analysis were applied as point loads to the frame system of the model for analysis.
Four load patterns were defined for the analysis of Melchor Hall. The first load pattern is the Dead
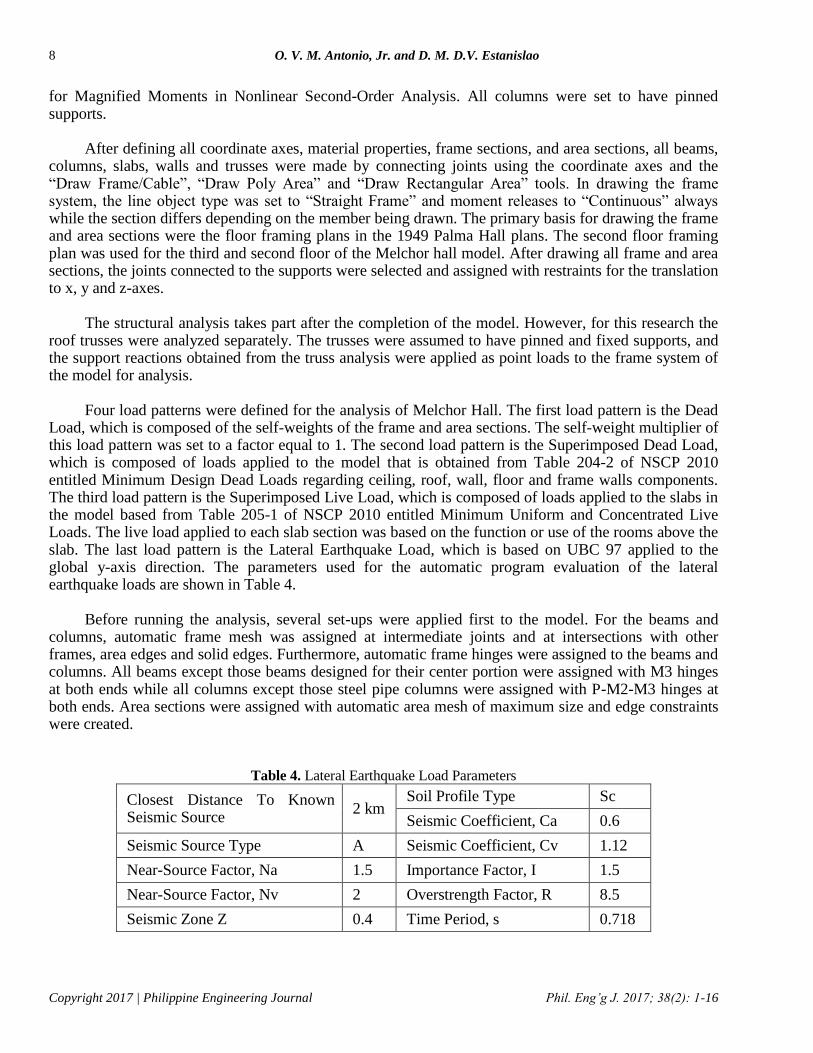
Load, which is composed of the self-weights of the frame and area sections. The self-weight multiplier of this load pattern was set to a factor equal to 1. The second load pattern is the Superimposed Dead Load, which is composed of loads applied to the model that is obtained from Table 204-2 of NSCP 2010 entitled Minimum Design Dead Loads regarding ceiling, roof, wall, floor and frame walls components. The third load pattern is the Superimposed Live Load, which is composed of loads applied to the slabs in the model based from Table 205-1 of NSCP 2010 entitled Minimum Uniform and Concentrated Live Loads. The live load applied to each slab section was based on the function or use of the rooms above the slab. The last load pattern is the Lateral Earthquake Load, which is based on UBC 97 applied to the global y-axis direction. The parameters used for the automatic program evaluation of the lateral earthquake loads are shown in Table 4.
Before running the analysis, several set-ups were applied first to the model. For the beams and
columns, automatic frame mesh was assigned at intermediate joints and at intersections with other frames, area edges and solid edges. Furthermore, automatic frame hinges were assigned to the beams and columns. All beams except those beams designed for their center portion were assigned with M3 hinges at both ends while all columns except those steel pipe columns were assigned with P-M2-M3 hinges at both ends. Area sections were assigned with automatic area mesh of maximum size and edge constraints were created.
Table 4. Lateral Earthquake Load Parameters
Closest Distance To Known Seismic Source
2 km Soil Profile Type Sc
Seismic Coefficient, Ca 0.6
Seismic Source Type A Seismic Coefficient, Cv 1.12
Near-Source Factor, Na 1.5 Importance Factor, I 1.5
Near-Source Factor, Nv 2 Overstrength Factor, R 8.5
Seismic Zone Z 0.4 Time Period, s 0.718
9
Copyright 2017 | Philippine Engineering Journal Phil. Eng’g J. 2017; 38(2): 1-16
ANALYTICAL MODELLING OF MELCHOR HALL USING NON-DESTRUCTIVE TESTS
Two load cases were defined for the analysis. The first one is the Earthquake Load Case, which is linear static. The load applied in this load case were dead, superimposed dead, superimposed live and earthquake loads with scale factors equal to 1.2, 1.2, 1.6 and 1, respectively. The results of this load case were the basis of the monitored displacement for the nonlinear static load case named Pushover. This nonlinear load case has the same applied loads and displacement controlled with a monitored displacement equal to 50 millimeters at the degree of freedom U2 at different joints. Also, the saved results were in multiple states of at least 10 steps. The hinge unloading method was set to “Restart Using Secant Stiffness” and maximum total and null steps per stage equal to 500 for longer analysis. Lastly, the iteration convergence relative tolerance was set to 0.01 and the other settings were set to their default values.
In running the analysis, the advanced solver and automatic analysis process was used. All available
degrees of freedom were applied for the space frame model. The Earthquake Load Case was run first and the results of this analysis were the basis for the selection of the monitored joints for the Pushover Load Case. Ten points were monitored for the nonlinear static pushover analysis and their Resultant Base Shear vs. Monitored Displacement graphs and ATC-40 Capacity Spectrum were obtained for interpretation of results.
3. RESULTS
3.1 Non-destructive tests
For the calibration of Profometer 5+, which was used for the rebar scanning tests, the researchers obtained samples of reinforced concrete with varying concrete covers and bar diameters and used the equipment at different settings. The different settings included inputting different assumed rebar diameter and concrete covers in the rebar scanner as indicated in the study made by Cruz (2012). After the tests, linear and polynomial regressions were used to determine which setting obtained the highest R-squared value for concrete cover and rebar diameter measurements. Based on the results, the actual concrete cover and bar diameter of the reinforcing bar can be best evaluated using the linear equations shown below:
For measuring the actual concrete cover of a bar, use the equation below.
(5)
where – measured concrete cover of the equipment
– actual concrete cover of the bar
For measuring the actual diameter of a bar, use the following equation.
(6)
where – measured bar diameter of the equipment
– actual diameter of the bar The first set of data obtained from the rebar scanning tests was the determination of the number of
reinforcing bars used for Column-00 (C-00) of the model, which are located at the first floor of the

10
Copyright 2017 | Philippine Engineering Journal Phil. Eng’g J. 2017; 38(2): 1-16
O. V. M. Antonio, Jr. and D. M. D.V. Estanislao
structure. After plotting the detected reinforcing bars around half of the circumference of the column, it can be observed that six groups of data are close to each other (Figure 4). Therefore, it can be said that there are a total of 12 bars around the circumference of the cylindrical column.
The second set of data obtained from the rebar scanning tests was the reinforcing bar pattern for
Column 01 – the trapezoidal shaped column. The rebar scanning tests were conducted to the seventeen samples of this type along the 2nd floor hallway. After obtaining all the data, the frequency of detected bars along the length of the front and side of the columns were plotted. Based on the Palma Hall plans, this type of column was made out of two parts, a column and a box wall. The structural column has three longitudinal steel bars on each opposite sides (left and right) and four longitudinal steel bars on the front (Figure 5). Comparing the results obtained from the rebar scanning test and the details presented in the Palma Hall plans, it can be seen that they look almost the same especially the structural column part. In addition, the dimensions of the columns and the distances between the columns were the same. Thus, it can be said that the Melchor Hall plans also followed the details of the Palma Hall plans.
Figure 4. Concentration of reinforcing bars detection using NDT for Column 00 (C-00)
Figure 5. Comparison of Column 01 Details from NDT results (left) vs Palma Hall Plans (right)
The rebound hammer tests were conducted at different columns of the whole structure while the
ultrasonic pulse velocity tests were conducted at the cylindrical columns of the first floor hallway. The
11
Copyright 2017 | Philippine Engineering Journal Phil. Eng’g J. 2017; 38(2): 1-16
ANALYTICAL MODELLING OF MELCHOR HALL USING NON-DESTRUCTIVE TESTS
average rebound number obtained from all the tested columns is 48 while the average ultrasonic pulse velocity is equal to 3,494 m/s and the average ultrasonic wave attenuation negative amplitude is equal to 83 V. Using the results of the two non-destructive tests and Equation 1, the concrete compressive strength was estimated to be equal to 14.615 MPa or 2,120 psi. This estimated compressive strength of concrete was valid since it was greater than the default lower-bound compressive strength of structural concrete for the year 1949, which is equal to 2000 psi as indicated in Table 6-3 of FEMA 356. 3.2 Analytical Modelling
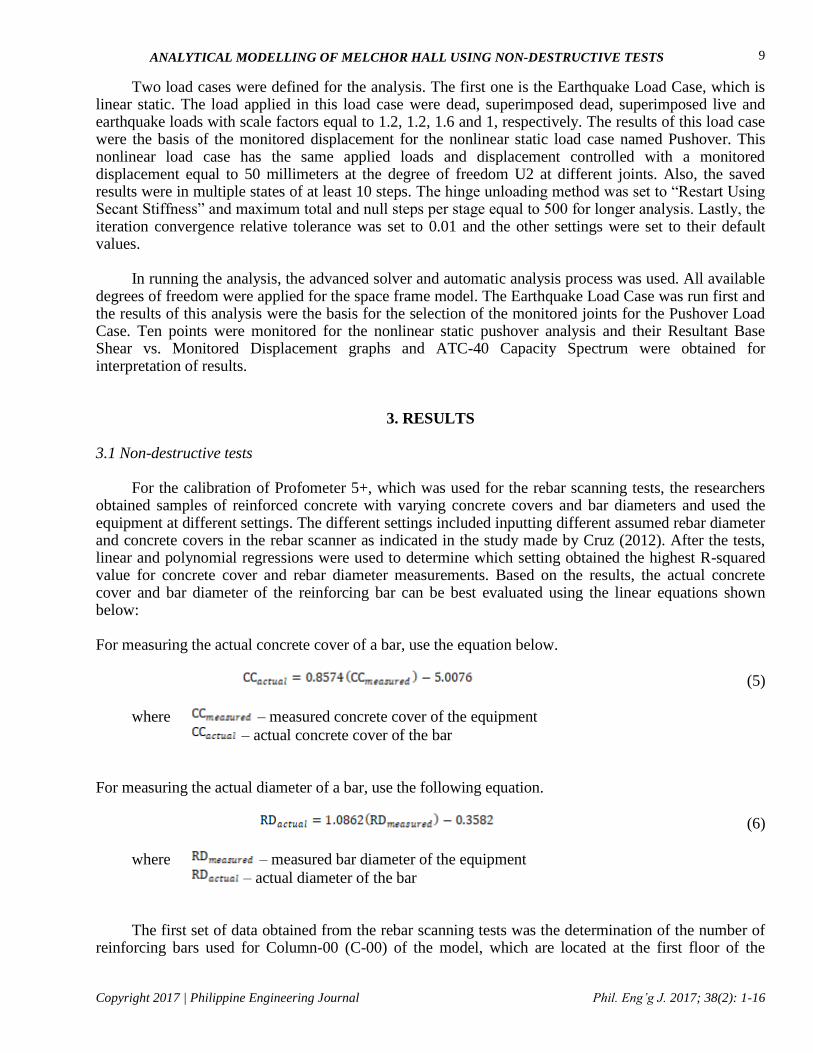
After drawing all the necessary frame and area sections, Figure 6 shows the analytical model for Melchor Hall including the roof trusses (Figure 7). The analysis of the analytical model was divided into two parts. The first part was the analysis of the roof truss system while the second part was the analysis of the frame system. The analysis of the truss system was conducted separately for the dead and live loads. The support reactions obtained in the roof truss analysis were applied as loads to the frame system.
Figure 6. Melchor Hall analytical model

12
Copyright 2017 | Philippine Engineering Journal Phil. Eng’g J. 2017; 38(2): 1-16
O. V. M. Antonio, Jr. and D. M. D.V. Estanislao
Figure 7. Truss analysis results with dead loads
The frame analysis starts with the static linear analysis to determine the points that will be
monitored at a displacement of 50 millimeters for the nonlinear static pushover analysis (Figure 8). Other points were monitored based on their locations along the length of the structure.
Figure 8. Twelve points for nonlinear static pushover analysis
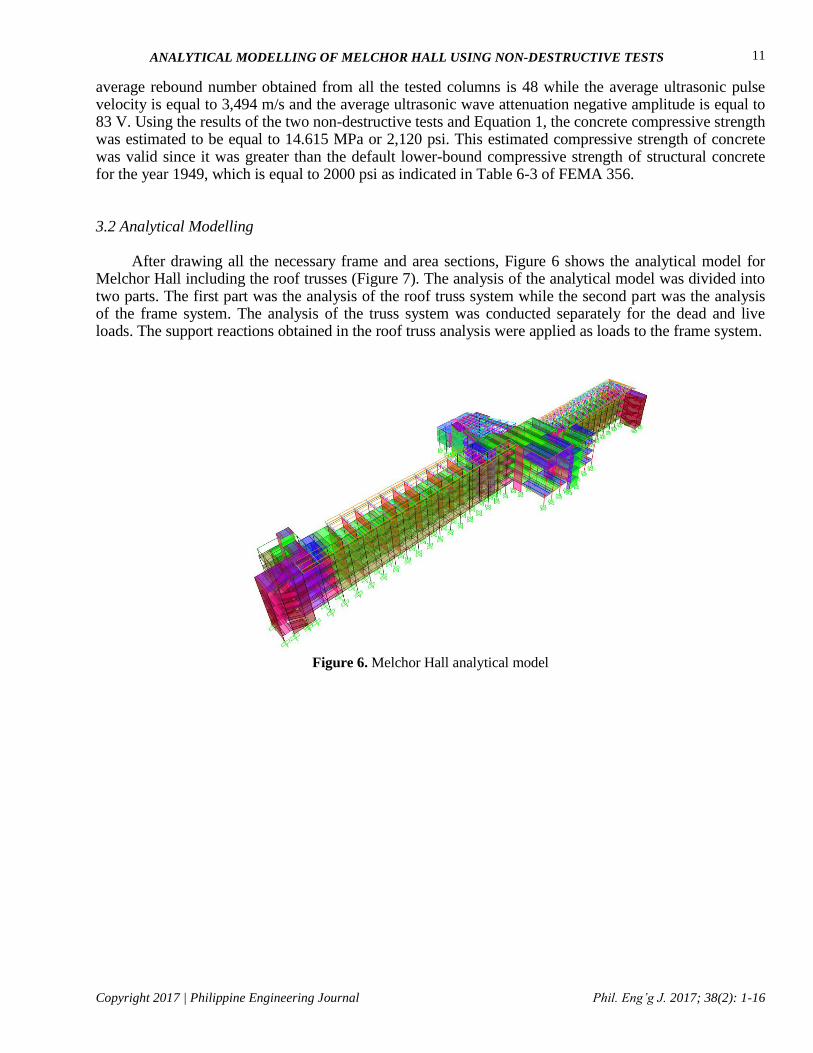
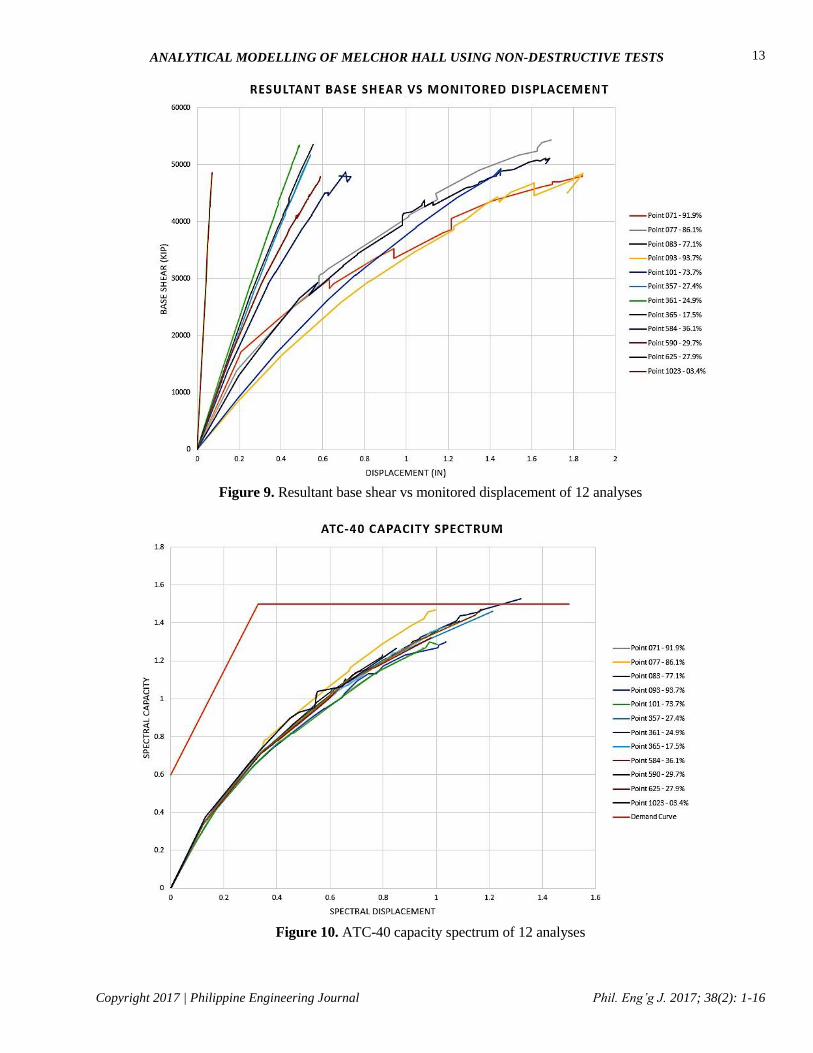
After the analysis, two sets of pushover curves were obtained from the results generated by the
program. The Resultant Base Shear vs. Monitored Displacement Curve (Figure 9) shows that the monitored joints with low displacements in the linear static analysis behaved elastically as it was pushed to the monitored displacement equal to 50 millimeters while those monitored joints with high displacements in the linear static analysis achieved nonlinear behavior. On the other hand, Figure 10 shows the ATC-40 Capacity Spectrum of the twelve analyses. It can be seen that the curves have the same shape and direction. However, only one curve intersected the demand curve, since the other analyses did not achieve 100% of the pushover analysis. The curve that intersected the demand curve is very important since it can represent the others. This curve shows the trend of the capacity curve that the other curves failed to show. Based on the Capacity versus Demand Curve shown, the structure has a performance point at a displacement approximately equal to 1.25 inches. It is therefore expected that the structure would not entirely fail due to the lateral earthquake loads defined in the UBC 97 Code.
13
Copyright 2017 | Philippine Engineering Journal Phil. Eng’g J. 2017; 38(2): 1-16
ANALYTICAL MODELLING OF MELCHOR HALL USING NON-DESTRUCTIVE TESTS
Figure 9. Resultant base shear vs monitored displacement of 12 analyses
Figure 10. ATC-40 capacity spectrum of 12 analyses

14
Copyright 2017 | Philippine Engineering Journal Phil. Eng’g J. 2017; 38(2): 1-16
O. V. M. Antonio, Jr. and D. M. D.V. Estanislao
Even though the structure has a performance point after its nonlinear static pushover analysis, it does not mean that retrofitting measures is not needed. Retrofitting measures can still be done to the structure based on the modes of failure that the structure obtained, such formation of plastic hinges in the model. After careful examination of the last step of each pushover analyses, it was noticed that several plastic hinges were formed in the left-most portion of Melchor Hall.
4. CONCLUSION
The research showed that analytical models can still be created for old reinforced concrete structures with the help of non-destructive tests. Material properties of the old reinforced concrete members were also evaluated using research and non-destructive testing. It was also shown that the combined non-destructive tests can measure a valid concrete compressive strength for the structure. Moreover, it was proven through non-destructive testing that Melchor Hall and Palma Hall are similar and the structural elements of both structures are almost identical. Thus, the details indicated in the Palma Hall plans are similar to the details indicated in the lost Melchor Hall plans. Analysis of the generated analytical model showed that Melchor Hall can withstand earthquake loads defined by UBC 97. The research also showed that at the last steps of the pushover analyses plastic hinges formed in the leftmost staircase, in the left hallway, in the middle staircase, in the lobby and in the library of Melchor Hall. In addition, failure hinges formed at the left staircase and along the hallway near the left staircase. It should be noted that the formation of plastic hinges during an earthquake can put the lives of the people occupying the structure at high risk. Therefore, it is recommended that retrofitting measures should be done to Melchor Hall in order to improve its capacity and prevent possible casualties. These measures will strengthen Melchor Hall’s structural members so that it can overcome any damage due to earthquakes. Moreover, changing or modifying the use and occupancy classification of the structure can also be considered to reduce the load and lessen the risk to those occupying the structure.
5. REFERENCES
[1] Guidebook on Non-destructive Testing of Concrete Structures, International Atomic Energy Agency,
Vienna,Austria, 2002, pp. 100-111.
[2] M. Schickert, “Ultrasonic NDE of Concrete,” IEEE Ultrasonic Symposium, pp. 739-748, 2002.
[3] A. Jain et al., “Combined Use of Non-Destructive Tests for Assessment of Strength of Concrete in Structure,”
Procedia Engineering, 2013, vol. 54, pp. 241-251.
[4] J. Prabakar et al., “Prediction of rebar profile in a earth retaining RCC structure using cover meter survey,”
Construction and Building Materials, 2014, vol. 21, pp. 873-878.
[5] M. J. Venus, “Effects of Reinforcing Bars in Ultrasonic Pulse and Rebound Number Measurement in
Concrete,” BS thesis, Institute of Civil Engineering, University of the Philippines Diliman, 2013.
[6] M. Flores, “Determination of Ultrasonic Wave Attenuation for Concrete,” BS thesis, Institute of Civil
Engineering, University of the Philippines Diliman, 2012.
[7] J. Cruz, “Factors affecting Reinforcing Steel Bar Detection and Measurement using Electromagnetic Method,”
BS thesis, Institute of Civil Engineering, University of the Philippines Diliman, 2012.

15
Copyright 2017 | Philippine Engineering Journal Phil. Eng’g J. 2017; 38(2): 1-16
ANALYTICAL MODELLING OF MELCHOR HALL USING NON-DESTRUCTIVE TESTS
[8] L. Qixian & J. H. Bungey 1996, “Using compression wave ultrasonic transducers to measure the velocity of
surface waves and hence determine dynamic modulus of elasticity for concrete”, Construction and Building
Materials, 1996, vol. 10, No. 4, pp. 237-242.
[9] J. Popovics, “A Study of Static and Dynamic Modulus of Elasticity of Concrete,” University of Illinois, 1998.
[10] P. Turgut and M.N. Okuyan, “The pulse velocity variation around cylindrical concrete section’, Civil
Engineering Department, Harran University, 2010.
[11] Standard Test Method for Pulse Velocity Through Concrete, ASTM International, C597-09, 2009, pp. 1-4.
[12] Standard Test Method for Rebound Number of Hardened Concrete, ASTM International, C805-08, 2008, pp.
1-3.
[13] Concrete Reinforcing Steel Institute, “Evaluation of Reinforcing Bars in Old Reinforced Concrete Structures,”
Engineering Data Report Number 48, 2001.
[14] National Structural Code of the Philippines, Association of Structural Engineers of the Philippines, 2010.
[15] Prestandard and Commentary for the Seismic Rehabilitation of Building, Federal Emergency Management
Agency, FEMA 356, 2000, pp. 1-519.

16
Copyright 2017 | Philippine Engineering Journal Phil. Eng’g J. 2017; 38(2): 1-16
O. V. M. Antonio, Jr. and D. M. D.V. Estanislao
Related Documents