Proxy Statement and 2005 Annual Report to Shareholders Dear Fellow Shareholders, I am pleased to report that PHI’s strategy of focusing on a low-risk, stable, power delivery business, complemented by our growing competitive energy business is creating value for shareholders. Executing on our strategy has enabled us to deliver steady cash flow, a stronger balance sheet and an improved total return. Significantly, in January, for the first time since Pepco Holdings’ creation, our Board of Directors declared a dividend increase. Since the merger, we’ve delivered on our commitment to create value by: • Paying down over $1 billion in debt, leading to an improved equity ratio of 41.8 percent at the end of 2005; • Divesting non-strategic businesses and assets; • Managing our way through the Mirant bankruptcy; • Investing nearly $1.3 billion in our utility infrastructure; • Integrating our operating utilities to increase efficiency and lower costs; • Developing an expanding and profitable commercial and industrial energy commodity business; and • Successfully managing our wholesale energy business through a cyclical downturn and positioning it for market recovery. I will provide further details on our progress in this letter. 2005 Results of Operations Improve PHI had a successful year in 2005 with consolidated earnings of $371.2 million, or $1.96 per share, compared to $260.6 million, or $1.48 per share, in 2004. Our power delivery business continues to achieve consistent results and, as planned, generates the majority of our earnings. In 2005, these earnings were boosted by warmer summer weather. Pepco Energy Services, our competitive retail arm, saw very favorable results driven primarily by an increase in retail electric load, and Conectiv Energy, our wholesale energy business, performed well despite a difficult market. Lower interest expense and a number of special items in 2005 helped our earnings performance. Pepco, our Washington, D.C.-based utility, sold excess non-utility land located in the District of Columbia in August 2005 with an after-tax gain of about $40 million. In addition, Pepco sold its allowed claim in the Mirant Corporation bankruptcy proceeding for a cash payment of $112.4 million in December 2005. We Letter to Shareholders .......... Cover Page Notice of 2006 Annual Meeting and Proxy Statement ......... 1 Policy on the Approval of Services Provided by the Independent Auditor .................... A-1 2005 Annual Report to Shareholders ............... B-1 • Business of the Company B-8 • Management’s Discussion and Analysis .................... B-18 • Quantitative and Qualitative Disclosures .................. B-76 • Consolidated Financial Statements .................. B-80 Board of Directors and Officers .... B-148 Investor Information ............ B-149

Welcome message from author
This document is posted to help you gain knowledge. Please leave a comment to let me know what you think about it! Share it to your friends and learn new things together.
Transcript

Proxy Statement and2005 Annual Report to Shareholders
Dear Fellow Shareholders,
I am pleased to report that PHI’s strategy offocusing on a low-risk, stable, power deliverybusiness, complemented by our growingcompetitive energy business is creating value forshareholders. Executing on our strategy hasenabled us to deliver steady cash flow, a strongerbalance sheet and an improved total return.Significantly, in January, for the first time sincePepco Holdings’ creation, our Board of Directorsdeclared a dividend increase. Since the merger,we’ve delivered on our commitment to createvalue by:
• Paying down over $1 billion in debt,leading to an improved equity ratio of41.8 percent at the end of 2005;
• Divesting non-strategic businesses andassets;
• Managing our way through the Mirantbankruptcy;
• Investing nearly $1.3 billion in our utilityinfrastructure;
• Integrating our operating utilities toincrease efficiency and lower costs;
• Developing an expanding and profitablecommercial and industrial energycommodity business; and
• Successfully managing our wholesaleenergy business through a cyclicaldownturn and positioning it for marketrecovery.
I will provide further details on our progressin this letter.
2005 Results of Operations Improve
PHI had a successful year in 2005 withconsolidated earnings of $371.2 million, or $1.96per share, compared to $260.6 million, or $1.48per share, in 2004.
Our power delivery business continues toachieve consistent results and, as planned,generates the majority of our earnings. In 2005,these earnings were boosted by warmer summerweather. Pepco Energy Services, our competitiveretail arm, saw very favorable results drivenprimarily by an increase in retail electric load, andConectiv Energy, our wholesale energy business,performed well despite a difficult market.
Lower interest expense and a number ofspecial items in 2005 helped our earningsperformance. Pepco, our Washington, D.C.-basedutility, sold excess non-utility land located in theDistrict of Columbia in August 2005 with anafter-tax gain of about $40 million. In addition,Pepco sold its allowed claim in the MirantCorporation bankruptcy proceeding for a cashpayment of $112.4 million in December 2005. We
Letter to Shareholders . . . . . . . . . . Cover Page
Notice of 2006 Annual Meetingand Proxy Statement . . . . . . . . . 1
Policy on the Approval of ServicesProvided by the IndependentAuditor . . . . . . . . . . . . . . . . . . . . A-1
2005 Annual Report toShareholders . . . . . . . . . . . . . . . B-1
• Business of the Company B-8
• Management’s Discussion andAnalysis . . . . . . . . . . . . . . . . . . . . B-18
• Quantitative and QualitativeDisclosures . . . . . . . . . . . . . . . . . . B-76
• Consolidated FinancialStatements . . . . . . . . . . . . . . . . . . B-80
Board of Directors and Officers . . . . B-148
Investor Information . . . . . . . . . . . . B-149

anticipate that customers under existing gain-sharing arrangements will receive slightly morethan $40 million of that amount. The remainingafter-tax proceeds of about $42 million wererecorded as earnings in 2005.
Excluding all special items, earnings wouldhave been $287.8 million or $1.52 per share in2005, compared to $273.6 million, or $1.56 pershare in 2004. The 2005 per-share amount isdiluted by 14 cents as a result of equity we issuedin September 2004.
Forbes magazine affirmed our progress inJanuary 2006 by naming PHI to Forbes Platinum400, an exclusive list of America’s “Best BigCompanies.” PHI was ranked against its industrypeers in the areas of sales and earnings growth,stock market returns, debt to total capital andforecasts for continued earnings growth.
We are Meeting Industry Challenges
During 2005, we saw the continued evolutionof the utility industry, shaped by events such as thepassage of the Energy Policy Act and rising fuelprices.
The Energy Policy Act, enacted in August2005, was the most comprehensive energylegislation in more than a decade. The Actmandated standards for electric reliability that areenforceable by the Federal Energy RegulatoryCommission (FERC) through a national ElectricReliability Organization, a move which we havebeen actively supporting. It also containedprovisions designed to provide incentives fortransmission investment and to expedite siting oftransmission lines. This is central to PHI as wehave a number of key transmission projects eitherunder way or planned over the next several years.Overall, the Energy Policy Act was a good stepforward, but how far forward won’t be known untilall the additional regulations to implement the Actare fully developed.
Rising Energy Prices Present Challenges
In the forefront of our customers’ andregulators’ minds are rising energy prices. In 2006,
PHI’s Delaware customers will become the finalPHI customer group to complete the transition tomarket pricing of electricity supply as rate capsexpire in that state.
Since 1999, when deregulation laws werepassed and rates were frozen, the cost of theprimary fuels used to produce electricity hasincreased dramatically—delivered coal prices havealmost doubled; crude oil prices have almosttripled; and natural gas prices have quadrupled. InDelaware, according to rules established by theDelaware Public Service Commission, in 2006 webid out 100 percent of Delmarva Power’sDelaware default supply load. Because of theincrease in fuel prices, the average residential billis expected to increase by 59 percent.
Customers in other PHI jurisdictions havemoved to market-priced electricity supply over thepast two years. Because we have beencompetitively bidding multiple contracts withstaggered expiration dates, the impact of risingenergy prices has been somewhat diffused in thesejurisdictions.
We recognize that significant increases inenergy bills can cause hardship for our customers.As a result, we presented a wide-ranging proposalto the Delaware regulatory commission to helpease the impact of rising energy prices, whichincludes a three step phase-in of rates forresidential and small commercial customers over a13-month period. Similarly, in Maryland, we haveproposed programs to help stabilize rates. We alsoare launching a comprehensive energyconservation program in all our jurisdictions tohelp customers reduce their energy usage.
Expiration of Delivery Rate Caps is DrawingNear
In our Maryland and District of Columbiaservice areas, we are preparing rate cases inanticipation of delivery rate caps being lifted inDecember 2006 and August 2007, respectively. InDelaware, we have a base-rate case pending.Because of these cases, we foresee a period ofcontinued high regulatory activity, as we seek to
ii

include in rates the costs associated with doingbusiness and a reasonable rate of return forbuilding a reliable infrastructure to serve ourcustomers.
The regulatory process will not be devoid ofhurdles, but I believe PHI’s history of constructiveregulatory relationships, strengthened by our returnto the heritage utility brands, will result in abalanced outcome for our customers andshareholders.
We had several successful regulatoryoutcomes in 2005. Our Atlantic City Electricutility settled a New Jersey rate case, whichresulted in an annual pre-tax earnings increase of$20 million. We also reached a settlement thatclears the way for us to proceed with the auction ofthe B.L. England generating station which, if notsold, we plan to retire in 2007.
Stock Performance and Equity Ratio Improve
As I noted earlier, we have made realprogress in strengthening our balance sheet andexecuting on the operational front. As you mayrecall, the Mirant bankruptcy issues have been aconcern to both equity and debt analysts. Now thatmost of the issues associated with Mirant’sbankruptcy are being resolved in our favor, ourstock price is improving and in 2005 trackedhigher than other Standard & Poor’s MidcapUtilities. In addition, at the end of 2005 we were inthe top 10 of our peer group for stock yield.
I am particularly pleased with the pace withwhich we have paid down our debt. Our goal hasbeen to improve our equity ratio by reducing debtby $1.3 billion during the 2003-2007 period.Through 2005, we paid down over $1.1 billion ofdebt and expect to reach our 2007 goal. As a resultof these actions, the issuance of common equity in2004, and earnings growth in 2005, our equityratio has been steadily rising and we’re on target toachieve a ratio in the mid 40 percent range by theend of 2007.
During 2005, we significantly improved ourinvestor relations efforts, meeting more routinelywith investors and providing more transparency to
PHI. We believe Wall Street and our ratingagencies now have a much better understanding ofPHI’s strategy, and these efforts, along withdelivering good financial results, have beenreflected in our stock price.
Prudent Investments Drive Expansion of UtilityRate Base
We believe our balance sheet progress issustainable, even with higher capital expenditures.That’s because our investments are prudent andfocused—aimed to improve reliability, meet loadgrowth and enhance customer service. Over thenext five years, we plan to invest $2.4 billion inour utility infrastructure. About $540 million ofthis investment will be in transmission, includingprojects to replace electricity supply from B.L.England, and enhance reliability of electric servicein the District of Columbia. In addition, we arebuilding a 230 kilovolt line in Delaware whichspans most of the length of the state. Theseinvestments lay the groundwork for the future andbuild our utility rate base.
Increased Dividend Reflects StrengthenedPerformance
I have said consistently that we would raisethe dividend when appropriate to reflectimprovement in our financial performance. Ourgrowth in earnings, steady pay down of debt, andability to manage costs while funding newinvestments, among other measures, have allcombined to improve the balance sheetsignificantly and enabled your Board to declare inJanuary 2006 a 4 percent increase in the annualdividend rate. Importantly, progress in all theseareas is a testament to our strong and predictablecash flow.
A Look to the Future
I am encouraged by the future of ourbusinesses. Utility sales are growing at a steadyrate. The higher electrical system load, paired withrecord summer heat, produced all-time peakdemand for electricity in each of our service areasin July 2005. The system performed well,
iii

demonstrating our infrastructure planning,investment and maintenance are on track. Inaddition, we held a comprehensive emergencypreparedness drill that tested our IncidentCommand System for handling large-scaleoutages, potential threats to the Company’sreputation and other crisis situations.
In the face of escalating energy prices andconsumer expectations, customer satisfactionremained steady. To serve our customers better,we are pursuing a strategy of operationalexcellence that focuses on enhancing informationto customers; improving the accuracy of estimatedrestoration times and increasing communityinvolvement which is so pivotal to our success.
Our utility business also is ramping up itsproductivity improvement efforts to enhanceoperational efficiencies and reduce costs. Extendedlabor agreements successfully negotiated over thepast 18 months support our cost containment andproductivity goals.
In our competitive energy businesses, I expectenhanced growth and value as well. Our wholesaleenergy business performed well through a cyclicaldownturn and is competitively positioned as theregional wholesale market begins to recover. Wemanaged the challenges by engaging in asuccessful hedging strategy, reducing risk,increasing fuel storage capacity and leveraging ourunique generation assets and our expertise.
In the retail arena, our commercial andindustrial load continues to grow and the businessis expanding into a number of new regions outsideof the mid-Atlantic area. Performance continues toimprove. The business now ranks sixth nationallyin electric retail competitive energy supply.
Our Employees and Directors Make the Difference
None of our successes could have beenaccomplished without our valued employees, whooften go the extra mile in the community serving
customers and helping the environment, thehomeless or other admirable causes. I amparticularly proud of our crews’ safe and selflessperformance in the Gulf Coast region, where manyemployees traveled to restore electricity tohurricane victims. In addition, many of ouremployees made monetary, material and othercontributions to those affected by the hurricanes.
I am pleased by the continued recognition byoutside entities of our diversity focus. In 2005, PHIwas recognized by Fortune and Black Enterprisemagazines as a top employer for minorities; byAARP for employing individuals age 50 and older;by the Veteran’s Business Journal as one of the“Top 10 Corporate Supplier Diversity Programs”for veteran-owned businesses and by AsianAmerican Business Roundtable as the “2005Corporate Small Business Advocate.”
I would like to acknowledge your Board ofDirectors who in 2005 took a very active role inassessing PHI’s strategy. Your Board providesstrong oversight in governance and performancemanagement, and I applaud their talent andcommitment.
Overall, 2005 was a good year. Our totalreturn to investors, balance sheet and cash floweach improved and I expect continuedimprovement in the future. PHI remains a verygood value with a stable, regulated deliverybusiness focus supported by a profitable andgrowing competitive business segment. We lookforward to embracing this future and providing ourshareholders with enhanced value.
Sincerely,
Dennis R. WraaseChairman of the Board,President and Chief Executive OfficerMarch 30, 2006
iv

701 Ninth Street, N.W.Washington, D.C. 20068
Notice of Annual Meeting of Shareholders
March 30, 2006
NOTICE IS HEREBY GIVEN that the Annual Meeting of Shareholders of Pepco Holdings, Inc. will beheld at 10:00 a.m. local time on Friday, May 19, 2006 (the doors will open at 9:00 a.m.), at the Company’soffices located at 701 Ninth Street, N.W., Edison Place Conference Center (second floor), Washington, D.C. forthe following purposes:
1. To elect five directors to serve for a term of one year;
2. To ratify the appointment of PricewaterhouseCoopers LLP as independent registered public accountingfirm of the Company for 2006;
3. To transact such other business as may properly be brought before the meeting.
All holders of record of the Company’s common stock at the close of business on Monday, March 20, 2006,will be entitled to vote on each matter submitted to a vote of shareholders at the meeting.
By order of the Board of Directors,
ELLEN SHERIFF ROGERSVice President and Secretary
IMPORTANT
You are cordially invited to attend the meeting in person.
Even if you plan to be present, you are urged to vote your shares promptly. To vote your shares, usethe Internet or call the toll-free telephone number as described in the instructions attached to your proxycard, or complete, sign, date and return your proxy card in the envelope provided.
If you attend the meeting, you may vote either in person or by proxy.
1

PAGE
TABLE OF CONTENTS
Election of Directors . . . . . . . . . . . . . . . . . . . . . . . . . . . . . . . . . . . . . . . . . . . . . . . . . . . . . . . . . . . . . . . . . . . 6
Nominees for Election as Directors . . . . . . . . . . . . . . . . . . . . . . . . . . . . . . . . . . . . . . . . . . . . . . . . . . . . . . . . 7
Directors Continuing in Office . . . . . . . . . . . . . . . . . . . . . . . . . . . . . . . . . . . . . . . . . . . . . . . . . . . . . . . . . . . . 8
Security Ownership of Certain Beneficial Owners and Management . . . . . . . . . . . . . . . . . . . . . . . . . . . . . . 15
Executive Compensation . . . . . . . . . . . . . . . . . . . . . . . . . . . . . . . . . . . . . . . . . . . . . . . . . . . . . . . . . . . . . . . . 17
Summary Compensation Table . . . . . . . . . . . . . . . . . . . . . . . . . . . . . . . . . . . . . . . . . . . . . . . . . . . . . . . . . . . 17
Aggregated Option Exercises in Last Fiscal Year and Fiscal Year-End Option Values . . . . . . . . . . . . . . . . 18
Pepco Pension Plan Table . . . . . . . . . . . . . . . . . . . . . . . . . . . . . . . . . . . . . . . . . . . . . . . . . . . . . . . . . . . . . . . 19
Delmarva Pension Plan Table . . . . . . . . . . . . . . . . . . . . . . . . . . . . . . . . . . . . . . . . . . . . . . . . . . . . . . . . . . . . 20
Atlantic City Electric Pension Plan Table . . . . . . . . . . . . . . . . . . . . . . . . . . . . . . . . . . . . . . . . . . . . . . . . . . . 21
Employment Agreements . . . . . . . . . . . . . . . . . . . . . . . . . . . . . . . . . . . . . . . . . . . . . . . . . . . . . . . . . . . . . . . . 21
Certain Relationships and Related Transactions . . . . . . . . . . . . . . . . . . . . . . . . . . . . . . . . . . . . . . . . . . . . . . 22
Report of the Compensation/Human Resources Committee on Executive Compensation . . . . . . . . . . . . . . 22
Five-Year Performance Graph 2001-2005 . . . . . . . . . . . . . . . . . . . . . . . . . . . . . . . . . . . . . . . . . . . . . . . . . . . 27
Audit Committee Report . . . . . . . . . . . . . . . . . . . . . . . . . . . . . . . . . . . . . . . . . . . . . . . . . . . . . . . . . . . . . . . . 28
Ratification of Independent Registered Public Accounting Firm . . . . . . . . . . . . . . . . . . . . . . . . . . . . . . . . . 29
Shareholder Proposals and Director Nominations . . . . . . . . . . . . . . . . . . . . . . . . . . . . . . . . . . . . . . . . . . . . . 31
Other Matters Which May Come Before the Meeting . . . . . . . . . . . . . . . . . . . . . . . . . . . . . . . . . . . . . . . . . . 33
Policy on the Approval of Services Provided by the Independent Auditor . . . . . . . . . . . . . . . . . . . . . . . . . . A-1
2005 Annual Report to Shareholders . . . . . . . . . . . . . . . . . . . . . . . . . . . . . . . . . . . . . . . . . . . . . . . . . . . . . . . B-1
2

PROXY STATEMENT
Annual Meeting of Shareholders
Pepco Holdings, Inc.
March 30, 2006
This Proxy Statement is being furnished by the Board of Directors of Pepco Holdings, Inc. (the “Company”or “Pepco Holdings”) in connection with its solicitation of proxies to vote on the matters to be submitted to avote of shareholders at the 2006 Annual Meeting. This Proxy Statement, together with the Company’s 2005Annual Report to Shareholders, which is attached as Annex B to the Proxy Statement, the Notice of AnnualMeeting, and a proxy card, is being first mailed to shareholders of record on or about April 4, 2006.
The Company is a holding company formed in connection with the merger of Potomac Electric PowerCompany (“Pepco”) and Conectiv. As a result of the merger, which occurred on August 1, 2002, Pepco andConectiv became wholly owned subsidiaries of the Company. The address of the Company’s principal executiveoffices is 701 Ninth Street, N.W., Washington, D.C. 20068.
When and where will the Annual Meeting be held?
The Annual Meeting will be held at 10:00 a.m. local time on Friday, May 19, 2006 (the doors will open at9:00 a.m.), at the Company’s offices located at 701 Ninth Street, N.W., Edison Place Conference Center(second floor), Washington, D.C. Admission to the meeting will be limited to Company shareholders or theirauthorized proxies. Admission tickets are not required.
Will the Annual Meeting be Web cast?
The live audio and slide presentation of the meeting can be accessed at the Company’s Web site,www.pepcoholdings.com/investors. An audio only version will also be available. The dial-in information will beannounced in a news release at a later date.
What matters will be voted on at the Annual Meeting?
1. The election of five directors for one-year terms.
The Board recommends a vote FOR each of the five candidates nominated by the Board of Directors andidentified in Item 1 in this Proxy Statement.
2. The ratification of the appointment by the Audit Committee of PricewaterhouseCoopers LLP as independentregistered public accounting firm of the Company for 2006.
The Board recommends a vote FOR this proposal.
How do I vote shares held in my own name?
If you own your shares in your own name, you can either attend the Annual Meeting and vote in person oryou can vote by proxy without attending the meeting. You can vote by proxy in any of three ways:
• Via Internet: Go to www.voteproxy.com. Have your proxy card in hand when you access the Website. You will be given simple voting instructions to follow to obtain your records and to create anelectronic voting instruction form. At this Web site, you also can elect to access future proxy statementsand annual reports via the Internet.
• By Telephone: Call toll-free 1-800-PROXIES (1-800-776-9437). Have your proxy card in hand whenyou call, and you will be given simple voting instructions to follow.
• In Writing: Complete, sign, date and return the enclosed proxy card in the postage-paid envelopethat has been provided.
3

The Internet and telephone voting facilities for shareholders of record will close at 5:00 p.m. Eastern timeon May 18, 2006. Your signed proxy card or the proxy you grant via the Internet or by telephone will be voted inaccordance with your instructions. If you return a signed proxy card or grant a proxy via the Internet or bytelephone, but do not indicate how you wish your shares to be voted, your shares will be voted FOR the electionof each of the director nominees and FOR the ratification of PricewaterhouseCoopers LLP as the Company’s2006 independent registered public accounting firm.
How do I vote shares held through a brokerage firm, bank or other financial intermediary?
If you hold shares through a brokerage firm, bank or other financial intermediary, you will receive from thatintermediary directions on how to direct the voting of your shares by the intermediary, which may include votinginstructions given via the Internet or by telephone. If you hold your shares through a brokerage firm, bank orother financial intermediary you may not vote in person at the Annual Meeting unless you obtain a proxy fromthe recordholder.
Who is eligible to vote?
All shareholders of record at the close of business on March 20, 2006 (the “record date”) are entitled to voteat the Annual Meeting. As of the close of business on the record date 190,037,810 shares of Pepco Holdingscommon stock, par value $.01 per share (the “Common Stock”), were outstanding. Each outstanding share ofCommon Stock entitles the holder of record to one vote on each matter submitted to the vote of shareholders atthe Annual Meeting.
What is the quorum requirement?
In order to hold the Annual Meeting, the holders of a majority of the outstanding shares of Common Stockmust be present at the meeting either in person or by proxy.
What shares are included on the enclosed proxy card?
The number of shares printed on the enclosed proxy card indicates the number of shares of Common Stockthat, as of the record date, you held of record, plus (i) any shares held for your account under the Pepco HoldingsDividend Reinvestment Plan (the “Dividend Reinvestment Plan”) and (ii) if you are a participant in the PepcoHoldings, Inc. Retirement Savings Plan (the “Retirement Savings Plan”), the shares held for your account underthat plan. See “How is stock in the 401(k) plans for employees voted?”
How is stock in the Dividend Reinvestment Plan voted?
Shares held by the Dividend Reinvestment Plan will be voted by the Plan administrator in accordance withyour instructions on the proxy card or given via the Internet or by telephone. Any shares held in the DividendReinvestment Plan for which no voting instructions are given will not be voted.
What does it mean if I receive more than one proxy card?
If you receive more than one proxy card, it is because your shares are registered in different names or withdifferent addresses. You must sign, date and return each proxy card that you receive (or grant a proxy for theshares represented by each proxy card via the Internet or by telephone) in order for all of your shares to be votedat the Annual Meeting. To enable us to provide better shareholder service, we encourage shareholders to have alltheir shares registered in the same name with the same address.
How is stock in the 401(k) plans for employees voted?
If you are a current or former employee who is a participant in the Retirement Savings Plan (which is thesuccessor plan to the (i) Potomac Electric Power Company Savings Plan for Bargaining Unit Employees,
4

(ii) Potomac Electric Power Company Retirement Savings Plan for Management Employees (which also is thesuccessor to the Potomac Electric Power Company Savings Plan for Non-Exempt, Non-Bargaining UnitEmployees; the Potomac Electric Power Company Retirement Savings Plan for Management Employees wasformerly known as the Potomac Electric Power Company Savings Plan for Exempt Employees), (iii) ConectivSavings and Investment Plan and the Conectiv PAYSOP/ESOP and (iv) Atlantic Electric 401(k) Savings andInvestment Plan-B), then the number of shares printed on the enclosed proxy card includes shares of CommonStock held through the plan. By completing, dating, signing and returning this proxy card or granting a proxy viathe Internet or by telephone, you will be providing the plan trustee with instructions on how to vote the sharesheld in your account. If you do not provide voting instructions for your plan shares, the plan trustee will voteyour shares on each matter in proportion to the voting instructions given by all of the other participants in theplan.
Can I change my vote after I have returned my proxy card or granted a proxy via the Internet or by telephone?
If you own your shares in your own name or through the Dividend Reinvestment Plan or RetirementSavings Plan, you may revoke your proxy, regardless of the manner in which it was submitted, by:
• sending a written statement to that effect to the Secretary of the Company before your proxy is voted;
• submitting a properly signed proxy dated a later date;
• submitting a later dated proxy via the Internet or by telephone; or
• voting in person at the Annual Meeting.
If you hold shares through a brokerage firm, bank or other financial intermediary, you should contact thatintermediary for instructions on how to change your vote.
How can I obtain more information about the Company?
The Company’s 2005 Annual Report to Shareholders is included as Annex B after page A-3 of this ProxyStatement. You may also visit the Company’s Web site at www.pepcoholdings.com.
5

1. ELECTION OF DIRECTORS
Twelve directors currently constitute the entire Board of Directors of the Company. Immediately prior to thecommencement of the 2006 Annual Meeting, the number of directors will be increased to 13. In 2005, theCompany’s Restated Certificate of Incorporation was amended to reinstate the annual election of Board membersexcept that any director who prior to the 2006 Annual Meeting was elected to a term that continues beyond the2006 Annual Meeting will continue in office for the remainder of his or her elected term or until his or her earlierdeath, resignation or removal. Accordingly, at the Annual Meeting, five directors are to be elected, each to holdoffice for a one-year term that expires at the 2007 Annual Meeting, and until his or her successor is elected andqualified. The five directors who will continue in office until 2007 and the three directors who will continue inoffice until 2008 are listed on pages 8 and 9, respectively, of this Proxy Statement.
Terence C. Golden, Frank O. Heintz, George F. MacCormack, Lawrence C. Nussdorf and Lester P.Silverman were recommended for nomination to the Board by the Corporate Governance/NominatingCommittee. Messrs. Heintz and Silverman were identified for consideration as nominees by one or morenon-management directors. Messrs. Golden, MacCormack and Nussdorf are incumbent directors.
The Board of Directors recommends a vote FOR each of the five nominees listed on the following page.
What vote is required to elect the directors?
Each director shall be elected by a majority of the votes cast “for” his or her election.
In January 2006, the Company’s Bylaws were amended to provide that each director shall be elected by amajority of the votes cast “for” his or her election, except that in a contested election where the number ofnominees exceeds the number of directors to be elected, directors shall be elected by a plurality of the votes cast.Accordingly, at the 2006 Annual Meeting, a nominee will be elected as a director only if a majority of the votespresent and entitled to vote are cast “for” his election. In accordance with the Company’s Bylaws, any incumbentnominee who fails to receive a majority of votes cast “for” his or her election is required to resign from the Boardno later than 90 days after the date of the certification of the election results.
What happens if a nominee is unable to serve as a director?
Each nominee identified in this Proxy Statement has confirmed that he is willing and able to serve as adirector. However, should any of the nominees, prior to the Annual Meeting, become unavailable to serve as adirector for any reason, the Board of Directors either may reduce the number of directors to be elected or, on therecommendation of the Corporate Governance/Nominating Committee, select another nominee. If anothernominee is selected, all proxies will be voted for that nominee.
6

NOMINEES FOR ELECTION AS DIRECTORS
For Terms Expiring in 2007
Terence C. Golden, age 61, since 2000 has been Chairman of Bailey CapitalCorporation in Washington, D.C. Bailey Capital Corporation is a private investmentcompany. From 1995 until 2000, Mr. Golden was President, Chief Executive Officerand a director of Host Marriott Corporation. He continues to serve as a director ofHost Marriott Corporation and of the Morris & Gwendolyn Cafritz Foundation.Mr. Golden also currently serves as Chairman of the Federal City Council.Mr. Golden was a director of Pepco from 1998 until August 1, 2002. He has been adirector of the Company since August 1, 2002.
Frank O. Heintz, age 62, is retired President and Chief Executive Officer ofBaltimore Gas and Electric Company, the gas and electric utility serving centralMaryland, a position he held from 2000 through 2004. Preceding leadership positionsincluded Executive Vice President for Utility Operations and Vice President of GasServices. From 1982 to 1995, Mr. Heintz was Chairman of the Maryland PublicService Commission, the state agency regulating gas, electric, telephone and certainwater and sewerage utilities. Previously he served as agency head of the MarylandEmployment Security Administration and was an elected member of the Marylandlegislature. Mr. Heintz currently does not serve as a director of the Company.
George F. MacCormack, age 62, is retired Group Vice President, DuPont,Wilmington, Delaware, a position he held from 1999 through 2003. He waspreviously Vice President and General Manager (1998), White Pigments & MineralProducts Strategic Business Unit and Vice President and General Manager (1995),Specialty Chemicals Strategic Business Unit for DuPont. Mr. MacCormack was adirector of Conectiv from 2000 until August 1, 2002. He has been a director of theCompany since August 1, 2002.
Lawrence C. Nussdorf, age 59, since 1998 has been President and Chief OperatingOfficer of Clark Enterprises, Inc., a privately held investment and real estate companybased in Bethesda, Maryland, whose interests include the Clark Construction Group,LLC, a general contracting company, of which Mr. Nussdorf has been Vice Presidentand Treasurer since 1977. Mr. Nussdorf was a director of Pepco from 2001 untilAugust 1, 2002. He has been a director of the Company since August 1, 2002.
Lester P. Silverman, age 59, is Director Emeritus of McKinsey & Company, Inc.,having retired from the international management consulting firm in 2005.Mr. Silverman joined McKinsey in 1982 and was head of the firm’s Electric Powerand Natural Gas practice from 1991 to 1999. From 2000 to 2004, Mr. Silverman wasthe leader of McKinsey’s Global Nonprofit Practice. Previous positions includedPrincipal Deputy Assistant Secretary for Policy and Evaluation in the U.S.Department of Energy from 1980 to 1981 and Director of Policy Analysis in the U.S.Department of the Interior from 1978 to 1980. Mr. Silverman is currently an AdjunctLecturer at Georgetown University, Washington, D.C., and a trustee of severalnational and Washington, D.C.-area nonprofit organizations. Mr. Silverman currentlydoes not serve as a director of the Company.
7

DIRECTORS CONTINUING IN OFFICE
Terms Expiring in 2007
Jack B. Dunn, IV, age 55, since October 1995 has been Chief Executive Officer andsince October 2004 has been President of FTI Consulting, Inc., a publicly held multi-disciplined consulting firm with practices in the areas of corporate finance/restructuring, forensic and litigation consulting and economic consulting, located inBaltimore, Maryland. He has served as a Director of FTI since 1992 and served asChairman of the Board from December 1998 to October 2004. Mr. Dunn is a limitedpartner of the Baltimore Orioles and is a director of Aether Holdings, Inc. He hasbeen a director of the Company since May 21, 2004.
Richard B. McGlynn, age 67, is an attorney. From 1995-2000, he was VicePresident and General Counsel of United Water Resources, Inc., Harrington Park,New Jersey and from 1992-1995, he was a partner in the law firm LeBoeuf, Lamb,Green & MacRae. He was a director of Atlantic Energy, Inc. from 1986 to 1998.Mr. McGlynn was a director of Conectiv from 1998 until August 1, 2002. He hasbeen a director of the Company since August 1, 2002.
Peter F. O’Malley, age 67, since 1989 has been of counsel to O’Malley, Miles,Nylen & Gilmore, P.A., a law firm headquartered in Calverton, Maryland.Mr. O’Malley currently serves as the President of Aberdeen Creek Corp., a privatelyheld company engaged in investment, business consulting and development activities.Mr. O’Malley is a director of FTI Consulting, Inc. and Legg Mason Trust Co. He wasa director of Pepco from 1982 until August 1, 2002. He has been a director of theCompany since August 1, 2002 and currently serves as the Lead IndependentDirector.
Frank K. Ross, age 62, is retired managing partner for the mid-Atlantic Audit and RiskAdvisory Services Practice and managing partner of the Washington, D.C. office of theaccounting firm KPMG LLP, positions he held from July 1, 1996 to December 31,2003. He is currently a Visiting Professor of Accounting at Howard University,Washington, D.C. and the Director of its Center for Accounting Education. He is adirector of Cohen & Steers Mutual Funds. Mr. Ross serves on The Greater Washington,D.C. Urban League, Gallaudet University and the Hoop Dreams Scholarship Fundboards. He has been a director of the Company since May 21, 2004.
William T. Torgerson, age 61, has been Vice Chairman of the Company since June 1,2003 and has been General Counsel of the Company since August 1, 2002. FromAugust 1, 2002 to June 2003, he was also Executive Vice President of the Company.From December 2000 to August 2002, he was Executive Vice President and GeneralCounsel of Pepco. Mr. Torgerson has been a director of Pepco and Conectiv sinceAugust 1, 2002. Mr. Torgerson has been a director of the Company since May 21, 2004.
8

DIRECTORS CONTINUING IN OFFICE
Terms Expiring in 2008
Edmund B. Cronin, Jr., age 68, since 2000 has been Chairman of the Board, andsince 1995 has been President and Chief Executive Officer of Washington Real EstateInvestment Trust, based in Rockville, Maryland, which owns income-producing realestate in the mid-Atlantic region. Mr. Cronin was a director of Pepco from 1998 untilAugust 1, 2002. He has been a director of the Company since August 1, 2002.
Pauline A. Schneider, age 62, joined the Washington office of the law firm ofHunton & Williams in 1985 and has been a partner since 1987. From October 2000 toOctober 2002, Ms. Schneider served as Chair of the Board of MedStar Health, Inc., acommunity-based healthcare organization that includes seven major hospitals in theWashington, D.C./Baltimore area. Also, between 1998 and 2002, she chaired theBoard of The Access Group, Inc., a not-for-profit student loan provider headquarteredin Wilmington, Delaware. She continues her service on both boards. She is a directorof DiamondCluster International, Inc. Ms. Schneider was a director of Pepco from2001 until August 1, 2002. She has been a director of the Company since August 1,2002.
Dennis R. Wraase, age 62, is Chairman, President and Chief Executive Officer of theCompany. Since May 2004 he has been Chairman of Pepco, Atlantic City ElectricCompany and Delmarva Power & Light Company. He was Chief Executive Officerfrom August 2002 through October 2005 and President and Chief Operating Officerof Pepco from January 2001 through August 1, 2002. Mr. Wraase became Presidentof the Company in August 2002. From August 2002 through May 2003, Mr. Wraasewas Chief Operating Officer of the Company. Mr. Wraase became CEO of theCompany in June 2003. He has been a director of the Company since 2001, and hasbeen Chairman since May 2004.
9

Which directors are “independent?”
According to the listing standards of the New York Stock Exchange (“NYSE”), a majority of theCompany’s directors are required to be “independent” as defined by the NYSE listing standards. Applying thesestandards, the Board has determined that nine of the Company’s current 12 directors, consisting of Messrs. Dunn,Golden, MacCormack, McGlynn, Nussdorf, O’Malley, and Ross and Mmes. McKenzie (who is retiring effectivewith the Annual Meeting) and Schneider qualify as independent and that if Messrs. Golden, Heintz,MacCormack, Nussdorf and Silverman are elected at the Annual Meeting, ten of the Company’s 13 directorsconsisting of Messrs. Dunn, Golden, Heintz, MacCormack, McGlynn, Nussdorf, O’Malley, Ross and Silvermanand Ms. Schneider following the Annual Meeting will qualify as independent.
For a director to be considered independent under NYSE listing standards, a director cannot have any of thedisqualifying relationships enumerated by the NYSE listing standards and the Board must determine that thedirector does not otherwise have any direct or indirect material relationship with the Company. In accordancewith the NYSE listing standards, the Board of Directors, as part of the Company’s Corporate GovernanceGuidelines, has adopted categorical standards to assist it in determining whether a relationship between a directorand the Company is a material relationship that would impair the director’s independence. Under these standards,which incorporate the disqualifying relationships specifically enumerated by the NYSE listing standards, aCompany director is not “independent” if any of the conditions specified are met.
a. The director is, or has been within the last three years, an employee of the Company, or an immediatefamily member is, or has been within the last three years, an executive officer of the Company. Anexecutive officer of the Company is the president, principal financial officer, controller, any vice-president in charge of a principal business unit, division or function, any other officer who performs apolicy-making function, or any other person who performs similar policy-making functions for theCompany. Officers of the Company’s subsidiaries are deemed to be officers of the Company if theyperform such policy-making functions for the Company.
b. The director has received, or has an immediate family member who has received, during any 12-monthperiod within the last three years, more than $100,000 in direct compensation from the Company, otherthan director and committee fees and pension or other forms of deferred compensation for prior service(provided such compensation is not contingent in any way on continued service).
c. (A) The director or an immediate family member is a current partner of a firm that is the Company’sinternal or external auditor; (B) the director is a current employee of such a firm; (C) the director hasan immediate family member who is a current employee of such a firm and who participates in thefirm’s audit, assurance or tax compliance (but not tax planning) practice; or (D) the director or animmediate family member was within the last three years (but is no longer) a partner or employee ofsuch a firm and personally worked on the Company’s audit within that time.
d. The director or an immediate family member is, or has been within the last three years, employed as anexecutive officer of another company where any of the Company’s present executive officers at thesame time serves or served on that company’s compensation committee.
e. The director is a current employee, or an immediate family member is a current executive officer, of acompany that has made payments to, or received payments from, the Company for property or servicesin an amount which, in any of the last three fiscal years, exceeds the greater of $1 million or 2% ofsuch other company’s consolidated gross revenues. Contributions to tax exempt organizations shall notbe considered “payments” for purposes of this categorical standard, provided however that theCompany shall disclose in its annual proxy statement any such contributions made by the Company toany tax exempt organization in which any independent director serves as an executive officer if, withinthe preceding three years, contributions in any single fiscal year from the Company to the tax exemptorganization exceed the greater of $1 million, or 2% of such tax exempt organization’s consolidatedgross revenues.
10

f. For purposes of considering the existence or materiality of a director’s relationship with the Companyor the relationship with the Company of an organization with which the director is associated,payments for electricity, gas or other products or services made in the normal course of business atprices generally applicable to similarly situated customers shall not be included.
g. Additional provisions applicable to members of the Audit Committee.
i. A director who is a member of the Audit Committee may not accept directly or indirectly anyconsulting, advisory, or other compensatory fee from the Company or any subsidiary of theCompany, provided that, unless the rules of the NYSE provide otherwise, compensatory fees do notinclude the receipt of fixed amounts of compensation under a retirement plan (including deferredcompensation) for prior service (provided that such compensation is not contingent in any way oncontinued service). The term “indirect acceptance” by a member of the Audit Committee of anyconsulting, advisory, or other compensatory fee includes acceptance of such fee by a spouse, a minorchild or stepchild or a child or stepchild sharing a home with the member or by an entity in whichsuch member is a partner, member, an officer such as a managing director occupying a comparableposition or executive officer, or occupies a similar position (except limited partners, non-managingmembers and those occupying similar positions who, in each case, have no active role in providingservices to the entity) and which provides accounting, consulting, legal, investment banking orfinancial advisory services to the Company or any subsidiary of the Company.
ii. A director who is an “affiliated person” of the Company or its subsidiaries (other than in his or hercapacity as a member of the Board or a Board Committee) as defined by the Securities andExchange Commission (“SEC”) shall not be considered independent for purposes of AuditCommittee membership. A director who beneficially owns more than 3% of the Company’scommon stock will be considered to be an “affiliated person.”
What are the Committees of the Board? How often did the Board and each Committee of the Board meet in2005?
In 2005, the Board of Directors held eight meetings. The Board has five separately designated standingCommittees:
• the Audit Committee;
• the Compensation/Human Resources Committee;
• the Corporate Governance/Nominating Committee;
• the Executive Committee; and
• the Finance Committee.
Each Committee’s charter can be found on the Company’s Web site (www.pepcoholdings.com) under thelink: Corporate Governance.
At each meeting, the Board and each of the Committees made up of independent directors (or, in the case ofthe Finance Committee, directors who are not employees of the Company or any of its subsidiaries (“non-management directors”)) set aside time to meet in executive session without management directors (in the case ofBoard meetings) or other management personnel present. The executive session of the Board is convened by theLead Independent Director. The Compensation/Human Resources Committee meets separately with itscompensation consultant. The Audit Committee meets separately with the Vice President and General Auditorand the independent registered public accounting firm.
The Audit Committee held nine meetings in 2005. The Audit Committee represents and assists the Board indischarging its responsibility of oversight, but the existence of the Committee does not alter the traditional rolesand responsibilities of the Company’s management and its independent registered public accounting firm with
11

respect to the accounting and control functions and financial statement presentation. The Audit Committee isresponsible for, among other things, representing and assisting the Board in oversight of (i) the integrity of theCompany’s financial statements, accounting and financial reporting processes and audits of the Company’sconsolidated financial statements, (ii) the Company’s compliance with legal and regulatory requirements, (iii) thequalifications, independence and the retention, compensation and performance of the Company’s independentregistered public accounting firm, and (iv) the design and performance of the Company’s internal audit function.The Audit Committee also reviews the Company’s guidelines and policies with respect to risk assessment. TheCommittee has full power and authority to obtain advice and assistance from independent legal, accounting orother advisors as it may deem appropriate to carry out its duties. Committee members are Directors Golden,McGlynn, Nussdorf (Chairman) and Ross. The Board has determined that directors Golden, Nussdorf and Rosseach is an “audit committee financial expert” as defined by the rules of the SEC. The Board has determined thateach of the members of the Audit Committee is independent as defined by the Company’s Corporate GovernanceGuidelines and in accordance with the listing standards of the NYSE.
The Compensation/Human Resources Committee held six meetings in 2005. The Committee, together withthe other independent members of the Board of Directors, sets the CEO’s compensation level. The Committeeapproves the salaries of the five most highly compensated officers (other than the CEO), the heads of the majorsubsidiaries and the Vice Presidents of the Company; administers the Company’s executive incentivecompensation programs; and establishes the structure of compensation and amounts of awards under the PepcoHoldings, Inc. Long-Term Incentive Plan (the “Long-Term Incentive Plan”). The Committee exercises thepowers of the Board with respect to the Company’s annual salary administration program for all managementemployees. The Committee also makes recommendations to the Board concerning the Company’s retirement andother benefit plans and oversees corporate workforce diversity issues. Committee members are DirectorsMacCormack, McGlynn (Chairman), McKenzie, O’Malley and Ross. The Board has determined that each of themembers of the Compensation/Human Resources Committee is independent as defined by the Company’sCorporate Governance Guidelines and in accordance with the listing standards of the NYSE.
The Corporate Governance/Nominating Committee held seven meetings in 2005. The Committee’s dutiesand responsibilities include making recommendations to the Board regarding the governance of the Companyand the Board, and helping to ensure that the Company is properly managed to protect and enhance shareholdervalue and to meet the Company’s obligations to shareholders, customers, the industry and under the law. TheCommittee is responsible for making recommendations to the Board regarding Board structure, practices andpolicies, including Board committee chairmanships and assignments and the compensation of Board members,assessing Board performance and effectiveness, and ensuring that processes are in place with regard to corporatestrategy, management development and management succession, business plans and corporate and governmentaffairs. The Committee evaluates annually the performance of the Company’s Chief Executive Officer andreports its appraisal to the other independent directors. The Committee also is responsible for ensuring that thetechnology and systems used by the Company are adequate to properly run the business and for it to remaincompetitive. The Committee reviews and recommends to the Board candidates for nomination for election asdirectors. Committee members are Directors Dunn, McGlynn, McKenzie, O’Malley (Chairman) and Schneider.The Board has determined that each of the members of the Corporate Governance/Nominating Committee isindependent as defined by the Company’s Corporate Governance Guidelines and in accordance with the listingstandards of the NYSE.
The Executive Committee held one meeting in 2005. The Committee has, and may exercise when the Boardis not in session, all the powers of the Board in the management of the property, business and affairs of theCompany, except as otherwise provided by law. The Committee does not hold regularly scheduled meetings.Committee members are Directors Cronin, McKenzie (Chairman), O’Malley, Torgerson and Wraase.
The Finance Committee held eight meetings in 2005. The Committee oversees the financial objectives,policies, procedures and activities of the Company and considers the long- and short-term strategic plans of theCompany. The Committee reviews with management the Company’s risk mitigation profile. Committeemembers are Directors Cronin, Dunn, Golden (Chairman), MacCormack, Nussdorf and Schneider.
12

In 2005, each director attended at least 75% of the aggregate number of meetings held by the Board andeach Committee of which he or she was a member. The Board has adopted an attendance policy, set forth in theCorporate Governance Guidelines, under which attendance in person is required at all regularly scheduledshareholder, Board and Committee meetings (except where scheduled as a conference call) and is the preferredmethod of attendance at specially called meetings. The Chairman has the authority to waive the requirement ofthis policy if, in the Chairman’s opinion, it is in the Company’s best interests to do so. Of the Company’s 12directors at the time of the 2005 Annual Meeting, 11 attended.
How do I send a communication to the Board of Directors or to a specific individual director?
The Company’s directors encourage interested parties, including employees and shareholders, to contact themdirectly and, if desired, confidentially and/or anonymously regarding matters of concern or interest, includingconcerns regarding questionable accounting or auditing matters. The names of the Company’s directors can befound on pages 7–9 of this Proxy Statement and on the Company’s Web site (www.pepcoholdings.com) under thelink: Corporate Governance. The Company’s directors may be contacted by writing to them either individually or asa group or partial group (such as all non-management directors), c/o Corporate Secretary, Pepco Holdings, Inc.,701 Ninth Street, N.W., Room 1300, Washington, D.C. 20068. If you wish your communication to be treatedconfidentially, please write the word “CONFIDENTIAL” prominently on the envelope and address it to the directorby name so that it can be forwarded without being opened. Communications addressed to multiple recipients, suchas to “directors,” “all directors,” “all non-management directors,” “independent directors,” etc. will necessarily haveto be opened and copied by the Office of the Corporate Secretary in order to forward them, and hence cannot betransmitted unopened, but will be treated as confidential communications. If you wish to remain anonymous, do notsign your letter or include a return address on the envelope. Communications from Company employees regardingaccounting, internal accounting controls, or auditing matters may be submitted in writing addressed to: VicePresident and General Auditor, Pepco Holdings, Inc., 701 Ninth Street, N.W., Room 8220, Washington, D.C. 20068or by telephone to 202-872-3524. Such communications will be handled initially by the Internal Audit Group,which reports to the Audit Committee, and will be reported by the Internal Audit Group to the Audit Committee. Iffor any reason the employee does not wish to submit a communication to the Vice President and General Auditor, itmay be addressed to the Chairman of the Audit Committee using the procedure set forth above, or can be sent viamail, telephone, facsimile or e-mail to the Company’s Ethics Officer. Employees may also leave messages on theCompany’s Ethics Officer hotline.
What are the directors paid for their services?
Commencing January 1, 2005, each of the Company’s non-management directors is paid an annual retainerof $45,000, plus a fee of $2,000 for each Board and Committee meeting attended. Each non-management directorwho chairs a standing Committee of the Board receives an additional retainer of $5,000, except that the Chairmanof the Audit Committee receives $7,500. The director who serves as Lead Independent Director receives, inaddition to any other compensation, an additional retainer of $2,500.
Each non-management director is required to own at least 7,500 shares of Common Stock or Common Stockequivalents (“phantom stock”). Non-management directors serving as of January 1, 2005, have untilDecember 31, 2007, to meet this requirement. Newly elected or appointed non-management directors arerequired to reach this ownership level within three years after the date of their election or appointment.
Under the Non-Management Director Compensation Plan (the “Director Compensation Plan”), eachnon-management director is entitled to elect to receive his or her annual retainer, retainer for service as aCommittee chairman, if any, and meeting fees in: (1) cash, (2) shares of Common Stock, (3) a credit to anaccount for the director established under the Company’s Executive and Director Deferred Compensation Plan(“Deferred Compensation Plan”) or (4) any combination thereof. A non-management director who elects to haveall or any portion of his or her compensation for services as a director credited to an account under the DeferredCompensation Plan can elect to have his or her account balance under the plan: (i) maintained in the form ofphantom stock and credited with additional phantom stock when the Company pays a dividend on its Common
13

Stock, (ii) credited with a return based on the prevailing prime rate or (iii) credited with a return based on thereturn on one or more investment funds selected by the Compensation/Human Resource Committee.Distributions to participants under the Deferred Compensation Plan are made in cash, in either a lump sum orinstallments, commencing at a time selected by the participant.
Although under the terms of the Long-Term Incentive Plan, each non-management director is entitled to agrant, on May 1 of each year, of an option to purchase 1,000 shares of Common Stock, in 2003, the Board ofDirectors discontinued these grants.
The Company also provides directors with travel accident insurance for Company-related travel, directors’and officers’ liability insurance coverage and reimburses directors for travel, hotel and other out-of-pocketexpenses incurred in connection with their performance of their duties as directors. The Company also providesthe directors with free parking in the Company’s headquarters building, which is also available for use by thedirectors other than in connection with the performance of their duties as directors.
The following table sets forth, as of March 24, 2006, for each non-management director who has elected toreceive all or a portion of his or her annual retainer and meeting fees in phantom stock under the DeferredCompensation Plan, the number of credited phantom stock units (each corresponding to one share of Common Stock).
Name of DirectorPepco Holdings
Phantom Stock Units
Edmund B. Cronin, Jr. . . . . . . . . . . . . . . . . . . . . . . . . . . . . . . . 24,794Terence C. Golden . . . . . . . . . . . . . . . . . . . . . . . . . . . . . . . . . . 17,941George F. MacCormack . . . . . . . . . . . . . . . . . . . . . . . . . . . . . . 4,235Richard B. McGlynn . . . . . . . . . . . . . . . . . . . . . . . . . . . . . . . . 2,129Lawrence C. Nussdorf . . . . . . . . . . . . . . . . . . . . . . . . . . . . . . . 3,053Peter F. O’Malley . . . . . . . . . . . . . . . . . . . . . . . . . . . . . . . . . . . 5,074Pauline A. Schneider . . . . . . . . . . . . . . . . . . . . . . . . . . . . . . . . 423
14

SECURITY OWNERSHIP OF CERTAIN BENEFICIAL OWNERS AND MANAGEMENT
The following table sets forth, as of March 24, 2006, for each director, director nominee, the five executiveofficers named in the Summary Compensation Table on page 17 and all directors and executive officers as agroup (i) the number of shares of Common Stock beneficially owned, (ii) the number of shares of Common Stockthat could be purchased through the exercise of stock options then-currently exercisable or scheduled to becomeexercisable within 60 days thereafter, and (iii) total beneficial ownership. The Common Stock is the Company’sonly class of equity or voting securities. Each of the individuals listed, and all directors and executive officers asa group, beneficially owned less than 1% of the outstanding shares of Common Stock.
Name of Beneficial Owner
Shares ofCommon Stock
Owned(1)
Common StockAcquirable Within
60 Days
TotalBeneficial
Ownership(2)
Edmund B. Cronin, Jr. . . . . . . . . . . . . . . . . . . . . . . . . . . . . . . . . . . 1,425 5,000 6,425Jack B. Dunn, IV . . . . . . . . . . . . . . . . . . . . . . . . . . . . . . . . . . . . . . 10,495 0 10,495Terence C. Golden (3) . . . . . . . . . . . . . . . . . . . . . . . . . . . . . . . . . . 52,132 4,000 56,132Frank O. Heintz (4) . . . . . . . . . . . . . . . . . . . . . . . . . . . . . . . . . . . . 1,500 0 1,500George F. MacCormack . . . . . . . . . . . . . . . . . . . . . . . . . . . . . . . . . 11,282 0 11,282Richard B. McGlynn . . . . . . . . . . . . . . . . . . . . . . . . . . . . . . . . . . . 5,762 0 5,762Floretta D. McKenzie . . . . . . . . . . . . . . . . . . . . . . . . . . . . . . . . . . 6,873 5,000 11,873Lawrence C. Nussdorf . . . . . . . . . . . . . . . . . . . . . . . . . . . . . . . . . . 5,000 2,000 7,000Peter F. O’Malley (5) . . . . . . . . . . . . . . . . . . . . . . . . . . . . . . . . . . . 10,000 5,000 15,000Joseph M. Rigby . . . . . . . . . . . . . . . . . . . . . . . . . . . . . . . . . . . . . . 19,711 16,025 35,736Frank K. Ross . . . . . . . . . . . . . . . . . . . . . . . . . . . . . . . . . . . . . . . . 5,758 0 5,758Pauline A. Schneider . . . . . . . . . . . . . . . . . . . . . . . . . . . . . . . . . . . 3,560 2,000 5,560Thomas S. Shaw . . . . . . . . . . . . . . . . . . . . . . . . . . . . . . . . . . . . . . 78,031 68,333 146,364Lester P. Silverman . . . . . . . . . . . . . . . . . . . . . . . . . . . . . . . . . . . . 1,000 0 1,000William H. Spence . . . . . . . . . . . . . . . . . . . . . . . . . . . . . . . . . . . . . 13,232 0 13,232William T. Torgerson . . . . . . . . . . . . . . . . . . . . . . . . . . . . . . . . . . 39,434 120,843 160,277Dennis R. Wraase . . . . . . . . . . . . . . . . . . . . . . . . . . . . . . . . . . . . . 99,213 165,843 265,056All Directors and Executive Officers as a Group (19
Individuals) . . . . . . . . . . . . . . . . . . . . . . . . . . . . . . . . . . . . . . . . 426,875 538,412 965,287
(1) Includes shares held under the Dividend Reinvestment Plan and Retirement Savings Plan. Also includesshares awarded under the Long-Term Incentive Plan that vest over time if the executive officer has the rightto vote the shares. Unless otherwise noted, each beneficial holder has sole voting power and sole dispositivepower with respect to the shares.
(2) Consists of the sum of the two preceding columns.(3) Includes 11,600 shares owned by Mr. Golden’s spouse. Mr. Golden disclaims beneficial ownership of these
shares.(4) Shares are owned in the Frank O. Heintz Trust of which Mr. Heintz is Trustee.(5) Includes 4,086 shares owned by Aberdeen Creek Corporation, of which Mr. O’Malley is the sole owner.
15

The following table sets forth, as of March 24, 2006, the number and percentage of shares of CommonStock reported as beneficially owned by all persons known by the Company to own beneficially 5% or more ofthe Common Stock.
Name and Address of Beneficial Owner
Shares ofCommon Stock
Owned
Percent ofCommon Stock
Outstanding
Barclays Global Investors, NA . . . . . . . . . . . . . . . . . . . . . . . . . . . . . . . . . . . . . . . . .45 Fremont Street, 17th Floor,San Francisco, CA 94105
10,364,900(6) 5.48%
UBS AG . . . . . . . . . . . . . . . . . . . . . . . . . . . . . . . . . . . . . . . . . . . . . . . . . . . . . . . . . .Bahnhofstrasse 45P.O. Box CH-8021Zurich, Switzerland
12,683,488(7) 6.7%
(6) This disclosure is based on information furnished in Schedule 13G, dated January 31, 2006, and filed withthe SEC on January 26, 2006, jointly by Barclays Global Investors, NA, Barclays Global Fund Advisors,Barclays Global Investors, Ltd., and Barclays Global Investors Japan Trust and Banking Company Limited,in which Barclays Global Investors, NA reports that it is the beneficial owner with sole dispositive power of7,281,531 shares of Common Stock, Barclays Global Fund Advisors reports that it is the beneficial ownerwith sole dispositive power of 2,322,161 shares of Common Stock, Barclays Global Investors, Ltd. reportsthat it is the beneficial owner with sole dispositive power of 598,026 shares of Common Stock, and BarclaysGlobal Investors Japan Trust and Banking Company Limited reports that it is the beneficial owner with soledispositive power of 163,182 shares of Common Stock.
(7) This disclosure is based on information furnished in Schedule 13G/A, dated February 14, 2006, and filedwith the SEC on February 14, 2006, by UBS AG (for the benefit and on behalf of the TraditionalInvestments division of the UBS Global Asset Management business group of UBS AG), in which UBS AGreports that it is the beneficial owner of 12,683,488 shares of Common Stock (consisting of 12,683,488shares as to which it has shared dispositive power and 7,138,660 shares as to which it has sole votingpower).
Section 16(a) Beneficial Ownership Reporting Compliance
Section 16(a) of the Securities Exchange Act of 1934 (the “Exchange Act”) requires the directors andexecutive officers of a company with a class of equity securities registered under Section 12 of the Exchange Actand any beneficial owner of more than 10% of any class of the company’s equity securities to file with the SECcertain reports of holdings and transactions in the company’s equity securities. Based on a review of the reportsfiled for 2005 and on written confirmations provided by its directors and executive officers, the Companybelieves that during 2005 all of its directors and executive officers filed on a timely basis the reports required bySection 16(a), except that Frank K. Ross, a director of the Company, filed one day late a report on Form 4disclosing the purchase of 3,000 shares of the Company’s Common Stock.
16

EXECUTIVE COMPENSATION
The following table sets forth compensation information for each of the last three fiscal years endedDecember 31, for the Chief Executive Officer and the four other most highly compensated executive officers ofthe Company determined on the basis of aggregate salary and bonus for the year ended December 31, 2005(collectively, the “Named Executive Officers”). The information presented in the table includes compensationpaid by the Company or its subsidiaries.
SUMMARY COMPENSATION TABLE
Long-Term Compensation
Annual Compensation Awards Payouts
Name and Principal Position Year Salary Bonus
OtherAnnual
Compen-sation(8)
RestrictedStock
Awards(9)
SecuritiesUnderlying
OptionsLTIP
Payouts(10)
All OtherCompen-sation(11)
Dennis R. Wraase . . . . . . . . .Chairman, Presidentand Chief Executive Officer
200520042003
$825,000730,250558,333
$601,920438,588
0
$10,7449,3438,124
$ 00
299,997
000
$220,546197,069
0
$48,76139,02829,488
William T. Torgerson . . . . . .Vice Chairmanand General Counsel
200520042003
$492,000475,000396,000
$299,136237,737
0
$ 9,0217,8456,821
$ 000
000
$151,416135,312
0
$30,05828,96523,310
Thomas S. Shaw . . . . . . . . . .Executive Vice Presidentand Chief Operating Officer
200520042003
$488,000474,000460,000
$296,704237,237
0
$ 000
$ 000
000
$184,166164,613
0
$20,74216,90910,434
Joseph M. Rigby . . . . . . . . . .Senior Vice Presidentand Chief Financial Officer
200520042003
$350,000299,167260,000
$170,240119,78658,656
$ 000
$ 000
000
$ 80,62472,088
0
$10,2786,7267,870
William H. Spence . . . . . . . . .Senior Vice President
200520042003
$285,000267,000260,000
$190,124171,018
0
$ 000
$ 000
000
$ 80,62472,088
0
$13,8368,160
10,315
(8) Other Annual Compensation. Amounts in this column for each year represent above-market earnings earnedby the executive on deferred compensation under the Pepco Deferred Compensation Plan assumingretirement at age 65. The amounts are reduced if the executive terminates employment prior to age 62 forany reason other than death, total or permanent disability or a change in control of Pepco. In the event of achange in control and termination of the participant’s employment, the participant will receive a lump sumpayment equal to the net present value of the expected payments at age 65 discounted using the PensionBenefit Guaranty Corporation immediate payment interest rate plus one-half of one percent. Payments to theexecutives are funded by Pepco-owned life insurance policies held in trust.
In addition to the compensation shown in the above Summary Compensation Table, each of the NamedExecutive Officers was entitled to one or more of the following personal benefits: financial planningservices, tax preparation services, personal use of company-owned automobiles or an automobile allowance,club dues and use of Company-leased entertainment venues other than for business purposes. For each ofthe Named Executive Officers, the aggregate value of these perquisites in each of the three years, was lessthan the lesser of $50,000 or 10% of the individual’s total annual salary and bonus, and accordingly,consistent with the rules of the SEC, the value of these perquisites has not been included in the Table.
17

(9) Restricted Stock. The amount in this column for 2003 for Mr. Wraase represents the dollar value on thegrant date of restricted shares of Common Stock awarded under the Company’s Long-Term Incentive Plan.These restricted shares vest on June 1, 2006, if Mr. Wraase is continuously employed by the Companythrough that date. Dividends are paid on the restricted shares. The dollar value has been calculated bymultiplying the number of restricted shares by the market price of the Common Stock on the grant date.
The number and aggregate market value of all restricted shares of Common Stock held by the NamedExecutive Officers at December 31, 2005, were: Mr. Wraase, 14,822 shares with a market value of$329,567; Mr. Shaw, 44,871 shares with a market value of $997,707; Mr. Rigby, 1,923 shares with a marketvalue of $42,758; and Mr. Spence, 1,923 shares with a market value of $42,758. Mr. Torgerson held norestricted shares at December 31, 2005.
(10) Incentive Plan Payouts. Amounts in this column for the executives represent the value of Common Stockawarded under the Company’s Merger Integration Success Program, which is a component of the Long-Term Incentive Plan. Amounts in this column for 2005 are for the performance cycle ending December 31,2005 which vested on March 7, 2006. Amounts in this column for 2004 are for the performance cycleending December 31, 2004 which vested on March 11, 2005. The value of the vested Common Stock hasbeen calculated by multiplying the number of vested shares by the market price of the Common Stock onthe day preceding the vesting date.
(11) All Other Compensation. Amounts in this column for 2005 consist of (i) the Company’s contributions to theRetirement Savings Plan for Management Employees of $13,915 and $13,556 for Messrs. Wraase andTorgerson, respectively, and the Company’s contribution to the Conectiv Savings and Investment Plan of$8,278, $9,108 and $9,225 for Messrs. Shaw, Rigby and Spence, respectively (ii) the Company’scontributions to the Executive Deferred Compensation Plan due to Internal Revenue Service limitations onmaximum contributions to the Company’s Retirement Savings Plan for Management Employees and, in thecase of Messrs. Shaw, Rigby and Spence, the Conectiv Savings and Investment Plan, of $22,218, $9,105,$7,686, $0 and $3,675 for Messrs. Wraase, Torgerson, Shaw, Rigby and Spence, respectively, and (iii) theterm life insurance premiums paid by the Company for Messrs. Wraase, Torgerson, Shaw, Rigby andSpence of $12,628, $7,397, $4,778, $1,170 and $936, respectively.
AGGREGATED OPTION EXERCISES IN LAST FISCAL YEARAND FISCAL YEAR-END OPTION VALUES
Name
SharesAcquired onExercise (#)
ValueRealized
($)
Number of SharesUnderlying Unexercised
Options at End ofFiscal Year
Value of UnexercisedIn-the-Money Options atEnd of Fiscal Year (12)
Exercisable Unexercisable Exercisable Unexercisable
Dennis R. Wraase . . . . . . . . . . . . . . 0 $0 153,843 12,000 $ 0 0William T. Torgerson . . . . . . . . . . . 0 $0 111,093 9,750 $ 0 0Thomas S. Shaw . . . . . . . . . . . . . . . 0 $0 68,333 0 $219,007 0Joseph M. Rigby . . . . . . . . . . . . . . . 0 $0 16,025 0 $ 51,360 0William H. Spence . . . . . . . . . . . . . . 0 $0 16,025 0 $ 51,360 0
(12) Value of Unexercised In-the-Money Options at End of Fiscal Year. The value of unexercised in-the-moneyoptions at December 30, 2005, is calculated by multiplying the number of shares by the amount by whichthe fair market value of the Common Stock on the last trading day of 2005, as reported by the NYSE,exceeded the option exercise price. For Messrs. Wraase and Torgerson, the closing price of the CommonStock on the last trading day of 2005 was less than the option exercise prices of all of their options, makingthe value of the unexercised in-the-money options zero.
18

PEPCO PENSION PLAN TABLE
Average Annual Salaryin Final Three Years
of Employment
Annual Retirement Benefits
Years in Plan
15 20 25 30 35 40
$550,000 . . . . . . . . . . . . . . . . . . . $144,000 $193,000 $241,000 $289,000 $337,000 $ 385,000$650,000 . . . . . . . . . . . . . . . . . . . $171,000 $228,000 $284,000 $341,000 $398,000 $ 455,000$750,000 . . . . . . . . . . . . . . . . . . . $197,000 $263,000 $328,000 $394,000 $459,000 $ 525,000$850,000 . . . . . . . . . . . . . . . . . . . $223,000 $298,000 $372,000 $446,000 $521,000 $ 595,000$950,000 . . . . . . . . . . . . . . . . . . . $249,000 $333,000 $416,000 $499,000 $582,000 $ 665,000$1,050,000 . . . . . . . . . . . . . . . . . $276,000 $368,000 $459,000 $551,000 $643,000 $ 735,000$1,150,000 . . . . . . . . . . . . . . . . . $302,000 $403,000 $503,000 $604,000 $704,000 $ 805,000$1,250,000 . . . . . . . . . . . . . . . . . $328,000 $438,000 $547,000 $656,000 $766,000 $ 875,000$1,350,000 . . . . . . . . . . . . . . . . . $354,000 $473,000 $591,000 $709,000 $827,000 $ 945,000$1,450,000 . . . . . . . . . . . . . . . . . $381,000 $508,000 $634,000 $761,000 $888,000 $1,015,000
The Pepco Holdings Retirement Plan consists of the Pepco General Retirement Plan and the ConectivRetirement Plan.
The Pepco General Retirement Plan provides participating employees with at least five years of service withretirement benefits based on the participant’s average salary (the term “salary” being equal to the amountscontained in the Salary column of the Summary Compensation Table) for the final three years of employmentand the number of years of credited service under the Plan at the time of retirement. Normal retirement under thisPlan is age 65. Plan benefits are subject to an offset for any Social Security benefits. Benefits under the Plan maybe reduced under provisions of the Internal Revenue Code and by salary deferrals under Pepco’s deferredcompensation plans (but not the participant’s pre-tax contributions made under the Retirement Savings Plan). Ifan executive’s retirement benefits under the Plan are reduced by either or both of these limitations, Pepco willpay a supplemental retirement benefit to the eligible executive that is designed to maintain total retirementbenefits at the formula level of the Plan. In addition, for executives who retire at age 59 or older, their retirementbenefit will be calculated by adding the average of the highest three annual incentive awards in the last fiveconsecutive years to their average salary over the final three years of their employment. The annual incentiveamounts are equal to the amounts shown in the Bonus column of the Summary Compensation Table. The currentage, years of credited service and compensation (assuming the individual had retired on January 1, 2006) used todetermine retirement benefits (including supplemental benefits) for the officers named in the SummaryCompensation Table who are participants in the Plan are as follows: Mr. Wraase, age 62, 37 years of creditedservice and $1,142,274 and Mr. Torgerson, age 61, 36 years of credited service and $688,682. Annual benefits atage 65 (including the effect of the Social Security offset) are illustrated in the table above.
Messrs. Shaw, Rigby and Spence participate in the Conectiv Retirement Plan and the ConectivSupplemental Executive Retirement Plan. The Conectiv Retirement Plan is a cash balance pension plan, but alsoincludes certain “grandfathered” rights under the Delmarva Retirement Plan, in which Messrs. Shaw and Spenceparticipated, and under the Atlantic City Electric Retirement Plan, in which Mr. Rigby participated, that apply toemployees who had attained either 20 years of service or age 50 on or before January 1, 1999. The ConectivSupplemental Executive Retirement Plan provides supplemental retirement benefits to which the participatingexecutives would be entitled in the absence of federal tax law limitations on the benefits payable under theConectiv Retirement Plan.
Under the Conectiv Retirement Plan, a record-keeping account in a participant’s name is credited with anamount equal to a percentage of the participant’s total pay, including base pay, overtime and bonuses, dependingon the participant’s age at the end of the plan year. For Messrs. Shaw, Rigby and Spence, the percentagecurrently is 10%, 9% and 9%, respectively. These accounts also receive interest credits equal to prevailing U.S.Treasury Bill rates during the year. In addition, some of the annuity benefits earned by participants under the
19

former Delmarva Retirement Plan and Atlantic City Electric Retirement Plan are fully protected as ofDecember 31, 1998, and were converted to an equivalent cash amount and included in each participant’s initialcash balance account. Benefits generally become vested after five years of service. When a participant terminatesemployment, the amount credited to his or her account is converted into an annuity or paid in a lump sum. Thereis no Social Security offset under the Conectiv Retirement Plan. The estimated retirement benefits, includingsupplemental retirement benefits, payable to Messrs. Shaw, Rigby and Spence under the Conectiv RetirementPlan, calculated based on the cash balance formula and including the Delmarva Retirement Plan or Atlantic CityElectric Retirement Plan credit, if the executive were to retire at normal retirement age of 65, expressed in theform of a lump sum payment, would be $7,238,000 for Mr. Shaw, $3,758,000 for Mr. Rigby and $2,067,000 forMr. Spence.
Under the Conectiv Retirement Plan’s grandfathering provisions, employees who participated in theDelmarva Retirement Plan or the Atlantic City Electric Retirement Plan and who met age and servicerequirements as of January 1, 1999, are assured a minimum retirement benefit calculated for all years of serviceup to the earlier of December 31, 2008, or retirement according to their original benefit formula under theapplicable plan. There is no Social Security offset under either the Delmarva Retirement Plan or the Atlantic CityElectric Retirement Plan. This benefit will be compared to the cash balance account and the employee willreceive whichever is greater. The benefit is payable in the form of various annuity options or a lump sum. OnDecember 31, 2008, the participant’s grandfathered benefit under the Delmarva Retirement Plan or Atlantic CityElectric Retirement Plan will be frozen, and all future benefit accruals will be under the cash balance formula ofthe Conectiv Retirement Plan.
Messrs. Shaw and Spence were participants in the Delmarva Retirement Plan. Their annual benefits underthe Plan at age 65, as supplemented by the Conectiv Supplemental Executive Retirement Plan, are illustrated inthe table below. Mr. Shaw’s current years of credited service and earnings (assuming he had retired on January 1,2006) used to determine retirement benefits (including supplemental benefits) are as follows: age 58, 34 years ofcredited service and $913,091. Mr. Spence’s current years of credited service and earnings (assuming he hadretired on January 1, 2006) used to determine retirement benefits (including supplemental benefits) are asfollows: age 48, 18 years of credited service and $455,604. Earnings consist of base salary and bonus as shown inthe Salary and Bonus columns of the Summary Compensation Table.
DELMARVA PENSION PLAN TABLE
Average Annual Earnings for the5 Consecutive Years of Earningsthat result in the Highest Average
Annual Retirement Benefits
Years in Plan
15 20 25 30 35 40
$300,000 . . . . . . . . . . . . . . . . . . . . . . . . . . $ 72,000 $ 96,000 $120,000 $144,000 $168,000 $192,000$400,000 . . . . . . . . . . . . . . . . . . . . . . . . . . $ 96,000 $128,000 $160,000 $192,000 $224,000 $256,000$500,000 . . . . . . . . . . . . . . . . . . . . . . . . . . $120,000 $160,000 $200,000 $240,000 $280,000 $320,000$600,000 . . . . . . . . . . . . . . . . . . . . . . . . . . $144,000 $192,000 $240,000 $288,000 $336,000 $384,000$700,000 . . . . . . . . . . . . . . . . . . . . . . . . . . $168,000 $224,000 $280,000 $336,000 $392,000 $448,000$800,000 . . . . . . . . . . . . . . . . . . . . . . . . . . $192,000 $256,000 $320,000 $384,000 $448,000 $512,000$900,000 . . . . . . . . . . . . . . . . . . . . . . . . . . $216,000 $288,000 $360,000 $432,000 $504,000 $576,000$1,000,000 . . . . . . . . . . . . . . . . . . . . . . . . . $240,000 $320,000 $400,000 $480,000 $560,000 $640,000$1,100,000 . . . . . . . . . . . . . . . . . . . . . . . . . $264,000 $352,000 $440,000 $528,000 $616,000 $704,000
20

Mr. Rigby was a participant in the Atlantic City Electric Retirement Plan. His annual benefits under the Planat age 65, as supplemented by the Conectiv Supplemental Executive Retirement Plan, are illustrated in the tablebelow. Mr. Rigby’s current years of credited service and earnings (assuming he had retired on January 1, 2006)used to determine retirement benefits (including supplemental benefits) are as follows: age 49, 27 years ofcredited service and $469,786. Earnings consist of base salary and bonus as shown in the Salary and Bonuscolumns of the Summary Compensation Table.
ATLANTIC CITY ELECTRIC PENSION PLAN TABLE
Average Salary and Bonus of the Highest FiveConsecutive Years of the Ten Years PrecedingRetirement
Annual Retirement Benefits
Years in Plan
15 20 25 30 35 40
$200,000 . . . . . . . . . . . . . . . . . . . . . . . . . . $ 48,000 $ 64,000 $ 80,000 $ 96,000 $112,000 $128,000$300,000 . . . . . . . . . . . . . . . . . . . . . . . . . . $ 72,000 $ 96,000 $120,000 $144,000 $168,000 $192,000$400,000 . . . . . . . . . . . . . . . . . . . . . . . . . . $ 96,000 $128,000 $160,000 $192,000 $224,000 $256,000$500,000 . . . . . . . . . . . . . . . . . . . . . . . . . . $120,000 $160,000 $200,000 $240,000 $280,000 $320,000$600,000 . . . . . . . . . . . . . . . . . . . . . . . . . . $144,000 $192,000 $240,000 $288,000 $336,000 $384,000
EMPLOYMENT AGREEMENTS
Messrs. Wraase, Torgerson, Shaw, Rigby and Spence each have employment agreements with theCompany. Mr. Wraase’s and Mr. Torgerson’s agreements each provide for employment through August 1, 2007,and automatically extend until April 1, 2009 for Mr. Wraase and June 1, 2009 for Mr. Torgerson, unless eitherthe Company or the executive gives notice that it shall not be extended. Mr. Shaw’s agreement provides forhis employment through August 1, 2007. Messrs. Rigby’s and Spence’s agreements provide for their respectiveemployment through August 1, 2005, and automatically extend for successive periods of three years thereafter,unless either the Company or the executive gives notice that it shall not be so extended. Each of the employmentagreements provides that the executive (i) will receive an annual salary in an amount not less than his base salaryin effect as of August 1, 2002, and incentive compensation as determined by the Board of Directors and (ii) willbe entitled to participate in retirement plans, fringe benefit plans, supplemental benefit plans and other plans andprograms, on the same basis as other senior executives of the Company.
Under each of the employment agreements, the executive is entitled to certain benefits if his employment isterminated prior to the expiration of the initial term of the agreement (or, if extended, the expiration of theextension period) either (i) by the Company other than for cause, death or disability or (ii) by the executive if hisbase salary is reduced, he is not in good faith considered for incentive awards, the Company fails to provide himwith retirement benefits and other benefits provided to similarly situated executives, he is required to relocate bymore than 50 miles from Washington, D.C. (or, in the case of Mr. Shaw, he is required to relocate by more than50 miles from Wilmington, Delaware, except that he may be required to locate to the Washington, D.C. area), orhe is demoted from a senior management position. These benefits include: (i) a lump sum payment in cash equalto three times (a) the sum of the executive’s highest annual base salary rate in effect during the three-year periodpreceding termination and (b) the higher of (1) the annual target bonus for the year in which the termination ofemployment occurs or (2) the highest annual bonus received by the executive in any of the three precedingcalendar years and (ii) the executive’s annual bonus for the year preceding termination of employment, if not yetpaid, and a pro rata portion of the executive’s annual bonus for the year in which the executive’s employmentterminates. In addition, any outstanding shares of restricted stock will become immediately vested, and theexecutive will be entitled to receive unpaid salary through the date of termination and certain supplementalretirement benefits under existing plans of the Company. Each of the agreements also provides that the executiveis entitled to receive a gross-up payment equal to the amount of any federal excise taxes imposed uponcompensation payable upon termination of employment and the additional taxes that result from such payment.In addition, under his employment agreement, Mr. Shaw on each of August 1, 2003, 2004 and 2005 was creditedwith one additional year of service and deemed one year older than his actual age for purposes of determining hisbenefits under the Conectiv Supplemental Executive Retirement Plan.
21

CERTAIN RELATIONSHIPS AND RELATED TRANSACTIONS
Pauline Schneider, a director of the Company, is a partner in the law firm of Hunton & Williams. Hunton &Williams rendered legal services to subsidiaries of the Company in 2005 and is expected to render services to theCompany’s subsidiaries in 2006.
REPORT OF THE COMPENSATION/HUMAN RESOURCES COMMITTEEON EXECUTIVE COMPENSATION
The Compensation/Human Resources Committee of the Board of Directors (the “Committee”) is composedentirely of independent directors. The Committee, together with the other independent members of the Board ofDirectors, sets the CEO’s compensation level after taking into account the annual evaluation of the CEO’sperformance conducted by the Corporate Governance/Nominating Committee and such other factors as theCommittee deems appropriate. The Committee’s responsibilities include review of the performance of electedofficers and other executives in the context of the administration of the Company’s executive compensationprograms. The Committee also approves the salaries for the executive officers and the heads of the majorsubsidiaries, as well as the salaries of the Vice Presidents of the Company. The Committee establishesperformance guidelines under the Executive Incentive Compensation Plan, sets awards for the executive officersand the heads of the major subsidiaries pursuant to the Executive Incentive Compensation Plan, approvespayments to the Vice Presidents made pursuant to the Executive Incentive Compensation Plan and establishes thestructure of compensation and amounts of awards under the shareholder-approved Long-Term Incentive Plan.The Committee also reviews other elements of compensation and benefits and makes recommendations to theBoard as appropriate. In order to carry out these responsibilities the Committee employs its own independentcompensation consultant and receives input from the Chief Executive Officer and management, as it deemsappropriate.
Officer Compensation Philosophy
The objective of the Company’s executive compensation program is to attract and retain key executives witha program that compensates executive officers competitively with other companies in the industry and rewardsexecutives for achieving levels of operational excellence and financial results, which increase shareholder value.In this way, the program provides a strong and direct link between compensation and executive performance andshort- and long-term Company performance. To be competitive, the Company’s compensation policy is toprovide a total compensation opportunity comparable to the median compensation levels of energy utilitycompanies of a similar size.
The compensation program for executives consists of three components: (i) base salary, (ii) annual cashincentive awards under Executive Incentive Compensation Plan and (iii) long-term incentive awards under theLong-Term Incentive Plan. The combination of these three elements is intended to balance short- and long-termbusiness performance goals and align executive financial rewards with Company operating results andshareholder return. Total compensation for any specific year may be above the median in the event performanceexceeds goals, or below the median if performance falls short of goals.
Annual incentive awards are earned based on the Company’s financial and operational plans and results,including annual earnings. For 2005, long-term incentive awards were in the form of performance restrictedshares of Common Stock (“Restricted Stock”) that will be earned at the end of a three-year performance period tothe extent pre-established goals relating to total shareholder returns are met. The executive compensationprogram for 2005 was structured so that between 33 and 65% of the total compensation opportunity, dependingon the responsibility level of the executive, was in the form of performance incentive compensation.
In order to further align the interests of executives with those of the shareholders, the Company adoptedstock ownership requirements for executives effective January 1, 2005. Ownership requirements are expressed asa multiple of salary. Officers are given until December 31, 2010, or five years after their election, whichever is
22

later, to attain the ownership guidelines. The following table is the amount of Common Stock required to beowned by the Company’s officers, expressed as a multiple of salary.
Chief Executive Officer . . . . . . . . . . . . . . . . . . . . . . . . . . . . . . . . . 5 times salaryExecutive Vice President, Vice Chairman . . . . . . . . . . . . . . . . . . . 3 times salarySenior Vice President . . . . . . . . . . . . . . . . . . . . . . . . . . . . . . . . . . . 2 times salaryVice President . . . . . . . . . . . . . . . . . . . . . . . . . . . . . . . . . . . . . . . . . 1 times salary
Under Section 162(m) of the Internal Revenue Code, a public company is prohibited from deducting forfederal income tax purposes compensation in excess of $1 million paid to any of the company’s five highest paidexecutive officers, except if the compensation in excess of $1 million qualifies for an exemption, such as the“performance-based compensation” exemption. The Company’s Long-Term Incentive Plan has been designed toallow the Committee to grant options and performance Restricted Stock that will qualify as performance-basedcompensation. However, the Committee and the Board of Directors retain the discretion under the Long-TermIncentive Plan to design compensation arrangements that do not qualify as “performance-based compensation”within the meaning of Section 162(m) if either determines that such compensation arrangements are in the bestinterests of the Company. The Restricted Stock awarded in January 2006 which vests solely on the basis ofcontinued employment, rather than performance, will not qualify as performance-based compensation in the yearin which it vests. Cash awards under the Company’s Executive Incentive Compensation Plan also do not qualifyas “performance-based compensation” within the meaning of Section 162(m).
Executive Compensation Plan Review
In 2005, the Committee retained the services of an independent compensation consultant to review all of theCompany’s compensation plans and make recommendations for plan changes, where appropriate. The reviewcovered base salary and total cash compensation levels, short-term and long-term incentive programs design,employment/severance agreements, retirement benefit plans, deferred compensation plans, and perquisites. Basedon the review of its consultant’s data, the Committee has taken the following actions commencing in 2006 to furtheralign the interests of the Company’s executives and senior management with investors’ long-term interests:
• Modified Peer Group. The Committee’s first step in studying appropriate compensation levels was toensure that the Committee was comparing the Company’s compensation to the appropriate peer group.Commencing in 2006, the Committee modified the Company’s peer group with the following results:
New Peer Group Old Peer Group
• Expanded peer group 24 companies 20 companies• Refined the composition of the
group to be closer in size to theCompany• Total assets1 $11,226,000,000 $3,457,000,000• Market capitalization1 $ 4,321,000,000 $1,828,000,000
• Reduced the number of gas-onlyutility companies 1 7
• Salary Structure. For 2005, pay levels were determined for executives and senior management basedon a review of external market movement in combination with internal equity and performance. For thepurpose of setting salaries in 2006 and succeeding years, the Committee’s consultants conducted acompetitive review of base salaries and total cash compensation for executives and senior management.Based on that review, the Committee established an executive and senior management pay structure toprovide consistency in pay across the Company. The pay structure consists of salary grades, whichprovide a market competitive range of pay for each position. Each executive and member of seniormanagement is placed into the appropriate grade based on market data with consideration given to
1 For the year ended 2004, the year used for establishing the peer group, the Company’s asset size was$13,349,000,000 and market capitalization was $4,408,000,000.
23

internal equity. Each pay grade has an associated target short-term and long-term incentive opportunity,expressed as a percent of base salary. These target opportunity levels are also based on competitivemarket data for the associated salary level. For 2006, the executive and senior managementcompensation program is structured so between 33 and 75% of total compensation, depending on theresponsibility of the executive or member of senior management, is in the form of performanceincentive compensation.
• Annual Incentive Plan. The Committee did not make any design changes to the Company’s ExecutiveIncentive Compensation Plan. The Committee’s consultants determined that the plan was in line withindustry and best practices in that it includes both financial and operational metrics and is largelyquantitative with some qualitative assessment of performance.
• Long-term Incentive Shift. In 2005, long-term incentive compensation program awards were in theform of performance Restricted Stock. The performance measure for determining long-term incentivecompensation payout was relative total shareholder return. For 2006, the Committee will continue to useperformance Restricted Stock but has added time-based vesting of Restricted Stock as anothercomponent to aid in executive and senior management retention. Also for 2006, the Committee ischanging the performance criteria to earnings growth and free cash flow. The Committee andmanagement believe that these performance criteria are the financial indicators that are most closely tiedto stock price and shareholder value. The program is designed so that 67% of the long-term awardpotential is in performance Restricted Stock and 33% is in the form of time-based Restricted Stock. Theperformance Restricted Stock vests upon achievement of three-year performance goals and the time-based Restricted Stock vests if the executive remains employed for the full three years. Depending onthe extent to which the pre-established performance criteria are satisfied, the participant can earn from0 to 200% of the target award of performance Restricted Stock. Performance will be determined bymeasuring average annual performance over the three-year performance period.
• Benefits and Perquisites. The Committee’s consultants reviewed the Company’s current perquisitepolicies and levels and determined they are conservative as compared to market best practices. Welfarebenefits offered to executives and senior management were the same as those offered to the generalemployee population. In addition, executives received perquisites related to the provision of anautomobile for use by the executive or an annual automobile allowance, financial planning and incometax preparation. No changes were made to these policies for 2006.
• Tally Sheets. In an effort to understand the total cost of the Company’s executive and seniormanagement compensation and benefits programs, the Committee reviewed tally sheets for all of theCompany’s executives and senior management. Tally sheets provide a snapshot of all elements ofremuneration including base salary, annual and long-term incentive opportunity, benefits andperquisites. The tally sheets also outlined the cost to the Company when an executive terminatesvoluntarily, involuntarily, or as a result of a change in control.
• Change in Control. The Committee believes the best time to consider the appropriateness of change ofcontrol provisions is when a change of control is not imminent and before the absence of such a planposes a risk to corporate policy effectiveness. As a result, the Committee considered each cost elementof a change in control plan as a percent of market capitalization and found it to be reasonable andconsistent with market practice, while still providing fair and adequate protection to executives andsenior management. The Committee recognizes the importance of reducing the risk that the fear of jobloss will influence executives and members of senior management considering strategic opportunitiesthat may include a change of control of the Company, and avoiding distractions that may result frompotential, rumored or actual changes of control. Accordingly, the Committee adopted aChange-in-Control Severance Plan for Certain Executive Officers. Severance benefits are only paid if achange of control occurs and an executive is terminated without cause or by the participant for goodreason. Each of the Named Executive Officers has an individual employment agreement with theCompany which addresses their respective severance benefits, and, accordingly, is not a participant inthe Change-in-Control Severance Plan for Certain Executive Officers.
24

Modifications were also made to executive retirement benefit plans and deferred compensation plans tobring them into compliance with the provisions of Internal Revenue Code Section 409A.
Factors Considered in Making Compensation Decisions
The CEO makes recommendations for compensation actions for his direct reports, which the Committeeindividually reviews, discusses, adjusts in its judgment and approves. The Committee also reviews thecompensation decisions for senior management who report to the CEO’s direct reports. The Committeejudgments regarding executive compensation are primarily based on the Committee’s assessment of eachexecutive’s performance and potential to enhance long-term stockholder value. Key factors affecting theCommittee’s judgment include: the nature and scope of the executive’s responsibilities; the executive’scontribution to the Company’s financial and operating results; and the executive’s effectiveness in leading theCompany’s initiatives to increase customer satisfaction and shareholder value.
Salary—In setting each executive’s 2006 salary, the Committee used input from the Committee’sconsultant along with management recommendations for individual adjustments. The consultant used publishedsurvey sources as well as a review of proxy statements from the new peer group of companies in the energyutility industry. Consistently effective individual performance is a threshold requirement for any salary increase.The CEO recommended base salary adjustments for certain executives using industry market movements as aguideline while also considering the relationship of current pay to market data, performance and internal equity.Following a review and discussion, the Committee approved base salary adjustments for the executives takinginto account the recommendations of the CEO. The Committee also developed a recommendation for the 2006pay increase of the CEO for consideration by the independent members of the Board of Directors for approval.
Short-Term Incentives—For 2005, performance goals established for annual cash bonus awards to themembers of the Company’s senior management, including the President and Chief Executive Officer, under theExecutive Incentive Compensation Plan were based on (1) earnings relative to the corporate plan, (2) cash availablefor debt reduction, (3) electric system reliability, (4) diversity and (5) safety. For 2005, a target bonus level of 60%of base salary was set for the CEO. For 2005, results related to the performance criteria were as follows:(1) earnings were significantly above target, (2) cash for debt reduction significantly exceeded target, (3) electricsystem reliability was above target, (4) diversity was at target and (5) safety was below target. Each component wasassigned a weighting prior to the performance period. Based on the overall results, the corporate performance wasset at 121.6% of target. Corporate performance is used to determine the award level for the CEO.
Long-Term Incentives—Under the Long-Term Incentive Plan, the Committee has instituted a series ofPerformance Restricted Stock Programs under which executives of the Company have the opportunity to earnRestricted Stock awards based on the extent to which pre-established performance criteria are achieved overgenerally a three-year performance period. In 2006, the Committee adopted a performance program with a three-year performance period that ends in 2008. The target awards that can be earned by the CEO were establishedusing competitive compensation levels for CEOs consistent with the goal of maintaining compensation at themedian level of utility companies of similar size.
In connection with the merger of Pepco and Conectiv, the Committee implemented, effective August 1,2002, a retention and performance plan entitled Merger Integration Success Program, adopted under the Long-Term Incentive Plan. The Merger Integration Success Program had two components: (1) Restricted Stock grantsvesting over three years (20% in 2003, 30% in 2004, and 50% in 2005), provided the executive remained anemployee of the Company, and (2) performance Restricted Stock, which was to vest in two equal installmentsdepending on the extent to which operating efficiencies and expense reduction goals were attained throughDecember 31, 2003 and December 31, 2004, respectively. Although these goals were met in 2003, theCommittee determined that the shares which would have vested in 2003 would not vest until 2005, and then onlyif the cost reduction goals were maintained and the Company’s financial performance was satisfactory.
25

For 2005, the cost reduction goals were exceeded and the Company’s financial performance had improved asmeasured by earnings growth, debt reduction and improved credit statistics and the shares vested. The CEO wasawarded 9,421 shares of Common Stock.
In 2002, the Pepco Board of Directors granted executives the opportunity to earn awards of Restricted Stockbased on the Company’s total shareholder return as compared to 20 peer utility companies over a three-yearperformance period beginning in 2003 and ending in 2005. For the three-year period, total shareholder return wasbelow the threshold level of performance of the plan and accordingly no shares were earned.
Compensation of the Chief Executive Officer
In 2005, the Committee increased Mr. Wraase’s salary from $769,000 to $825,000. The amount of thesalary increase was set to position Mr. Wraase at a level comparable to the CEOs of the utility company peergroup then in effect, with consideration given to the CEO’s performance evaluation conducted by the CorporateGovernance/Nominating Committee. In making its evaluation, the Corporate Governance/NominatingCommittee considered the successes in debt reduction, the Common Stock offering, succession planning andmanagement development, diversity efforts, safety record, emergency response capability, business unitintegration, Sarbanes-Oxley compliance, strategic plan implementation, and the overall progress in improvingshareholder return.
During 2005, the Committee’s consultant reviewed the group of companies used to make executive paydecisions and recommended changes to better align the size and business of peer companies with the Company (see“Executive Compensation Plan Review — Modified Peer Group”). The CEO’s compensation was found to bebelow the 50th percentile of the new peer group and below the 25th percentile of a survey of utility company CEOs,size-adjusted to the Company’s fiscal year-end 2004 revenues. In 2005, the Corporate Governance/NominatingCommittee’s evaluation of the CEO considered the Company’s performance in debt reduction, reliabilityimprovements, strategic planning and third-party recognition of the Company’s diversity practices. The CorporateGovernance/Nominating Committee also recognized the continued success in succession planning and thesuccessful return to the traditional brand names of the Company’s utilities. The Corporate Governance/NominatingCommittee’s 2005 evaluation of CEO performance indicated to the Committee that the CEO should becompensated more closely with the market median. Accordingly, the Committee began to address this shortfall in2006 through increases in base salary and short- and long-term incentive opportunity. Effective in 2006, a salary of$950,000, a target short-term incentive of 100% of salary, and a target long-term incentive of 200% of salary havebeen set for Mr. Wraase. Consistent with the other executives, two-thirds of the long-term incentive will be in theform of performance Restricted Stock and one-third will be in the form of Restricted Stock.
In addition to reviewing market data, the Committee also considered the relationship between Mr. Wraase’spay and that of the other Company executives. The Committee believes the relative differences are appropriate.The Committee and the independent members of the Board of Directors have had discussions and made decisionsrelative to Mr. Wraase’s compensation in executive session, without the CEO present.
In summary, a substantial portion of Mr. Wraase’s potential compensation for 2005 and 2006 is incentivebased with the achievement of specific performance results required to earn awards. As a result, the Committeebelieves his total compensation package meets the Committee’s compensation objectives, is in line with theCommittee’s compensation philosophy, and supports the Company’s business strategy.
COMPENSATION/HUMAN RESOURCESCOMMITTEE
Richard B. McGlynn, ChairmanGeorge F. MacCormackFloretta D. McKenziePeter F. O’MalleyFrank K. Ross
26

FIVE-YEAR PERFORMANCE GRAPH 2001-2005
The following chart compares the Company’s five-year cumulative total return to shareholders consisting ofthe change in stock price and reinvestment of dividends with the five-year cumulative total return on theStandard & Poor’s 500 Stock Index (the “S&P 500”) and the Dow Jones Utilities Index. Prior to August 1, 2002,the total return is for the common stock of Potomac Electric Power Company. After August 1, 2002, the totalreturn is for the Common Stock.
Cumulative Total Return
2000 2001 2002 2003 2004 2005
Pepco Holdings . . . . . . . . . . . . . . . . . . . . . . . . . . . . . . $100.00 $96.20 $86.66 $92.21 $105.75 $115.95S&P 500 Index . . . . . . . . . . . . . . . . . . . . . . . . . . . . . . $100.00 $88.17 $68.73 $88.41 $ 97.99 $102.80Dow Jones Utilities . . . . . . . . . . . . . . . . . . . . . . . . . . . $100.00 $73.87 $56.64 $73.11 $ 95.08 $118.81
27

AUDIT COMMITTEE REPORT
Among its duties, the Audit Committee is responsible for recommending to the Board of Directors that theCompany’s financial statements be included in the Company’s Annual Report on Form 10-K. The Committeetook a number of steps as a basis for making this recommendation for 2005. First, the Audit Committee discussedwith PricewaterhouseCoopers LLP, the Company’s independent registered public accounting firm for 2005,those matters that PricewaterhouseCoopers LLP is required to communicate to and discuss with the AuditCommittee under Statement on Auditing Standards No. 61, as amended (Communication with AuditCommittees), which included information regarding the scope and results of the audit. These communicationsand discussions are intended to assist the Audit Committee in overseeing the financial reporting and disclosureprocess. Second, the Audit Committee discussed with PricewaterhouseCoopers LLP the firm’s independence andreceived from PricewaterhouseCoopers LLP a letter concerning independence as required by IndependentStandards Board No. 1 (Independence Discussions with Audit Committees). This discussion and disclosureinformed the Audit Committee of PricewaterhouseCoopers LLP’s relationships with the Company and wasdesigned to assist the Audit Committee in considering PricewaterhouseCoopers LLP’s independence. Finally, theAudit Committee reviewed and discussed, with the Company’s management and with PricewaterhouseCoopersLLP, the Company’s audited consolidated balance sheets at December 31, 2005 and 2004, and the Company’sconsolidated statements of earnings, comprehensive earnings, shareholders’ equity and cash flows for the threeyears ended December 31, 2005, including the notes thereto. Management is responsible for the consolidatedfinancial statements and reporting process, including the system of internal controls and disclosure controls. Theindependent registered public accounting firm is responsible for expressing an opinion on the conformity of theseconsolidated financial statements with accounting principles generally accepted in the United States. Based onthe discussions with management and PricewaterhouseCoopers LLP concerning the audit, the independencediscussions, and the financial statement review and discussions, and such other matters deemed relevant andappropriate by the Audit Committee, the Audit Committee recommended to the Board that these consolidatedfinancial statements be included in the Company’s 2005 Annual Report on Form 10-K.
The Audit Committee, in accordance with its charter, conducts an annual evaluation of the performance ofits duties. Based on this evaluation, the Committee concluded that it performed effectively in 2005.
AUDIT COMMITTEE
Lawrence C. Nussdorf, ChairmanTerence C. GoldenRichard B. McGlynnFrank K. Ross
28

2. RATIFICATION OF INDEPENDENT REGISTERED PUBLIC ACCOUNTING FIRM
The Audit Committee of the Board of Directors of the Company appointed PricewaterhouseCoopers LLP asindependent registered public accounting firm for the Company for the year 2005. The Audit Committee hasreappointed the firm for 2006. A representative of PricewaterhouseCoopers LLP is expected to attend the AnnualMeeting and will be given the opportunity to make a statement and to respond to appropriate questions.
Although the Company is not required to seek shareholder ratification of this appointment, the Boardbelieves it to be sound corporate governance to do so. If the appointment is not ratified, the Audit Committee willtake this fact into consideration when selecting the Company’s independent registered public accounting firm for2007. Even if the selection is ratified, the Audit Committee may in its discretion direct the appointment of adifferent independent registered public accounting firm at any time during the year if the Committee determinesthat a change would be in the best interests of the Company and its shareholders.
Audit Fees
The aggregate fees billed by PricewaterhouseCoopers LLP for professional services rendered for the auditof the Company’s and subsidiaries’ annual financial statements for the 2005 and 2004 fiscal years and thereviews of the financial statements included in the Company’s and subsidiary reporting companies’ 2005 and2004 Forms 10-Q were $5,354,083 and $6,801,420, respectively. The amount for 2004 includes $543,328 for the2004 audit that was billed after the 2005 Pepco Holdings proxy statement was filed.
Audit-Related Fees
The aggregate fees billed by PricewaterhouseCoopers LLP for audit-related services rendered for the 2005and 2004 fiscal years were $170,053 and $586,088, respectively. These services consist of employee benefit planaudits, accounting consultations, internal control reviews, computer systems post-implementation reviews, andattest services for financial reporting not required by statute or regulation.
Tax Fees
The aggregate fees billed by PricewaterhouseCoopers LLP for tax services rendered for the 2005 and 2004fiscal years were $8,400 and $261,680, respectively. These services consisted of tax compliance, tax advice andtax planning, including advice relating to tax accounting in connection with the 2000, 2001 and 2002 Conectivtax returns and the 2002 Conectiv Services, Inc. tax return.
All Other Fees
The aggregate fees billed by PricewaterhouseCoopers LLP for all other services other than those coveredunder “Audit Fees,” “Audit-Related Fees” and “Tax Fees” for the 2005 and 2004 fiscal years were $3,000 and$55,600, respectively. Of the amount for 2005, $1,500 was for a research service subscription renewal for PHIService Company, and $1,500 was for a research service subscription renewal for Pepco Energy Services, Inc. Ofthe amount for 2004, $33,300 was for the executive tax services program, $19,300 was for depositions providedin litigation related to the Chalk Point oil spill, $1,500 was for a research service subscription renewal for PHIService Company and $1,500 was for a research service subscription renewal for Pepco Energy Services, Inc.
All of the services described in “Audit Fees,” “Audit-Related Fees,” “Tax Fees” and “All Other Fees” wereapproved in advance by the Audit Committee, in accordance with the Audit Committee Policy on the Approvalof Services by the Independent Auditor which is attached to this Proxy Statement as Annex A.
What vote is required to ratify the selection of the independent registered public accounting firm?
Ratification of the appointment of the independent registered public accounting firm requires the affirmativevote of the holders of a majority of the Common Stock present and entitled to vote at a meeting of shareholdersat which a quorum is present.
29

How are the votes counted?
Shares, if any, which are the subject of an abstention with regard to the vote on this proposal, will beconsidered present and entitled to vote, and accordingly will have the same effect as a vote against the proposal.Any shares that are the subject of a “broker non-vote” will not be considered present and entitled to vote and,therefore, will not be included in the denominator when determining whether the requisite percentage of shareshas been voted in favor of this matter.
THE BOARD OF DIRECTORS UNANIMOUSLY RECOMMENDS A VOTE IN FAVOR OFRATIFICATION OF THE INDEPENDENT REGISTERED PUBLIC ACCOUNTING FIRM, WHICH IS
SET FORTH AS ITEM 2 ON THE PROXY CARD.
30

SHAREHOLDER PROPOSALS AND DIRECTOR NOMINATIONS
What is the deadline for submission of shareholder proposals for inclusion in the Company’s Proxy Statementfor the 2007 Annual Meeting?
In order to be considered for inclusion in the Proxy Statement for the 2007 Annual Meeting, shareholderproposals must be received by the Company on or before November 29, 2006.
May a shareholder introduce a resolution for a vote at a future annual meeting?
Under the Company’s Bylaws, a shareholder may introduce a resolution for consideration at a future AnnualMeeting if the shareholder complies with the advance notice provisions set forth in the Bylaws. These provisionsrequire that for a shareholder to properly bring business before an Annual Meeting, the shareholder must givewritten notice to the Company’s Secretary at 701 Ninth Street, N.W., Washington, D.C. 20068, not less than 100days nor more than 120 days prior to the date of the meeting (or if the date of the meeting is more than 30 daysbefore or after the anniversary date of the Annual Meeting in the prior year, then the written notice must bereceived no later than the close of business on the tenth day following the earlier of the date on which notice orpublic announcement of the date of the meeting was given or made by the Company). The shareholder’s noticemust set forth a description of the business desired to be brought before the meeting and the reasons forconducting the business at the Annual Meeting, the name and record address of the shareholder, the class andnumber of shares owned beneficially and of record by the shareholder, and any material interest of theshareholder in the proposed business. The Company will publicly announce the date of its 2007 Annual Meetingat a later date.
May a shareholder nominate or recommend an individual for election as a director of the Company?
Under the Company’s Bylaws, a shareholder may nominate an individual for election as a director at a futureAnnual Meeting by giving written notice of the shareholder’s intention to the Company’s Secretary at 701 NinthStreet, N.W., Washington, D.C. 20068, not less than 100 days nor more than 120 days prior to the date of themeeting (or if the date of the meeting is more than 30 days before or after the anniversary date of the AnnualMeeting in the prior year, then the written notice must be received no later than the close of business on the tenthday following the earlier of the date on which notice or public announcement of the date of the meeting was givenor made by the Company). The notice provided to the Secretary must set forth the name and record address of thenominating shareholder and the class and number of shares of capital stock of the Company beneficially owned bysuch shareholder; and, for each nominee, the nominee’s name, age, business address, residence address, principaloccupation or employment, the class and number of shares of the Company’s capital stock beneficially owned bythe nominee, and any other information concerning the nominee that would be required to be included in a proxystatement. The Company will publicly announce the date of its 2007 Annual Meeting at a later date.
A shareholder also may recommend for the consideration of the Corporate Governance/NominatingCommittee one or more candidates to serve as a nominee of the Company for election as a director. Any suchrecommendations for the 2007 Annual Meeting must be submitted in writing to the Secretary of the Company onor before November 29, 2006, accompanied by the information described in the preceding paragraph.
What principles has the Board adopted with respect to Board membership? What are the specific qualities orskills that the Corporate Governance/Nominating Committee has determined are necessary for one or more ofthe directors to possess?
The Board has approved the following principles with respect to Board membership. The Board shouldinclude an appropriate blend of independent and management directors, which should result in independentdirectors being predominant, and in the views of the Company’s management being effectively represented.Accordingly, the number of independent directors should never be less than seven and the management directorsshould always include the Chief Executive Officer, there should never be more than three management directors,and any management directors other than the Chief Executive Officer should be selected from the Company’sExecutive Leadership Team.
31

For independent directors, the Corporate Governance/Nominating Committee seeks the appropriate balanceof experience, skills and personal characteristics required of a director. In order to be considered for nominationto the Board, a director candidate should possess most or all of the following attributes: independence, as definedby the NYSE listing standards as currently in effect; integrity; judgment; credibility; collegiality; professionalachievement; constructiveness; and public awareness. The independent directors should possess, in aggregate,skill sets that include but are not limited to: financial acumen equivalent to the level of a Chief Financial Officeror senior executive of a capital market, investment or financial services firm; operational or strategic acumengermane to the energy industry, or other industry with similar characteristics (construction, manufacturing, etc.);public and/or government affairs acumen germane to complex enterprises, especially in regulated industries;customer service acumen germane to a service organization with a large customer base; legal acumen in thefield(s) of regulatory or commercial law at the partner or chief legal officer level; salient community ties in areasof operation of the Company’s enterprises; and corporate governance acumen, gained through service as a seniorofficer or director of a large publicly held corporation or through comparable academic or other experience.Independent directors are also selected to ensure diversity, in the aggregate, which diversity should includeexpertise or experience germane to the Company’s total business needs, in addition to other generally understoodaspects of diversity.
What is the process for identifying and evaluating nominees for director (including nominees recommendedby security holders)?
The Corporate Governance/Nominating Committee has developed the following identification andevaluation process which is contained in the Company’s Corporate Governance Guidelines and can be found onthe Company’s Web site (www.pepcoholdings.com) under the link: Corporate Governance:
a. List of Potential Candidates. The Corporate Governance/Nominating Committee develops andmaintains a list of potential candidates for Board membership. Potential candidates are recommended byCommittee members and other Board members. Shareholders may put forward potential candidates for theCommittee’s consideration by following submission requirements published in the Company’s proxy statementfor the previous year’s meeting.
b. Candidate Attributes, Skill Sets and Other Criteria. The Committee annually reviews the attributes,skill sets and other qualifications for potential candidates and may modify them from time to time based upon theCommittee’s assessment of the needs of the Board and the skill sets required to meet those needs.
c. Review of Candidates. All potential candidates are reviewed by the Committee against the currentattributes, skill sets and other qualifications established by the Board to determine if a candidate is suitable forBoard membership. If a candidate is deemed suitable based on this review, a more detailed review will beperformed through examination of publicly available information. This examination will include consideration ofthe independence requirement for outside directors, the number of boards on which the candidate serves, thepossible applicability of restrictions on director interlocks or other requirements or prohibitions imposed byapplicable laws or regulations, proxy disclosure requirements, and any actual or potentially perceived conflicts ofinterest or other issues raised by applicable laws or regulations or the Company’s policies or practices.
d. Prioritization of Candidates. The Committee then (i) determines whether any candidate needs to beremoved from consideration as a result of the detailed review, and (ii) determines a recommended priority amongthe remaining candidates for recommendation to and final determination by the Board prior to direct discussionwith any candidate.
e. Candidate Contact. Following the Board’s determination of a priority-ranked list of approved potentialcandidates, the Chairman of the Committee or, at his or her discretion, other member(s) of the Board will contactand interview the potential candidates in priority order. When a potential candidate indicates his or herwillingness to accept nomination to the Board, no further candidates will be contacted. Subject to a final reviewof eligibility under the Company’s policies and applicable laws and regulations using information supplieddirectly by the candidate, the candidate will then be nominated.
32

3. OTHER MATTERS WHICH MAY COME BEFORE THE MEETING
Does the Board of Directors know of any additional matters to be acted upon at the Annual Meeting?
The Board of Directors does not know of any other matter to be brought before the meeting.
If another matter does come before the meeting, how will my proxy be voted?
If any other matter should properly come before the meeting, your signed proxy card, as well as yourInternet or telephone proxy, gives the designated proxy holders discretionary authority to vote on such matters inaccordance with their best judgment.
How are proxies being solicited and who pays for the costs involved?
The Company will bear the costs of solicitation of proxies, including the reimbursement of banks andbrokers for certain costs incurred in forwarding proxy materials to beneficial owners. In addition to the use of themails, officers, directors and regular employees of the Company may solicit proxies personally, by telephone orfacsimile or via the Internet. These individuals will not receive any additional compensation for these activities.
Why was only a single Proxy Statement mailed to households that have multiple holders of Common Stock?
Under the rules of the SEC, a company is permitted to deliver a single proxy statement and annual report toany household at which two or more shareholders reside, if the shareholders at the address of the household havethe same last name or the company reasonably believes that the shareholders are members of the same family.Accordingly, the Company is sending only one copy of this Proxy Statement and 2005 Annual Report toShareholders that shared the same last name and address, unless the Company has received instructions to thecontrary from one or more of the shareholders.
Under these SEC rules, brokers and banks that hold stock for the account of their customers also arepermitted to deliver single copies of proxy statements and annual reports to two or more shareholders that sharethe same address. If you and other residents at your mailing address own shares of Common Stock through abroker or bank, you may have received a notice notifying you that your household will be sent only one copy ofproxy statements and annual reports. If you did not notify your broker or bank of your objection, you may havebeen deemed to have consented to the arrangement.
If, in accordance with these rules, your household received only a single copy of this Proxy Statement and2005 Annual Report to Shareholders and you would like to receive a separate copy or you would like to receiveseparate copies of the Company’s proxy statements and annual reports in the future, please contact AmericanStock Transfer & Trust Company, the Company’s transfer agent:
By Telephone: 1-866-254-6502 (toll-free)
In Writing: American Stock Transfer & Trust Company6201 15th AvenueBrooklyn, NY 11219-9821
If you own your shares through a brokerage firm or a bank, your notification should include the name ofyour brokerage firm or bank and your account number.
If you are a record holder of shares of Common Stock who is receiving multiple copies of the Company’sshareholder communications at your address and you would like to receive only one copy for your household,please contact American Stock Transfer & Trust Company at the telephone number or address set forth above. Ifyou own your shares through a brokerage firm or a bank, please contact your broker or bank.
33

Where do I find the Company’s Corporate Business Policies, Corporate Governance Guidelines andCommittee Charters?
The Company has in place Corporate Business Policies, which in their totality constitute its code of businessconduct and ethics. These Policies apply to all directors, employees and others working at the Company and itssubsidiaries. The Company’s Board of Directors has also adopted Corporate Governance Guidelines and chartersfor the Company’s Audit Committee, Compensation/Human Resources Committee and Corporate Governance/Nominating Committee which conform to the requirements set forth in the New York Stock Exchange listingstandards. The Board of Directors has also adopted charters for the Company’s Executive Committee and FinanceCommittee. Copies of these documents are available on the Company Web site at http://www.pepcoholdings.com/governance/index.html and also can be obtained by writing to: Ellen Sheriff Rogers, Vice President and Secretary,701 Ninth Street, N.W., Suite 1300, Washington, D.C. 20068.
Any amendment to, or waiver of, any provision of the Corporate Business Policies with respect to anydirector or executive officer of the Company will be promptly reported to shareholders through the filing of aForm 8-K with the SEC.
The Letter to Shareholders which begins on the cover page of this document and the Annual Report toShareholders, including the Business of the Company, Management’s Discussion and Analysis and theConsolidated Financial Statements, and other shareholder information included in Annex B to this ProxyStatement are not deemed to be “soliciting material” or to be “filed” with the SEC under or pursuant to theSecurities Act of 1933 or the Exchange Act of 1934 and shall not be incorporated by reference or deemed to beincorporated by reference into any filing by the Company under either such Act, unless otherwise specificallyprovided for in such filing.
34

ANNEX A
PEPCO HOLDINGS, INC.AUDIT COMMITTEE
Policy on the Approval of ServicesProvided By the Independent Auditor
I. Overview
Under the federal securities laws and the rules of the Securities and Exchange Commission (the “SEC”), theannual consolidated financial statements of Pepco Holdings, Inc. (the “Company”) and each of its subsidiariesthat has a reporting obligation (a “Reporting Company”) under the Securities Exchange Act of 1934, as amended(the “Exchange Act”), must be audited by an “independent” public accountant. Likewise, the quarterly financialstatements of the Company and each Reporting Company must be reviewed by an “independent” publicaccountant.
Under SEC regulations, a public accountant is not “independent” if it provides certain specified non-auditservices to an audit client. In addition, a public accountant will not qualify as “independent” unless (i) before theaccountant is engaged to provide audit or non-audit services, the engagement is approved by the publiccompany’s audit committee or (ii) the engagement to provide audit or non-audit services is pursuant topre-approved policies and procedures established by the audit committee.
Under the Audit Committee Charter, the Audit Committee of the Company has sole authority (i) to retainand terminate the Company’s independent auditors, (ii) to pre-approve all audit engagement fees and terms and(iii) to pre-approve all significant audit-related relationships with the independent auditor. This Policy sets forththe policies and procedures adopted by the Audit Committee with respect to the engagement of the Company’sindependent auditor to provide audit and non-audit services to the Company and its subsidiaries (as defined byRule 1-02 (x) of SEC Regulation S-X).
The Audit Committee also serves as the audit committee for each subsidiary of the Company that is aReporting Company for the purpose of approving audit and non-audit services to be provided by the independentauditor(s) of such Reporting Companies. In this capacity, the Audit Committee has determined that this Policyalso shall govern the engagement of the independent auditor for each such Reporting Company.
II. Statement of Principles
The Audit Committee recognizes the importance of maintaining the independence of its external auditorboth in fact and appearance. In order to ensure that the independence of the Company’s external auditor is not, inthe judgment of the Audit Committee, impaired by any other services that the external auditor may provide to theCompany and its subsidiaries:
• The Audit Committee shall approve in advance all services—both audit and permitted non-auditservices—provided to the Company or any of its subsidiaries by the Company’s independent auditor inaccordance with the procedures set forth in this Policy.
• The Audit Committee shall not engage the Company’s independent auditor to provide to the Companyor any of its subsidiaries any non-audit services that are unlawful under Section 10A of the ExchangeAct or that would impair the independence of the Company’s independent auditor under the standardsset forth in Rule 2-01 of SEC Regulation S-X (“Prohibited Non-Audit Services”).
A-1

III. Approval of Annual Audit Services
The annual audit services provided to the Company and its subsidiaries by the Company’s independentauditor shall consist of:
• The audit of the annual consolidated financial statements of the Company and each other ReportingCompany and the other procedures required to be performed by the independent auditor to be able toform an opinion on the financial statements.
• Review of the quarterly consolidated financial statements of the Company and each ReportingCompany.
• The attestation engagement for the independent auditor’s report on management’s statement on theeffectiveness of the Company’s internal control over financial reports.
• Services associated with SEC registration statements, periodic reports and other documents filed withthe SEC or issued in connection with securities offerings, including consents and comfort lettersprovided to underwriters, reviews of registration statements and prospectuses, and assistance inresponding to SEC comment letters.
All such audit services must be approved annually by the Audit Committee following a review by the AuditCommittee of the proposed terms and scope of the engagement and the projected fees. Any subsequent change ofa material nature in the terms, scope or fees associated with such annual audit services shall be approved inadvance by the Audit Committee.
Any additional audit services may be pre-approved annually at the meeting at which the annual auditservices are approved. If not pre-approved, each additional annual audit service must be approved by the AuditCommittee in advance on a case-by-case basis.
IV. Approval of Audit-Related Services
Audit-related services consist of assurance and related services that are reasonably related to theperformance of the audit or review of the financial statements of the Company and each Reporting Company,other than the annual audit services described in Section III above. Audit-related services may include, but arenot limited to:
• Employee benefit plan audits.
• Due diligence related to mergers and acquisitions.
• Accounting consultations and audits in connection with acquisitions.
• Internal control reviews.
• Attest services related to financial reporting that are not required by statute or regulation.
Audit-related services may be pre-approved annually at the meeting at which the annual audit services areapproved. If not pre-approved, each audit-related service must be approved by the Audit Committee in advanceon a case-by-case basis.
V. Approval of Tax Services
Tax services consist of professional services rendered by the independent auditor to the Company or any ofits subsidiaries for tax compliance, tax advice and tax planning. Tax services may be pre-approved annually atthe meeting of the Audit Committee at which the annual audit services are approved. If not pre-approved, eachtax service must be approved by the Audit Committee in advance on a case-by-case basis.
A-2

VI. Approval of All Other Services
Any other services to be provided by the Company’s independent auditor, other than Prohibited Non-AuditServices, may be pre-approved annually at the meeting of the Audit Committee at which the annual auditservices are approved. If not pre-approved, each such other service must be approved by the Audit Committee inadvance on a case-by-case basis.
VII. Procedures
At the meeting of the Audit Committee to select the independent auditor for the Company and each of theReporting Companies, the Chief Financial Officer shall submit to the Audit Committee a list of the additionalaudit services, audit-related services, tax services and other services, if any, that the Company and the RelatedCompanies wish to have pre-approved for the ensuing year. The list shall be accompanied by:
• a written description (which may consist of or include a description furnished to the Company by theindependent auditor) of the services to be provided in detail sufficient to enable the Audit Committee tomake an informed decision with regard to each proposed service, and, to the extent determinable, anestimate provided by the independent auditor of the fees for each of the services; and
• confirmation of the independent auditor that (i) it would not be unlawful under Section 10A of theExchange Act for the independent auditor to provide the listed non-audit services to the Company orany of its subsidiaries and (B) none of the services, if provided by the independent auditor to theCompany or any of its subsidiaries, would impair the independence of the auditor under the standardsset forth in Rule 2-01 of SEC Regulation S-X.
If a type of non-audit service is pre-approved by the Audit Committee, and the Company or any of itssubsidiaries subsequently engages the independent auditor to provide that service, the Company’s ChiefFinancial Officer shall report the engagement to the Audit Committee at its next regularly scheduled meeting.
VIII. Delegation
The Audit Committee hereby delegates to the Chairman of the Audit Committee the authority to approve,upon the receipt of the documentation referred to in Section VII above, on a case-by-case basis any non-auditservice of the types referred to in Sections IV, V and VI above (i.e. an audit-related, tax or other service) at anytime other than at a meeting of the Audit Committee. The Chairman shall report any services so approved to theAudit Committee at its next regularly scheduled meeting. In no circumstances shall the responsibilities of theAudit Committee under this Policy be delegated to the management of the Company or any of its subsidiaries.
A-3

[THIS PAGE INTENTIONALLY LEFT BLANK]

ANNEX B
PAGE
TABLE OF CONTENTS
Glossary of Terms . . . . . . . . . . . . . . . . . . . . . . . . . . . . . . . . . . . . . . . . . . . . . . . . . . . . . . . . . . . . . . . . . . . . . B-2
Consolidated Financial Highlights . . . . . . . . . . . . . . . . . . . . . . . . . . . . . . . . . . . . . . . . . . . . . . . . . . . . . . . . B-6
Business of the Company . . . . . . . . . . . . . . . . . . . . . . . . . . . . . . . . . . . . . . . . . . . . . . . . . . . . . . . . . . . . . . . B-8
Management’s Discussion and Analysis of Financial Condition and Results of Operations . . . . . . . . . . . . B-18
Quantitative and Qualitative Disclosures . . . . . . . . . . . . . . . . . . . . . . . . . . . . . . . . . . . . . . . . . . . . . . . . . . . B-76
Management’s Report on Internal Control Over Financial Reporting . . . . . . . . . . . . . . . . . . . . . . . . . . . . . B-78
Report of Independent Registered Public Accounting Firm . . . . . . . . . . . . . . . . . . . . . . . . . . . . . . . . . . . . . B-78
Consolidated Statements of Earnings . . . . . . . . . . . . . . . . . . . . . . . . . . . . . . . . . . . . . . . . . . . . . . . . . . . . . . B-80
Consolidated Statements of Comprehensive Earnings . . . . . . . . . . . . . . . . . . . . . . . . . . . . . . . . . . . . . . . . . B-81
Consolidated Balance Sheets . . . . . . . . . . . . . . . . . . . . . . . . . . . . . . . . . . . . . . . . . . . . . . . . . . . . . . . . . . . . B-82
Consolidated Statements of Cash Flows . . . . . . . . . . . . . . . . . . . . . . . . . . . . . . . . . . . . . . . . . . . . . . . . . . . . B-84
Consolidated Statements of Shareholders’ Equity . . . . . . . . . . . . . . . . . . . . . . . . . . . . . . . . . . . . . . . . . . . . B-85
Notes to Consolidated Financial Statements . . . . . . . . . . . . . . . . . . . . . . . . . . . . . . . . . . . . . . . . . . . . . . . . . B-86
Quarterly Financial Information (unaudited) . . . . . . . . . . . . . . . . . . . . . . . . . . . . . . . . . . . . . . . . . . . . . . . . B-146
Board of Directors and Officers . . . . . . . . . . . . . . . . . . . . . . . . . . . . . . . . . . . . . . . . . . . . . . . . . . . . . . . . . . B-148
Investor Information . . . . . . . . . . . . . . . . . . . . . . . . . . . . . . . . . . . . . . . . . . . . . . . . . . . . . . . . . . . . . . . . . . . B-149
Forward-Looking Statements: Except for historical statements and discussions, the statements in thisannual report constitute “forward-looking statements” within the meaning of federal securities law. Thesestatements contain management’s beliefs based on information currently available to management and on variousassumptions concerning future events. Forward-looking statements are not a guarantee of future performance orevents. They are subject to a number of uncertainties and other factors, many of which are outside the company’scontrol. Factors that could cause actual results to differ materially from those in the forward-looking statementsherein include general economic, business and financing conditions; availability and cost of capital; changes inlaws, regulations or regulatory policies; weather conditions; competition; governmental actions; and otherpresently unknown or unforeseen factors. These uncertainties and factors could cause actual results to differmaterially from such statements. Pepco Holdings disclaims any intention or obligation to update or revise anyforward-looking statements, whether as a result of new information, future events or otherwise. This informationis presented solely to provide additional information to understand further the results and prospects of PepcoHoldings.
B-1

GLOSSARY OF TERMS
Term Definition
ABO Accumulated benefit obligationAccounting hedges Derivatives designated as cash flow and fair value hedgesACE Atlantic City Electric CompanyACE Funding Atlantic City Electric Transition Funding LLCACO Administrative Consent OrderAct Prescription Drug, Improvement and Modernization Act of 2003ADITC Accumulated deferred investment tax creditsAFUDC Allowance for Funds Used During ConstructionAgreement and Plan of Merger Agreement and Plan of Merger, dated as of February 9, 2001, among PHI,
Pepco and ConectivAncillary services Generally, electricity generation reserves and reliability servicesAPB Accounting Principles BoardAPBO Accumulated Postretirement Benefit ObligationAPCA Air Pollution Control ActAsset Purchase and Sale
AgreementAsset Purchase and Sale Agreement, dated as of June 7, 2000 and
subsequently amended, between Pepco and Mirant (formerly SouthernEnergy, Inc.) relating to the sale of Pepco’s generation assets
Bankruptcy Court Bankruptcy Court for the Northern District of TexasBankruptcy Emergence Date January 3, 2006, the date Mirant emerged from bankruptcyBGS Basic generation service in New Jersey (the supply of energy to customers
who have not chosen a competitive supplier)BGS-FP BGS-Fixed Price serviceBGS-CIEP BGS-Commercial and Industrial Energy Price serviceBondable Transition Property Right to collect a non-bypassable transition bond charge from ACE customers
pursuant to bondable stranded costs rate orders issued by the NJBPUBPU Financing Orders Bondable stranded costs rate orders issued by the NJBPUBTP Bondable Transition PropertyCAA Federal Clean Air ActCAIR EPA’s Clean Air Interstate ruleCAMR EPA’s Clean Air Mercury ruleCBI Conectiv Bethlehem, LLCCERCLA Comprehensive Environmental Response, Compensation, and Liability Act of
1980CESI Conectiv Energy Supply, Inc.Circuit Court U.S. Court of Appeals for the Fifth CircuitCO2 Carbon DioxideCooling Degree Days Daily difference in degrees by which the mean (high and low divided by 2)
dry bulb temperature is above a base of 65 degrees Fahrenheit.Competitive Energy Business Consists of the business operations of Conectiv Energy and Pepco Energy
ServicesConectiv A wholly owned subsidiary of PHI which is a holding company under
PUHCA 2005 and the parent of DPL and ACEConectiv Energy Conectiv Energy Holding Company and its subsidiariesConectiv Power Delivery The trade name under which DPL and ACE formerly conducted their power
delivery operationsCRMC PHI’s Corporate Risk Management CommitteeCTs Combustion turbinesCWA Federal Clean Water ActDCPSC District of Columbia Public Service Commission
B-2

Term Definition
DER Discrete Emission Reduction CreditsDistrict Court U.S. District Court for the Northern District of TexasDNREC Delaware Department of Natural Resources and Environmental ControlDPL Delmarva Power & Light CompanyDPSC Delaware Public Service CommissionDRP PHI’s Shareholder Dividend Reinvestment PlanEDECA New Jersey Electric Discount and Energy Competition ActEDIT Excess Deferred Income TaxesEITF Emerging Issues Task ForceEnergy Act Energy Policy Act of 2005EPA U.S. Environmental Protection AgencyERISA Employment Retirement Income Security Act of 1974Exchange Act Securities Exchange Act of 1934, as amendedFASB Financial Accounting Standards BoardFERC Federal Energy Regulatory CommissionFinancing Order Financing Order of the SEC under PUHCA 1935 dated June 30, 2005, with
respect to PHI and its subsidiariesFirstEnergy FirstEnergy Corp., formerly Ohio EdisonFirstEnergy PPA PPAs between Pepco and FirstEnergy Corp. and Allegheny Energy, Inc.First Motion to Reject The motion Mirant filed with the Bankruptcy Court in August 2003 seeking
authorization to reject the PPA-Related ObligationsGCR Gas Cost RecoveryGPC Generation Procurement CreditHeating Degree Days Daily difference in degrees by which the mean (high and low divided by 2)
dry bulb temperature is below a base of 65 degrees Fahrenheit.IRC Internal Revenue CodeIRS Internal Revenue ServiceITC Investment Tax CreditKwh Kilowatt hourLEAC Liability ACE’s $59.3 million deferred energy cost liability existing as of July 31, 1999
related to ACE’s Levelized Energy Adjustment Clause and ACE’s DemandSide Management Programs
LTIP Pepco Holdings’ Long-Term Incentive PlanMarch 2005 Orders Orders entered in March 2005 by the District Court granting Pepco’s motion
to withdraw jurisdiction over rejection proceedings from the BankruptcyCourt and ordering Mirant to continue to perform the PPA-RelatedObligations
Mcf One thousand cubic feetMDE Maryland Department of the EnvironmentMirant Mirant Corporation and its predecessors and its subsidiariesMirant Parties Mirant Corporation and its affiliate Mirant Americas Energy Marketing, LPMoody’s Moody’s Investor ServiceMPSC Maryland Public Service CommissionMTC Market Transition ChargeNJBPU New Jersey Board of Public UtilitiesNJDEP New Jersey Department of Environmental ProtectionNJPDES New Jersey Pollutant Discharge Elimination SystemNew Mirant Common Stock Common stock of Mirant issued pursuant to the Reorganization Plan
B-3

Term Definition
Normalization provisions Sections of the Internal Revenue Code and related regulations that dictate howexcess deferred income taxes resulting from the corporate income tax ratereduction enacted by the Tax Reform Act of 1986 and accumulated deferredinvestment tax credits should be treated for ratemaking purposes
NOx Nitrogen oxideNPDES National Pollutant Discharge Elimination SystemNSR New Source ReviewNUG Non-Utility GenerationOCI Other Comprehensive IncomePanda Panda-Brandywine, L.P.Panda PPA PPA between Pepco and PandaPARS Performance Accelerated Restricted StockPCI Potomac Capital Investment Corporation and its subsidiariesPepco Potomac Electric Power CompanyPepco’s pre-merger subsidiaries PCI and Pepco Energy ServicesPepco Energy Services Pepco Energy Services, Inc. and its subsidiariesPepco Holdings or PHI Pepco Holdings, Inc.Pepco TPA Claim Pepco’s $105 million allowed, pre-petition general unsecured claim against
each of the Mirant PartiesPJM PJM Interconnection, LLCPOLR Provider of Last Resort (the supply of energy to customers who have not
chosen a competitive supplier)POM Pepco Holdings’ NYSE trading symbolPPA Power Purchase AgreementPPA-Related Obligations Mirant’s obligations to purchase from Pepco the capacity and energy that
Pepco is obligated to purchase under the FirstEnergy PPA and the PandaPPA
Pre-Petition Claims Unpaid obligations of Mirant to Pepco existing at the time of filing ofMirant’s bankruptcy petition consisting primarily of payments due Pepco inrespect of the PPA-Related Obligations
PRP Potentially Responsible PartyPSD Prevention of Significant DeteriorationPUHCA 1935 Public Utility Holding Company Act of 1935, which was repealed effective
February 8, 2006PUHCA 2005 Public Utility Holding Company Act of 2005, which became effective
February 8, 2006RARC Regulatory Asset Recovery ChargeRecoverable stranded costs The portion of stranded costs that is recoverable from ratepayers as approved
by regulatory authoritiesRegulated electric revenues Revenues for delivery (transmission and distribution) service and electricity
supply serviceReorganization Plan Mirant’s Plan of ReorganizationRetirement Plan PHI’s noncontributory retirement planRGGI Regional Greenhouse Gas InitiativeRI/FS Remedial Investigation/Feasibility StudyS&P Standard & Poor’sSEC Securities and Exchange CommissionSettlement Agreement Amended Settlement Agreement and Release, dated as of October 24, 2003
between Pepco and the Mirant PartiesSMECO Southern Maryland Electric Cooperative, Inc.SMECO Agreement Capacity purchase agreement between Pepco and SMECO
B-4

Term Definition
SO2 Sulfur dioxideSOS Standard Offer Service (the supply of energy to customers who have not
chosen a competitive supplier)SPEs Special Purpose Entities as defined in FIN 46RStandard Offer Service revenue
or SOS revenueRevenue Pepco and DPL, respectively, receive for the procurement of energy
for its SOS customersStarpower Starpower Communications, LLCStranded costs Costs incurred by a utility in connection with providing service which would
be unrecoverable in a competitive or restructured market. Such costs mayinclude costs for generation assets, purchased power costs, and regulatoryassets and liabilities, such as accumulated deferred income taxes.
TPAs Transition Power Agreements for Maryland and the District of Columbiabetween Pepco and Mirant
Transition Bonds Transition bonds issued by ACE FundingTreasury lock A hedging transaction that allows a company to “lock-in” a specific interest
rate corresponding to the rate of a designated Treasury bond for adetermined period of time
VaR Value at RiskVEBA Voluntary Employee Beneficiary AssociationVRDB Variable Rate Demand BondsVSCC Virginia State Corporation Commission
B-5

CONSOLIDATED FINANCIAL HIGHLIGHTS
2005(Restated)2004 (a)
(Restated)2003 (a)
(PreviouslyReported)
2002(Restated)2002 (a)
(PreviouslyReported)
2001(Restated)2001 (a)
(In millions, except per share data)Consolidated Operating ResultsTotal Operating Revenue . . . . . . . . . . . . . $ 8,065.5 7,223.1 7,268.7 4,324.5 4,324.5 2,371.2 2,371.2Total Operating Expenses . . . . . . . . . . . . . $ 7,160.1(b)(c)(d) 6,451.0 6,658.0(g)(i) 3,778.9 3,778.6 2,004.8(j) 2,004.7(j)Operating Income . . . . . . . . . . . . . . . . . . . $ 905.4 772.1 610.7 545.6 545.9 366.4 366.5Other Expenses . . . . . . . . . . . . . . . . . . . . . $ 285.5 341.4 433.3(h) 190.4 191.4 105.3 104.8Preferred Stock Dividend Requirements
of Subsidiaries . . . . . . . . . . . . . . . . . . . $ 2.5 2.8 13.9 20.6 20.6 14.2 14.2Income Before Income Tax Expense
and Extraordinary Item . . . . . . . . . . . . . $ 617.4 427.9 163.5 334.6 333.9 246.9 247.5Income Tax Expense . . . . . . . . . . . . . . . . $ 255.2(e) 167.3(f) 62.1 124.1 124.9 83.5 83.1Income Before Extraordinary Item . . . . . . $ 362.2 260.6 101.4 210.5 209.0 163.4 164.4Extraordinary Item . . . . . . . . . . . . . . . . . . $ 9.0 — 5.9 — — — —Net Income . . . . . . . . . . . . . . . . . . . . . . . . $ 371.2 260.6 107.3 210.5 209.0 163.4 164.4Redemption Premium on Preferred
Stock . . . . . . . . . . . . . . . . . . . . . . . . . . . $ (.1) .5 — — — — —Earnings Available for Common Stock . . $ 371.1 261.1 107.3 210.5 209.0 163.4 164.4Common Stock InformationBasic Earnings Per Share of Common
Stock Before Extraordinary Item . . . . . $ 1.91 1.48 .60 1.61 1.59 1.51 1.52Basic—Extraordinary Item Per Share
of Common Stock . . . . . . . . . . . . . . . . . $ .05 — .03 — — — —Basic Earnings Per Share of Common
Stock . . . . . . . . . . . . . . . . . . . . . . . . . . . $ 1.96 1.48 .63 1.61 1.59 1.51 1.52Diluted Earnings Per Share of Common
Stock Before Extraordinary Item . . . . . $ 1.91 1.48 .60 1.61 1.59 1.50 1.51Diluted—Extraordinary Item Per Share
of Common Stock . . . . . . . . . . . . . . . . . $ .05 — .03 — — — —Diluted Earnings Per Share of Common
Stock . . . . . . . . . . . . . . . . . . . . . . . . . . . $ 1.96 1.48 .63 1.61 1.59 1.50 1.51Basic Common Shares Outstanding
(Avg.) . . . . . . . . . . . . . . . . . . . . . . . . . . 189.0 176.8 170.7 131.1 131.1 108.5 108.5Diluted Common Shares Outstanding
(Avg.) . . . . . . . . . . . . . . . . . . . . . . . . . . 189.3 176.8 170.7 131.1 131.1 108.8 108.8Cash Dividends Per Share of Common
Stock . . . . . . . . . . . . . . . . . . . . . . . . . . . $ 1.00 1.00 1.00 1.00 1.00 1.165 1.165Year-End Stock Price . . . . . . . . . . . . . . . . $ 22.37 21.32 19.54 19.39 19.39 22.57 22.57Book Value per Common Share . . . . . . . . $ 18.88 17.74 17.31 17.62 17.49 17.00 16.81Other InformationInvestment in Property, Plant and
Equipment . . . . . . . . . . . . . . . . . . . . . . . $11,384.2 11,047.8 10,748.0 10,625.0 10,626.5 4,361.9 4,361.9Net Investment in Property, Plant and
Equipment . . . . . . . . . . . . . . . . . . . . . . . $ 7,312.0 7,090.6 6,965.7 7,043.3 7,044.8 2,819.0 2,819.0Total Assets . . . . . . . . . . . . . . . . . . . . . . . $14,017.8 13,350.8 13,369.0 13,368.5 13,406.2 5,395.7 5,400.3CapitalizationShort-term Debt . . . . . . . . . . . . . . . . . . . . $ 156.4 319.7 518.4 971.1 971.1 350.2 350.2Long-term Debt . . . . . . . . . . . . . . . . . . . . $ 4,202.9 4,362.1 4,588.9 4,287.5 4,287.5 1,602.1 1,602.1Current Maturities of Long-Term Debt . . $ 469.5 516.3 384.9 408.1 408.1 109.2 109.2Transition Bonds issued by ACE
Funding . . . . . . . . . . . . . . . . . . . . . . . . . $ 494.3 523.3 551.3 425.3 425.3 — —Capital Lease Obligations due within
one year . . . . . . . . . . . . . . . . . . . . . . . . $ 5.3 4.9 4.4 4.1 4.1 3.3 3.3Capital Lease Obligations . . . . . . . . . . . . . $ 116.6 122.1 126.8 131.3 131.3 132.2 132.2Long-Term Project Funding . . . . . . . . . . . $ 25.5 65.3 68.6 28.6 28.6 21.7 21.7Debentures issued to Financing Trust . . . $ — — 98.0 — — — —Trust Preferred Securities . . . . . . . . . . . . . $ — — — 290.0 290.0 125.0 125.0Preferred Stock of Subsidiaries . . . . . . . . $ 45.9 54.9 108.2 110.7 110.7 84.8 84.8Common Shareholders’ Equity . . . . . . . . $ 3,584.1 3,339.0 2,974.1 2,995.8 2,972.8 1,823.2 1,801.8
Total Capitalization . . . . . . . . . . . . . $ 9,100.5 9,307.6 9,423.6 9,652.5 9,629.5 4,251.7 4,230.3
B-6

Note: As a result of the acquisition of Conectiv by Pepco that was completed on August 1, 2002, PHI’s 2005, 2004 and 2003amounts include PHI and its subsidiaries’ results for the full year. PHI’s 2002 amounts include Conectiv and its subsidiariespost-August 1, 2002 results with Pepco and its pre-merger subsidiaries (PCI and Pepco Energy Services) results for the fullyear in 2002. The amounts presented for 2001 represent only Pepco and its pre-merger subsidiaries’ results.
(a) As discussed in Note (15) to the consolidated financial statements of Pepco Holdings, Pepco Holdings restated its financialstatements to reflect the correction of the accounting for certain deferred compensation arrangements and other errors thatmanagement deemed to be immaterial.
(b) Includes $68.1 million ($40.7 million after tax) gain from sale of non-utility land owned by Pepco at Buzzard Point.(c) Includes $70.5 million ($42.2 million after tax) gain (net of customer sharing) from settlement of the Pepco TPA Claim and
the Pepco asbestos claim against the Mirant bankruptcy estate.(d) Includes $13.3 million ($8.9 million after tax) related to PCI’s liquidation of a financial investment that was written off in
2001.(e) Includes $10.9 million in income tax expense related to the mixed service cost issue under IRS Ruling 2005-53.(f) Includes a $19.7 million charge related to an IRS settlement. Also includes $13.2 million tax benefit related to issuance of a
local jurisdiction’s final consolidated tax return regulations.(g) Includes a charge of $50.1 million ($29.5 million after tax) related to a CT contract cancellation. Also includes a gain of $68.8
million ($44.7 million after tax) on the sale of the Edison Place office building.(h) Includes an impairment charge of $102.6 million ($66.7 million after tax) related to investment in Starpower
Communications, LLC.(i) Includes the unfavorable impact of $44.3 million ($26.6 million after tax) resulting from trading losses prior to the cessation
of proprietary trading.(j) Includes $55.5 million ($36.1 million after tax) impairment charge related to the write-down of aircraft leasing portfolio.
B-7

BUSINESS OF THE COMPANY
OVERVIEW
Pepco Holdings, Inc. (PHI or Pepco Holdings) is a public utility holding company that, through its operatingsubsidiaries, is engaged primarily in two principal business operations:
• electricity and natural gas delivery (Power Delivery), and
• competitive energy generation, marketing and supply (Competitive Energy).
PHI was incorporated in Delaware in 2001, for the purpose of effecting the acquisition of Conectiv by PotomacElectric Power Company (Pepco). The acquisition was completed on August 1, 2002, at which time Pepco andConectiv became wholly owned subsidiaries of PHI. Conectiv was formed in 1998 to be the holding company forDelmarva Power & Light Company (DPL) and Atlantic City Electric Company (ACE) in connection with thecombination of DPL and ACE. As a result, DPL and ACE are wholly owned subsidiaries of Conectiv. Thefollowing chart shows, in simplified form, the corporate structure of PHI and its principal subsidiaries.
On February 8, 2006, the Public Utility Holding Company Act of 1935 (PUHCA 1935) was repealed and thePublic Utility Holding Company Act of 2005 (PUHCA 2005) went into effect. As a result, PHI has ceased to beregulated by the Securities and Exchange Commission (SEC) as a public utility holding company and is now subjectto the regulatory oversight of the Federal Energy Regulatory Commission (FERC). As permitted under FERCregulations promulgated under PUHCA 2005, PHI will give notice to FERC that it will continue, until furthernotice, to operate pursuant to the authority granted in the financing order issued by the SEC under PUHCA 1935,which has an authorization period ending June 30, 2008, relating to the issuance of securities and guarantees, otherfinancing transactions and the operation of the money pool. See “Management’s Discussion and Analysis ofFinancial Condition and Results of Operations—PUHCA Restrictions” for additional information.
PHI Service Company, a subsidiary service company of PHI, provides a variety of support services,including legal, accounting, treasury, tax, purchasing and information technology services to PHI and itsoperating subsidiaries. These services are provided pursuant to a service agreement among PHI, PHI Service
B-8

Company, and the participating operating subsidiaries which was filed with, and approved by, the SEC underPUHCA 1935. The expenses of the service company are charged to PHI and the participating operatingsubsidiaries in accordance with cost allocation methodologies set forth in the service agreement. PHI expects tocontinue operating under the service agreement and is evaluating whether to seek FERC approval of the costallocation methodologies in the service agreement under PUHCA 2005.
For financial information relating to PHI’s segments, see Note (3) Segment Information to the consolidatedfinancial statements of PHI. This segment information includes a revision of PHI’s segments for 2003 to reflectthat, as of January 1, 2004, the formerly separate segments of Pepco Power Delivery and Conectiv PowerDelivery were combined to form one operating segment. Each of Pepco, DPL and ACE has one operatingsegment.
Investor Information
Each of PHI, Pepco, DPL and ACE is a reporting company under the Securities Exchange Act of 1934, asamended (the Exchange Act). The Annual Reports on Form 10-K, Quarterly Reports on Form 10-Q, CurrentReports on Form 8-K, and all amendments to those reports, of each of the companies are made available free ofcharge on PHI’s internet Web site as soon as reasonably practicable after such documents are electronicallyfiled with or furnished to the SEC. These reports may be found at http://www.pepcoholdings.com/investors.
The following is a description of each of PHI’s two principal areas of operation.
Power Delivery
The largest component of PHI’s business is Power Delivery, which consists of the transmission anddistribution of electricity and the distribution of natural gas. In 2005, 2004 and 2003, respectively, PHI’s PowerDelivery operations produced 58%, 61% and 55% of PHI’s consolidated operating revenues (includingintercompany transactions) and 74%, 70% and 82% of PHI’s consolidated operating income (including incomefrom intercompany transactions).
PHI’s Power Delivery business is conducted by its three regulated utility subsidiaries: Pepco, DPL andACE. Each subsidiary is a regulated public utility in the jurisdictions that comprise its service territory. PEPCO,DPL and ACE each owns and operates a network of wires, substations and other equipment that are classifiedeither as transmission or distribution facilities. Transmission facilities are high-voltage systems that carrywholesale electricity into, or across, the utility’s service territory. Distribution facilities are low-voltage systemsthat carry electricity to end-use customers in the utility’s regulated service territory.
Delivery of Electricity and Natural Gas and Default Electricity Supply
Each company is responsible for the delivery of electricity and, in the case of DPL, natural gas in its serviceterritory, for which it is paid tariff rates established by the local public service commission. Each company alsosupplies electricity at regulated rates to retail customers in its service territory who do not elect to purchaseelectricity from a competitive energy supplier. The regulatory term for this supply service varies by jurisdictionas follows:
Delaware Provider of Last Resort service (POLR)—before May 1, 2006Standard Offer Service (SOS)—on and after May 1, 2006
District of Columbia SOS
Maryland SOS
New Jersey Basic Generation Service (BGS)
Virginia Default Service
B-9

PHI and its subsidiaries refer to this supply service in each of the jurisdictions generally as DefaultElectricity Supply.
In the aggregate, the Power Delivery business delivers electricity to more than 1.8 million customers in themid-Atlantic region and distributes natural gas to approximately 120,000 customers in Delaware.
Transmission of Electricity and Relationship with PJM
The transmission facilities owned by Pepco, DPL and ACE are interconnected with the transmissionfacilities of contiguous utilities and as such are part of an interstate power transmission grid over whichelectricity is transmitted throughout the eastern United States. FERC has designated a number of regionaltransmission organizations to coordinate the operation and planning of portions of the interstate transmissiongrid. Pepco, DPL and ACE are members of the PJM Regional Transmission Organization. PJM Interconnection,LLC (PJM) provides transmission planning functions and acts as the independent system operator thatcoordinates the movement of electricity in all or parts of Delaware, Illinois, Indiana, Kentucky, Maryland,Michigan, New Jersey, North Carolina, Ohio, Pennsylvania, Tennessee, Virginia, West Virginia and the Districtof Columbia. FERC has designated PJM as the sole provider of transmission service in the PJM region. Anyentity that wishes to have electricity delivered at any point in the PJM region must obtain transmission servicesfrom PJM at rates approved by FERC. In accordance with FERC rules, Pepco, DPL, ACE and the othertransmission-owning utilities in the region make their transmission facilities available to PJM and PJM directsand controls the operation of these transmission facilities. In return for the use of their transmission facilities,PJM pays the transmission owners fees approved by FERC.
Distribution of Electricity and Deregulation
Historically, electric utilities, including Pepco, DPL and ACE, were vertically integrated businesses thatgenerated all or a substantial portion of the electric power that they delivered to customers in their serviceterritories over their own distribution facilities. Customers were charged a bundled rate approved by theapplicable regulatory authority that covered both the supply and delivery components of the retail electricservice. However, legislative and regulatory actions in each of the service territories in which Pepco, DPL andACE operate have resulted in the “unbundling” of the supply and delivery components of retail electric serviceand in the opening of the supply component to competition from non-regulated providers. Accordingly, whilePepco, DPL and ACE continue to be responsible for the distribution of electricity in their respective serviceterritories, as the result of deregulation, customers in those service territories now are permitted to choose theirelectricity supplier from among a number of non-regulated, competitive suppliers. Customers who do not choosea competitive supplier receive Default Electricity Supply on terms that vary depending on the service territory, asdescribed more fully below.
In connection with the deregulation of electric power supply, Pepco, DPL and ACE have divestedsubstantially all of their generation assets, either by selling them to third parties or transferring them to thenon-regulated affiliates of PHI that comprise PHI’s Competitive Energy businesses. Accordingly, Pepco, DPLand ACE are no longer engaged in generation operations, except for the limited generation activities of ACEdescribed in the “ACE” section, herein.
Seasonality
The power delivery business is seasonal and weather patterns can have a material impact on operatingperformance. In the region served by PHI, demand for electricity is generally greater in the summer monthsassociated with cooling and demand for electricity and natural gas is generally greater in the winter monthsassociated with heating, as compared to other times of the year. Historically, the power delivery operations ofeach of PHI’s utility subsidiaries have generated less revenues and income when weather conditions are milder inthe winter and cooler in the summer.
B-10

Regulation
The retail operations of PHI’s utility subsidiaries, including the rates they are permitted to charge customersfor the delivery of electricity and natural gas, are subject to regulation by governmental agencies in thejurisdictions in which they provide utility service. Pepco’s electricity delivery operations are regulated inMaryland by the Maryland Public Service Commission (MPSC) and in Washington, D.C. by the District ofColumbia Public Service Commission (DCPSC). DPL’s electricity delivery operations are regulated in Marylandby the MPSC, in Virginia by the Virginia State Corporation Commission (VSCC) and in Delaware by theDelaware Public Service Commission (DPSC). DPL’s natural gas distribution operations in Delaware areregulated by the DPSC. ACE’s electric delivery operations are regulated in New Jersey by the New Jersey Boardof Public Utilities (NJBPU). The wholesale and transmission operations for both electricity and natural gas ofeach of PHI’s utility subsidiaries are regulated by FERC.
Pepco
Pepco is engaged in the transmission and distribution of electricity in Washington, D.C. and major portionsof Prince George’s and Montgomery Counties in suburban Maryland. Pepco was incorporated in Washington,D.C. in 1896 and became a domestic Virginia corporation in 1949. Pepco’s service territory coversapproximately 640 square miles and has a population of approximately 2 million. As of December 31, 2005,Pepco delivered electricity to approximately 747,000 customers, as compared to 737,000 customers as ofDecember 31, 2004. Pepco delivered a total of approximately 27,594,000 megawatt hours of electricity in 2005,compared to approximately 26,902,000 megawatt hours in 2004. In 2005, approximately 30% was delivered toresidential customers, 51% to commercial customers, and 19% to United States and District of Columbiagovernment customers.
Under a settlement approved by the MPSC in April 2003, Pepco is required to provide SOS to residentialand small commercial customers through May 2008 and to medium-sized commercial customers through May2006, and was required to provide SOS to large commercial customers through May 2005. Pepco also has anobligation to provide service at hourly priced rates to the largest customers through May 2006. In accordancewith the settlement, Pepco purchases the power supply required to satisfy its SOS obligation from wholesalesuppliers under contracts entered into pursuant to a competitive bid procedure approved by the MPSC. Pepco isentitled to recover from its SOS customers the cost of the SOS supply plus an average margin of approximately$.002 per kilowatt hour (calculated at the time of the announcement of the contracts, based on total sales toresidential and small and large commercial Maryland SOS customers over the twelve months endedDecember 31, 2003). Because margins vary by customer class, the actual average margin over any given timeperiod depends on the number of Maryland SOS customers from each customer class and the load taken by suchcustomers over the time period. Pepco is paid tariff delivery rates for the delivery of electricity over itstransmission and distribution facilities to both SOS customers and customers in Maryland who have selectedanother energy supplier. These delivery rates are capped through December 31, 2006 pursuant to the MPSC orderissued in connection with the Pepco acquisition of Conectiv, but are subject to adjustment if FERC transmissionrates increase by more than 10%.
Under an order issued by the DCPSC in March 2004, as amended by a DCPSC order issued in July 2004,Pepco is obligated to provide SOS for small commercial and residential customers through May 31, 2011 and forlarge commercial customers through May 31, 2007. Pepco purchases the power supply required to satisfy its SOSobligation from wholesale suppliers under contracts entered into pursuant to a competitive bid procedureapproved by the DCPSC. Pepco is entitled to recover from its SOS customers the costs associated with theacquisition of the SOS supply plus administrative charges that are intended to allow Pepco to recover theadministrative costs incurred to provide the SOS. These administrative charges include an average margin forPepco of approximately $.00248 per kilowatt hour (calculated at the time of the announcement of the contracts,based on total sales to residential and small and large commercial District of Columbia SOS customers over thetwelve months ended December 31, 2003). Because margins vary by customer class, the actual average margin
B-11

over any given time period depends on the number of District of Columbia SOS customers from each customerclass and the load taken by such customers over the time period. Pepco is paid tariff delivery rates for thedelivery of electricity over its transmission and distribution facilities to both SOS customers and customers in theDistrict of Columbia who have selected another energy supplier. Delivery rates in the District of Columbiagenerally are capped through July 2007, but are subject to adjustment if FERC transmission rates increase bymore than 10%, except that for residential low-income customers, rates generally are capped through July 2009.
For the twelve months ended December 31, 2005, 62% of Pepco’s Maryland sales (measured by megawatthours) were to SOS customers, as compared to 71% in 2004 and 42% of its District of Columbia sales were toSOS customers, as compared to 68% in 2004.
DPL
DPL is engaged in the transmission and distribution of electricity in Delaware and portions of Maryland andVirginia and provides natural gas distribution service in northern Delaware. In Delaware, service is provided inthree counties, Kent, New Castle, and Sussex; in Maryland, service is provided in ten counties, Caroline, Cecil,Dorchester, Harford, Kent, Queen Anne’s, Somerset, Talbot, Wicomico, and Worchester; and in Virginia, serviceis provided to two counties, Accomack and Northampton. DPL was incorporated in Delaware in 1909 andbecame a domestic Virginia corporation in 1979. DPL’s electricity distribution service territory coversapproximately 6,000 square miles and has a population of approximately 1.28 million. DPL’s natural gasdistribution service territory covers approximately 275 square miles and has a population of approximately523,000. As of December 31, 2005, DPL delivered electricity to approximately 510,000 customers and deliverednatural gas to approximately 120,000 customers, as compared to 501,000 electricity customers and 118,000natural gas customers as of December 31, 2004.
In 2005, DPL delivered a total of approximately 14,101,000 megawatt hours of electricity to its customers,as compared to a total of approximately 13,902,000 megawatt hours in 2004. In 2005, approximately 40% ofDPL’s retail electricity deliveries were to residential customers, 38% were to commercial customers and 22%were to industrial customers. In 2005, DPL delivered approximately 20,700,000 Mcf (one thousand cubic feet) ofnatural gas to retail customers in its Delaware service territory, as compared to approximately 21,600,000 Mcf in2004. In 2005, approximately 41% of DPL’s retail gas deliveries were sales to residential customers, 27% weresales to commercial customers, 5% were sales to industrial customers, and 27% were sales to customersreceiving a transportation-only service.
Under a settlement approved by the DPSC, DPL is required to provide POLR service to customers inDelaware through April 2006. DPL is paid for supplying POLR service to customers in Delaware at fixed ratesestablished in the settlement. DPL obtains all of the energy needed to fulfill its POLR obligations in Delawareunder a supply agreement with its affiliate Conectiv Energy, which terminates in April 2006. DPL does not makeany profit or incur any loss on the supply component of the POLR supply that it delivers to its Delawarecustomers. DPL is paid tariff delivery rates for the delivery of electricity over its transmission and distributionfacilities to both POLR customers and customers who have selected another energy supplier. These delivery ratesgenerally are frozen through April 2006, except that DPL is allowed to file for a one-time transmission ratechange during this period. On March 22, 2005, the DPSC issued an order approving DPL as the SOS providerafter May 1, 2006, when DPL’s current fixed rate POLR obligation ends. DPL will retain the SOS obligation foran indefinite period until changed by the DPSC, and will purchase the power supply required to satisfy its SOSobligations from wholesale suppliers under contracts entered into pursuant to a competitive bid procedure. OnOctober 11, 2005, the DPSC approved a settlement agreement, under which DPL will provide SOS to allcustomer classes, with no specified termination date for SOS. Two categories of SOS will exist: (i) a fixed priceSOS available to all but the largest customers; and (ii) an Hourly Priced Service (HPS) for the largest customers.DPL will purchase the power supply required to satisfy its fixed-price SOS obligation from wholesale suppliersunder contracts entered into pursuant to a competitive bid procedure. Power to supply the HPS customers will be
B-12

acquired on next-day and other short-term PJM markets. In addition to the costs of capacity, energy,transmission, and ancillary services associated with the fixed-price SOS and HPS, DPL’s initial rates will includea component referred to as the Reasonable Allowance for Retail Margin (RARM). Components of the RARMinclude a fixed annual margin of $2.75 million, plus estimated incremental expenses, a cash working capitalallowance, and recovery with a return over five years of the capitalized costs of a billing system to be used forbilling HPS customers.
Under a settlement approved by the MPSC in April 2003, DPL is required to provide SOS to residential andsmall commercial customers through May 2008 and to medium-sized commercial customers through May 2006.In accordance with the settlement, DPL purchases the power supply required to satisfy its market rate SOSobligation from wholesale suppliers under contracts entered into pursuant to a competitive bid procedureapproved and supervised by the MPSC. DPL is entitled to recover from its SOS customers the costs of the SOSsupply plus an average margin of $.002 per kilowatt hour (calculated at the time of the announcement of thecontracts, based on total sales to residential and small and large commercial Maryland SOS customers over thetwelve months ended December 31, 2003). Because margins vary by customer class, the actual average marginover any given time period depends on the number of Maryland SOS customers from each customer class and theload taken by such customers over the time period. DPL is paid tariff delivery rates for the delivery of electricityover its transmission and distribution facilities to both SOS customers and customers in Maryland who haveselected another energy supplier. These delivery rates generally are capped through December 2006, subject toadjustment if FERC transmission rates increase by more than 10%.
Under amendments to the Virginia Electric Utility Restructuring Act implemented in March 2004, DPL isobligated to offer Default Service to customers in Virginia for an indefinite period until relieved of thatobligation by the VSCC. DPL currently obtains all of the energy and capacity needed to fulfill its Default Serviceobligations in Virginia under a supply agreement with Conectiv Energy that commenced on January 1, 2005 andexpires in May 2006 (the 2005 Supply Agreement). DPL entered into the 2005 Supply Agreement afterconducting a competitive bid procedure in which Conectiv Energy was the lowest bidder.
In October 2004, DPL filed an application with the VSCC for approval to increase the rates that DPLcharges its Default Service customers to allow it to recover its costs for power under the 2005 Supply Agreementplus an administrative charge and a margin. A VSCC order issued in November 2004 allowed DPL to put interimrates into effect on January 1, 2005, subject to refund if the VSCC subsequently determined the rates areexcessive. The interim rates reflected an increase of 1.0247 cents per kilowatt hour (Kwh) to the fuel rate, whichprovides for recovery of the entire amount being paid by DPL to Conectiv Energy, but did not include anadministrative charge or margin, pending further consideration of this issue. In January 2005, the VSCC ruledthat the administrative charge and margin are base rate items not recoverable through a fuel clause. On March 25,2005, the VSCC approved a settlement resolving all other issues and making the interim rates final.
DPL is paid tariff delivery rates for the delivery of electricity over its transmission and distribution facilitiesto both Default Service customers and customers in Virginia who have selected another energy supplier. Thesedelivery rates generally are frozen until December 31, 2010, except that DPL can propose two changes indelivery rates—one prior to July 1, 2007 and another between July 1, 2007 and December 31, 2010.
In Maryland, DPL sales to SOS customers represented 77% of total sales (measured by megawatt hours) forthe twelve months ended December 31, 2005, as compared to 80% in 2004. In Delaware, DPL sales to POLRcustomers represented 90% of total sales (measured by megawatt hours) for the twelve months endedDecember 31, 2005, as compared to 89% in 2004. In Virginia, DPL sales to Default Supply customersrepresented 100% of total sales (measured by megawatt hours) in both 2005 and 2004.
DPL also provides regulated natural gas supply and distribution service to customers in its Delaware naturalgas service territory. Large and medium volume commercial and industrial natural gas customers may purchasenatural gas either from DPL or from other suppliers. DPL uses its natural gas distribution facilities to transport
B-13

gas for customers that choose to purchase natural gas from other suppliers. These customers pay DPLdistribution service rates approved by the DPSC. DPL purchases natural gas supplies for resale to its sales servicecustomers from marketers and producers through a combination of long-term agreements and next-day deliveryarrangements. For the twelve months ended December 31, 2005, DPL supplied 72.8% of the natural gas that itdelivered, compared to 71.8% in 2004.
ACE
ACE is primarily engaged in the transmission and distribution of electricity in a service territory consistingof Gloucester, Camden, Burlington, Ocean, Atlantic, Cape May, Cumberland and Salem counties in southernNew Jersey. ACE was incorporated in New Jersey in 1924. ACE’s service territory covers approximately 2,700square miles and has a population of approximately 998,000. As of December 31, 2005, ACE deliveredelectricity to approximately 532,000 customers in its service territory, as compared to approximately 524,000customers as of December 31, 2004. ACE delivered a total of approximately 10,080,000 megawatt hours ofelectricity in 2005 compared to approximately 9,874,000 megawatt hours in 2004. In 2005, approximately 44%was delivered to residential customers, 43% was delivered to commercial customers and 13% was delivered toindustrial customers.
In accordance with a process mandated by the NJBPU, electric customers in New Jersey who do not chooseanother supplier receive BGS from their electric distribution company. Each of New Jersey’s electric distributioncompanies, including ACE, jointly procure the supply to meet their BGS obligations from competitive suppliersselected through two concurrent auctions authorized by the NJBPU for New Jersey’s total BGS requirement eachFebruary. The winning bidders in the auction are required to supply a specified portion of the BGS customer loadwith full requirements service, consisting of power supply and transmission service.
ACE provides two types of BGS:
• BGS-Fixed Price (BGS-FP), which is supplied to smaller commercial and residential customers atseasonally-adjusted fixed prices. BGS-FP rates change annually on June 1 and are based on the averageBGS price obtained at auction in the current year and two prior years. ACE’s BGS-FP load isapproximately 2,050 megawatts, which represents approximately 87% of ACE’s total BGS load.Approximately one-third of this total load is auctioned off each year for a three-year term.
• BGS-Commercial and Industrial Energy Price (BGS-CIEP), which is supplied to larger customers athourly PJM real-time market prices for a term of 12 months. ACE’s BGS-CIEP load is approximately300 megawatts, which represents approximately 13% of ACE’s BGS load. This total load is auctionedoff each year for a one-year term.
As of December 31, 2005, Conectiv Energy served four 100 megawatt blocks of BGS load in the ACEterritory.
ACE is paid tariff delivery rates for the delivery of electricity over its transmission and distribution facilitiesto both BGS customers and customers in its service territory who have selected another energy supplier. ACE isalso paid tariff rates established by the NJBPU that compensate it for the cost of obtaining the BGS fromcompetitive suppliers. ACE does not make any profit or incur any loss on the supply component of the BGS itprovides to customers.
ACE sales to New Jersey BGS customers represented 78% of total sales (measured by megawatt hours) forthe twelve months ended December 31, 2005 and 2004.
In addition to its electricity transmission and distribution operations, as of December 31, 2005, ACE ownedthe B.L. England electric generating facility (with a generating capacity of 447 megawatts) and a 2.47%undivided interest in the Keystone electric generating facility and a 3.83% undivided interest in the Conemaugh
B-14

electric generating facility. The combined generating capacity of these facilities is 555 megawatts. ACE also hascontracts with non-utility generators under which ACE purchased 3.8 million megawatt hours of power in 2005.ACE sells the electricity produced by the generating facilities and purchased under the non-utility generatorcontracts in the wholesale market administered by PJM. During 2005, ACE’s generation and wholesaleelectricity sales operations produced approximately 30% of ACE’s operating revenue.
On November 15, 2005, ACE entered into an agreement to sell its undivided interests in the Keystone andConemaugh generating facilities to Duquesne Light Holdings Inc. for $173.1 million. The sale, subject toapproval by the NJBPU, as well as other regulatory agencies and certain other legal conditions, is expected to becompleted mid-year 2006. In December 2005, ACE filed testimony with the NJBPU in estimating that its netgains on the sale of the generating stations will be approximately $126.9 million; however, the net gainsultimately realized will be dependent upon the timing of the closing of the sale, transaction costs and otherfactors. The net gains will be an offset to stranded costs.
ACE is continuing its efforts to sell the B.L. England generating facility. On January 24, 2006, PHI,Conectiv and ACE entered into an administrative consent order (ACO) with the New Jersey Department ofEnvironmental Protection (NJDEP) and the Attorney General of New Jersey, which provides that ACE willpermanently cease operation of the B.L. England generating facility by December 15, 2007 if it does not sell thefacility before then. The shut-down is contingent upon the receipt by ACE of necessary approvals fromapplicable regulatory authorities and permits to construct certain electric transmission facilities in southern NewJersey. See “Environmental Matters—Air Quality Regulation.”
In 2001, ACE established Atlantic City Electric Transition Funding L.L.C. (ACE Funding) solely for thepurpose of securitizing authorized portions of ACE’s recoverable stranded costs through the issuance and sale ofbonds (Transition Bonds). The proceeds of the sale of each series of Transition Bonds have been transferred toACE in exchange for the transfer by ACE to ACE Funding of the right to collect a non-bypassable transitionbond charge from ACE customers pursuant to bondable stranded costs rate orders issued by the NJBPU in anamount sufficient to fund the principal and interest payments on the Transition Bonds and related taxes, expensesand fees (Bondable Transition Property). The assets of ACE Funding, including the Bondable TransitionProperty, and the Transition Bond charges collected from ACE’s customers, are not available to creditors ofACE. The holders of Transition Bonds have recourse only to the assets of ACE Funding.
Competitive Energy
PHI’s Competitive Energy business provides non-regulated generation, marketing and supply of electricityand natural gas, and related energy management services, in the mid-Atlantic region. In 2005, 2004 and 2003,respectively, PHI’s Competitive Energy operations produced 51%, 50% and 55% of PHI’s consolidatedoperating revenues. In 2005 and 2004, respectively, PHI’s Competitive Energy operations produced 16% and19% of PHI’s consolidated operating income. In 2003, PHI’s Competitive Energy operations incurred anoperating loss equal to 20% of PHI’s consolidated operating income. PHI’s Competitive Energy operations areconducted through subsidiaries of Conectiv Energy and Pepco Energy Services.
Conectiv Energy
Conectiv Energy provides wholesale electric power, capacity, and ancillary services in the wholesalemarkets administered by PJM and also supplies electricity to other wholesale market participants under long andshort-term bilateral contracts. Among its bilateral contracts are the power supply agreements under whichConectiv Energy sells to DPL electricity required by DPL to fulfill its Default Electricity Supply obligations forcustomers in Delaware and Virginia and for a portion of its Maryland customers. Conectiv Energy also supplieselectric power to satisfy a portion of ACE’s Default Electric Supply load, as well as Default Electric Supply loadto other mid-Atlantic utilities. Other than its Default Electricity Supply sales, Conectiv Energy does not
B-15

participate in the retail competitive power supply market. Conectiv Energy obtains the electricity required tomeet its power supply obligations from its own generating plants, under bilateral contracts entered into with otherwholesale market participants and from purchases in the wholesale market administered by PJM.
Conectiv Energy’s generation asset strategy focuses on mid-merit plants with operating flexibility andmulti-fuel capability that can quickly change their output level on an economic basis. Like “peak-load” plants,mid-merit plants generally operate during times when demand for electricity rises and prices are higher.However, mid-merit plants usually operate more frequently and for longer periods of time than peak-load plantsbecause of better heat rates. As of December 31, 2005, Conectiv Energy owned and operated mid-merit plantswith a combined 2,713 megawatts of capacity, peak-load plants with a combined 639 megawatts of capacity andbase-load generating plants with a combined 340 megawatts of capacity. Conectiv Energy also owns threeuninstalled combustion turbines with a book value of $57.0 million. Conectiv Energy will determine whether toinstall these turbines as part of an existing or new generating facility or sell the turbines to a third party basedupon market demand and transmission system needs and requirements.
Conectiv Energy also sells natural gas and fuel oil to very large end-users and to wholesale marketparticipants under bilateral agreements. Conectiv Energy obtains the natural gas and fuel oil required to meet itssupply obligations through market purchases for next day delivery and under long- and short-term bilateralcontracts with other market participants.
Conectiv Energy actively engages in commodity risk management activities to reduce its financial exposureto changes in the value of its assets and obligations due to commodity price fluctuations. A portion of these riskmanagement activities are conducted using instruments classified as derivatives, such as forward contracts,futures, swaps, and exchange-traded and over-the-counter options. Conectiv Energy also manages commodityrisk with contracts that are not classified as derivatives. Conectiv Energy has two primary risk managementobjectives: to manage the spread between the cost of fuel used to operate its electric generation plants and therevenue received from the sale of the power produced by those plants; and to manage the cost of its contractsrelating to Default Electricity Supply in order to ensure stable and known minimum cash flows and lock-infavorable prices and margins when they become available. To a lesser extent, Conectiv Energy also engages inmarket activities in an effort to profit from short-term geographical price differentials in electricity prices amongmarkets.
Conectiv Energy’s goal is to hedge economically a targeted portion of both the expected power output of itsgeneration facilities and the expected costs of fuel used to operate those facilities. The hedge goals are approvedby PHI’s Corporate Risk Management Committee and may change from time to time based on marketconditions, and the actual level of coverage may vary from the target depending on the extent to which thecompany is successful in implementing its hedging strategies. In July 2003, Conectiv Energy entered into anagreement with an international investment banking firm consisting of a series of energy contracts designed tohedge more effectively approximately 50% of Conectiv Energy’s generation output and approximately 50% of itssupply obligations, with the intention of providing Conectiv Energy with a more predictable earnings streamduring the term of the agreement. The agreement will expire in May 2006. For additional discussion of ConectivEnergy’s hedging activities, see “Quantitative and Qualitative Disclosures.”
Pepco Energy Services
Pepco Energy Services sells retail electricity and natural gas primarily to commercial, industrial andgovernmental customers primarily in the mid-Atlantic region. Pepco Energy Services also provides integratedenergy management services to commercial, industrial and governmental customers, including energy-efficiencycontracting, development and construction of “green power” facilities, central plant and other equipmentoperation and maintenance, and fuel management. Subsidiaries of Pepco Energy Services provide high voltageconstruction and maintenance services to utilities and other customers throughout the United States and lowvoltage electric and telecommunication construction and maintenance services in the Washington, D.C. area.
B-16

Pepco Energy Services owns peak-load electricity generation plants with approximately 800 megawatts ofpeak-load capacity, the output of which is sold in the wholesale market administered by PJM.
Pepco Energy Services actively engages in commodity risk management activities to reduce the financialexposure to changes in the value of its supply contracts and sales commitments due to commodity price andvolume fluctuations. Certain of these risk management activities are conducted using instruments classified asderivatives, such as forward contracts, futures, swaps, and exchange-traded and over-the-counter options. PepcoEnergy Services’ primary risk management objective is to manage the spread between its retail electric andnatural gas sales commitments and the cost of supply used to service those commitments in order to securefavorable margins. Because of the age and design of Pepco Energy Services’ power plants, these facilities have ahigh variable cost of operation and Pepco Energy Services generally does not hedge the output of these plants.For additional discussion of Pepco Energy Services’ hedging activities, see “Quantitative and QualitativeDisclosures.”
Competition
The unregulated energy generation, supply and marketing businesses in the mid-Atlantic region arecharacterized by intense competition at both the wholesale and retail levels. At the wholesale level, ConectivEnergy and Pepco Energy Services compete with numerous non-utility generators, independent power producers,wholesale power marketers and brokers, and traditional utilities that continue to operate generation assets. In theretail energy supply market and in providing energy management services, Pepco Energy Services competes withnumerous competitive energy marketers and other service providers. Competition in both the wholesale and retailmarkets for energy and energy management services is based primarily on price and, to a lesser extent, the rangeof services offered to customers and quality of service.
Seasonality
Like the Power Delivery business, the power generation, supply and marketing businesses are seasonal andweather patterns can have a material impact on operating performance. Demand for electricity generally isgreater in the summer months associated with cooling and demand for electricity and natural gas generally isgreater in the winter months associated with heating, as compared to other times of the year. Historically, thecompetitive energy operations of Conectiv Energy and Pepco Energy Services have produced less revenue whenweather conditions are milder than normal. Such weather conditions can also negatively impact income fromthese operations. Energy management services generally are not seasonal.
Other Business Operations
Over the last several years, PHI has discontinued its investments in non-energy related businesses, includingthe sale of its aircraft investments and the sale of its 50% interest in Starpower Communications LLC(Starpower). Through its subsidiary, Potomac Capital Investment Corporation (PCI), PHI continues to maintain aportfolio of cross-border energy sale-leaseback transactions, with a book value at December 31, 2005 ofapproximately $1.3 billion. For additional information concerning these cross-border lease transactions, see Note(12) “Commitments and Contingencies” to the consolidated financial statements of PHI, “Management’sDiscussion and Analysis of Financial Condition and Results of Operations—Risk Factors.” This activityconstitutes a separate operating segment for financial reporting purposes which is designated “OtherNon-Regulated.”
B-17

MANAGEMENT’S DISCUSSION AND ANALYSIS OF FINANCIALCONDITION AND RESULTS OF OPERATIONS
RESTATEMENT
Pepco Holdings restated its previously reported consolidated financial statements as of December 31, 2004and for the years ended December 31, 2004 and 2003, the quarterly financial information for the first threequarters in 2005, and all quarterly periods in 2004, to correct the accounting for certain deferred compensationarrangements. The restatement includes the correction of other errors for the same periods, primarily relating tounbilled revenue, taxes, and various accrual accounts, which were considered by management to be immaterial.These other errors would not themselves have required a restatement absent the restatement to correct theaccounting for deferred compensation arrangements. This restatement was required solely because thecumulative impact of the correction, if recorded in the fourth quarter of 2005, would have been material to thatperiod’s reported net income. See Note 15 “Restatement” for further discussion.
CONSOLIDATED RESULTS OF OPERATIONS
The accompanying results of operations discussion is for the year ended December 31, 2005, compared tothe year ended December 31, 2004. All amounts in the tables (except sales and customers) are in millions.
Operating Revenue
A detail of the components of PHI’s consolidated operating revenues is as follows:
2005 2004 Change
Power Delivery . . . . . . . . . . . . . . . . . . . . . . . . . . . . . . . . . . $4,702.9 $4,377.7 $325.2Conectiv Energy . . . . . . . . . . . . . . . . . . . . . . . . . . . . . . . . . 2,603.6 2,409.8 193.8Pepco Energy Services . . . . . . . . . . . . . . . . . . . . . . . . . . . . 1,487.5 1,166.6 320.9Other Non-Regulated . . . . . . . . . . . . . . . . . . . . . . . . . . . . . 81.9 87.9 (6.0)Corporate and Other . . . . . . . . . . . . . . . . . . . . . . . . . . . . . . (810.4) (818.9) 8.5
Total Operating Revenue . . . . . . . . . . . . . . . . . . . . . . $8,065.5 $7,223.1 $842.4
Power Delivery Business
The following table categorizes Power Delivery’s operating revenue by type of revenue.
2005 2004 Change
Regulated T&D Electric Revenue . . . . . . . . . . . . . . . . . . . $1,618.5 $1,566.6 $ 51.9Default Supply Revenue . . . . . . . . . . . . . . . . . . . . . . . . . . . 2,753.0 2,514.7 238.3Other Electric Revenue . . . . . . . . . . . . . . . . . . . . . . . . . . . 69.9 67.8 2.1
Total Electric Operating Revenue . . . . . . . . . . . . . . . 4,441.4 4,149.1 292.3
Regulated Gas Revenue . . . . . . . . . . . . . . . . . . . . . . . . . . . 198.7 169.7 29.0Other Gas Revenue . . . . . . . . . . . . . . . . . . . . . . . . . . . . . . . 62.8 58.9 3.9
Total Gas Operating Revenue . . . . . . . . . . . . . . . . . . 261.5 228.6 32.9
Total Power Delivery Operating Revenue . . . . . . . . . . . . . $4,702.9 $4,377.7 $325.2
Regulated Transmission and Distribution (T&D) Electric Revenue consists of revenue from the transmissionand the delivery of electricity to PHI’s customers within its service territories at regulated rates.
Default Supply Revenue is the revenue received for Default Electricity Supply. The costs related to thesupply of electricity are included in Fuel and Purchased Energy and Other Services Cost of Sales.
B-18

Other Electric Revenue consists of utility-related work and services performed on behalf of customers,including other utilities.
Regulated Gas Revenue consists of revenues for on-system natural gas sales and the transportation ofnatural gas for customers within PHI’s service territories at regulated rates.
Other Gas Revenue consists of off-system natural gas sales and the release of excess system capacity.
Electric Operating Revenue
Regulated T&D Electric Revenue 2005 2004 Change
Residential . . . . . . . . . . . . . . . . . . . . . . . . . . . . . . . . . . . . . $ 613.0 $ 597.7 $ 15.3Commercial . . . . . . . . . . . . . . . . . . . . . . . . . . . . . . . . . . . . 726.8 692.3 34.5Industrial . . . . . . . . . . . . . . . . . . . . . . . . . . . . . . . . . . . . . . . 36.8 37.4 (.6)Other (Includes PJM) . . . . . . . . . . . . . . . . . . . . . . . . . . . . . 241.9 239.2 2.7
Total Regulated T&D Electric Revenue . . . . . . . . . . $1,618.5 $1,566.6 $ 51.9
Regulated T&D Electric Sales (Gwh) 2005 2004 Change
Residential . . . . . . . . . . . . . . . . . . . . . . . . . . . . . . . . . . . . . 18,045 17,759 286Commercial . . . . . . . . . . . . . . . . . . . . . . . . . . . . . . . . . . . . 29,441 28,448 993Industrial . . . . . . . . . . . . . . . . . . . . . . . . . . . . . . . . . . . . . . . 4,288 4,471 (183)
Total Regulated T&D Electric Sales . . . . . . . . . . . . . 51,774 50,678 1,096
Regulated T&D Electric Customers (000s) 2005 2004 Change
Residential . . . . . . . . . . . . . . . . . . . . . . . . . . . . . . . . . . . . . 1,591 1,567 24Commercial . . . . . . . . . . . . . . . . . . . . . . . . . . . . . . . . . . . . 196 193 3Industrial . . . . . . . . . . . . . . . . . . . . . . . . . . . . . . . . . . . . . . . 2 2 —
Total Regulated T&D Electric Customers . . . . . . . . . 1,789 1,762 27
The Pepco, DPL and ACE service territories are located within a corridor extending from Washington, D.C.to southern New Jersey. These service territories are economically diverse and include key industries thatcontribute to the regional economic base.
• Commercial activity in the region includes banking and other professional services, government,insurance, real estate, strip malls, casinos, stand alone construction, and tourism.
• Industrial activity in the region includes automotive, chemical, glass, pharmaceutical, steelmanufacturing, food processing, and oil refining.
Regulated T&D Revenue increased by $51.9 million primarily due to the following: (i) $19.3 million due tocustomer growth, the result of a 1.5% customer increase in 2005, (ii) $17.6 million increase as a result of a14.7% increase in Cooling Degree Days in 2005, (iii) $1.9 million (including $3.3 million in tax pass-throughs)increase due to net adjustments for estimated unbilled revenues recorded in the second and fourth quarters of2005, reflecting a modification in the estimation process, primarily reflecting higher estimated power line losses(estimates of electricity expected to be lost in the process of its transmission and distribution to customers) and(iv) $21.7 million increase in tax pass-throughs, principally a county surcharge (offset in Other Taxes) offset by(v) $8.6 million other sales and rate variances.
B-19

Default Electricity Supply
Default Supply Revenue 2005 2004 Change
Residential . . . . . . . . . . . . . . . . . . . . . . . . . . . . . . . . . . . . . $1,161.7 $ 993.6 $ 168.1Commercial . . . . . . . . . . . . . . . . . . . . . . . . . . . . . . . . . . . . 994.9 1,060.9 (66.0)Industrial . . . . . . . . . . . . . . . . . . . . . . . . . . . . . . . . . . . . . . 134.2 140.7 (6.5)Other (Includes PJM) . . . . . . . . . . . . . . . . . . . . . . . . . . . . 462.2 319.5 142.7
Total Default Supply Revenue . . . . . . . . . . . . . . . . . $2,753.0 $2,514.7 $ 238.3
Default Electricity Supply Sales (Gwh) 2005 2004 Change
Residential . . . . . . . . . . . . . . . . . . . . . . . . . . . . . . . . . . . . . 17,490 16,775 715Commercial . . . . . . . . . . . . . . . . . . . . . . . . . . . . . . . . . . . . 15,020 19,203 (4,183)Industrial . . . . . . . . . . . . . . . . . . . . . . . . . . . . . . . . . . . . . . 2,058 2,292 (234)Other . . . . . . . . . . . . . . . . . . . . . . . . . . . . . . . . . . . . . . . . . 157 226 (69)
Total Default Electricity Supply Sales . . . . . . . . . . . 34,725 38,496 (3,771)
Default Electricity Supply Customers (000s) 2005 2004 Change
Residential . . . . . . . . . . . . . . . . . . . . . . . . . . . . . . . . . . . . . 1,557 1,509 48Commercial . . . . . . . . . . . . . . . . . . . . . . . . . . . . . . . . . . . . 181 178 3Industrial . . . . . . . . . . . . . . . . . . . . . . . . . . . . . . . . . . . . . . 2 2 —Other . . . . . . . . . . . . . . . . . . . . . . . . . . . . . . . . . . . . . . . . . 2 2 —
Total Default Electricity Supply Customers . . . . . . . 1,742 1,691 51
Default Supply Revenue increased $238.3 million primarily due to the following: (i) $251.9 million due tohigher retail energy rates, the result of market-based SOS competitive bid procedures implemented in Marylandin June 2005 and the District of Columbia in February 2005, (ii) $142.2 million increase in wholesale energyrevenues resulting from sales of generated and purchased energy into PJM due to higher market prices in 2005,(iii) $44.8 million due to weather (14.7% increase in Cooling Degree Days), (iv) $48.2 million increase due tocustomer growth, and (v) $8.1 million due to other sales and rate variances, offset by (vi) $245.0 million decreasedue primarily to higher commercial customer migration, and (vii) $11.9 million decrease due to net adjustmentsfor estimated unbilled revenues recorded in the second and fourth quarters of 2005, primarily reflecting higherestimated power line losses (estimates of electricity expected to be lost in the process of its transmission anddistribution to customers).
Other Electric Revenue increased $2.1 million to $69.9 million from $67.8 million in 2004 primarily due tomutual assistance work related to storm damage in 2005 (offset in Other Operations and Maintenance expense).
B-20

Gas Operating Revenue
Regulated Gas Revenue 2005 2004 Change
Residential . . . . . . . . . . . . . . . . . . . . . . . . . . . . . . . . . . . . . . . . $115.0 $100.2 $14.8Commercial . . . . . . . . . . . . . . . . . . . . . . . . . . . . . . . . . . . . . . . . 68.5 56.7 11.8Industrial . . . . . . . . . . . . . . . . . . . . . . . . . . . . . . . . . . . . . . . . . . 10.6 8.3 2.3Transportation and Other . . . . . . . . . . . . . . . . . . . . . . . . . . . . . 4.6 4.5 .1
Total Regulated Gas Revenue . . . . . . . . . . . . . . . . . . . . . $198.7 $169.7 $29.0
Regulated Gas Sales (Bcf) 2005 2004 Change
Residential . . . . . . . . . . . . . . . . . . . . . . . . . . . . . . . . . . . . . . . . 8.4 8.7 (.3)Commercial . . . . . . . . . . . . . . . . . . . . . . . . . . . . . . . . . . . . . . . . 5.6 5.5 .1Industrial . . . . . . . . . . . . . . . . . . . . . . . . . . . . . . . . . . . . . . . . . . 1.1 1.2 (.1)Transportation and Other . . . . . . . . . . . . . . . . . . . . . . . . . . . . . 5.6 6.2 (.6)
Total Regulated Gas Sales . . . . . . . . . . . . . . . . . . . . . . . . 20.7 21.6 (.9)
Regulated Gas Customers (000s) 2005 2004 Change
Residential . . . . . . . . . . . . . . . . . . . . . . . . . . . . . . . . . . . . . . . . 111 109 2Commercial . . . . . . . . . . . . . . . . . . . . . . . . . . . . . . . . . . . . . . . . 9 9 —Industrial . . . . . . . . . . . . . . . . . . . . . . . . . . . . . . . . . . . . . . . . . . — — —Transportation and Other . . . . . . . . . . . . . . . . . . . . . . . . . . . . . — — —
Total Regulated Gas Customers . . . . . . . . . . . . . . . . . . . . 120 118 2
Power Delivery’s natural gas service territory is located in New Castle County, Delaware. Several keyindustries contribute to the economic base as well as to growth.
• Commercial activity in the region includes banking and other professional services, government,insurance, real estate, strip malls, stand alone construction and tourism.
• Industrial activity in the region includes automotive, chemical and pharmaceutical.
Regulated Gas Revenue increased by $29.0 million primarily due to a $30.6 million increase in the Gas CostRate (GCR) effective November 2004 and 2005, due to higher natural gas commodity costs.
Other Gas Revenue increased by $3.9 million to $62.8 million from $58.9 in 2004 primarily due toincreased capacity release revenues compared to the same period last year.
Competitive Energy Businesses
Conectiv Energy
The following table divides Conectiv Energy’s operating revenues among its major business activities.
2005 2004 Change
Merchant Generation . . . . . . . . . . . . . . . . . . . . . . . . . . . . $ 675.7 $ 684.5 $ (8.8)Full Requirements Load Service . . . . . . . . . . . . . . . . . . . . 848.7 960.2 (111.5)Other Power, Oil and Gas Marketing Services . . . . . . . . . 1,079.2 765.1 314.1
Total Conectiv Energy Operating Revenue . . . . . . . $2,603.6 $2,409.8 $ 193.8
B-21

Merchant Generation includes sales of electric power, capacity and ancillary services from its power plantsinto PJM, tolling arrangements, hedges of generation power and capacity, and fuel-switching activities where thelowest cost fuel is utilized and the more expensive fuel is sold. Excess generation capacity is used to manage riskassociated with Full Requirements Load Service.
Full Requirements Load Service includes service provided to affiliated and non-affiliated companies tosatisfy Default Energy Supply obligations, other full requirements electric power sales contracts, and relatedhedges.
Other Power, Oil and Gas Marketing Services consist of all other Conectiv Energy activities not includedabove. These activities include primarily wholesale gas marketing, oil marketing, a large operating servicesagreement with an unaffiliated power plant, and the activities of the real-time power desk, which engages inarbitrage between power pools.
Total Conectiv Energy Operating Revenue includes $801.8 million and $820.3 million of affiliatetransactions for 2005 and 2004, respectively.
The impact of revenue changes with respect to the Conectiv Energy component of the Competitive Energybusiness are encompassed within the discussion below under the heading “Conectiv Energy Gross Margin.”
Pepco Energy Services
The following table presents Pepco Energy Services’ operating revenues.
2005 2004 Change
Pepco Energy Services . . . . . . . . . . . . . . . . . . . . . . . . . . . . $1,487.5 $1,166.6 $320.9
The increase in Pepco Energy Services’ operating revenue of $320.9 million is primarily due to (i) anincrease of $228.1 million due to commercial and industrial retail load acquisition by Pepco Energy Services in2005 at higher prices than in 2004, (ii) an increase of $39.3 million due to higher generation from its Benningand Buzzard Point power plants in 2005 due to warmer weather conditions, and (iii) an increase of $49.5 milliondue to higher energy services activities in 2005 resulting from contracts signed with customers under whichPepco Energy Services provides services for energy efficiency and high voltage installation projects. As ofDecember 31, 2005, Pepco Energy Services had 2,004 megawatts of commercial and industrial load, ascompared to 1,553 megawatts of commercial and industrial load at the end of 2004. In 2005, Pepco EnergyServices’ power plants generated 237,624 megawatt hours of electricity as compared to 45,836 in 2004.
Operating Expenses
Fuel and Purchased Energy and Other Services Cost of Sales
A detail of PHI’s consolidated Fuel and Purchased Energy and Other Services Cost of Sales is as follows:
2005 2004 Change
Power Delivery . . . . . . . . . . . . . . . . . . . . . . . . . . . . . . . . . . $2,720.5 $2,524.2 $196.3Conectiv Energy . . . . . . . . . . . . . . . . . . . . . . . . . . . . . . . . . 2,344.4 2,130.9 213.5Pepco Energy Services . . . . . . . . . . . . . . . . . . . . . . . . . . . . 1,357.5 1,064.4 293.1Corporate and Other . . . . . . . . . . . . . . . . . . . . . . . . . . . . . . (805.7) (823.3) 17.6
Total . . . . . . . . . . . . . . . . . . . . . . . . . . . . . . . . . . . . . . $5,616.7 $4,896.2 $720.5
B-22

Power Delivery Business
Power Delivery’s Fuel and Purchased Energy costs increased by $196.3 million primarily due to (i) $326.7million increase for higher average energy costs resulting from Default Electricity Supply contracts implementedin 2005, (ii) $65.6 million increase due to customer growth, (iii) $33.1 million increase for gas commoditypurchases, (iv) $25.8 million increase in other sales and rate variances, offset by (v) $254.9 million decrease dueto higher customer migration. This expense is primarily offset in Default Supply Revenue.
Competitive Energy Business
Conectiv Energy
The following table divides Conectiv Energy’s Fuel and Purchased Energy and Other Services Cost of Salesamong its major business activities.
2005 2004 Change
Merchant Generation . . . . . . . . . . . . . . . . . . . . . . . . . . . . . $ 418.6 $ 444.3 $ (25.7)Full Requirements Load Service . . . . . . . . . . . . . . . . . . . . 857.7 933.1 (75.4)Other Power, Oil and Gas Marketing Services . . . . . . . . . 1,068.1 753.5 314.6
Total Conectiv Energy Fuel and Purchased Energyand Other Services Cost of Sales . . . . . . . . . . . . . . $2,344.4 $2,130.9 $213.5
The totals presented include $217.7 million and $245.4 million of affiliate transactions for 2005 and 2004,respectively.
The impact of Fuel and Purchased Energy and Other Services Cost of Sales changes with respect to theConectiv Energy component of the Competitive Energy business are encompassed within the discussion belowunder the heading “Conectiv Energy Gross Margin.”
B-23

Conectiv Energy Gross Margin
Management believes that gross margin (Revenue less Fuel and Purchased Energy and Other Services Costof Sales) is a better comparative measurement of the primary activities of Conectiv Energy than Revenue andFuel and Purchased Energy by themselves. Gross margin is a more stable comparative measurement and it isused extensively by management in internal reporting. The following is a summary of gross margins by activitytype (Millions of dollars):
December 31,
2005 2004
Megawatt Hour Supply (Megawatt Hours)Merchant Generation output sold into market . . . . . . . . . . . . . . . . . . . . . . . . . . . . . . . . 5,595,149 5,161,682
Operating Revenue:Merchant Generation . . . . . . . . . . . . . . . . . . . . . . . . . . . . . . . . . . . . . . . . . . . . . . . . $ 675.7 $ 684.5Full Requirements Load Service . . . . . . . . . . . . . . . . . . . . . . . . . . . . . . . . . . . . . . . 848.7 960.2Other Power, Oil, and Gas Marketing . . . . . . . . . . . . . . . . . . . . . . . . . . . . . . . . . . . 1,079.2 765.1
Total Operating Revenue . . . . . . . . . . . . . . . . . . . . . . . . . . . . . . . . . . . . . . . . $ 2,603.6 $ 2,409.8
Cost of Sales:Merchant Generation . . . . . . . . . . . . . . . . . . . . . . . . . . . . . . . . . . . . . . . . . . . . . . . . $ 418.6 $ 444.3Full Requirements Load Service . . . . . . . . . . . . . . . . . . . . . . . . . . . . . . . . . . . . . . . 857.7 933.1Other Power, Oil, and Gas Marketing . . . . . . . . . . . . . . . . . . . . . . . . . . . . . . . . . . . 1,068.1 753.5
Total Cost of Sales . . . . . . . . . . . . . . . . . . . . . . . . . . . . . . . . . . . . . . . . . . . . . $ 2,344.4 $ 2,130.9
Gross Margin:Merchant Generation . . . . . . . . . . . . . . . . . . . . . . . . . . . . . . . . . . . . . . . . . . . . . . . . $ 257.1 $ 240.2Full Requirements Load Service . . . . . . . . . . . . . . . . . . . . . . . . . . . . . . . . . . . . . . . (9.0) 27.1Other Power, Oil and Gas Marketing . . . . . . . . . . . . . . . . . . . . . . . . . . . . . . . . . . . 11.1 11.6
Total Gross Margin . . . . . . . . . . . . . . . . . . . . . . . . . . . . . . . . . . . . . . . . . . . . . $ 259.2 $ 278.9
Warmer weather during the summer months of 2005 and continued PJM load growth resulted in increaseddemand for power and higher prices for power, causing higher Merchant Generation output and an increase in thegross margin. The higher gross margin from the sale of generation output was partially offset by negative hedgeresults.
The 2005 decrease in the Lower Full Requirements Load Service gross margin resulted from higher fuel andenergy prices during 2005. Full Requirements Load Service is hedged by both contract purchases with thirdparties and by the output of the generation plants operated by Conectiv Energy.
Other Power, Oil and Gas Marketing margins decreased because of a one-time gain of $8.7 million on agroup of coal contracts in 2004. This was partially offset by higher margin sales for oil marketing ($5.6 million)and gas marketing ($2.0 million) during the fourth quarter of 2005.
Pepco Energy Services
The following table presents Pepco Energy Services’ Fuel and Purchased Energy and Other Services cost ofsales.
2005 2004 Change
Pepco Energy Services . . . . . . . . . . . . . . . . . . . . . . . . . . . . $1,357.5 $1,064.4 $293.1
The increase in Pepco Energy Services’ fuel and purchased energy and other services cost of sales of $293.1million resulted from (i) higher volumes of electricity purchased at higher prices in 2005 to serve commercial
B-24

and industrial retail customers, (ii) higher fuel and operating costs for the Benning and Buzzard Point powerplants in 2005 due to higher electric generation that resulted from warmer weather in 2005, and (iii) higherenergy services activities in 2005 resulting from contracts signed with customers under which Pepco EnergyServices provides services for energy efficiency and high voltage installation projects.
Other Operation and Maintenance
A detail of PHI’s other operation and maintenance expense is as follows:
2005 2004 Change
Power Delivery . . . . . . . . . . . . . . . . . . . . . . . . . . . . . . . . . . . . . $643.1 $623.9 $19.2Conectiv Energy . . . . . . . . . . . . . . . . . . . . . . . . . . . . . . . . . . . . 107.7 103.8 3.9Pepco Energy Services . . . . . . . . . . . . . . . . . . . . . . . . . . . . . . . 71.2 71.5 (.3)Other Non-Regulated . . . . . . . . . . . . . . . . . . . . . . . . . . . . . . . . 6.1 6.9 (.8)Corporate and Other . . . . . . . . . . . . . . . . . . . . . . . . . . . . . . . . . (12.4) (9.5) (2.9)
Total . . . . . . . . . . . . . . . . . . . . . . . . . . . . . . . . . . . . . . . . . $815.7 $796.6 $19.1
PHI’s other operation and maintenance increased by $19.1 million to $815.7 million for the year ended 2005from $796.6 million for the year ended 2004 primarily due to the following: (i) a $10.3 million increase inemployee related costs, (ii) $9.0 million increase in corporate services allocation, (iii) $3.9 million increase dueto the write-off of software, (iv) $3.2 million increase due to mutual assistance work related to storm damage in2005 (offset in Other Electric Revenues), and (v) $2.1 million increase in maintenance expenses, partially offsetby (vi) $4.9 million reduction in the uncollectible account reserve to reflect the amount expected to be collectedon Pepco’s Pre-Petition Claims with Mirant and (vii) a $5.5 million decrease in PJM administrative expenses.
Depreciation and Amortization
PHI’s depreciation and amortization expenses decreased by $17.9 million to $422.6 million in 2005 from$440.5 million in 2004. The decrease is primarily due to a $7.6 million decrease from a change in depreciationtechnique resulting from a 2005 final rate order from the NJBPU and a $4.8 million decrease due to a change inthe estimated useful lives of Conectiv Energy’s generation assets.
Other Taxes
Other taxes increased by $30.8 million to $342.2 million in 2005 from $311.4 million in 2004 due to higherpass-throughs, mainly as the result of a county surcharge rate increase (primarily offset in Regulated T&DElectric Revenue).
Deferred Electric Service Costs
Deferred Electric Service Costs, which relates only to ACE, increased by $83.9 million to $120.2 million in2005, from $36.3 million in 2004. At December 31, 2005, DESC represents the net expense or over-recoveryassociated with New Jersey NUGs, market transition change (MTC) and other restructuring items. The $83.9million increase represents (i) $77.1 million net over-recovery associated with New Jersey BGS, NUGS, markettransition charges and other restructuring items, and (ii) $4.5 million in regulatory disallowances (net of amountspreviously reserved) associated with the April 2005 NJBPU settlement agreement. ACE’s rates for the recoveryof those costs are reset annually and the rates will vary from year to year. At December 31, 2005, ACE’s balancesheet included as a regulatory liability an over-recovery of $40.9 million with respect to these items, which is netof a $47.3 million reserve for items disallowed by the NJBPU in a ruling that is under appeal.
B-25

Gain on Sales of Assets
Pepco Holdings recorded a Gain on Sales of Assets of $86.8 million for the year ended December 31, 2005,compared to $30.0 million for the year ended December 31, 2004. The $86.8 million gain in 2005 primarilyconsists of: (i) a $68.1 million gain from the 2005 sale of non-utility land owned by Pepco located at BuzzardPoint in the District of Columbia, and (ii) a $13.3 million gain recorded by PCI from proceeds related to the finalliquidation of a financial investment that was written off in 2001. The $30.0 million gain in 2004 consists of: (i) a$14.7 million gain from the 2004 condemnation settlement with the City of Vineland relating to the transfer ofACE’s distribution assets and customer accounts to the city, (ii) a $6.6 million gain from the 2004 sale of land,and (iii) an $8.3 million gain on the 2004 sale of aircraft investments by PCI.
Gain on Settlement of Claims with Mirant
The Gain on Settlement of Claims with Mirant of $70.5 million represents a settlement (net of customersharing) with Mirant in the fourth quarter of 2005, of the Pepco TPA Claim ($70 million gain) and a Pepcoasbestos claim against the Mirant bankruptcy estate ($.5 million gain).
Other Income (Expenses)
Other expenses (which are net of other income) decreased by $55.9 million to $285.5 million in 2005 from$341.4 million in 2004, primarily due to the following: (i) a decrease in net interest expense of $35.7 million,which primarily resulted from a $23.6 million decrease due to less debt outstanding during the 2005 period and adecrease of $12.8 million of interest expense that was recorded by Conectiv Energy in 2004 related to costsassociated with the prepayment of debt related to the Bethlehem mid-merit facility, (ii) an $11.2 millionimpairment charge on the Starpower investment that was recorded during 2004, (iii) income of $7.9 millionreceived by PCI in 2005 from the sale and liquidation of energy investments, and (iv) income of $3.9 million in2005 from cash distributions from a joint-owned co-generation facility, partially offset by (v) an impairmentcharge of $4.1 million in 2005 related to a Conectiv Energy investment in a jointly owned generation project, and(vi) a pre-tax gain of $11.2 million on a distribution from a co-generation joint-venture that was recognized byConectiv Energy during the second quarter of 2004.
Income Tax Expense
Pepco Holdings’ effective tax rate for the year ended December 31, 2005 was 41% as compared to thefederal statutory rate of 35%. The major reasons for this difference were state income taxes (net of federalbenefit), the flow-through of certain book/tax depreciation differences, and changes in estimates related to taxliabilities of prior tax years subject to audit, partially offset by the flow-through of Deferred Investment TaxCredits and tax benefits related to certain leveraged leases.
Pepco Holdings’ effective tax rate for the year ended December 31, 2004 was 39% as compared to thefederal statutory rate of 35%. The major reasons for this difference were state income taxes (net of federalbenefit), the flow-through of certain book/tax depreciation differences, and the settlement with the IRS on certainnon-lease financial assets, partially offset by the flow-through of Deferred Investment Tax Credits and taxbenefits related to certain leveraged leases.
Extraordinary Items
On April 19, 2005, ACE, the staff of the New Jersey Board of Public Utilities (NJBPU), the New JerseyRatepayer Advocate, and active intervenor parties agreed on a settlement in ACE’s electric distribution rate case.As a result of this settlement, ACE reversed $15.2 million in accruals related to certain deferred costs that arenow deemed recoverable. The after-tax credit to income of $9.0 million is classified as an extraordinary gain inthe 2005 financial statements since the original accrual was part of an extraordinary charge in conjunction withthe accounting for competitive restructuring in 1999.
B-26

The accompanying results of operations discussion is for the year ended December 31, 2004, compared tothe year ended December 31, 2003. All amounts in the tables (except sales and customers) are in millions.
Operating Revenue
A detail of the components of PHI’s consolidated operating revenue is as follows:
2004 2003 Change
Power Delivery . . . . . . . . . . . . . . . . . . . . . . . . . . . . . . . . . $4,377.7 $4,015.7 $ 362.0Conectiv Energy . . . . . . . . . . . . . . . . . . . . . . . . . . . . . . . . 2,409.8 2,857.5 (447.7)Pepco Energy Services . . . . . . . . . . . . . . . . . . . . . . . . . . . 1,166.6 1,126.2 40.4Other Non-Regulated . . . . . . . . . . . . . . . . . . . . . . . . . . . . 87.9 100.1 (12.2)Corporate and Other . . . . . . . . . . . . . . . . . . . . . . . . . . . . . (818.9) (830.8) 11.9
Total Operating Revenue . . . . . . . . . . . . . . . . . . . . . $7,223.1 $7,268.7 $ (45.6)
Power Delivery Business
The following table categorizes Power Delivery’s operating revenue by type of revenue.
2004 2003 Change
Regulated T&D Electric Revenue . . . . . . . . . . . . . . . . . . . $1,566.6 $1,521.0 $ 45.6Default Supply Revenue . . . . . . . . . . . . . . . . . . . . . . . . . . . 2,514.7 2,206.1 308.6Other Electric Revenue . . . . . . . . . . . . . . . . . . . . . . . . . . . 67.8 97.6 (29.8)
Total Electric Operating Revenue . . . . . . . . . . . . . . . 4,149.1 3,824.7 324.4
Regulated Gas Revenue . . . . . . . . . . . . . . . . . . . . . . . . . . . 169.7 150.2 19.5Other Gas Revenue . . . . . . . . . . . . . . . . . . . . . . . . . . . . . . . 58.9 40.8 18.1
Total Gas Operating Revenue . . . . . . . . . . . . . . . . . . 228.6 191.0 37.6
Total Power Delivery Operating Revenue . . . . . . . . . . . . . $4,377.7 $4,015.7 $362.0
Electric Operating Revenue
Regulated T&D Electric Revenue 2004 2003 Change
Residential . . . . . . . . . . . . . . . . . . . . . . . . . . . . . . . . . . . . . $ 597.7 $ 576.2 $ 21.5Commercial . . . . . . . . . . . . . . . . . . . . . . . . . . . . . . . . . . . . 692.3 674.7 17.6Industrial . . . . . . . . . . . . . . . . . . . . . . . . . . . . . . . . . . . . . . . 37.4 41.0 (3.6)Other (Includes PJM) . . . . . . . . . . . . . . . . . . . . . . . . . . . . . 239.2 229.1 10.1
Total Regulated T&D Electric Revenue . . . . . . . . . . $1,566.6 $1,521.0 $ 45.6
Regulated T&D Electric Sales (Gwh) 2004 2003 Change
Residential . . . . . . . . . . . . . . . . . . . . . . . . . . . . . . . . . . . . . 17,759 17,147 612Commercial . . . . . . . . . . . . . . . . . . . . . . . . . . . . . . . . . . . . 28,448 27,648 800Industrial . . . . . . . . . . . . . . . . . . . . . . . . . . . . . . . . . . . . . . . 4,471 4,874 (403)
Total Regulated T&D Electric Sales . . . . . . . . . . . . . 50,678 49,669 1,009
Regulated T&D Electric Customers (000s) 2004 2003 Change
Residential . . . . . . . . . . . . . . . . . . . . . . . . . . . . . . . . . . . . . 1,567 1,547 20Commercial . . . . . . . . . . . . . . . . . . . . . . . . . . . . . . . . . . . . 193 191 2Industrial . . . . . . . . . . . . . . . . . . . . . . . . . . . . . . . . . . . . . . . 2 2 —
Total Regulated T&D Electric Customers . . . . . . . . . 1,762 1,740 22
B-27

Regulated T&D Electric Sales, as measured on a Gwh basis, increased by 2% in 2004, driven by residentialand commercial customer classes. Regulated T&D Revenue increased by $45.6 million primarily due to thefollowing: (i) $14.4 million increase due to growth and average customer usage, (ii) $4.8 million increase due tohigher average effective rates, (iii) $9.1 million due to weather, and (iv) $39.9 million increase in tax pass-throughs, principally a county surcharge (offset in Other Taxes expense). These increases were offset by(v) $20.5 million decrease primarily related to PJM network transmission revenue and the impact of customerchoice, and (vi) $2.1 million related to a Delaware competitive transition charge that ended in 2003. CoolingDegree Days increased by 11.0% and heating degree days decreased by 6.3% for the year ended December 31,2004 as compared to the same period in 2003.
Default Electricity Supply
Default Supply Revenue 2004 2003 Change
Residential . . . . . . . . . . . . . . . . . . . . . . . . . . . . . . . . . . . . . $ 993.6 $ 875.2 $118.4Commercial . . . . . . . . . . . . . . . . . . . . . . . . . . . . . . . . . . . . 1,060.9 946.4 114.5Industrial . . . . . . . . . . . . . . . . . . . . . . . . . . . . . . . . . . . . . . . 140.7 156.1 (15.4)Other (Includes PJM) . . . . . . . . . . . . . . . . . . . . . . . . . . . . . 319.5 228.4 91.1
Total Default Supply Revenue . . . . . . . . . . . . . . . . . . $2,514.7 $2,206.1 $308.6
Default Electricity Supply Sales (Gwh) 2004 2003 Change
Residential . . . . . . . . . . . . . . . . . . . . . . . . . . . . . . . . . . . . . 16,775 16,048 727Commercial . . . . . . . . . . . . . . . . . . . . . . . . . . . . . . . . . . . . 19,203 18,134 1,069Industrial . . . . . . . . . . . . . . . . . . . . . . . . . . . . . . . . . . . . . . . 2,292 2,882 (590)Other . . . . . . . . . . . . . . . . . . . . . . . . . . . . . . . . . . . . . . . . . . 226 94 132
Total Default Electricity Supply Sales . . . . . . . . . . . . 38,496 37,158 1,338
Default Electricity Supply Customers (000s) 2004 2003 Change
Residential . . . . . . . . . . . . . . . . . . . . . . . . . . . . . . . . . . . . . 1,509 1,460 49Commercial . . . . . . . . . . . . . . . . . . . . . . . . . . . . . . . . . . . . 178 175 3Industrial . . . . . . . . . . . . . . . . . . . . . . . . . . . . . . . . . . . . . . . 2 2 —Other . . . . . . . . . . . . . . . . . . . . . . . . . . . . . . . . . . . . . . . . . . 2 1 1
Total Default Electricity Supply Customers . . . . . . . 1,691 1,638 53
Default Supply Revenue increased $308.6 million primarily due to the following: (i) $109.2 million as theresult of higher retail energy rates, the result of effective rate increases in Delaware beginning October 2003 andin Maryland beginning in June and July 2004, (ii) $92.3 million primarily due to a reduction in customermigration in D.C., (iii) $83.1 million increase in wholesale energy prices as the result of higher market prices in2004, and (iv) $24.4 million increase in average customer usage.
Other Electric Revenue decreased $29.8 million primarily due to a $43.0 million decrease that resulted fromthe expiration on December 31, 2003 of a contract to supply electricity to Delaware Municipal ElectricCorporation (DMEC). This decrease was partially offset by a $14.0 million increase in customer requested work(related costs in Operations and Maintenance expense).
B-28

Gas Operating Revenue
Regulated Gas Revenue 2004 2003 Change
Residential . . . . . . . . . . . . . . . . . . . . . . . . . . . . . . . . . . . . . . . . $100.2 $ 88.8 $11.4Commercial . . . . . . . . . . . . . . . . . . . . . . . . . . . . . . . . . . . . . . . . 56.7 47.7 9.0Industrial . . . . . . . . . . . . . . . . . . . . . . . . . . . . . . . . . . . . . . . . . . 8.3 9.2 (.9)Transportation and Other . . . . . . . . . . . . . . . . . . . . . . . . . . . . . 4.5 4.5 —
Total Regulated Gas Revenue . . . . . . . . . . . . . . . . . . . . . $169.7 $150.2 $19.5
Regulated Gas Sales (Bcf) 2004 2003 Change
Residential . . . . . . . . . . . . . . . . . . . . . . . . . . . . . . . . . . . . . . . . 8.7 9.0 (.3)Commercial . . . . . . . . . . . . . . . . . . . . . . . . . . . . . . . . . . . . . . . . 5.5 5.5 —Industrial . . . . . . . . . . . . . . . . . . . . . . . . . . . . . . . . . . . . . . . . . . 1.2 1.6 (.4)Transportation and Other . . . . . . . . . . . . . . . . . . . . . . . . . . . . . 6.2 6.8 (.6)
Total Regulated Gas Sales . . . . . . . . . . . . . . . . . . . . . . . . 21.6 22.9 (1.3)
Regulated Gas Customers (000s) 2004 2003 Change
Residential . . . . . . . . . . . . . . . . . . . . . . . . . . . . . . . . . . . . . . . . 109 108 1Commercial . . . . . . . . . . . . . . . . . . . . . . . . . . . . . . . . . . . . . . . . 9 9 —Industrial . . . . . . . . . . . . . . . . . . . . . . . . . . . . . . . . . . . . . . . . . . — — —Transportation and Other . . . . . . . . . . . . . . . . . . . . . . . . . . . . . — — —
Total Regulated Gas Customers . . . . . . . . . . . . . . . . . . . . 118 117 1
Regulated Gas Revenue increased $19.5 million principally due to the following: (i) $21.0 million increasein the Gas Cost Rate due to higher natural gas commodity costs, effective November 1, 2003, (ii) $8.2 millionincrease in Gas Base Rates due to higher operating expenses and cost of capital, effective December 9, 2003, and(iii) $2.0 million true up adjustment to unbilled revenues in 2003. These increases were partially offset by(iv) $9.4 million decrease due to 2003 being significantly colder than normal, and (v) $2.9 million reductionrelated to lower industrial sales. Heating degree days decreased 7.1% for the year ended December 31, 2004 ascompared to the same period in 2003.
Other Gas Revenue increased $18.1 million largely related to an increase in off-system sales revenues of$17.3 million. The gas sold off-system was made available by warmer winter weather and reduced customerdemand.
Competitive Energy Businesses
Conectiv Energy
The following table divides Conectiv Energy’s operating revenues among its major business activities.
2004 2003 Change
Merchant Generation . . . . . . . . . . . . . . . . . . . . . . . . . . . . $ 684.5 $ 540.2 $ 144.3Full Requirements Load Service . . . . . . . . . . . . . . . . . . . . 960.2 1,630.3 (670.1)Other Power, Oil and Gas Marketing Services . . . . . . . . . 765.1 687.0 78.1
Total Conectiv Energy Operating Revenue . . . . . . . $2,409.8 $2,857.5 $(447.7)
The totals presented include $820.3 million and $822.1 million of affiliate transactions for 2004 and 2003,respectively.
The impact of revenue changes with respect to the Conectiv Energy component of the Competitive Energybusiness are encompassed within the discussion below under the heading “Conectiv Energy Gross Margin.”
B-29

Pepco Energy Services
The following table presents Pepco Energy Services’ operating revenues.
2004 2003 Change
Pepco Energy Services . . . . . . . . . . . . . . . . . . . . . . . . . . . . $1,166.6 $1,126.2 $40.4
The increase in Pepco Energy Services’ operating revenue of $40.4 million resulted from higher volumes ofelectricity sold to customers in 2004 at more favorable prices than in 2003, partially offset by a decrease innatural gas revenues.
Operating Expenses
Fuel and Purchased Energy and Other Services Cost of Sales
A detail of PHI’s consolidated Fuel and Purchased Energy and Other Services Cost of Sales is as follows:
2004 2003 Change
Power Delivery . . . . . . . . . . . . . . . . . . . . . . . . . . . . . . . . . $2,524.2 $2,295.4 $ 228.8Conectiv Energy . . . . . . . . . . . . . . . . . . . . . . . . . . . . . . . . 2,130.9 2,696.1 (565.2)Pepco Energy Services . . . . . . . . . . . . . . . . . . . . . . . . . . . 1,064.4 1,033.1 31.3Corporate and Other . . . . . . . . . . . . . . . . . . . . . . . . . . . . . (823.3) (820.8) (2.5)
Total . . . . . . . . . . . . . . . . . . . . . . . . . . . . . . . . . . . . . $4,896.2 $5,203.8 $(307.6)
Power Delivery Business
Power Delivery’s Fuel and Purchased Energy costs increased by $228.8 million primarily due to thefollowing: (i) a $212.9 million increase related to higher average energy costs, the result of new Default Supplyrates for Maryland beginning in June and July 2004 and for New Jersey beginning in June 2004, and lesscustomer migration primarily in D.C., (ii) $45.1 million higher costs due to the increased cost of electricitysupply under the Amended Settlement Agreement and Release with Mirant, effective October 2003, and (iii) a$30.2 million increase for gas commodity purchases, partially offset by (iv) $43.0 million related to the DMEC2003 contract expiration, and (v) a $14.5 million reserve recorded in September 2003 to reflect a potentialexposure related to a pre-petition receivable from Mirant for which Pepco filed a creditor’s claim in thebankruptcy proceedings.
Competitive Energy Businesses
Conectiv Energy
The following table categorizes Conectiv Energy’s Fuel and Purchased Energy and Other Services Cost ofSales into major profit centers.
2004 2003 Change
Merchant Generation . . . . . . . . . . . . . . . . . . . . . . . . . . . . $ 444.3 $ 356.5 $ 87.8Full Requirements Load Service . . . . . . . . . . . . . . . . . . . . 933.1 1,591.9 (658.8)Other Power, Oil & Gas Marketing Services . . . . . . . . . . 753.5 747.7 5.8
Total Conectiv Energy Fuel and Purchased Energyand Other Services Cost of Sales . . . . . . . . . . . . . $2,130.9 $2,696.1 $(565.2)
Totals presented include $245.4 million and $161.1 million of affiliate transactions for 2004 and 2003,respectively.
The impact of Fuel and Purchased Energy and Other Services Cost of Sales changes for Conectiv Energy’scomponent of the Competitive Energy business is detailed within the discussion below under the heading“Conectiv Energy Gross Margin.”
B-30
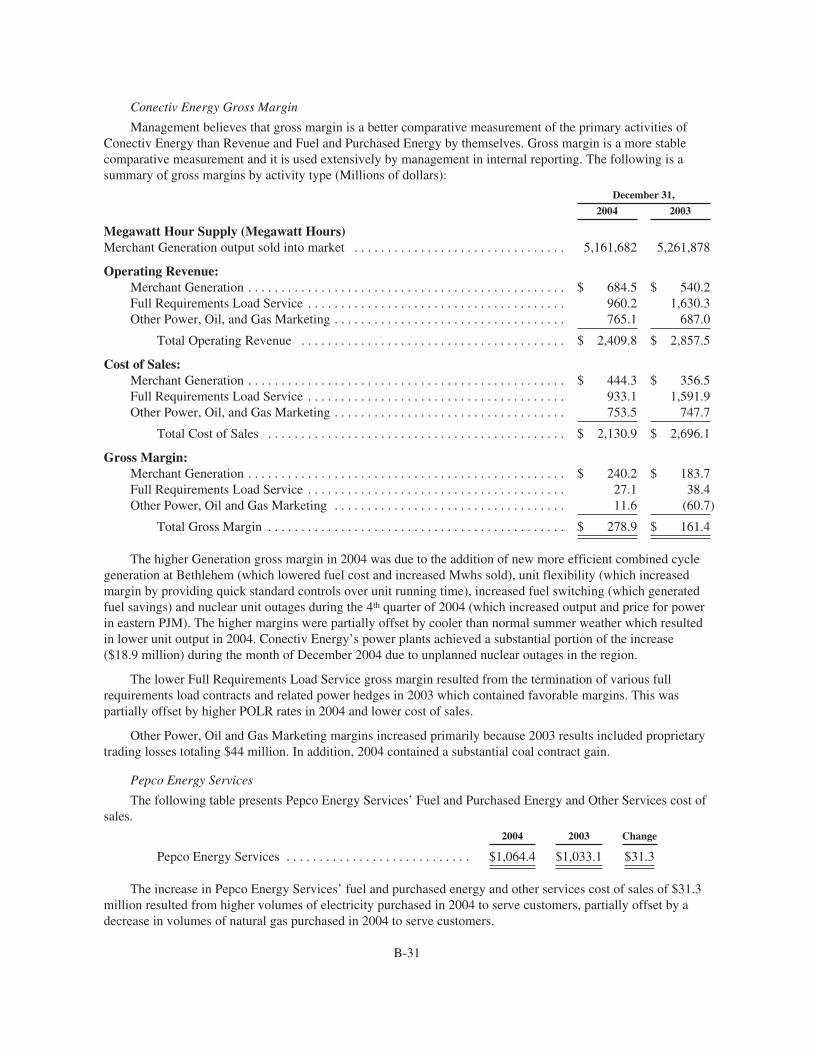
Conectiv Energy Gross Margin
Management believes that gross margin is a better comparative measurement of the primary activities ofConectiv Energy than Revenue and Fuel and Purchased Energy by themselves. Gross margin is a more stablecomparative measurement and it is used extensively by management in internal reporting. The following is asummary of gross margins by activity type (Millions of dollars):
December 31,
2004 2003
Megawatt Hour Supply (Megawatt Hours)Merchant Generation output sold into market . . . . . . . . . . . . . . . . . . . . . . . . . . . . . . . . 5,161,682 5,261,878
Operating Revenue:Merchant Generation . . . . . . . . . . . . . . . . . . . . . . . . . . . . . . . . . . . . . . . . . . . . . . . . $ 684.5 $ 540.2Full Requirements Load Service . . . . . . . . . . . . . . . . . . . . . . . . . . . . . . . . . . . . . . . 960.2 1,630.3Other Power, Oil, and Gas Marketing . . . . . . . . . . . . . . . . . . . . . . . . . . . . . . . . . . . 765.1 687.0
Total Operating Revenue . . . . . . . . . . . . . . . . . . . . . . . . . . . . . . . . . . . . . . . . $ 2,409.8 $ 2,857.5
Cost of Sales:Merchant Generation . . . . . . . . . . . . . . . . . . . . . . . . . . . . . . . . . . . . . . . . . . . . . . . . $ 444.3 $ 356.5Full Requirements Load Service . . . . . . . . . . . . . . . . . . . . . . . . . . . . . . . . . . . . . . . 933.1 1,591.9Other Power, Oil, and Gas Marketing . . . . . . . . . . . . . . . . . . . . . . . . . . . . . . . . . . . 753.5 747.7
Total Cost of Sales . . . . . . . . . . . . . . . . . . . . . . . . . . . . . . . . . . . . . . . . . . . . . $ 2,130.9 $ 2,696.1
Gross Margin:Merchant Generation . . . . . . . . . . . . . . . . . . . . . . . . . . . . . . . . . . . . . . . . . . . . . . . . $ 240.2 $ 183.7Full Requirements Load Service . . . . . . . . . . . . . . . . . . . . . . . . . . . . . . . . . . . . . . . 27.1 38.4Other Power, Oil and Gas Marketing . . . . . . . . . . . . . . . . . . . . . . . . . . . . . . . . . . . 11.6 (60.7)
Total Gross Margin . . . . . . . . . . . . . . . . . . . . . . . . . . . . . . . . . . . . . . . . . . . . . $ 278.9 $ 161.4
The higher Generation gross margin in 2004 was due to the addition of new more efficient combined cyclegeneration at Bethlehem (which lowered fuel cost and increased Mwhs sold), unit flexibility (which increasedmargin by providing quick standard controls over unit running time), increased fuel switching (which generatedfuel savings) and nuclear unit outages during the 4th quarter of 2004 (which increased output and price for powerin eastern PJM). The higher margins were partially offset by cooler than normal summer weather which resultedin lower unit output in 2004. Conectiv Energy’s power plants achieved a substantial portion of the increase($18.9 million) during the month of December 2004 due to unplanned nuclear outages in the region.
The lower Full Requirements Load Service gross margin resulted from the termination of various fullrequirements load contracts and related power hedges in 2003 which contained favorable margins. This waspartially offset by higher POLR rates in 2004 and lower cost of sales.
Other Power, Oil and Gas Marketing margins increased primarily because 2003 results included proprietarytrading losses totaling $44 million. In addition, 2004 contained a substantial coal contract gain.
Pepco Energy Services
The following table presents Pepco Energy Services’ Fuel and Purchased Energy and Other Services cost ofsales.
2004 2003 Change
Pepco Energy Services . . . . . . . . . . . . . . . . . . . . . . . . . . . . $1,064.4 $1,033.1 $31.3
The increase in Pepco Energy Services’ fuel and purchased energy and other services cost of sales of $31.3million resulted from higher volumes of electricity purchased in 2004 to serve customers, partially offset by adecrease in volumes of natural gas purchased in 2004 to serve customers.
B-31

Other Operation and Maintenance
PHI’s other operation and maintenance increased by $25.2 million to $796.6 million in 2004 from $771.4million in 2003 primarily due to (i) $12.1 million of customer requested work (offset in Other Electric Revenue),(ii) $10.6 million higher electric system operation and maintenance costs, (iii) $9.4 million in Sarbanes-Oxleyexternal compliance costs, and (iv) $12.8 million in severance costs, partially offset by (v) $10.6 millionincremental storm costs primarily related to Hurricane Isabel in September 2003.
Depreciation and Amortization
PHI’s depreciation and amortization expenses increased by $18.4 million to $440.5 million in 2004 from$422.1 million in 2003 primarily due to a $17.0 million increase attributable to the Power Delivery businessresulting from (i) a $12.8 million increase for amortization of New Jersey bondable transition property as a resultof additional transitional bonds issued in December 2003, (ii) $3.8 million for the amortization of the New Jerseydeferred service costs balance which began in August 2003, and (iii) a $2.4 million increase for amortization of aregulatory tax asset related to New Jersey stranded costs. Additionally, depreciation expense attributable to theCompetitive Energy business increased by $5.9 million from 2003 due to a full year of depreciation expenseduring 2004 at Conectiv Energy’s Bethlehem facility.
Other Taxes
Other taxes increased by $39.2 million to $311.4 million in 2004 from $272.2 million in 2003. This increaseprimarily resulted from a $30.1 million increase attributable to the Power Delivery business due to higher countysurcharge pass-throughs of $33.9 million and $3.6 million higher gross receipts/delivery taxes (offset inRegulated T&D Electric Revenue).
Deferred Electric Service Costs
Deferred Electric Service Costs (DESC), which relates only to ACE, increased by $43.3 million to $36.3million in 2004 from a $7.0 million operating expense credit in 2003. At December 31, 2004, DESC representsthe net expense or over-recovery associated with New Jersey NUGs, MTC and other restructuring items. A keydriver of the $43.3 million change was $27.5 million for the New Jersey deferral disallowance from 2003. ACE’srates for the recovery of these costs are reset annually and the rates will vary from year to year. On ACE’sbalance sheet, regulatory assets include an under-recovery of $97.4 million as of December 31, 2004. Thisamount is net of a $46.1 million write-off on previously disallowed items under appeal.
Impairment Losses
The impairment losses recorded by PHI in 2003 consist of an impairment charge of $53.3 million from thecancellation of a CT contract and an $11.0 million aircraft investments impairment.
Gain on Sales of Assets
During 2004, PHI recorded $30.0 million in pre-tax gains on the sale of assets compared to a $68.8 millionpre-tax gain in 2003. The 2004 pre-tax gains primarily consist of (i) a $14.7 million pre-tax gain from thecondemnation settlement with the City of Vineland relating to the ACE transfer of distribution assets andcustomer accounts, (ii) an $8.3 million pre-tax gain on the sale of aircraft investments by PCI, and (iii) a $6.6million pre-tax gain on the sale of land. The $68.8 million pre-tax gain in 2003 represents the gain on the sale ofPHI’s office building which was owned by PCI.
Other Income (Expenses)
Other expenses (which are net of other income) decreased $91.9 million to $341.4 million in 2004 from$433.3 million in 2003. The decrease was primarily due to a pre-tax impairment charge of $102.6 million relatedto PHI’s investment in Starpower in 2003, compared to a pre-tax impairment charge of $11.2 million related toStarpower that was recorded in 2004.
B-32

Preferred Stock Dividend Requirements of Subsidiaries
Preferred Stock Dividend Requirements decreased by $11.1 million to $2.8 million in 2004 from $13.9million in 2003. Of this decrease, $6.9 million was attributable to SFAS No. 150, which requires that dividendson Mandatorily Redeemable Serial Preferred Stock declared subsequent to July 1, 2003 be recorded as interestexpense. An additional $4.6 million of the decrease resulted from lower dividends in 2004 due to the redemptionof the Trust Originated Preferred Securities in 2003.
Income Tax Expense
Pepco Holdings’ effective tax rate for 2004 was 39% as compared to the federal statutory rate of 35%. Themajor reasons for this difference were state income taxes (net of federal benefit), the flow-through of certainbook/tax depreciation differences, and the settlement with the IRS on certain non-lease financial assets (which isthe primary reason for the higher effective tax rate as compared to 2003), partially offset by the flow-through ofDeferred Investment Tax Credits and tax benefits related to certain leveraged leases, and the benefit associatedwith the retroactive adjustment for the issuance of final consolidated tax return regulations by a taxing authority.
Pepco Holdings’ effective tax rate for 2003 was 37% as compared to the federal statutory rate of 35%. Themajor reasons for this difference were state income taxes (net of federal benefit) and the flow-through of certainbook/tax depreciation differences, partially offset by the flow-through of Deferred Investment Tax Credits andtax benefits related to certain leveraged leases.
Extraordinary Item
In July 2003, the NJBPU approved the recovery of $149.5 million of stranded costs related to ACE’s B.L.England generating facility. As a result of the order, ACE reversed $10.0 million of accruals for the possibledisallowances related to these stranded costs. The credit to income of $5.9 million is classified as anextraordinary gain in the financial statements, since the original accrual was part of an extraordinary charge inconjunction with the accounting for competitive restructuring in 1999.
B-33

CAPITAL RESOURCES AND LIQUIDITY
This section discusses Pepco Holdings’ capital structure, cash flow activity, capital spending plans and otheruses and sources of capital for 2005 and 2004.
Capital Structure
The components of Pepco Holdings’ capital structure are shown below as of December 31, 2005 and 2004in accordance with GAAP. The table also shows the following adjustments to components of the capital structuremade for the reasons discussed in the footnotes to the table: (i) the exclusion from debt of the Transition Bondsissued by ACE Funding, and (ii) the treatment of the Variable Rate Demand Bonds (VRDBs) issued by certain ofPHI’s subsidiaries as long-term, rather than short-term, debt obligations (Millions of dollars):
2005
PerBalance
Sheet AdjustmentsAs
Adjusted
AsAdjusted
%
Common Shareholders’ Equity . . . . . . . . . . . . . . . . . . . . . . . . . . . . $3,584.1 $ — $3,584.1 41.8%Preferred Stock of Subsidiaries (a) . . . . . . . . . . . . . . . . . . . . . . . . . 45.9 — 45.9 .5%Long-Term Debt . . . . . . . . . . . . . . . . . . . . . . . . . . . . . . . . . . . . . . . 4,202.9 156.4 (b) 4,359.3 50.8%Transition Bonds issued by ACE Funding . . . . . . . . . . . . . . . . . . . 494.3 (494.3)(c) — —Long-Term Project Funding . . . . . . . . . . . . . . . . . . . . . . . . . . . . . . 25.5 — 25.5 .3%Capital Lease Obligations . . . . . . . . . . . . . . . . . . . . . . . . . . . . . . . . 116.6 — 116.6 1.4%Capital Lease Obligations due within one year . . . . . . . . . . . . . . . . 5.3 — 5.3 .1%Short-Term Debt . . . . . . . . . . . . . . . . . . . . . . . . . . . . . . . . . . . . . . . 156.4 (156.4)(b) — —Current Maturities of Long-Term Debt . . . . . . . . . . . . . . . . . . . . . . 469.5 (29.0)(d) 440.5 5.1%
Total . . . . . . . . . . . . . . . . . . . . . . . . . . . . . . . . . . . . . . . . . . . . . $9,100.5 $(523.3) $8,577.2 100.0%
2004
PerBalance
Sheet AdjustmentsAs
Adjusted
AsAdjusted
%
Common Shareholders’ Equity . . . . . . . . . . . . . . . . . . . . . . . . . . . . $3,339.0 $ — $3,339.0 38.1%Preferred Stock of Subsidiaries (a) . . . . . . . . . . . . . . . . . . . . . . . . . 54.9 — 54.9 .6%Long-Term Debt . . . . . . . . . . . . . . . . . . . . . . . . . . . . . . . . . . . . . . . 4,362.1 158.4 (b) 4,520.5 51.7%Transition Bonds issued by ACE Funding . . . . . . . . . . . . . . . . . . . 523.3 (523.3)(c) — —Long-Term Project Funding . . . . . . . . . . . . . . . . . . . . . . . . . . . . . . 65.3 — 65.3 .7%Capital Lease Obligations . . . . . . . . . . . . . . . . . . . . . . . . . . . . . . . . 122.1 — 122.1 1.4%Capital Lease Obligations due within one year . . . . . . . . . . . . . . . . 4.9 — 4.9 .1%Short-Term Debt . . . . . . . . . . . . . . . . . . . . . . . . . . . . . . . . . . . . . . . 319.7 (158.4)(b) 161.3 1.8%Current Maturities of Long-Term Debt . . . . . . . . . . . . . . . . . . . . . . 516.3 (28.1)(d) 488.2 5.6%
Total . . . . . . . . . . . . . . . . . . . . . . . . . . . . . . . . . . . . . . . . . . . . . $9,307.6 $(551.4) $8,756.2 100.0%
(a) Consists of Serial Preferred Stock and Redeemable Serial Preferred Stock issued by subsidiaries of PHI.(b) In accordance with GAAP, the VRDBs are included in short-term debt on the Balance Sheet of PHI because
they are payable on demand by the holder. However, under the terms of the VRDBs, when demand is madefor payment by the holder (specifically, when the VRDBs are submitted for purchase by the holder), theVRDBs are remarketed by a remarketing agent on a best efforts basis and the remarketing resets the interestrate at market rates. Due to the creditworthiness of the issuers, PHI expects that any VRDBs submitted forpurchase will be successfully remarketed. Because of these characteristics of the VRDBs, PHI, from a debtmanagement standpoint, views the VRDBs (which have nominal maturity dates ranging from 2009 to 2031)as Long-Term Debt and, accordingly, the adjustment reduces Short-Term Debt and increases Long-TermDebt by an amount equal to the principal amount of the VRDBs.
B-34

(c) Adjusted to exclude Transition Bonds issued by ACE Funding. Because repayment of the Transition Bondsis funded solely by charges collected from ACE’s customers and is not a general obligation of ACE or PHI,PHI excludes the Transition Bonds from capitalization from a debt management standpoint.
(d) Adjusted to exclude the current maturities of Transition Bonds issued by ACE Funding.
In 2003, PHI established a goal of reducing its total debt and preferred stock outstanding by $1 billion bythe end of 2007 to improve PHI’s interest coverage ratios and to achieve a ratio of consolidated equity to totalcapitalization (excluding Transition Bonds issued by ACE Funding) in the mid-40% range. Because the netproceeds of $278 million from a public offering of PHI common stock in 2004 was not contemplated in theoriginal $1 billion debt reduction plan, PHI raised its debt reduction goal to $1.3 billion by 2007.
PHI expects to meet its debt reduction goal through a combination of internally generated cash, equityissuances through the Shareholder Dividend Reinvestment Plan (DRP), and asset dispositions. (See “RiskFactors” for a description of factors that could cause PHI to not meet this goal.)
The total debt and preferred stock reduction achieved through year end 2005 is $1.14 billion.
Set forth below is a summary of the equity and long-term debt financing activity during 2005 for PepcoHoldings and its subsidiaries.
Pepco Holdings issued 1,228,505 shares of common stock under the DRP and various benefit plans. Theproceeds from the issuances were added to PHI’s general funds.
Pepco Holdings issued $250 million of floating rate unsecured notes due 2010. The net proceeds of $248.5million were used to repay commercial paper issued to fund the redemptions of Conectiv debt.
Pepco issued $175 million of 5.40% senior secured notes due 2035. The net proceeds of $172.8 million, plusadditional funds, were used to pay at maturity and redeem higher interest rate securities of $175 million.
DPL issued $100 million of unsecured notes due in 2015. The net proceeds of $98.9 million, plus additionalfunds, were used to redeem higher interest rate securities of $100 million.
Proceeds from Sale of Claims with Mirant
In December 2005, Pepco received proceeds of $112.9 million for the sale of the Pepco TPA Claim and thePepco asbestos claim against the Mirant bankruptcy estate. After customer sharing, Pepco recorded a pre-tax gainof $70.5 million related to the settlement of these claims.
Sale of Buzzard Point Property
In August 2005, Pepco sold for $75 million in cash 384,051 square feet of excess non-utility land owned byPepco located at Buzzard Point in the District of Columbia. The sale resulted in a pre-tax gain of $68.1 millionwhich was recorded as a reduction of Operating Expenses in the Consolidated Statements of Earnings.
Financial Investment Liquidation
In October 2005, PCI received $13.3 million in cash and recorded an after tax gain of $8.9 million related tothe liquidation of a financial investment that was written-off in 2001.
Working Capital
At December 31, 2005, Pepco Holdings’ current assets on a consolidated basis totaled $2.2 billion and itscurrent liabilities totaled $2.4 billion. At December 31, 2004, Pepco Holdings’ current assets totaled $1.7 billionand its current liabilities totaled $1.9 billion.
B-35

PHI’s working capital deficit results in large part from the fact that, in the normal course of business, PHI’sutility subsidiaries acquire energy supplies for their customers before the supplies are delivered to, metered andbilled to customers. Short-term financing is used to meet liquidity needs. Short-term financing is also used, attimes, to fund temporary redemptions of long-term debt, until long-term replacement financings are completed.
At December 31, 2005, Pepco Holdings’ cash and cash equivalents and its restricted cash, totaled $144.5million, of which $112.8 million was net cash collateral held by subsidiaries of PHI engaged in CompetitiveEnergy and Default Electricity Supply activities (none of which was held as restricted cash). At December 31,2004, Pepco Holdings’ cash and cash equivalents and its restricted cash totaled $71.5 million, of which $21million was net cash collateral held by subsidiaries of PHI engaged in Competitive Energy and DefaultElectricity Supply activities (of which $7.6 million was held as restricted cash). See “Capital Requirements—Contractual Arrangements with Credit Rating Triggers or Margining Rights” for additional information.
A detail of PHI’s short-term debt balance and its current maturities of long-term debt and project fundingbalance follows:
As of December 31, 2005(Millions of dollars)
TypePHI
Parent Pepco DPL ACEACE
FundingConectivEnergy PES PCI Conectiv
PHIConsolidated
Variable Rate DemandBonds . . . . . . . . . . . . $ — $ — $104.8 $22.6 $ — $— $29.0 $ — $ — $156.4
Floating Rate Note . . . . — — — — — — — — — —Commercial Paper . . . . — — — — — — — — — —
Total Short-TermDebt . . . . . . . . . $ — $ — $104.8 $22.6 $ — $— $29.0 $ — $ — $156.4
Current Maturities ofLong-Term Debt andProject Funding . . . . $300.0 $ 50.0 $ 22.9 $65.0 $29.0 $— $ 2.6 $ — $ — $469.5
As of December 31, 2004(Millions of dollars)
TypePHI
Parent Pepco DPL ACEACE
FundingConectivEnergy PES PCI Conectiv
PHIConsolidated
Variable Rate DemandBonds . . . . . . . . . . . . $ — $ — $104.8 $22.6 $ — $— $31.0 $ — $ — $158.4
Floating Rate Note . . . . 50.0 — — — — — — — — 50.0Commercial Paper . . . . 78.6 — — 32.7 — — — — — 111.3
Total Short-TermDebt . . . . . . . . . $128.6 $ — $104.8 $55.3 $ — $— $31.0 $ — $ — $319.7
Current Maturities ofLong-Term Debt andProject Funding . . . . $ — $100.0 $ 2.7 $40.0 $28.1 $— $ 5.5 $60.0 $280.0 $516.3
B-36

Cash Flow Activity
PHI’s cash flows for 2005, 2004, and 2003 are summarized below.
Cash Source (Use)
2005 2004 2003
(Millions of dollars)
Operating Activities . . . . . . . . . . . . . . . . . . . . . . . . . . . . . . . . . . . . . . . . . . . . . . . . . . $ 986.9 $ 715.7 $ 662.4Investing Activities . . . . . . . . . . . . . . . . . . . . . . . . . . . . . . . . . . . . . . . . . . . . . . . . . . (333.9) (417.3) (252.7)Financing Activities . . . . . . . . . . . . . . . . . . . . . . . . . . . . . . . . . . . . . . . . . . . . . . . . . . (561.0) (359.1) (370.7)
Net change in cash and cash equivalents . . . . . . . . . . . . . . . . . . . . . . . . . . . . . . . . . . $ 92.0 $ (60.7) $ 39.0
Operating Activities
Cash flows from operating activities are summarized below for 2005, 2004, and 2003.
Cash Source (Use)
2005 2004 2003
(Millions of dollars)
Net Income . . . . . . . . . . . . . . . . . . . . . . . . . . . . . . . . . . . . . . . . . . . . . . . . . . . . . . . . . . . $371.2 $260.6 $107.3Non-cash adjustments to net income . . . . . . . . . . . . . . . . . . . . . . . . . . . . . . . . . . . . . . . 156.5 521.9 643.8Changes in working capital . . . . . . . . . . . . . . . . . . . . . . . . . . . . . . . . . . . . . . . . . . . . . . 459.2 (66.8) (88.7)
Net cash provided by operating activities . . . . . . . . . . . . . . . . . . . . . . . . . . . . . . . . . . . $986.9 $715.7 $662.4
Net cash provided by operating activities increased by $271.2 million in 2005 as compared to 2004. A$110.6 million increase in net income in 2005 as compared to 2004 is a result of improved operating results atPHI’s regulated utilities. Other increases in operating activities include the following: (i) Pepco’s receipt of$112.9 million in proceeds in December 2005 for the sale of the Pepco TPA Claim and the Pepco asbestos claimagainst the Mirant bankruptcy estate, (ii) a decrease of approximately $29 million in interest paid on debtobligations in 2005 as compared to 2004 due to a decrease in outstanding debt, (iii) an increase in power brokerpayables in 2005 as a result of higher electricity prices, and (iv) an increase from $21 million to $112.8 million inthe cash collateral held in connection with Competitive Energy activities.
Cash flows from operating activities increased by $53.3 million to $715.7 million in 2004 from $662.4million in 2003. The $53.3 million increase was largely the result of improved operating results at PHI’sRegulated utilities. Regulated T&D Electric experienced 2% growth in Gwh sales in 2004, and Regulated T&DRevenue increased by $45.6 million primarily due to customer growth and increased average usage, higheraverage effective rates, and favorable warmer weather.
The Power Delivery business produced over 80% of consolidated cash from operations in 2005, 2004 and2003.
B-37

Investing Activities
The most significant items included in cash flows related to investing activities during 2005, 2004, and 2003are summarized below.
Cash Source (Use)
2005 2004 2003
(Millions of dollars)
Capital expenditures . . . . . . . . . . . . . . . . . . . . . . . . . . . . . . . . . . . . . . . . . . . . . . . . . . $(467.1) $(517.4) $(598.2)Cash proceeds from sale of:
Starpower investment . . . . . . . . . . . . . . . . . . . . . . . . . . . . . . . . . . . . . . . . . . . . . — 29.0 —Marketable securities, net . . . . . . . . . . . . . . . . . . . . . . . . . . . . . . . . . . . . . . . . . . — 19.4 156.6Office building and other properties . . . . . . . . . . . . . . . . . . . . . . . . . . . . . . . . . 84.1 46.4 147.7
All other investing cash flows, net . . . . . . . . . . . . . . . . . . . . . . . . . . . . . . . . . . . . . . . 49.1 5.3 41.2
Net cash used by investing activities . . . . . . . . . . . . . . . . . . . . . . . . . . . . . . . . . . . . . $(333.9) $(417.3) $(252.7)
Net cash used by investing activities decreased by $83.4 million in 2005 compared to 2004. The decrease isprimarily due to a $50.3 million decrease in capital expenditures, net proceeds of $73.7 million received from thesale of non-utility land in 2005, and proceeds of $33.8 million received by PCI from the sale of an energyinvestment and from the final liquidation of a financial investment that was written off in 2001.
In 2004, capital expenditures decreased $80.8 million to $517.4 million from $598.2 million in 2003. Thedecrease was primarily due to lower construction expenditures for Conectiv Energy, offset by an increase inPower Delivery capital requirements to upgrade electric transmission and distribution systems.
In 2004, PHI sold its 50% interest in Starpower for $29 million in cash. Additionally in 2004, PCI continuedto liquefy its marketable securities portfolio and PHI received proceeds from the sale of aircraft and land.
In 2003, PCI liquidated its marketable securities portfolio. Additionally, in 2003, PHI received cashproceeds of $147.7 million from the sale by PCI of an office building known as Edison Place (which serves asheadquarters for PHI and Pepco).
Financing Activities
Cash Source (Use)
2005 2004 2003
(Millions of dollars)
Common stock dividends . . . . . . . . . . . . . . . . . . . . . . . . . . . . . . . . . . . . . . . . . . . $(188.9) $ (176.0) $ (170.7)Common stock issuances . . . . . . . . . . . . . . . . . . . . . . . . . . . . . . . . . . . . . . . . . . . . 33.2 318.0 32.8Preferred stock redemptions . . . . . . . . . . . . . . . . . . . . . . . . . . . . . . . . . . . . . . . . . (9.0) (53.3) (197.5)Long-term debt issuances . . . . . . . . . . . . . . . . . . . . . . . . . . . . . . . . . . . . . . . . . . . 532.0 650.4 1,136.9Long-term debt redemptions . . . . . . . . . . . . . . . . . . . . . . . . . . . . . . . . . . . . . . . . . (755.8) (1,214.7) (692.2)Short-term debt, net . . . . . . . . . . . . . . . . . . . . . . . . . . . . . . . . . . . . . . . . . . . . . . . . (161.3) 136.3 (452.7)Other . . . . . . . . . . . . . . . . . . . . . . . . . . . . . . . . . . . . . . . . . . . . . . . . . . . . . . . . . . . (11.2) (19.8) (27.3)
Net cash used in financing activities . . . . . . . . . . . . . . . . . . . . . . . . . . . . . . . . . . . $(561.0) $ (359.1) $ (370.7)
Net cash used by financing activities increased by $201.9 million in 2005 as compared to 2004.
Common stock dividend payments were $188.9 million in 2005, $176.0 million in 2004 and $170.7 millionin 2003. The increase in common dividends paid in 2005 and 2004 was due to the issuance of 14,950,000 sharesof common stock in September 2004 and issuances of 1,228,505 and 1,471,936 shares in 2005 and 2004,respectively, of common stock under the DRP.
B-38

Preferred stock redemptions in 2005 totaled $9.0 million and included the following: (i) in October 2005,Pepco redeemed 22,795 shares of its $2.44 Series 1957 Serial Preferred Stock at $1.1 million, 74,103 shares of its$2.46 Series 1958 Serial Preferred Stock at $3.7 million, and 13,148 shares of its $2.28 Series 1965 SerialPreferred Stock at $.7 million, (ii) in August 2005, ACE redeemed 160 shares of its 4.35% Serial Preferred Stockat $.02 million, and (iii) in December 2005, DPL redeemed all of the 35,000 shares of its 6.75% Serial PreferredStock outstanding at $3.5 million.
In 2005, Pepco Holdings issued $250 million of floating rate unsecured notes due 2010. The net proceeds,plus additional funds, were used to repay commercial paper issued to fund the redemption of $300 million ofConectiv debt.
In September 2005, Pepco used the proceeds from the June 2005 issuance of $175 million in senior securednotes to fund the retirement of $100 million in first mortgage bonds at maturity as well as the redemption of $75million in first mortgage bonds prior to maturity.
In 2005, DPL issued $100 million of unsecured notes due 2015 to redeem $100 million of higher ratesecurities.
In December 2005, Pepco paid down $50 million of its $100 million bank loan due December 2006.
In 2005, ACE retired at maturity $40 million of medium-term notes.
In 2005, PCI redeemed $60 million of Medium-Term Notes.
Described above are $525 million of the $532 million total 2005 long-term debt issuances and $725 millionof the $755.8 million total 2005 long-term debt redemptions.
As a result of the 2004 common stock issuance, Pepco Holdings received $278.5 million of proceeds, net ofissuance costs of $10.3 million. The proceeds in combination with short-term debt were used to prepay in itsentirety the $335 million Conectiv Bethlehem term loan.
In 2004, Pepco redeemed all of the 900,000 shares of $3.40 series mandatorily redeemable preferred stockthen outstanding for $45 million, and 165,902 shares of $2.28 series preferred stock for $8.3 million.
In 2004, Pepco Holdings redeemed $200 million of variable rate notes at maturity.
In 2004, Pepco issued $275 million of secured senior notes with maturities of 10 and 30 years, the netproceeds of which were used to redeem higher interest rate securities of $210 million and to repay short-termdebt. Pepco borrowed $100 million under a bank loan due in 2006, and proceeds were used to redeemmandatorily redeemable preferred stock and repay short-term debt. DPL issued $100 million of unsecured notesthat mature in 2014, the net proceeds of which were used to redeem trust preferred securities and repay short-term debt. ACE issued $54.7 million of insured auction rate tax-exempt securities and $120 million of securedsenior notes which mature in 2029 and 2034, respectively; the net proceeds of $173.2 million were used toredeem higher interest rate securities. Conectiv redeemed $50 million of Medium-Term Notes, and PCIredeemed $86 million of Medium-Term Notes in 2004. In 2004, redemptions of mandatorily redeemable trustpreferred securities included $70 million for DPL and $25 million for ACE.
Described above are $649.7 million of the $650.4 million total 2004 long-term debt issuances and $1,149.2million of the $1,214.7 million total 2004 long-term debt redemptions.
In 2003, Pepco Holdings issued $700 million of unsecured long-term debt with maturities ranging from1 year to 7 years, the net proceeds of which were used to repay short-term debt. Pepco issued $200 million of
B-39

secured senior notes, and proceeds were used to refinance $125 million trust preferred securities and repay short-term debt. Pepco redeemed $50 million of First Mortgage Bonds at maturity, $140 million of First MortgageBonds, and $15 million of Medium-Term Notes during 2003. DPL issued $33.2 million of tax-exempt bondshaving maturities ranging from 5 to 35 years, the net proceeds of which were used to refinance higher interestdebt of $33 million. DPL also redeemed $85 million of First Mortgage Bonds at maturity and $32 million ofhigher interest rate securities. ACE redeemed $40 million of First Mortgage Bonds and $30 million Medium-Term Notes at maturity, and redeemed $58 million of higher interest rate securities. ACE Funding issued $152million of Transition Bonds with maturities ranging from 8 to 17 years, the net proceeds of which were used torecover the stranded costs associated with an ACE generation asset and transaction costs. PCI redeemed $141million of Medium-Term Notes in 2003. Conectiv redeemed $50 million of Medium-Term Notes. Also, in 2003,redemptions of mandatorily redeemable trust preferred securities included $125 million for Pepco, and $70million for ACE.
Described above are $1,085.2 million of the $1,136.9 million total 2003 long-term debt issuances and $647million of the $692.2 million total 2003 long-term debt redemptions.
Subsequent Financing
On February 9, 2006, certain institutional buyers tentatively agreed to purchase in a private placement $105million of ACE’s senior notes having an interest rate of 5.80% and a term of 30 years. The execution of adefinitive purchase agreement and closing is expected on or about March 15, 2006. The proceeds from the noteswould be used to repay outstanding commercial paper issued by ACE to fund the payment at maturity of $105million in principal amount of various issues of medium-term notes.
On March 1, 2006, Pepco redeemed all outstanding shares of its Serial Preferred Stock of each series, at102% of par, for an aggregate redemption amount of $21.9 million.
Capital Requirements
Construction Expenditures
Pepco Holdings’ construction expenditures for the year ended December 31, 2005 totaled $467.1 million ofwhich $432.1 million was related to the Power Delivery businesses and the remainder related to Conectiv Energyand Pepco Energy Services.
For the five-year period 2006 through 2010, approximate construction expenditures are projected as follows:
For the Year
2006 2007 2008 2009 2010 Total
Total . . . . . . . . . . . . . . . . . . . . . . . . . . . . . . . . . . . . . . . . . . . . . . . . . $571 $505 $500 $480 $492 $2,548Power Delivery related . . . . . . . . . . . . . . . . . . . . . . . . . . . . . . . . . . . $535 $477 $470 $454 $469 $2,405
These amounts include estimated costs for environmental compliance by PHI’s subsidiaries. Pepco Holdingsexpects to fund these expenditures through internally generated cash from the Power Delivery businesses.
Dividends
Pepco Holdings’ annual dividend rate on its common stock is determined by the Board of Directors on aquarterly basis and takes into consideration, among other factors, current and possible future developments thatmay affect PHI’s income and cash flows. PHI’s Board of Directors declared quarterly dividends of 25 cents pershare of common stock payable on March 31, 2005, June 30, 2005, September 30, 2005 and December 31, 2005.
On January 26, 2006, Pepco Holdings declared a dividend on common stock of 26 cents per share payableMarch 31, 2006, to shareholders of record March 10, 2006.
B-40

PHI generates no operating income of its own. Accordingly, its ability to pay dividends to its shareholdersdepends on dividends received from its subsidiaries. In addition to their future financial performance, the abilityof PHI’s direct and indirect subsidiaries to pay dividends is subject to limits imposed by: (i) state corporate andregulatory laws, which impose limitations on the funds that can be used to pay dividends and, in the case ofregulatory laws, as applicable, may require the prior approval of the relevant utility regulatory commissionsbefore dividends can be paid, (ii) the prior rights of holders of existing and future preferred stock, mortgagebonds and other long-term debt issued by the subsidiaries, and any other restrictions imposed in connection withthe incurrence of liabilities, and (iii) certain provisions of the charters of Pepco, DPL and ACE, which imposerestrictions on the payment of common stock dividends for the benefit of preferred stockholders.
Pepco’s articles of incorporation and DPL’s certificate and articles of incorporation each contain provisionsrestricting the amount of dividends that can be paid on common stock when preferred stock is outstanding if theapplicable company’s capitalization ratio is less than 25%. For this purpose, the capitalization ratio is equal to(i) common stock capital plus surplus, divided by (ii) total capital (including long-term debt) plus surplus. Inaddition, DPL’s certificate and articles of incorporation and ACE’s certificate of incorporation each provide that,if preferred stock is outstanding, no dividends may be paid on common stock if, after payment, the applicablecompany’s common stock capital plus surplus would be less than the involuntary liquidation value of theoutstanding preferred stock. Pepco has no shares of preferred stock outstanding. Currently, the restriction in theACE charter does not limit its ability to pay dividends.
Pension Funding
Pepco Holdings has a noncontributory retirement plan (the Retirement Plan) that covers substantially allemployees of Pepco, DPL and ACE and certain employees of other Pepco Holdings’ subsidiaries.
As of the 2005 valuation, the Retirement Plan satisfied the minimum funding requirements of theEmployment Retirement Income Security Act of 1974 (ERISA) without requiring any additional funding.However, PHI’s funding policy with regard to the Retirement Plan is to maintain a funding level in excess of100% of its accumulated benefit obligation (ABO). In 2005 and 2004, PHI made discretionary tax-deductiblecash contributions to the Retirement Plan in accordance with its funding policy as described below.
In 2005, the ABO for the Retirement Plan increased over 2004, due to the accrual of an additional year ofservice for participants and a decrease in the discount rate used to value the ABO obligation. The change in thediscount rate reflected the continued decline in long-term interest rates in 2005. The Retirement Plan assetsachieved returns in 2005 below the 8.50% level assumed in the valuation. As a result of the combination of thesefactors, in December 2005 PHI contributed $60 million (all of which was funded by ACE) to the RetirementPlan. The contribution was made to ensure that under reasonable assumptions, the funding level at year endwould be in excess of 100% of the ABO. In 2004, PHI contributed a total of $10 million (all of which wasfunded by Pepco) to the Retirement Plan. Assuming no changes to the current pension plan assumptions, PHIprojects no funding will be required under ERISA in 2006; however, PHI may elect to make a discretionarytax-deductible contribution, if required to maintain its assets in excess of ABO for the Retirement Plan.
B-41

Contractual Obligations And Commercial Commitments
Summary information about Pepco Holdings’ consolidated contractual obligations and commercialcommitments at December 31, 2005, is as follows:
Contractual Maturity
Obligation TotalLess than
1 Year1-3
Years3-5
YearsAfter 5Years
(Millions of dollars)
Variable rate demand bonds . . . . . . . . . . . . . . . . . . . . . . . $ 156.4 $ 156.4 $ — $ — $ —Long-term debt . . . . . . . . . . . . . . . . . . . . . . . . . . . . . . . . . 5,170.3 467.1 1,178.4 614.1 2,910.7Interest payments on debt . . . . . . . . . . . . . . . . . . . . . . . . 2,787.9 280.1 468.6 384.7 1,654.5Capital leases . . . . . . . . . . . . . . . . . . . . . . . . . . . . . . . . . . 213.9 15.8 30.9 30.4 136.8Operating leases . . . . . . . . . . . . . . . . . . . . . . . . . . . . . . . . 561.0 38.3 77.2 78.0 367.5Non-derivative fuel and purchase power contracts (a) . . 7,406.8 1,823.7 1,705.0 754.3 3,123.8
Total . . . . . . . . . . . . . . . . . . . . . . . . . . . . . . . . . . . . . $16,296.3 $2,781.4 $3,460.1 $1,861.5 $8,193.3
(a) Excludes the PPA Related Obligations that are part of the back-to-back agreement that was entered into withMirant (See “Relationship with Mirant Corporation” for additional information) and excludes ACE’s BGSload supply.
Third Party Guarantees, Indemnifications and Off-Balance Sheet Arrangements
Pepco Holdings and certain of its subsidiaries have various financial and performance guarantees andindemnification obligations which are entered into in the normal course of business to facilitate commercialtransactions with third parties as discussed below.
As of December 31, 2005, Pepco Holdings and its subsidiaries were parties to a variety of agreementspursuant to which they were guarantors for standby letters of credit, performance residual value, and othercommitments and obligations. The fair value of these commitments and obligations was not required to berecorded in Pepco Holdings’ Consolidated Balance Sheets; however, certain energy marketing obligations ofConectiv Energy were recorded. The commitments and obligations, in millions of dollars, were as follows:
Guarantor
PHI DPL ACE Other Total
Energy marketing obligations of Conectiv Energy (1) . . . . . . . . . . . . . . . $167.5 $— $— $— $167.5Energy procurement obligations of Pepco Energy Services (1) . . . . . . . . 13.4 — — — 13.4Guaranteed lease residual values (2) . . . . . . . . . . . . . . . . . . . . . . . . . . . . . .6 3.3 3.2 — 7.1Other (3) . . . . . . . . . . . . . . . . . . . . . . . . . . . . . . . . . . . . . . . . . . . . . . . . . . 18.3 — — 2.4 20.7
Total . . . . . . . . . . . . . . . . . . . . . . . . . . . . . . . . . . . . . . . . . . . . . . . . . $199.8 $ 3.3 $ 3.2 $ 2.4 $208.7
1. Pepco Holdings has contractual commitments for performance and related payments of Conectiv Energyand Pepco Energy Services to counterparties related to routine energy sales and procurement obligations,including requirements under BGS contracts entered into with ACE.
2. Subsidiaries of Pepco Holdings have guaranteed residual values in excess of fair value related to certainequipment and fleet vehicles held through lease agreements. As of December 31, 2005, obligations underthe guarantees were approximately $7.1 million. Assets leased under agreements subject to residual valueguarantees are typically for periods ranging from 2 years to 10 years. Historically, payments under theguarantees have not been made by the guarantor as, under normal conditions, the contract runs to full termat which time the residual value is minimal. As such, Pepco Holdings believes the likelihood of paymentbeing required under the guarantee is remote.
3. Other guarantees consist of:
• Pepco Holdings has guaranteed payment of a bond issued by a subsidiary of $14.9 million. PepcoHoldings does not expect to fund the full amount of the exposure under the guarantee.
B-42

• Pepco Holdings has guaranteed a subsidiary building lease of $3.4 million. Pepco Holdings does notexpect to fund the full amount of the exposure under the guarantee.
• PCI has guaranteed facility rental obligations related to contracts entered into by Starpower. As ofDecember 31, 2005, the guarantees cover the remaining $2.4 million in rental obligations.
Pepco Holdings and certain of its subsidiaries have entered into various indemnification agreements related topurchase and sale agreements and other types of contractual agreements with vendors and other third parties. Theseindemnification agreements typically cover environmental, tax, litigation and other matters, as well as breaches ofrepresentations, warranties and covenants set forth in these agreements. Typically, claims may be made by thirdparties under these indemnification agreements over various periods of time depending on the nature of the claim.The maximum potential exposure under these indemnification agreements can range from a specified dollar amountto an unlimited amount depending on the nature of the claim and the particular transaction. The total maximumpotential amount of future payments under these indemnification agreements is not estimable due to several factors,including uncertainty as to whether or when claims may be made under these indemnities.
Energy Contract Net Asset Activity
The following table provides detail on changes in net asset or liability position of the Competitive Energybusiness with respect to energy commodity contracts from one period to the next:
Roll-forward of Mark-to-Market Energy Contract Net AssetsFor the Year Ended December 31, 2005
(Dollars are pre-tax and in millions)
ProprietaryTrading (1)
OtherEnergy
Commodity(2) Total
Total Marked-to-Market (MTM) Energy Contract Net Assets atDecember 31, 2004 . . . . . . . . . . . . . . . . . . . . . . . . . . . . . . . . . . . . . . . . . $ .9 $ 25.7 $ 26.6
Total change in unrealized fair value excluding reclassification torealized at settlement of contracts . . . . . . . . . . . . . . . . . . . . . . . . . . . . . .1 36.2 36.3
Reclassification to realized at settlement of contracts . . . . . . . . . . . . . . . . (1.0) (124.6) (125.6)Effective portion of changes in fair value—recorded in Other
Comprehensive Income (OCI) . . . . . . . . . . . . . . . . . . . . . . . . . . . . . . . . — 121.9 121.9Ineffective portion of changes in fair value—recorded in earnings . . . . . . — .3 .3Changes in valuation techniques and assumptions . . . . . . . . . . . . . . . . . . . — — —Purchase/sale of existing contracts or portfolios subject to MTM . . . . . . . — .4 .4
Total MTM Energy Contract Net Assets at December 31, 2005 . . . . . . . . . . . . $— $ 59.9 $ 59.9
Detail of MTM Energy Contract Net Assets at December 31, 2005 (see above) Total
Current Assets (other current assets) . . . . . . . . . . . . . . . . . . . . . . . . . . . . . . . . . . . . . . . . . . . . $ 173.3Noncurrent Assets (other assets) . . . . . . . . . . . . . . . . . . . . . . . . . . . . . . . . . . . . . . . . . . . . . . . . 65.1
Total MTM Energy Assets . . . . . . . . . . . . . . . . . . . . . . . . . . . . . . . . . . . . . . . . . . . . . . . . . . . . 238.4
Current Liabilities (other current liabilities) . . . . . . . . . . . . . . . . . . . . . . . . . . . . . . . . . . . . . . . (114.2)Noncurrent Liabilities (other liabilities) . . . . . . . . . . . . . . . . . . . . . . . . . . . . . . . . . . . . . . . . . . (64.3)
Total MTM Energy Contract Liabilities . . . . . . . . . . . . . . . . . . . . . . . . . . . . . . . . . . . . . . . . . . (178.5)
Total MTM Energy Contract Net Assets . . . . . . . . . . . . . . . . . . . . . . . . . . . . . . . . . . . . . . . . . $ 59.9
Notes:(1) Includes all contracts held for proprietary trading since the discontinuation of that activity in 2003.
(2) Includes all SFAS No. 133 hedge activity and non-proprietary trading activities marked-to-market throughearnings.
B-43

The following table provides the source of fair value information (exchange-traded, provided by otherexternal sources, or modeled internally) used to determine the carrying amount of the Competitive Energybusiness’ total mark-to-market energy contract net assets. The table also provides the maturity, by year, of theCompetitive Energy business’ mark-to-market energy contract net assets, which indicates when the amounts willsettle and either generate cash for, or require payment of cash by, PHI.
PHI uses its best estimates to determine the fair value of the commodity and derivative contracts that itsCompetitive Energy business hold and sell. The fair values in each category presented below reflect forwardprices and volatility factors as of December 31, 2005 and are subject to change as a result of changes in thesefactors:
Maturity and Source of Fair Value of Mark-to-MarketEnergy Contract Net Assets
As of December 31, 2005(Dollars are pre-tax and in millions)
Fair Value of Contracts at December 31, 2005
Maturities
Source of Fair Value 2006 2007 20082009 andBeyond
TotalFair
Value
Proprietary TradingActively Quoted (i.e., exchange-traded) prices . . . . . . . . . . . . . . . . . $ — $ — $— $— $ —Prices provided by other external sources . . . . . . . . . . . . . . . . . . . . . — — — — —Modeled . . . . . . . . . . . . . . . . . . . . . . . . . . . . . . . . . . . . . . . . . . . . . . . — — — — —
Total . . . . . . . . . . . . . . . . . . . . . . . . . . . . . . . . . . . . . . . . . . . . . . . . . . $ — $ — $— $— $ —
Other Energy Commodity, net (1)Actively Quoted (i.e., exchange-traded) prices . . . . . . . . . . . . . . . . . $ 88.4 $ 45.5 $ 9.9 $ .4 $ 144.2Prices provided by other external sources (2) . . . . . . . . . . . . . . . . . . (68.6) (52.1) (1.9) (1.0) (123.6)Modeled (3) . . . . . . . . . . . . . . . . . . . . . . . . . . . . . . . . . . . . . . . . . . . . 39.3 — — — 39.3
Total . . . . . . . . . . . . . . . . . . . . . . . . . . . . . . . . . . . . . . . . . . . . . . . . . . $ 59.1 $ (6.6) $ 8.0 $ (.6) $ 59.9
Notes:(1) Includes all SFAS No. 133 hedge activity and non-proprietary trading activities marked-to-market through
AOCI or on the Statement of Earnings, as required.
(2) Prices provided by other external sources reflect information obtained from over-the-counter brokers,industry services, or multiple-party on-line platforms.
(3) The modeled hedge position is a power swap for 50% of the POLR obligation in the DPL territory. Themodel is used to approximate the forward load quantities. Pricing is derived from the broker market.
Contractual Arrangements with Credit Rating Triggers or Margining Rights
Under certain contractual arrangements entered into by PHI’s subsidiaries in connection with competitiveenergy and other transactions, the subsidiary may be required to provide cash collateral or letters of credit assecurity for its contractual obligations if the credit ratings of the subsidiary are downgraded one or more levels.In the event of a downgrade, the amount required to be posted would depend on the amount of the underlyingcontractual obligation existing at the time of the downgrade. As of December 31, 2005, a one-level downgrade inthe credit rating of PHI and all of its affected subsidiaries would have required PHI and such subsidiaries toprovide aggregate cash collateral or letters of credit of up to approximately $181 million. An additionalapproximately $328 million of aggregate cash collateral or letters of credit would have been required in the event
B-44

of subsequent downgrades to below investment grade. PHI believes that it and its utility subsidiaries maintainadequate short-term funding sources in the event the additional collateral or letters of credit are required. See“Sources of Capital—Short-Term Funding Sources.”
Many of the contractual arrangements entered into by PHI’s subsidiaries in connection with competitiveenergy activities include margining rights pursuant to which the PHI subsidiary or a counterparty may requestcollateral if the market value of the contractual obligations reaches levels in excess of the credit thresholdsestablished in the applicable arrangements. Pursuant to these margining rights, the affected PHI subsidiary mayreceive, or be required to post, collateral due to energy price movements. As of December 31, 2005, PepcoHoldings’ subsidiaries engaged in competitive energy activities and default supply activities were in receipt of (anet holder of) cash collateral in the amount of $112.8 million in connection with their competitive energyactivities.
Environmental Remediation Obligations
PHI’s accrued liabilities as of December 31, 2005 include approximately $22.3 million, of which $5.6million is expected to be incurred in 2006, for potential cleanup and other costs related to sites at which anoperating subsidiary is a PRP, is alleged to be a third-party contributor, or has made a decision to clean upcontamination on its own property. The principal environmental remediation obligations as of December 31,2005, were:
• $6.8 million, of which $1.0 million is expected to be incurred in 2006, payable by DPL in accordancewith a consent agreement reached with DNREC during 2001, for remediation, site restoration, naturalresource damage compensatory projects and other costs associated with environmental contaminationthat resulted from an oil release at the Indian River power plant. That plant was sold on June 22, 2001.
• ACE’s entry into a sale agreement in 2000 (which was subsequently terminated) for the B.L. Englandand Deepwater generating facilities (ACE transferred the Deepwater generating facility to ConectivEnergy on February 29, 2004) triggered the applicability of the New Jersey Industrial Site Recovery Actrequiring remediation at these facilities. When the prospective purchaser of these generating facilitiesterminated the agreement of sale in accordance with the agreement’s termination provisions, ACEdecided to continue the environmental investigation process at these facilities. ACE and ConectivEnergy are continuing the investigation with oversight from NJDEP. ACE anticipates that it will incurapproximately $2.2 million in environmental remediation costs, of which $860,000 is expected to beincurred in 2006, associated with the B.L. England generating facility. Conectiv Energy anticipates thatit will incur approximately $6.0 million in environmental remediation costs, of which $690,000 isexpected to be incurred in 2006, associated with the Deepwater generating facility.
• As a result of a December 7, 2003 oil spill at the B.L. England generating facility, $811,000 wasaccrued in December 2003 for estimated clean up, remediation, restoration, and potential NJDEP naturalresources damage assessments. As of December 31, 2005, ACE has spent $611,000 for clean up,remediation, and restoration. The remaining liability of $200,000 is anticipated to cover futurerestoration efforts to be monitored for three years ending in May 2007. The NJDEP natural resourcedamage assessments, if any, have not been determined at this time.
• DPL expects to incur costs of approximately $2.6 million in connection with a site located inWilmington, Delaware, to remediate residual material from the historical operation of a manufacturedgas plant. Approximately $2.0 million is expected to be incurred in 2006.
• Pepco expects to incur approximately $1.3 million for long-term monitoring in connection with apipeline oil release, of which $140,000 is expected to be incurred in 2006.
Sources Of Capital
Pepco Holdings’ sources to meet its long-term funding needs, such as capital expenditures, dividends, andnew investments, and its short-term funding needs, such as working capital and the temporary funding of long-term funding needs, include internally generated funds, securities issuances and bank financing under new or
B-45

existing facilities. PHI’s ability to generate funds from its operations and to access capital and credit markets issubject to risks and uncertainties. See “Risk Factors” for a discussion of important factors that may impact thesesources of capital.
Internally Generated Cash
The primary source of Pepco Holdings’ internally generated funds is the cash flow generated by itsregulated utility subsidiaries in the Power Delivery business. Additional sources of funds include cash flowgenerated from its non-regulated subsidiaries and the sale of non-core assets.
Short-Term Funding Sources
Pepco Holdings and its regulated utility subsidiaries have traditionally used a number of sources to fulfillshort-term funding needs, such as commercial paper, short-term notes and bank lines of credit. Proceeds fromshort-term borrowings are used primarily to meet working capital needs but may also be used to fund temporarilylong-term capital requirements.
Pepco Holdings maintains an ongoing commercial paper program of up to $700 million. Pepco, DPL, andACE have ongoing commercial paper programs of up to $300 million, up to $275 million, and up to$250 million, respectively. The commercial paper can be issued with maturities up to 270 days from the date ofissue. The commercial paper programs of PHI, Pepco, DPL, and ACE are backed by a $1.2 billion credit facility.
Long-Term Funding Sources
The sources of long-term funding for PHI and its subsidiaries are the issuance of debt and equity securitiesand borrowing under long-term credit agreements. Proceeds from long-term financings are used primarily to fundlong-term capital requirements, such as capital expenditures and new investments, and to repay or refinanceexisting indebtedness.
PUHCA Restrictions
Because Pepco Holdings is a public utility holding company that was registered under the Public UtilityHolding Company Act of 1935 (PUHCA 1935), it was required to obtain Securities and Exchange Commission(SEC) approval to issue securities. PUHCA 1935 also prohibited Pepco Holdings from borrowing from itssubsidiaries. Under an SEC Financing Order dated June 30, 2005 (the Financing Order), Pepco Holdings isauthorized to issue equity, preferred securities and debt securities in an aggregate amount not to exceed $6 billionthrough an authorization period ending June 30, 2008, subject to a ceiling on the effective cost of these funds.Pepco Holdings is also authorized to enter into guarantees to third parties or otherwise provide credit supportwith respect to obligations of its subsidiaries of up to $3.5 billion. Of this amount, only $1.75 billion may be onbehalf of subsidiaries engaged in energy marketing activities. As permitted under FERC regulations promulgatedunder the newly effective Public Utility Holding Company Act of 2005 (PUHCA 2005), Pepco Holdings willgive notice to FERC that it will continue to operate pursuant to the authority granted in the Financing Order untilfurther notice.
Under the Financing Order, Pepco Holdings is limited to issuing no more than an aggregate of 20 millionshares of common stock under the DRP and employee benefit plans during the period ending June 30, 2008.
The Financing Order requires that, in order to issue debt or equity securities, including commercial paper,Pepco Holdings must maintain a ratio of common stock equity to total capitalization (consisting of commonstock, preferred stock, if any, long-term debt and short-term debt for this purpose) of at least 30 percent. AtDecember 31, 2005, Pepco Holdings’ common equity ratio for purposes of the Financing Order was 40.1 percent.The Financing Order also requires that all rated securities issued by Pepco Holdings be rated “investment grade”
B-46

by at least one nationally recognized rating agency. Accordingly, if Pepco Holdings’ common equity ratio wereless than 30 percent or if no nationally recognized rating agency rated a security investment grade, PepcoHoldings could not issue the security without first obtaining an amendment to the Financing Order from FERC.
If an amendment to the Financing Order or other FERC authority pursuant to the Federal Power Act orFERC regulations is required to enable Pepco Holdings or any of its subsidiaries to effect a financing, there is nocertainty that such an amendment or authority could be obtained nor certainty as to the timing of FERC action.
The foregoing financing limitations also generally apply to Pepco, DPL, ACE and certain other PepcoHoldings’ subsidiaries.
Money Pool
Under the Financing Order, Pepco Holdings has received SEC authorization under PUHCA 1935, whichwill continue until June 30, 2008 under PUHCA 2005, to establish the Pepco Holdings system money pool. Themoney pool is a cash management mechanism used by Pepco Holdings to manage the short-term investment andborrowing requirements of the PHI subsidiaries that participate in the money pool. Pepco Holdings may invest inbut not borrow from the money pool. Eligible subsidiaries with surplus cash may deposit those funds in themoney pool. Deposits in the money pool are guaranteed by Pepco Holdings. Eligible subsidiaries with cashrequirements may borrow from the money pool. Borrowings from the money pool are unsecured. Depositors inthe money pool receive, and borrowers from the money pool pay, an interest rate based primarily on PepcoHoldings’ short-term borrowing rate. Pepco Holdings deposits funds in the money pool to the extent that the poolhas insufficient funds to meet the borrowing needs of its participants, which may require Pepco Holdings toborrow funds for deposit from external sources. Consequently, Pepco Holdings’ external borrowing requirementsfluctuate based on the amount of funds required to be deposited in the money pool.
REGULATORY AND OTHER MATTERS
Relationship with Mirant Corporation
In 2000, Pepco sold substantially all of its electricity generation assets to Mirant Corporation, formerlySouthern Energy, Inc. As part of the Asset Purchase and Sale Agreement, Pepco entered into several ongoingcontractual arrangements with Mirant Corporation and certain of its subsidiaries. In July 2003, MirantCorporation and most of its subsidiaries filed a voluntary petition for reorganization under Chapter 11 of the U.S.Bankruptcy Code in the U.S. Bankruptcy Court for the Northern District of Texas (the Bankruptcy Court). OnDecember 9, 2005, the Bankruptcy Court approved Mirant’s Plan of Reorganization (the Reorganization Plan)and the Mirant business emerged from bankruptcy on January 3, 2006 (the Bankruptcy Emergence Date), in theform of a new corporation of the same name (together with its predecessors, Mirant). However, as discussedbelow, the Reorganization Plan did not resolve all of the outstanding matters between Pepco and Mirant relatingto the Mirant bankruptcy and the litigation between Pepco and Mirant over these matters is ongoing.
Depending on the outcome of ongoing litigation, the Mirant bankruptcy could have a material adverse effecton the results of operations and cash flows of Pepco Holdings and Pepco. However, management believes thatPepco Holdings and Pepco currently have sufficient cash, cash flow and borrowing capacity under their creditfacilities and in the capital markets to be able to satisfy any additional cash requirements that may arise due to theMirant bankruptcy. Accordingly, management does not anticipate that the Mirant bankruptcy will impair theability of either Pepco Holdings or Pepco to fulfill its contractual obligations or to fund projected capitalexpenditures. On this basis, management currently does not believe that the Mirant bankruptcy will have amaterial adverse effect on the financial condition of either company.
Transition Power Agreements
As part of the Asset Purchase and Sale Agreement, Pepco and Mirant entered into Transition PowerAgreements for Maryland and the District of Columbia, respectively (collectively, the TPAs). Under the TPAs,
B-47

Mirant was obligated to supply Pepco with all of the capacity and energy needed to fulfill Pepco’s SOSobligations during the rate cap periods in each jurisdiction immediately following deregulation, which inMaryland extended through June 2004 and in the District of Columbia extended until January 22, 2005.
To avoid the potential rejection of the TPAs by Mirant in the bankruptcy proceeding, Pepco and Mirant inOctober 2003 entered into an Amended Settlement Agreement and Release (the Settlement Agreement) pursuantto which the terms of the TPAs were modified to increase the purchase price of the capacity and energy suppliedby Mirant. In exchange, the Settlement Agreement provided Pepco with an allowed, pre-petition generalunsecured claim against Mirant Corporation in the amount of $105 million (the Pepco TPA Claim).
On December 22, 2005, Pepco completed the sale of the Pepco TPA Claim, plus the right to receive accruedinterest thereon, to Deutsche Bank for a cash payment of $112.4 million. Additionally, Pepco received $0.5 millionin proceeds from Mirant in settlement of an asbestos claim against the Mirant bankruptcy estate. Pepco Holdingsand Pepco recognized a total gain of $70.5 million (pre-tax) related to the settlement of these claims. Based on theregulatory settlements entered into in connection with deregulation in Maryland and the District of Columbia, Pepcois obligated to share with its customers the profits it realizes from the provision of SOS during the rate cap periods.The proceeds of the sale of the Pepco TPA Claim will be included in the calculations of the amounts required to beshared with customers in both jurisdictions. Based on the applicable sharing formulas in the respective jurisdictions,Pepco anticipates that customers will receive (through billing credits) approximately $42.3 million of the proceedsover a 12-month period beginning in March 2006 (subject to DCPSC and MPSC approvals).
Power Purchase Agreements
Under agreements with FirstEnergy Corp., formerly Ohio Edison (FirstEnergy), and Allegheny Energy, Inc.,both entered into in 1987, Pepco was obligated to purchase 450 megawatts of capacity and energy fromFirstEnergy annually through December 2005 (the FirstEnergy PPA). Under the Panda PPA, entered into in1991, Pepco is obligated to purchase 230 megawatts of capacity and energy from Panda annually through 2021.At the time of the sale of Pepco’s generation assets to Mirant, the purchase price of the energy and capacityunder the PPAs was, and since that time has continued to be, substantially in excess of the market price. As a partof the Asset Purchase and Sale Agreement, Pepco entered into a “back-to-back” arrangement with Mirant. Underthis arrangement, Mirant (i) was obligated, through December 2005, to purchase from Pepco the capacity andenergy that Pepco was obligated to purchase under the FirstEnergy PPA at a price equal to Pepco’s purchaseprice from FirstEnergy, and (ii) is obligated through 2021 to purchase from Pepco the capacity and energy thatPepco is obligated to purchase under the Panda PPA at a price equal to Pepco’s purchase price from Panda (thePPA-Related Obligations). Mirant currently is making these required payments.
Pepco Pre-Petition Claims
At the time the Reorganization Plan was approved by the Bankruptcy Court, Pepco had pending pre-petitionclaims against Mirant totaling approximately $28.5 million (the Pre-Petition Claims), consisting of(i) approximately $26 million in payments due to Pepco in respect of the PPA-Related Obligations and(ii) approximately $2.5 million that Pepco has paid to Panda in settlement of certain billing disputes under the PandaPPA that related to periods after the sale of Pepco’s generation assets to Mirant and prior to Mirant’s bankruptcyfiling, for which Pepco believes Mirant is obligated to reimburse it under the terms of the Asset Purchase and SaleAgreement. In the bankruptcy proceeding, Mirant filed an objection to the Pre-Petition Claims. The Pre-PetitionClaims were not resolved in the Reorganization Plan and are the subject of ongoing litigation between Pepco andMirant. To the extent Pepco is successful in its efforts to recover the Pre-Petition Claims, it would receive under theterms of the Reorganization Plan a number of shares of common stock of the new corporation created pursuant tothe Reorganization Plan (the New Mirant Common Stock) equal to (i) the amount of the allowed claim (ii) dividedby the market price of the New Mirant Common Stock on the Bankruptcy Emergence Date. Because the number ofshares is based on the market price of the New Mirant Common Stock on the Bankruptcy Emergence Date, Pepcowould receive the benefit, and bear the risk, of any change in the market price of the stock between the BankruptcyEmergence Date and the date the stock is issued to Pepco.
B-48

As of December 31, 2005, Pepco maintained a receivable in the amount of $28.5 million, representing thePre-Petition Claims, which was offset by a reserve of $14.5 million established by an expense recorded in 2003to reflect the uncertainty as to whether the entire amount of the Pre-Petition Claims is recoverable. As ofDecember 31, 2005, this reserve was reduced to $9.6 million to reflect the fact that there was no longer anobjection to $15 million of Pepco’s claim.
Mirant’s Efforts to Reject the PPA-Related Obligations and Disgorgement Claims
In August 2003, Mirant filed with the Bankruptcy Court a motion seeking authorization to reject thePPA-Related Obligations (the First Motion to Reject). Upon motions filed with the U.S. District Court for theNorthern District of Texas (the District Court) by Pepco and FERC, the District Court in October 2003 withdrewjurisdiction over this matter from the Bankruptcy Court. In December 2003, the District Court denied Mirant’smotion to reject the PPA-Related Obligations on jurisdictional grounds. Mirant appealed the District Court’sdecision to the U.S. Court of Appeals for the Fifth Circuit (the Court of Appeals). In August 2004, the Court ofAppeals remanded the case to the District Court holding that the District Court had jurisdiction to rule on themerits of Mirant’s rejection motion, suggesting that in doing so the court apply a “more rigorous standard” thanthe business judgment rule usually applied by bankruptcy courts in ruling on rejection motions.
In December 2004, the District Court issued an order again denying Mirant’s motion to reject thePPA-Related Obligations. The District Court found that the PPA-Related Obligations are not severable from theAsset Purchase and Sale Agreement and that the Asset Purchase and Sale Agreement cannot be rejected in part,as Mirant was seeking to do. Mirant has appealed the District Court’s order to the Court of Appeals.
In January 2005, Mirant filed in the Bankruptcy Court a motion seeking to reject certain of its ongoingobligations under the Asset Purchase and Sale Agreement, including the PPA-Related Obligations (the SecondMotion to Reject). In March 2005, the District Court entered orders granting Pepco’s motion to withdrawjurisdiction over these rejection proceedings from the Bankruptcy Court and ordering Mirant to continue toperform the PPA-Related Obligations (the March 2005 Orders). Mirant has appealed the March 2005 Orders tothe Court of Appeals.
In March 2005, Pepco, FERC, the Office of People’s Counsel of the District of Columbia (the District ofColumbia OPC), the MPSC and the Office of People’s Counsel of Maryland (Maryland OPC) filed in the DistrictCourt oppositions to the Second Motion to Reject. In August 2005, the District Court issued an order informallystaying this matter, pending a decision by the Court of Appeals on the March 2005 Orders.
On February 9, 2006, oral arguments on Mirant’s appeals of the District Court’s order relating to the FirstMotion to Reject and the March 2005 Orders were held before the Court of Appeals; an opinion has not yet beenissued.
On December 1, 2005, Mirant filed with the Bankruptcy Court a motion seeking to reject the executory partsof the Asset Purchase and Sale Agreement and its obligations under all other related agreements with Pepco, withthe exception of Mirant’s obligations relating to operation of the electric generating stations owned by PepcoEnergy Services (the Third Motion to Reject). The Third Motion to Reject also seeks disgorgement of paymentsmade by Mirant to Pepco in respect of the PPA-Related Obligations after filing of its bankruptcy petition in July2003 to the extent the payments exceed the market value of the capacity and energy purchased. On December 21,2005, Pepco filed an opposition to the Third Motion to Reject in the Bankruptcy Court.
On December 1, 2005, Mirant, in an attempt to “recharacterize” the PPA-Related Obligations, filed acomplaint with the Bankruptcy Court seeking (i) a declaratory judgment that the payments due under thePPA-Related Obligations to Pepco are pre-petition debt obligations; and (ii) an order entitling Mirant to recoverall payments that it made to Pepco on account of these pre-petition obligations after the petition date to the extentpermitted under bankruptcy law (i.e., disgorgement).
B-49

On December 15, 2005, Pepco filed a motion with the District Court to withdraw jurisdiction over both ofthe December 1 filings from the Bankruptcy Court. The motion to withdraw and Mirant’s underlying complainthave both been stayed pending a decision of the Court of Appeals in the appeals described above.
Each of the theories advanced by Mirant to recover funds paid to Pepco relating to the PPA-RelatedObligations as a practical matter seeks reimbursement for the above-market cost of the capacity and energypurchased from Pepco over a period beginning, at the earliest, from the date on which Mirant filed its bankruptcypetition and ending on the date of rejection or the date through which disgorgement is approved. Under thesetheories, Pepco’s financial exposure is the amount paid by Mirant to Pepco in respect of the PPA-RelatedObligations during the relevant period, less the amount realized by Mirant from the resale of the purchasedenergy and capacity. On this basis, Pepco estimates that if Mirant ultimately is successful in rejecting thePPA-Related Obligations or on its alternative claims to recover payments made to Pepco related to thePPA-Related Obligations, Pepco’s maximum reimbursement obligation would be approximately $263 million asof March 1, 2006.
If Mirant were ultimately successful in its effort to reject its obligations relating to the Panda PPA, Pepcoalso would lose the benefit on a going-forward basis of the offsetting transaction that negates the financial risk toPepco of the Panda PPA. Accordingly, if Pepco were required to purchase capacity and energy from Pandacommencing as of March 1, 2006, at the rates provided in the PPA (with an average price per kilowatt hour ofapproximately 17.1 cents), and resold the capacity and energy at market rates projected, given the characteristicsof the Panda PPA, to be approximately 11.0 cents per kilowatt hour, Pepco estimates that it would incur losses ofapproximately $24 million for the remainder of 2006, approximately $30 million in 2007, and approximately $27million to $38 million annually thereafter through the 2021 contract termination date. These estimates are basedin part on current market prices and forward price estimates for energy and capacity, and do not includefinancing costs, all of which could be subject to significant fluctuation.
Pepco is continuing to exercise all available legal remedies to vigorously oppose Mirant’s efforts to reject orrecharacterize the PPA-Related Obligations under the Asset Purchase and Sale Agreement in order to protect theinterests of its customers and shareholders. While Pepco believes that it has substantial legal bases to opposethese efforts by Mirant, the ultimate legal outcome is uncertain. However, if Pepco is required to repay to Mirantany amounts received from Mirant in respect of the PPA-Related Obligations, Pepco believes it will be entitled tofile a claim against the Mirant bankruptcy estate in an amount equal to the amount repaid. Likewise, if Mirant issuccessful in its efforts to reject its future obligations relating to the Panda PPA, Pepco will have a claim againstMirant in an amount corresponding to the increased costs that it would incur. In either case, Pepco anticipatesthat Mirant will contest the claim. To the extent Pepco is successful in its efforts to recover on these claims, itwould receive, as in the case of the Pre-Petition Claims, a number of shares of New Mirant Common Stock thatis calculated using the market price of the New Mirant Common Stock on the Bankruptcy Emergence Date andaccordingly would receive the benefit, and bear the risk, of any change in the market price of the stock betweenthe Bankruptcy Emergence Date and the date the stock is issued to Pepco.
Regulatory Recovery of Mirant Bankruptcy Losses
If Mirant were ultimately successful in rejecting the PPA-Related Obligations or on its alternative claims torecover payments made to Pepco related to the PPA-Related Obligations and Pepco’s corresponding claimsagainst the Mirant bankruptcy estate are not recovered in full, Pepco would seek authority from the MPSC andthe DCPSC to recover its additional costs. Pepco is committed to working with its regulatory authorities toachieve a result that is appropriate for its shareholders and customers. Under the provisions of the settlementagreements approved by the MPSC and the DCPSC in the deregulation proceedings in which Pepco agreed todivest its generation assets under certain conditions, the PPAs were to become assets of Pepco’s distributionbusiness if they could not be sold. Pepco believes that these provisions would allow the stranded costs of thePPAs that are not recovered from the Mirant bankruptcy estate to be recovered from Pepco’s customers throughits distribution rates. If Pepco’s interpretation of the settlement agreements is confirmed, Pepco expects to be able
B-50

to establish the amount of its anticipated recovery from customers as a regulatory asset. However, there is noassurance that Pepco’s interpretation of the settlement agreements would be confirmed by the respective publicservice commissions.
Pepco’s Notice of Administrative Claims
On January 24, 2006, Pepco filed Notice of Administrative Claims in the Bankruptcy Court seeking torecover: (i) costs in excess of $70 million associated with the transmission upgrades necessitated by shut-down ofthe Potomac River Power Station; and (ii) costs in excess of $8 million due to Mirant’s unjustified post-petitiondelay in executing the certificates needed to permit Pepco to refinance certain tax exempt pollution controlbonds. Mirant is expected to oppose both of these claims, which must be approved by the Bankruptcy Court.There is no assurance that Pepco will be able to recover the amounts claimed.
Mirant’s Fraudulent Transfer Claim
In July 2005, Mirant filed a complaint in the Bankruptcy Court against Pepco alleging that Mirant’s $2.65billion purchase of Pepco’s generating assets in June 2000 constituted a fraudulent transfer for which it seekscompensatory and punitive damages. Mirant alleges in the complaint that the value of Pepco’s generation assetswas “not fair consideration or fair or reasonably equivalent value for the consideration paid to Pepco” and thatthe purchase of the assets rendered Mirant insolvent, or, alternatively, that Pepco and Southern Energy, Inc. (aspredecessor to Mirant) intended that Mirant would incur debts beyond its ability to pay them.
Pepco believes this claim has no merit and is vigorously contesting the claim, which has been withdrawn tothe District Court. On December 5, 2005, the District Court entered a stay pending a decision of the Court ofAppeals in the appeals described above.
The SMECO Agreement
As a term of the Asset Purchase and Sale Agreement, Pepco assigned to Mirant a facility and capacityagreement with Southern Maryland Electric Cooperative (SMECO) under which Pepco was obligated topurchase the capacity of an 84-megawatt combustion turbine installed and owned by SMECO at a former Pepcogenerating facility (the SMECO Agreement). The SMECO Agreement expires in 2015 and contemplates amonthly payment to SMECO of approximately $.5 million. Pepco is responsible to SMECO for the performanceof the SMECO Agreement if Mirant fails to perform its obligations thereunder. At this time, Mirant continues tomake post-petition payments due to SMECO.
On March 15, 2004, Mirant filed a complaint with the Bankruptcy Court seeking a declaratory judgmentthat the SMECO Agreement is an unexpired lease of non-residential real property rather than an executorycontract and that if Mirant were to successfully reject the agreement, any claim against the bankruptcy estate fordamages made by SMECO (or by Pepco as subrogee) would be subject to the provisions of the Bankruptcy Codethat limit the recovery of rejection damages by lessors.
On November 22, 2005, the Bankruptcy Court issued an order granting summary judgment in favor ofMirant, finding that the SMECO Agreement is an unexpired lease of nonresidential real property. On the basis ofthis ruling, any claim by SMECO (or by Pepco as subrogee) for damages arising from a successful rejection arelimited to the greater of (i) the amount of future rental payments due over one year, or (ii) 15% of the futurerental payments due over the remaining term of the lease, not to exceed three years.
On December 1, 2005, Mirant filed both a motion with the Bankruptcy Court seeking to reject the SMECOAgreement and a complaint against Pepco and SMECO seeking to recover payments made to SMECO after theentry of the Bankruptcy Court’s November 22, 2005 order holding that the SMECO Agreement is a lease of realproperty. On December 15, 2005, Pepco filed a motion with the District Court to withdraw jurisdiction of this
B-51

matter from the Bankruptcy Court. The motion to withdraw and Mirant’s underlying motion and complaint havebeen stayed pending a decision of the Court of Appeals in the appeals described above.
If the SMECO Agreement is successfully rejected by Mirant, Pepco will become responsible for theperformance of the SMECO Agreement. In addition, if the SMECO Agreement is ultimately determined to be anunexpired lease of nonresidential real property, Pepco’s claim for recovery against the Mirant bankruptcy estatewould be limited as described above. Pepco estimates that its rejection claim, assuming the SMECO Agreementis determined to be an unexpired lease of nonresidential real property, would be approximately $8 million, andthat the amount it would be obligated to pay over the remaining nine years of the SMECO Agreement isapproximately $44.3 million. While that amount would be offset by the sale of capacity, under currentprojections, the market value of the capacity is de minimis.
Rate Proceedings
Delaware
On October 3, 2005, DPL submitted its 2005 gas cost rate (GCR) filing to the DPSC, which permits DPL torecover gas procurement costs through customer rates. In its filing, DPL seeks to increase its GCR byapproximately 38% in anticipation of increasing natural gas commodity costs. The proposed rate becameeffective November 1, 2005, subject to refund pending final Delaware Public Service Commission (DPSC)approval after evidentiary hearings. A public input hearing was held on January 19, 2006. DPSC staff and theDivision of the Public Advocate filed testimony on February 20, 2006.
As authorized by the April 16, 2002 settlement agreement in Delaware relating to the acquisition ofConectiv by Pepco (the Delaware Merger Settlement Agreement), on May 4, 2005, DPL filed with the DPSC aproposed increase of approximately $6.2 million in electric transmission service revenues, or about 1.1% of totalDelaware retail electric revenues. This revenue increase covers the Delaware retail portion of the increase in the“Delmarva zonal” transmission rates on file with FERC under the PJM Open Access Transmission Tariff(OATT) and other transition of PJM charges. This level of revenue increase will decrease to the extent thatcompetitive suppliers provide the supply portion and its associated transmission service to retail customers. Inthat circumstance, PJM would charge the competitive retail supplier the PJM OATT rate for transmission serviceinto the Delmarva zone and DPL’s charges to the retail customer would exclude as a “shopping credit” anamount equal to the SOS supply charge and the transmission and ancillary charges that would otherwise becharged by DPL to the retail customer. DPL began collecting this rate change for service rendered on and afterJune 3, 2005, subject to refund pending final approval by the DPSC.
On September 1, 2005, DPL filed with the DPSC its first comprehensive base rate case in ten years. Thisapplication was filed as a result of increasing costs and is consistent with a provision in the Delaware MergerSettlement Agreement requiring DPL to file a base rate case by September 1, 2005 and permitting DPL to applyfor an increase in rates to be effective no earlier than May 1, 2006. In the application, DPL sought approval of anannual increase of approximately $5.1 million in its electric rates, with an increase of approximately $1.6 millionto its electric distribution base rates after proposing to assign approximately $3.5 million in costs to the supplycomponent of rates to be collected as part of the SOS. Of the approximately $1.6 million in net increases to itselectric distribution base rates, DPL proposed that approximately $1.2 million be recovered through changes indelivery charges and that the remaining approximately $0.4 million be recovered through changes in premisecollection and reconnect fees. The full proposed revenue increase is approximately 0.9% of total annual electricutility revenues, while the proposed net increase to distribution rates is 0.2% of total annual electric utilityrevenues. DPL’s distribution revenue requirement is based on a proposed return on common equity of 11%. DPLalso has proposed revised depreciation rates and a number of tariff modifications.
On September 20, 2005, the DPSC issued an order approving DPL’s request that the rate increase go intoeffect on May 1, 2006; subject to refund and pending evidentiary hearings. The order also suspends effectiveness ofvarious proposed tariff rule changes until the case is concluded. The discovery process commenced on October 21,
B-52

2005. In its direct testimony, DPSC staff has proposed a variety of adjustments to rate base, operating expensesincluding depreciation and rate of return with an overall recommendation of a distribution base rate revenuedecrease of $14.3 million. The DPSC staff’s testimony also addresses issues such as rate design, allocation of anyrate decrease and positions regarding the DPL’s proposals on certain non-rate tariff modifications. The DelawareDivision of Public Advocate has proposed many of the same adjustments and others with an overallrecommendation of a distribution base rate revenue decrease of $18.9 million. DPL filed rebuttal testimony onJanuary 17, 2006, which supports a distribution base rate revenue increase of $2 million. On January 30, 2006, theDPSC staff requested the Hearing Examiner approve a modification of the procedural schedule in the case to allowfor inclusion of testimony regarding recalculation of DPSC staff’s proposed depreciation rates to allow for aseparate amortization of the cost of removal reserve. DPL objected to this modification of the procedural schedule.The Hearing Examiner issued a letter ruling on February 1, 2006, which denied DPSC staff’s request for a modifiedprocedural schedule. On February 2, 2006, DPSC staff filed an emergency motion requesting the DPSC to permitconsideration of the issue by the Hearing Examiner in this docket. On February 6, 2006, the DPSC ruled to allowthe issue in the case. A revised procedural schedule was established by the Hearing Examiner on February 10, 2006.On February 15, 2006, DPL filed an interlocutory appeal of the Hearing Examiner’s ruling on the proceduralschedule with the DPSC. On February 28, 2006, the DPSC upheld the Hearing Examiner’s ruling and proceduralschedule set on February 10, 2006. DPSC staff filed testimony related to this issue on February 17, 2006. DPSCstaff’s revised depreciation proposal reduces their recommended proposed rate decrease to $18.9 million, plus theamortization of the cost of removal of $58.4 million, which DPSC staff has recommended be returned to customersthrough either a 5-, 7- or 10-year amortization. DPL continues to oppose the inclusion of this issue in the case forsubstantive and procedural grounds. Evidentiary hearings were held in early February. Hearings on the separateissue related to the depreciation of the cost of removal are scheduled to be held March 20, 2006. Briefs are due onMarch 31, 2006 and DPSC deliberation is scheduled to occur on April 25, 2006. DPL cannot predict the outcome ofthis proceeding.
District of Columbia and Maryland
On February 27, 2006, Pepco filed for the period February 8, 2002 through February 7, 2004 and for theperiod February 8, 2004 through February 7, 2005, an update to the District of Columbia GenerationProcurement Credit (GPC), which provides for sharing of the profit from SOS sales; and on February 24, 2006,Pepco filed an update for the period July 1, 2003 through June 30, 2004 to the Maryland GPC. The updates to theGPC in both the District of Columbia and Maryland take into account the proceeds from the sale of the $105million claim against the Mirant bankruptcy estate related to the TPA Settlement on December 13, 2005 for$112.4 million. The filings also incorporate true-ups to previous disbursements in the GPC for both states. In thefilings, Pepco requests that $24.3 million be credited to District of Columbia customers and $17.7 million becredited to Maryland customers during the twelve-month-period beginning April 2006.
Federal Energy Regulatory Commission
On January 31, 2005, Pepco, DPL, and ACE filed at FERC to reset their rates for network transmissionservice using a formula methodology. The companies also sought a 12.4% return on common equity and a50-basis-point return on equity adder that FERC had made available to transmission utilities who had joinedRegional Transmission Organizations and thus turned over control of their assets to an independent entity. FERCissued an order on May 31, 2005, approving the rates to go into effect June 1, 2005, subject to refund, hearings,and further orders. The new rates reflect a decrease of 7.7% in Pepco’s transmission rate, and increases of 6.5%and 3.3% in DPL’s and ACE’s transmission rates, respectively. The companies continue in settlementdiscussions under the supervision of a FERC administrative law judge and cannot predict the ultimate outcome ofthis proceeding.
Restructuring Deferral
Pursuant to orders issued by the NJBPU under New Jersey Electric Discount and Energy Competition Act(EDECA), beginning August 1, 1999, ACE was obligated to provide BGS to retail electricity customers in its
B-53

service territory who did not choose a competitive energy supplier. For the period August 1, 1999 throughJuly 31, 2003, ACE’s aggregate costs that it was allowed to recover from customers exceeded its aggregaterevenues from supplying BGS. These under-recovered costs were partially offset by a $59.3 million deferredenergy cost liability existing as of July 31, 1999 (LEAC Liability) that was related to ACE’s Levelized EnergyAdjustment Clause and ACE’s Demand Side Management Programs. ACE established a regulatory asset in anamount equal to the balance of under-recovered costs.
In August 2002, ACE filed a petition with the NJBPU for the recovery of approximately $176.4 million inactual and projected deferred costs relating to the provision of BGS and other restructuring related costs incurredby ACE over the four-year period August 1, 1999 through July 31, 2003, net of the $59.3 million offset for theLEAC Liability. The petition also requested that ACE’s rates be reset as of August 1, 2003 so that there would beno under-recovery of costs embedded in the rates on or after that date. The increase sought represented an overall8.4% annual increase in electric rates and was in addition to the base rate increase discussed above. ACE’srecovery of the deferred costs is subject to review and approval by the NJBPU in accordance with EDECA.
In July 2004, the NJBPU issued a final order in the restructuring deferral proceeding confirming a July 2003summary order, which (i) permitted ACE to begin collecting a portion of the deferred costs and reset rates torecover on-going costs incurred as a result of EDECA, (ii) approved the recovery of $125 million of the deferredbalance over a ten-year amortization period beginning August 1, 2003, (iii) transferred to ACE’s then pendingbase rate case for further consideration approximately $25.4 million of the deferred balance, and (iv) estimatedthe overall deferral balance as of July 31, 2003 at $195 million, of which $44.6 million was disallowed recoveryby ACE. ACE believes the record does not justify the level of disallowance imposed by the NJBPU in the finalorder. In August 2004, ACE filed with the Appellate Division of the Superior Court of New Jersey, which hearsappeals of New Jersey administrative agencies, including the NJBPU, a Notice of Appeal with respect to the July2004 final order. ACE’s initial brief was filed on August 17, 2005. Cross-appellant briefs on behalf of theDivision of the New Jersey Ratepayer Advocate and Cogentrix Energy Inc., the co-owner of two cogenerationpower plants with contracts to sell ACE approximately 397 megawatts of electricity, were filed on October 3,2005. The NJBPU Staff filed briefs on December 12, 2005. ACE filed its reply briefs on January 30, 2006.
Divestiture Cases
District of Columbia
Final briefs on Pepco’s District of Columbia divestiture proceeds sharing application were filed in July 2002following an evidentiary hearing in June 2002. That application was filed to implement a provision of Pepco’sDCPSC-approved divestiture settlement that provided for a sharing of any net proceeds from the sale of Pepco’sgeneration-related assets. One of the principal issues in the case is whether Pepco should be required to sharewith customers the excess deferred income taxes (EDIT) and accumulated deferred investment tax credits(ADITC) associated with the sold assets and, if so, whether such sharing would violate the normalizationprovisions of the Internal Revenue Code and its implementing regulations. As of December 31, 2005, the Districtof Columbia allocated portions of EDIT and ADITC associated with the divested generation assets wereapproximately $6.5 million and $5.8 million, respectively.
Pepco believes that a sharing of EDIT and ADITC would violate the Internal Revenue Service (IRS)normalization rules. Under these rules, Pepco could not transfer the EDIT and the ADITC benefit to customersmore quickly than on a straight line basis over the book life of the related assets. Since the assets are no longerowned there is no book life over which the EDIT and ADITC can be returned. If Pepco were required to shareEDIT and ADITC and, as a result, the normalization rules were violated, Pepco would be unable to useaccelerated depreciation on District of Columbia allocated or assigned property. In addition to sharing withcustomers the generation-related EDIT and ADITC balances, Pepco would have to pay to the IRS an amountequal to Pepco’s District of Columbia jurisdictional generation-related ADITC balance ($5.8 million as ofDecember 31, 2005), as well as its District of Columbia jurisdictional transmission and distribution-related
B-54

ADITC balance ($5.3 million as of December 31, 2005) in each case as those balances exist as of the later of thedate a DCPSC order is issued and all rights to appeal have been exhausted or lapsed, or the date the DCPSCorder becomes operative.
In March 2003, the IRS issued a notice of proposed rulemaking (NOPR), which would allow for the sharingof EDIT and ADITC related to divested assets with utility customers on a prospective basis and at the election ofthe taxpayer on a retroactive basis. In December 2005 a revised NOPR was issued which, among other things,withdrew the March 2003 NOPR and eliminated the taxpayer’s ability to elect to apply the regulationretroactively. Comments on the revised NOPR are due by March 21, 2006, and a public hearing will be held onApril 5, 2006. Pepco filed a letter with the DCPSC on January 12, 2006, in which it has reiterated that theDCPSC should continue to defer any decision on the ADITC and EDIT issues until the IRS issues finalregulations or states that its regulations project will be terminated without the issuance of any regulations. Otherissues in the divestiture proceeding deal with the treatment of internal costs and cost allocations as deductionsfrom the gross proceeds of the divestiture.
Pepco believes that its calculation of the District of Columbia customers’ share of divestiture proceeds iscorrect. However, depending on the ultimate outcome of this proceeding, Pepco could be required to makeadditional gain-sharing payments to District of Columbia customers, including the payments described aboverelated to EDIT and ADITC. Such additional payments (which, other than the EDIT and ADITC relatedpayments, cannot be estimated) would be charged to expense in the quarter and year in which a final decision isrendered and could have a material adverse effect on Pepco’s and PHI’s results of operations for those periods.However, neither PHI nor Pepco believes that additional gain-sharing payments, if any, or the ADITC-relatedpayments to the IRS, if required, would have a material adverse impact on its financial position, results ofoperations or cash flows. It is uncertain when the DCPSC will issue a decision regarding Pepco’s divestitureproceeds sharing application.
Maryland
Pepco filed its divestiture proceeds plan application in Maryland in April 2001. The principal issue in theMaryland case is the same EDIT and ADITC sharing issue that has been raised in the District of Columbia case.See the discussion above under “Divestiture Cases—District of Columbia.” As of December 31, 2005, the MPSCallocated portions of EDIT and ADITC associated with the divested generation assets were approximately$9.1 million and $10.4 million, respectively. Other issues deal with the treatment of certain costs as deductionsfrom the gross proceeds of the divestiture. In November 2003, the Hearing Examiner in the Maryland proceedingissued a proposed order with respect to the application that concluded that Pepco’s Maryland divestituresettlement agreement provided for a sharing between Pepco and customers of the EDIT and ADITC associatedwith the sold assets. Pepco believes that such a sharing would violate the normalization rules (discussed above)and would result in Pepco’s inability to use accelerated depreciation on Maryland allocated or assigned property.If the proposed order is affirmed, Pepco would have to share with its Maryland customers, on an approximately50/50 basis, the Maryland allocated portion of the generation-related EDIT ($9.1 million as of December 31,2005), and the Maryland-allocated portion of generation-related ADITC. Furthermore, Pepco would have to payto the IRS an amount equal to Pepco’s Maryland jurisdictional generation-related ADITC balance ($10.4 millionas of December 31, 2005), as well as its Maryland retail jurisdictional ADITC transmission and distribution-related balance ($9.5 million as of December 31, 2005), in each case as those balances exist as of the later of thedate a MPSC order is issued and all rights to appeal have been exhausted or lapsed, or the date the MPSC orderbecomes operative. The Hearing Examiner decided all other issues in favor of Pepco, except for thedetermination that only one-half of the severance payments that Pepco included in its calculation of corporatereorganization costs should be deducted from the sales proceeds before sharing of the net gain between Pepcoand customers. Pepco filed a letter with the MPSC on January 12, 2006, in which it has reiterated that the MPSCshould continue to defer any decision on the ADITC and EDIT issues until the IRS issues final regulations orstates that its regulations project will be terminated without the issuance of any regulations.
B-55

Pepco has appealed the Hearing Examiner’s decision as it relates to the treatment of EDIT and ADITC andcorporate reorganization costs to the MPSC. Consistent with Pepco’s position in the District of Columbia, Pepcohas argued that the only prudent course of action is for the MPSC to await the issuance of final regulationsrelating to the tax issues or a termination by the IRS of its regulation project without the issuance of anyregulations, and then allow the parties to file supplemental briefs on the tax issues. Pepco believes that itscalculation of the Maryland customers’ share of divestiture proceeds is correct. However, depending on theultimate outcome of this proceeding, Pepco could be required to share with its customers approximately 50percent of the EDIT and ADITC balances described above and make additional gain-sharing payments related tothe disallowed severance payments. Such additional payments would be charged to expense in the quarter andyear in which a final decision is rendered and could have a material adverse effect on results of operations forthose periods. However, neither PHI nor Pepco believes that additional gain-sharing payments, if any, or theADITC-related payments to the IRS, if required, would have a material adverse impact on its financial position,results of operations or cash flows.
Default Electricity Supply Proceedings
District of Columbia
Under an order issued by the DCPSC in March 2004, as amended by a DCPSC order issued in July 2004,Pepco is obligated to provide SOS for small commercial and residential customers through May 31, 2011 and forlarge commercial customers through May 31, 2007. In August 2004, the DCPSC issued an order adoptingadministrative charges for residential, small and large commercial District of Columbia SOS customers that areintended to allow Pepco to recover the administrative costs incurred to provide the SOS supply. The approvedadministrative charges include an average margin for Pepco of approximately $.00248 per kilowatt hour,calculated based on total sales to residential, small and large commercial District of Columbia SOS customersover the twelve months ended December 31, 2003. Because margins vary by customer class, the actual averagemargin over any given time period will depend on the number of SOS customers from each customer class andthe load taken by such customers over the time period. The administrative charges went into effect for Pepco’sSOS sales on February 8, 2005.
The TPA with Mirant under which Pepco obtained the fixed-rate SOS supply ended on January 22, 2005,while the new SOS supply contracts with the winning bidders in the competitive procurement process began onFebruary 1, 2005. Pepco procured power separately on the market for next-day deliveries to cover the period fromJanuary 23 through January 31, 2005, before the new SOS contracts began. Consequently, Pepco had to pay thedifference between the procurement cost of power on the market for next-day deliveries and the current SOS ratescharged to customers during the period from January 23 through January 31, 2005. In addition, because the newSOS rates did not go into effect until February 8, 2005, Pepco had to pay the difference between the procurementcost of power under the new SOS contracts and the SOS rates charged to customers for the period from February 1to February 7, 2005. The total amount of the difference is estimated to be approximately $8.7 million. Thisdifference, however, was included in the calculation of the GPC for the District of Columbia for the periodFebruary 8, 2004 through February 7, 2005, which was filed on July 12, 2005 with the DCPSC. The GPC providesfor a sharing between Pepco’s customers and shareholders, on an annual basis, of any margins, but not losses, thatPepco earned providing SOS in the District of Columbia during the four-year period from February 8, 2001 throughFebruary 7, 2005. At the time of the filing, based on the rates paid to Mirant by Pepco under the TPA Settlement,there was no customer sharing. On December 22, 2005 Pepco received $112.4 million in proceeds from the sale ofthe Pepco TPA Claim against the Mirant bankruptcy estate. A portion of this recovery related to the periodFebruary 8, 2004 through February 7, 2005 covered in the July 12 DCPSC filing. As a consequence, onFebruary 27, 2006, Pepco filed with the DCPSC an updated calculation of the customer sharing for this period,which also takes into account the losses incurred during the January 22, 2005 through February 7, 2005 period. Theupdated filing shows that both residential and commercial customers will receive customer sharing that totals $17.5million. Without the inclusion of the $8.7 million loss from the January 22, 2005 through February 7, 2005 period,the amount shared with customers would have been approximately $22.7 million, or $5.2 million greater, so that thenet effect of the loss on the SOS sales during this period is approximately $3.5 million.
B-56

On February 3, 2006, Pepco announced proposed rates for its District of Columbia SOS customers to takeeffect on June 1, 2006. The new rate will raise the average monthly bill for residential customers byapproximately 12%. The proposed rates must be approved by the DCPSC.
Delaware
Under a settlement approved by the DPSC, DPL is required to provide POLR to customers in Delawarethrough April 2006. DPL is paid for POLR to customers in Delaware at fixed rates established in the settlement.DPL obtains all of the energy needed to fulfill its POLR obligations in Delaware under a supply agreement withits affiliate Conectiv Energy, which terminates in May 2006. DPL does not make any profit or incur any loss onthe supply component of the POLR supply that it delivers to its Delaware customers. DPL is paid tariff deliveryrates for the delivery of electricity over its transmission and distribution facilities to both POLR customers andcustomers who have selected another energy supplier. These delivery rates generally are frozen through April2006, except that DPL is allowed to file for a one-time transmission rate change during this period. On March 22,2005, the DPSC issued an order approving DPL as the SOS provider after May 1, 2006, when DPL’s currentfixed rate POLR obligation ends. DPL will retain the SOS obligation for an indefinite period until changed by theDPSC, and will purchase the power supply required to satisfy its SOS obligations from wholesale suppliers undercontracts entered into pursuant to a competitive bid procedure.
On October 11, 2005, the DPSC approved a settlement agreement, under which DPL will provide SOS to allcustomer classes, with no specified termination date for SOS. Two categories of SOS will exist: (i) a fixed priceSOS available to all but the largest customers; and (ii) an Hourly Priced Service (HPS) for the largest customers.DPL will purchase the power supply required to satisfy its fixed-price SOS obligation from wholesale suppliersunder contracts entered into pursuant to a competitive bid procedure. Power to supply the HPS customers will beacquired on next-day and other short-term PJM markets. In addition to the costs of capacity, energy,transmission, and ancillary services associated with the fixed-price SOS and HPS, DPL’s initial rates will includea component referred to as the Reasonable Allowance for Retail Margin (RARM). Components of the RARMinclude a fixed annual margin of $2.75 million, plus estimated incremental expenses, a cash working capitalallowance, and recovery with a return over five years of the capitalized costs of a billing system to be used forbilling HPS customers.
Bids for fixed-priced SOS supply for the May 1, 2006 through May 31, 2007 period were accepted andapproved by the DPSC in December 2005 and January 2006. The new SOS rates are scheduled to be effectiveMay 1, 2006.
On February 7, 2006, the Governor of Delaware issued an Executive Order directing the DPSC and otherstate agencies to examine ways to mitigate the electric rate increases that are expected in May 2006 as a result ofrising energy prices. The Executive Order directed the DPSC to examine the feasibility of: (1) deferring orphasing-in the increases; (2) requiring DPL to build generation or enter into long-term supply contracts to meetall, or a portion of, the SOS supply requirements under a traditional regulatory paradigm; (3) directing DPL toconduct integrated resource planning to ensure fuel diversity and least-cost supply alternatives; and (4) requiringDPL to implement demand-side management, conservation and energy efficient programs.
In response to the Executive Order and to help facilitate discussion on several key issues facing the State ofDelaware, particularly the issue of rising energy prices, DPL presented a proposed plan to the DPSC onFebruary 28, 2006. A key feature of DPL’s proposed plan is a phase-in of rate increases to assist DPL’sresidential and small commercial customers with the impact of rising energy prices. The proposed phase-in of therate increase would be in three steps, with one third of the increase to be phased in on May 1, 2006, anotherone-third on January 1, 2007 and the remainder on June 1, 2007. The phase-in would create a deferral balance ofapproximately $60 million dollars that would accrue interest and would be recovered through a surchargeimposed for a 24-month period beginning June 1, 2007. DPL believes that this proposal offers a fair andreasonable solution to the concerns identified in the Executive Order.
B-57

The Delaware Governor’s Cabinet Committee on Energy filed its report with the Governor on March 8,2006. The report outlines a proposal that recommends: (1) a phase-in of the SOS increase; (2) long-term steps toensure more stabilized prices and supply; (3) aggregation of the state of Delaware’s power needs; and(4) reduction of Delaware’s dependence on traditional energy sources through conservation, energy efficiency,and innovation.
DPL intends to file with the DPSC, on or about March 15, 2006, an implementation plan with proposedtariffs based on its proposed phase-in plan as described above. DPL also anticipates that others may advanceother legislative or regulatory proposals to address the concerns expressed in the Executive Order. Accordingly,the nature and impact of any changes precipitated by the Executive Order are uncertain and DPL cannot predictat this time whether this phase-in proposal will be implemented.
Maryland
Because of rising energy prices and the resultant expected increases in Pepco’s and DPL’s rates, onMarch 3, 2006 the MPSC issued an order initiating an investigation to consider a residential rate stabilizationplan for Pepco and DPL. This investigation is driven by the unprecedented national and international events. TheMPSC directed the MPSC staff, Pepco and DPL to file comments addressing whether or not the rate stabilizationplan that the MPSC adopted for Baltimore Gas & Electric Company in a March 6, 2006 order also should be usedfor Pepco and DPL. Comments are to be filed by March 16, 2006.
On March 7, 2006, Pepco and DPL each announced the results of competitive bids to supply electricity to itsMaryland SOS customers for one year beginning June 1, 2006. The proposed new rates must be approvedformally by the MPSC. Due to significant increases in the cost of fuels used to generate electricity, the averagemonthly electric bill will increase by about 38.5% and 35% for Pepco’s and DPL’s Maryland residentialcustomers, respectively.
Virginia
Under amendments to the Virginia Electric Utility Restructuring Act implemented in March 2004, DPL isobligated to offer Default Service to customers in Virginia for an indefinite period until relieved of thatobligation by the VSCC. DPL currently obtains all of the energy and capacity needed to fulfill its Default Serviceobligations in Virginia under a supply agreement with Conectiv Energy that commenced on January 1, 2005 andexpires in May 2006 (the 2005 Supply Agreement). A prior agreement, also with Conectiv Energy, terminatedeffective December 31, 2004. DPL entered into the 2005 Supply Agreement after conducting a competitive bidprocedure in which Conectiv Energy was the lowest bidder.
In October 2004, DPL filed an application with the VSCC for approval to increase the rates that DPLcharges its Default Service customers to allow it to recover its costs for power under the 2005 Supply Agreementplus an administrative charge and a margin. A VSCC order issued in November 2004 allowed DPL to put interimrates into effect on January 1, 2005, subject to refund if the VSCC subsequently determined the rate is excessive.The interim rates reflected an increase of 1.0247 cents per Kwh to the fuel rate, which provide for recovery of theentire amount being paid by DPL to Conectiv Energy, but did not include an administrative charge or margin,pending further consideration of this issue. In January 2005, the VSCC ruled that the administrative charge andmargin are base rate items not recoverable through a fuel clause. In March 2005, the VSCC approved asettlement resolving all other issues and making the interim rates final.
On March 10, 2006, DPL filed a rate increase with the VSCC to reflect proposed rates for its VirginiaDefault Service customers to take effect on June 1, 2006. The new rates will raise the average monthly bill forresidential customers by approximately 43%. The proposed rates must be approved by the VSCC.
New Jersey
On October 12, 2005, the NJBPU, following the evaluation of proposals submitted by ACE and the otherthree electric distribution companies located in New Jersey, issued an order reaffirming the current BGS auction
B-58
process for the annual period from June 1, 2006 through May 2007. The NJBPU order maintains the current sizeand make up of the Commercial and Industrial Energy Pricing class (CIEP) and approved the electric distributioncompanies’ recommended approach for the CIEP auction product, but deferred a decision on the level of theretail margin funds.
Proposed Shut Down of B.L. England Generating Facility
In April 2004, pursuant to a NJBPU order, ACE filed a report with the NJBPU recommending that ACE’sB.L. England generating facility, a 447 megawatt plant, be shut down. The report stated that, while operation ofthe B.L. England generating facility was necessary at the time of the report to satisfy reliability standards, thosereliability standards could also be satisfied in other ways. The report concluded that, based on B.L. England’scurrent and projected operating costs resulting from compliance with more restrictive environmentalrequirements, the most cost-effective way in which to meet reliability standards is to shut down the B.L. Englandgenerating facility and construct additional transmission enhancements in southern New Jersey.
In December 2004, ACE filed a petition with the NJBPU requesting that the NJBPU establish a proceedingthat will consist of a Phase I and Phase II and that the procedural process for the Phase I proceeding requireintervention and participation by all persons interested in the prudence of the decision to shut down B.L. Englandgenerating facility and the categories of stranded costs associated with shutting down and dismantling the facilityand remediation of the site. ACE contemplates that Phase II of this proceeding, which would be initiated by anACE filing in 2008 or 2009, would establish the actual level of prudently incurred stranded costs to be recoveredfrom customers in rates. The NJBPU has not acted on this petition.
In a January 24, 2006 Administrative Consent Order (ACO) among PHI, Conectiv, ACE, the New JerseyDepartment of Environmental Protection (NJDEP) and the Attorney General of New Jersey, ACE agreed to shutdown and permanently cease operations at the B.L. England generating facility by December 15, 2007 if ACEdoes not sell the plant. The shut-down of the B.L. England generating facility will be subject to necessaryapprovals from the relevant agencies and the outcomes of the auction process, discussed under “ACE Auction ofGenerating Assets,” below.
ACE Auction of Generation Assets
In May 2005, ACE announced that it would again auction its electric generation assets, consisting of its B.L.England generating facility and its ownership interests in the Keystone and Conemaugh generating stations. OnNovember 15, 2005, ACE announced an agreement to sell its interests in the Keystone and Conemaughgenerating stations to Duquesne Light Holdings Inc. for $173.1 million. The sale, subject to approval by theNJBPU as well as other regulatory agencies and certain other legal conditions, is expected to be completedmid-year 2006.
Based on the expressed need of the potential B.L. England bidders for the details of the ACO relating to theshut down of the plant that was being negotiated between ACE and the NJDEP, ACE elected to delay the finalbid due date for B.L. England until such time as a final ACO was complete and available to bidders. With theJanuary 24, 2006 execution of the ACO by all parties, ACE is proceeding with the auction process. Indicativebids were received on February 16, 2006 and final bids are scheduled to be submitted on or about April 19, 2006.
Under the terms of sale, any successful bid for B.L. England must include assumption of all environmentalliabilities associated with the plant in accordance with the auction standards previously issued by the NJBPU.
Any sale of B.L. England will not affect the stranded costs associated with the plant that already have beensecuritized. If B.L. England is sold, ACE anticipates that, subject to regulatory approval in Phase II of theproceeding described above, approximately $9.1 million of additional assets may be eligible for recovery asstranded costs. The net gains on the sale of the Keystone and Conemaugh generating stations will be an offset to
B-59

stranded costs associated with the shutdown of B. L. England or will be offset through other ratemakingadjustments. Testimony filed by ACE with the NJBPU in December 2005 estimated net gains of approximately$126.9 million; however, the net gains ultimately realized will be dependent upon the timing of the closing of thesale of Keystone and Conemaugh generating stations, transaction costs and other factors.
Federal Tax Treatment of Cross-Border Leases
PCI maintains a portfolio of cross-border energy sale-leaseback transactions, which, as of December 31,2005, had a book value of approximately $1.3 billion, and from which PHI currently derives approximately $55million per year in tax benefits in the form of interest and depreciation deductions.
On February 11, 2005, the Treasury Department and IRS issued Notice 2005-13 informing taxpayers thatthe IRS intends to challenge on various grounds the purported tax benefits claimed by taxpayers entering intocertain sale-leaseback transactions with tax-indifferent parties (i.e., municipalities, tax-exempt and governmentalentities), including those entered into on or prior to March 12, 2004 (the Notice). All of PCI’s cross-borderenergy leases are with tax indifferent parties and were entered into prior to 2004. In addition, on June 29, 2005the IRS published a Coordinated Issue Paper concerning the resolution of audit issues related to suchtransactions. PCI’s cross-border energy leases are similar to those sale-leaseback transactions described in theNotice and the Coordinated Issue Paper.
PCI’s leases have been under examination by the IRS as part of the normal PHI tax audit. On May 4, 2005,the IRS issued a Notice of Proposed Adjustment to PHI that challenges the tax benefits realized from interest anddepreciation deductions claimed by PHI with respect to these leases for the tax years 2001 and 2002. The taxbenefits claimed by PHI with respect to these leases from 2001 through December 31, 2005 were approximately$230 million. The ultimate outcome of this issue is uncertain; however, if the IRS prevails, PHI would be subjectto additional taxes, along with interest and possibly penalties on the additional taxes, which could have a materialadverse effect on PHI’s financial condition, results of operations, and cash flows.
PHI believes that its tax position related to these transactions was proper based on applicable statutes,regulations and case law, and intends to contest the final adjustments proposed by the IRS; however, there is noassurance that PHI’s position will prevail.
On November 18, 2005 the U.S. Senate passed The Tax Relief Act of 2005 (S.2020) which would applypassive loss limitation rules to leases with foreign tax indifferent parties effective for taxable years beginningafter December 31, 2005, even if the leases were entered into on or prior to March 12, 2004. On December 8,2005 the U.S. House of Representatives passed the Tax Relief Extension Reconciliation Act of 2005 (H.R. 4297),which does not contain any provision which would modify the current treatment of leases with tax indifferentparties. Enactment into law of a bill that is similar to S.2020 in its current form could result in a material delay ofthe income tax benefits that PCI would receive in connection with its cross-border energy leases and therebyadversely affect PHI’s financial condition and cash flows. The U.S. House of Representatives and the U.S.Senate are expected to hold a conference in the near future to reconcile the differences in the two bills todetermine the final legislation.
Under SFAS No. 13, as currently interpreted, a settlement with the IRS or a change in tax law that results ina deferral of tax benefits that does not change the total estimated net income from a lease does not require anadjustment to the book value of the lease. However, if the IRS were to disallow, rather than require the deferralof, certain tax deductions related to PHI’s leases, PHI would be required to adjust the book value of the leasesand record a charge to earnings equal to the repricing impact of the disallowed deductions. Such a charge toearnings, if required, is likely to have a material adverse effect on PHI’s financial condition, results of operations,and cash flows for the period in which the charge is recorded.
In July 2005, the FASB released a Proposed Staff Position paper that would amend SFAS No. 13 andrequire a lease to be repriced and the book value adjusted when there is a change or probable change in the
B-60

timing of tax benefits. Under this proposal, a material change in the timing of cash flows under PHI’s cross-border leases as the result of a settlement with the IRS or a change in tax law also would require an adjustment tothe book value. If adopted in its proposed form, the application of this guidance could result in a material adverseeffect on PHI’s financial condition, results of operations, and cash flows, even if a resolution with the IRS or achange in tax law is limited to a deferral of the tax benefits realized by PCI from its leases.
IRS Mixed Service Cost Issue
During 2001, Pepco, DPL, and ACE changed their methods of accounting with respect to capitalizableconstruction costs for income tax purposes, which allow the companies to accelerate the deduction of certainexpenses that were previously capitalized and depreciated. Through December 31, 2005, these accelerateddeductions have generated incremental tax cash flow benefits of approximately $205 million (consisting of $94million for Pepco, $62 million for DPL, and $49 million for ACE) for the companies, primarily attributable totheir 2001 tax returns. On August 2, 2005, the IRS issued Revenue Ruling 2005-53 (the Revenue Ruling) thatwill limit the ability of the companies to utilize this method of accounting for income tax purposes on their taxreturns for 2004 and prior years. PHI intends to contest any IRS adjustment to its prior year income tax returnsbased on the Revenue Ruling. However, if the IRS is successful in applying this Revenue Ruling, Pepco, DPL,and ACE would be required to capitalize and depreciate a portion of the construction costs previously deductedand repay the associated income tax benefits, along with interest thereon. During 2005, PHI recorded a $10.9million increase in income tax expense consisting of $6.0 million for Pepco, $2.9 million for DPL, and $2.0million for ACE, to account for the accrued interest that would be paid on the portion of tax benefits that PHIestimates would be deferred to future years if the construction costs previously deducted are required to becapitalized and depreciated.
On the same day as the Revenue Ruling was issued, the Treasury Department released regulations that, ifadopted in their current form, would require Pepco, DPL, and ACE to change their method of accounting withrespect to capitalizable construction costs for income tax purposes for all future tax periods beginning in 2005.Under these regulations, Pepco, DPL, and ACE will have to capitalize and depreciate a portion of theconstruction costs that they have previously deducted and include the impact of this adjustment in taxable incomeover a two-year period beginning with tax year 2005. PHI is continuing to work with the industry to determine analternative method of accounting for capitalizable construction costs acceptable to the IRS to replace the methoddisallowed by the proposed regulations.
In February 2006, PHI paid approximately $121 million of taxes to cover the amount of taxes managementestimates will be payable once a new final method of tax accounting is adopted on its 2005 tax return, due to theproposed regulations. Although the increase in taxable income will be spread over the 2005 and 2006 tax returnperiods, the cash payments would have all occurred in 2006 with the filing of the 2005 tax return and the ongoing2006 estimated tax payments. This $121 million tax payment was accelerated to eliminate the need to accrueadditional federal interest expense for the potential IRS adjustment related to the previous tax accounting methodPHI used during the 2001-2004 tax years.
CRITICAL ACCOUNTING POLICIES
General
The SEC has defined a company’s most critical accounting policies as the ones that are most important tothe portrayal of its financial condition and results of operations, and which require the company to make its mostdifficult and subjective judgments, often as a result of the need to make estimates of matters that are inherentlyuncertain. Critical estimates represent those estimates and assumptions that may be material due to the levels ofsubjectivity and judgment necessary to account for highly uncertain matters or the susceptibility of such mattersto change, and that have a material impact on financial condition or operating performance.
B-61

Use of Estimates
The preparation of financial statements in conformity with accounting principles generally accepted in theUnited States of America, such as Statement of Position 94-6, “Disclosure of Certain Significant Risks andUncertainties,” requires management to make certain estimates and assumptions that affect the reported amountsof assets and liabilities, revenues and expenses, and related disclosures of contingent assets and liabilities in theconsolidated financial statements and accompanying notes.
Examples of significant estimates used by Pepco Holdings include the assessment of contingencies and theneed/amount for reserves of future receipts from Mirant (see “Relationship with Mirant Corporation”), thecalculation of future cash flows and fair value amounts for use in goodwill and asset impairment evaluations, fairvalue calculations (based on estimated market pricing) associated with derivative instruments, pension and otherpostretirement benefits assumptions, unbilled revenue calculations, and the judgment involved with assessing theprobability of recovery of regulatory assets. Additionally, PHI is subject to legal, regulatory, and otherproceedings and claims that arise in the ordinary course of our business. Pepco Holdings records an estimatedliability for these proceedings and claims based upon the probable and reasonably estimable criteria contained inSFAS No. 5, “Accounting for Contingencies.” Although Pepco Holdings believes that its estimates andassumptions are reasonable, they are based upon information available to management at the time the estimatesare made. Actual results may differ significantly from these estimates.
Goodwill Impairment Evaluation
Pepco Holdings believes that the estimates involved in its goodwill impairment evaluation process represent“Critical Accounting Estimates” because (i) they may be susceptible to change from period to period becausemanagement is required to make assumptions and judgments about the discounting of future cash flows, whichare inherently uncertain, (ii) actual results could vary from those used in Pepco Holdings’ estimates and theimpact of such variations could be material, and (iii) the impact that recognizing an impairment would have onPepco Holdings’ assets and the net loss related to an impairment charge could be material.
The provisions of SFAS No. 142, “Goodwill and Other Intangible Assets,” require the evaluation ofgoodwill for impairment at least annually and more frequently if events and circumstances indicate that the assetmight be impaired. SFAS No. 142 indicates that if the fair value of a reporting unit is less than its carrying value,including goodwill, an impairment charge may be necessary. The goodwill generated in the transaction by whichPepco acquired Conectiv in 2002 was allocated to Pepco Holdings’ Power Delivery segment. In order to estimatethe fair value of its Power Delivery segment, Pepco Holdings discounts the estimated future cash flowsassociated with the segment using a discounted cash flow model with a single interest rate that is commensuratewith the risk involved with such an investment. The estimation of fair value is dependent on a number of factors,including but not limited to interest rates, future growth assumptions, operating and capital expenditurerequirements and other factors, changes in which could materially impact the results of impairment testing.Pepco Holdings tested its goodwill for impairment as of July 1, 2005. This testing concluded that PepcoHoldings’ goodwill balance was not impaired. A hypothetical decrease in the Power Delivery segment’sforecasted cash flows of 10 percent would not have resulted in an impairment charge.
Long-Lived Assets Impairment Evaluation
Pepco Holdings believes that the estimates involved in its long-lived asset impairment evaluation processrepresent “Critical Accounting Estimates” because (i) they are highly susceptible to change from period to periodbecause management is required to make assumptions and judgments about undiscounted and discounted futurecash flows and fair values, which are inherently uncertain, (ii) actual results could vary from those used in PepcoHoldings’ estimates and the impact of such variations could be material, and (iii) the impact that recognizing animpairment would have on Pepco Holdings’ assets as well as the net loss related to an impairment charge couldbe material.
B-62

SFAS No. 144, “Accounting for the Impairment or Disposal of Long-Lived Assets,” requires that certainlong-lived assets must be tested for recoverability whenever events or circumstances indicate that the carryingamount may not be recoverable. An impairment loss may only be recognized if the carrying amount of an asset isnot recoverable and the carrying amount exceeds its fair value. The asset is deemed not to be recoverable whenits carrying amount exceeds the sum of the undiscounted future cash flows expected to result from the use andeventual disposition of the asset. In order to estimate an asset’s future cash flows, Pepco Holdings considershistorical cash flows. Pepco Holdings uses its best estimates in making these evaluations and considers variousfactors, including forward price curves for energy, fuel costs, legislative initiatives, and operating costs. Theprocess of determining fair value is done consistent with the process described in assessing the fair value ofgoodwill, which is discussed above.
Derivative Instruments
Pepco Holdings believes that the estimates involved in accounting for its derivative instruments represent“Critical Accounting Estimates” because (i) the fair value of the instruments are highly susceptible to changes inmarket value and interest rate fluctuations, (ii) there are significant uncertainties in modeling techniques used tomeasure fair value in certain circumstances, (iii) actual results could vary from those used in Pepco Holdings’estimates and the impact of such variations could be material, and (iv) changes in fair values and market pricescould result in material impacts to Pepco Holdings’ assets, liabilities, other comprehensive income (loss), andresults of operations. See Note 2, “Summary of Significant Accounting Policies—Accounting for Derivatives” tothe consolidated financial statements of PHI for information on PHI’s accounting for derivatives.
Pepco Holdings and its subsidiaries use derivative instruments primarily to manage risk associated withcommodity prices and interest rates. SFAS No. 133, “Accounting for Derivative Instruments and HedgingActivities,” as amended, governs the accounting treatment for derivatives and requires that derivative instrumentsbe measured at fair value. The fair value of derivatives is determined using quoted exchange prices whereavailable. For instruments that are not traded on an exchange, external broker quotes are used to determine fairvalue. For some custom and complex instruments, an internal model is used to interpolate broker quality priceinformation. The same valuation methods are used to determine the value of non-derivative, commodity exposurefor risk management purposes.
Pension and Other Postretirement Benefit Plans
Pepco Holdings believes that the estimates involved in reporting the costs of providing pension and otherpostretirement benefits represent “Critical Accounting Estimates” because (i) they are based on an actuarialcalculation that includes a number of assumptions which are subjective in nature, (ii) they are dependent onnumerous factors resulting from actual plan experience and assumptions of future experience, and (iii) changes inassumptions could impact Pepco Holdings’ expected future cash funding requirements for the plans and wouldhave an impact on the projected benefit obligations, the reported pension and other postretirement benefitliability on the balance sheet, and the reported annual net periodic pension and other postretirement benefit coston the income statement. In terms of quantifying the anticipated impact of a change in assumptions, PepcoHoldings estimates that a .25% change in the discount rate used to value the benefit obligations could result in a$5 million impact on its consolidated balance sheets and statements of earnings. Additionally, Pepco Holdingsestimates that a .25% change in the expected return on plan assets could result in a $4 million impact on theconsolidated balance sheets and statements of earnings and a .25% change in the assumed healthcare cost trendrate could result in a $.5 million impact on its consolidated balance sheets and statements of earnings. PepcoHoldings’ management consults with its actuaries and investment consultants when selecting its planassumptions.
Pepco Holdings follows the guidance of SFAS No. 87, “Employers’ Accounting for Pensions,” and SFASNo. 106, “Employers’ Accounting for Postretirement Benefits Other Than Pensions,” when accounting for thesebenefits. Under these accounting standards, assumptions are made regarding the valuation of benefit obligations
B-63

and the performance of plan assets. In accordance with these standards, the impact of changes in theseassumptions and the difference between actual and expected or estimated results on pension and postretirementobligations is generally recognized over the working lives of the employees who benefit under the plans ratherthan immediately recognized in the statement of earnings. Plan assets are stated at their market value as of themeasurement date, which is December 31.
Regulation of Power Delivery Operations
The requirements of SFAS No. 71, “Accounting for the Effects of Certain Types of Regulation,” apply tothe Power Delivery businesses of Pepco, DPL, and ACE. Pepco Holdings believes that the judgment involved inaccounting for its regulated activities represent “Critical Accounting Estimates” because (i) a significant amountof judgment is required (including but not limited to the interpretation of laws and regulatory commission orders)to assess the probability of the recovery of regulatory assets, (ii) actual results and interpretations could varyfrom those used in Pepco Holdings’ estimates and the impact of such variations could be material, and (iii) theimpact that writing off a regulatory asset would have on Pepco Holdings’ assets and the net loss related to thecharge could be material.
Unbilled Revenue
Unbilled revenue represents an estimate of revenue earned from services rendered by Pepco Holdings’utility operations that have not yet been billed. Pepco Holdings’ utility operations calculate unbilled revenueusing an output based methodology. This methodology is based on the supply of electricity or gas distributed tocustomers. Pepco Holdings believes that the estimates involved in its unbilled revenue process represent “CriticalAccounting Estimates” because management is required to make assumptions and judgments about input factorssuch as customer sales mix and estimated power line losses (estimates of electricity expected to be lost in theprocess of its transmission and distribution to customers), all of which are inherently uncertain and susceptible tochange from period to period, the impact of which could be material.
New Accounting Standards
SFAS No. 154
In May 2005, the FASB issued Statement No. 154, “Accounting Changes and Error Corrections (SFASNo. 154), a replacement of APB Opinion No. 20 and FASB Statement No. 3.” SFAS No. 154 provides guidanceon the accounting for and reporting of accounting changes and error corrections. It establishes, unlessimpracticable, retrospective application as the required method for reporting a change in accounting principle inthe absence of explicit transition requirements specific to the newly adopted accounting principle. The reportingof a correction of an error by restating previously issued financial statements is also addressed by SFAS No. 154.This Statement is effective for accounting changes and corrections of errors made in fiscal years beginning afterDecember 15, 2005 (the year ended December 31, 2006 for Pepco Holdings). Early adoption is permitted.
SFAS No. 155
In February 2006, the FASB issued Statement No. 155, “Accounting for Certain Hybrid FinancialInstruments-an amendment of FASB Statements No. 133 and 140” (SFAS No. 155). This Statement amendsFASB Statements No. 133, “Accounting for Derivative Instruments and Hedging Activities”, and No. 140,“Accounting for Transfers and Servicing of Financial Assets and Extinguishments of Liabilities.” This Statementresolves issues addressed in Statement 133 Implementation Issue No. D1, “Application of Statement 133 toBeneficial Interests in Securitized Financial Assets.” SFAS No. 155 is effective for all financial instrumentsacquired or issued after the beginning of an entity’s first fiscal year that begins after September 15, 2006. PepcoHoldings is in the process of evaluating the impact of SFAS No. 155 but does not anticipate that itsimplementation will have a material impact on Pepco Holdings overall financial condition, results of operations,or cash flows.
B-64

SAB 107 and SFAS No. 123R
In March 2005, the SEC issued Staff Accounting Bulletin No. 107 (SAB 107) which providesimplementation guidance on the interaction between FASB Statement No. 123 (revised 2004), “Share-BasedPayment” (SFAS No. 123R), and certain SEC rules and regulations, as well as guidance on the valuation ofshare-based payment arrangements for public companies.
In April 2005, the SEC adopted a rule delaying the effective date of SFAS No. 123R for public companies.Under the rule, most registrants must comply with SFAS No. 123R beginning with the first interim or annualreporting period of their first fiscal year beginning after June 15, 2005 (the year ended December 31, 2006 forPepco Holdings).
In November 2005, the FASB published FASB Staff Position (FSP) FAS 123R-3, “Transition ElectionRelated to Accounting for the Tax Effects of Share-Based Payment Awards” (FSP FAS 123R-3), which providesguidance regarding an alternative transition election for accounting for the tax effects of share-based payments.FSP FAS 123R-3 was effective upon issuance.
In February 2006, the FASB published FASB Staff Position FAS 123(R)-4, “Classification of Options andSimilar Instruments Issued as Employee Compensation that Allow for Cash Settlement upon the Occurrence of aContingent Event” (FSP FAS 123(R)-4), which incorporate the concept of when cash settlement features ofoptions and similar instruments meet the condition outlined in SAFS No. 123R. FSP FAS 123(R)-4 is effectiveupon initial adoption of SFAS No.123R or the first reporting period after its issuance, if SFAS No. 123R hasbeen adopted.
Pepco Holdings is in the process of completing its evaluation of the impact of SFAS No. 123R, FSP FAS123(R)-3, and FSP FAS 123(R)-4, and does not anticipate that their implementation or SAB 107 will have amaterial effect on Pepco Holdings’ overall financial condition, results of operations or cash flows.
FIN 47
Pepco Holdings adopted FASB Interpretation No. 47, “Accounting for Conditional Asset RetirementObligations” (FIN 47), on December 31, 2005. A conditional asset retirement obligation refers to a legalobligation to perform an asset retirement activity in which the timing and/or method of settlement are conditionalon a future event that may or may not be within the control of the entity. The obligation to perform the assetretirement activity applies even though uncertainty exists about the time and/or method of settlement. FIN 47requires an entity to recognize a liability for the fair value of a conditional asset retirement obligation, whenincurred, if the fair value of the liability can be reasonably estimated. Uncertainty about the timing and/or methodof settlement of the conditional asset retirement obligation should be factored into the measurement of theliability when sufficient information exists.
In adopting FIN 47, Pepco Holdings identified that it has asset retirement obligations to (1) remove retiredunderground storage tanks located in multiple locations, (2) cap and monitor an ash disposal site, (3) removeasbestos at one generating station and (4) remove thermal equipment installed under contract with a Delawarecourt house at the termination of the contract. As a result of these obligations, during 2005 Pepco Holdingsrecorded both a conditional asset retirement obligation of $1.5 million and a de minimis transition liability.Accretion expense for 2005 which relates to the Power Delivery segment has been recorded as a regulatory asset.
EITF 04-13
In September 2005, the FASB ratified EITF Issue No. 04-13, “Accounting for Purchases and Sales ofInventory with the Same Counterparty” (EITF 04-13), which addresses circumstances under which two or moreexchange transactions involving inventory with the same counterparty should be viewed as a single exchangetransaction for the purposes of evaluating the effect of APB Opinion 29. EITF 04-13 is effective for new
B-65

arrangements entered into, or modifications or renewals of existing arrangements, beginning in the first interimor annual reporting period beginning after March 15, 2006 (April 1, 2006 for Pepco Holdings). EITF 04-13would not affect Pepco Holdings’ net income, overall financial condition, or cash flows, but rather could result incertain revenues and costs, including wholesale revenues and purchased power expenses, being presented on anet basis. Pepco Holdings is in the process of evaluating the impact of EITF 04-13 on its ConsolidatedStatements of Earnings presentation of purchases and sales.
RISK FACTORS
The businesses of PHI and its subsidiaries are subject to numerous risks and uncertainties, including theevents or conditions identified below. The occurrence of one or more of these events or conditions could have anadverse effect on the business of PHI and its subsidiaries, including, depending on the circumstances, theirfinancial condition, results of operations and cash flows.
PHI and its subsidiaries are subject to substantial governmental regulation. If PHI or any of its subsidiariesreceives unfavorable regulatory treatment, PHI’s business could be negatively affected.
PHI’s Power Delivery businesses are subject to regulation by various federal, state and local regulatoryagencies that significantly affects their operations. Each of Pepco, DPL and ACE is regulated by state publicservice commissions in its service territories, with respect to, among other things, the rates it can charge retailcustomers for the supply and distribution of electricity (and additionally for DPL the supply and distribution ofgas). In addition, the rates that the companies can charge for electricity transmission are regulated by FERC. Thecompanies cannot change supply, distribution, or transmission rates without approval by the applicableregulatory authority. While the approved distribution and transmission rates are intended to permit the companiesto recover their costs of service and earn a reasonable rate of return, the profitability of the companies is affectedby the rates they are able to charge. In addition, if the costs incurred by any of the companies in operating itstransmission and distribution facilities exceed the allowed amounts for costs included in the approved rates, thefinancial results of that company, and correspondingly, PHI, will be adversely affected.
PHI’s subsidiaries also are required to have numerous permits, approvals and certificates from governmentalagencies that regulate their businesses. PHI believes that its subsidiaries have obtained or sought renewal of thematerial permits, approvals and certificates necessary for their existing operations and that their businesses areconducted in accordance with applicable laws; however, PHI is unable to predict the impact of future regulatoryactivities of any of these agencies on its business. Changes in or reinterpretations of existing laws or regulations,or the imposition of new laws or regulations, may require PHI’s subsidiaries to incur additional expenses or tochange the way they conduct their operations.
PHI’s business could be adversely affected by the Mirant bankruptcy.
In 2000, Pepco sold substantially all of its electricity generation assets to Mirant. As part of the sale, Pepcoentered into several ongoing contractual arrangements with Mirant and certain of its subsidiaries. On July 14,2003, Mirant and most of its subsidiaries filed a voluntary petition for reorganization under Chapter 11 of theU.S. Bankruptcy Code in the U.S. Bankruptcy Court for the Northern District of Texas. Depending on theoutcome of the proceedings related to the bankruptcy, the Mirant bankruptcy could adversely affect PHI’sbusiness. See “Relationship with Mirant Corporation” for additional information.
Pepco may be required to make additional divestiture proceeds gain-sharing payments to customers in theDistrict of Columbia and Maryland.
Pepco currently is involved in regulatory proceedings in Maryland and the District of Columbia related tothe sharing of the net proceeds from the sale of its generation-related assets. The principal issue in theproceedings is whether Pepco should be required to share with customers the excess deferred income taxes andaccumulated deferred investment tax credits associated with the sold assets and, if so, whether such sharing
B-66

would violate the normalization provisions of the Internal Revenue Code and its implementing regulations.Depending on the outcome of the proceedings, Pepco could be required to make additional gain-sharingpayments to customers and payments to the IRS in the amount of the associated accumulated deferred investmenttax credits, and Pepco might be unable to use accelerated depreciation on District of Columbia and Marylandallocated or assigned property. See “Regulatory and Other Matters” for additional information.
The operating results of PHI’s Power Delivery and Competitive Energy businesses fluctuate on a seasonalbasis and can be adversely affected by changes in weather.
PHI’s Power Delivery and Competitive Energy businesses are seasonal and weather patterns can have amaterial impact on their operating performance. Demand for electricity is generally greater in the summermonths associated with cooling and demand for electricity and gas is generally greater in the winter monthsassociated with heating as compared to other times of the year. Historically, the competitive energy operations ofConectiv Energy and Pepco Energy Services have produced less revenues when weather conditions are milderthan normal. Such weather conditions can also negatively impact income from these operations. Energymanagement services generally are not seasonal.
The facilities of PHI’s subsidiaries may not operate as planned or may require significant maintenanceexpenditures, which could decrease their revenues or increase their expenses.
Operation of generation, transmission and distribution facilities involves many risks, including thebreakdown or failure of equipment, accidents, labor disputes and performance below expected levels. Olderfacilities and equipment, even if maintained in accordance with sound engineering practices, may requiresignificant capital expenditures for additions or upgrades to keep them operating at peak efficiency, to complywith changing environmental requirements, or to provide reliable operations. Natural disasters and weather-related incidents, including tornadoes, hurricanes and snow and ice storms, also can disrupt generation,transmission and distribution delivery systems. Operation of generation, transmission and distribution facilitiesbelow expected capacity levels can reduce revenues and result in the incurrence of additional expenses that maynot be recoverable from customers or through insurance. Furthermore, if PHI’s operating subsidiaries are unableto perform their contractual obligations for any of these reasons, they may incur penalties or damages.
The transmission facilities of PHI’s Power Delivery business are interconnected with the facilities of othertransmission facility owners whose actions could have a negative impact on the operations of PHI’ssubsidiaries.
The transmission facilities of Pepco, DPL and ACE are directly interconnected with the transmissionfacilities of contiguous utilities and, as such, are part of an interstate power transmission grid. FERC hasdesignated a number of regional transmission operators to coordinate the operation of portions of the interstatetransmission grid. Each of Pepco, DPL and ACE is a member of PJM, which is the regional transmissionoperator that coordinates the movement of electricity in all or parts of Delaware, Illinois, Indiana, Kentucky,Maryland, Michigan, New Jersey, North Carolina, Ohio, Pennsylvania, Tennessee, Virginia, West Virginia andthe District of Columbia. Pepco, DPL and ACE operate their transmission facilities under the direction andcontrol of PJM. PJM and the other regional transmission operators have established sophisticated systems thatare designed to ensure the reliability of the operation of transmission facilities and prevent the operations of oneutility from having an adverse impact on the operations of the other utilities. However, the systems put in placeby PJM and the other regional transmission operators may not always be adequate to prevent problems at otherutilities from causing service interruptions in the transmission facilities of Pepco, DPL or ACE. If any of Pepco,DPL or ACE were to suffer such a service interruption, it could have a negative impact on its and PHI’s business.
The cost of compliance with environmental laws is significant and new environmental laws may increasethe expenses of PHI and its subsidiaries.
The operations of PHI’s subsidiaries, both regulated and unregulated, are subject to extensive federal, stateand local environmental statutes, rules and regulations, relating to air quality, water quality, spill prevention,
B-67

waste management, natural resources, site remediation, and health and safety. These laws and regulations requirePHI’s subsidiaries to make capital expenditures and to incur other expenditures to, among other things, meetemissions standards, conduct site remediation and perform environmental monitoring. PHI’s subsidiaries alsomay be required to pay significant remediation costs with respect to third party sites. If PHI’s subsidiaries fail tocomply with applicable environmental laws and regulations, even if caused by factors beyond their control, suchfailure could result in the assessment of civil or criminal penalties and liabilities and the need to expendsignificant sums to come into compliance.
In addition, PHI’s subsidiaries incur costs to obtain and comply with a variety of environmental permits,licenses, inspections and other approvals. If there is a delay in obtaining any required environmental regulatoryapproval, or if PHI’s subsidiaries fail to obtain, maintain or comply with any such approval, operations ataffected facilities could be halted or subjected to additional costs.
New environmental laws and regulations, or new interpretations of existing laws and regulations, couldimpose more stringent limitations on the operations of PHI’s subsidiaries or require them to incur significantadditional costs. PHI’s current compliance strategy may not successfully address the relevant standards andinterpretations of the future.
Failure to retain and attract key skilled professional and technical employees could have an adverse effecton the operations of PHI.
Implementation of PHI’s strategy is dependent on its ability to recruit, retain and motivate employees.Competition for skilled employees in some areas is high and the inability to retain and attract these employeescould adversely affect PHI’s business, operations, and financial condition.
PHI’s Competitive Energy businesses are highly competitive.
The unregulated energy generation, supply and marketing businesses in the mid-Atlantic region arecharacterized by intense competition at both the wholesale and retail levels. PHI’s Competitive Energybusinesses compete with numerous non-utility generators, independent power producers, wholesale and retailenergy marketers, and traditional utilities. This competition generally has the effect of reducing margins andrequires a continual focus on controlling costs.
PHI’s Competitive Energy businesses rely on some transmission, storage, and distribution assets that theydo not own or control to deliver wholesale and retail electricity and natural gas and to obtain fuel for theirgeneration facilities.
PHI’s Competitive Energy businesses depend upon electric transmission facilities, natural gas pipelines, andgas storage facilities owned and operated by others. The operation of their generation facilities also depends uponcoal, natural gas or diesel fuel supplied by others. If electric transmission, natural gas pipelines, or gas storage aredisrupted or capacity is inadequate or unavailable, the Competitive Energy businesses’ ability to buy and receiveand/or sell and deliver wholesale and retail power and natural gas, and therefore to fulfill their contractualobligations, could be adversely affected. Similarly, if the fuel supply to one or more of their generation plants isdisrupted and storage or other alternative sources of supply are not available, the Competitive Energy businesses’ability to operate their generating facilities could be adversely affected.
Changes in technology may adversely affect PHI’s Power Delivery and Competitive Energy businesses.
Research and development activities are ongoing to improve alternative technologies to produce electricity,including fuel cells, micro turbines and photovoltaic (solar) cells. It is possible that advances in these or otheralternative technologies will reduce the costs of electricity production from these technologies, thereby makingthe generating facilities of PHI’s Competitive Energy businesses less competitive. In addition, increasedconservation efforts and advances in technology could reduce demand for electricity supply and distribution,
B-68

which could adversely affect PHI’s Power Delivery and Competitive Energy businesses. Changes in technologyalso could alter the channels through which retail electric customers buy electricity, which could adversely affectPHI’s Power Delivery business.
PHI’s risk management procedures may not prevent losses in the operation of its Competitive Energybusinesses.
The operations of PHI’s Competitive Energy businesses are conducted in accordance with sophisticated riskmanagement systems that are designed to quantify risk. However, actual results sometimes deviate from modeledexpectations. In particular, risks in PHI’s energy activities are measured and monitored utilizing value-at-riskmodels to determine the effects of potential one-day favorable or unfavorable price movements. These estimatesare based on historical price volatility and assume a normal distribution of price changes and a 95% probabilityof occurrence. Consequently, if prices significantly deviate from historical prices, PHI’s risk managementsystems, including assumptions supporting risk limits, may not protect PHI from significant losses. In addition,adverse changes in energy prices may result in economic losses in PHI’s earnings and cash flows and reductionsin the value of assets on its balance sheet under applicable accounting rules.
The commodity hedging procedures used by PHI’s Competitive Energy businesses may not protect themfrom significant losses caused by volatile commodity prices.
To lower the financial exposure related to commodity price fluctuations, PHI’s Competitive Energybusinesses routinely enter into contracts to hedge the value of their assets and operations. As part of this strategy,PHI’s Competitive Energy businesses utilize fixed-price, forward, physical purchase and sales contracts, tollingagreements, futures, financial swaps and option contracts traded in the over-the-counter markets or on exchanges.Each of these various hedge instruments can carry a unique set of risks in their application to PHI’s energyassets. PHI must apply judgment in determining the application and effectiveness of each hedge instrument.Changes in accounting rules, or revised interpretations to existing rules, may cause hedges to be deemedineffective. This could have material earnings implications for the period or periods in question. ConectivEnergy’s objective is to hedge a portion of the expected power output of its generation facilities and the costs offuel used to operate those facilities so it is not completely exposed to spot energy price movements. Hedgetargets are approved by PHI’s Corporate Risk Management Committee and may change from time to time basedon market conditions. Conectiv Energy generally establishes hedge targets annually for the next three succeeding12-month periods. Within a given 12 month horizon, the actual hedged positioning any month may be outside ofthe targeted range, even if the average for a 12 month period falls within the stated range. Management exercisesjudgment in determining which months present the most significant risk, or opportunity, and hedge levels areadjusted accordingly. Since energy markets can move significantly in a short period of time, hedge levels mayalso be adjusted to reflect revised assumptions. Such factors may include, but are not limited to, changes inprojected plant output, revisions to fuel requirements, transmission constraints, prices of alternate fuels, andimproving or deteriorating supply and demand conditions. In addition, short-term occurrences, such as abnormalweather, operational events, or intra-month commodity price volatility may also cause the actual level of hedgingcoverage to vary from the established hedge targets. These events can cause fluctuations in PHI’s earnings fromperiod to period. Due to the high heat rate of the Pepco Energy Services generation facilities, Pepco EnergyServices generally does not enter into wholesale contracts to lock in the forward value of its plants. To the extentthat PHI’s Competitive Energy businesses have unhedged positions or their hedging procedures do not work asplanned, fluctuating commodity prices could result in significant losses. Conversely, by engaging in hedgingactivities, PHI may not realize gains that otherwise could result from fluctuating commodity prices.
Acts of terrorism could adversely affect PHI’s businesses.
The threat of, or actual acts of, terrorism may affect the operations of PHI and its subsidiaries inunpredictable ways and may cause changes in the insurance markets, force PHI and its subsidiaries to increasesecurity measures and cause disruptions of fuel supplies and markets. If any of PHI’s infrastructure facilities,
B-69

such as its electric generation, fuel storage, transmission or distribution facilities, were to be a direct target, or anindirect casualty, of an act of terrorism, its operations could be adversely affected. Instability in the financialmarkets as a result of terrorism also could affect the ability of PHI and its subsidiaries to raise needed capital.
The insurance coverage of PHI and its subsidiaries may not be sufficient to cover all casualty losses thatthey might incur.
PHI and its subsidiaries currently have insurance coverage for their facilities and operations in amounts andwith deductibles that they consider appropriate. However, there is no assurance that such insurance coverage willbe available in the future on commercially reasonable terms. In addition, some risks, such as weather relatedcasualties, may not be insurable. In the case of loss or damage to property, plant or equipment, there is noassurance that the insurance proceeds, if any, received will be sufficient to cover the entire cost of replacement orrepair.
PHI and its subsidiaries may be adversely affected by economic conditions.
Periods of slowed economic activity generally result in decreased demand for power, particularly byindustrial and large commercial customers. As a consequence, recessions or other downturns in the economy mayresult in decreased revenues and cash flows for PHI’s Power Delivery and Competitive Energy businesses.
The IRS challenge to cross-border energy sale and lease-back transactions entered into by a PHI subsidiarycould result in loss of prior and future tax benefits.
PCI maintains a portfolio of cross-border energy sale-leaseback transactions, which as of December 31,2005, had a book value of approximately $1.3 billion and from which PHI currently derives approximately $55million per year in tax benefits in the form of interest and depreciation deductions. All of PCI’s cross-borderenergy leases are with tax indifferent parties and were entered into prior to 2004. On February 11, 2005, theTreasury Department and IRS issued a notice informing taxpayers that the IRS intends to challenge the taxbenefits claimed by taxpayers with respect to certain of these transactions. In addition, on June 29, 2005, the IRSpublished a Coordinated Issue Paper concerning the resolution of audit issues related to such transactions.
PCI’s leases have been under examination by the IRS as part of the normal PHI tax audit. On May 4, 2005,the IRS issued a Notice of Proposed Adjustment to PHI that challenges the tax benefits realized from interest anddepreciation deductions claimed by PHI with respect to these leases for the tax years 2001 and 2002. The taxbenefits claimed by PHI with respect to these leases from 2001 through December 31, 2005 were approximately$230 million. The ultimate outcome of this issue is uncertain; however, if the IRS prevails, PHI would be subjectto additional taxes, along with interest and possibly penalties on the additional taxes, which could have a materialadverse effect on PHI’s results of operations and cash flows.
In addition, a disallowance, rather than a deferral, of tax benefits to be realized by PHI from these leaseswill require PHI to adjust the book value of its leases and record a charge to earnings equal to the repricingimpact of the disallowed deductions. Such a change would likely have a material adverse effect on PHI’s resultsof operations for the period in which the charge is recorded.
See “Management’s Discussion and Analysis of Financial Condition and Results of Operations—Regulatoryand Other Matters” for additional information.
Pending tax legislation could result in a loss of future tax benefits from cross-border energy sale and lease-back transactions entered into by a PHI subsidiary.
On November 18, 2005, the U.S. Senate passed The Tax Relief Act of 2005 (S.2020) which would applypassive loss limitation rules to leases with foreign tax indifferent parties effective for taxable years beginning
B-70

after December 31, 2005, even if the leases were entered into on or prior to March 12, 2004. On December 8,2005, the U.S. House of Representatives passed the Tax Relief Extension Reconciliation Act of 2005 (H.R.4297), which does not contain any provision which would modify the current treatment of leases with taxindifferent parties. Enactment into law of a bill that is similar to S.2020 in its current form could result in amaterial delay of the income tax benefits that PCI would receive in connection with its cross-border energyleases and thereby adversely affect PHI’s cash flow. The U.S. House of Representatives and the U.S. Senate areexpected to hold a conference in the near future to reconcile the differences in the two bills to determine the finallegislation.
In July 2005, the FASB released a Proposed Staff Position paper that would amend SFAS No. 13 andrequire a lease to be repriced and the book value adjusted when there is a change or probable change in thetiming of tax benefits. Adoption of this Proposed Staff Position Paper and enactment of a bill that is similar toS.2020 could result in a material adverse effect on PHI’s results of operations and cash flows.
See “Regulatory and Other Matters” for additional information.
IRS Revenue Ruling 2005-53 on Mixed Service Costs could require PHI to incur additional tax and interestpayments in connection with the IRS audit of this issue for the tax years 2001 through 2004 (IRS RevenueRuling 2005-53).
During 2001, Pepco, DPL, and ACE changed their methods of accounting with respect to capitalizableconstruction costs for income tax purposes, which allow the companies to accelerate the deduction of certainexpenses that were previously capitalized and depreciated. Through December 31, 2005, these accelerateddeductions have generated incremental tax cash flow benefits of approximately $205 million (consisting of $94million for Pepco, $62 million for DPL, and $49 million for ACE) for the companies, primarily attributable totheir 2001 tax returns. On August 2, 2005, the IRS issued Revenue Ruling 2005-53 (the Revenue Ruling) thatwill limit the ability of the companies to utilize this method of accounting for income tax purposes on their taxreturns for 2004 and prior years. PHI intends to contest any IRS adjustment to its prior year income tax returnsbased on the Revenue Ruling. However, if the IRS is successful in applying this Revenue Ruling, Pepco, DPL,and ACE would be required to capitalize and depreciate a portion of the construction costs previously deductedand repay the associated income tax benefits, along with interest thereon. During 2005, PHI recorded a $10.9million increase in income tax expense, consisting of $6.0 million for Pepco, $2.9 million for DPL, and $2.0million for ACE, to account for the accrued interest that would be paid on the portion of tax benefits that PHIestimates would be deferred to future years if the construction costs previously deducted are required to becapitalized and depreciated.
On the same day as the Revenue Ruling was issued, the Treasury Department released regulations that, ifadopted in their current form, would require Pepco, DPL, and ACE to change their method of accounting withrespect to capitalizable construction costs for income tax purposes for all future tax periods beginning in 2005.Under these regulations, Pepco, DPL, and ACE will have to capitalize and depreciate a portion of theconstruction costs that they have previously deducted, and include the impact of this adjustment in taxableincome over a two year period beginning with tax year 2005. PHI is working with the industry to identify analternative method of accounting for capitalizable construction costs acceptable to the IRS to replace the methoddisallowed by the proposed regulations.
In February 2006, PHI paid approximately $121 million of taxes to cover the amount of taxes managementestimates will be payable once a new final method of tax accounting is adopted on its 2005 tax return, due to theproposed regulations. Although the increase in taxable income will be spread over the 2005 and 2006 tax returnperiods, the cash payments would have all occurred in 2006 with the filing of the 2005 tax return and the ongoing2006 estimated tax payments. This $121 million tax payment was accelerated to eliminate the need to accrueadditional Federal interest expense for the potential IRS adjustment related to the previous tax accountingmethod PHI used during the 2001-2004 tax years.
B-71

PHI believes that the $121 million tax payment is a reasonable estimate, based on current information, ofthe additional taxes that will be due once a new method of tax accounting is adopted. For the 2001 through 2004period currently under audit by the IRS, there is a risk that the IRS could successfully challenge the taxaccounting method utilized in 2001 through 2004, and assert additional taxes above the $121 million payment. Ifthe IRS were to be successful in this contention, PHI would be responsible for the additional taxes above the$121 million amount, as well as interest on the additional taxes.
PHI and its subsidiaries are dependent on their ability to successfully access capital markets. An inability toaccess capital may adversely affect their business.
PHI and its subsidiaries rely on access to both short-term money markets and longer-term capital markets asa source of liquidity and to satisfy their capital requirements not satisfied by the cash flow from their operations.Capital market disruptions, or a downgrade in credit ratings of PHI or its subsidiaries, could increase the cost ofborrowing or could adversely affect their ability to access one or more financial markets. In addition, a reductionin PHI’s credit ratings could require PHI or its subsidiaries to post additional collateral in connection with someof its wholesale marketing and financing activities. Disruptions to the capital markets could include, but are notlimited to:
• recession or an economic slowdown;
• the bankruptcy of one or more energy companies;
• significant increases in the prices for oil or other fuel;
• a terrorist attack or threatened attacks; or
• a significant transmission failure.
In accordance with the requirements of the Sarbanes-Oxley Act of 2002 and the SEC rules thereunder,PHI’s management is responsible for establishing and maintaining internal control over financial reporting and isrequired to assess annually the effectiveness of these controls. The inability to certify the effectiveness of thesecontrols due to the identification of one or more material weaknesses in these controls also could increase thefinancing costs of PHI and its subsidiaries or could adversely affect their ability to access one or more financialmarkets.
PHI’s future defined benefit plan funding obligations are affected by its assumptions regarding thevaluation of its benefit obligations and the performance of plan assets; actual experience which varies fromthe assumptions could result in an obligation of PHI to make significant unplanned cash contributions tothe plan.
PHI follows the guidance of SFAS No. 87, “Employers’ Accounting for Pensions,” in accounting forpension benefits under the Retirement Plan, a non-contributory defined benefit plan. In accordance with theseaccounting standards, PHI makes assumptions regarding the valuation of benefit obligations and the performanceof plan assets. Changes in assumptions, such as the use of a different discount rate or expected return on planassets, affect the calculation of projected benefit obligations, accumulated benefit obligation (ABO), reportedpension liability on PHI’s balance sheet, and reported annual net periodic pension benefit cost on PHI’sstatement of earnings.
Furthermore, if actual pension plan experience is different from that which is expected, the ABO could begreater than the fair value of pension plan assets. If this were to occur, PHI could be required to recognize anadditional minimum liability as prescribed by SFAS No. 87. The liability would be recorded as a reduction tocommon equity through a charge to Other Comprehensive Income (OCI), and would not affect net income for theyear. The charge to OCI would be restored through common equity in future periods when the fair value of planassets exceeded the accumulated benefit obligation. PHI’s funding policy is to make cash contributions to thepension plan sufficient for plan assets to exceed the ABO, and avoid the recognition of an additional minimumliability.
B-72

Use of alternative assumptions could also impact the expected future cash funding requirements for thepension plan if PHI’s defined benefit plan did not meet the minimum funding requirements of ERISA.
PHI’s cash flow, ability to pay dividends and ability to satisfy debt obligations depend on the performance ofits operating subsidiaries. PHI’s unsecured obligations are effectively subordinated to the liabilities and theoutstanding preferred stock of its subsidiaries.
PHI is a holding company that conducts its operations entirely through its subsidiaries, and all of PHI’sconsolidated operating assets are held by its subsidiaries. Accordingly, PHI’s cash flow, its ability to satisfy itsobligations to creditors and its ability to pay dividends on its common stock are dependent upon the earnings ofthe subsidiaries and the distribution of such earnings to PHI in the form of dividends. The subsidiaries areseparate and distinct legal entities and have no obligation to pay any amounts due on any debt or equity securitiesissued by PHI or to make any funds available for such payment. Because the claims of the creditors and preferredstockholders of PHI’s subsidiaries are superior to PHI’s entitlement to dividends, the unsecured debt andobligations of PHI are effectively subordinated to all existing and future liabilities of its subsidiaries and to therights of the holders of preferred stock to receive dividend payments.
Energy companies are subject to adverse publicity, which may render PHI and its subsidiaries vulnerable tonegative regulatory and litigation outcomes.
The energy sector has been among the sectors of the economy that have been the subject of highlypublicized allegations of misconduct in recent years. In addition, many utility companies have been publiclycriticized for their performance during recent natural disasters and weather related incidents. Adverse publicity ofthis nature may render legislatures, regulatory authorities, and other government officials less likely to viewenergy companies such as PHI and its subsidiaries in a favorable light, and may cause PHI and its subsidiaries tobe susceptible to adverse outcomes with respect to decisions by such bodies.
Provisions of the Delaware General Corporation Law and PHI’s organizational documents may discouragean acquisition of PHI.
The Delaware General Corporation Law and PHI’s organizational documents both contain provisions thatcould impede the removal of PHI’s directors and discourage a third party from making a proposal to acquire PHI.As a Delaware corporation, PHI is subject to the business combination law set forth in Section 203 of theDelaware General Corporation Law, which could have the effect of delaying, discouraging or preventing anacquisition of PHI. PHI has a staggered board of directors that is divided into three classes of equal size, with oneclass elected each year for a term of three years. At the 2005 Annual Meeting, the shareholders approved anamendment to PHI’s Certificate of Incorporation that will eliminate the staggered board over a two-year period.As a result, beginning with the 2007 Annual Meeting, all of the directors will be elected for one-year terms.
GENERAL INFORMATION ABOUT RISK MANAGEMENT
As of March 2003, Conectiv Energy ceased all proprietary trading activities, which generally consist of theentry into contracts to take a view of market direction, capture market price change, and put capital at risk. PHI’scompetitive energy segments are no longer engaged in proprietary trading; however, the market exposure undercertain contracts entered into prior to cessation of proprietary trading activities was not eliminated due to theilliquid market environment to execute such elimination. Some of these contracts remained in place throughDecember 2005.
The competitive energy segments actively engage in commodity risk management activities to reduce theirfinancial exposure to changes in the value of their assets and obligations due to commodity price fluctuations.Certain of these risk management activities are conducted using instruments classified as derivatives under SFAS133. In addition, the competitive energy segments also manage commodity risk with contracts that are notclassified as derivatives. The competitive energy segments’ primary risk management objectives are to managethe spread between the cost of fuel used to operate their electric generation plants and the revenue received from
B-73

the sale of the power produced by those plants and manage the spread between retail sales commitments and thecost of supply used to service those commitments in order to ensure stable and known minimum cash flows andfix favorable prices and margins when they become available. To a lesser extent, Conectiv Energy also engagesin market activities in an effort to profit from short-term geographical price differentials in electricity pricesamong markets. PHI collectively refers to these energy market activities, including its commodity riskmanagement activities, as “other energy commodity” activities and identifies this activity separately from that ofthe discontinued proprietary trading activity.
PHI’s risk management policies place oversight at the senior management level through the Corporate RiskManagement Committee which has the responsibility for establishing corporate compliance requirements for thecompetitive energy segments’ energy market participation. PHI uses a value-at-risk (VaR) model to assess themarket risk of its competitive energy segments’ other energy commodity activities and its remaining proprietarytrading contracts. PHI also uses other measures to limit and monitor risk in its commodity activities, includinglimits on the nominal size of positions and periodic loss limits. VaR represents the potential mark-to-market losson energy contracts or portfolios due to changes in market prices for a specified time period and confidencelevel. PHI estimates VaR using a delta-gamma variance / covariance model with a 95 percent, one-tailedconfidence level and assuming a one-day holding period. Since VaR is an estimate, it is not necessarily indicativeof actual results that may occur.
Value at Risk Associated with Energy ContractsFor the Year Ended December 31, 2005
(Millions of dollars)
ProprietaryTradingVaR (1)
VaR forCompetitive
EnergyActivity (2)
95% confidence level, one-day holding period, one-tailed(3)Period end . . . . . . . . . . . . . . . . . . . . . . . . . . . . . . . . . . . . . . . . . . . . . . . . . . . . . . . . . . $0 $17.0Average for the period . . . . . . . . . . . . . . . . . . . . . . . . . . . . . . . . . . . . . . . . . . . . . . . . $0 $ 9.7High . . . . . . . . . . . . . . . . . . . . . . . . . . . . . . . . . . . . . . . . . . . . . . . . . . . . . . . . . . . . . . $0 $23.1Low . . . . . . . . . . . . . . . . . . . . . . . . . . . . . . . . . . . . . . . . . . . . . . . . . . . . . . . . . . . . . . . $0 $ 2.9
Notes:(1) Includes all remaining proprietary trading contracts entered into prior to cessation of this activity prior to
March 2003.
(2) This column represents all energy derivative contracts, normal purchase and sales contracts, modeledgeneration output and fuel requirements and modeled customer load obligations for both the discontinuedproprietary trading activity and the ongoing other energy commodity activities.
(3) As VaR calculations are shown in a standard delta or delta/gamma closed form 95% 1-day holding period1-tail normal distribution form, traditional statistical and financial methods can be employed to reconcileprior Form 10-K and Form 10-Q VaRs to the above approach. In this case, 5-day VaRs divided by thesquare root of 5 equal 1-day VaRs; and 99% 1-tail VaRs divided by 2.326 times 1.645 equal 95% 1-tailVaRs. Note that these methods of conversion are not valid for converting from 5-day or less holding periodsto over 1-month holding periods and should not be applied to “non-standard closed form” VaR calculationsin any case.
For additional quantitative and qualitative information on the fair value of energy contracts see Note(13) “Use of Derivatives in Energy and Interest Rate Hedging Activities” to the consolidated financial statementsof Pepco Holdings.
The competitive energy segments’ portfolio of electric generating plants includes “mid-merit” assets andpeaking assets. Mid-merit electric generating plants are typically combined cycle units that can quickly change
B-74

their megawatt output level on an economic basis. These plants are generally operated during times whendemand for electricity rises and power prices are higher. The competitive energy segments dynamically(economically) hedge both the estimated plant output and fuel requirements as the estimated levels of output andfuel needs change. Dynamic (or economic) hedge percentages include the estimated electricity output of and fuelrequirements for the competitive energy segment’s generation plants that have been economically hedged andany associated financial or physical commodity contracts (including derivative contracts that are classified ascash flow hedges under SFAS 133, other derivative instruments, wholesale normal purchase and sales contracts,and load service obligations).
During the fourth quarter of 2005, Conectiv Energy revised its energy commodity hedging targets to reflectseveral factors, including improving market conditions that are predicted for the eastern portion of the PJMpower market. Conectiv Energy intends to maintain a forward 36 month program with targeted ranges forhedging energy and capacity margins as follows:
Month Target Range
1-12 . . . . . . . . . . . . . . . . . . . . . . . . . . . 50-100%13-24 . . . . . . . . . . . . . . . . . . . . . . . . . . 25-75%25-36 . . . . . . . . . . . . . . . . . . . . . . . . . . 0-50%
The primary purpose of the hedging program is to improve the predictability and stability of generationmargins by selling forward a portion of its projected plant output, and buying forward a portion of its projectedfuel supply requirements. Within each period, hedged values can vary significantly above or below the averagereported values.
As of December 31, 2005, Conectiv Energy was within the established target ranges for each of the forwardtwelve month periods. The projected amount of on peak output hedged on average was 91%, 66% and 18% forthe 1-12 month, 13-24 month and 25-36 month forward periods respectively. While Conectiv Energy attempts toplace hedges that are expected to generate energy margins at or near its forecasted gross margin levels, thevolumetric percentages vary significantly by month and often do not capture the peak pricing hours and therelated high margins that can be realized. As a result the percentage of on peak output hedged does not representthe amount of expected value hedged.
Not all of Conectiv Energy’s Merchant Generation gross margins can be hedged such as ancillary servicesand fuel switching. Also the hedging of locational value and capacity can be limited. These margins can bematerial to Conectiv Energy.
This table provides information on the competitive energy segment’s credit exposure, net of collateral, towholesale counterparties.
Schedule of Credit Risk Exposure on Competitive Wholesale Energy Contracts(Millions of dollars)
December 31, 2005
Rating (1)
ExposureBefore CreditCollateral (2)
CreditCollateral (3)
NetExposure
Number ofCounterpartiesGreater Than
10% *
Net Exposure ofCounterparties
Greater Than 10%
Investment Grade . . . . . . . . . . . . . . . . . . $440.8 $147.1 $293.7 1 $64.8Non-Investment Grade . . . . . . . . . . . . . . 7.1 1.0 6.1No External Ratings . . . . . . . . . . . . . . . . 29.2 15.6 13.6Credit reserves . . . . . . . . . . . . . . . . . . . . $ 2.4
(1) Investment Grade—primarily determined using publicly available credit ratings of the counterparty. If thecounterparty has provided a guarantee by a higher-rated entity (e.g., its parent), it is determined based uponthe rating of its guarantor. Included in “Investment Grade” are counterparties with a minimum Standard &Poor’s or Moody’s rating of BBB- or Baa3, respectively.
B-75

(2) Exposure before credit collateral—includes the MTM energy contract net assets for open/unrealizedtransactions, the net receivable/payable for realized transactions and net open positions for contracts notsubject to MTM. Amounts due from counterparties are offset by liabilities payable to those counterparties tothe extent that legally enforceable netting arrangements are in place. Thus, this column presents the netcredit exposure to counterparties after reflecting all allowable netting, but before considering collateral held.
(3) Credit collateral—the face amount of cash deposits, letters of credit and performance bonds received fromcounterparties, not adjusted for probability of default, and, if applicable, property interests (including oil andgas reserves).
* Using a percentage of the total exposure.
QUANTITATIVE AND QUALITATIVE DISCLOSURES
Market Risk
Market risk represents the potential loss arising from adverse changes in market rates and prices. Certain ofPepco Holdings financial instruments are exposed to market risk in the form of interest rate risk, equity pricerisk, commodity risk, and credit and nonperformance risk. Pepco Holdings management takes an active role inthe risk management process and has developed policies and procedures that require specific administrative andbusiness functions to assist in the identification, assessment and control of various risks. Management reviewsany open positions in accordance with strict policies in order to limit exposure to market risk.
Interest Rate Risk
Pepco Holdings and its subsidiaries floating rate debt is subject to the risk of fluctuating interest rates in thenormal course of business. Pepco Holdings manages interest rates through the use of fixed and, to a lesser extent,variable rate debt. The effect of a hypothetical 10% change in interest rates on the annual interest costs for short-term and variable rate debt was approximately $3.2 million as of December 31, 2005.
Commodity Price Risk
Pepco Holdings is at risk for a decrease in market liquidity to levels that affect its capability to execute itscommodity participation strategies. PHI believes the commodity markets to be sufficiently liquid to support itsmarket participation.
Credit and Nonperformance Risk
Certain of PHI’s subsidiaries’ agreements may be subject to credit losses and nonperformance by thecounterparties to the agreements. However, PHI anticipates that the counterparties will be able to fully satisfytheir obligations under the agreements. PHI’s subsidiaries attempt to minimize credit risk exposure to wholesaleenergy counterparties through, among other things, formal credit policies, regular assessment of counterpartycreditworthiness and the establishment of a credit limit for each counterparty, monitoring procedures that includestress testing, the use of standard agreements which allow for the netting of positive and negative exposuresassociated with a single counterparty and collateral requirements under certain circumstances, and hasestablished reserves for credit losses. As of December 31, 2005, credit exposure to wholesale energycounterparties was weighted 94% with investment grade counterparties, 4% with counterparties without externalcredit quality ratings, and 2% with non-investment grade counterparties.
FORWARD-LOOKING STATEMENTS
Some of the statements contained in this Annual Report are forward-looking statements within the meaningof Section 21E of the Securities Exchange Act and are subject to the safe harbor created by the Private SecuritiesLitigation Reform Act of 1995. These statements include declarations regarding Pepco Holdings’ intents, beliefs
B-76

and current expectations. In some cases, you can identify forward-looking statements by terminology such as“may,” “will,” “should,” “expects,” “plans,” “anticipates,” “believes,” “estimates,” “predicts,” “potential” or“continue” or the negative of such terms or other comparable terminology. Any forward-looking statements arenot guarantees of future performance, and actual results could differ materially from those indicated by theforward-looking statements. Forward-looking statements involve estimates, assumptions, known and unknownrisks, uncertainties and other factors that may cause PHI’s actual results, levels of activity, performance orachievements to be materially different from any future results, levels of activity, performance or achievementsexpressed or implied by such forward-looking statements.
The forward-looking statements contained herein are qualified in their entirety by reference to the followingimportant factors, which are difficult to predict, contain uncertainties, are beyond Pepco Holdings’ control andmay cause actual results to differ materially from those contained in forward-looking statements:
• Prevailing governmental policies and regulatory actions affecting the energy industry, including withrespect to allowed rates of return, industry and rate structure, acquisition and disposal of assets andfacilities, operation and construction of plant facilities, recovery of purchased power expenses, andpresent or prospective wholesale and retail competition;
• Changes in and compliance with environmental and safety laws and policies;
• Weather conditions;
• Population growth rates and demographic patterns;
• Competition for retail and wholesale customers;
• General economic conditions, including potential negative impacts resulting from an economicdownturn;
• Growth in demand, sales and capacity to fulfill demand;
• Changes in tax rates or policies or in rates of inflation;
• Potential changes in accounting standards or practices;
• Changes in project costs;
• Unanticipated changes in operating expenses and capital expenditures;
• The ability to obtain funding in the capital markets on favorable terms;
• Restrictions imposed by Federal and/or state regulatory commissions;
• Legal and administrative proceedings (whether civil or criminal) and settlements that influence PHI’sbusiness and profitability;
• Pace of entry into new markets;
• Volatility in market demand and prices for energy, capacity and fuel;
• Interest rate fluctuations and credit market concerns; and
• Effects of geopolitical events, including the threat of domestic terrorism.
Any forward-looking statements speak only as to the date of this Annual Report and Pepco Holdingsundertakes no obligation to update any forward-looking statements to reflect events or circumstances after thedate on which such statements are made or to reflect the occurrence of unanticipated events. New factors emergefrom time to time, and it is not possible for Pepco Holdings to predict all of such factors, nor can Pepco Holdingsassess the impact of any such factor on its business or the extent to which any factor, or combination of factors,may cause results to differ materially from those contained in any forward-looking statement.
The foregoing review of factors should not be construed as exhaustive.
B-77

Management’s Report on Internal Control Over Financial Reporting
The management of Pepco Holdings is responsible for establishing and maintaining adequate internalcontrol over financial reporting. Because of inherent limitations, internal control over financial reporting may notprevent or detect misstatements. Also, projections of any evaluation of effectiveness to future periods are subjectto the risk that controls may become inadequate because of changes in conditions, or that the degree ofcompliance with the policies or procedures may deteriorate.
Management assessed its internal control over financial reporting as of December 31, 2005 based on theframework in Internal Control—Integrated Framework issued by the Committee of Sponsoring Organizations ofthe Treadway Commission. Based on its assessment, the management of Pepco Holdings concluded that itsinternal control over financial reporting was effective as of December 31, 2005.
Management’s assessment of the effectiveness of its internal controls over financial reporting as ofDecember 31, 2005 has been audited by PricewaterhouseCoopers LLP, an independent registered publicaccounting firm, as stated in its report which is included herein.
Report of Independent Registered Public Accounting Firm
To the Shareholders and Board of Directors ofPepco Holdings, Inc.:
We have completed integrated audits of Pepco Holdings, Inc.’s 2005 and 2004 consolidated financial statementsand of its internal control over financial reporting as of December 31, 2005, and an audit of its 2003 consolidatedfinancial statements in accordance with the standards of the Public Company Accounting Oversight Board(United States). Our opinions, based on our audits, are presented below.
Consolidated financial statements
In our opinion, the accompanying consolidated balance sheets and the related consolidated statements ofearnings, comprehensive earnings, shareholders’ equity and cash flows present fairly, in all material respects, thefinancial position of Pepco Holdings, Inc. and its subsidiaries at December 31, 2005 and 2004, and the results oftheir operations and their cash flows for each of the three years in the period ended December 31, 2005 inconformity with accounting principles generally accepted in the United States of America. These financialstatements are the responsibility of the Company’s management. Our responsibility is to express an opinion onthese financial statements based on our audits. We conducted our audits of these statements in accordance withthe standards of the Public Company Accounting Oversight Board (United States). Those standards require thatwe plan and perform the audit to obtain reasonable assurance about whether the financial statements are free ofmaterial misstatement. An audit of financial statements includes examining, on a test basis, evidence supportingthe amounts and disclosures in the financial statements, assessing the accounting principles used and significantestimates made by management, and evaluating the overall financial statement presentation. We believe that ouraudits provide a reasonable basis for our opinion.
As disclosed in Note 15 to the consolidated financial statements, the Company restated its financial statements asof December 31, 2004 and for the years ended December 31, 2004 and 2003.
Internal control over financial reporting
Also, in our opinion, management’s assessment, included in the accompanying Management’s Report on InternalControl Over Financial Reporting, that the Company maintained effective internal control over financial
B-78

reporting as of December 31, 2005 based on criteria established in Internal Control—Integrated Frameworkissued by the Committee of Sponsoring Organizations of the Treadway Commission (COSO), is fairly stated, inall material respects, based on those criteria. Furthermore, in our opinion, the Company maintained, in allmaterial respects, effective internal control over financial reporting as of December 31, 2005, based on criteriaestablished in Internal Control—Integrated Framework issued by the COSO. The Company’s management isresponsible for maintaining effective internal control over financial reporting and for its assessment of theeffectiveness of internal control over financial reporting. Our responsibility is to express opinions onmanagement’s assessment and on the effectiveness of the Company’s internal control over financial reportingbased on our audit. We conducted our audit of internal control over financial reporting in accordance with thestandards of the Public Company Accounting Oversight Board (United States). Those standards require that weplan and perform the audit to obtain reasonable assurance about whether effective internal control over financialreporting was maintained in all material respects. An audit of internal control over financial reporting includesobtaining an understanding of internal control over financial reporting, evaluating management’s assessment,testing and evaluating the design and operating effectiveness of internal control, and performing such otherprocedures as we consider necessary in the circumstances. We believe that our audit provides a reasonable basisfor our opinions.
A company’s internal control over financial reporting is a process designed to provide reasonable assuranceregarding the reliability of financial reporting and the preparation of financial statements for external purposes inaccordance with generally accepted accounting principles. A company’s internal control over financial reportingincludes those policies and procedures that (i) pertain to the maintenance of records that, in reasonable detail,accurately and fairly reflect the transactions and dispositions of the assets of the company; (ii) provide reasonableassurance that transactions are recorded as necessary to permit preparation of financial statements in accordancewith generally accepted accounting principles, and that receipts and expenditures of the company are being madeonly in accordance with authorizations of management and directors of the company; and (iii) provide reasonableassurance regarding prevention or timely detection of unauthorized acquisition, use, or disposition of thecompany’s assets that could have a material effect on the financial statements.
Because of its inherent limitations, internal control over financial reporting may not prevent or detectmisstatements. Also, projections of any evaluation of effectiveness to future periods are subject to the risk thatcontrols may become inadequate because of changes in conditions, or that the degree of compliance with thepolicies or procedures may deteriorate.
Washington, DCMarch 13, 2006
B-79

PEPCO HOLDINGS, INC. AND SUBSIDIARIESCONSOLIDATED STATEMENTS OF EARNINGS
For the Year Ended December 31, 2005(Restated)
2004(Restated)
2003
(In millions, except per share data)
Operating RevenuePower Delivery . . . . . . . . . . . . . . . . . . . . . . . . . . . . . . . . . . . . . . . . . . . . . . . $4,702.9 $4,377.7 $4,015.7Competitive Energy . . . . . . . . . . . . . . . . . . . . . . . . . . . . . . . . . . . . . . . . . . . 3,288.2 2,755.5 3,135.8Other . . . . . . . . . . . . . . . . . . . . . . . . . . . . . . . . . . . . . . . . . . . . . . . . . . . . . . . 74.4 89.9 117.2
Total Operating Revenue . . . . . . . . . . . . . . . . . . . . . . . . . . . . . . . . . . . 8,065.5 7,223.1 7,268.7
Operating ExpensesFuel and purchased energy . . . . . . . . . . . . . . . . . . . . . . . . . . . . . . . . . . . . . . 4,904.4 4,258.3 4,626.2Other services cost of sales . . . . . . . . . . . . . . . . . . . . . . . . . . . . . . . . . . . . . . 712.3 637.9 577.6Other operation and maintenance . . . . . . . . . . . . . . . . . . . . . . . . . . . . . . . . . 815.7 796.6 771.4Depreciation and amortization . . . . . . . . . . . . . . . . . . . . . . . . . . . . . . . . . . . 422.6 440.5 422.1Other taxes . . . . . . . . . . . . . . . . . . . . . . . . . . . . . . . . . . . . . . . . . . . . . . . . . . . 342.2 311.4 272.2Deferred electric service costs . . . . . . . . . . . . . . . . . . . . . . . . . . . . . . . . . . . 120.2 36.3 (7.0)Impairment losses . . . . . . . . . . . . . . . . . . . . . . . . . . . . . . . . . . . . . . . . . . . . . — — 64.3Gain on sales of assets . . . . . . . . . . . . . . . . . . . . . . . . . . . . . . . . . . . . . . . . . . (86.8) (30.0) (68.8)Gain on settlement of claims with Mirant . . . . . . . . . . . . . . . . . . . . . . . . . . . (70.5) — —
Total Operating Expenses . . . . . . . . . . . . . . . . . . . . . . . . . . . . . . . . . . . 7,160.1 6,451.0 6,658.0
Operating Income . . . . . . . . . . . . . . . . . . . . . . . . . . . . . . . . . . . . . . . . . . . . . . . . 905.4 772.1 610.7
Other Income (Expenses)Interest and dividend income . . . . . . . . . . . . . . . . . . . . . . . . . . . . . . . . . . . . 16.0 8.7 17.3Interest expense . . . . . . . . . . . . . . . . . . . . . . . . . . . . . . . . . . . . . . . . . . . . . . . (337.6) (373.3) (372.8)(Loss) Income from equity investments . . . . . . . . . . . . . . . . . . . . . . . . . . . . (2.2) 14.4 (.9)Impairment loss on equity investments . . . . . . . . . . . . . . . . . . . . . . . . . . . . . (4.1) (11.2) (102.6)Other income . . . . . . . . . . . . . . . . . . . . . . . . . . . . . . . . . . . . . . . . . . . . . . . . . 50.8 29.3 41.9Other expenses . . . . . . . . . . . . . . . . . . . . . . . . . . . . . . . . . . . . . . . . . . . . . . . (8.4) (9.3) (16.2)
Total Other Expenses . . . . . . . . . . . . . . . . . . . . . . . . . . . . . . . . . . . . . . (285.5) (341.4) (433.3)
Preferred Stock Dividend Requirements of Subsidiaries . . . . . . . . . . . . . . . . 2.5 2.8 13.9
Income Before Income Tax Expense and Extraordinary Item . . . . . . . . . . . . 617.4 427.9 163.5
Income Tax Expense . . . . . . . . . . . . . . . . . . . . . . . . . . . . . . . . . . . . . . . . . . . . . . 255.2 167.3 62.1
Income Before Extraordinary Item . . . . . . . . . . . . . . . . . . . . . . . . . . . . . . . . . . 362.2 260.6 101.4
Extraordinary Item (net of income taxes of $6.2 million and $4.1 millionfor the years ended December 31, 2005 and 2003, respectively) . . . . . . . . . 9.0 — 5.9
Net Income . . . . . . . . . . . . . . . . . . . . . . . . . . . . . . . . . . . . . . . . . . . . . . . . . . . . . . $ 371.2 $ 260.6 $ 107.3
Earnings Per Share of Common StockBasic Before Extraordinary Item . . . . . . . . . . . . . . . . . . . . . . . . . . . . . . . . . $ 1.91 $ 1.48 $ .60Basic—Extraordinary Item . . . . . . . . . . . . . . . . . . . . . . . . . . . . . . . . . . . . . . $ .05 $ — $ .03Basic Earnings Per Share of Common Stock . . . . . . . . . . . . . . . . . . . . . . . . $ 1.96 $ 1.48 $ .63Diluted Before Extraordinary Item . . . . . . . . . . . . . . . . . . . . . . . . . . . . . . . . $ 1.91 $ 1.48 $ .60Diluted—Extraordinary Item . . . . . . . . . . . . . . . . . . . . . . . . . . . . . . . . . . . . $ .05 $ — $ .03Diluted Earnings Per Share of Common Stock . . . . . . . . . . . . . . . . . . . . . . . $ 1.96 $ 1.48 $ .63
The accompanying Notes are an integral part of these Consolidated Financial Statements.
B-80

PEPCO HOLDINGS, INC. AND SUBSIDIARIESCONSOLIDATED STATEMENTS OF COMPREHENSIVE EARNINGS
For the Year Ended December 31, 2005(Restated)
2004(Restated)
2003
(Millions of dollars)
Net income . . . . . . . . . . . . . . . . . . . . . . . . . . . . . . . . . . . . . . . . . . . . . . . . . . . . . . . . $371.2 $260.6 $107.3
Other comprehensive earnings (losses)
Unrealized gains (losses) on commodity derivatives designated as cashflow hedges:Unrealized holding gains (losses) arising during period . . . . . . . . . . . . . . . 117.1 (20.9) 45.0Less: reclassification adjustment for gains included in net earnings . . . . . . 76.1 33.4 18.9
Net unrealized gains (losses) on commodity derivatives . . . . . . . . . . . . . . . 41.0 (54.3) 26.1
Realized gains on Treasury lock transaction . . . . . . . . . . . . . . . . . . . . . . . . 11.7 11.7 11.7
Unrealized gains (losses) on interest rate swap agreements designated ascash flow hedges:Unrealized holding gains (losses) arising during period . . . . . . . . . . . . . . . 1.5 (4.5) 3.4Less: reclassification adjustment for gains (losses) included in net
earnings . . . . . . . . . . . . . . . . . . . . . . . . . . . . . . . . . . . . . . . . . . . . . . . . . . 1.1 (9.6) (5.6)
Net unrealized gains on interest rate swaps . . . . . . . . . . . . . . . . . . . . . . . . . .4 5.1 9.0
Unrealized (losses) gains on marketable securities:Unrealized holding (losses) gains arising during period . . . . . . . . . . . . . . . — (3.6) 6.1Less: reclassification adjustment for gains included in net earnings . . . . . . — .8 .3
Net unrealized (losses) gains on marketable securities . . . . . . . . . . . . . . . . — (4.4) 5.8
Minimum pension liability adjustment . . . . . . . . . . . . . . . . . . . . . . . . . . . . (5.2) (6.9) —
Other comprehensive earnings (losses), before income taxes . . . . . . . . . . . 47.9 (48.8) 52.6Income tax expense (benefit) . . . . . . . . . . . . . . . . . . . . . . . . . . . . . . . . . . . . 18.7 (19.5) 22.4
Other comprehensive earnings (losses), net of income taxes . . . . . . . . . . . . . . . 29.2 (29.3) 30.2
Comprehensive earnings . . . . . . . . . . . . . . . . . . . . . . . . . . . . . . . . . . . . . . . . . . . . $400.4 $231.3 $137.5
The accompanying Notes are an integral part of these Consolidated Financial Statements.
B-81

PEPCO HOLDINGS, INC. AND SUBSIDIARIESCONSOLIDATED BALANCE SHEETS
ASSETSDecember 31,
2005
(Restated)December 31,
2004
(Millions of dollars)
CURRENT ASSETSCash and cash equivalents . . . . . . . . . . . . . . . . . . . . . . . . . . . . . . . . . . . . . . . . . . . $ 121.5 $ 29.5Restricted cash . . . . . . . . . . . . . . . . . . . . . . . . . . . . . . . . . . . . . . . . . . . . . . . . . . . . 23.0 42.0Accounts receivable, less allowance for uncollectible accounts of $40.6 million
and $43.7 million, respectively . . . . . . . . . . . . . . . . . . . . . . . . . . . . . . . . . . . . . 1,363.1 1,122.8Fuel, materials and supplies—at average cost . . . . . . . . . . . . . . . . . . . . . . . . . . . . 340.1 268.4Unrealized derivative receivables . . . . . . . . . . . . . . . . . . . . . . . . . . . . . . . . . . . . . 185.7 90.3Prepaid expenses and other . . . . . . . . . . . . . . . . . . . . . . . . . . . . . . . . . . . . . . . . . . 118.3 119.5
Total Current Assets . . . . . . . . . . . . . . . . . . . . . . . . . . . . . . . . . . . . . . . . . . . 2,151.7 1,672.5
INVESTMENTS AND OTHER ASSETSGoodwill . . . . . . . . . . . . . . . . . . . . . . . . . . . . . . . . . . . . . . . . . . . . . . . . . . . . . . . . 1,431.3 1,430.5Regulatory assets . . . . . . . . . . . . . . . . . . . . . . . . . . . . . . . . . . . . . . . . . . . . . . . . . . 1,202.0 1,335.0Investment in finance leases held in Trust . . . . . . . . . . . . . . . . . . . . . . . . . . . . . . . 1,297.9 1,218.7Prepaid pension expense . . . . . . . . . . . . . . . . . . . . . . . . . . . . . . . . . . . . . . . . . . . . 208.9 165.7Other . . . . . . . . . . . . . . . . . . . . . . . . . . . . . . . . . . . . . . . . . . . . . . . . . . . . . . . . . . . 414.0 437.8
Total Investments and Other Assets . . . . . . . . . . . . . . . . . . . . . . . . . . . . . . . 4,554.1 4,587.7
PROPERTY, PLANT AND EQUIPMENTProperty, plant and equipment . . . . . . . . . . . . . . . . . . . . . . . . . . . . . . . . . . . . . . . . 11,384.2 11,047.8Accumulated depreciation . . . . . . . . . . . . . . . . . . . . . . . . . . . . . . . . . . . . . . . . . . . (4,072.2) (3,957.2)
Net Property, Plant and Equipment . . . . . . . . . . . . . . . . . . . . . . . . . . . . . . . . . . . . 7,312.0 7,090.6
TOTAL ASSETS . . . . . . . . . . . . . . . . . . . . . . . . . . . . . . . . . . . . . . . . . . . . . $14,017.8 $13,350.8
The accompanying Notes are an integral part of these Consolidated Financial Statements.
B-82
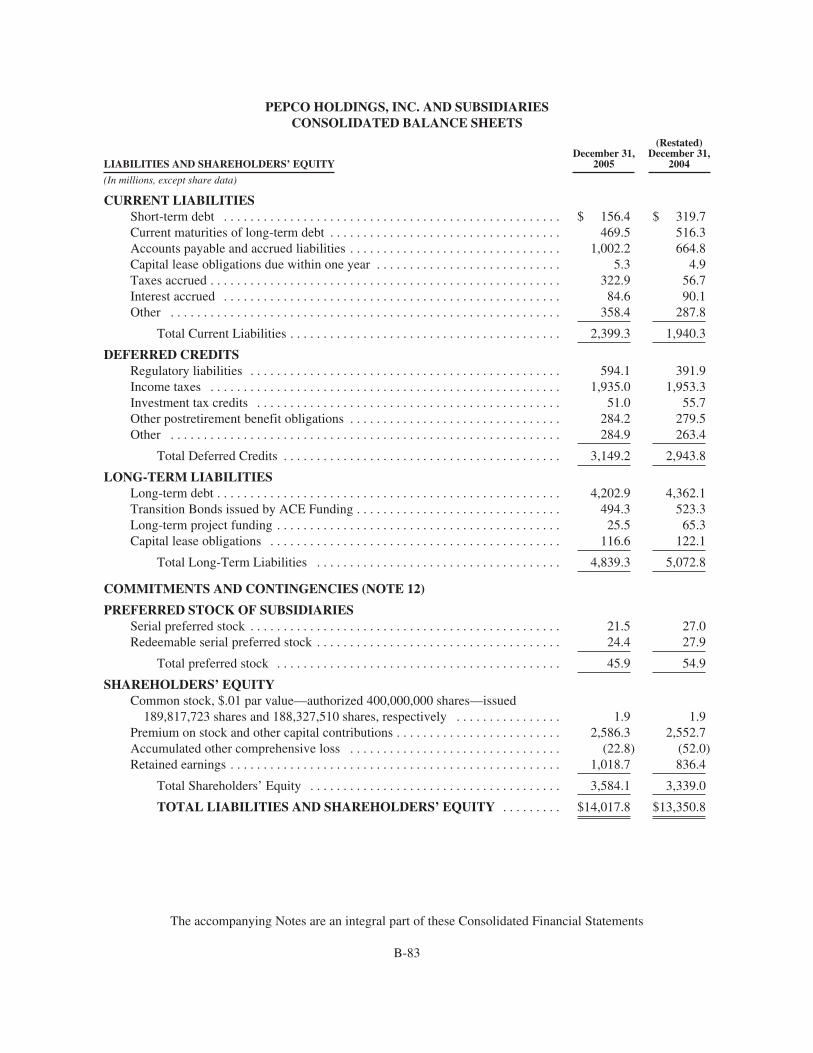
PEPCO HOLDINGS, INC. AND SUBSIDIARIESCONSOLIDATED BALANCE SHEETS
LIABILITIES AND SHAREHOLDERS’ EQUITYDecember 31,
2005
(Restated)December 31,
2004
(In millions, except share data)
CURRENT LIABILITIESShort-term debt . . . . . . . . . . . . . . . . . . . . . . . . . . . . . . . . . . . . . . . . . . . . . . . . . . . $ 156.4 $ 319.7Current maturities of long-term debt . . . . . . . . . . . . . . . . . . . . . . . . . . . . . . . . . . . 469.5 516.3Accounts payable and accrued liabilities . . . . . . . . . . . . . . . . . . . . . . . . . . . . . . . . 1,002.2 664.8Capital lease obligations due within one year . . . . . . . . . . . . . . . . . . . . . . . . . . . . 5.3 4.9Taxes accrued . . . . . . . . . . . . . . . . . . . . . . . . . . . . . . . . . . . . . . . . . . . . . . . . . . . . . 322.9 56.7Interest accrued . . . . . . . . . . . . . . . . . . . . . . . . . . . . . . . . . . . . . . . . . . . . . . . . . . . 84.6 90.1Other . . . . . . . . . . . . . . . . . . . . . . . . . . . . . . . . . . . . . . . . . . . . . . . . . . . . . . . . . . . 358.4 287.8
Total Current Liabilities . . . . . . . . . . . . . . . . . . . . . . . . . . . . . . . . . . . . . . . . . 2,399.3 1,940.3
DEFERRED CREDITSRegulatory liabilities . . . . . . . . . . . . . . . . . . . . . . . . . . . . . . . . . . . . . . . . . . . . . . . 594.1 391.9Income taxes . . . . . . . . . . . . . . . . . . . . . . . . . . . . . . . . . . . . . . . . . . . . . . . . . . . . . 1,935.0 1,953.3Investment tax credits . . . . . . . . . . . . . . . . . . . . . . . . . . . . . . . . . . . . . . . . . . . . . . 51.0 55.7Other postretirement benefit obligations . . . . . . . . . . . . . . . . . . . . . . . . . . . . . . . . 284.2 279.5Other . . . . . . . . . . . . . . . . . . . . . . . . . . . . . . . . . . . . . . . . . . . . . . . . . . . . . . . . . . . 284.9 263.4
Total Deferred Credits . . . . . . . . . . . . . . . . . . . . . . . . . . . . . . . . . . . . . . . . . . 3,149.2 2,943.8
LONG-TERM LIABILITIESLong-term debt . . . . . . . . . . . . . . . . . . . . . . . . . . . . . . . . . . . . . . . . . . . . . . . . . . . . 4,202.9 4,362.1Transition Bonds issued by ACE Funding . . . . . . . . . . . . . . . . . . . . . . . . . . . . . . . 494.3 523.3Long-term project funding . . . . . . . . . . . . . . . . . . . . . . . . . . . . . . . . . . . . . . . . . . . 25.5 65.3Capital lease obligations . . . . . . . . . . . . . . . . . . . . . . . . . . . . . . . . . . . . . . . . . . . . 116.6 122.1
Total Long-Term Liabilities . . . . . . . . . . . . . . . . . . . . . . . . . . . . . . . . . . . . . 4,839.3 5,072.8
COMMITMENTS AND CONTINGENCIES (NOTE 12)
PREFERRED STOCK OF SUBSIDIARIESSerial preferred stock . . . . . . . . . . . . . . . . . . . . . . . . . . . . . . . . . . . . . . . . . . . . . . . 21.5 27.0Redeemable serial preferred stock . . . . . . . . . . . . . . . . . . . . . . . . . . . . . . . . . . . . . 24.4 27.9
Total preferred stock . . . . . . . . . . . . . . . . . . . . . . . . . . . . . . . . . . . . . . . . . . . 45.9 54.9
SHAREHOLDERS’ EQUITYCommon stock, $.01 par value—authorized 400,000,000 shares—issued
189,817,723 shares and 188,327,510 shares, respectively . . . . . . . . . . . . . . . . 1.9 1.9Premium on stock and other capital contributions . . . . . . . . . . . . . . . . . . . . . . . . . 2,586.3 2,552.7Accumulated other comprehensive loss . . . . . . . . . . . . . . . . . . . . . . . . . . . . . . . . (22.8) (52.0)Retained earnings . . . . . . . . . . . . . . . . . . . . . . . . . . . . . . . . . . . . . . . . . . . . . . . . . . 1,018.7 836.4
Total Shareholders’ Equity . . . . . . . . . . . . . . . . . . . . . . . . . . . . . . . . . . . . . . 3,584.1 3,339.0
TOTAL LIABILITIES AND SHAREHOLDERS’ EQUITY . . . . . . . . . $14,017.8 $13,350.8
The accompanying Notes are an integral part of these Consolidated Financial Statements
B-83

PEPCO HOLDINGS, INC. AND SUBSIDIARIESCONSOLIDATED STATEMENTS OF CASH FLOWS
For the Year Ended December 31, 2005(Restated)
2004(Restated)
2003
(Millions of dollars)OPERATING ACTIVITIESNet income . . . . . . . . . . . . . . . . . . . . . . . . . . . . . . . . . . . . . . . . . . . . . . . . . . . . . . . . . . . . . . . . . . . . . . . . . $ 371.2 $ 260.6 $ 107.3Adjustments to reconcile net income to net cash provided by (used in) operating activities:
Depreciation and amortization . . . . . . . . . . . . . . . . . . . . . . . . . . . . . . . . . . . . . . . . . . . . . . . . . . . . . . 422.6 440.5 422.1Gain on sale of assets . . . . . . . . . . . . . . . . . . . . . . . . . . . . . . . . . . . . . . . . . . . . . . . . . . . . . . . . . . . . . (86.8) (30.0) (68.8)Gain on settlement of claims with Mirant . . . . . . . . . . . . . . . . . . . . . . . . . . . . . . . . . . . . . . . . . . . . . (70.5) — —Proceeds from sale of claims with Mirant . . . . . . . . . . . . . . . . . . . . . . . . . . . . . . . . . . . . . . . . . . . . . 112.9 — —Gain on sale of other investment . . . . . . . . . . . . . . . . . . . . . . . . . . . . . . . . . . . . . . . . . . . . . . . . . . . . (8.0) — —Extraordinary item . . . . . . . . . . . . . . . . . . . . . . . . . . . . . . . . . . . . . . . . . . . . . . . . . . . . . . . . . . . . . . . (15.2) — (10.0)Rents received from leveraged leases under income earned . . . . . . . . . . . . . . . . . . . . . . . . . . . . . . . (79.3) (76.4) (72.4)Impairment losses . . . . . . . . . . . . . . . . . . . . . . . . . . . . . . . . . . . . . . . . . . . . . . . . . . . . . . . . . . . . . . . . 4.1 11.2 166.9Deferred income taxes . . . . . . . . . . . . . . . . . . . . . . . . . . . . . . . . . . . . . . . . . . . . . . . . . . . . . . . . . . . . (51.6) 217.5 197.0Investment tax credit adjustments . . . . . . . . . . . . . . . . . . . . . . . . . . . . . . . . . . . . . . . . . . . . . . . . . . . (5.1) (8.0) (5.3)Prepaid pension expense . . . . . . . . . . . . . . . . . . . . . . . . . . . . . . . . . . . . . . . . . . . . . . . . . . . . . . . . . . . (43.2) .9 (17.3)Energy supply contracts . . . . . . . . . . . . . . . . . . . . . . . . . . . . . . . . . . . . . . . . . . . . . . . . . . . . . . . . . . . (11.3) (12.3) (21.6)Other deferred charges . . . . . . . . . . . . . . . . . . . . . . . . . . . . . . . . . . . . . . . . . . . . . . . . . . . . . . . . . . . . 17.0 3.9 59.1Other deferred credits . . . . . . . . . . . . . . . . . . . . . . . . . . . . . . . . . . . . . . . . . . . . . . . . . . . . . . . . . . . . . (29.1) (25.4) (5.9)Changes in:
Accounts receivable . . . . . . . . . . . . . . . . . . . . . . . . . . . . . . . . . . . . . . . . . . . . . . . . . . . . . . . . . . (153.7) (171.0) 49.0Regulatory assets and liabilities . . . . . . . . . . . . . . . . . . . . . . . . . . . . . . . . . . . . . . . . . . . . . . . . . 76.1 (11.3) (75.1)Prepaid expenses . . . . . . . . . . . . . . . . . . . . . . . . . . . . . . . . . . . . . . . . . . . . . . . . . . . . . . . . . . . . . 10.3 22.0 (23.1)Materials and supplies . . . . . . . . . . . . . . . . . . . . . . . . . . . . . . . . . . . . . . . . . . . . . . . . . . . . . . . . (71.7) 9.2 (18.0)Accounts payable and accrued liabilities . . . . . . . . . . . . . . . . . . . . . . . . . . . . . . . . . . . . . . . . . . 327.5 120.4 (59.1)Interest and taxes accrued . . . . . . . . . . . . . . . . . . . . . . . . . . . . . . . . . . . . . . . . . . . . . . . . . . . . . . 270.7 (36.1) 37.6
Net Cash Provided By Operating Activities . . . . . . . . . . . . . . . . . . . . . . . . . . . . . . . . . . . . . . . . . . . . . . . . 986.9 715.7 662.4
INVESTING ACTIVITIESInvestment in property, plant and equipment . . . . . . . . . . . . . . . . . . . . . . . . . . . . . . . . . . . . . . . . . . . . . . . (467.1) (517.4) (598.2)Proceeds from/changes in:
Sale of office building and other properties . . . . . . . . . . . . . . . . . . . . . . . . . . . . . . . . . . . . . . . . . . . . 84.1 46.4 147.7Sale of Starpower investment . . . . . . . . . . . . . . . . . . . . . . . . . . . . . . . . . . . . . . . . . . . . . . . . . . . . . . . — 29.0 —Proceeds from combustion turbine contract cancellation . . . . . . . . . . . . . . . . . . . . . . . . . . . . . . . . . . — — 52.0Proceeds from sale of marketable securities . . . . . . . . . . . . . . . . . . . . . . . . . . . . . . . . . . . . . . . . . . . . — 117.6 715.2Purchase of marketable securities . . . . . . . . . . . . . . . . . . . . . . . . . . . . . . . . . . . . . . . . . . . . . . . . . . . . — (98.2) (558.6)Purchases of other investments . . . . . . . . . . . . . . . . . . . . . . . . . . . . . . . . . . . . . . . . . . . . . . . . . . . . . . (2.1) (.3) (11.0)Proceeds from sale of other investments . . . . . . . . . . . . . . . . . . . . . . . . . . . . . . . . . . . . . . . . . . . . . . 33.8 15.1 11.5Net investment in receivables . . . . . . . . . . . . . . . . . . . . . . . . . . . . . . . . . . . . . . . . . . . . . . . . . . . . . . . (7.1) 2.9 (43.2)Changes in restricted cash . . . . . . . . . . . . . . . . . . . . . . . . . . . . . . . . . . . . . . . . . . . . . . . . . . . . . . . . . 19.0 (17.8) 31.0Net other investing activities . . . . . . . . . . . . . . . . . . . . . . . . . . . . . . . . . . . . . . . . . . . . . . . . . . . . . . . 5.5 5.4 .9
Net Cash Used In Investing Activities . . . . . . . . . . . . . . . . . . . . . . . . . . . . . . . . . . . . . . . . . . . . . . . . . . . . (333.9) (417.3) (252.7)
FINANCING ACTIVITIESDividends paid on preferred stock of subsidiaries . . . . . . . . . . . . . . . . . . . . . . . . . . . . . . . . . . . . . . . . . . . (2.5) (2.8) (4.6)Dividends paid on common stock . . . . . . . . . . . . . . . . . . . . . . . . . . . . . . . . . . . . . . . . . . . . . . . . . . . . . . . (188.9) (176.0) (170.7)Common stock issued to the Dividend Reinvestment Plan . . . . . . . . . . . . . . . . . . . . . . . . . . . . . . . . . . . . 27.5 29.2 31.2Redemption of debentures issued to financing trust . . . . . . . . . . . . . . . . . . . . . . . . . . . . . . . . . . . . . . . . . . — (95.0) —Redemption of Trust Preferred Stock of subsidiaries . . . . . . . . . . . . . . . . . . . . . . . . . . . . . . . . . . . . . . . . . — — (195.0)Redemption of preferred stock of subsidiaries . . . . . . . . . . . . . . . . . . . . . . . . . . . . . . . . . . . . . . . . . . . . . . (9.0) (53.3) (2.5)Redemption of variable rate demand bonds . . . . . . . . . . . . . . . . . . . . . . . . . . . . . . . . . . . . . . . . . . . . . . . . (2.0) — —Issuance of common stock . . . . . . . . . . . . . . . . . . . . . . . . . . . . . . . . . . . . . . . . . . . . . . . . . . . . . . . . . . . . . 5.7 288.8 1.6Issuances of long-term debt . . . . . . . . . . . . . . . . . . . . . . . . . . . . . . . . . . . . . . . . . . . . . . . . . . . . . . . . . . . . 532.0 650.4 1,136.9Redemption of long-term debt . . . . . . . . . . . . . . . . . . . . . . . . . . . . . . . . . . . . . . . . . . . . . . . . . . . . . . . . . . (755.8) (1,119.7) (692.2)(Repayments) issuances of short-term debt, net . . . . . . . . . . . . . . . . . . . . . . . . . . . . . . . . . . . . . . . . . . . . . (161.3) 136.3 (452.7)Cost of issuances and financings . . . . . . . . . . . . . . . . . . . . . . . . . . . . . . . . . . . . . . . . . . . . . . . . . . . . . . . . (9.0) (26.7) (14.6)Net other financing activities . . . . . . . . . . . . . . . . . . . . . . . . . . . . . . . . . . . . . . . . . . . . . . . . . . . . . . . . . . . 2.3 9.7 (8.1)
Net Cash Used In Financing Activities . . . . . . . . . . . . . . . . . . . . . . . . . . . . . . . . . . . . . . . . . . . . . . . . . . . (561.0) (359.1) (370.7)
Net Increase (Decrease) In Cash and Cash Equivalents . . . . . . . . . . . . . . . . . . . . . . . . . . . . . . . . . . . . . . . 92.0 (60.7) 39.0Cash and Cash Equivalents at Beginning of Year . . . . . . . . . . . . . . . . . . . . . . . . . . . . . . . . . . . . . . . . . . . 29.5 90.2 51.2
CASH AND CASH EQUIVALENTS AT END OF YEAR . . . . . . . . . . . . . . . . . . . . . . . . . . . . . . . . . $ 121.5 $ 29.5 $ 90.2
NON-CASH ACTIVITIESExcess accumulated depreciation transferred to regulatory liabilities . . . . . . . . . . . . . . . . . . . . . . . . . . . . $ 131.0 — —Sale of financed project account receivables . . . . . . . . . . . . . . . . . . . . . . . . . . . . . . . . . . . . . . . . . . . . . . . $ 50.0 — —Supplemental Disclosure of Cash Flow InformationCash paid for interest (net of capitalized interest of $3.8 million, $2.9 million and $11.3 million,
respectively) and paid (received) for income taxes:Interest . . . . . . . . . . . . . . . . . . . . . . . . . . . . . . . . . . . . . . . . . . . . . . . . . . . . . . . . . . . . . . . . . . . . . . . . $ 328.4 $ 356.9 $ 390.3Income taxes . . . . . . . . . . . . . . . . . . . . . . . . . . . . . . . . . . . . . . . . . . . . . . . . . . . . . . . . . . . . . . . . . . . . $ 44.1 $ (19.9) $ (144.1)
The accompanying Notes are an integral part of these Consolidated Financial Statements.
B-84

PEPCO HOLDINGS, INC. AND SUBSIDIARIESCONSOLIDATED STATEMENTS OF SHAREHOLDERS’ EQUITY
Common Stock Premiumon Stock
CapitalStock
Expense
AccumulatedOther
Comprehensive(Loss)
EarningsRetainedEarningsShares Par Value
(In millions, except share data)
BALANCE, DECEMBER 31, 2002(AS REPORTED) . . . . . . . . . . . . . . . . . . . . . 169,982,361 $ 1.7 $2,212.0 $ (3.2) $(52.9) $ 838.2
RESTATEMENT . . . . . . . . . . . . . . . . . . . . . . . — — — — — (23.0)
BALANCE, DECEMBER 31, 2002(RESTATED) . . . . . . . . . . . . . . . . . . . . . . . . 169,982,361 $ 1.7 $2,212.0 $ (3.2) $(52.9) $ 815.2
Net Income (RESTATED) . . . . . . . . . . . . . . . . — — — — — 107.3Other comprehensive income . . . . . . . . . . . . . . — — — — 30.2 —Dividends on common stock ($1.00/sh.) . . . . . — — — — — (170.7)Issuance of common stock:
Original issue shares . . . . . . . . . . . . . . . . . 80,665 — 1.6 — — —DRP original shares . . . . . . . . . . . . . . . . . 1,706,422 — 31.2 — — —
Release of restricted stock . . . . . . . . . . . . . . . . — — .1 (.1) — —Reacquired Conectiv and Pepco PARS . . . . . . — — 1.7 — — —
BALANCE, DECEMBER 31, 2003(RESTATED) . . . . . . . . . . . . . . . . . . . . . . . . 171,769,448 $ 1.7 $2,246.6 $ (3.3) $(22.7) $ 751.8
Net Income (RESTATED) . . . . . . . . . . . . . . . . — — — — — 260.6Other comprehensive loss . . . . . . . . . . . . . . . . . — — — — (29.3) —Dividends on common stock ($1.00/sh.) . . . . . — — — — — (176.0)Reacquisition of subsidiary preferred stock . . . — — 1.0 — — —Issuance of common stock:
Original issue shares . . . . . . . . . . . . . . . . . 15,086,126 .2 288.6 (10.2) — —DRP original shares . . . . . . . . . . . . . . . . . 1,471,936 — 29.2 — — —
Reacquired Conectiv and Pepco PARS . . . . . . — — .6 — — —Vested options converted to Pepco Holdings
options . . . . . . . . . . . . . . . . . . . . . . . . . . . . . . — — .2 — — —
BALANCE, DECEMBER 31, 2004(RESTATED) . . . . . . . . . . . . . . . . . . . . . . . . 188,327,510 $ 1.9 $2,566.2 $(13.5) $(52.0) $ 836.4
Net Income . . . . . . . . . . . . . . . . . . . . . . . . . . . . — — — — — 371.2Other comprehensive income . . . . . . . . . . . . . . — — — — 29.2 —Dividends on common stock ($1.00/sh.) . . . . . — — — — — (188.9)Reacquisition of subsidiary preferred stock . . . — — .1 — — —Issuance of common stock:
Original issue shares . . . . . . . . . . . . . . . . . 261,708 — 5.7 — — —DRP original shares . . . . . . . . . . . . . . . . . 1,228,505 — 27.5 — — —
Reacquired Conectiv and Pepco PARS . . . . . . — — .3 — — —
BALANCE, DECEMBER 31, 2005 . . . . . . . . 189,817,723 $ 1.9 $2,599.8 $(13.5) $(22.8) $1,018.7
The accompanying Notes are an integral part of these Consolidated Financial Statements.
B-85
NOTES TO CONSOLIDATED FINANCIAL STATEMENTS
(1) ORGANIZATION
Pepco Holdings, Inc. (Pepco Holdings or PHI) is a diversified energy company that, through its operatingsubsidiaries, is engaged in two principal business operations:
• electricity and natural gas delivery (Power Delivery), and
• competitive energy generation, marketing and supply (Competitive Energy).
PHI was incorporated in Delaware in February 2001, for the purpose of effecting the acquisition of Conectivby Potomac Electric Power Company (Pepco). The acquisition was completed on August 1, 2002, at which timePepco and Conectiv became wholly owned subsidiaries of PHI. Conectiv was formed in 1998 to be the holdingcompany for Delmarva Power & Light Company (DPL) and Atlantic City Electric Company (ACE) inconnection with a merger between DPL and ACE. As a result, DPL and ACE are wholly owned subsidiaries ofConectiv.
On February 8, 2006, the Public Utility Holding Company Act of 1935 (PUHCA 1935) was repealed andthe Public Utility Holding Company Act of 2005 (PUHCA 2005) went into effect. As a result, PHI has ceased tobe regulated by the Securities and Exchange Commission (SEC) as a public utility holding company and is nowsubject to the regulatory oversight of the Federal Energy Regulatory Commission (FERC). As permitted underFERC regulations promulgated under PUHCA 2005, PHI will give notice to FERC that it will continue, untilfurther notice, to operate pursuant to the authority granted in the financing order issued by the SEC underPUHCA 1935, which has an authorization period ending June 30, 2008, relating to the issuance of securities andguarantees, other financing transactions and the operation of the money pool.
PHI Service Company, a subsidiary service company of PHI, provides a variety of support services,including legal, accounting, tax, financial reporting, treasury, purchasing and information technology services toPepco Holdings and its operating subsidiaries. These services are provided pursuant to a service agreementamong PHI, PHI Service Company, and the participating operating subsidiaries that was filed with, and approvedby, the SEC under PUHCA 1935. The expenses of the service company are charged to PHI and the participatingoperating subsidiaries in accordance with costing methodologies set forth in the service agreement. PHI expectsto continue operating under the service agreement.
The following is a description of each of PHI’s two principal business operations.
Power Delivery
The largest component of PHI’s business is power delivery, which consists of the transmission anddistribution of electricity and the distribution of natural gas. PHI’s Power Delivery business is conducted by itsthree regulated utility subsidiaries: Pepco, DPL and ACE. Each subsidiary is a regulated public utility in thejurisdictions that comprise its service territory. Together the three companies constitute a single segment forfinancial reporting purposes. Each company is responsible for the delivery of electricity and, in the case of DPL,natural gas in its service territory, for which it is paid tariff rates established by the local public servicecommission. Each company also supplies electricity at regulated rates to retail customers in its service territorywho do not elect to purchase electricity from a competitive energy supplier. The regulatory term for this supplyservice varies by jurisdiction as follows:
Delaware Provider of Last Resort service (POLR)—before May 1, 2006 StandardOffer Service (SOS)—on and after May 1, 2006
District of Columbia SOS
Maryland SOS
New Jersey Basic Generation Service (BGS)
Virginia Default Service
B-86

PHI and its subsidiaries refer to this supply service in each of the jurisdictions generally as DefaultElectricity Supply.
The rates each company is permitted to charge for the wholesale transmission of electricity are regulated byFERC.
The profitability of the Power Delivery business depends on its ability to recover costs and earn a reasonablereturn on its capital investments through the rates it is permitted to charge.
Competitive Energy
The Competitive Energy business provides competitive generation, marketing and supply of electricity andgas, and related energy management services, primarily in the mid-Atlantic region. PHI’s Competitive Energyoperations are conducted through subsidiaries of Conectiv Energy Holding Company (collectively, ConectivEnergy) and Pepco Energy Services, Inc. and its subsidiaries (collectively, Pepco Energy Services). ConectivEnergy and Pepco Energy Services are separate operating segments for financial reporting purposes.
Other Business Operations
Over the last several years, PHI has discontinued its investments in non-energy related businesses, includingthe sale of its aircraft investments and the sale of its 50% interest in Starpower Communications LLC(Starpower). Through its subsidiary, Potomac Capital Investment Corporation (PCI), PHI continues to maintain aportfolio of cross-border energy sale-leaseback transactions, with a book value at December 31, 2005 ofapproximately $1.3 billion. This activity constitutes a fourth operating segment, which is designated as “OtherNon-Regulated” for financial reporting purposes.
(2) SUMMARY OF SIGNIFICANT ACCOUNTING POLICIES
Consolidation Policy
The accompanying consolidated financial statements include the accounts of Pepco Holdings and its whollyowned subsidiaries. All intercompany balances and transactions between subsidiaries have been eliminated.Pepco Holdings uses the equity method to report investments, corporate joint ventures, partnerships, andaffiliated companies in which it holds a 20% to 50% voting interest and cannot exercise control over theoperations and policies of the investment. Under the equity method, Pepco Holdings records its interest in theentity as an investment in the accompanying Consolidated Balance Sheets, and its percentage share of theentity’s earnings are recorded in the accompanying Consolidated Statements of Earnings. Additionally, theproportionate interests in jointly owned electric plants are consolidated.
In accordance with the provisions of Financial Accounting Standards Board (FASB) Interpretation No. 46R(revised December 2003), entitled “Consolidation of Variable Interest Entities,” Pepco Holdings deconsolidatedseveral entities that had previously been consolidated and consolidated several small entities that had notpreviously been consolidated. FIN 46R addresses conditions under which an entity should be consolidated basedupon variable interests rather than voting interests. For additional information regarding the impact ofimplementing FIN 46R, see the FIN 46R discussion later in this Note.
Use of Estimates
The preparation of financial statements in conformity with accounting principles generally accepted in theUnited States of America, such as compliance with Statement of Position 94-6, “Disclosure of CertainSignificant Risks and Uncertainties,” requires management to make certain estimates and assumptions that affectthe reported amounts of assets, liabilities, revenues and expenses, and related disclosures of contingent assets andliabilities in the consolidated financial statements and accompanying notes. Examples of significant estimates
B-87

used by Pepco Holdings include the assessment of contingencies, the calculation of future cash flows and fairvalue amounts for use in goodwill and asset impairment evaluations, fair value calculations (based on estimatedmarket pricing) associated with derivative instruments, pension and other postretirement benefits assumptions,unbilled revenue calculations, and judgment involved with assessing the probability of recovery of regulatoryassets. Additionally, PHI is subject to legal, regulatory, and other proceedings and claims that arise in theordinary course of its business. PHI records an estimated liability for these proceedings and claims based uponthe probable and reasonably estimable criteria contained in SFAS No. 5 “Accounting for Contingencies.”Although Pepco Holdings believes that its estimates and assumptions are reasonable, they are based uponinformation available to management at the time the estimates are made. Actual results may differ significantlyfrom these estimates.
Changes in Accounting Estimates
During 2005, Pepco recorded the impact of an increase in estimated unbilled revenue (electricity and gasdelivered to the customer but not yet billed), primarily reflecting a change in Pepco’s unbilled revenue estimationprocess. This modification in accounting estimate increased net earnings for the year ended December 31, 2005by approximately $2.2 million.
Also, during 2005, DPL and ACE each recorded the impact of reductions in estimated unbilled revenue,primarily reflecting an increase in the estimated amount of power line losses (electricity lost in the process of itstransmission and distribution to customers). These changes in accounting estimates reduced net earnings for theyear ended December 31, 2005 by approximately $7.4 million, of which $1.0 million was attributable to DPL and$6.4 million was attributable to ACE.
During 2005, Conectiv Energy increased the estimated useful lives of its generation assets that resulted inlower depreciation expense of approximately $5.3 million.
Revenue Recognition
Regulated Revenue
The Power Delivery businesses recognize revenues from the supply and delivery of electricity and gas upondelivery to the customer, including amounts for services rendered but not yet billed (unbilled revenue). PepcoHoldings recorded amounts for unbilled revenue of $198.2 million and $227.4 million as of December 31, 2005and 2004, respectively. These amounts are included in the “accounts receivable” line item in the accompanyingConsolidated Balance Sheets. Pepco Holdings utility operations calculate unbilled revenue using an output basedmethodology. This methodology is based on the supply of electricity or gas distributed to customers. Theunbilled revenue process requires management to make assumptions and judgments about input factors such ascustomer sales mix and estimated power line losses, which are inherently uncertain and susceptible to changefrom period to period, the impact of which could be material.
The taxes related to the consumption of electricity and gas by the utility customers, such as fuel, energy, orother similar taxes, are components of the tariff rates charged by PHI subsidiaries and, as such, are billed tocustomers and recorded in Operating Revenues. Accruals for these taxes by the respective companies arerecorded in Other Taxes. Excise tax related generally to the consumption of gasoline by PHI and its subsidiariesin the normal course of business is charged to operations, maintenance or construction, and is de minimis.
Competitive Revenue
The Competitive Energy businesses recognize revenues for the supply and delivery of electricity and gasupon delivery to the customer, including amounts for services rendered, but not yet billed. Conectiv Energyrecognizes revenue when delivery is complete. Unrealized derivative gains and losses are recognized in currentearnings as revenue if the derivative activity does not qualify for hedge accounting or normal sales treatment
B-88

under SFAS No. 133. Pepco Energy Services recognizes revenue for its wholesale and retail commodity businessupon delivery to customers. Revenues for Pepco Energy Services’ energy efficiency construction business arerecognized using the percentage-of-completion method of revenue recognition which recognizes revenue as workis completed on the contract, and revenues from its operation and maintenance and other products and servicescontracts are recognized when earned. Revenues from the other non-regulated business lines are principallyrecognized when services are performed or products are delivered; however, revenues from utility industryservices contracts are recognized using the percentage-of-completion method of revenue recognition.
Regulation of Power Delivery Operations
The power delivery operations of Pepco are regulated by the District of Columbia Public ServiceCommission (DCPSC) and the Maryland Public Service Commission (MPSC).
The power delivery operations of DPL are regulated by the Delaware Public Service Commission (DPSC),the MPSC, and the Virginia State Corporation Commission (VSCC).
The power delivery operations of ACE are regulated by the New Jersey Board of Public Utilities (NJBPU).
The wholesale power transmission operations of each of Pepco, DPL, and ACE are regulated by FERC.
The requirements of SFAS No. 71 apply to the Power Delivery businesses of Pepco, DPL, and ACE. SFASNo. 71 allows regulated entities, in appropriate circumstances, to establish regulatory assets and liabilities and todefer the income statement impact of certain costs that are expected to be recovered in future rates.Management’s assessment of the probability of recovery of regulatory assets requires judgment andinterpretation of laws, regulatory commission orders, and other factors. If management subsequently determines,based on changes in facts or circumstances, that a regulatory asset is not probable of recovery, then the regulatoryasset must be eliminated through a charge to earnings.
The components of Pepco Holdings’ regulatory asset balances at December 31, 2005 and 2004, are asfollows:
2005 2004
(Millions of dollars)
Securitized stranded costs . . . . . . . . . . . . . . . . . . . . . . . . . . . . . . . . . . $ 823.5 $ 887.7Deferred energy supply costs . . . . . . . . . . . . . . . . . . . . . . . . . . . . . . . 18.3 109.1Deferred recoverable income taxes . . . . . . . . . . . . . . . . . . . . . . . . . . . 150.5 162.2Deferred debt extinguishment costs . . . . . . . . . . . . . . . . . . . . . . . . . . 80.9 78.3Unrecovered purchased power contract costs . . . . . . . . . . . . . . . . . . . 18.2 22.6Deferred other postretirement benefit costs . . . . . . . . . . . . . . . . . . . . 17.5 20.0Other . . . . . . . . . . . . . . . . . . . . . . . . . . . . . . . . . . . . . . . . . . . . . . . . . . 93.1 55.1
Total regulatory assets . . . . . . . . . . . . . . . . . . . . . . . . . . . . . . . . . $1,202.0 $1,335.0
The components of Pepco Holdings’ regulatory liability balances at December 31, 2005 and 2004, are asfollows:
2005 2004
(Millions of dollars)
Deferred income taxes due to customers . . . . . . . . . . . . . . . . . . . . . . . . . $ 73.2 $ 71.0Deferred energy supply costs . . . . . . . . . . . . . . . . . . . . . . . . . . . . . . . . . . 40.9 —Regulatory liability for Federal and New Jersey tax benefit . . . . . . . . . . . 37.6 40.7Generation Procurement Credit, customer sharing commitment and
other . . . . . . . . . . . . . . . . . . . . . . . . . . . . . . . . . . . . . . . . . . . . . . . . . . . . 76.5 26.1Accrued asset removal costs . . . . . . . . . . . . . . . . . . . . . . . . . . . . . . . . . . . 244.2 254.1Excess depreciation reserve . . . . . . . . . . . . . . . . . . . . . . . . . . . . . . . . . . . 121.7 —
Total regulatory liabilities . . . . . . . . . . . . . . . . . . . . . . . . . . . . . . . . . $594.1 $391.9
B-89

A description for each category of regulatory assets and regulatory liabilities follows:
Securitized Stranded Costs: Represents stranded costs associated with a non-utility generator (NUG)contract termination payment and the discontinuation of the application of SFAS No. 71 for ACE’s electricitygeneration business. The recovery of these stranded costs has been securitized through the issuance of TransitionBonds by Atlantic City Electric Transition Funding LLC (ACE Funding). A customer surcharge is collected byACE to fund principal and interest payments on the Transition Bonds. The stranded costs are amortized over thelife of the Transition Bonds, which mature between 2010 and 2023.
Deferred Energy Supply Costs: The regulatory asset balances primarily represent deferred costs related tothe provision of BGS and other restructuring related costs incurred by ACE as well as deferred fuel costs forDPL’s gas business. All deferrals receive a return, with ACE deferrals recovered over the next 8 years and DPL’sdeferred fuel costs recovered annually. The regulatory liability balance at December 31, 2005 relates to ACE andreflects net over recovery associated with New Jersey BGS, NUGS, Market transition charges, and otherrestructuring items.
Deferred Recoverable Income Taxes: Represents deferred income tax assets recognized from thenormalization of flow-through items as a result of amounts previously provided to customers. As temporarydifferences between the financial statement and tax basis of assets reverse, deferred recoverable income taxes areamortized. There is no return on these deferrals.
Deferred Debt Extinguishment Costs: Represents the costs of debt extinguishment for which recoverythrough regulated utility rates is considered probable and, if approved, will be amortized to interest expenseduring the authorized rate recovery period. A return is received on these deferrals.
Unrecovered Purchased Power Contract Costs: Represents deferred costs related to purchase powercontracts at ACE and DPL. The ACE amortization period began in July 1994 and will end in May 2014. TheDPL amortization period began in February 1996 and will end in October 2007. Both earn a return.
Deferred Other Postretirement Benefit Costs: Represents the non-cash portion of other postretirementbenefit costs deferred by ACE during 1993 through 1997. This cost is being recovered over a 15-year period thatbegan on January 1, 1998. There is no return on this deferral.
Other: Represents miscellaneous regulatory assets that generally are being amortized over 1 to 20 years andgenerally do not receive a return.
Deferred Income Taxes Due to Customers: Represents the portion of deferred income tax liabilitiesapplicable to utility operations of Pepco, DPL, and ACE that has not been reflected in current customer rates forwhich future payment to customers is probable. As temporary differences between the financial statement and taxbasis of assets reverse, deferred recoverable income taxes are amortized.
Regulatory Liability for Federal and New Jersey Tax Benefit: Securitized stranded costs include aportion of stranded costs attributable to the future tax benefit expected to be realized when the higher tax basis ofgenerating plants divested by ACE is deducted for New Jersey state income tax purposes as well as the futurebenefit to be realized through the reversal of federal excess deferred taxes. To account for the possibility thatthese tax benefits may be given to ACE’s regulated electricity delivery customers through lower rates in thefuture, ACE established a regulatory liability. The regulatory liability related to federal excess deferred taxes willremain until such time as the Internal Revenue Service issues its final regulations with respect to normalizationof these federal excess deferred taxes.
Generation Procurement Credit (GPC) and Customer Sharing Commitment: Pepco’s settlementagreements related to its December 2000 generation divestiture, approved by both the DCPSC and MPSC,required the sharing between customers and shareholders of any profits earned during the four-year transition
B-90

period from February 8, 2001 through February 7, 2005 in each jurisdiction. The GPC represents the customers’share of profits that Pepco has realized on the procurement and resale of Standard Offer Service electricitysupply to customers in Maryland and the District of Columbia that has not yet been distributed to customers.Pepco is currently distributing the customers’ share of profits monthly to customers in a billing credit. The GPCincreased by $42.3 million in December 2005 due to the settlement of the Pepco TPA claim against the Mirantbankruptcy estate.
Accrued Asset Removal Costs: Represents Pepco’s and DPL’s asset retirement obligations associated withremoval costs accrued using public service commission-approved depreciation rates for transmission,distribution, and general utility property. In accordance with the SEC interpretation of SFAS 143, accruals forremoval costs were classified as a regulatory liability.
Excess Depreciation Reserve: The excess depreciation reserve was recorded as part of a New Jersey ratecase settlement. This excess reserve is the result of a change in depreciable lives and a change in depreciationtechnique from remaining life to whole life. The excess will be amortized over 8.25 years, beginning June 2005.
Accounting For Derivatives
Pepco Holdings and its subsidiaries use derivative instruments primarily to manage risk associated withcommodity prices and interest rates. Risk management policies are determined by PHI’s Corporate RiskManagement Committee (CRMC). The CRMC monitors interest rate fluctuation, commodity price fluctuation,and credit risk exposure. The CRMC sets risk management policies that establish limits on unhedged risk anddetermine risk reporting requirements.
PHI accounts for its derivative activities in accordance with SFAS No. 133, “Accounting for DerivativeInstruments and Hedging Activities,” as amended by subsequent pronouncements. SFAS No. 133 requiresderivative instruments to be measured at fair value. Derivatives are recorded on the Consolidated Balance Sheetas other assets or other liabilities with offsetting gains and losses flowing through earnings unless they aredesignated as cash flow hedges. Derivatives can be accounted for in four ways under SFAS No. 133:(i) marked-to-market through current earnings, (ii) cash flow hedge accounting, (iii) fair value hedge accounting,and (iv) normal purchase and sales accounting.
Mark-to-market gains and losses on derivatives that are not designated as hedges are presented on theConsolidated Statements of Earnings as operating revenue. PHI uses mark-to-market accounting throughearnings for derivatives that either do not qualify for hedge accounting, or that management does not designate ashedges. Derivatives that were used for Conectiv Energy’s discontinued proprietary trading activities weremarked-to-market through earnings.
The gain or loss on a derivative that hedges exposure to variable cash flow of a forecasted transaction isinitially recorded in Other Comprehensive Income (a separate component of common stockholders’ equity) andis subsequently reclassified into earnings in the same category as the item being hedged when the forecastedtransaction occurs. If a forecasted transaction is no longer probable, the deferred gain or loss in accumulatedother comprehensive income is immediately reclassified to earnings. Gains or losses related to any ineffectiveportion of cash flow hedges are also recognized in earnings immediately.
Changes in the fair value of other hedging derivatives, designated as fair value hedges, result in a change inthe value of the asset, liability, or firm commitment being hedged. Changes in fair value of the asset, liability, orfirm commitment, and the hedging instrument, are recorded in the Consolidated Statements of Earnings.
Certain commodity forwards are not required to be recorded on a mark-to-market basis of accounting asprovided under the guidance of SFAS No. 133. These contracts are designated as “normal purchases and sales”as permitted by SFAS No. 133. This type of contract is used in normal operations, settles physically, and follows
B-91

standard accrual accounting. Unrealized gains and losses on these contracts do not appear on the ConsolidatedBalance Sheets. Examples of these transactions include purchases of fuel to be consumed in power plants andactual receipts and deliveries of electric power. Normal purchases and sales transactions are presented on a grossbasis, normal sales as operating revenue, and normal purchases as fuel and purchased energy expenses.
PHI uses option contracts to mitigate certain risk. These options are normally marked-to-market throughcurrent earnings because of the difficulty in qualifying options for hedge accounting treatment. Option premiumsare deferred as prepaid expenses or other liabilities until the exercise period of the option is realized. Marketprices, when available, are used to value options. If market prices are not available, the market value of theoptions is estimated using Black-Scholes closed form models. Option contracts typically make up only a smallportion of PHI’s total derivatives portfolio.
The fair value of derivatives is determined using quoted exchange prices where available. For instrumentsthat are not traded on an exchange, external broker quotes are used to determine fair value. For some custom andcomplex instruments, an internal model is used to interpolate broker quality price information. Models are alsoused to estimate volumes for certain transactions. The same valuation methods are used to determine the value ofnon-derivative, commodity exposure for risk management purposes.
The impact of derivatives that are marked-to-market through current earnings, the ineffective portion ofcash flow hedges, and the portion of fair value hedges that flows to current earnings are presented on a net basison the Consolidated Statements of Earnings. When a hedging gain or loss is realized, it is presented on a net basisin the same category as the underlying item being hedged. Normal purchase and sales transactions are presentedgross on the Consolidated Statements of Earnings as they are realized. The unrealized assets and liabilities thatoffset unrealized derivative gains and losses are presented gross on the Consolidated Balance Sheets exceptwhere contractual netting agreements are in place.
Conectiv Energy engages in commodity hedging activities to minimize the risk of market fluctuationsassociated with the purchase and sale of energy commodities (natural gas, petroleum, coal and electricity). Themajority of these hedges relate to the procurement of fuel for its power plants, fixing the cash flows from theplant output, and securing power for electric load service. Conectiv Energy’s hedging activities are conductedusing derivative instruments, including forward contracts, swaps and futures, designated as cash flow hedgeswhich are designed to reduce the variability in future cash flows. Conectiv Energy’s commodity hedgingobjectives, in accordance with its risk management policy, are primarily the assurance of stable and known cashflows and the fixing of favorable prices and margins when they become available.
Conectiv Energy assesses risk on a total portfolio basis and by component (e.g. generation output,generation fuel, load supply, etc.). Portfolio risk combines the generation fleet, load obligations, miscellaneouscommodity sales and hedges. Accounting hedges are matched against each component using the product orproducts that most closely represent the underlying hedged item. The total portfolio is risk managed based on itsmegawatt position by month. If the total portfolio becomes too long or too short for a period, steps are taken toreduce or increase hedges. Portfolio-level hedging includes the use of accounting hedges (derivatives designatedas cash flow hedges), derivatives that are being marked-to-market through earnings, and other physicalcommodity purchases and sales.
DPL uses derivative instruments (forward contracts, futures, swaps, and exchange-traded andover-the-counter options) primarily to reduce gas commodity price volatility while limiting its firm customers’exposure to increases in the market price of gas. DPL also manages commodity risk with capacity contracts thatdo not meet the definition of derivatives. The primary goal of these activities is to reduce the exposure of itsregulated retail gas customers to natural gas price spikes. All premiums paid and other transaction costs incurredas part of DPL’s natural gas hedging activity, in addition to all gains and losses on the natural gas hedgingactivity, are fully recoverable through the fuel adjustment clause approved by the DPSC and are deferred underSFAS No. 71 until recovered. At December 31, 2005, DPL’s Balance Sheet included a deferred derivativereceivable of $21.6 million, offset by a $21.6 million regulatory liability.
B-92
Pepco Energy Services purchases electric and natural gas futures, swaps and forward contracts to hedgeprice risk in connection with the purchase of physical natural gas and electricity for delivery to customers infuture months. Pepco Energy Services accounts for its futures and swap contracts as cash flow hedges offorecasted transactions. Its forward contracts are accounted for under standard accrual accounting as thesecontracts meet the requirements for normal purchase and sale accounting under SFAS No. 133.
Conectiv Bethlehem, LLC (CBI), a subsidiary of Conectiv Energy, entered into an interest rate swapagreement for the purpose of managing its overall borrowing rate and limiting its interest rate risk associatedwith debt it incurred. CBI hedged 75% of the interest rate payments for its variable rate debt. CBI formallydesignated its interest rate swap agreement as a cash flow hedge. CBI repaid all of its external debt and settled itsinterest rate swap agreement ($6.8 million gain) in September 2004.
PCI has entered into interest rate swap agreements for the purpose of managing its overall borrowing rateand managing its interest rate exposure associated with debt it has issued. Approximately 72.9% of PCI’s fixedrate debt for its Medium Term Note program has been swapped into variable rate debt. All of PCI’s hedges onvariable rate debt expired when the variable rate debt incurred under its Medium-Term Note program maturedduring 2005.
Emission Allowances
Emission allowances for Sulfur Dioxide (SO2) and Nitrous Oxide (NOX) are allocated to generation ownersby the Environmental Protection Agency (EPA) based on Federal programs designed to regulate the emissionsfrom power plants. The EPA allotments have no cost basis to the generation owners. Depending on the run-timeof a generating unit in a given year, and other pollution controls it may have, the unit may need additionalallowances above its allocation or it may have excess allowances. Allowances are traded among companies in anover-the-counter market, which allows companies to purchase additional allowances to avoid incurring penaltiesfor noncompliance with applicable emissions standards or to sell excess allowances.
Pepco Holdings accounts for emission allowances as inventory. Allowances from EPA allocation are addedto current inventory each year at a zero basis. Additional purchased allowances are recorded at cost. Allowancessold or consumed at the power plants are expensed at a weighted-average cost. This cost tends to be relativelylow due to the zero-basis allowances. Pepco Holdings has a committee established to monitor compliance withemissions regulations and whether its power plants have the required number of allowances.
Accounting for Goodwill
Goodwill represents the excess of the purchase price of an acquisition over the fair value of the net assetsacquired. The accounting for goodwill is governed by SFAS No. 141, “Business Combinations,” and SFASNo. 142, “Goodwill and Other Intangible Assets.” Pepco Holdings’ goodwill balance that was generated fromPepco’s acquisition of Conectiv has been allocated to the Power Delivery business. SFAS No. 141 requiresbusiness combinations initiated after June 30, 2001 to be accounted for using the purchase method of accountingand broadens the criteria for recording intangible assets apart from goodwill. SFAS No. 142 requires thatpurchased goodwill and certain indefinite-lived intangibles no longer be amortized, but instead be tested forimpairment at least annually. Substantially all of Pepco Holdings’ goodwill was generated by the acquisition ofConectiv by Pepco in 2002.
A roll forward of PHI’s goodwill balance follows (Millions of dollars):
Balance, December 31, 2003 . . . . . . . . . . . . . . . . . . . . . . . . . . . . . . . . . . . . . . . . . . $1,432.3Less: Adjustment to pre-merger tax reserve . . . . . . . . . . . . . . . . . . . . . . . . . . (1.8)
Balance December 31, 2004 . . . . . . . . . . . . . . . . . . . . . . . . . . . . . . . . . . . . . . . . . . $1,430.5Add: Adjustment to pre-merger tax reserve . . . . . . . . . . . . . . . . . . . . . . . . . . .8
Balance, December 31, 2005 . . . . . . . . . . . . . . . . . . . . . . . . . . . . . . . . . . . . . . . . . . $1,431.3
B-93

Goodwill Impairment Evaluation
The provisions of SFAS No. 142 require the evaluation of goodwill for impairment at least annually or morefrequently if events and circumstances indicate that the asset might be impaired. Examples of such events andcircumstances include an adverse action or assessment by a regulator, a significant adverse change in legalfactors or in the business climate, and unanticipated competition. SFAS No. 142 indicates that if the fair value ofa reporting unit is less than its carrying value, including goodwill, an impairment charge may be necessary.During 2005, Pepco Holdings tested its goodwill for impairment as of July 1, 2005. This test indicated that noneof Pepco Holdings’ goodwill balance was impaired.
Long-Lived Assets Impairment Evaluation
Pepco Holdings is required to evaluate certain long-lived assets (for example, generating property andequipment and real estate) to determine if they are impaired when certain conditions exist. SFAS No. 144,“Accounting for the Impairment or Disposal of Long-Lived Assets,” governs the accounting treatment forimpairments of long-lived assets and indicates that companies are required to test long-lived assets forrecoverability whenever events or changes in circumstances indicate that their carrying amount may not berecoverable. Examples of such events or changes include a significant decrease in the market price of a long-lived asset or a significant adverse change in the manner in which an asset is being used or its physical condition.
For long-lived assets that are expected to be held and used, SFAS No. 144 requires that an impairment lossbe recognized only if the carrying amount of an asset is not recoverable and exceeds its fair value. For long-livedassets that can be classified as assets to be disposed of by sale under SFAS No. 144, an impairment loss will berecognized to the extent their carrying amount exceeds their fair value including costs to sell.
During 2003, PHI recorded an impairment charge of $53.3 million from the cancellation of a combustionturbine purchase contract and an impairment charge of $11.0 million related to aircraft investments held for leaseby PCI.
Cash and Cash Equivalents
Cash and cash equivalents include cash on hand, money market funds, and commercial paper with originalmaturities of three months or less.
Restricted Cash
Restricted cash represents cash either held as collateral or pledged as collateral that is restricted from use forgeneral corporate purposes.
Prepaid Expenses and Other
The prepaid expenses and other balance primarily consists of prepayments and the current portion ofdeferred income tax assets.
Accounts Receivable and Allowance for Uncollectible Accounts
Pepco Holdings’ subsidiaries’ accounts receivable balances primarily consist of customer accountsreceivable, other accounts receivable, and accrued unbilled revenue. Accrued unbilled revenue representsrevenue earned in the current period but not billed to the customer until a future date (usually within one monthafter the receivable is recorded). PHI uses the allowance method to account for uncollectible accounts receivable.
Capitalized Interest and Allowance for Funds Used During Construction
In accordance with the provisions of SFAS No. 34, “Capitalization of Interest Cost,” the cost of financingthe construction of Pepco Holdings’ non-regulated subsidiaries’ electric generating plants is capitalized. Other
B-94

non-utility construction projects also include financing costs in accordance with SFAS No. 34. In accordancewith the provisions of SFAS No. 71, utilities can capitalize Allowance for Funds Used During Construction(AFUDC) as part of the cost of plant and equipment. AFUDC recognizes that utility construction is financedpartially by debt and partially by equity.
Pepco Holdings recorded AFUDC for borrowed funds of $3.3 million, $2.8 million, and $3.0 million for theyears ended December 31, 2005, 2004, and 2003, respectively. These amounts are recorded as a reduction of“interest expense” in the accompanying Consolidated Statements of Earnings.
Pepco Holdings recorded amounts for the equity component of AFUDC of $4.7 million, $4.1 million and$4.6 million for the years ended December 31, 2005, 2004 and 2003, respectively. The amounts are included inthe “other income” caption of the accompanying Consolidated Statements of Earnings.
Leasing Activities
Pepco Holdings accounts for leases entered into by its subsidiaries in accordance with the provisions ofSFAS No. 13, “Accounting for Leases.” Income from investments in direct financing leases and leveraged leasetransactions, in which PCI is an equity participant, is accounted for using the financing method. In accordancewith the financing method, investments in leased property are recorded as a receivable from the lessee to berecovered through the collection of future rentals. For direct financing leases, unearned income is amortized toincome over the lease term at a constant rate of return on the net investment. Income, including investment taxcredits, on leveraged equipment leases is recognized over the life of the lease at a constant rate of return on thepositive net investment. Investments in equipment under capital leases are stated at cost, less accumulateddepreciation. Depreciation is recorded on a straight-line basis over the equipment’s estimated useful life.
Amortization of Debt Issuance and Reacquisition Costs
Expenses incurred in connection with the issuance of long-term debt, including premiums and discountsassociated with such debt, are deferred and amortized over the lives of the respective debt issues. Costsassociated with the reacquisition of debt for PHI’s regulated operations are also deferred and amortized over thelives of the new issues.
Pension and Other Postretirement Benefit Plans
Pepco Holdings sponsors a retirement plan that covers substantially all employees of Pepco, DPL, ACE andcertain employees of other Pepco Holdings’ subsidiaries (Retirement Plan). Pepco Holdings also providessupplemental retirement benefits to certain eligible executives and key employees through nonqualifiedretirement plans and provides certain postretirement health care and life insurance benefits for eligible retiredemployees.
Pepco Holdings accounts for the Retirement Plan in accordance with SFAS No. 87, “Employers’Accounting for Pensions,” and its postretirement health care and life insurance benefits for eligible employees inaccordance with SFAS No. 106, “Employers’ Accounting for Postretirement Benefits Other Than Pensions.”PHI’s financial statement disclosures are prepared in accordance with SFAS No. 132, “Employers’ Disclosuresabout Pensions and Other Postretirement Benefits,” as revised.
Severance Costs
In 2004, PHI’s Power Delivery business reduced its work force through a combination of retirements andtargeted reductions. This reduction plan met the criteria for the accounting treatment provided under SFASNo. 88, “Employer’s Accounting for Settlements and Curtailments of Defined Benefit Pension Plans and forTermination Benefits,” and SFAS No. 146, “Accounting for Costs Associated with Exit or Disposal Activities,”
B-95

as applicable. Additionally, during 2002, Pepco Holdings’ management approved initiatives by Pepco andConectiv to streamline their operating structures by reducing the number of employees at each company. Theseinitiatives met the criteria for the accounting treatment provided under EITF No. 94-3, “Liability Recognition forCertain Employee Termination Benefits and Other Costs to Exit an Activity (including Certain Costs Incurred ina Restructuring).” A roll forward of PHI’s severance accrual balance is as follows (Millions of dollars):
Balance, December 31, 2003 . . . . . . . . . . . . . . . . . . . . . . . . . . . . . . . . . . . . . . . . . . . $ 7.9Accrued during 2004 . . . . . . . . . . . . . . . . . . . . . . . . . . . . . . . . . . . . . . . . . . . . . . 11.7Payments during 2004 . . . . . . . . . . . . . . . . . . . . . . . . . . . . . . . . . . . . . . . . . . . . . (12.5)
Balance, December 31, 2004 . . . . . . . . . . . . . . . . . . . . . . . . . . . . . . . . . . . . . . . . . . . 7.1Accrued during 2005 . . . . . . . . . . . . . . . . . . . . . . . . . . . . . . . . . . . . . . . . . . . . . . 5.0Payments during 2005 . . . . . . . . . . . . . . . . . . . . . . . . . . . . . . . . . . . . . . . . . . . . . (9.6)
Balance, December 31, 2005 . . . . . . . . . . . . . . . . . . . . . . . . . . . . . . . . . . . . . . . . . . . $ 2.5
Property, Plant and Equipment
Property, plant and equipment are recorded at cost. The carrying value of property, plant and equipment isevaluated for impairment whenever circumstances indicate the carrying value of those assets may not berecoverable under the provisions of SFAS No. 144. Upon retirement, the cost of regulated property, net ofsalvage, is charged to accumulated depreciation. For non-regulated property, the cost and accumulateddepreciation of the property, plant and equipment retired or otherwise disposed of are removed from the relatedaccounts and included in the determination of any gain or loss on disposition. For additional informationregarding the treatment of asset removal obligations, see the “Asset Retirement Obligations” section included inthis Note.
The annual provision for depreciation on electric and gas property, plant and equipment is computed on astraight-line basis using composite rates by classes of depreciable property. Accumulated depreciation is chargedwith the cost of depreciable property retired, less salvage and other recoveries. Property, plant and equipmentother than electric and gas facilities is generally depreciated on a straight-line basis over the useful lives of theassets. The system-wide composite depreciation rates for 2005, 2004 and 2003 for Pepco’s transmission anddistribution system property were approximately 3.4%, 3.5% and 3.5%, respectively. The system-wide compositedepreciation rates for 2005, 2004 and 2003 for DPL’s transmission and distribution system property wasapproximately 3.1%. The system-wide composite depreciation rates for 2005, 2004 and 2003 for ACE’sgeneration, transmission and distribution system property were 3.1%, 3.3% and 3.2%, respectively.
Asset Retirement Obligations
Pepco Holdings adopted SFAS No. 143, “Accounting for Asset Retirement Obligations,” on January 1, 2003and FIN 47 as of December 31, 2005. This statement and related interpretation establish the accounting andreporting standards for measuring and recording asset retirement obligations. Based on the implementation ofSFAS No. 143, $244.2 million of accrued asset removal costs ($179.2 million for DPL and $65.0 million forPepco) at December 31, 2005, and $254.1 million of accrued asset removal costs ($176.9 million for DPL and$77.2 million for Pepco) at December 31, 2004, are reflected as regulatory liabilities in the accompanyingConsolidated Balance Sheets. Commission-approved depreciation rates for ACE do not contain components forthe recovery of removal cost; therefore, the recording of asset retirement obligations for ACE associated withaccruals for removal cost is not required. Additionally, in 2005, Pepco Holdings recorded conditional assetretirement obligations of approximately $1.5 million. Accretion expense for 2005, which relates to the regulatedPower Delivery segment, has been recorded as a regulatory asset.
Stock-Based Compensation
Pepco Holdings accounts for its stock-based employee compensation under the intrinsic value method ofexpense recognition and measurement prescribed by APB Opinion No. 25, “Accounting for Stock Issued to
B-96

Employees, and related Interpretations” (APB No. 25). As required by SFAS No. 123, “Accounting for Stock-Based Compensation,” as amended by SFAS No. 148, “Accounting for Stock-Based Compensation-Transitionand Disclosure,” a tabular presentation of the pro-forma stock-based employee compensation cost, net income,and basic and diluted earnings per share as if the fair value based method of expense recognition andmeasurement prescribed by SFAS No. 123 had been applied to all options follows:
For the Year EndedDecember 31,
(In millions, except per share data) 2005 2004 2003
Net Income, as reported . . . . . . . . . . . . . . . . . . . . . . . . . . . . . . . . . . . . . . . . . . . . . . . . . $371.2 $260.6 $107.3Add: Total stock-based employee compensation expense included in net income as
reported (net of related tax effect of $1.8 million, $1.7 million and $1.2 million,respectively) . . . . . . . . . . . . . . . . . . . . . . . . . . . . . . . . . . . . . . . . . . . . . . . . . . . . . . . . 2.6 2.6 2.0
Deduct: Total stock-based employee compensation expense determined under fairvalue based methods for all awards (net of related tax effect of $2.0 million, $2.5million and $1.5 million, respectively) . . . . . . . . . . . . . . . . . . . . . . . . . . . . . . . . . . . (2.8) (3.8) (2.6)
Pro forma net income . . . . . . . . . . . . . . . . . . . . . . . . . . . . . . . . . . . . . . . . . . . . . . . . . . . $371.0 $259.4 $106.7
Basic earnings per share as reported . . . . . . . . . . . . . . . . . . . . . . . . . . . . . . . . . . . . . . . $ 1.96 $ 1.48 $ .63Pro forma basic earnings per share . . . . . . . . . . . . . . . . . . . . . . . . . . . . . . . . . . . . . . . . $ 1.96 $ 1.47 $ .63Diluted earnings per share as reported . . . . . . . . . . . . . . . . . . . . . . . . . . . . . . . . . . . . . . $ 1.96 $ 1.48 $ .63Pro forma diluted earnings per share . . . . . . . . . . . . . . . . . . . . . . . . . . . . . . . . . . . . . . . $ 1.96 $ 1.47 $ .63
Accumulated Other Comprehensive Loss
A detail of the components of Pepco Holdings’ Accumulated Other Comprehensive Loss is as follows. Foradditional information, see the Consolidated Statements of Comprehensive Earnings.
(Millions of dollars)CommodityDerivatives
TreasuryLock
InterestRate
SwapsMarketableSecurities Other (a)
AccumulatedOther
Comprehensive(Loss) Income
Balance, December 31, 2002 . . . . . . . . . . . $ 17.2 $(59.7) $(9.6) $ (.8) $— $(52.9)Current year change . . . . . . . . . . . . . . . . . . 15.0 5.4 6.0 3.8 — 30.2
Balance, December 31, 2003 . . . . . . . . . . . 32.2 (54.3) (3.6) 3.0 — (22.7)Current year change . . . . . . . . . . . . . . . . . . (32.7) 7.2 3.3 (3.0) (4.1) (29.3)
Balance, December 31, 2004 . . . . . . . . . . . $ (.5) $(47.1) $ (.3) $— $(4.1) $(52.0)Current year change . . . . . . . . . . . . . . . . . . 25.1 7.0 .3 — (3.2) 29.2
Balance, December 31, 2005 . . . . . . . . . . . $ 24.6 $(40.1) $— $— $(7.3) $(22.8)
(a) Represents an adjustment for nonqualified pension plan minimum liability.
A detail of the income tax expense (benefit) allocated to the components of Pepco Holdings’ OtherComprehensive Earnings (Loss) for each year is as follows.
Year EndedCommodityDerivatives
TreasuryLock
InterestRate
SwapsMarketableSecurities Other (a)
OtherComprehensive(Loss) Income
(Millions of dollars)
December 31, 2003 . . . . . . . . . . . . . . . . . . $ 11.1 $6.3 $3.0 $ 2.0 $— $ 22.4December 31, 2004 . . . . . . . . . . . . . . . . . . $(21.6) $4.5 $1.8 $(1.4) $(2.8) $(19.5)December 31, 2005 . . . . . . . . . . . . . . . . . . $ 15.9 $4.7 $ .1 $— $(2.0) $ 18.7
(a) Represents the income tax benefit on an adjustment for nonqualified pension plan minimum liability.
B-97
Financial Investment Liquidation
In October 2005, PCI received $13.3 million in cash related to the liquidation of a preferred stockinvestment that was written-off in 2001 and recorded an after tax gain of $8.9 million.
Income Taxes
PHI and the majority of its subsidiaries file a consolidated Federal income tax return. Federal income taxesare allocated among PHI and the subsidiaries included in its consolidated group pursuant to a written tax sharingagreement which was approved by the SEC pursuant to regulations under PUHCA 1935 in connection with theestablishment of PHI as a holding company as part of Pepco’s acquisition of Conectiv on August 1, 2002. Underthis tax sharing agreement, PHI’s consolidated Federal income tax liability is allocated based upon PHI’s and itssubsidiaries’ separate taxable income or loss amounts, with the exception of the tax benefits applicable tonon-acquisition debt expenses of PHI. Such tax benefits are allocated only to subsidiaries with taxable income.
The Consolidated Financial Statements include current and deferred income taxes. Current income taxesrepresent the amounts of tax expected to be reported on PHI’s and its subsidiaries’ federal and state income taxreturns. Deferred income taxes are discussed below.
Deferred income tax assets and liabilities represent the tax effects of temporary differences between thefinancial statement and tax basis of existing assets and liabilities and are measured using presently enacted taxrates. The portion of Pepco’s, DPL’s, and ACE’s deferred tax liability applicable to its utility operations that hasnot been recovered from utility customers represents income taxes recoverable in the future and is included in“regulatory assets” on the Consolidated Balance Sheet. For additional information, see the preceding discussionunder “Regulation of Power Delivery Operations.”
Deferred income tax expense generally represents the net change during the reporting period in the netdeferred tax liability and deferred recoverable income taxes.
Investment tax credits from utility plants purchased in prior years are reported on the Consolidated BalanceSheet as “Investment tax credits.” These investment tax credits are being amortized to income over the usefullives of the related utility plant.
FIN 46R
Subsidiaries of Pepco Holdings have power purchase agreements (PPAs) with a number of entities,including three ACE Non-Utility Generation contracts (ACE NUGs) and an agreement of Pepco (Panda PPA)with Panda-Brandywine, L.P. (Panda). Due to a variable element in the pricing structure of the ACE NUGs andthe Panda PPA, the Pepco Holdings’ subsidiaries potentially assume the variability in the operations of the plantsrelated to these PPAs and therefore have a variable interest in the counterparties to these PPAs. As required byFIN 46R, Pepco Holdings continued, during 2005, to conduct exhaustive efforts to obtain information from thesefour entities, but was unable to obtain sufficient information to conduct the analysis required under FIN 46R todetermine whether these four entities were variable interest entities or if Pepco Holdings’ subsidiaries were theprimary beneficiary. As a result, Pepco Holdings has applied the scope exemption from the application of FIN46R for enterprises that have conducted exhaustive efforts to obtain the necessary information, but has not beenable to obtain such information.
Net purchase activities with the counterparties to the ACE NUGs and the Panda PPA for the years endedDecember 31, 2005, 2004, and 2003, were approximately $419 million, $341 million, and $326 million,respectively, of which approximately $381 million, $312 million, and $299 million, respectively, related topower purchases under the ACE NUGs and the Panda PPA. Pepco Holdings’ exposure to loss under theagreement with Panda entered into in 1991, pursuant to which Pepco is obligated to purchase from Panda 230megawatts of capacity and energy annually through 2021, is discussed in Note (12), Commitments andContingencies, under “Relationship with Mirant Corporation.” Pepco Holdings does not have loss exposureunder the ACE NUGs because cost recovery will be achieved from ACE’s customers through regulated rates.
B-98

Other Non-Current Assets
The other assets balance principally consists of real estate under development, equity and other investments,unrealized derivative assets, and deferred compensation trust assets.
Other Current Liabilities
The other current liability balance principally consists of customer deposits, accrued vacation liability,current unrealized derivative liabilities, and the current portion of deferred income taxes.
Other Deferred Credits
The other deferred credits balance principally consists of non-current unrealized derivative liabilities andmiscellaneous deferred liabilities.
New Accounting Standards
SFAS No. 154
In May 2005, the FASB issued Statement No. 154, “Accounting Changes and Error Corrections (SFASNo. 154), a replacement of APB Opinion No. 20 and FASB Statement No. 3.” SFAS No. 154 provides guidanceon the accounting for and reporting of accounting changes and error corrections. It establishes, unlessimpracticable, retrospective application as the required method for reporting a change in accounting principle inthe absence of explicit transition requirements specific to the newly adopted accounting principle. The reportingof a correction of an error by restating previously issued financial statements is also addressed by SFAS No. 154.This Statement is effective for accounting changes and corrections of errors made in fiscal years beginning afterDecember 15, 2005 (the year ended December 31, 2006 for Pepco Holdings). Early adoption is permitted.
SFAS No. 155
In February 2006, the FASB issued Statement No. 155, “Accounting for Certain Hybrid FinancialInstruments-an amendment of FASB Statements No. 133 and 140” (SFAS No. 155). This Statement amendsFASB Statements No. 133, “Accounting for Derivative Instruments and Hedging Activities”, and No. 140,“Accounting for Transfers and Servicing of Financial Assets and Extinguishments of Liabilities.” This Statementresolves issues addressed in Statement 133 Implementation Issue No. D1, “Application of Statement 133 toBeneficial Interests in Securitized Financial Assets.” SFAS No. 155 is effective for all financial instrumentsacquired or issued after the beginning of an entity’s first fiscal year that begins after September 15, 2006. PepcoHoldings is in the process of evaluating the impact of SFAS No. 155 but does not anticipate that itsimplementation will have a material impact on Pepco Holdings overall financial condition, results of operations,or cash flows.
SAB 107 and SFAS No. 123R
In March 2005, the SEC issued Staff Accounting Bulletin No. 107 (SAB 107) which providesimplementation guidance on the interaction between FASB Statement No. 123 (revised 2004), “Share-BasedPayment” (SFAS No. 123R), and certain SEC rules and regulations, as well as guidance on the valuation ofshare-based payment arrangements for public companies.
In April 2005, the SEC adopted a rule delaying the effective date of SFAS No. 123R for public companies.Under the rule, most registrants must comply with SFAS No. 123R beginning with the first interim or annualreporting period of their first fiscal year beginning after June 15, 2005 (the year ended December 31, 2006 forPepco Holdings).
B-99

In November 2005, the FASB published FASB Staff Position (FSP) FAS 123(R)-3, “Transition ElectionRelated to Accounting for the Tax Effects of Share-Based Payment Awards” (FSP FAS 123(R)-3, whichprovides guidance regarding an alternative transition election for accounting for the tax effects of share-basedpayments. FSP FAS 123(R)-3 was effective upon issuance.
In February 2006, the FASB published FASB Staff Position FAS 123(R)-4, “Classification of Options andSimilar Instruments Issued as Employee Compensation that Allow for Cash Settlement upon the Occurrence of aContingent Event” (FSP FAS 123(R)-4), which incorporate the concept of when cash settlement features ofoptions and similar instruments meet the condition outlined in SAFS No. 123R. FSP FAS 123(R)-4 is effectiveupon initial adoption of SFAS No.123R or the first reporting period after its issuance if SFAS No. 123R has beenadopted.
Pepco Holdings is in the process of completing its evaluation of the impact of SFAS No. 123R, FSP FAS123(R)-3, and FSP FAS 123(R)-4, and does not anticipate that their implementation or SAB 107 will have amaterial effect on Pepco Holdings’ overall financial condition, results of operations or cash flows.
EITF 04-13
In September 2005, the FASB ratified EITF Issue No. 04-13, “Accounting for Purchases and Sales ofInventory with the Same Counterparty” (EITF 04-13), which addresses circumstances under which two or moreexchange transactions involving inventory with the same counterparty should be viewed as a single exchangetransaction for the purposes of evaluating the effect of APB Opinion 29. EITF 04-13 is effective for newarrangements entered into, or modifications or renewals of existing arrangements, beginning in the first interimor annual reporting period beginning after March 15, 2006 (April 1, 2006 for Pepco Holdings). EITF 04-13would not affect Pepco Holdings’ net income, overall financial condition, or cash flows, but rather could result incertain revenues and costs, including wholesale revenues and purchased power expenses, being presented on anet basis. Pepco Holdings is in the process of evaluating the impact of EITF 04-13 on its ConsolidatedStatements of Earnings presentation of purchases and sales.
B-100

(3) SEGMENT INFORMATION
Based on the provisions of SFAS No. 131, “Disclosures about Segments of an Enterprise and RelatedInformation,” Pepco Holdings’ management has identified its operating segments at December 31, 2005 asPower Delivery, Conectiv Energy, Pepco Energy Services, and Other Non-Regulated. Intercompany(intersegment) revenues and expenses are not eliminated at the segment level for purposes of presenting segmentfinancial results. Elimination of these intercompany amounts is accomplished for PHI’s consolidated resultsthrough the “Corporate and Other” column. Segment financial information for the years ended December 31,2005, 2004, and 2003, is as follows.
Year Ended December 31, 2005
(Millions of dollars)Competitive
Energy Segments
PowerDelivery
ConectivEnergy
PepcoEnergyServices
OtherNon-
RegulatedCorp. &Other (a) PHI Cons.
Operating Revenue . . . . . . . . . . . . $ 4,702.9 $2,603.6(b) $1,487.5 $ 81.9 $ (810.4) $ 8,065.5Operating Expense (g) . . . . . . . . . . 4,032.1 (b)(e) 2,499.7 1,445.1 (5.0)(f) (811.8) 7,160.1Operating Income . . . . . . . . . . . . . 670.8 103.9 42.4 86.9 1.4 905.4Interest Income . . . . . . . . . . . . . . . 8.3 31.9 2.5 112.3 (139.0) 16.0Interest Expense . . . . . . . . . . . . . . . 175.0 58.7 5.6 146.1 (47.8) 337.6Other Income . . . . . . . . . . . . . . . . . 20.2 3.6 1.7 7.9 2.7 36.1Preferred Stock Dividends . . . . . . . 2.6 — — — (.1) 2.5Income Taxes . . . . . . . . . . . . . . . . . 228.6(c) 32.6 15.3 13.1 (34.4) 255.2Extraordinary Item (net of income
tax of $6.2 million) . . . . . . . . . . 9.0(d) — — — — 9.0Net Income (loss) . . . . . . . . . . . . . 302.1 48.1 25.7 47.9 (52.6) 371.2Total Assets . . . . . . . . . . . . . . . . . . 8,720.3 2,227.6 511.6 1,404.0 1,154.3 14,017.8Construction Expenditures . . . . . . $ 432.1 $ 15.4 $ 11.3 $ — $ 8.3 $ 467.1
Note:(a) Includes unallocated Pepco Holdings’ (parent company) capital costs, such as acquisition financing costs,
and the depreciation and amortization related to purchase accounting adjustments for the fair value ofConectiv assets and liabilities as of the August 1, 2002 acquisition date. Additionally, the Total Assets lineitem in this column includes Pepco Holdings’ goodwill balance.
(b) Power Delivery purchased electric energy and capacity and natural gas from Conectiv Energy in the amountof $565.3 million for the year ended December 31, 2005.
(c) Includes $10.9 million in income tax expense related to IRS Revenue Ruling 2005-53.(d) Relates to ACE’s electric distribution rate case settlement that was accounted for in the first quarter of 2005.
This resulted in ACE’s reversal of $9.0 million in after tax accruals related to certain deferred costs that arenow deemed recoverable. This amount is classified as extraordinary since the original accrual was part of anextraordinary charge in conjunction with the accounting for competitive restructuring in 1999.
(e) Includes $70.5 million ($42.2 million after tax) gain (net of customer sharing) from the settlement of thePepco TPA Claim and the Pepco asbestos claims against the Mirant bankruptcy estate. Also includes $68.1million ($40.7 million after tax) from the sale by Pepco of non-utility land owned at Buzzard Point.
(f) Includes $13.3 million gain ($8.9 million after tax) recorded by PCI as a result of the receipt, in the fourthquarter of 2005, of proceeds from the final liquidation of a financial investment that was written off in 2001.
(g) Includes depreciation and amortization of $422.6 million, consisting of $361.4 million for Power Delivery,$40.4 million for Conectiv Energy, $14.5 million for Pepco Energy Services, and $6.3 million for Corp. &Other.
B-101

Year Ended December 31, 2004 (As Restated)
(Millions of dollars)
PowerDelivery
CompetitiveEnergy Segments
OtherNon-
RegulatedCorp.
& Other (a)PHI
Cons.ConectivEnergy
PepcoEnergyServices
Operating Revenue . . . . . . . . . . . $4,377.7 $2,409.8(b) $1,166.6 $ 87.9 $ (818.9) $ 7,223.1Operating Expense (j) . . . . . . . . . 3,840.7(b)(c) 2,282.6 1,148.8 (1.1)(d) (820.0) 6,451.0Operating Income . . . . . . . . . . . . 537.0 127.2 17.8 89.0 1.1 772.1Interest Income . . . . . . . . . . . . . . 4.7 9.9 .7 58.8 (65.4) 8.7Interest Expense . . . . . . . . . . . . . 178.1 47.8(e) 2.8 94.8 49.8 373.3Other Income (expense) . . . . . . . 16.0 11.0(g) 2.5 (12.3)(h) 6.0 23.2Preferred Stock Dividends . . . . . 2.3 — — — .5 2.8Income Taxes (f) . . . . . . . . . . . . . 150.2 40.1 5.3 15.1(i) (43.4) 167.3Net Income (loss) . . . . . . . . . . . . 227.1 60.2 12.9 25.6 (65.2) 260.6Total Assets . . . . . . . . . . . . . . . . . 8,379.3 1,896.5 542.4 1,319.2 1,213.4 13,350.8Construction Expenditures . . . . . $ 479.5 $ 11.6 $ 21.2 $ — $ 5.1 $ 517.4
(a) Includes unallocated Pepco Holdings’ (parent company) capital costs, such as acquisition financing costs,and the depreciation and amortization related to purchase accounting adjustments for the fair value ofConectiv assets and liabilities as of the August 1, 2002 acquisition date. Additionally, the Total Assets lineitem in this column includes Pepco Holdings’ goodwill balance.
(b) Power Delivery purchased electric energy and capacity and natural gas from Conectiv Energy in the amountof $563.5 million for the year ended December 31, 2004.
(c) Includes a $14.7 million gain ($8.6 million after tax) recognized by Power Delivery from the condemnationsettlement associated with the transfer of certain distribution assets in Vineland, New Jersey. Also, includesa $6.6 million gain ($3.9 million after tax) recorded by Power Delivery from the sale of non-utility landduring the first quarter of 2004.
(d) Includes an $8.3 million gain ($5.4 million after tax) recorded by Other Non-Regulated from the sale ofPCI’s final three aircraft investments.
(e) Includes $12.8 million loss ($7.7 million after tax) associated with the pre-payment of the debt incurred byConectiv Bethlehem, LLC.
(f) In February 2004, a local jurisdiction issued final consolidated tax return regulations, which were retroactiveto 2001. These regulations provided Pepco Holdings (parent company) and its affiliated companies doingbusiness in this location the guidance necessary to file a consolidated income tax return. This allows PepcoHoldings’ subsidiaries with taxable losses to utilize those losses against tax liabilities of Pepco Holdings’companies with taxable income. During the first quarter of 2004, Pepco Holdings and its subsidiariesrecorded the impact of the new regulations of $13.2 million for the period of 2001 through 2003. The $13.2million consists of $.8 million for Power Delivery, $1.5 million for Pepco Energy Services, $8.8 million forOther Non-Regulated, and $2.1 million for Corporate & Other.
(g) Includes an $11.2 million pre-tax gain ($6.6 million after tax) recognized by Conectiv Energy from thedisposition of a joint venture associated with a co-generation facility.
(h) Includes an $11.2 million pre-tax impairment charge ($7.3 million after tax) to reduce the value of PHI’sinvestment in Starpower Communications, LLC to $28 million at June 30, 2004.
(i) Includes a $19.7 million charge related to an IRS settlement.(j) Includes depreciation and amortization expense of $440.5 million, which consists of $373.0 million for
Power Delivery, $45.2 million for Conectiv Energy, $11.9 million for Pepco Energy Services, $.2 millionfor Other Non-Regulated, and $10.2 million for Corp. & Other.
B-102

Year Ended December 31, 2003 (As Restated)
(Millions of dollars)
PowerDelivery
CompetitiveEnergy Segments
OtherNon-
RegulatedCorp. &Other (a) PHI Cons.
ConectivEnergy
PepcoEnergyServices
Operating Revenue . . . . . . $4,015.7 $2,857.5(b) $1,126.2 $ 100.1 $ (830.8) $ 7,268.7Operating Expense (h) . . . . 3,512.1(b) 2,984.0(c)(d)(e) 1,120.5 (44.1)(g) (914.5)(c)(d) 6,658.0Operating Income (loss) . . 503.6 (126.5) 5.7 144.2 83.7 610.7Interest Income . . . . . . . . . 21.9 5.7 .8 49.0 (60.1) 17.3Interest Expense . . . . . . . . 170.2 32.3 10.2 96.4 63.7 372.8Other Income (expense) . . (6.2) 15.1 4.6 (99.5)(f) 8.2 (77.8)Preferred Stock
Dividends . . . . . . . . . . . 13.9 — — — — 13.9Income Taxes (benefit) . . . 134.3 (53.0) .3 (10.1) (9.4) 62.1Extraordinary Item (net of
income taxes of $4.1million) . . . . . . . . . . . . . 5.9 — — — — 5.9
Net Income (loss) . . . . . . . 206.8 (85.0) .6 7.4 (22.5) 107.3Total Assets . . . . . . . . . . . . 8,385.5 1,964.5 547.9 1,384.5 1,086.6 13,369.0Construction
Expenditures . . . . . . . . . $ 383.9 $ 199.4 $ 10.8 $ — $ 4.1 $ 598.2
Note: The 2003 operating results have been revised for the full year to reflect: (1) the operations of PepcoPower Delivery and Conectiv Power Delivery as a single Power Delivery segment, (2) the transfer of theoperations of Conectiv Thermal Systems, Inc. from Conectiv Energy to Pepco Energy Services, (3) thetransfer of the operations of the Deepwater power generation plant from Power Delivery to ConectivEnergy, and (4) the transfer of operations of Pepco Enterprises, Inc. from Other Non-Regulated to PepcoEnergy Services.
(a) Includes unallocated Pepco Holdings’ (parent company) capital costs, such as acquisition financing costs,and the depreciation and amortization related to purchase accounting adjustments for the Conectiv assetsand liabilities as of the August 1, 2002 acquisition date. Additionally, the Total Assets line item in thiscolumn includes Pepco Holdings’ goodwill balance.
(b) Power Delivery purchased electric energy and capacity and natural gas from Conectiv Energy in theamount of $653.3 million for the year ended December 31, 2003.
(c) Conectiv Energy’s results include a charge of $108.0 million ($64.1 million after tax) related to thecancellation of a combustion turbine contract. This was partially offset by $57.9 million ($34.6 millionafter tax) in Corp. & Other, resulting from the reversal of a purchase accounting fair value adjustmentmade on the date of the acquisition of Conectiv. Overall, the net impact of these two transactions is $29.5million reduction of consolidated net income.
(d) Conectiv Energy’s results include a charge of $32.8 million ($19.4 million after tax) related to animpairment of its combustion turbine inventory. This charge was partially offset by $29.6 million ($17.7million after tax) in Corp. & Other, resulting from the reversal of a purchase accounting fair valueadjustment made on the date of the acquisition of Conectiv. Overall, the net impact of these twotransactions is $1.7 million reduction of consolidated net income.
(e) Conectiv Energy’s results include a charge of $44.3 million ($26.6 million after tax) resulting fromtrading losses prior to the cessation of proprietary trading.
(f) Other Non-Regulated results include a non-cash impairment charge of $102.6 million ($66.7 million aftertax) related to PHI’s investment in Starpower Communications, LLC.
(g) Includes a gain of $68.8 million ($44.7 million after tax) on the sale of the Edison Place office buildingand an impairment charge of $11.0 million ($7.2 million after tax) on PCI’s aircraft investments.
(h) Includes depreciation and amortization expense of $422.1 million, consisting of $356.0 million for PowerDelivery, $39.3 million for Conectiv Energy, $11.5 million for Pepco Energy Services, $2.4 million forOther Non-Regulated, and $12.9 million for Corp. & Other.
B-103

(4) LEASING ACTIVITIES
Financing lease balances were comprised of the following at December 31:
2005 2004
(Millions of dollars)
Energy leveraged leases . . . . . . . . . . . . . . . . . . . . . . . . . . . . . . . . . . . . . . . . . . . $1,264.4 $1,183.1Other . . . . . . . . . . . . . . . . . . . . . . . . . . . . . . . . . . . . . . . . . . . . . . . . . . . . . . . . . . 33.5 35.6
Total . . . . . . . . . . . . . . . . . . . . . . . . . . . . . . . . . . . . . . . . . . . . . . . . . . . . . . $1,297.9 $1,218.7
Pepco Holdings’ $1,264.4 million equity investment in energy leveraged leases at December 31, 2005,consists of electric power plants and natural gas distribution networks located outside of the United States. Ofthis amount, $439.4 million of equity is attributable to facilities located in The Netherlands, $649.5 million inAustria and $175.5 million in Australia.
The components of the net investment in finance leases at December 31, 2005 and 2004 are summarizedbelow (millions of dollars):
At December 31, 2005:Leveraged
Leases
DirectFinanceLeases
TotalFinanceLeases
Scheduled lease payments, net of non-recourse debt . . . . . . . . . . . $ 2,315.4 $24.1 $ 2,339.5Residual value . . . . . . . . . . . . . . . . . . . . . . . . . . . . . . . . . . . . . . . . . — 12.5 12.5Less: Unearned and deferred income . . . . . . . . . . . . . . . . . . . . . . . (1,051.0) (3.1) (1,054.1)
Investment in finance leases held in trust . . . . . . . . . . . . . . . . . . . . 1,264.4 33.5 1,297.9Less: Deferred taxes . . . . . . . . . . . . . . . . . . . . . . . . . . . . . . . . . . . . (584.3) (8.7) (593.0)
Net Investment in Finance Leases Held in Trust . . . . . . . . . . . . . . . $ 680.1 $24.8 $ 704.9
At December 31, 2004:Leveraged
Leases
DirectFinanceLeases
TotalFinanceLeases
Scheduled lease payments, net of non-recourse debt . . . . . . . . . . . $ 2,315.4 $26.4 $ 2,341.8Residual value . . . . . . . . . . . . . . . . . . . . . . . . . . . . . . . . . . . . . . . . . — 12.5 12.5Less: Unearned and deferred income . . . . . . . . . . . . . . . . . . . . . . . (1,132.3) (3.3) (1,135.6)
Investment in finance leases held in trust . . . . . . . . . . . . . . . . . . . . 1,183.1 35.6 1,218.7Less: Deferred taxes . . . . . . . . . . . . . . . . . . . . . . . . . . . . . . . . . . . . (494.6) (8.1) (502.7)
Net Investment in Finance Leases Held in Trust . . . . . . . . . . . . . . . $ 688.5 $27.5 $ 716.0
Income recognized from leveraged leases (included in “Other Operating Revenue”) was comprised of thefollowing for the years ended December 31:
2005 2004 2003
(Millions of dollars)
Pre-tax earnings from leveraged leases . . . . . . . . . . . . . . . . . . . . . . . . . . . . . $81.5 $83.5 $84.2Income tax expense . . . . . . . . . . . . . . . . . . . . . . . . . . . . . . . . . . . . . . . . . . . . 20.6 26.8 21.2
Net Income from Leveraged Leases Held in Trust . . . . . . . . . . . . . . . . . . . . $60.9 $56.7 $63.0
Scheduled lease payments from leveraged leases are net of non-recourse debt. Minimum lease paymentsreceivable from PCI’s finance leases for each of the years 2006 through 2010 and thereafter are $30.7 million for2006, $3.5 million for 2007, zero for 2008, zero for 2009, $32.1 million for 2010, and $1,231.6 millionthereafter. For a discussion of the Federal tax treatment of cross-border leases, see Note (12) “Commitments andContingencies.”
B-104

Lease Commitments
Pepco leases its consolidated control center, an integrated energy management center used by Pepco’spower dispatchers to centrally control the operation of its transmission and distribution systems. The lease isaccounted for as a capital lease and was initially recorded at the present value of future lease payments, whichtotaled $152 million. The lease requires semi-annual payments of $7.6 million over a 25-year period beginning inDecember 1994 and provides for transfer of ownership of the system to Pepco for $1 at the end of the lease term.Under SFAS No. 71, the amortization of leased assets is modified so that the total interest on the obligation andamortization of the leased asset is equal to the rental expense allowed for rate-making purposes. This lease hasbeen treated as an operating lease for rate-making purposes.
Rental expense for operating leases was $51.2 million, $46.2 million and $32.9 million for the years endedDecember 31, 2005, 2004, and 2003, respectively.
The approximate annual commitments under all operating leases are $38.3 million for 2006, $38.2 millionfor 2007, $39.0 million for 2008, 2009, and 2010, and $367.5 million thereafter.
Capital lease assets recorded within Property, Plant and Equipment at December 31, 2005 and 2004, inmillions of dollars, are comprised of the following:
At December 31, 2005Original
CostAccumulatedAmortization
Net BookValue
Transmission . . . . . . . . . . . . . . . . . . . . . . . . . . . . . . . . . . . . . . . . . . $ 76.0 $15.7 $ 60.3Distribution . . . . . . . . . . . . . . . . . . . . . . . . . . . . . . . . . . . . . . . . . . . 79.7 19.3 60.4General . . . . . . . . . . . . . . . . . . . . . . . . . . . . . . . . . . . . . . . . . . . . . . 2.8 1.8 1.0
Total . . . . . . . . . . . . . . . . . . . . . . . . . . . . . . . . . . . . . . . . . . . . $158.5 $36.8 $121.7
At December 31, 2004
Transmission . . . . . . . . . . . . . . . . . . . . . . . . . . . . . . . . . . . . . . . . . . $ 76.0 $13.6 $ 62.4Distribution . . . . . . . . . . . . . . . . . . . . . . . . . . . . . . . . . . . . . . . . . . . 79.7 16.9 62.8General . . . . . . . . . . . . . . . . . . . . . . . . . . . . . . . . . . . . . . . . . . . . . . 2.8 1.2 1.6
Total . . . . . . . . . . . . . . . . . . . . . . . . . . . . . . . . . . . . . . . . . . . . $158.5 $31.7 $126.8
The approximate annual commitments under all capital leases are $15.8 million for 2006, $15.5 million for2007, $15.4 million for 2008, $15.2 million for 2009 and 2010, and $137.1 million thereafter.
(5) PROPERTY, PLANT AND EQUIPMENT
Property, plant and equipment is comprised of the following:
At December 31, 2005Original
CostAccumulatedDepreciation
Net BookValue
(Millions of dollars)
Generation . . . . . . . . . . . . . . . . . . . . . . . . . . . . . . . . . . . . . . . . . . . . . . . . . . . . $ 1,795.1 $ 558.4 $1,236.7Distribution . . . . . . . . . . . . . . . . . . . . . . . . . . . . . . . . . . . . . . . . . . . . . . . . . . . 5,985.5 2,219.9 3,765.6Transmission . . . . . . . . . . . . . . . . . . . . . . . . . . . . . . . . . . . . . . . . . . . . . . . . . . 1,773.5 680.4 1,093.1Gas . . . . . . . . . . . . . . . . . . . . . . . . . . . . . . . . . . . . . . . . . . . . . . . . . . . . . . . . . . 339.5 100.7 238.8Construction work in progress . . . . . . . . . . . . . . . . . . . . . . . . . . . . . . . . . . . . 364.1 — 364.1Non-operating and other property . . . . . . . . . . . . . . . . . . . . . . . . . . . . . . . . . . 1,126.5 512.8 613.7
Total . . . . . . . . . . . . . . . . . . . . . . . . . . . . . . . . . . . . . . . . . . . . . . . . . . . . $11,384.2 $4,072.2 $7,312.0
B-105

At December 31, 2004Original
CostAccumulatedDepreciation
Net BookValue
(Millions of dollars)
Generation . . . . . . . . . . . . . . . . . . . . . . . . . . . . . . . . . . . . . . . . . . . . . . . . . . . . $ 1,847.6 $ 520.4 $1,327.2Distribution . . . . . . . . . . . . . . . . . . . . . . . . . . . . . . . . . . . . . . . . . . . . . . . . . . . 5,712.9 2,193.7 3,519.2Transmission . . . . . . . . . . . . . . . . . . . . . . . . . . . . . . . . . . . . . . . . . . . . . . . . . . 1,653.1 648.9 1,004.2Gas . . . . . . . . . . . . . . . . . . . . . . . . . . . . . . . . . . . . . . . . . . . . . . . . . . . . . . . . . . 326.7 93.8 232.9Construction work in progress . . . . . . . . . . . . . . . . . . . . . . . . . . . . . . . . . . . . 409.8 — 409.8Non-operating and other property . . . . . . . . . . . . . . . . . . . . . . . . . . . . . . . . . . 1,097.7 500.4 597.3
Total . . . . . . . . . . . . . . . . . . . . . . . . . . . . . . . . . . . . . . . . . . . . . . . . . . . . $11,047.8 $3,957.2 $7,090.6
The non-operating and other property amounts include balances for general plant, distribution andtransmission plant held for future use as well as other property held by non-utility subsidiaries.
Pepco Holdings’ utility subsidiaries use separate depreciation rates for each electric plant account. The ratesvary from jurisdiction to jurisdiction.
Gain on Sale of Assets
In August 2005, Pepco sold for $75 million in cash 384,051 square feet of excess non-utility land owned byPepco located at Buzzard Point in the District of Columbia. The sale resulted in a pre-tax gain of $68.1 millionwhich was recorded as a reduction of Operating Expenses in the Consolidated Statements of Earnings.
In 2004, PHI recorded pre-tax gains of $14.7 million from the condemnation settlement with the City ofVineland relating to the transfer of its distribution assets and customer accounts, $8.3 million on the sale ofaircraft investments by PCI, and $6.6 million on the sale of land.
Jointly Owned Plant
PHI’s Consolidated Balance Sheet includes its proportionate share of assets and liabilities related to jointlyowned plant. PHI’s subsidiaries have ownership interests in electric generating plants, transmission facilities, andother facilities in which various parties have ownership interests. PHI’s proportionate share of operating andmaintenance expenses of the jointly owned plant is included in the corresponding expenses in PHI’sConsolidated Statements of Earnings. PHI is responsible for providing its share of financing for the jointlyowned facilities. Information with respect to PHI’s share of jointly owned plant as of December 31, 2005 isshown below.
Jointly Owned PlantOwnership
Share
MegawattCapability
Owned
Plantin
ServiceAccumulatedDepreciation
ConstructionWork inProgress
(Millions of dollars)
Coal-Fired Electric Generating PlantsKeystone . . . . . . . . . . . . . . . . . . . . . . . . . . . . . . . 2.47% 42 $19.9 $ 6.5 $ .9Conemaugh . . . . . . . . . . . . . . . . . . . . . . . . . . . . . 3.83% 65 37.6 13.9 .9
Transmission Facilities . . . . . . . . . . . . . . . . . . . . . . . . Various 35.8 21.7 —Other Facilities . . . . . . . . . . . . . . . . . . . . . . . . . . . . . . . Various 5.1 1.9 —
Total . . . . . . . . . . . . . . . . . . . . . . . . . . . . . . . . . . . $98.4 $44.0 $ 1.8
As discussed in Note (12), Commitments and Contingencies, on November 15, 2005, ACE announced anagreement to sell its undivided interests in the Keystone and Conemaugh generating facilities to Duquesne LightHoldings Inc. for $173.1 million. The sale, subject to approval by the NJBPU, as well as other regulatoryagencies and certain other legal conditions, is expected to be completed mid-year 2006.
B-106

(6) PENSIONS AND OTHER POSTRETIREMENT BENEFITSPension Benefits
Pepco Holdings sponsors a defined benefit Retirement Plan that covers substantially all employees of Pepco,DPL, ACE and certain employees of other Pepco Holdings’ subsidiaries. Pepco Holdings also providessupplemental retirement benefits to certain eligible executive and key employees through nonqualified retirementplans.
Other Postretirement BenefitsPepco Holdings provides certain postretirement health care and life insurance benefits for eligible retired
employees. Certain employees hired on January 1, 2005 or later will not have company subsidized retireemedical coverage; however, they will be able to purchase coverage at full cost through PHI.
During 2004, PHI amended its postretirement health care plans for certain groups of eligible employeeseffective January 1, 2005 or January 1, 2006. The amendments included changes to coverage and retiree cost-sharing, and are reflected as a reduction in PHI’s 2004 net periodic benefit cost and a reduction of $42 million inthe projected benefit obligation at December 31, 2004.
Pepco Holdings uses a December 31 measurement date for its plans. Plan assets are stated at their marketvalue as of the measurement date, December 31. All dollar amounts in the following tables are in millions ofdollars.
Pension Benefits
OtherPostretirement
Benefits
2005 2004 2005 2004
Change in Benefit ObligationBenefit obligation at beginning of year . . . . . . . . . . . . . . . $1,648.0 $1,579.2 $593.5 $511.9Service cost . . . . . . . . . . . . . . . . . . . . . . . . . . . . . . . . . . . . 37.9 35.9 8.5 8.6Interest cost . . . . . . . . . . . . . . . . . . . . . . . . . . . . . . . . . . . . 96.1 94.7 33.6 35.4Amendments . . . . . . . . . . . . . . . . . . . . . . . . . . . . . . . . . . . — — — (42.4)Actuarial loss . . . . . . . . . . . . . . . . . . . . . . . . . . . . . . . . . . . 81.1 51.4 12.8 117.0Benefits paid . . . . . . . . . . . . . . . . . . . . . . . . . . . . . . . . . . . (117.1) (113.2) (38.2) (37.0)
Benefit obligation at end of year . . . . . . . . . . . . . . . . . . . . $1,746.0 $1,648.0 $610.2 $593.5
Change in Plan AssetsFair value of plan assets at beginning of year . . . . . . . . . . $1,523.5 $1,462.8 $164.9 $145.2Actual return on plan assets . . . . . . . . . . . . . . . . . . . . . . . 106.4 161.1 10.0 15.7Company contributions . . . . . . . . . . . . . . . . . . . . . . . . . . . 65.6 12.8 37.0 41.0Benefits paid . . . . . . . . . . . . . . . . . . . . . . . . . . . . . . . . . . . (117.1) (113.2) (38.2) (37.0)
Fair value of plan assets at end of year . . . . . . . . . . . . . . . $1,578.4 $1,523.5 $173.7 $164.9
The following table provides a reconciliation of the projected benefit obligation, plan assets and fundedstatus of the plans.
Pension BenefitsOther Postretirement
Benefits
2005 2004 2005 2004
Fair value of plan assets at end of year . . . . . . . . . . . . . . $1,578.4 $1,523.5 $ 173.7 $ 164.9Benefit obligation at end of year . . . . . . . . . . . . . . . . . . 1,746.0 1,648.0 610.2 593.5
Funded status (plan assets less than plan obligations) . . (167.6) (124.5) (436.5) (428.6)
Amounts not recognized:Unrecognized net actuarial loss . . . . . . . . . . . . . . . 350.5 261.2 188.6 188.5Unrecognized prior service cost . . . . . . . . . . . . . . . 1.9 3.0 (26.2) (29.5)
Net amount recognized . . . . . . . . . . . . . . . . . . . . . . . . . . $ 184.8 $ 139.7 $(274.1) $(269.6)
B-107

The following table provides a reconciliation of the amounts recognized in PHI’s Consolidated BalanceSheet as of December 31:
Pension BenefitsOther Postretirement
Benefits
2005 2004 2005 2004
Prepaid benefit cost . . . . . . . . . . . . . . . . . . . . . . . . . . . . . . . $208.9 $165.7 $ — $ —Accrued benefit cost . . . . . . . . . . . . . . . . . . . . . . . . . . . . . . . (24.1) (26.0) (274.1) (269.6)Additional minimum liability for nonqualified plan . . . . . . (12.2) (7.0) — —Intangible assets for nonqualified plan . . . . . . . . . . . . . . . . . .1 .1 — —Accumulated other comprehensive income for nonqualified
plan . . . . . . . . . . . . . . . . . . . . . . . . . . . . . . . . . . . . . . . . . . 12.1 6.9 — —
Net amount recognized . . . . . . . . . . . . . . . . . . . . . . . . . . . . . $184.8 $139.7 $(274.1) $(269.6)
The accumulated benefit obligation for the Retirement Plan (the qualified defined benefit pension plan) was$1,556.2 million and $1,462.9 million at December 31, 2005, and 2004, respectively. The table below providesthe projected benefit obligation, accumulated benefit obligation and fair value of plan assets for the PHInonqualified pension plan with an accumulated benefit obligation in excess of plan assets at December 31, 2005and 2004.
Pension Benefits
2005 2004
Projected benefit obligation for nonqualified plan . . . . . . . . . . . . . . . . . . . . . . . . . . . . $38.6 $35.3Accumulated benefit obligation for nonqualified plan . . . . . . . . . . . . . . . . . . . . . . . . . $36.3 $32.9Fair value of plan assets for nonqualified plan . . . . . . . . . . . . . . . . . . . . . . . . . . . . . . . — —
In 2005 and 2004, PHI was required to recognize an additional minimum liability and an intangible assetrelated to its nonqualified pension plan as prescribed by SFAS No. 87. The liability was recorded as a reductionto shareholders’ equity (other comprehensive income), and the equity will be restored to the balance sheet infuture periods when the accrued benefit liability exceeds the accumulated benefit obligation at futuremeasurement dates. The amount of reduction to shareholders’ equity (net of income taxes) in 2005 was $7.3million and in 2004 was $4.1 million. The recording of this reduction did not affect net income or cash flows in2005 or 2004 or compliance with debt covenants.
The table below provides the components of net periodic benefit costs recognized for the years endedDecember 31.
Pension BenefitsOther Postretirement
Benefits
2005 2004 2003 2005 2004 2003
Service cost . . . . . . . . . . . . . . . . . . . . . . $ 37.9 $ 35.9 $ 33.0 $ 8.5 $ 8.6 $ 9.5Interest cost . . . . . . . . . . . . . . . . . . . . . . 96.1 94.7 93.7 33.6 35.4 32.9Expected return on plan assets . . . . . . . . (125.5) (124.2) (106.2) (10.9) (9.9) (8.3)Amortization of prior service cost . . . . . 1.1 1.1 1.0 — — —Amortization of net loss . . . . . . . . . . . . . 10.9 6.5 13.9 8.0 9.5 8.0
Net periodic benefit cost . . . . . . . . . . . . $ 20.5 $ 14.0 $ 35.4 $ 39.2 $43.6 $42.1
The 2005 combined pension and other postretirement net periodic benefit cost of $59.7 million includes$28.9 million for Pepco, $(2.0) million for DPL and $16.9 million for ACE. The remaining net periodic benefitcost includes amounts for other PHI subsidiaries.
B-108

The 2004 combined pension and other postretirement net periodic benefit cost of $57.6 million includes$24.1 million for Pepco, $1.0 million for DPL and $17.6 million for ACE. The remaining net periodic benefitcost includes amounts for other PHI subsidiaries.
The 2003 combined pension and other postretirement net periodic benefit cost of $77.5 million includes$33.7 million for Pepco, $7.1 million for DPL and $20.8 million for ACE. The remaining net periodic benefitcost includes amounts for other PHI subsidiaries.
The following weighted average assumptions were used to determine the benefit obligations atDecember 31:
Pension BenefitsOther Postretirement
Benefits
2005 2004 2005 2004
Discount rate . . . . . . . . . . . . . . . . . . . . . . . . . . . . . . . . . . . . . . 5.625% 5.875% 5.625% 5.875%Rate of compensation increase . . . . . . . . . . . . . . . . . . . . . . . . 4.500% 4.500% 4.500% 4.500%Health care cost trend rate assumed for next year . . . . . . . . . n/a n/a 8.00% 9.00%Rate to which the cost trend rate is assumed to decline
(the ultimate trend rate) . . . . . . . . . . . . . . . . . . . . . . . . . . . 5.00% 5.00%Year that the rate reaches the ultimate trend rate . . . . . . . . . . 2009 2009
Assumed health care cost trend rates may have a significant effect on the amounts reported for the healthcare plans. A one-percentage-point change in assumed health care cost trend rates would have the followingeffects (millions of dollars):
1-Percentage-Point Increase
1-Percentage-Point Decrease
Effect on total of service and interest cost . . . . . . . . . . . . . . . . . . . . . . . $ 1.8 $ (1.7)Effect on postretirement benefit obligation . . . . . . . . . . . . . . . . . . . . . . . 27.0 (25.1)
The following weighted average assumptions were used to determine the net periodic benefit cost for yearsended December 31:
PensionBenefits
Other PostretirementBenefits
2005 2004 2005 2004
Discount rate . . . . . . . . . . . . . . . . . . . . . . . . . . . . . . . . . . . . . . 5.875% 6.250% 5.875% 6.250%Expected long-term return on plan assets . . . . . . . . . . . . . . . . 8.500% 8.750% 8.500% 8.750%Rate of compensation increase . . . . . . . . . . . . . . . . . . . . . . . . 4.500% 4.500% 4.500% 4.500%
A cash flow matched bond portfolio approach to developing a discount rate is used to value FAS 87 andFAS 106 liabilities. The hypothetical portfolio includes high quality instruments with maturities that mirror thebenefit obligations.
In selecting an expected rate of return on plan assets, PHI considers actual historical returns, economicforecasts and the judgment of its investment consultants on expected long-term performance for the types ofinvestments held by the plan. The plan assets consist of equity and fixed income investments, and when viewedover a long time horizon, are expected to yield a return on assets of 8.50%.
B-109

Plan Assets
Pepco Holdings’ Retirement Plan weighted-average asset allocations at December 31, 2005, and 2004, byasset category are as follows:
Plan Assetsat December 31 Target Plan
AssetAllocation
Minimum/Maximum2005 2004
Asset CategoryEquity securities . . . . . . . . . . . . . . . . . . . . . . . . . . . . . . . . . 62% 66% 60% 55% - 65%Debt securities . . . . . . . . . . . . . . . . . . . . . . . . . . . . . . . . . . . 37% 33% 35% 30% - 50%Other . . . . . . . . . . . . . . . . . . . . . . . . . . . . . . . . . . . . . . . . . . 1% 1% 5% 0% - 10%
Total . . . . . . . . . . . . . . . . . . . . . . . . . . . . . . . . . . . . . . . . . . . 100% 100% 100%
Pepco Holdings’ other postretirement plan weighted-average asset allocations at December 31, 2005, and2004, by asset category are as follows:
Plan Assetsat December 31 Target Plan
AssetAllocation
Minimum/Maximum2005 2004
Asset CategoryEquity securities . . . . . . . . . . . . . . . . . . . . . . . . . . . . . . . . 67% 65% 60% 55% - 65%Debt securities . . . . . . . . . . . . . . . . . . . . . . . . . . . . . . . . . . 24% 32% 35% 20% - 50%Cash . . . . . . . . . . . . . . . . . . . . . . . . . . . . . . . . . . . . . . . . . . 9% 3% 5% 0% - 10%
Total . . . . . . . . . . . . . . . . . . . . . . . . . . . . . . . . . . . . . . . . . . 100% 100% 100%
In developing an asset allocation policy for its Retirement Plan and Other Postretirement Plan, PHIexamined projections of asset returns and volatility over a long-term horizon. In connection with this analysis,PHI examined the risk/return tradeoffs of alternative asset classes and asset mixes given long-term historicalrelationships, as well as prospective capital market returns. PHI also conducted an asset/liability study to matchprojected asset growth with projected liability growth and provide sufficient liquidity for projected benefitpayments. By incorporating the results of these analyses with an assessment of its risk posture, and taking intoaccount industry practices, PHI developed its asset mix guidelines. Under these guidelines, PHI diversifies assetsin order to protect against large investment losses and to reduce the probability of excessive performancevolatility while maximizing return at an acceptable risk level. Diversification of assets is implemented byallocating monies to various asset classes and investment styles within asset classes, and by retaining investmentmanagement firm(s) with complementary investment philosophies, styles and approaches. Based on theassessment of demographics, actuarial/funding, and business and financial characteristics, PHI believes that itsrisk posture is slightly below average relative to other pension plans. Consequently, Pepco Holdings believes thata slightly below average equity exposure (i.e., a target equity asset allocation of 60%) is appropriate for theRetirement Plan and the Other Postretirement Plan.
On a periodic basis, Pepco Holdings reviews its asset mix and rebalances assets back to the target allocationover a reasonable period of time.
No Pepco Holdings common stock is included in pension or postretirement program assets.
Cash Flows
Contributions—Retirement Plan
Pepco Holdings’ funding policy with regard to the Retirement Plan is to maintain a funding level in excessof 100% with respect to its accumulated benefit obligation (ABO). PHI’s Retirement Plan currently meets the
B-110

minimum funding requirements of ERISA without any additional funding. In 2005 and 2004, PHI madediscretionary tax-deductible cash contributions to the plan of $60.0 million and $10.0 million, respectively, inline with its funding policy. Assuming no changes to the current pension plan assumptions, PHI projects nofunding will be required under ERISA in 2006; however, PHI may elect to make a discretionary tax-deductiblecontribution, if required to maintain its plan assets in excess of its ABO.
Contributions—Other Postretirement Benefits
In 2005, PHI combined its health and welfare plans and the existing IRC 501 (c) (9) Voluntary EmployeeBeneficiary Association (VEBA) trusts for Pepco, DPL and ACE to fund a portion of their estimatedpostretirement liabilities. Pepco funded the 2004 portion of its estimated liability for postretirement medical coststhrough the use of an Internal Revenue Code (IRC)401(h) account, within PHI’s Retirement Plan. The trust wasdepleted in 2004 and a VEBA will be used for future funding. In 2005 and 2004, Pepco contributed $3.1 millionand $4.7 million, respectively, DPL contributed $6.0 million and $9.5 million, respectively, and ACE contributed$7.0 million and $9.3 million, respectively, to the plans. Contributions of $6.4 million and $5.0 million,respectively, were made by other PHI subsidiaries. Assuming no changes to the other postretirement benefitpension plan assumptions, PHI expects similar amounts to be contributed in 2006.
Expected Benefit Payments
Estimated future benefit payments to participants in PHI’s qualified pension and postretirement welfarebenefit plans, which reflect expected future service as appropriate, as of December 31, 2005 are in millions ofdollars:
Years Pension Benefits Other Postretirement Benefits
2006 . . . . . . . . . . . . . . . . . . . . . . . . . . . $ 91.6 $ 37.22007 . . . . . . . . . . . . . . . . . . . . . . . . . . . 99.7 39.52008 . . . . . . . . . . . . . . . . . . . . . . . . . . . 102.2 41.72009 . . . . . . . . . . . . . . . . . . . . . . . . . . . 104.7 43.12010 . . . . . . . . . . . . . . . . . . . . . . . . . . . 106.1 44.3
2011 through 2015 . . . . . . . . . . . . . . . . . . . . . . 553.0 229.7
B-111

(7) DEBT
LONG-TERM DEBT
The components of long-term debt are shown below.
At December 31,
Interest Rate Maturity 2005 2004
(Millions of dollars)First Mortgage Bonds
Pepco:6.50% 2005 $ — $ 100.06.25% 2007 175.0 175.06.50% 2008 78.0 78.05.875% 2008 50.0 50.05.75% (a) 2010 16.0 16.04.95% (a) 2013 200.0 200.04.65% (a) 2014 175.0 175.06.00% (a) 2022 30.0 30.06.375% (a) 2023 37.0 37.05.375% (a) 2024 42.5 42.55.375% (a) 2024 38.3 38.37.375% 2025 — 75.05.75% (a) 2034 100.0 100.05.40% (a) 2035 175.0 —
DPL:7.71% 2025 — 100.0
ACE:6.18% – 7.15% 2005 – 2008 116.0 156.07.25% – 7.63% 2010 – 2014 8.0 8.06.63% 2013 68.6 68.67.68% 2015 – 2016 17.0 17.06.80% (a) 2021 38.9 38.95.60% (a) 2025 4.0 4.0Variable (a) 2029 54.7 54.75.80% (a) 2034 120.0 120.0
Amortizing First Mortgage BondsDPL:
6.95% 2005 – 2008 10.5 13.2
Total First Mortgage Bonds $1,554.5 $1,697.2
(a) Represents a series of First Mortgage Bonds issued by the indicated company as collateral for an outstandingseries of senior notes or tax-exempt bonds issued by the same company. The maturity date, optional andmandatory prepayment provisions, if any, interest rate, and interest payment dates on each series of seniornotes or tax-exempt bonds are identical to the terms of the collateral First Mortgage Bonds by which it issecured. Payments of principal and interest on a series of senior notes or tax-exempt bonds satisfy thecorresponding payment obligations on the related series of collateral First Mortgage Bonds. At such time asthere are no First Mortgage Bonds of an issuing company outstanding, other than collateral First MortgageBonds securing payment of senior notes and tax-exempt bonds, each outstanding series of senior notes andtax-exempt bonds of the company will automatically cease to be secured by the corresponding series ofcollateral First Mortgage Bonds and all of the outstanding collateral First Mortgage Bonds of the company willbe cancelled. Because each series of senior notes and tax-exempt bonds and the series of collateral FirstMortgage Bonds securing that series of senior notes or tax-exempt bonds effectively represents a singlefinancial obligation, the senior notes and the tax-exempt bonds are not separately shown on the table.
NOTE: Schedule is continued on next page.
B-112

At December 31,
Interest Rate Maturity 2005 2004
(Millions of dollars)
Unsecured Tax-Exempt BondsDPL:
5.20% 2019 $ 31.0 $ 31.03.15% 2023 18.2 18.25.50% 2025 15.0 15.04.90% 2026 34.5 34.55.65% 2028 16.2 16.2Variable 2030 – 2038 93.4 93.4
Total Unsecured Tax-Exempt Bonds 208.3 208.3
Medium-Term Notes (unsecured)Pepco:
7.64% 2007 35.0 35.06.25% 2009 50.0 50.0
DPL:6.75% 2006 20.0 20.07.06% – 8.13% 2007 61.5 61.57.56% – 7.58% 2017 14.0 14.06.81% 2018 4.0 4.07.61% 2019 12.0 12.07.72% 2027 10.0 10.0
ACE:7.52% 2007 15.0 15.0
Conectiv:5.30% 2005 — 250.06.73% 2006 — 50.0
Total Medium-Term Notes (unsecured) $221.5 $521.5
NOTE: Schedule is continued on next page.
B-113

At December 31,
Interest Rate Maturity 2005 2004
(Millions of dollars)
Recourse DebtPCI:
6.59% – 6.69% 2005 – 2014 $ 11.1 $ 71.17.62% 2007 34.3 34.36.57% 2008 92.0 92.0
Total Recourse Debt 137.4 197.4
Notes (secured)Pepco Energy Services:
7.85% 2017 9.2 9.2
Notes (unsecured)PHI:
3.75% 2006 300.0 300.05.50% 2007 500.0 500.0Variable 2010 250.0 —4.00% 2010 200.0 200.06.45% 2012 750.0 750.07.45% 2032 250.0 250.0
PepcoVariable 2006 50.0 100.0
DPL:5.0% 2014 100.0 100.05.0% 2015 100.0 —
Total Notes (unsecured) 2,500.0 2,200.0
Nonrecourse debtPCI:
6.60% 2018 15.9 17.1
Acquisition fair value adjustment .1 .2
Total Long-Term Debt 4,646.9 4,850.9Net unamortized discount (5.9) (6.1)Current maturities of long-term debt (438.1) (482.7)
Total Net Long-Term Debt $4,202.9 $4,362.1
Transition Bonds Issued by ACE Funding2.89% 2010 $ 55.2 $ 75.22.89% 2011 31.3 39.44.21% 2013 66.0 66.04.46% 2016 52.0 52.04.91% 2017 118.0 118.05.05% 2020 54.0 54.05.55% 2023 147.0 147.0
Total 523.5 551.6Net unamortized discount (.2) (.2)
Current maturities of long-term debt (29.0) (28.1)
Total Transition Bonds issued by ACE Funding $ 494.3 $ 523.3
B-114

The outstanding First Mortgage Bonds issued by each of Pepco, DPL and ACE are secured by a lien onsubstantially all of the issuing company’s property, plant and equipment.
Atlantic City Electric Transition Funding L.L.C. (ACE Funding) was established in 2001 solely for thepurpose of securitizing authorized portions of ACE’s recoverable stranded costs through the issuance and sale ofbonds (Transition Bonds). The proceeds of the sale of each series of Transition Bonds have been transferred toACE in exchange for the transfer by ACE to ACE Funding of the right to collect a non-bypassable transitionbond charge from ACE customers pursuant to bondable stranded costs rate orders issued by the NJBPU in anamount sufficient to fund the principal and interest payments on the Transition Bonds and related taxes, expensesand fees (Bondable Transition Property). The assets of ACE Funding, including the Bondable TransitionProperty, and the Transition Bond charges collected from ACE’s customers, are not available to creditors ofACE. The holders of Transition Bonds have recourse only to the assets of ACE Funding.
The aggregate amounts of maturities for long-term debt and Transition Bonds outstanding at December 31,2005, are $467.1 million in 2006, $854.8 million in 2007, $323.6 million in 2008, $82.2 million in 2009, $531.9million in 2010, and $2,910.7 million thereafter.
Pepco Energy Services Notes, referred to as “Project Funding Secured by Customer Accounts Receivable”(Project Funding) represent funding for energy savings contracts performed by Pepco Energy Services. Theaggregate amounts of maturities for the Project Funding debt outstanding at December 31, 2005, are $2.5 millionin 2006, zero in 2007, $1.0 million in 2008, zero in 2009, $2.1 million in 2010, and $22.4 million thereafter, andincludes the current portion of project funding that was provided in exchange for the sale of the customers’accounts receivable.
SHORT-TERM DEBT
Pepco Holdings and its regulated utility subsidiaries have traditionally used a number of sources to fulfillshort-term funding needs, such as commercial paper, short-term notes, and bank lines of credit. Proceeds fromshort-term borrowings are used primarily to meet working capital needs, but may also be used to temporarilyfund long-term capital requirements. A detail of the components of Pepco Holdings’ short-term debt atDecember 31, 2005 and 2004 is as follows.
2005 2004
(Millions of dollars)
Commercial paper . . . . . . . . . . . . . . . . . . . . . . . . . . . . . . . . . . . . . . . . . . . $ — $111.3Floating rate note . . . . . . . . . . . . . . . . . . . . . . . . . . . . . . . . . . . . . . . . . . . . — 50.0Variable rate demand bonds . . . . . . . . . . . . . . . . . . . . . . . . . . . . . . . . . . . 156.4 158.4
Total . . . . . . . . . . . . . . . . . . . . . . . . . . . . . . . . . . . . . . . . . . . . . . . . . $156.4 $319.7
Commercial Paper
Pepco Holdings maintains an ongoing commercial paper program of up to $700 million. Pepco, DPL, andACE have ongoing commercial paper programs of up to $300 million, $275 million, and $250 million,respectively. The commercial paper programs of PHI, Pepco, DPL and ACE are backed by a $1.2 billion creditfacility, which is described under the heading “Credit Facility” below.
Pepco Holdings, Pepco, DPL and ACE had no commercial paper outstanding at December 31, 2005. Theweighted average interest rate for commercial paper issued during 2005 was 3.02%. Interest rates for commercialpaper issued during 2004 ranged from 1.05% to 2.63%. The weighted average maturity was two days for allcommercial paper issued during 2005.
B-115

Floating Rate Note
In December 2004, Pepco Holdings issued a $50 million floating rate note that was paid at maturity inDecember 2005. The weighted average interest rate on this note was 3.61%.
Variable Rate Demand Bonds
Variable Rate Demand Bonds (“VRDB”) are subject to repayment on the demand of the holders and for thisreason are accounted for as short-term debt in accordance with GAAP. However, bonds submitted for purchaseare remarketed by a remarketing agent on a best efforts basis. PHI expects that the bonds submitted for purchasewill continue to be remarketed successfully due to the credit worthiness of the issuing company and because theremarketing resets the interest rate to the then-current market rate. The issuing company also may utilize one ofthe fixed rate/fixed term conversion options of the bonds to establish a maturity which corresponds to the date offinal maturity of the bonds. On this basis, PHI views VRDBs as a source of long-term financing. The VRDBsoutstanding in 2005 and 2004 mature in 2006 to 2009 ($10.5 million), 2014 to 2017 ($48.6 million), 2024 ($33.3million) and 2028 to 2031 ($64.0 million). The weighted average interest rate for VRDB was 2.61% during 2005and interest rates ranged from .82% to 2.47% in 2004.
Credit Facility
In May 2005, Pepco Holdings, Pepco, DPL and ACE entered into a five-year credit agreement with anaggregate borrowing limit of $1.2 billion. This agreement replaces a $650 million five-year credit agreement thatwas entered into in July 2004 and a $550 million three-year credit agreement entered into in July 2003. PepcoHoldings’ credit limit under this agreement is $700 million. The credit limit of each of Pepco, DPL and ACE isthe lower of $300 million and the maximum amount of debt the company is permitted to have outstanding by itsregulatory authorities, except that the aggregate amount of credit used by Pepco, DPL and ACE at any given timeunder the agreement may not exceed $500 million. Under the terms of the credit agreement, the companies areentitled to request increases in the principal amount of available credit up to an aggregate increase of $300million, with any such increase proportionately increasing the credit limit of each of the respective borrowers andthe $300 million sublimits for each of Pepco, DPL and ACE. The interest rate payable by the respectivecompanies on utilized funds is determined by a pricing schedule with rates corresponding to the credit rating ofthe borrower. Any indebtedness incurred under the credit agreement would be unsecured.
The credit agreement is intended to serve primarily as a source of liquidity to support the commercial paperprograms of the respective companies. The companies also are permitted to use the facility to borrow funds forgeneral corporate purposes and issue letters of credit. In order for a borrower to use the facility, certainrepresentations and warranties made by the borrower at the time the credit agreement was entered into also mustbe true at the time the facility is utilized, and the borrower must be in compliance with specified covenants,including the financial covenant described below. However, a material adverse change in the borrower’sbusiness, property, and results of operations or financial condition subsequent to the entry into the creditagreement is not a condition to the availability of credit under the facility. Among the covenants contained in thecredit agreement are (i) the requirement that each borrowing company maintain a ratio of total indebtedness tototal capitalization of 65% or less, computed in accordance with the terms of the credit agreement, (ii) arestriction on sales or other dispositions of assets, other than sales and dispositions permitted by the creditagreement, and (iii) a restriction on the incurrence of liens on the assets of a borrower or any of its significantsubsidiaries other than liens permitted by the credit agreement. The failure to satisfy any of the covenants or theoccurrence of specified events that constitute an event of default could result in the acceleration of the repaymentobligations of the borrower. The events of default include (i) the failure of any borrowing company or any of itssignificant subsidiaries to pay when due, or the acceleration of, certain indebtedness under other borrowingarrangements, (ii) certain bankruptcy events, judgments or decrees against any borrowing company or itssignificant subsidiaries, and (iii) a change in control (as defined in the credit agreement) of Pepco Holdings or thefailure of Pepco Holdings to own all of the voting stock of Pepco, DPL and ACE. The agreement does notinclude any ratings triggers. There were no balances outstanding at December 31, 2005 and 2004.
B-116

(8) INCOME TAXES
PHI and the majority of its subsidiaries file a consolidated federal income tax return. Federal income taxesare allocated among PHI and its subsidiaries included in its consolidated group pursuant to a written tax sharingagreement which was approved by the SEC pursuant to regulations under PUHCA 1935 in connection with theestablishment of PHI as a holding company as part of Pepco’s acquisition of Conectiv on August 1, 2002. Underthis tax sharing agreement, PHI’s consolidated Federal income tax liability is allocated based upon PHI’s and itssubsidiaries’ separate taxable income or loss, with the exception of the tax benefits applicable to non-acquisitiondebt expenses of PHI. Such tax benefits are allocated only to subsidiaries with taxable income.
The provision for income taxes, reconciliation of consolidated income tax expense, and components ofconsolidated deferred tax liabilities (assets) are shown below.
Provision for Income Taxes
For the Year Ended December 31,
2005 2004 2003
(Millions of dollars)
OperationsCurrent Tax Expense (Benefit)
Federal . . . . . . . . . . . . . . . . . . . . . . . . . . . . . . . . . . . . . . . . . . . . . . . $236.2 $ (33.2) $(130.3)State and local . . . . . . . . . . . . . . . . . . . . . . . . . . . . . . . . . . . . . . . . . 81.9 (9.0) 36.0
Total Current Tax (Benefit) Expense . . . . . . . . . . . . . . . . . . . . . . . . . . . 318.1 (42.2) (94.3)
Deferred Tax (Benefit) ExpenseFederal . . . . . . . . . . . . . . . . . . . . . . . . . . . . . . . . . . . . . . . . . . . . . . . (24.4) 185.1 172.6State and local . . . . . . . . . . . . . . . . . . . . . . . . . . . . . . . . . . . . . . . . . (33.4) 32.4 (10.9)Investment tax credits . . . . . . . . . . . . . . . . . . . . . . . . . . . . . . . . . . . (5.1) (8.0) (5.3)
Total Deferred Tax (Benefit) Expense . . . . . . . . . . . . . . . . . . . . . . . . . . (62.9) 209.5 156.4
Total Income Tax Expense from Operations . . . . . . . . . . . . . . . . . . . . . $255.2 $167.3 $ 62.1
Extraordinary ItemDeferred Tax Expense
Federal . . . . . . . . . . . . . . . . . . . . . . . . . . . . . . . . . . . . . . . . . . . . . . . 4.8 — 3.2State and local . . . . . . . . . . . . . . . . . . . . . . . . . . . . . . . . . . . . . . . . . 1.4 — .9
Total Deferred Tax on Extraordinary Item . . . . . . . . . . . . . . . . . . . . . . . 6.2 — 4.1
Total Income Tax Expense . . . . . . . . . . . . . . . . . . . . . . . . . . . . . . . . . . . $261.4 $167.3 $ 66.2
B-117

Reconciliation of Consolidated Income Tax Expense
For the Year Ended December 31,
2005 2004 2003
Amount Rate Amount Rate Amount Rate
(Millions of dollars)
Income Before Income Taxes . . . . . . . . . . . . . . . . . . . . . . . . . . . . . $617.4 $427.9 $163.5Preferred dividends . . . . . . . . . . . . . . . . . . . . . . . . . . . . . . . . . . . . . 2.5 2.8 4.7
Income Before Income Taxes . . . . . . . . . . . . . . . . . . . . . . . . . . . . . $619.9 $430.7 $168.2
Income tax at federal statutory rate . . . . . . . . . . . . . . . . . . . . . . . . $217.1 .35 $150.7 .35 $ 58.9 .35Increases (decreases) resulting from
Depreciation . . . . . . . . . . . . . . . . . . . . . . . . . . . . . . . . . . . . . . 7.8 .01 9.4 .02 8.2 .05Asset removal costs . . . . . . . . . . . . . . . . . . . . . . . . . . . . . . . . (3.3) (.01) (1.7) — (4.6) (.02)State income taxes, net of federal effect . . . . . . . . . . . . . . . . . 30.8 .05 27.4 .06 15.9 .09Tax credits . . . . . . . . . . . . . . . . . . . . . . . . . . . . . . . . . . . . . . . (4.7) (.01) (5.9) (.01) (5.1) (.03)Cumulative effect of local tax consolidation . . . . . . . . . . . . . — — (13.2) (.03) — —IRS settlement . . . . . . . . . . . . . . . . . . . . . . . . . . . . . . . . . . . . — — 19.7 .05 — —Company dividends reinvested in 401(k) plan . . . . . . . . . . . . (2.1) — (2.1) — (1.4) (.01)Leveraged leases . . . . . . . . . . . . . . . . . . . . . . . . . . . . . . . . . . . (7.8) (.01) (8.2) (.02) (8.2) (.05)Adjustment to estimates related to prior years under audit . . 17.9 .03 (1.0) (.01) — —Other . . . . . . . . . . . . . . . . . . . . . . . . . . . . . . . . . . . . . . . . . . . . (0.5) — (7.8) (.02) (1.6) (.01)
Total Income Tax Expense . . . . . . . . . . . . . . . . . . . . . . . . . . . . . . . $255.2 .41 $167.3 .39 $ 62.1 .37
Components of Consolidated Deferred Tax Liabilities (Assets)
At December 31,
2005 2004
(Millions of dollars)
Deferred Tax Liabilities (Assets)Depreciation and other book to tax basis differences . . . . . . . . . . . . . . . . . . . . . . . . . . . $1,630.8 $1,709.8Deferred taxes on amounts to be collected through future rates . . . . . . . . . . . . . . . . . . . 53.5 57.1Deferred investment tax credit . . . . . . . . . . . . . . . . . . . . . . . . . . . . . . . . . . . . . . . . . . . . (29.4) (30.9)Contributions in aid of construction . . . . . . . . . . . . . . . . . . . . . . . . . . . . . . . . . . . . . . . . (57.9) (56.9)Goodwill, accumulated other comprehensive income, and valuation adjustments . . . . (116.8) (161.4)Deferred electric service and electric restructuring liabilities . . . . . . . . . . . . . . . . . . . . (21.7) (5.2)Finance and operating leases . . . . . . . . . . . . . . . . . . . . . . . . . . . . . . . . . . . . . . . . . . . . . . 516.9 434.8NUG contracts . . . . . . . . . . . . . . . . . . . . . . . . . . . . . . . . . . . . . . . . . . . . . . . . . . . . . . . . . 77.3 82.1Capital loss carryforward . . . . . . . . . . . . . . . . . . . . . . . . . . . . . . . . . . . . . . . . . . . . . . . . (1.2) (14.3)Federal net operating loss . . . . . . . . . . . . . . . . . . . . . . . . . . . . . . . . . . . . . . . . . . . . . . . . (64.7) (65.7)Federal Alternative Minimum Tax credit . . . . . . . . . . . . . . . . . . . . . . . . . . . . . . . . . . . . (6.9) (5.6)State net operating loss . . . . . . . . . . . . . . . . . . . . . . . . . . . . . . . . . . . . . . . . . . . . . . . . . . (54.0) (63.7)Valuation allowance (State NOLs) . . . . . . . . . . . . . . . . . . . . . . . . . . . . . . . . . . . . . . . . . 30.0 33.9Other postretirement benefits . . . . . . . . . . . . . . . . . . . . . . . . . . . . . . . . . . . . . . . . . . . . . (43.4) (36.2)Unrealized losses on fair value declines . . . . . . . . . . . . . . . . . . . . . . . . . . . . . . . . . . . . . (13.3) (6.2)Property taxes, contributions to pension plan, and other . . . . . . . . . . . . . . . . . . . . . . . . (51.4) 11.5
Total Deferred Tax Liabilities, Net . . . . . . . . . . . . . . . . . . . . . . . . . . . . . . . . . . . . . . . . . . . . . 1,847.8 1,883.1Deferred tax assets included in Other Current Assets . . . . . . . . . . . . . . . . . . . . . . . . . . . . . . . 87.2 70.2
Total Deferred Tax Liabilities, Net Non-Current . . . . . . . . . . . . . . . . . . . . . . . . . . . . . . . . . . $1,935.0 $1,953.3
B-118

The net deferred tax liability represents the tax effect, at presently enacted tax rates, of temporarydifferences between the financial statement and tax basis of assets and liabilities. The portion of the net deferredtax liability applicable to PHI’s operations, which has not been reflected in current service rates, representsincome taxes recoverable through future rates, net and is recorded as a regulatory asset on the balance sheet.
The Tax Reform Act of 1986 repealed the Investment Tax Credit (ITC) for property placed in service afterDecember 31, 1985, except for certain transition property. ITC previously earned on Pepco’s, DPL’s and ACE’sproperty continues to be normalized over the remaining service lives of the related assets.
PHI files a consolidated federal income tax return. PHI’s federal income tax liabilities for Pepco legacycompanies for all years through 2000, and for Conectiv legacy companies for all years through 1997, have beendetermined, subject to adjustment to the extent of any net operating loss or other loss or credit carrybacks fromsubsequent years.
Non Financial Lease Asset
The IRS, as part of its normal audit of PHI’s income tax returns, has questioned whether PHI is entitled tocertain ongoing tax deductions being taken by PHI as a result of the adoption by PHI of a carry-over tax basis fora non-lease financial asset acquired in 1998 by a subsidiary of PHI. On December 14, 2004, PHI and the IRSagreed to a Notice of Proposed Adjustment settling this and certain other tax matters. This settlement will resultin a cash outlay during 2006 for additional taxes and interest of approximately $23.3 million associated with theexamination of PHI’s 2001-2002 tax returns and an anticipated refund of taxes and interest of approximately $7.1million when the examination of PHI’s 2003 return is completed. In addition, in the fourth quarter of 2004, PHItook a tax charge to earnings of approximately $19.7 million for financial reporting purposes related to thismatter. The charge consisted of approximately $16.3 million to reflect the reversal of tax benefits recognized byPHI prior to September 30, 2004, and approximately $3.4 million of interest on the additional taxes. During 2005PHI recorded a tax charge to earnings of approximately $.9 million for interest on the additional taxes.
Taxes Other Than Income Taxes
Taxes other than income taxes for each year are shown below. The majority of these amounts relate to thePower Delivery businesses and are recoverable through rates.
2005 2004 2003
(Millions of dollars)
Gross Receipts/Delivery . . . . . . . . . . . . . . . . . . . . . . . . . . . . . . . . . . . . . . $148.3 $138.1 $138.4Property . . . . . . . . . . . . . . . . . . . . . . . . . . . . . . . . . . . . . . . . . . . . . . . . . . 60.4 60.1 57.6County Fuel and Energy . . . . . . . . . . . . . . . . . . . . . . . . . . . . . . . . . . . . . . 89.0 70.6 36.7Environmental, Use and Other . . . . . . . . . . . . . . . . . . . . . . . . . . . . . . . . . 44.5 42.6 39.5
Total . . . . . . . . . . . . . . . . . . . . . . . . . . . . . . . . . . . . . . . . . . . . . . . . . $342.2 $311.4 $272.2
B-119

(9) PREFERRED STOCK OF SUBSIDIARIES
Preferred stock amounts outstanding as of December 31, 2005 and 2004 are as follows:
Issuer and SeriesRedemption
Price
Shares Outstanding December 31,
2005 2004 2005 2004
(Millions ofdollars)
Serial Preferred (1)Pepco . . . . . . . . . . . . . . . . . . . . $2.44 Series of 1957 $ 51.00 216,846 239,641 $10.9 $12.0Pepco . . . . . . . . . . . . . . . . . . . . $2.46 Series of 1958 $ 51.00 99,789 173,892 5.0 8.7Pepco . . . . . . . . . . . . . . . . . . . . $2.28 Series of 1965 $ 51.00 112,709 125,857 5.6 6.3
$21.5 $27.0
Redeemable Serial PreferredACE . . . . . . . . . . . . . . . . . . . . . $100 per share par value,
4.00% – 5.00% $100 – $105.5 62,145 62,305 $ 6.2 $ 6.2DPL . . . . . . . . . . . . . . . . . . . . . $100 per share par value,
3.70% – 5.00%6.75% (2)
$ 103 – $105$100
181,698—
181,69835,000
18.2—
18.23.5
$24.4 $27.9
(1) In September and October of 2004, Pepco redeemed 81,400 and 84,502 shares, respectively, of its $2.28Series 1965 Serial Preferred Stock for aggregate redemption amounts of $4.1 million and $4.2 million,respectively. In October 2005, Pepco redeemed 74,103 shares of its $2.46 Series 1958 Serial PreferredStock, 13,148 shares of its $2.28 Series 1965 Serial Preferred Stock and 22,795 shares of its $2.44 Series1957 Serial Preferred Stock for an aggregate redemption amount of $3.7 million, $.7 million and $1.1million, respectively. On March 1, 2006, Pepco redeemed all outstanding shares of its Serial Preferred Stockof each series, at 102% of par, for an aggregate redemption amount of $21.9 million.
(2) In December 2005, DPL redeemed all outstanding shares of its 6.75% Serial Preferred Stock, at par, for anaggregate redemption amount of $3.5 million.
(10) STOCK-BASED COMPENSATION, DIVIDEND RESTRICTIONS, AND CALCULATIONS OFEARNINGS PER SHARE OF COMMON STOCK
Stock-Based Compensation
PHI maintains a Long-Term Incentive Plan (LTIP), the objective of which is to increase shareholder valueby providing a long-term incentive to reward officers, key employees, and directors of Pepco Holdings and itssubsidiaries and to increase the ownership of Pepco Holdings’ common stock by such individuals. Any officer orkey employee of Pepco Holdings or its subsidiaries may be designated by the Board as a participant in the LTIP.Under the LTIP, awards to officers and key employees may be in the form of restricted stock, options,performance units, stock appreciation rights, and dividend equivalents. Up to 10,000,000 shares of common stockinitially were available for issuance under the LTIP over a period of 10 years commencing August 1, 2002.
Prior to acquisition of Conectiv by Pepco, each company had a long-term incentive plan under which stockoptions were granted. At the time of the acquisition, certain Conectiv options vested and were canceled inexchange for a cash payment. Certain other Conectiv options were exchanged on a 1 for 1.28205 basis for PepcoHoldings stock options under the LTIP: 590,198 Conectiv stock options were converted into 756,660 PepcoHoldings stock options. The Conectiv stock options were originally granted on January 1, 1998, January 1,1999, July 1, 1999, October 18, 2000, and January 1, 2002, in each case with an exercise price equal to themarket price (fair value) of the Conectiv stock on the date of the grant. The exercise prices of these options, afteradjustment to give effect to the conversion ratio of Conectiv stock for Pepco Holdings stock, are $17.81, $18.91,$19.30, $13.08 and $19.03, respectively. All of the Pepco Holdings options received in exchange for theConectiv options are exercisable.
B-120

At the time of the acquisition of Conectiv by Pepco, outstanding Pepco options were exchanged on aone-for-one basis for Pepco Holdings stock options granted under the LTIP. The options were originally grantedunder Pepco’s long-term incentive plan in May 1998, May 1999, January 2000, May 2000, January 2001, May2001, January 2002, and May 2002. The exercise prices of the options are $24.3125, $29.78125, $22.4375,$23.15625, $24.59, $21.825, $22.57 and $22.685, respectively, which represent the market prices (fair values) ofthe Pepco common stock on its original grant dates. All the options granted in May 1998, May 1999, January2000, May 2000, January 2001, and May 2001 are exercisable. Seventy-five percent of the options granted onJanuary 1, 2002 are exercisable and the remaining options became exercisable on January 1, 2006. Seventy-fivepercent of the options granted on May 1, 2002 are exercisable and the remaining options will become exercisableon May 1, 2006.
Stock option activity for the three years ended December 31 is summarized below. The informationpresented in the table is for Pepco Holdings, including converted Pepco and Conectiv options.
2005 2004 2003
Numberof
Options
WeightedAverage
Price
Numberof
Options
WeightedAverage
Price
Numberof
Options
WeightedAverage
Price
Beginning-of-year balance . . . . . . . . . . . 2,063,754 $21.8841 2,115,037 $21.8131 2,122,601 $21.8031Options granted . . . . . . . . . . . . . . . . . . . — $ — — $ — — $ —Options exercised . . . . . . . . . . . . . . . . . . 196,299 $18.9834 41,668 $18.9385 — $ —Options forfeited . . . . . . . . . . . . . . . . . . 3,205 $19.0300 9,615 $19.0300 7,564 $19.0300End-of-year balance . . . . . . . . . . . . . . . . 1,864,250 $22.1944 2,063,754 $21.8841 2,115,037 $21.8131Exercisable at end of year . . . . . . . . . . . 1,814,350 $22.1840 1,739,032 $21.9944 1,211,448 $22.8386
As of December 31, 2005, an analysis of options outstanding by exercise prices is as follows:
Range ofExercise Prices
Number OutstandingAt December 31, 2005
Weighted AverageExercise Price
Weighted AverageRemaining
Contractual Life
$13.08 to $19.30 . . . . . . . . . . . . . . . 498,309 18.8036 6.4$21.83 to $29.78 . . . . . . . . . . . . . . . 1,365,941 23.4314 4.6
$13.08 to $29.78 . . . . . . . . . . . . . . . 1,864,250 22.1944 5.1
Pepco Holdings recognizes compensation costs for the LTIP based on the accounting prescribed by APBNo. 25, “Accounting for Stock Issued to Employees.” There were no stock-based employee compensation costscharged to expense in 2005, 2004 and 2003 with respect to stock options granted under the LTIP.
There were no options granted in 2005, 2004, or 2003.
The Performance Restricted Stock Program and the Merger Integration Success Program have beenestablished under the LTIP. Under the Performance Restricted Stock Program, performance criteria are selectedand measured over a three-year period. The target number of share award opportunities established in 2001 underPepco’s Performance Restricted Stock Program, a component of the LTIP, for performance periods 2002-2004was 57,000. The target number of share award opportunities established in 2005, 2004 and 2003 under PepcoHoldings’ Performance Restricted Stock Program for performance periods 2006-2008, 2005-2007 and 2004-2006were 218,108, 247,400 and 292,100, respectively. The fair value per share on award date for the performancerestricted stock was $22.235 for the 2006-2008 award, $21.060 for the 2005-2007 award, and $19.695 for the2004-2006 award. Depending on the extent to which the performance criteria are satisfied, the executives areeligible to earn shares of common stock under the Performance Restricted Stock Program ranging from 0% to200% of the target share award opportunities. No awards were earned with respect to the 2003-2005 share awardopportunity.
B-121

The maximum number of share award opportunities granted under the Merger Integration Success Programduring 2002 was 241,075. The fair value per share on grant date was $19.735. Of those shares, 96,427 wererestricted and have time-based vesting over three years: 20% vested in 2003, 30% vested in 2004, and 50%vested in 2005. The remaining 144,648 shares are performance-based award opportunities that may be earnedbased on the extent to which operating efficiencies and expense reduction goals were attained throughDecember 31, 2003 and 2004, respectively. Although the goals were met in 2003, it was determined that 63,943shares, including shares reallocated from participants who did not meet performance goals as well as sharesreflecting accrued dividends for the period August 1, 2002 to December 31, 2003, granted to certain executives,would not vest until 2005, and then only if the cost reduction goals were maintained and Pepco Holdings’financial performance were satisfactory. A total of 9,277 shares of common stock vested under this program onDecember 31, 2003 for other eligible employees. On March 11, 2005, 70,315 shares, including reinvesteddividends, vested for the performance period ending on December 31, 2004. A total of 44,644 shares, includingreinvested dividends, vested on March 7, 2006, for the original performance period ended December 31, 2003,that was extended to December 31, 2005.
Under the LTIP, non-employee directors are entitled to a grant on May 1 of each year of a non-qualifiedstock option for 1,000 shares of common stock. However, the Board of Directors has determined that these grantswill not be made.
On August 1, 2002, the date of the acquisition of Conectiv by Pepco, in accordance with the terms of themerger agreement, 80,602 shares of Conectiv performance accelerated restricted stock (PARS) were converted to103,336 shares of Pepco Holdings restricted stock. The PARS were originally granted on January 1, 2002 at afair market price of $24.40. All of the converted restricted stock has time-based vesting over periods rangingfrom 5 to 7 years from the original grant date.
In June 2003, the President and Chief Executive Officer of PHI received a retention award in the form of14,822 shares of restricted stock. The shares will vest on June 1, 2006, if he is continuously employed by PHIthrough that date.
Dividend Restrictions
PHI generates no operating income of its own. Accordingly, its ability to pay dividends to its shareholdersdepends on dividends received from its subsidiaries. In addition to their future financial performance, the abilityof PHI’s direct and indirect subsidiaries to pay dividends is subject to limits imposed by: (i) state corporate andregulatory laws, which impose limitations on the funds that can be used to pay dividends and, in the case ofregulatory laws, as applicable, may require the prior approval of the relevant utility regulatory commissionsbefore dividends can be paid; (ii) the prior rights of holders of existing and future preferred stock, mortgagebonds and other long-term debt issued by the subsidiaries, and any other restrictions imposed in connection withthe incurrence of liabilities; and (iii) certain provisions of the charters of Pepco, DPL and ACE, which imposerestrictions on payment of common stock dividends for the benefit of preferred stockholders.
B-122

Calculations of Earnings Per Share of Common Stock
Reconciliations of the numerator and denominator for basic and diluted earnings per share of common stockcalculations are shown below.
For the Year EndedDecember 31,
2005 2004 2003
(In millions, except per sharedata)
Income (Numerator):Net Income . . . . . . . . . . . . . . . . . . . . . . . . . . . . . . . . . . . . . . . . . . . . . . . . . . . . . . . . . . . $371.2 $260.6 $107.3Add: (Loss) gain on redemption of subsidiary’s preferred stock . . . . . . . . . . . . . . . . . . (.1) .5 —
Earnings Applicable to Common Stock . . . . . . . . . . . . . . . . . . . . . . . . . . . . . . . . . . . . . $371.1 $261.1 $107.3
Shares (Denominator)(a):Weighted average shares outstanding for computation of basic earnings per share of
common stock . . . . . . . . . . . . . . . . . . . . . . . . . . . . . . . . . . . . . . . . . . . . . . . . . . . . . . 189.0 176.8 170.7Weighted average shares outstanding for diluted computation:
Average shares outstanding . . . . . . . . . . . . . . . . . . . . . . . . . . . . . . . . . . . . . . . . . . 189.0 176.8 170.7Adjustment to shares outstanding . . . . . . . . . . . . . . . . . . . . . . . . . . . . . . . . . . . . . .3 — —
Weighted average Shares Outstanding for Computation of Diluted Earnings PerShare of Common Stock . . . . . . . . . . . . . . . . . . . . . . . . . . . . . . . . . . . . . . . . . . . . . . 189.3 176.8 170.7
Basic earnings per share of common stock . . . . . . . . . . . . . . . . . . . . . . . . . . . . . . . . . . $ 1.96 $ 1.48 $ .63Diluted earnings per share of common stock . . . . . . . . . . . . . . . . . . . . . . . . . . . . . . . . . $ 1.96 $ 1.48 $ .63
(a) Options to purchase shares of common stock that were excluded from the calculation of diluted EPS as theyare considered to be anti-dilutive were approximately 1.4 million for the years ended December 31, 2005and 2004, and approximately 2.0 million for the year ended December 31, 2003, respectively.
PHI maintains a Shareholder Dividend Reinvestment Plan (DRP) through which shareholders may reinvestcash dividends and both existing shareholders and new investors can make purchases of shares of PHI commonstock through the investment of not less than $25 each calendar month nor more than $200,000 each calendaryear. Shares of common stock purchased through the DRP may be original issue shares or, at the election of PHI,shares purchased in the open market. There were 1,228,505; 1,471,936; and 1,706,422 original issue shares soldunder the DRP in 2005, 2004 and 2003, respectively.
The following table presents Pepco Holdings’ common stock reserved and unissued at December 31, 2005:
Name of PlanNumber of
Shares
DRP . . . . . . . . . . . . . . . . . . . . . . . . . . . . . . . . . . . . . . . . . . . . . . . . . . . . . . . . . . 4,946,124Conectiv Incentive Compensation Plan . . . . . . . . . . . . . . . . . . . . . . . . . . . . . . . 1,569,062Potomac Electric Power Company Long-Term Incentive Plan . . . . . . . . . . . . . 1,400,000Pepco Holdings, Inc. Long-Term Incentive Plan . . . . . . . . . . . . . . . . . . . . . . . . 9,773,810Pepco Holdings, Inc. Stock Compensation Plan for Directors (a) . . . . . . . . . . . —Pepco Holdings, Inc. Non-Management Directors Compensation Plan . . . . . . 497,976Potomac Electric Power Company Savings Plans consisting of (i) the
Retirement Savings Plan for Management Employees and (ii) the SavingsPlan for Bargaining Unit Employees (b),(c) . . . . . . . . . . . . . . . . . . . . . . . . . 3,000,000
Conectiv Savings and Investment Plan (c) . . . . . . . . . . . . . . . . . . . . . . . . . . . . . 20,000Atlantic Electric 401(k) Savings and Investment Plan-B (c) . . . . . . . . . . . . . . . 25,000
Total . . . . . . . . . . . . . . . . . . . . . . . . . . . . . . . . . . . . . . . . . . . . . . . . . . . . . . 21,231,972
(a) Plan was terminated in 2005.
B-123

(b) Effective January 1, 2005, the Savings Plan for Non-Bargaining Unit, Non-Exempt Employees was mergedwith and into the Savings Plan for Exempt Employees which was renamed the Retirement Savings Plan forManagement Employees.
(c) Effective January 13, 2006, Pepco Holdings established the Pepco Holdings, Inc. Retirement Savings Planwhich is an amalgam of, and a successor to, (i) the Potomac Electric Power Company Savings Plan forBargaining Unit Employees, (ii) the Retirement Savings Plan for Management Employees, (iii) the ConectivSavings and Investment Plan, and (iv) the Atlantic City Electric 401(k) Savings and Investment Plan—B. Asof January 20, 2006, there are 5,000,000 reserved and unissued shares under the Retirement Savings Plan(including the 3,045,000 shares previously reserved and unissued under the predecessor Plans.)
(11) FAIR VALUES OF FINANCIAL INSTRUMENTS
The estimated fair values of Pepco Holdings’ financial instruments at December 31, 2005 and 2004 areshown below.
At December 31,
2005 2004
(Millions of dollars)CarryingAmount
FairValue
CarryingAmount
FairValue
AssetsDerivative Instruments . . . . . . . . . . . . . . . . . . . . . . . . . . . . . . . . $ 260.0 $ 260.0 $ 111.2 $ 111.2
Liabilities and CapitalizationLong-Term Debt . . . . . . . . . . . . . . . . . . . . . . . . . . . . . . . . . . . . . $4,202.9 $4,308.0 $4,362.1 $4,575.3Transition Bonds issued by ACE Funding . . . . . . . . . . . . . . . . . $ 494.3 $ 496.7 $ 523.3 $ 537.5Derivative Instruments . . . . . . . . . . . . . . . . . . . . . . . . . . . . . . . . $ 201.3 $ 201.3 $ 78.0 $ 78.0Long-Term Project Funding . . . . . . . . . . . . . . . . . . . . . . . . . . . . $ 25.5 $ 25.5 $ 65.3 $ 65.3Serial Preferred Stock . . . . . . . . . . . . . . . . . . . . . . . . . . . . . . . . . $ 21.5 $ 18.2 $ 27.0 $ 21.7Redeemable Serial Preferred Stock . . . . . . . . . . . . . . . . . . . . . . . $ 24.4 $ 17.2 $ 27.9 $ 18.7
The methods and assumptions described below were used to estimate, at December 31, 2005 and 2004, thefair value of each class of financial instruments shown above for which it is practicable to estimate a value.
The fair values of derivative instruments were derived based on quoted market prices.
Long-Term Debt includes recourse and non-recourse debt issued by PCI. The fair values of this PCI debt,excluding amounts due within one year, were based on current rates offered to similar companies for debt withsimilar remaining maturities. The fair values of all other Long-Term Debt and Transition Bonds issued by ACEFunding, excluding amounts due within one year, were derived based on current market prices, or for issues withno market price available, were based on discounted cash flows using current rates for similar issues with similarterms and remaining maturities.
The fair values of the Serial Preferred Stock and Redeemable Serial Preferred Stock, excluding amounts duewithin one year, were derived based on quoted market prices or discounted cash flows using current rates ofpreferred stock with similar terms.
The carrying amounts of all other financial instruments in Pepco Holdings’ accompanying financialstatements approximate fair value.
B-124

(12) COMMITMENTS AND CONTINGENCIES
REGULATORY AND OTHER MATTERS
Relationship with Mirant Corporation
In 2000, Pepco sold substantially all of its electricity generation assets to Mirant Corporation, formerlySouthern Energy, Inc. As part of the Asset Purchase and Sale Agreement, Pepco entered into several ongoingcontractual arrangements with Mirant Corporation and certain of its subsidiaries. In July 2003, MirantCorporation and most of its subsidiaries filed a voluntary petition for reorganization under Chapter 11 of the U.S.Bankruptcy Code in the U.S. Bankruptcy Court for the Northern District of Texas (the Bankruptcy Court). OnDecember 9, 2005, the Bankruptcy Court approved Mirant’s Plan of Reorganization (the Reorganization Plan)and the Mirant business emerged from bankruptcy on January 3, 2006 (the Bankruptcy Emergence Date), in theform of a new corporation of the same name (together with its predecessors, Mirant). However, as discussedbelow, the Reorganization Plan did not resolve all of the outstanding matters between Pepco and Mirant relatingto the Mirant bankruptcy and the litigation between Pepco and Mirant over these matters is ongoing.
Depending on the outcome of ongoing litigation, the Mirant bankruptcy could have a material adverse effecton the results of operations and cash flows of Pepco Holdings and Pepco. However, management believes thatPepco Holdings and Pepco currently have sufficient cash, cash flow and borrowing capacity under their creditfacilities and in the capital markets to be able to satisfy any additional cash requirements that may arise due to theMirant bankruptcy. Accordingly, management does not anticipate that the Mirant bankruptcy will impair theability of either Pepco Holdings or Pepco to fulfill its contractual obligations or to fund projected capitalexpenditures. On this basis, management currently does not believe that the Mirant bankruptcy will have amaterial adverse effect on the financial condition of either company.
Transition Power Agreements
As part of the Asset Purchase and Sale Agreement, Pepco and Mirant entered into Transition PowerAgreements for Maryland and the District of Columbia, respectively (collectively, the TPAs). Under the TPAs,Mirant was obligated to supply Pepco with all of the capacity and energy needed to fulfill Pepco’s SOSobligations during the rate cap periods in each jurisdiction immediately following deregulation, which inMaryland extended through June 2004 and in the District of Columbia extended until January 22, 2005.
To avoid the potential rejection of the TPAs by Mirant in the bankruptcy proceeding, Pepco and Mirant inOctober 2003 entered into an Amended Settlement Agreement and Release (the Settlement Agreement) pursuantto which the terms of the TPAs were modified to increase the purchase price of the capacity and energy suppliedby Mirant. In exchange, the Settlement Agreement provided Pepco with an allowed, pre-petition generalunsecured claim against Mirant Corporation in the amount of $105 million (the Pepco TPA Claim).
On December 22, 2005, Pepco completed the sale of the Pepco TPA Claim, plus the right to receive accruedinterest thereon, to Deutsche Bank for a cash payment of $112.4 million. Additionally, Pepco received $0.5 millionin proceeds from Mirant in settlement of an asbestos claim against the Mirant bankruptcy estate. Pepco Holdingsand Pepco recognized a total gain of $70.5 million (pre-tax) related to the settlement of these claims. Based on theregulatory settlements entered into in connection with deregulation in Maryland and the District of Columbia, Pepcois obligated to share with its customers the profits it realizes from the provision of SOS during the rate cap periods.The proceeds of the sale of the Pepco TPA Claim will be included in the calculations of the amounts required to beshared with customers in both jurisdictions. Based on the applicable sharing formulas in the respective jurisdictions,Pepco anticipates that customers will receive (through billing credits) approximately $42.3 million of the proceedsover a 12-month period beginning in March 2006 (subject to DCPSC and MPSC approvals).
Power Purchase Agreements
Under agreements with FirstEnergy Corp., formerly Ohio Edison (FirstEnergy), and Allegheny Energy, Inc.,both entered into in 1987, Pepco was obligated to purchase 450 megawatts of capacity and energy fromFirstEnergy annually through December 2005 (the FirstEnergy PPA). Under the Panda PPA, entered into in
B-125

1991, Pepco is obligated to purchase 230 megawatts of capacity and energy from Panda annually through 2021.At the time of the sale of Pepco’s generation assets to Mirant, the purchase price of the energy and capacityunder the PPAs was, and since that time has continued to be, substantially in excess of the market price. As a partof the Asset Purchase and Sale Agreement, Pepco entered into a “back-to-back” arrangement with Mirant. Underthis arrangement, Mirant (i) was obligated, through December 2005, to purchase from Pepco the capacity andenergy that Pepco was obligated to purchase under the FirstEnergy PPA at a price equal to Pepco’s purchaseprice from FirstEnergy, and (ii) is obligated through 2021 to purchase from Pepco the capacity and energy thatPepco is obligated to purchase under the Panda PPA at a price equal to Pepco’s purchase price from Panda (thePPA-Related Obligations). Mirant currently is making these required payments.
Pepco Pre-Petition Claims
At the time the Reorganization Plan was approved by the Bankruptcy Court, Pepco had pending pre-petitionclaims against Mirant totaling approximately $28.5 million (the Pre-Petition Claims), consisting of(i) approximately $26 million in payments due to Pepco in respect of the PPA-Related Obligations and(ii) approximately $2.5 million that Pepco has paid to Panda in settlement of certain billing disputes under thePanda PPA that related to periods after the sale of Pepco’s generation assets to Mirant and prior to Mirant’sbankruptcy filing, for which Pepco believes Mirant is obligated to reimburse it under the terms of the AssetPurchase and Sale Agreement. In the bankruptcy proceeding, Mirant filed an objection to the Pre-PetitionClaims. The Pre-Petition Claims were not resolved in the Reorganization Plan and are the subject of ongoinglitigation between Pepco and Mirant. To the extent Pepco is successful in its efforts to recover the Pre-PetitionClaims, it would receive under the terms of the Reorganization Plan a number of shares of common stock of thenew corporation created pursuant to the Reorganization Plan (the New Mirant Common Stock) equal to (i) theamount of the allowed claim (ii) divided by the market price of the New Mirant Common Stock on theBankruptcy Emergence Date. Because the number of shares is based on the market price of the New MirantCommon Stock on the Bankruptcy Emergence Date, Pepco would receive the benefit, and bear the risk, of anychange in the market price of the stock between the Bankruptcy Emergence Date and the date the stock is issuedto Pepco.
As of December 31, 2005, Pepco maintained a receivable in the amount of $28.5 million, representing thePre-Petition Claims, which was offset by a reserve of $14.5 million established by an expense recorded in 2003to reflect the uncertainty as to whether the entire amount of the Pre-Petition Claims is recoverable. As ofDecember 31, 2005, this reserve was reduced to $9.6 million to reflect the fact that there was no longer anobjection to $15 million of Pepco’s claim.
Mirant’s Efforts to Reject the PPA-Related Obligations and Disgorgement Claims
In August 2003, Mirant filed with the Bankruptcy Court a motion seeking authorization to reject thePPA-Related Obligations (the First Motion to Reject). Upon motions filed with the U.S. District Court for theNorthern District of Texas (the District Court) by Pepco and FERC, the District Court in October 2003 withdrewjurisdiction over this matter from the Bankruptcy Court. In December 2003, the District Court denied Mirant’smotion to reject the PPA-Related Obligations on jurisdictional grounds. Mirant appealed the District Court’sdecision to the U.S. Court of Appeals for the Fifth Circuit (the Court of Appeals). In August 2004, the Court ofAppeals remanded the case to the District Court holding that the District Court had jurisdiction to rule on themerits of Mirant’s rejection motion, suggesting that in doing so the court apply a “more rigorous standard” thanthe business judgment rule usually applied by bankruptcy courts in ruling on rejection motions.
In December 2004, the District Court issued an order again denying Mirant’s motion to reject thePPA-Related Obligations. The District Court found that the PPA-Related Obligations are not severable from theAsset Purchase and Sale Agreement and that the Asset Purchase and Sale Agreement cannot be rejected in part,as Mirant was seeking to do. Mirant has appealed the District Court’s order to the Court of Appeals.
In January 2005, Mirant filed in the Bankruptcy Court a motion seeking to reject certain of its ongoingobligations under the Asset Purchase and Sale Agreement, including the PPA-Related Obligations (the Second
B-126

Motion to Reject). In March 2005, the District Court entered orders granting Pepco’s motion to withdrawjurisdiction over these rejection proceedings from the Bankruptcy Court and ordering Mirant to continue toperform the PPA-Related Obligations (the March 2005 Orders). Mirant has appealed the March 2005 Orders tothe Court of Appeals.
In March 2005, Pepco, FERC, the Office of People’s Counsel of the District of Columbia (the District ofColumbia OPC), the MPSC and the Office of People’s Counsel of Maryland (Maryland OPC) filed in the DistrictCourt oppositions to the Second Motion to Reject. In August 2005, the District Court issued an order informallystaying this matter, pending a decision by the Court of Appeals on the March 2005 Orders.
On February 9, 2006, oral arguments on Mirant’s appeals of the District Court’s order relating to the FirstMotion to Reject and the March 2005 Orders were held before the Court of Appeals; an opinion has not yet beenissued.
On December 1, 2005, Mirant filed with the Bankruptcy Court a motion seeking to reject the executory partsof the Asset Purchase and Sale Agreement and its obligations under all other related agreements with Pepco, withthe exception of Mirant’s obligations relating to operation of the electric generating stations owned by PepcoEnergy Services (the Third Motion to Reject). The Third Motion to Reject also seeks disgorgement of paymentsmade by Mirant to Pepco in respect of the PPA-Related Obligations after filing of its bankruptcy petition in July2003 to the extent the payments exceed the market value of the capacity and energy purchased. On December 21,2005, Pepco filed an opposition to the Third Motion to Reject in the Bankruptcy Court.
On December 1, 2005, Mirant, in an attempt to “recharacterize” the PPA-Related Obligations, filed acomplaint with the Bankruptcy Court seeking (i) a declaratory judgment that the payments due under thePPA-Related Obligations to Pepco are pre-petition debt obligations; and (ii) an order entitling Mirant to recoverall payments that it made to Pepco on account of these pre-petition obligations after the petition date to the extentpermitted under bankruptcy law (i.e., disgorgement).
On December 15, 2005, Pepco filed a motion with the District Court to withdraw jurisdiction over both ofthe December 1 filings from the Bankruptcy Court. The motion to withdraw and Mirant’s underlying complainthave both been stayed pending a decision of the Court of Appeals in the appeals described above.
Each of the theories advanced by Mirant to recover funds paid to Pepco relating to the PPA-RelatedObligations as a practical matter seeks reimbursement for the above-market cost of the capacity and energypurchased from Pepco over a period beginning, at the earliest, from the date on which Mirant filed its bankruptcypetition and ending on the date of rejection or the date through which disgorgement is approved. Under thesetheories, Pepco’s financial exposure is the amount paid by Mirant to Pepco in respect of the PPA-RelatedObligations during the relevant period, less the amount realized by Mirant from the resale of the purchasedenergy and capacity. On this basis, Pepco estimates that if Mirant ultimately is successful in rejecting thePPA-Related Obligations or on its alternative claims to recover payments made to Pepco related to thePPA-Related Obligations, Pepco’s maximum reimbursement obligation would be approximately $263 million asof March 1, 2006.
If Mirant were ultimately successful in its effort to reject its obligations relating to the Panda PPA, Pepcoalso would lose the benefit on a going-forward basis of the offsetting transaction that negates the financial risk toPepco of the Panda PPA. Accordingly, if Pepco were required to purchase capacity and energy from Pandacommencing as of March 1, 2006, at the rates provided in the PPA (with an average price per kilowatt hour ofapproximately 17.1 cents), and resold the capacity and energy at market rates projected, given the characteristicsof the Panda PPA, to be approximately 11.0 cents per kilowatt hour, Pepco estimates that it would incur losses ofapproximately $24 million for the remainder of 2006, approximately $30 million in 2007, and approximately $27million to $38 million annually thereafter through the 2021 contract termination date. These estimates are basedin part on current market prices and forward price estimates for energy and capacity, and do not includefinancing costs, all of which could be subject to significant fluctuation.
B-127

Pepco is continuing to exercise all available legal remedies to vigorously oppose Mirant’s efforts to reject orrecharacterize the PPA-Related Obligations under the Asset Purchase and Sale Agreement in order to protect theinterests of its customers and shareholders. While Pepco believes that it has substantial legal bases to opposethese efforts by Mirant, the ultimate legal outcome is uncertain. However, if Pepco is required to repay to Mirantany amounts received from Mirant in respect of the PPA-Related Obligations, Pepco believes it will be entitled tofile a claim against the Mirant bankruptcy estate in an amount equal to the amount repaid. Likewise, if Mirant issuccessful in its efforts to reject its future obligations relating to the Panda PPA, Pepco will have a claim againstMirant in an amount corresponding to the increased costs that it would incur. In either case, Pepco anticipatesthat Mirant will contest the claim. To the extent Pepco is successful in its efforts to recover on these claims, itwould receive, as in the case of the Pre-Petition Claims, a number of shares of New Mirant Common Stock thatis calculated using the market price of the New Mirant Common Stock on the Bankruptcy Emergence Date andaccordingly would receive the benefit, and bear the risk, of any change in the market price of the stock betweenthe Bankruptcy Emergence Date and the date the stock is issued to Pepco.
Regulatory Recovery of Mirant Bankruptcy Losses
If Mirant were ultimately successful in rejecting the PPA-Related Obligations or on its alternative claims torecover payments made to Pepco related to the PPA-Related Obligations and Pepco’s corresponding claimsagainst the Mirant bankruptcy estate are not recovered in full, Pepco would seek authority from the MPSC andthe DCPSC to recover its additional costs. Pepco is committed to working with its regulatory authorities toachieve a result that is appropriate for its shareholders and customers. Under the provisions of the settlementagreements approved by the MPSC and the DCPSC in the deregulation proceedings in which Pepco agreed todivest its generation assets under certain conditions, the PPAs were to become assets of Pepco’s distributionbusiness if they could not be sold. Pepco believes that these provisions would allow the stranded costs of thePPAs that are not recovered from the Mirant bankruptcy estate to be recovered from Pepco’s customers throughits distribution rates. If Pepco’s interpretation of the settlement agreements is confirmed, Pepco expects to be ableto establish the amount of its anticipated recovery from customers as a regulatory asset. However, there is noassurance that Pepco’s interpretation of the settlement agreements would be confirmed by the respective publicservice commissions.
Pepco’s Notice of Administrative Claims
On January 24, 2006, Pepco filed Notice of Administrative Claims in the Bankruptcy Court seeking torecover: (i) costs in excess of $70 million associated with the transmission upgrades necessitated by shut-down ofthe Potomac River Power Station; and (ii) costs in excess of $8 million due to Mirant’s unjustified post-petitiondelay in executing the certificates needed to permit Pepco to refinance certain tax exempt pollution controlbonds. Mirant is expected to oppose both of these claims, which must be approved by the Bankruptcy Court.There is no assurance that Pepco will be able to recover the amounts claimed.
Mirant’s Fraudulent Transfer Claim
In July 2005, Mirant filed a complaint in the Bankruptcy Court against Pepco alleging that Mirant’s $2.65billion purchase of Pepco’s generating assets in June 2000 constituted a fraudulent transfer for which it seekscompensatory and punitive damages. Mirant alleges in the complaint that the value of Pepco’s generation assetswas “not fair consideration or fair or reasonably equivalent value for the consideration paid to Pepco” and thatthe purchase of the assets rendered Mirant insolvent, or, alternatively, that Pepco and Southern Energy, Inc. (aspredecessor to Mirant) intended that Mirant would incur debts beyond its ability to pay them.
Pepco believes this claim has no merit and is vigorously contesting the claim, which has been withdrawn tothe District Court. On December 5, 2005, the District Court entered a stay pending a decision of the Court ofAppeals in the appeals described above.
B-128

The SMECO Agreement
As a term of the Asset Purchase and Sale Agreement, Pepco assigned to Mirant a facility and capacityagreement with Southern Maryland Electric Cooperative (SMECO) under which Pepco was obligated topurchase the capacity of an 84-megawatt combustion turbine installed and owned by SMECO at a former Pepcogenerating facility (the SMECO Agreement). The SMECO Agreement expires in 2015 and contemplates amonthly payment to SMECO of approximately $.5 million. Pepco is responsible to SMECO for the performanceof the SMECO Agreement if Mirant fails to perform its obligations thereunder. At this time, Mirant continues tomake post-petition payments due to SMECO.
On March 15, 2004, Mirant filed a complaint with the Bankruptcy Court seeking a declaratory judgmentthat the SMECO Agreement is an unexpired lease of non-residential real property rather than an executorycontract and that if Mirant were to successfully reject the agreement, any claim against the bankruptcy estate fordamages made by SMECO (or by Pepco as subrogee) would be subject to the provisions of the Bankruptcy Codethat limit the recovery of rejection damages by lessors.
On November 22, 2005, the Bankruptcy Court issued an order granting summary judgment in favor ofMirant, finding that the SMECO Agreement is an unexpired lease of nonresidential real property. On the basis ofthis ruling, any claim by SMECO (or by Pepco as subrogee) for damages arising from a successful rejection arelimited to the greater of (i) the amount of future rental payments due over one year, or (ii) 15% of the futurerental payments due over the remaining term of the lease, not to exceed three years.
On December 1, 2005, Mirant filed both a motion with the Bankruptcy Court seeking to reject the SMECOAgreement and a complaint against Pepco and SMECO seeking to recover payments made to SMECO after theentry of the Bankruptcy Court’s November 22, 2005 order holding that the SMECO Agreement is a lease of realproperty. On December 15, 2005, Pepco filed a motion with the District Court to withdraw jurisdiction of thismatter from the Bankruptcy Court. The motion to withdraw and Mirant’s underlying motion and complaint havebeen stayed pending a decision of the Court of Appeals in the appeals described above.
If the SMECO Agreement is successfully rejected by Mirant, Pepco will become responsible for theperformance of the SMECO Agreement. In addition, if the SMECO Agreement is ultimately determined to be anunexpired lease of nonresidential real property, Pepco’s claim for recovery against the Mirant bankruptcy estatewould be limited as described above. Pepco estimates that its rejection claim, assuming the SMECO Agreementis determined to be an unexpired lease of nonresidential real property, would be approximately $8 million, andthat the amount it would be obligated to pay over the remaining nine years of the SMECO Agreement isapproximately $44.3 million. While that amount would be offset by the sale of capacity, under currentprojections, the market value of the capacity is de minimis.
Rate Proceedings
Delaware
On October 3, 2005, DPL submitted its 2005 gas cost rate (GCR) filing to the DPSC, which permits DPL torecover gas procurement costs through customer rates. In its filing, DPL seeks to increase its GCR byapproximately 38% in anticipation of increasing natural gas commodity costs. The proposed rate becameeffective November 1, 2005, subject to refund pending final DPSC approval after evidentiary hearings. A publicinput hearing was held on January 19, 2006. DPSC staff and the Division of the Public Advocate filed testimonyon February 20, 2006.
As authorized by the April 16, 2002 settlement agreement in Delaware relating to the acquisition ofConectiv by Pepco (the Delaware Merger Settlement Agreement), on May 4, 2005, DPL filed with the DPSC aproposed increase of approximately $6.2 million in electric transmission service revenues, or about 1.1% of totalDelaware retail electric revenues. This revenue increase covers the Delaware retail portion of the increase in the
B-129

“Delmarva zonal” transmission rates on file with FERC under the PJM Open Access Transmission Tariff(OATT) and other transition PJM charges. This level of revenue increase will decrease to the extent thatcompetitive suppliers provide the supply portion and its associated transmission service to retail customers. Inthat circumstance, PJM would charge the competitive retail supplier the PJM OATT rate for transmission serviceinto the Delmarva zone and DPL’s charges to the retail customer would exclude as a “shopping credit” anamount equal to the SOS supply charge and the transmission and ancillary charges that would otherwise becharged by DPL to the retail customer. DPL began collecting this rate change for service rendered on and afterJune 3, 2005, subject to refund pending final approval by the DPSC.
On September 1, 2005, DPL filed with the DPSC its first comprehensive base rate case in ten years. Thisapplication was filed as a result of increasing costs and is consistent with a provision in the Delaware MergerSettlement Agreement requiring DPL to file a base rate case by September 1, 2005 and permitting DPL to applyfor an increase in rates to be effective no earlier than May 1, 2006. In the application, DPL sought approval of anannual increase of approximately $5.1 million in its electric rates, with an increase of approximately $1.6 millionto its electric distribution base rates after proposing to assign approximately $3.5 million in costs to the supplycomponent of rates to be collected as part of the SOS. Of the approximately $1.6 million in net increases to itselectric distribution base rates, DPL proposed that approximately $1.2 million be recovered through changes indelivery charges and that the remaining approximately $0.4 million be recovered through changes in premisecollection and reconnect fees. The full proposed revenue increase is approximately 0.9% of total annual electricutility revenues, while the proposed net increase to distribution rates is 0.2% of total annual electric utilityrevenues. DPL’s distribution revenue requirement is based on a proposed return on common equity of 11%. DPLalso has proposed revised depreciation rates and a number of tariff modifications.
On September 20, 2005, the DPSC issued an order approving DPL’s request that the rate increase go intoeffect on May 1, 2006; subject to refund and pending evidentiary hearings. The order also suspends effectivenessof various proposed tariff rule changes until the case is concluded. The discovery process commenced onOctober 21, 2005. In its direct testimony, DPSC staff has proposed a variety of adjustments to rate base,operating expenses including depreciation and rate of return with an overall recommendation of a distributionbase rate revenue decrease of $14.3 million. The DPSC staff’s testimony also addresses issues such as ratedesign, allocation of any rate decrease and positions regarding the DPL’s proposals on certain non-rate tariffmodifications. The Delaware Division of Public Advocate has proposed many of the same adjustments andothers with an overall recommendation of a distribution base rate revenue decrease of $18.9 million. DPL filedrebuttal testimony on January 17, 2006, which supports a distribution base rate revenue increase of $2 million.On January 30, 2006, the DPSC staff requested the Hearing Examiner approve a modification of the proceduralschedule in the case to allow for inclusion of testimony regarding recalculation of DPSC staff’s proposeddepreciation rates to allow for a separate amortization of the cost of removal reserve. DPL objected to thismodification of the procedural schedule. The Hearing Examiner issued a letter ruling on February 1, 2006, whichdenied DPSC staff’s request for a modified procedural schedule. On February 2, 2006, DPSC staff filed anemergency motion requesting the DPSC to permit consideration of the issue by the Hearing Examiner in thisdocket. On February 6, 2006, the DPSC ruled to allow the issue in the case. A revised procedural schedule wasestablished by the Hearing Examiner on February 10, 2006. On February 15, 2006, DPL filed an interlocutoryappeal of the Hearing Examiner’s ruling on the procedural schedule with the DPSC. On February 28, 2006, theDPSC upheld the Hearing Examiner’s ruling and procedural schedule set on February 10, 2006. DPSC staff filedtestimony related to this issue on February 17, 2006. DPSC staff’s revised depreciation proposal reduces theirrecommended proposed rate decrease to $18.9 million, plus the amortization of the cost of removal of $58.4million, which DPSC staff has recommended be returned to customers through either a 5, 7 or 10-yearamortization. DPL continues to oppose the inclusion of this issue in the case for substantive and proceduralgrounds. Evidentiary hearings were held in early February. Hearings on the separate issue related to thedepreciation of the cost of removal are scheduled to be held March 20, 2006. Briefs are due on March 31, 2006and DPSC deliberation is scheduled to occur on April 25, 2006. DPL cannot predict the outcome of thisproceeding.
B-130

District of Columbia and Maryland
On February 27, 2006, Pepco filed for the period February 8, 2002 through February 7, 2004 and for theperiod February 8, 2004 through February 7, 2005, an update to the District of Columbia GenerationProcurement Credit (GPC), which provides for sharing of the profit from SOS sales; and on February 24, 2006,Pepco filed an update for the period July 1, 2003 through June 30, 2004 to the Maryland GPC. The updates to theGPC in both the District of Columbia and Maryland take into account the proceeds from the sale of the $105million claim against the Mirant bankruptcy estate related to the TPA Settlement on December 13, 2005 for$112.4 million. The filings also incorporate true-ups to previous disbursements in the GPC for both states. In thefilings, Pepco requests that $24.3 million be credited to District of Columbia customers and $17.7 million becredited to Maryland customers during the twelve-month-period beginning April 2006.
Federal Energy Regulatory Commission
On January 31, 2005, Pepco, DPL, and ACE filed at FERC to reset their rates for network transmissionservice using a formula methodology. The companies also sought a 12.4% return on common equity and a50-basis-point return on equity adder that FERC had made available to transmission utilities who had joinedRegional Transmission Organizations and thus turned over control of their assets to an independent entity. FERCissued an order on May 31, 2005, approving the rates to go into effect June 1, 2005, subject to refund, hearings,and further orders. The new rates reflect a decrease of 7.7% in Pepco’s transmission rate, and increases of 6.5%and 3.3% in DPL’s and ACE’s transmission rates, respectively. The companies continue in settlementdiscussions under the supervision of a FERC administrative law judge and cannot predict the ultimate outcome ofthis proceeding.
Restructuring Deferral
Pursuant to orders issued by the NJBPU under New Jersey Electric Discount and Energy Competition Act(EDECA), beginning August 1, 1999, ACE was obligated to provide BGS to retail electricity customers in itsservice territory who did not choose a competitive energy supplier. For the period August 1, 1999 throughJuly 31, 2003, ACE’s aggregate costs that it was allowed to recover from customers exceeded its aggregaterevenues from supplying BGS. These under-recovered costs were partially offset by a $59.3 million deferredenergy cost liability existing as of July 31, 1999 (LEAC Liability) that was related to ACE’s Levelized EnergyAdjustment Clause and ACE’s Demand Side Management Programs. ACE established a regulatory asset in anamount equal to the balance of under-recovered costs.
In August 2002, ACE filed a petition with the NJBPU for the recovery of approximately $176.4 million inactual and projected deferred costs relating to the provision of BGS and other restructuring related costs incurredby ACE over the four-year period August 1, 1999 through July 31, 2003, net of the $59.3 million offset for theLEAC Liability. The petition also requested that ACE’s rates be reset as of August 1, 2003 so that there would beno under-recovery of costs embedded in the rates on or after that date. The increase sought represented an overall8.4% annual increase in electric rates and was in addition to the base rate increase discussed above. ACE’srecovery of the deferred costs is subject to review and approval by the NJBPU in accordance with EDECA.
In July 2004, the NJBPU issued a final order in the restructuring deferral proceeding confirming a July 2003summary order, which (i) permitted ACE to begin collecting a portion of the deferred costs and reset rates torecover on-going costs incurred as a result of EDECA, (ii) approved the recovery of $125 million of the deferredbalance over a ten-year amortization period beginning August 1, 2003, (iii) transferred to ACE’s then pendingbase rate case for further consideration approximately $25.4 million of the deferred balance, and (iv) estimatedthe overall deferral balance as of July 31, 2003 at $195 million, of which $44.6 million was disallowed recoveryby ACE. ACE believes the record does not justify the level of disallowance imposed by the NJBPU in the finalorder. In August 2004, ACE filed with the Appellate Division of the Superior Court of New Jersey, which hearsappeals of New Jersey administrative agencies, including the NJBPU, a Notice of Appeal with respect to the July2004 final order. ACE’s initial brief was filed on August 17, 2005. Cross-appellant briefs on behalf of theDivision of the New Jersey Ratepayer Advocate and Cogentrix Energy Inc., the co-owner of two cogeneration
B-131

power plants with contracts to sell ACE approximately 397 megawatts of electricity, were filed on October 3,2005. The NJBPU Staff filed briefs on December 12, 2005. ACE filed its reply briefs on January 30, 2006.
Divestiture Cases
District of Columbia
Final briefs on Pepco’s District of Columbia divestiture proceeds sharing application were filed in July 2002following an evidentiary hearing in June 2002. That application was filed to implement a provision of Pepco’sDCPSC-approved divestiture settlement that provided for a sharing of any net proceeds from the sale of Pepco’sgeneration-related assets. One of the principal issues in the case is whether Pepco should be required to sharewith customers the excess deferred income taxes (EDIT) and accumulated deferred investment tax credits(ADITC) associated with the sold assets and, if so, whether such sharing would violate the normalizationprovisions of the Internal Revenue Code and its implementing regulations. As of December 31, 2005, the Districtof Columbia allocated portions of EDIT and ADITC associated with the divested generation assets wereapproximately $6.5 million and $5.8 million, respectively.
Pepco believes that a sharing of EDIT and ADITC would violate the Internal Revenue Service (IRS)normalization rules. Under these rules, Pepco could not transfer the EDIT and the ADITC benefit to customersmore quickly than on a straight line basis over the book life of the related assets. Since the assets are no longerowned there is no book life over which the EDIT and ADITC can be returned. If Pepco were required to shareEDIT and ADITC and, as a result, the normalization rules were violated, Pepco would be unable to useaccelerated depreciation on District of Columbia allocated or assigned property. In addition to sharing withcustomers the generation-related EDIT and ADITC balances, Pepco would have to pay to the IRS an amountequal to Pepco’s District of Columbia jurisdictional generation-related ADITC balance ($5.8 million as ofDecember 31, 2005), as well as its District of Columbia jurisdictional transmission and distribution-relatedADITC balance ($5.3 million as of December 31, 2005) in each case as those balances exist as of the later of thedate a DCPSC order is issued and all rights to appeal have been exhausted or lapsed, or the date the DCPSCorder becomes operative.
In March 2003, the IRS issued a notice of proposed rulemaking (NOPR), which would allow for the sharingof EDIT and ADITC related to divested assets with utility customers on a prospective basis and at the election ofthe taxpayer on a retroactive basis. In December 2005 a revised NOPR was issued which, among other things,withdrew the March 2003 NOPR and eliminated the taxpayer’s ability to elect to apply the regulationretroactively. Comments on the revised NOPR are due by March 21, 2006, and a public hearing will be held onApril 5, 2006. Pepco filed a letter with the DCPSC on January 12, 2006, in which it has reiterated that theDCPSC should continue to defer any decision on the ADITC and EDIT issues until the IRS issues finalregulations or states that its regulations project will be terminated without the issuance of any regulations. Otherissues in the divestiture proceeding deal with the treatment of internal costs and cost allocations as deductionsfrom the gross proceeds of the divestiture.
Pepco believes that its calculation of the District of Columbia customers’ share of divestiture proceeds iscorrect. However, depending on the ultimate outcome of this proceeding, Pepco could be required to makeadditional gain-sharing payments to District of Columbia customers, including the payments described aboverelated to EDIT and ADITC. Such additional payments (which, other than the EDIT and ADITC relatedpayments, cannot be estimated) would be charged to expense in the quarter and year in which a final decision isrendered and could have a material adverse effect on Pepco’s and PHI’s results of operations for those periods.However, neither PHI nor Pepco believes that additional gain-sharing payments, if any, or the ADITC-relatedpayments to the IRS, if required, would have a material adverse impact on its financial position, results ofoperations or cash flows. It is uncertain when the DCPSC will issue a decision regarding Pepco’s divestitureproceeds sharing application.
B-132

Maryland
Pepco filed its divestiture proceeds plan application in Maryland in April 2001. The principal issue in theMaryland case is the same EDIT and ADITC sharing issue that has been raised in the District of Columbia case.See the discussion above under “Divestiture Cases—District of Columbia.” As of December 31, 2005, the MPSCallocated portions of EDIT and ADITC associated with the divested generation assets were approximately$9.1 million and $10.4 million, respectively. Other issues deal with the treatment of certain costs as deductionsfrom the gross proceeds of the divestiture. In November 2003, the Hearing Examiner in the Maryland proceedingissued a proposed order with respect to the application that concluded that Pepco’s Maryland divestituresettlement agreement provided for a sharing between Pepco and customers of the EDIT and ADITC associatedwith the sold assets. Pepco believes that such a sharing would violate the normalization rules (discussed above)and would result in Pepco’s inability to use accelerated depreciation on Maryland allocated or assigned property.If the proposed order is affirmed, Pepco would have to share with its Maryland customers, on an approximately50/50 basis, the Maryland allocated portion of the generation-related EDIT ($9.1 million as of December 31,2005), and the Maryland-allocated portion of generation-related ADITC. Furthermore, Pepco would have to payto the IRS an amount equal to Pepco’s Maryland jurisdictional generation-related ADITC balance ($10.4 millionas of December 31, 2005), as well as its Maryland retail jurisdictional ADITC transmission and distribution-related balance ($9.5 million as of December 31, 2005), in each case as those balances exist as of the later of thedate a MPSC order is issued and all rights to appeal have been exhausted or lapsed, or the date the MPSC orderbecomes operative. The Hearing Examiner decided all other issues in favor of Pepco, except for thedetermination that only one-half of the severance payments that Pepco included in its calculation of corporatereorganization costs should be deducted from the sales proceeds before sharing of the net gain between Pepcoand customers. Pepco filed a letter with the MPSC on January 12, 2006, in which it has reiterated that the MPSCshould continue to defer any decision on the ADITC and EDIT issues until the IRS issues final regulations orstates that its regulations project will be terminated without the issuance of any regulations.
Pepco has appealed the Hearing Examiner’s decision as it relates to the treatment of EDIT and ADITC andcorporate reorganization costs to the MPSC. Consistent with Pepco’s position in the District of Columbia, Pepco hasargued that the only prudent course of action is for the MPSC to await the issuance of final regulations relating tothe tax issues or a termination by the IRS of its regulation project without the issuance of any regulations, and thenallow the parties to file supplemental briefs on the tax issues. Pepco believes that its calculation of the Marylandcustomers’ share of divestiture proceeds is correct. However, depending on the ultimate outcome of this proceeding,Pepco could be required to share with its customers approximately 50 percent of the EDIT and ADITC balancesdescribed above and make additional gain-sharing payments related to the disallowed severance payments. Suchadditional payments would be charged to expense in the quarter and year in which a final decision is rendered andcould have a material adverse effect on results of operations for those periods. However, neither PHI nor Pepcobelieves that additional gain-sharing payments, if any, or the ADITC-related payments to the IRS, if required, wouldhave a material adverse impact on its financial position, results of operations or cash flows.
Default Electricity Supply Proceedings
District of Columbia
Under an order issued by the DCPSC in March 2004, as amended by a DCPSC order issued in July 2004,Pepco is obligated to provide SOS for small commercial and residential customers through May 31, 2011 and forlarge commercial customers through May 31, 2007. In August 2004, the DCPSC issued an order adoptingadministrative charges for residential, small and large commercial District of Columbia SOS customers that areintended to allow Pepco to recover the administrative costs incurred to provide the SOS supply. The approvedadministrative charges include an average margin for Pepco of approximately $.00248 per kilowatt hour,calculated based on total sales to residential, small and large commercial District of Columbia SOS customersover the twelve months ended December 31, 2003. Because margins vary by customer class, the actual averagemargin over any given time period will depend on the number of SOS customers from each customer class andthe load taken by such customers over the time period. The administrative charges went into effect for Pepco’sSOS sales on February 8, 2005.
B-133

The TPA with Mirant under which Pepco obtained the fixed-rate SOS supply ended on January 22, 2005,while the new SOS supply contracts with the winning bidders in the competitive procurement process began onFebruary 1, 2005. Pepco procured power separately on the market for next-day deliveries to cover the periodfrom January 23 through January 31, 2005, before the new SOS contracts began. Consequently, Pepco had to paythe difference between the procurement cost of power on the market for next-day deliveries and the current SOSrates charged to customers during the period from January 23 through January 31, 2005. In addition, because thenew SOS rates did not go into effect until February 8, 2005, Pepco had to pay the difference between theprocurement cost of power under the new SOS contracts and the SOS rates charged to customers for the periodfrom February 1 to February 7, 2005. The total amount of the difference is estimated to be approximately $8.7million. This difference, however, was included in the calculation of the GPC for the District of Columbia for theperiod February 8, 2004 through February 7, 2005, which was filed on July 12, 2005 with the DCPSC. The GPCprovides for a sharing between Pepco’s customers and shareholders, on an annual basis, of any margins, but notlosses, that Pepco earned providing SOS in the District of Columbia during the four-year period from February 8,2001 through February 7, 2005. At the time of the filing, based on the rates paid to Mirant by Pepco under theTPA Settlement, there was no customer sharing. On December 22, 2005 Pepco received $112.4 million inproceeds from the sale of the Pepco TPA Claim against the Mirant bankruptcy estate. A portion of this recoveryrelated to the period February 8, 2004 through February 7, 2005 covered in the July 12 DCPSC filing. As aconsequence, on February 27, 2006, Pepco filed with the DCPSC an updated calculation of the customer sharingfor this period, which also takes into account the losses incurred during the January 22, 2005 through February 7,2005 period. The updated filing shows that both residential and commercial customers will receive customersharing that totals $17.5 million. Without the inclusion of the $8.7 million loss from the January 22, 2005through February 7, 2005 period, the amount shared with customers would have been approximately $22.7million, or $5.2 million greater, so that the net effect of the loss on the SOS sales during this period isapproximately $3.5 million.
On February 3, 2006, Pepco announced proposed rates for its District of Columbia SOS customers to takeeffect on June 1, 2006. The new rate will raise the average monthly bill for residential customers byapproximately 12%. The proposed rates must be approved by the DCPSC.
Delaware
Under a settlement approved by the DPSC, DPL is required to provide POLR to customers in Delawarethrough April 2006. DPL is paid for POLR to customers in Delaware at fixed rates established in the settlement.DPL obtains all of the energy needed to fulfill its POLR obligations in Delaware under a supply agreement withits affiliate Conectiv Energy, which terminates in May 2006. DPL does not make any profit or incur any loss onthe supply component of the POLR supply that it delivers to its Delaware customers. DPL is paid tariff deliveryrates for the delivery of electricity over its transmission and distribution facilities to both POLR customers andcustomers who have selected another energy supplier. These delivery rates generally are frozen through April2006, except that DPL is allowed to file for a one-time transmission rate change during this period. On March 22,2005, the DPSC issued an order approving DPL as the SOS provider after May 1, 2006, when DPL’s currentfixed rate POLR obligation ends. DPL will retain the SOS obligation for an indefinite period until changed by theDPSC, and will purchase the power supply required to satisfy its SOS obligations from wholesale suppliers undercontracts entered into pursuant to a competitive bid procedure.
On October 11, 2005, the DPSC approved a settlement agreement, under which DPL will provide SOS to allcustomer classes, with no specified termination date for SOS. Two categories of SOS will exist: (i) a fixed priceSOS available to all but the largest customers; and (ii) an Hourly Priced Service (HPS) for the largest customers.DPL will purchase the power supply required to satisfy its fixed-price SOS obligation from wholesale suppliersunder contracts entered into pursuant to a competitive bid procedure. Power to supply the HPS customers will beacquired on next-day and other short-term PJM markets. In addition to the costs of capacity, energy,transmission, and ancillary services associated with the fixed-price SOS and HPS, DPL’s initial rates will includea component referred to as the Reasonable Allowance for Retail Margin (RARM). Components of the RARM
B-134

include a fixed annual margin of $2.75 million, plus estimated incremental expenses, a cash working capitalallowance, and recovery with a return over five years of the capitalized costs of a billing system to be used forbilling HPS customers.
Bids for fixed-priced SOS supply for the May 1, 2006 through May 31, 2007 period were accepted andapproved by the DPSC in December 2005 and January 2006. The new SOS rates are scheduled to be effectiveMay 1, 2006.
On February 7, 2006, the Governor of Delaware issued an Executive Order directing the DPSC and otherstate agencies to examine ways to mitigate the electric rate increases that are expected in May 2006 as a result ofrising energy prices. The Executive Order directed the DPSC to examine the feasibility of: (1) deferring orphasing-in the increases; (2) requiring DPL to build generation or enter into long-term supply contracts to meetall, or a portion of, the SOS supply requirements under a traditional regulatory paradigm; (3) directing DPL toconduct integrated resource planning to ensure fuel diversity and least-cost supply alternatives; and (4) requiringDPL to implement demand-side management, conservation and energy efficient programs.
In response to the Executive Order and to help facilitate discussion on several key issues facing the State ofDelaware, particularly the issue of rising energy prices, DPL presented a proposed plan to the DPSC onFebruary 28, 2006. A key feature of DPL’s proposed plan is a phase-in of rate increases to assist DPL’sresidential and small commercial customers with the impact of rising energy prices. The proposed phase-in of therate increase would be in three steps, with one third of the increase to be phased in on May 1, 2006, anotherone-third on January 1, 2007 and the remainder on June 1, 2007. The phase-in would create a deferral balance ofapproximately $60 million that would accrue interest and would be recovered through a surcharge imposed for a24-month period beginning June 1, 2007. DPL believes that this proposal offers a fair and reasonable solution tothe concerns identified in the Executive Order.
The Delaware Governor’s Cabinet Committee on Energy filed its report with the Governor on March 8,2006. The report outlines a proposal that recommends: (1) a phase-in of the SOS increase; (2) long-term steps toensure more stabilized prices and supply; (3) aggregation of the state of Delaware’s power needs; and(4) reduction of Delaware’s dependence on traditional energy sources through conservation, energy efficiency,and innovation.
DPL intends to file with the DPSC, on or about March 15, 2006, an implementation plan with proposedtariffs based on its proposed phase-in plan as described above. DPL also anticipates that others may advanceother legislative or regulatory proposals to address the concerns expressed in the Executive Order. Accordingly,the nature and impact of any changes precipitated by the Executive Order are uncertain and DPL cannot predictat this time whether this phase-in proposal will be implemented.
Maryland
Because of rising energy prices and the resultant expected increases in Pepco’s and DPL’s rates, onMarch 3, 2006 the MPSC issued an order initiating an investigation to consider a residential rate stabilizationplan for Pepco and DPL. This investigation is driven by the unprecedented national and international events. TheMPSC directed the MPSC staff, Pepco and DPL to file comments addressing whether or not the rate stabilizationplan that the MPSC adopted for Baltimore Gas & Electric Company in a March 6, 2006 order also should be usedfor Pepco and DPL. Comments are to be filed by March 16, 2006.
On March 7, 2006, Pepco and DPL each announced the results of competitive bids to supply electricity to itsMaryland SOS customers for one year beginning June 1, 2006. The proposed new rates must be approvedformally by the MPSC. Due to significant increases in the cost of fuels used to generate electricity, the averagemonthly electric bill will increase by about 38.5% and 35% for Pepco’s and DPL’s Maryland residentialcustomers, respectively.
B-135

Virginia
Under amendments to the Virginia Electric Utility Restructuring Act implemented in March 2004, DPL isobligated to offer Default Service to customers in Virginia for an indefinite period until relieved of thatobligation by the VSCC. DPL currently obtains all of the energy and capacity needed to fulfill its Default Serviceobligations in Virginia under a supply agreement with Conectiv Energy that commenced on January 1, 2005 andexpires in May 2006 (the 2005 Supply Agreement). A prior agreement, also with Conectiv Energy, terminatedeffective December 31, 2004. DPL entered into the 2005 Supply Agreement after conducting a competitive bidprocedure in which Conectiv Energy was the lowest bidder.
In October 2004, DPL filed an application with the VSCC for approval to increase the rates that DPLcharges its Default Service customers to allow it to recover its costs for power under the 2005 Supply Agreementplus an administrative charge and a margin. A VSCC order issued in November 2004 allowed DPL to put interimrates into effect on January 1, 2005, subject to refund if the VSCC subsequently determined the rate is excessive.The interim rates reflected an increase of 1.0247 cents per Kwh to the fuel rate, which provide for recovery of theentire amount being paid by DPL to Conectiv Energy, but did not include an administrative charge or margin,pending further consideration of this issue. In January 2005, the VSCC ruled that the administrative charge andmargin are base rate items not recoverable through a fuel clause. In March 2005, the VSCC approved asettlement resolving all other issues and making the interim rates final.
On March 10, 2006, DPL filed a rate increase with the VSCC to reflect proposed rates for its VirginiaDefault Service customers to take effect on June 1, 2006. The new rates will raise the average monthly bill forresidential customers by approximately 43%. The proposed rates must be approved by the VSCC.
New Jersey
On October 12, 2005, the NJBPU, following the evaluation of proposals submitted by ACE and the otherthree electric distribution companies located in New Jersey, issued an order reaffirming the current BGS auctionprocess for the annual period from June 1, 2006 through May 2007. The NJBPU order maintains the current sizeand make up of the Commercial and Industrial Energy Pricing class (CIEP) and approved the electric distributioncompanies’ recommended approach for the CIEP auction product, but deferred a decision on the level of theretail margin funds.
Proposed Shut Down of B.L. England Generating Facility
In April 2004, pursuant to a NJBPU order, ACE filed a report with the NJBPU recommending that ACE’sB.L. England generating facility, a 447 megawatt plant, be shut down. The report stated that, while operation ofthe B.L. England generating facility was necessary at the time of the report to satisfy reliability standards, thosereliability standards could also be satisfied in other ways. The report concluded that, based on B.L. England’scurrent and projected operating costs resulting from compliance with more restrictive environmentalrequirements, the most cost-effective way in which to meet reliability standards is to shut down the B.L. Englandgenerating facility and construct additional transmission enhancements in southern New Jersey.
In December 2004, ACE filed a petition with the NJBPU requesting that the NJBPU establish a proceedingthat will consist of a Phase I and Phase II and that the procedural process for the Phase I proceeding requireintervention and participation by all persons interested in the prudence of the decision to shut down B.L. Englandgenerating facility and the categories of stranded costs associated with shutting down and dismantling the facilityand remediation of the site. ACE contemplates that Phase II of this proceeding, which would be initiated by anACE filing in 2008 or 2009, would establish the actual level of prudently incurred stranded costs to be recoveredfrom customers in rates. The NJBPU has not acted on this petition.
In a January 24, 2006 Administrative Consent Order (ACO) among PHI, Conectiv, ACE, the New JerseyDepartment of Environmental Protection (NJDEP) and the Attorney General of New Jersey, ACE agreed to shutdown and permanently cease operations at the B.L. England generating facility by December 15, 2007 if ACE
B-136

does not sell the plant. The shut-down of the B.L. England generating facility will be subject to necessaryapprovals from the relevant agencies and the outcomes of the auction process, discussed under “ACE Auction ofGenerating Assets,” below.
ACE Auction of Generation Assets
In May 2005, ACE announced that it would again auction its electric generation assets, consisting of its B.L.England generating facility and its ownership interests in the Keystone and Conemaugh generating stations. OnNovember 15, 2005, ACE announced an agreement to sell its interests in the Keystone and Conemaughgenerating stations to Duquesne Light Holdings Inc. for $173.1 million. The sale, subject to approval by theNJBPU as well as other regulatory agencies and certain other legal conditions, is expected to be completedmid-year 2006.
Based on the expressed need of the potential B.L. England bidders for the details of the ACO relating to theshut down of the plant that was being negotiated between ACE and the NJDEP, ACE elected to delay the finalbid due date for B.L. England until such time as a final ACO was complete and available to bidders. With theJanuary 24, 2006 execution of the ACO by all parties, ACE is proceeding with the auction process. Indicativebids were received on February 16, 2006 and final bids are scheduled to be submitted on or about April 19, 2006.
Under the terms of sale, any successful bid for B.L. England must include assumption of all environmentalliabilities associated with the plant in accordance with the auction standards previously issued by the NJBPU.
Any sale of B.L. England will not affect the stranded costs associated with the plant that already have beensecuritized. If B.L. England is sold, ACE anticipates that, subject to regulatory approval in Phase II of theproceeding described above, approximately $9.1 million of additional assets may be eligible for recovery asstranded costs. The net gains on the sale of the Keystone and Conemaugh generating stations will be an offset tostranded costs associated with the shutdown of B.L. England or will be offset through other ratemakingadjustments. Testimony filed by ACE with the NJBPU in December 2005 estimated net gains of approximately$126.9 million; however, the net gains ultimately realized will be dependent upon the timing of the closing of thesale of Keystone and Conemaugh generating stations, transaction costs and other factors.
Federal Tax Treatment of Cross-Border Leases
PCI maintains a portfolio of cross-border energy sale-leaseback transactions, which, as of December 31,2005, had a book value of approximately $1.3 billion, and from which PHI currently derives approximately $55million per year in tax benefits in the form of interest and depreciation deductions.
On February 11, 2005, the Treasury Department and IRS issued Notice 2005-13 informing taxpayers thatthe IRS intends to challenge on various grounds the purported tax benefits claimed by taxpayers entering intocertain sale-leaseback transactions with tax-indifferent parties (i.e., municipalities, tax-exempt and governmentalentities), including those entered into on or prior to March 12, 2004 (the Notice). All of PCI’s cross-borderenergy leases are with tax indifferent parties and were entered into prior to 2004. In addition, on June 29, 2005the IRS published a Coordinated Issue Paper concerning the resolution of audit issues related to suchtransactions. PCI’s cross-border energy leases are similar to those sale-leaseback transactions described in theNotice and the Coordinated Issue Paper.
PCI’s leases have been under examination by the IRS as part of the normal PHI tax audit. On May 4, 2005,the IRS issued a Notice of Proposed Adjustment to PHI that challenges the tax benefits realized from interest anddepreciation deductions claimed by PHI with respect to these leases for the tax years 2001 and 2002. The taxbenefits claimed by PHI with respect to these leases from 2001 through December 31, 2005 were approximately$230 million. The ultimate outcome of this issue is uncertain; however, if the IRS prevails, PHI would be subjectto additional taxes, along with interest and possibly penalties on the additional taxes, which could have a materialadverse effect on PHI’s financial condition, results of operations, and cash flows.
B-137

PHI believes that its tax position related to these transactions was proper based on applicable statutes,regulations and case law, and intends to contest the final adjustments proposed by the IRS; however, there is noassurance that PHI’s position will prevail.
On November 18, 2005 the U.S. Senate passed The Tax Relief Act of 2005 (S.2020) which would applypassive loss limitation rules to leases with foreign tax indifferent parties effective for taxable years beginningafter December 31, 2005, even if the leases were entered into on or prior to March 12, 2004. On December 8,2005 the U.S. House of Representatives passed the Tax Relief Extension Reconciliation Act of 2005 (H.R. 4297),which does not contain any provision which would modify the current treatment of leases with tax indifferentparties. Enactment into law of a bill that is similar to S.2020 in its current form could result in a material delay ofthe income tax benefits that PCI would receive in connection with its cross-border energy leases and therebyadversely affect PHI’s financial condition and cash flows. The U.S. House of Representatives and the U.S.Senate are expected to hold a conference in the near future to reconcile the differences in the two bills todetermine the final legislation.
Under SFAS No. 13, as currently interpreted, a settlement with the IRS or a change in tax law that results ina deferral of tax benefits that does not change the total estimated net income from a lease does not require anadjustment to the book value of the lease. However, if the IRS were to disallow, rather than require the deferralof, certain tax deductions related to PHI’s leases, PHI would be required to adjust the book value of the leasesand record a charge to earnings equal to the repricing impact of the disallowed deductions. Such a charge toearnings, if required, is likely to have a material adverse effect on PHI’s financial condition, results of operations,and cash flows for the period in which the charge is recorded.
In July 2005, the FASB released a Proposed Staff Position paper that would amend SFAS No. 13 andrequire a lease to be repriced and the book value adjusted when there is a change or probable change in thetiming of tax benefits. Under this proposal, a material change in the timing of cash flows under PHI’s cross-border leases as the result of a settlement with the IRS or a change in tax law also would require an adjustment tothe book value. If adopted in its proposed form, the application of this guidance could result in a material adverseeffect on PHI’s financial condition, results of operations, and cash flows, even if a resolution with the IRS or achange in tax law is limited to a deferral of the tax benefits realized by PCI from its leases.
IRS Mixed Service Cost Issue
During 2001, Pepco, DPL, and ACE changed their methods of accounting with respect to capitalizableconstruction costs for income tax purposes, which allow the companies to accelerate the deduction of certainexpenses that were previously capitalized and depreciated. Through December 31, 2005, these accelerateddeductions have generated incremental tax cash flow benefits of approximately $205 million (consisting of $94million for Pepco, $62 million for DPL, and $49 million for ACE) for the companies, primarily attributable totheir 2001 tax returns. On August 2, 2005, the IRS issued Revenue Ruling 2005-53 (the Revenue Ruling) thatwill limit the ability of the companies to utilize this method of accounting for income tax purposes on their taxreturns for 2004 and prior years. PHI intends to contest any IRS adjustment to its prior year income tax returnsbased on the Revenue Ruling. However, if the IRS is successful in applying this Revenue Ruling, Pepco, DPL,and ACE would be required to capitalize and depreciate a portion of the construction costs previously deductedand repay the associated income tax benefits, along with interest thereon. During 2005, PHI recorded a $10.9million increase in income tax expense consisting of $6.0 million for Pepco, $2.9 million for DPL, and $2.0million for ACE, to account for the accrued interest that would be paid on the portion of tax benefits that PHIestimates would be deferred to future years if the construction costs previously deducted are required to becapitalized and depreciated.
On the same day as the Revenue Ruling was issued, the Treasury Department released regulations that, ifadopted in their current form, would require Pepco, DPL, and ACE to change their method of accounting withrespect to capitalizable construction costs for income tax purposes for all future tax periods beginning in 2005.
B-138

Under these regulations, Pepco, DPL, and ACE will have to capitalize and depreciate a portion of theconstruction costs that they have previously deducted and include the impact of this adjustment in taxable incomeover a two-year period beginning with tax year 2005. PHI is continuing to work with the industry to determine analternative method of accounting for capitalizable construction costs acceptable to the IRS to replace the methoddisallowed by the proposed regulations.
In February 2006, PHI paid approximately $121 million of taxes to cover the amount of taxes managementestimates will be payable once a new final method of tax accounting is adopted on its 2005 tax return, due to theproposed regulations. Although the increase in taxable income will be spread over the 2005 and 2006 tax returnperiods, the cash payments would have all occurred in 2006 with the filing of the 2005 tax return and the ongoing2006 estimated tax payments. This $121 million tax payment was accelerated to eliminate the need to accrueadditional Federal interest expense for the potential IRS adjustment related to the previous tax accountingmethod PHI used during the 2001-2004 tax years.
General Litigation
During 1993, Pepco was served with Amended Complaints filed in the state Circuit Courts of PrinceGeorge’s County, Baltimore City and Baltimore County, Maryland in separate ongoing, consolidatedproceedings known as “In re: Personal Injury Asbestos Case.” Pepco and other corporate entities were broughtinto these cases on a theory of premises liability. Under this theory, the plaintiffs argued that Pepco was negligentin not providing a safe work environment for employees or its contractors, who allegedly were exposed toasbestos while working on Pepco’s property. Initially, a total of approximately 448 individual plaintiffs addedPepco to their complaints. While the pleadings are not entirely clear, it appears that each plaintiff sought $2million in compensatory damages and $4 million in punitive damages from each defendant.
Since the initial filings in 1993, additional individual suits have been filed against Pepco, and significantnumbers of cases have been dismissed. As a result of two motions to dismiss, numerous hearings and meetingsand one motion for summary judgment, Pepco has had approximately 400 of these cases successfully dismissedwith prejudice, either voluntarily by the plaintiff or by the court. As of December 31, 2005, there areapproximately 265 cases still pending against Pepco in the State Courts of Maryland; of those approximately 265remaining asbestos cases, approximately 85 cases were filed after December 19, 2000, and have been tendered toMirant Corporation for defense and indemnification pursuant to the terms of the Asset Purchase and SaleAgreement. Mirant’s Plan of Reorganization, as approved by the Bankruptcy Court in connection with the Mirantbankruptcy, does not alter Mirant’s indemnification obligations. However, litigation relating to Mirant’s effortsto reject its contract obligations under the Asset Purchase and Sale Agreement is continuing. In the eventMirant’s efforts to reject obligations under the Asset Purchase and Sale Agreement, including the indemnityobligations, were to be successful, Mirant would be relieved of these indemnity obligations and Pepco wouldhave a pre-petition claim for the value of the damages incurred.
While the aggregate amount of monetary damages sought in the remaining suits (excluding those tenderedto Mirant) exceeds $400 million, Pepco believes the amounts claimed by current plaintiffs are greatlyexaggerated. The amount of total liability, if any, and any related insurance recovery cannot be determined at thistime; however, based on information and relevant circumstances known at this time, Pepco does not believe thesesuits will have a material adverse effect on its financial position, results of operations or cash flows. However, ifan unfavorable decision were rendered against Pepco, it could have a material adverse effect on Pepco’s andPHI’s financial position, results of operations or cash flows.
Environmental Litigation
PHI, through its subsidiaries, is subject to regulation by various federal, regional, state, and local authoritieswith respect to the environmental effects of its operations, including air and water quality control, solid andhazardous waste disposal, and limitations on land use. In addition, federal and state statutes authorizegovernmental agencies to compel responsible parties to clean up certain abandoned or unremediated hazardous
B-139

waste sites. PHI’s subsidiaries may incur costs to clean up currently or formerly owned facilities or sites found tobe contaminated, as well as other facilities or sites that may have been contaminated due to past disposalpractices. Although penalties assessed for violations of environmental laws and regulations are not recoverablefrom customers of the operating utilities, environmental clean-up costs incurred by Pepco, DPL and ACE wouldbe included by each company in its respective cost of service for ratemaking purposes.
In July 2004, DPL entered into an ACO with the Maryland Department of the Environment (MDE) toperform a Remedial Investigation/Feasibility Study (RI/FS) to further identify the extent of soil, sediment andground and surface water contamination related to former manufactured gas plant (MGP) operations at theCambridge, Maryland site on DPL-owned property and to investigate the extent of MGP contamination onadjacent property. The MDE has approved the RI and DPL has completed and submitted the FS to MDE. Thecosts for completing the RI/FS for this site were approximately $150,000. The costs of cleanup resulting from theRI/FS will not be determinable until MDE identifies the appropriate remedy.
In the early 1970s, both Pepco and DPL sold scrap transformers, some of which may have contained somelevel of PCBs, to a metal reclaimer operating at the Metal Bank/Cottman Avenue site in Philadelphia,Pennsylvania, owned by a nonaffiliated company. In December 1987, Pepco and DPL were notified by EPA thatthey, along with a number of other utilities and non-utilities, were PRPs in connection with the PCBcontamination at the site.
In 1994, an RI/FS including a number of possible remedies was submitted to the EPA. In 1997, the EPAissued a Record of Decision that set forth a selected remedial action plan with estimated implementation costs ofapproximately $17 million. In 1998, the EPA issued a unilateral administrative order to Pepco and 12 other PRPsdirecting them to conduct the design and actions called for in its decision. In May 2003, two of the potentiallyliable owner/operator entities filed for reorganization under Chapter 11 of the U.S. Bankruptcy Code. In October2003, the bankruptcy court confirmed a reorganization plan that incorporates the terms of a settlement among thetwo debtor owner/operator entities, the United States and a group of utility PRPs including Pepco (the UtilityPRPs). Under the bankruptcy settlement, the reorganized entity/site owner will pay a total of $13.25 million toremediate the site (the Bankruptcy Settlement).
On September 2, 2005 the United States lodged with the U.S. District Court for the Eastern District ofPennsylvania global consent decrees for the Metal Bank/Cottman Avenue site, entered into on August 23, 2005involving the Utility PRPs, the U.S. Department of Justice, EPA, The City of Philadelphia and two owner/operators of the site. Under the terms of the settlement, the two owner/operators will make payments totaling$5.55 million to the U.S. and totaling $4.05 million to the Utility PRPs. The Utility PRPs will perform theremedy at the site and will be able to draw on the $13.25 million from the Bankruptcy Settlement to accomplishthe remediation (the Bankruptcy Funds). The Utility PRPs will contribute funds to the extent remediation costsexceed the Bankruptcy Funds available. The Utility PRPs also will be liable for EPA costs associated withoverseeing the monitoring and operation of the site remedy after the remedy construction is certified to becomplete and also the cost of performing the “5 year” review of site conditions required by CERCLA. AnyBankruptcy Funds not spent on the remedy may be used to cover the Utility PRPs’ liabilities for future costs. Noparties are released from potential liability for damages to natural resources. The global settlement agreement issubject to approval by the court.
As of December 31, 2005, Pepco had accrued $1.7 million to meet its liability for a remedy at the MetalBank/Cottman Avenue site. While final costs to Pepco of the settlement have not been determined, Pepcobelieves that its liability at this site will not have a material adverse effect on its financial position, results ofoperations or cash flows.
In 1999, DPL entered into a de minimis settlement with EPA and paid approximately $107,000 to resolve itsliability for cleanup costs at the Metal Bank/Cottman Avenue site. The de minimis settlement did not resolveDPL’s responsibility for natural resource damages, if any, at the site. DPL believes that any liability for naturalresource damages at this site will not have a material adverse effect on its financial position, results of operationsor cash flows.
B-140

In June 1992, EPA identified ACE as a PRP at the Bridgeport Rental and Oil Services Superfund site inLogan Township, New Jersey. In September 1996, ACE along with other PRPs signed a consent decree withEPA and NJDEP to address remediation of the site. ACE’s liability is limited to .232 percent of the aggregateremediation liability and thus far ACE has made contributions of approximately $105,000. Based on informationcurrently available, ACE anticipates that it may be required to contribute approximately an additional $52,000.ACE believes that its liability at this site will not have a material adverse effect on its financial position, resultsof operations or cash flows.
In November 1991, NJDEP identified ACE as a PRP at the Delilah Road Landfill site in Egg HarborTownship, New Jersey. In 1993, ACE, along with other PRPs, signed an ACO with NJDEP to remediate the site.The soil cap remedy for the site has been completed and the NJDEP conditionally approved the report submittedby the parties on the implementation of the remedy in January 2003. In March 2004, NJDEP approved a GroundWater Sampling and Analysis Plan. Positive results of groundwater monitoring events have resulted in a reducedlevel of groundwater monitoring. In March 2003, EPA demanded from the PRP group reimbursement for EPA’spast costs at the site, totaling $168,789. The PRP group objected to the demand for certain costs, but agreed toreimburse EPA approximately $19,000. Based on information currently available, ACE anticipates that its shareof additional cost associated with this site will be approximately $626,000. ACE believes that its liability forpost-remedy operation and maintenance costs will not have a material adverse effect on its financial position,results of operations or cash flows.
On January 24, 2006, PHI, Conectiv and ACE entered into an ACO with NJDEP and the Attorney Generalof New Jersey. This ACO is the definitive agreement contemplated by the April 26, 2004 preliminary settlementagreement among the parties. The ACO resolves the NJDEP’s concerns regarding ACE’s compliance with NSRrequirements with respect to the B.L. England generating facility and various other environmental issues relatingto ACE and Conectiv Energy facilities in New Jersey.
Third Party Guarantees, Indemnifications, and Off-Balance Sheet Arrangements
Pepco Holdings and certain of its subsidiaries have various financial and performance guarantees andindemnification obligations which are entered into in the normal course of business to facilitate commercialtransactions with third parties as discussed below.
As of December 31, 2005, Pepco Holdings and its subsidiaries were parties to a variety of agreementspursuant to which they were guarantors for standby letters of credit, performance residual value, and othercommitments and obligations. The fair value of these commitments and obligations was not required to berecorded in Pepco Holdings’ Consolidated Balance Sheets; however, certain energy marketing obligations ofConectiv Energy were recorded. The commitments and obligations, in millions of dollars, were as follows:
Guarantor
PHI DPL ACE Other Total
Energy marketing obligations of Conectiv Energy (1) . . . . . . . . . . . . . . . $167.5 $— $— $— $167.5Energy procurement obligations of Pepco Energy Services (1) . . . . . . . . 13.4 — — — 13.4Guaranteed lease residual values (2) . . . . . . . . . . . . . . . . . . . . . . . . . . . . . .6 3.3 3.2 — 7.1Other (3) . . . . . . . . . . . . . . . . . . . . . . . . . . . . . . . . . . . . . . . . . . . . . . . . . . 18.3 — — 2.4 20.7
Total . . . . . . . . . . . . . . . . . . . . . . . . . . . . . . . . . . . . . . . . . . . . . . . . . $199.8 $ 3.3 $ 3.2 $ 2.4 $208.7
(1) Pepco Holdings has contractual commitments for performance and related payments of Conectiv Energyand Pepco Energy Services to counterparties related to routine energy sales and procurement obligations,including requirements under BGS contracts entered into with ACE.
(2) Subsidiaries of Pepco Holdings have guaranteed residual values in excess of fair value related to certainequipment and fleet vehicles held through lease agreements. As of December 31, 2005, obligations underthe guarantees were approximately $7.1 million. Assets leased under agreements subject to residual value
B-141

guarantees are typically for periods ranging from 2 years to 10 years. Historically, payments under theguarantees have not been made by the guarantor as, under normal conditions, the contract runs to full termat which time the residual value is minimal. As such, Pepco Holdings believes the likelihood of paymentbeing required under the guarantee is remote.
(3) Other guarantees consist of:
• Pepco Holdings has guaranteed payment of a bond issued by a subsidiary of $14.9 million. PepcoHoldings does not expect to fund the full amount of the exposure under the guarantee.
• Pepco Holdings has guaranteed a subsidiary building lease of $3.4 million. Pepco Holdings does notexpect to fund the full amount of the exposure under the guarantee.
• PCI has guaranteed facility rental obligations related to contracts entered into by Starpower. As ofDecember 31, 2005, the guarantees cover the remaining $2.4 million in rental obligations.
Pepco Holdings and certain of its subsidiaries have entered into various indemnification agreements relatedto purchase and sale agreements and other types of contractual agreements with vendors and other third parties.These indemnification agreements typically cover environmental, tax, litigation and other matters, as well asbreaches of representations, warranties and covenants set forth in these agreements. Typically, claims may bemade by third parties under these indemnification agreements over various periods of time depending on thenature of the claim. The maximum potential exposure under these indemnification agreements can range from aspecified dollar amount to an unlimited amount depending on the nature of the claim and the particulartransaction. The total maximum potential amount of future payments under these indemnification agreements isnot estimable due to several factors, including uncertainty as to whether or when claims may be made underthese indemnities.
Contractual Obligations
As of December 31, 2005, Pepco Holdings’ contractual obligations under non-derivative fuel and purchasepower contracts, excluding the Panda PPA discussed above under “Relationship with Mirant Corporation” andBGS supplier load commitments, were $1,823.7 million in 2006, $1,705.0 million in 2007 to 2008, $754.3million in 2009 to 2010, and $3,123.8 million in 2011 and thereafter.
(13) USE OF DERIVATIVES IN ENERGY AND INTEREST RATE HEDGING ACTIVITIES
PHI’s Competitive Energy businesses use derivative instruments primarily to reduce their financial exposureto changes in the value of their assets and obligations due to commodity price fluctuations. The derivativeinstruments used by the Competitive Energy businesses include forward contracts, futures, swaps, and exchange-traded and over-the-counter options. In addition, the Competitive Energy businesses also manage commodity riskwith contracts that are not classified as derivatives. The primary goal of these activities is to manage the spreadbetween the cost of fuel used to operate electric generation plants and the revenue received from the sale of thepower produced by those plants and manage the spread between retail sales commitments and the cost of supplyused to service those commitments in order to ensure stable and known minimum cash flows and fix favorableprices and margins when they become available. To a lesser extent, Conectiv Energy also engages in marketactivities in an effort to profit from short-term geographical price differentials in electricity prices amongmarkets. PHI collectively refers to these energy market activities, including its commodity risk managementactivities, as “other energy commodity” activities and identifies this activity separately from that of thediscontinued proprietary trading activity described below.
Conectiv Energy’s 2003 loss includes the unfavorable impact of net trading losses of $26.6 million thatresulted from a dramatic rise in natural gas futures prices during February 2003, net of an after tax gain of $15million on the sale of a purchase power contract in February 2003. As of March 2003, Conectiv Energy ceasedall proprietary trading activities, which generally consisted of the entry into contracts to take a view of marketdirection, capture market price change, and put capital at risk. PHI’s Competitive Energy businesses are nolonger engaged in proprietary trading; however, the market exposure under certain contracts entered into prior to
B-142

cessation of proprietary trading activities was not completely eliminated because perfectly offsetting contractualpositions were not available in the market at that time. These contracts will remain in place until they areterminated and their values are realized.
On June 25, 2003, Conectiv Energy entered into an agreement consisting of a series of energy contracts withan international investment banking firm with a senior unsecured debt rating of A+ / Stable from Standard &Poor’s (the Counterparty). The agreement was designed to more effectively hedge approximately 50% ofConectiv Energy’s generation output and approximately 50% of its supply obligations, with the intention ofproviding Conectiv Energy with a more predictable earnings stream during the term of the agreement. Theagreement consists of two major components: a fixed price energy supply hedge and a generation off-takeagreement. The fixed price energy supply hedge is used to reduce Conectiv Energy’s financial exposure under itscurrent supply commitment to DPL. Under this commitment, which extends through April 2006, ConectivEnergy is obligated to supply to DPL the electric power necessary to enable DPL to meet its POLR loadobligations. Under the energy supply hedge, the volume and price risks associated with 50% of the POLR loadobligation are effectively transferred from Conectiv Energy to the Counterparty through a financial“contract-for-differences.” The contract-for-differences (swap) establishes a fixed cost for the energy required byConectiv Energy to satisfy 50% of the POLR load, and any deviations of the market price from the fixed priceare paid by Conectiv Energy to, or are received by Conectiv Energy from, the Counterparty. The contract doesnot cover the cost of capacity or ancillary services. Under the generation off-take agreement, Conectiv Energyreceives a fixed monthly payment from the Counterparty and the Counterparty receives the profit realized fromthe sale of approximately 50% of the electricity generated by Conectiv Energy’s plants (excluding the EdgeMoor facility) through May 2006. This portion of the agreement is designed to hedge sales of approximately 50%of Conectiv Energy’s generation output, and under assumed operating parameters and market conditions shouldeffectively transfer this portion of Conectiv Energy’s wholesale energy market risk to the Counterparty, whileproviding a more stable stream of revenues to Conectiv Energy. The agreement also includes several standardenergy price swaps under which Conectiv Energy has locked in a sales price for approximately 50% of the outputfrom its Edge Moor facility and has financially hedged other on-peak and off-peak energy price exposures in itsportfolio to further reduce market price exposure. In total, the transaction is expected to improve ConectivEnergy’s risk profile by providing hedges that are tailored to the characteristics of its generation fleet and itsPOLR supply obligation.
PHI and its subsidiaries also use derivative instruments from time to time to mitigate the effects offluctuating interest rates on debt incurred in connection with the operation of their businesses. In June 2002, PHIentered into several treasury lock transactions in anticipation of the issuance of several series of fixed rate debtcommencing in July 2002. There remained a loss balance of $40.1 million in Accumulated Other ComprehensiveIncome (AOCI) at December 31, 2005 related to this transaction. The portion expected to be reclassified toearnings during the next 12 months is $7.1 million. In addition, interest rate swaps have been executed in supportof PCI’s medium-term note program.
B-143

The table below provides detail on effective cash flow hedges under SFAS No. 133 included in PHI’sConsolidated Balance Sheet as of December 31, 2005. Under SFAS No. 133, cash flow hedges aremarked-to-market on the balance sheet with corresponding adjustments to AOCI. The data in the table indicatesthe magnitude of the effective cash flow hedges by hedge type (i.e., other energy commodity and interest ratehedges), maximum term, and portion expected to be reclassified to earnings during the next 12 months.
Cash Flow Hedges Included in Accumulated Other Comprehensive LossAs of December 31, 2005
(Millions of dollars)
ContractsAccumulated OCI
(Loss) After Tax (1)
Portion Expectedto be Reclassified
to Earnings duringthe Next 12 Months Maximum Term
Other Energy Commodity . . . . . . . . . . . . . . . $ 24.6 $26.7 51 monthsInterest Rate . . . . . . . . . . . . . . . . . . . . . . . . . (40.1) (7.1) 320 months
Total . . . . . . . . . . . . . . . . . . . . . . . . . . . $(15.5) $19.6
(1) Accumulated Other Comprehensive Loss as of December 31, 2005, includes $(7.3) million for anadjustment for minimum pension liability. This adjustment is not included in this table as it is not a cashflow hedge.
The following table shows, in millions of dollars, the pre-tax gain (loss) recognized in earnings for cashflow hedge ineffectiveness for the years ended December 31, 2005, 2004, and 2003, and where they werereported in the Consolidated Statements of Earnings during the period.
2005 2004 2003
Operating Revenue . . . . . . . . . . . . . . . . . . . . . . . . . . . . . . . . . . . . . . . . . . . . . . $ 3.0 $ 2.5 $ 1.8Fuel and Purchased Energy Expenses . . . . . . . . . . . . . . . . . . . . . . . . . . . . . . . (2.7) (8.5) (2.8)
Total . . . . . . . . . . . . . . . . . . . . . . . . . . . . . . . . . . . . . . . . . . . . . . . . . . . . . $ .3 $(6.0) $(1.0)
For the years ended December 31, 2005 and 2004, there were no forecasted hedged transactions deemed tobe no longer probable.
In connection with their other energy commodity activities, the Competitive Energy businesses hold certainderivatives that do not qualify as hedges. Under SFAS No. 133, these derivatives are marked-to-market throughearnings with corresponding adjustments on the balance sheet. The pre-tax gains (losses) on these derivatives areincluded in “Competitive Energy Operating Revenues” and are summarized in the following table, in millions ofdollars, for the years ended December 31, 2005, 2004, and 2003.
2005 2004 2003
Proprietary Trading . . . . . . . . . . . . . . . . . . . . . . . . . . . . . . . . . . . . . . . . . . . . $ .1 $ (.4) $(67.3)Other Energy Commodity . . . . . . . . . . . . . . . . . . . . . . . . . . . . . . . . . . . . . . . 37.8 24.2 19.6
Total . . . . . . . . . . . . . . . . . . . . . . . . . . . . . . . . . . . . . . . . . . . . . . . . . . . $37.9 $23.8 $(47.7)
(14) EXTRAORDINARY ITEMS
On April 19, 2005, ACE, the staff of the New Jersey Board of Public Utilities (NJBPU), the New JerseyRatepayer Advocate, and active intervenor parties agreed on a settlement in ACE’s electric distribution rate case.As a result of this settlement, ACE reversed $15.2 million in accruals related to certain deferred costs that arenow deemed recoverable. The after tax credit to income of $9.0 million is classified as an extraordinary gain inthe 2005 financial statements since the original accrual was part of an extraordinary charge in conjunction withthe accounting for competitive restructuring in 1999.
B-144

In July 2003, the NJBPU approved the recovery of $149.5 million of stranded costs related to ACE’s B.L.England generating facility. As a result of the order, ACE reversed $10.0 million of accruals for the possibledisallowances related to these stranded costs. The after tax credit to income of $5.9 million is classified as anextraordinary gain in the 2003 financial statements, since the original accrual was part of an extraordinary chargein conjunction with the accounting for competitive restructuring in 1999.
(15) RESTATEMENT
Pepco Holdings restated its previously reported consolidated financial statements as of December 31, 2004and for the years ended December 31, 2004 and 2003, the quarterly financial information for the first threequarters in 2005, and all quarterly periods in 2004, to correct the accounting for certain deferred compensationarrangements. The restatement includes the correction of other errors for the same periods, primarily relating tounbilled revenue, taxes, and various accrual accounts, which were considered by management to be immaterial.These other errors would not themselves have required a restatement absent the restatement to correct theaccounting for deferred compensation arrangements. This restatement was required solely because thecumulative impact of the correction, if recorded in the fourth quarter of 2005, would have been material to thatperiod’s reported net income. The impact of the restatement related to the deferred compensation arrangementson periods prior to 2003 has been reflected as a reduction of approximately $23 million to Pepco Holdings’retained earnings balance as of January 1, 2003. The following table sets forth for Pepco Holdings, for the yearsended December 31, 2004 and 2003, the impact of the restatement to correct the accounting for the deferredcompensation arrangements and the other errors noted above (millions of dollars):
December 31, 2004 December 31, 2003
PreviouslyReported Restated
PreviouslyReported Restated
Consolidated Statements of EarningsTotal Operating Revenue . . . . . . . . . . . . . . . . . . . . . . . . . . $ 7,221.8 $ 7,223.1 $ 7,271.3 $ 7,268.7Total Operating Expenses . . . . . . . . . . . . . . . . . . . . . . . . . . 6,446.1 6,451.0 6,654.9 6,658.0Total Operating Income . . . . . . . . . . . . . . . . . . . . . . . . . . . 775.7 772.1 616.4 610.7Other Income (Expenses) . . . . . . . . . . . . . . . . . . . . . . . . . . (341.0) (341.4) (429.0) (433.3)Income Before Income Tax Expense . . . . . . . . . . . . . . . . . 431.9 427.9 173.5 163.5Net Income . . . . . . . . . . . . . . . . . . . . . . . . . . . . . . . . . . . . . $ 258.7 $ 260.6 $ 113.5 $ 107.3Earnings Per Share (Basic and Diluted) . . . . . . . . . . . . . . . $ 1.47 $ 1.48 $ .66 $ .63
Consolidated Balance SheetsTotal Current Assets . . . . . . . . . . . . . . . . . . . . . . . . . . . . . . $ 1,653.9 $ 1,672.5 $ 1,685.3 $ 1,702.2Total Investments and Other Assets . . . . . . . . . . . . . . . . . . 4,607.5 4,587.7 4,721.1 4,701.1Total Property, Plant and Equipment . . . . . . . . . . . . . . . . . 7,088.0 7,090.6 6,964.9 6,965.7Total Assets . . . . . . . . . . . . . . . . . . . . . . . . . . . . . . . . . . . . . 13,349.4 13,350.8 13,371.3 13,369.0Total Current Liabilities . . . . . . . . . . . . . . . . . . . . . . . . . . . 1,942.8 1,940.3 2,179.7 2,198.9Total Deferred Credits . . . . . . . . . . . . . . . . . . . . . . . . . . . . . 2,912.6 2,943.8 2,672.3 2,680.0Total Long-Term Liabilities . . . . . . . . . . . . . . . . . . . . . . . . 5,072.8 5,072.8 5,452.8 5,452.8Total Shareholders’ Equity . . . . . . . . . . . . . . . . . . . . . . . . . 3,366.3 3,339.0 3,003.3 2,974.1Total Liabilities and Shareholders’ Equity . . . . . . . . . . . . . $13,349.4 $13,350.8 $13,371.3 $13,369.0
Consolidated Statements of Cash FlowsNet Cash Provided by Operating Activities . . . . . . . . . . . . $ 734.6 $ 715.7 $ 661.4 $ 662.4Net Cash Used in Investing Activities . . . . . . . . . . . . . . . . $ (422.1) $ (417.3) $ (254.8) $ (252.7)Net Cash Used in Financing Activities . . . . . . . . . . . . . . . . $ (373.5) $ (359.1) $ (367.9) $ (370.7)
Consolidated Statements of Shareholders’ EquityRetained Earnings at December 31, . . . . . . . . . . . . . . . . . . $ 863.7 $ 836.4 $ 781.0 $ 751.8
B-145

(16) QUARTERLY FINANCIAL INFORMATION (UNAUDITED)
The unaudited quarterly financial information for the three months ended March 31, 2005, June 30, 2005,and September 30, 2005 and all interim periods during the year ended December 31, 2004 have been restated toreflect the correction of the accounting for certain deferred compensation arrangements and other noted errorsthat would not themselves have required a restatement absent the restatement to correct the accounting for thedeferred compensation arrangements as described in Note 15. The quarterly data presented below reflect alladjustments necessary in the opinion of management for a fair presentation of the interim results. Quarterly datanormally vary seasonally because of temperature variations, differences between summer and winter rates, andthe scheduled downtime and maintenance of electric generating units. The totals of the four quarterly basic anddiluted earnings per common share may not equal the basic and diluted earnings per common share for the yeardue to changes in the number of common shares outstanding during the year.
2005
FirstQuarter
SecondQuarter
ThirdQuarter
FourthQuarter
PreviouslyReported
AsRestated
PreviouslyReported
AsRestated
PreviouslyReported
AsRestated Total
(In millions, except per share data)Total Operating Revenue . . . . . . . . . . $1,804.8 $1,798.8 $1,712.1 $1,720.2 $2,488.7 $2,483.6 $2,062.9 $8,065.5Total Operating Expenses . . . . . . . . . 1,656.7 1,654.1 1,533.3 1,535.8 2,118.2(c) 2,115.3(c) 1,854.9(d)(e) 7,160.1Operating Income . . . . . . . . . . . . . . . . 148.1 144.7 178.8 184.4 370.5 368.3 208.0 905.4Other Expenses . . . . . . . . . . . . . . . . . (66.9) (67.8) (73.9) (74.8) (71.6) (72.4) (70.5) (285.5)Preferred Stock Dividend
Requirements of Subsidiaries . . . . .6 .6 .7 .7 .6 .6 .6 2.5Income Before Income Tax
Expense . . . . . . . . . . . . . . . . . . . . . 80.6 76.3 104.2 108.9 298.3 295.3 136.9 617.4Income Tax Expense . . . . . . . . . . . . . 34.1 30.6 40.2 42.5 128.2(b) 127.3(b) 54.8(f) 255.2Income Before Extraordinary Item . . 46.5 45.7 64.0 66.4 170.1 168.0 82.1 362.2Extraordinary Item . . . . . . . . . . . . . . . 9.0(a) 9.0 — — — — — 9.0Net Income . . . . . . . . . . . . . . . . . . . . . 55.5 54.7 64.0 66.4 170.1 168.0 82.1 371.2Basic and Diluted Earnings Per Share
of Common StockBefore Extraordinary Item . . . . . . . .24 .24 .34 .35 .90 .89 .43 1.91
Extraordinary Item Per Share ofCommon Stock . . . . . . . . . . . . . . . . .05 .05 — — — — — .05
Basic and Diluted Earnings Per Shareof Common Stock . . . . . . . . . . . . . .29 .29 .34 .35 .90 .89 .43 1.96
Cash Dividends Per CommonShare . . . . . . . . . . . . . . . . . . . . . . . $ .25 $ .25 $ .25 $ .25 $ .25 $ .25 $ .25 $ 1.00
B-146

2004
FirstQuarter
SecondQuarter
ThirdQuarter
FourthQuarter
PreviouslyReported
AsRestated
PreviouslyReported
AsRestated
PreviouslyReported
AsRestated
PreviouslyReported
AsRestated Total
(In millions, except per share data)Total Operating
Revenue . . . . . . . . . $1,764.1 $1,769.8 $1,691.5 $1,691.7 $2,046.5 $2,043.2 $1,719.7 $1,718.4 $7,223.1Total Operating
Expenses . . . . . . . . . 1,613.6 1,616.0 1,461.0(j) 1,469.7(j) 1,767.0 1,769.3 1,604.5 1,596.0 6,451.0Operating Income . . . . 150.5 153.8 230.5 222.0 279.5 273.9 115.2 122.4 772.1Other Expenses . . . . . . (87.2) (87.6) (80.6)(h) (81.2)(h) (96.3)(i) (94.9)(i) (76.9) (77.7) (341.4)Preferred Stock
DividendRequirements ofSubsidiaries . . . . . . . .7 .7 .8 .8 .7 .7 .6 .6 2.8
Income Before IncomeTax Expense . . . . . . 62.6 65.5 149.1 140.0 182.5 178.3 37.7 44.1 427.9
Income TaxExpense . . . . . . . . . . 11.4(g) 13.0(g) 58.7 55.5 71.5 68.6 31.6(k) 30.2(k) 167.3
Net Income . . . . . . . . . 51.2 52.5 90.4 84.5 111.0 109.7 6.1 13.9 260.6Basic and Diluted
Earnings Per Shareof CommonStock . . . . . . . . . . . . .30 .31 .53 .49 .64 .63 .03 .07 1.48
Cash Dividends PerCommon Share . . . . $ .25 $ .25 $ .25 $ .25 $ .25 $ .25 $ .25 $ .25 $ 1.00
(a) Relates to ACE’s electric distribution rate case settlement that was accounted for in the first quarter of 2005. This resulted in ACE’sreversal of $9.0 million in after tax accruals related to certain deferred costs that are now deemed recoverable. This amount is classifiedas an extraordinary gain since the original accrual was part of an extraordinary charge in conjunction with the accounting for competitiverestructuring in 1999.
(b) Includes $8.3 million in income tax expense related to the mixed service cost issue under IRS Ruling 2005-53.(c) Includes $68.1 million gain ($40.7 million after tax) from sale of non-utility land owned by Pepco at Buzzard Point.(d) Includes $70.5 million ($42.2 million after tax) gain (net of customer sharing) from the settlement of the Pepco TPA Claim and the
Pepco asbestos claim against the Mirant bankruptcy estate.(e) Includes $13.3 million gain ($8.9 million after tax) related to PCI’s liquidation of a financial investment that was written off in 2001.(f) Includes $2.6 million in income tax expense related to the mixed service cost issue under IRS Ruling 2005-53.(g) Includes tax benefit of $13.2 million related to a local jurisdiction’s final consolidated tax return regulations, which are retroactive to
2001.(h) Includes an $11.2 million pre-tax impairment charge ($7.3 million after tax) to reduce the value of PHI’s investment in Starpower
Communications, LLC to $28 million. Also includes $11.2 million pre-tax gain ($6.6 million after tax) from the disposition of a jointventure associated with the Vineland co-generation facility.
(i) Includes $12.8 million pre-tax loss ($7.7 million after tax) associated with the prepayment of the debt incurred by Conectiv Bethlehem,LLC.
(j) Includes a $14.7 million pre-tax ($8.6 million after tax) gain from the condemnation settlement associated with the transfer of Vinelanddistribution assets.
(k) Includes a $19.7 million charge related to an IRS Settlement.
(17) SUBSEQUENT EVENTS
On February 9, 2006, certain institutional buyers tentatively agreed to purchase in a private placement $105million of ACE’s senior notes having an interest rate of 5.80% and a term of 30 years. The execution of adefinitive purchase agreement and closing is expected on or about March 15, 2006. The proceeds from the noteswould be used to repay outstanding commercial paper issued by ACE to fund the payment at maturity of $105million in principal amount of various issues of medium-term notes.
On March 1, 2006, Pepco redeemed all outstanding shares of its Serial Preferred Stock of each series, at102% of par, for an aggregate redemption amount of $21.9 million.
B-147

BOARD OF DIRECTORS AND OFFICERS
Directors Officers
Edmund B. Cronin, Jr.3,5
Chairman of the Board,President and ChiefExecutive OfficerWashington Real EstateInvestment TrustRockville, Maryland(Real estate investment trust)
Jack B. Dunn, IV2,5
Chief Executive Officer,President and DirectorFTI Consulting, Inc.Baltimore, Maryland(Consulting)
Terence C. Golden1,5
ChairmanBailey Capital CorporationWashington, D.C.(Private investmentcompany)
George F. MacCormack4,5
Retired Group Vice PresidentDupont
Richard B. McGlynn1,3,4
AttorneyRetired Vice President andGeneral CounselUnited Water Resources, Inc.
Floretta D. McKenzie2,3,4
Senior AdvisorThe American ResearchInstitutes, Inc.Washington, D.C.(Education research)
Lawrence C. Nussdorf1,5
President and ChiefOperating OfficerClark Enterprises, Inc.Bethesda, Maryland(Real estate and construction)
Peter F. O’Malley2,3,4
PresidentAberdeen Creek Corp.Maryland(Private investment andconsulting)
Frank K. Ross1,4
Retired Managing Partner,Washington, D.C. office,KPMG LLP; VisitingProfessor of Accounting,Howard UniversityWashington, D.C.
Pauline A. Schneider2,5
PartnerHunton & WilliamsWashington, D.C.(Law)
William T. Torgerson 3
Vice Chairman and GeneralCounselPepco Holdings, Inc.
Dennis R. Wraase3
Chairman of the Board,President and ChiefExecutive OfficerPepco Holdings, Inc.
Dennis R. WraaseChairman of the Board,President and ChiefExecutive Officer
William T. TorgersonVice Chairman and GeneralCounsel
Thomas S. ShawExecutive Vice President andChief Operating Officer(President and ChiefExecutiveOfficer, Delmarva Power &Light Company)
Joseph M. RigbySenior Vice Presidentand Chief Financial Officer
Beverly L. PerrySenior Vice PresidentGovernment Affairs andPublic Policy
William J. SimSenior Vice President(President andChief Executive Officer,Potomac Electric PowerCompany and Atlantic CityElectric Company)
William H. SpenceSenior Vice President(President, PHI CompetitiveBusinesses)
Ronald K. ClarkVice President and Controller
Kenneth P. CohnVice President andChief Information Officer
Jill R. DownsVice President, CorporateCommunications
Kirk J. EmgeVice President,Legal Services
Paul W. FrielVice President and GeneralAuditor
Ernest L. JenkinsVice President,People Strategy and HumanResources
Anthony J. KamerickVice President andTreasurer
James S. PottsVice President, Safety andEnvironment
Ellen Sheriff RogersVice President, CorporateGovernance, Secretary andAssistant Treasurer
David M. VelazquezVice President, StrategicPlanning
Karen G. AlmquistAssistant Treasurer andAssistant Secretary
Donna J. KinzelAssistant Treasurer
Allen E. WebbAssistant Controller
Kathy A. WhiteAssistant Controller
1 Member of the Audit Committee of which Mr.Nussdorf is Chairman.
2 Member of the Corporate Governance/NominatingCommittee of which Mr. O’Malley is Chairman.
3 Member of the Executive Committee of whichDr. McKenzie is Chairman.
4 Member of the Compensation/Human ResourcesCommittee of which Mr. McGlynn is Chairman.
5 Member of the Finance Committee of which Mr.Golden is Chairman.
B-148

INVESTOR INFORMATION
Fiscal Agents
Common Stock and All Series of Preferred Stock(Atlantic City Electric Company and DelmarvaPower & Light Company)
In writing:American Stock Transfer & Trust Company6201 15th AvenueBrooklyn, NY 11219-9821
By telephone:Toll free 1-866-254-6502
Via e-mail:[email protected]
Inquiries concerning your Pepco Holdings, Inc.shareholdings (such as status of your account, dividendpayments, change of address, lost certificates ortransfer of ownership of shares) or to enroll in thedividend reinvestment plan or direct deposit ofdividends, should be directed to American StockTransfer & Trust Company as listed above.
A copy of Pepco Holdings’ Form 10-K for the yearended December 31, 2005, is available withoutcharge by contacting American Stock Transfer &Trust Company as listed above.
Other InformationFor Historical Stock Prices (Potomac Electric PowerCompany, Conectiv, Delmarva Power & LightCompany and Atlantic Energy), and other PepcoHoldings, Inc. company information, including ourCorporate Governance Guidelines, Corporate BusinessPolicies (which in their totality constitute our code ofbusiness conduct and ethics) and Board CommitteeCharters, please visit our Web site atwww.pepcoholdings.com
To exchange Potomac Electric Power Company orConectiv common stock certificates for PepcoHoldings, Inc. stock certificates, contact AmericanStock Transfer & Trust Company as listed in the leftcolumn.
Pepco Holdings, Inc. Notes, Potomac ElectricPower Company Bonds, and Atlantic City ElectricCompany Bonds
In writing:The Bank of New YorkP. O. Box 11265Church Street StationNew York, NY 10286
By telephone:Toll Free: 1-800-548-5075
Delmarva Power & Light Company Bonds
In writing:JP Morgan Chase BankInstitutional Trust Service4 New York Plaza, 15th FloorNew York, NY 10004
By telephone:Toll free 1-800-275-2048
Investor Relations ContactDonna J. Kinzel, Director, Investor RelationsTelephone: 302-429-3004E-mail: [email protected] York Stock Exchange Ticker Symbol: POM
Pepco Holdings, Inc. filed its annual CEOCertification with the New York Stock Exchange onJune 9, 2005, and filed its annual CEO and CFOCertifications required by Section 302 of theSarbanes-Oxley Act of 2002 as exhibits to its AnnualReport on Form 10-K filed with the Securities andExchange Commission on March 13, 2006.
Stock Market Information
2005 High Low Dividend 2004 High Low Dividend1st Quarter $23.25 $20.26 $.25 1st Quarter $21.71 $19.08 $.252nd Quarter $24.20 $20.50 $.25 2nd Quarter $20.70 $16.94 $.253rd Quarter $24.46 $21.87 $.25 3rd Quarter $20.70 $17.90 $.254th Quarter $23.89 $20.36 $.25 4th Quarter $21.68 $19.88 $.25(Close on December 30, 2005: $22.37) (Close on December 31, 2004: $21.32)Number of Shareholders at December 30, 2005: 73,154
B-149

Printed on recycled paper.
Related Documents