PHEV Battery Cost Assessment Kevin G. Gallagher, Dennis Dees and Paul Nelson Chemical Sciences and Engineering Division May 9-13 th , 2011 Vehicle Technologies Program Annual Merit Review and Peer Evaluation Meeting Washington D.C. Project ID# ES111 This presentation does not contain any proprietary, confidential, or otherwise restricted information

Welcome message from author
This document is posted to help you gain knowledge. Please leave a comment to let me know what you think about it! Share it to your friends and learn new things together.
Transcript

PHEV Battery Cost Assessment
Kevin G. Gallagher, Dennis Dees and Paul NelsonChemical Sciences and Engineering Division
May 9-13th, 2011
Vehicle Technologies Program Annual Merit Review
and Peer Evaluation Meeting
Washington D.C. Project ID# ES111
This presentation does not contain any proprietary, confidential, or otherwise restricted information

Vehicle Technologies Program
2
Overview
Timeline
Start: August 2010
Finish: September 2014
~20% Complete
Budget
Total project funding
– 100% DOE
FY2010: $300K
FY2011: $300K
Barriers
Development of a PHEV40 with a maximum price of $3,400 at 100k units/yr, weighing less than 120 kg, and being smaller in size than 80 L.– Calculating total battery mass, volume,
& cost from individual components
– Predicting methods & materials that enable manufacturers to reach goals
Partners (Collaborators)
Ira Bloom, Argonne
Dan Santini, Argonne
Vehicle Technologies Program
3
Project Objectives, Milestones & Approach
The objective of this task is to develop and utilize efficientsimulation and design tools for Li-ion batteries to predict:– Precise overall (and component) mass and dimensions
– Cost and performance characteristics
– Battery pack values from bench-scale results
Milestones for this year– Fully integrate single spreadsheet-model to predict battery pack price
to OEM for PHEVs (first version completed)
– Document methodology and assumptions feeding into design and cost model to support distribution (completed and under peer-review)
– Initiate model of advanced Li-ion electrochemical couples (completed)
Our approach is to design a battery based on power and energy requirements for a specific cell chemistry, feeding into a cost calculation that accounts for materials & processes required

Vehicle Technologies Program
4
Major Technical Accomplishments & Progress
Development of enhanced area-specific impedance (ASI) calculation to account for physical limitations in performance
Fully integrated model to design and predict high volume costs for PHEVs, as well as HEVs & EVs, based on user defined requirements (pack voltage, power, efficiency, cell chemistry)
Documented design and cost calculation methodology to support peer-review and free & open distribution of Li-ion battery design and cost model
Initiated battery performance and cost calculations for advanced Li-ion electrochemical couples (LMR-NMC, LNMO, Gr-Si composite)

Vehicle Technologies Program
5
Approach
Builds off of foundation of work by Paul Nelson at Argonne
Designs Li-ion battery and required manufacturing facility based on user defined performance specifications for an assumed cell, module, and pack format– Power, energy, efficiency, cell chemistry, production volume
Calculates the price to original equipment manufacturer (OEM) for the battery pack produced in the year 2020– Not modeling the cost of today’s batteries but those produced by
successful companies operating in 2020
– Some advances have been assumed while most processes are similar to well-established high-volume manufacturing practices
Coupling design and cost allows the user to quantify the impact of underlying properties on the total battery pack cost (cell chemistry, parallel cells, electrode thickness limits, P/E)

Vehicle Technologies Program
6
Assumed battery format
Assuming a battery format allows for the direct calculation of all components that comprise the unit
Previous efforts were based on flat-wound and cylindrical cells
Our assumed format is most likely not the best design, however those successful in producing batteries in the year 2020 will reach similar energy densities and costs through other means
Stiff pouch cells
Sealed in modules
Cooling of module walls
Terminal Seal
Polymer Seal of Cell Container
to Terminal
Ultrasonic Weldsof Terminal to Collector Foils
Cell Cross-Section Battery Module
Double-Seamed Module Closure
Heat Transfer Surfaces on Top and Bottom of Container in Contact with Cell Edge Seals
Cell Terminal Connections
Cell with Stiff, Multi-Layer Container
Polymer Edge Seal

Vehicle Technologies Program
7
Battery design calculations
Iterative SpreadsheetDetermines cell properties
1. Cell capacity2. Cell area3. Electrode thickness4. Internal resistance
And designs battery pack
Pack Requirements• Power• Energy or range• # of cells• Fade over lifetime
Cell ChemistryMeasured Properties• Pulse Power ASI• Discharge ASI• mAh/g, mAh/L• Electrode porosity• SOC window• Physical propertiesASI = area specific impedance
Key Constraints• Max electrode thickness• Target cell potential, V, at
peak power• Assumed cell/module format
Calculated BatteryProperties• Volume and weight• Specific energy, power• Materials required

Vehicle Technologies Program
8
Battery cost calculations
Key input values• Active material costs• Production volume• Baseline plant
• Designed for 100k/yr• Operation in 2020
• Costs derived from discussions with industry, publications, and engineering estimations
Calculated BatteryProperties• Volume and weight• Specific energy, power• Materials required
Shipping
Cell and Scrap
Recycling
Receiving
Control Laboratory
Baseline Lithium-Ion Battery Manufacturing Plant Schematic Diagram 100,000 battery NCA-Gr packs per year, 50-kW battery power, 40-Ah capacity, 60 cells per battery
Operating year: 300 days with three 8-hr shifts per day (two shifts for receiving and shipping)
Assembly Route
The areas in this diagram for each processing step are approximately proportional to the estimated plant areas in the baseline plant.
Battery Pack Assembly
and TestingModule
Assembly Formation Cycling
Current Collector Welding
Enclosing Cell in
Container
Electrolyte Fillingand Cell Closing
Cell Stacking
Solvent Evaporation
Positive
Negative
Electrode CoatingPositive
Negative
Electrode Slitting
Vacuum Drying
Electrode Materials Preparation
Positive
Negative Calendering
Solvent Recovery
Air Locks
Charge-Retention Testing
Final Cell
Sealing
Dry Room
Materials Handling
Outdoor dry-room air processing equipment
Battery Pack Price to OEM• Materials & purchased items• Individual process steps• Overhead, depreciation, etc• Warranty
p
CostCost
=
00 Rate Processing
Rate Processing

Vehicle Technologies Program
9
Materials
Purchased Items
Direct Labor
Variable Overhead
GSA
R & D
Depreciation
Profit
Warranty
0 500 1000 1500 200055.6%60.5%
Contribution to battery pack unit cost ($)
Capacity x2 Power x2 Baseline
63.4%
Variation from baseline plant
Model accounts for changes in materials and processing costs
Examine simple changes to baseline battery and plant– 2x power (50 to 100kW) increases cost 26%
– 2x capacity (40 to 80 Ah) increases cost 46%
Positive Active Material
Negative Active Material
Carbon and Binders
Aluminum Foil
Copper Foil
Separators
Electrolyte
Cell Hardware
Module Hardware
Jacket & Cooling
0 10 20 30 40
Contribution to materials cost (%)
Capacity x2 Power x2 Baseline
Materials dominate total cost
Materials that scale with area becomemore important at higher P/E ratios
NCA/ Gr, 60 cells, [V/U]=0.8100 µm max electrode thicknessBaseline: 50 kW, 8.7 kWhtot

Vehicle Technologies Program
10
Model Predictions for PHEV40 Goals
Battery packs designed to meet PHEV40 goals– 17 kWh, 40 kW max power achieved at 80 % of open-circuit voltage (OCV)
– 70 % useable capacity, max power measured at 25% SOC
– Battery pack OCV at 50% SOC = 360 ± 15 V (80-144 cells in series)
– 100 µm maximum electrode thickness
Established chemistries: 222-301 $/kWhtotal & 79-165 Wh/kg
Advanced Li-ion: 183-193 $/kWhtotal & 201-218 Wh/kg (early numbers)
NMC-333 = Li1.05(Ni1/3Mn1/3Co1/3)0.95O2 / NMC-441 = Li1.05(Ni4/9Mn4/9Co1/9)0.95O2 / NCA = LiNi0.8Co0.15Al0.05O2
LFP = LiFePO4 / LMO = Li1.06Mn1.94O4 / LNMO = LiNi0.5Mn1.5O4 / LMR-NMC = Li2MnO3·LiMO2 / LTO = Li4Ti5O12
NMC-333 / Gr NMC-441 / Gr NCA / Gr LFP / Gr LMO / Gr LMO / LTO LMR-NMC / Gr LNMO / GrPrice to OEM ($) 4380 3833 4243 4608 3782 5125 3112 3275
$/kWhtotal 258 225 250 271 222 301 183 193$/kWhuseable 368 322 357 387 318 402 262 275
kg 110 103 108 141 133 214 78 93L 65 62 64 90 76 125 50 54
Wh/kg 155 165 158 120 128 79 218 201Wh/L 261 274 265 189 223 136 340 336
Vehicle Technologies Program
11
New Approach to Impedance Calculation
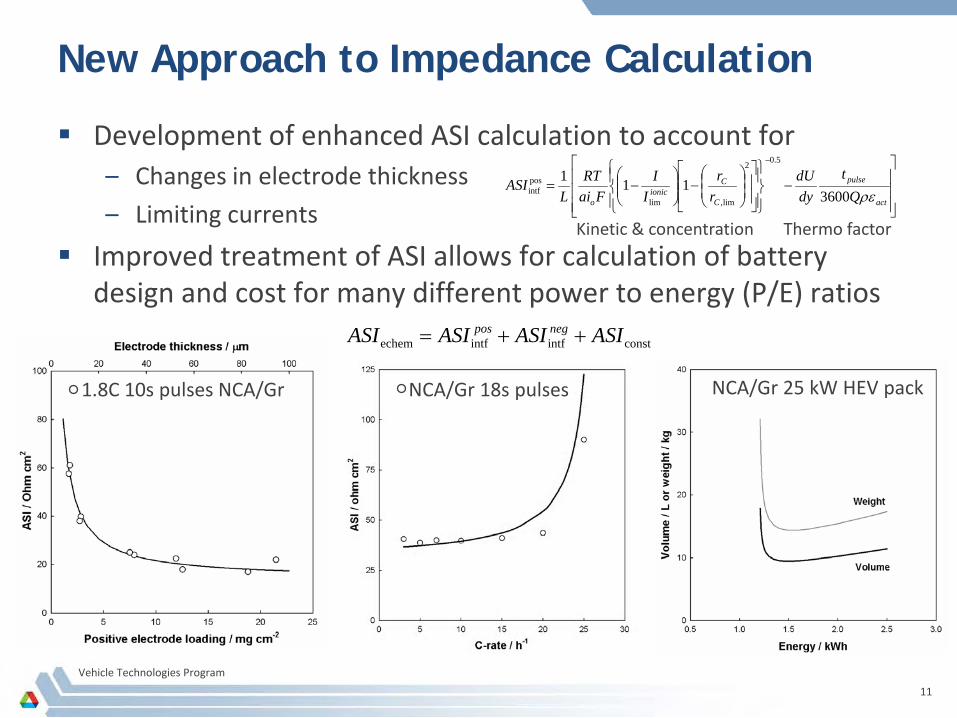
Development of enhanced ASI calculation to account for– Changes in electrode thickness
– Limiting currents
Improved treatment of ASI allows for calculation of battery design and cost for many different power to energy (P/E) ratios
1.8C 10s pulses NCA/Gr NCA/Gr 18s pulses
−
−
−=
act
pulse
C
Cionic
o Qt
dydU
rr
II
FaiRT
LASI
ρε3600111
5.0–2
lim,lim
posintf
NCA/Gr 25 kW HEV pack
Kinetic & concentration Thermo factor
constintfintfechem ASIASIASIASI negpos ++=

Vehicle Technologies Program
12
Model allows design of complete P/E space
Price, mass and volume track together
High P/E ratios (chemistry specific) will cause increase in cost even at low total energy
NMC-333 / Gr, 96 cells, [V/U]=0.8200 µm max electrode thickness
510
15
20
40
60
80
10015002000250030003500
400045005000
55006000
Batte
ry pr
ice to
OEM
($)
Maximum power (kW)
Total energy (kWh)5
10
15
20
40
60
80
10020
40
60
80
100
120
140
160
180
Batte
ry pa
ck m
ass (
kg)
Maximum power (kW)
Total energy (kWh)
Vehicle Technologies Program
13
Reducing Inactive Material Burden
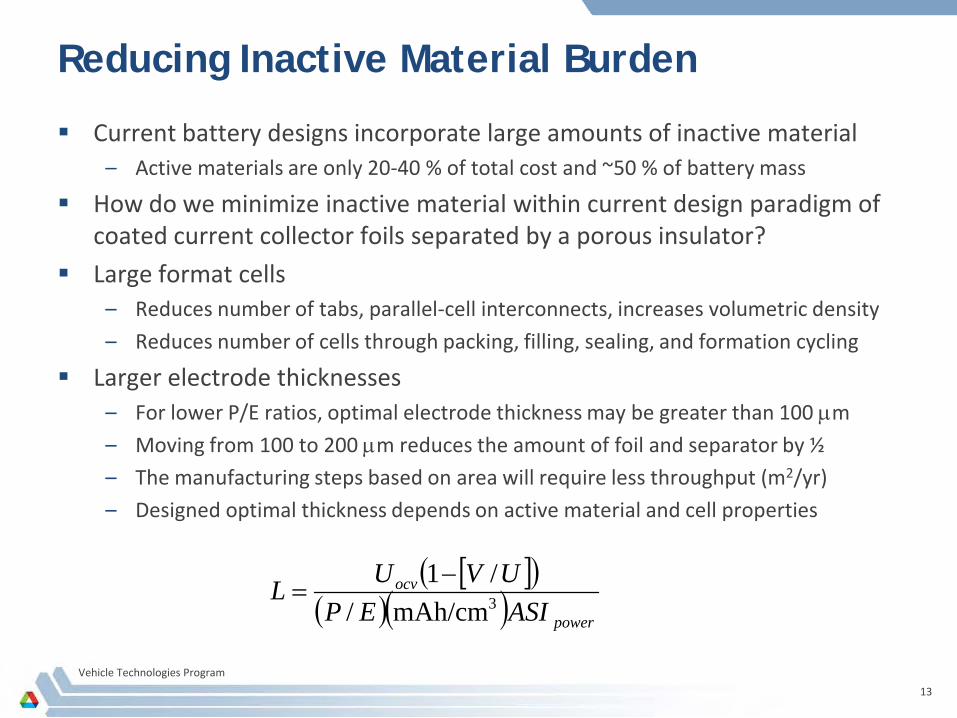
Current battery designs incorporate large amounts of inactive material– Active materials are only 20-40 % of total cost and ~50 % of battery mass
How do we minimize inactive material within current design paradigm of coated current collector foils separated by a porous insulator?
Large format cells– Reduces number of tabs, parallel-cell interconnects, increases volumetric density
– Reduces number of cells through packing, filling, sealing, and formation cycling
Larger electrode thicknesses– For lower P/E ratios, optimal electrode thickness may be greater than 100 µm
– Moving from 100 to 200 µm reduces the amount of foil and separator by ½– The manufacturing steps based on area will require less throughput (m2/yr)
– Designed optimal thickness depends on active material and cell properties
[ ]( )( )( ) power
ocv
ASIEPUVUL 3mAh/cm/
/1−=

Vehicle Technologies Program
14
1 2 3
3200
3600
4000
4400
4800
200 µmmaximum
Batte
ry p
ack
pric
e to
OEM
($)
Number of parallel connected cells
NMC-441 / Gr LMO / Gr
100 µmmaximum
180
200
220
240
260
280
Pric
e pe
r tot
al e
nerg
y ($
/kW
h)
Battery design approaches to lowering cost
Large format cells and large electrode thicknesses reduce the contribution of inactive materials to total cost of PHEV batteries
– $400-500/parallel cell added; <$600 for 100 to 200 µm
Manufacturing & durability issues present challenges to implementation
At higher P/E, only LMO / Gr benefits from allowing thicker electrodes
50 kW, 17kWh, P/E ~3 100 kW, 17kWh, P/E~6
1 2 3
3200
3600
4000
4400
4800
Batte
ry p
ack
pric
e to
OEM
($)
Number of parallel connected cells
NMC-441 / Gr LMO / Gr
180
200
220
240
260
280
Pric
e pe
r tot
al e
nerg
y ($
/kW
h)
Cell Configuration1P-96S 2P-96S 3P-96S
Cell Configuration1P-96S 2P-96S 3P-96S
Capacity, Ah of individual cells increasing
Vehicle Technologies Program
15
Increasing Energy Density to Lower Cost
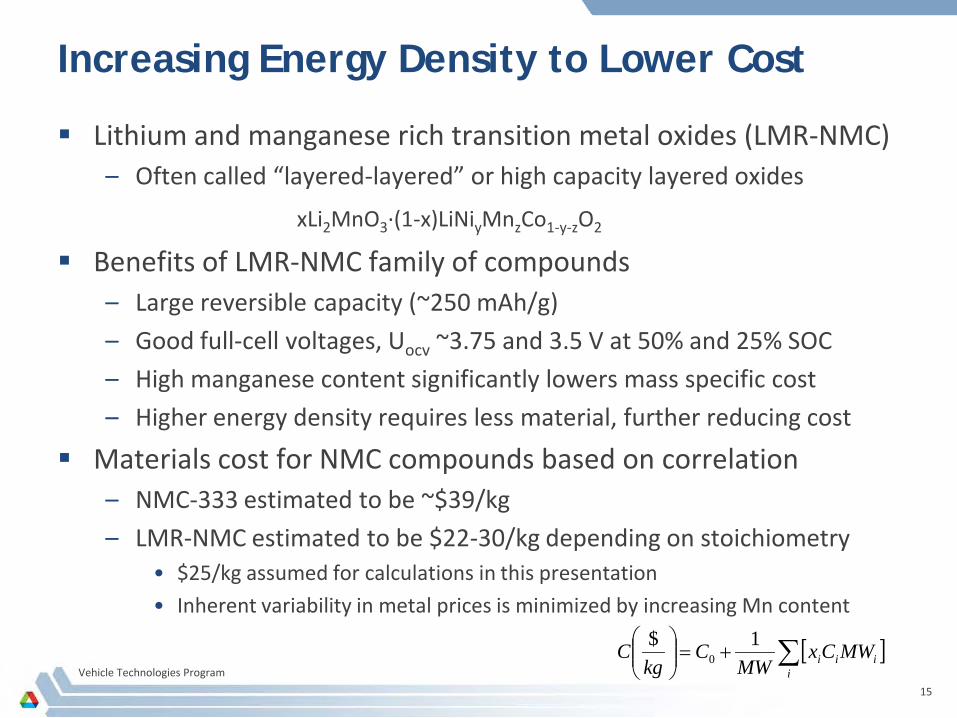
Lithium and manganese rich transition metal oxides (LMR-NMC)– Often called “layered-layered” or high capacity layered oxides
Benefits of LMR-NMC family of compounds– Large reversible capacity (~250 mAh/g)
– Good full-cell voltages, Uocv ~3.75 and 3.5 V at 50% and 25% SOC
– High manganese content significantly lowers mass specific cost
– Higher energy density requires less material, further reducing cost
Materials cost for NMC compounds based on correlation– NMC-333 estimated to be ~$39/kg
– LMR-NMC estimated to be $22-30/kg depending on stoichiometry• $25/kg assumed for calculations in this presentation
• Inherent variability in metal prices is minimized by increasing Mn content
[ ]∑+=
iiii MWCx
MWC
kgC 1$
0
xLi2MnO3·(1-x)LiNiyMnzCo1-y-zO2

Vehicle Technologies Program
16
30 40 50 60 70 80 90 100 110 120
3000
3500
4000
4500
5000
5500
6000
100 kW
85 kW
70 kW
55 kW
Batte
ry p
rice
to O
EM ($
)
Area-specific impedance (Ohm cm2)
40 kW
30 40 50 60 70 80 90 100 110 120
80
90
100
110
120
130
140
Batte
ry m
ass
(kg)
Area-specific imedance (Ohm cm2)
100 kW
85 kW
70 kW
55 kW
40 kW
Relationship between performance & cost
Challenges to implementation– High voltage during activation: 4.6 V vs Li0
– Stability of the material and energy fade over extended cycling
– Low 1st cycle efficiency ~77% (developers now achieving 90 %)
– Large initial ASI at low SOC: What ASI do we need to meet goals?
LMR-NMC / Gr17 kWh100 µm max
DOE GOAL
DOE GOAL

Vehicle Technologies Program
17
2010 2015 2020 202550
100
150
200
250
300
Pric
e pe
r uni
t use
able
ene
rgy
($ k
Wh-1
)
Year
Path Forward for Lithium Based Batteries
2010 2015 2020 2025
100
200
300
400
500
600
700
Usea
ble
ener
gy (W
h kg
-1 o
r Wh
L-1)
Year
Volumetric energy density Gravimetric energy density
UK-HV-HC / Li metal
UK-HV-HC / Gr-Si
Li2MXO4 / Gr-Si
LMR-NMC / Gr-Si
LMR-NMC / Gr
LMO / Gr
Stabilization of silicon Market entry > 2015
Discovery of path to reversible multi-electroncathode material with 4V cell voltageMarket entry > 2017
Discovery of high voltage electrolyte >4.8 VDiscovery of reversible unknown high-voltagehigh-capacity cathode: 250 mAh/g @ 4.8 VMarket entry > 2019
Safe and reversible cycling of Li metalMarket entry >2021
Stabilization of LMR-NMCMarket entry > 2013
If high-risk research is successful, then a 60 % reduction in battery cost and 260 % increase in energy density is possible from materials advances
EV b
atte
ry p
ack
desi
gned
at P
/E =
2.
Pack price to OEM and dimensions do not include components required to integrate battery into vehicle or meet electrical safety standards. Peer reviewed through EPA. Numbers for all materials assume 3-5 years of engineering advances in cell and pack design as compared to 2011.
Vehicle Technologies Program
18
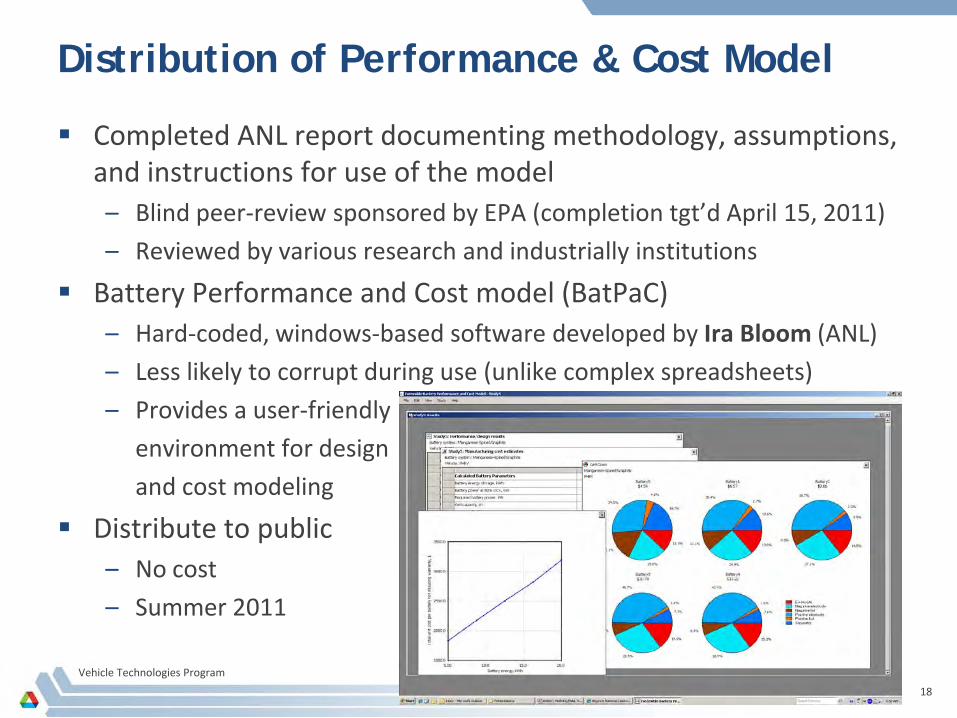
Distribution of Performance & Cost Model
Completed ANL report documenting methodology, assumptions, and instructions for use of the model– Blind peer-review sponsored by EPA (completion tgt’d April 15, 2011)
– Reviewed by various research and industrially institutions
Battery Performance and Cost model (BatPaC)– Hard-coded, windows-based software developed by Ira Bloom (ANL)
– Less likely to corrupt during use (unlike complex spreadsheets)
– Provides a user-friendly
environment for design
and cost modeling
Distribute to public– No cost
– Summer 2011

Vehicle Technologies Program
19
Future Work
Advance thermal management portion of design & cost model– Add liquid-cooled module walls with aluminum plate heat conductors
Distribute model to public (targeting Summer 2011)
Estimate cost reduction from moving to advanced negative and positive electrode active materials
Continuous refinement of model input parameters– Collaborate to identify battery pack integration component costs
• Argonne’s CTR, OEMs
Milestones for next year– Implement initial active thermal management into model
– Publish documentation as Argonne report
– Distribute model openly
– Refine cost behavior of some advanced Li-ion couples (Gr-Si / LMR-NMC and Gr-Si / LNMO)

Vehicle Technologies Program
20
Summary
The objective of this task is to efficiently calculate Li-ion battery pack mass, dimensions, and cost from a specified power & energy requirement
The approach is to design the Li-ion battery and required manufacturing facility based on user defined performance specifications using an assumed cell, module, and pack format
Technical accomplishments– Fully integrated Li-ion design and cost model into single spreadsheet
– Completed documentation of methodology, currently under review
– Demonstrated potential cost reduction from increased electrode thicknesses and large-format pouch cells
– Calculated cost reduction from advanced Li-ion cathode materials and the performance requirements necessary to realize savings
Future plans involve improving thermal management aspect of model, a full release of model to public, and potential savings of moving to advanced Li-ion negative electrodes

Vehicle Technologies Program
21
Acknowledgements & Collaborators
Support for this work from DOE-EERE, Office of Vehicle Technologies is gratefully acknowledged– David Howell & Peter Faguy
Collaborators:
Institutions that have provide some form of review/comments– Ralph Brodd (now at Argonne) reviewed our baseline plant in detail
– EPA: Joe McDonald initiated peer-review
– EPRI: Fritz Kalhammer, Satish Rajagopalan, Haresh Kamath
– Multiple domestic cell manufacturers and a domestic OEM
Argonne National Laboratory– Ira Bloom and Dan Santini
– Khalil Amine, Sun-Ho Kang, Wenquan Lu

Vehicle Technologies Program
22
Support Slides
The following slides are for the use of the Peer Reviewers only and will not be shown as part of the presentation at the Review.

Vehicle Technologies Program
25
Description of Battery Design & Cost Model
Model is largely based off a linear system (Ohm’s law)
Electrode thickness (loading) is calculated from the area-specific impedance (ASI), power-to-energy ratio (P/E), and efficiency
The electrode thickness (loading) determines the separator and electrode area necessary to meet the capacity requirement
The materials and equipment costs are mostly derived from personal communications or engineering estimations – NMC based materials are calculated based off of a correlation
The model scales the capital, labor, & plant area costs based on the level of production compared to the “baseline plant”
The calculation happens in a fraction of a second– Hundreds of battery & plant designs in an afternoon

Vehicle Technologies Program
26
Governing Equations for Battery Design
Assumes a linear system
Defines battery pack voltage at maximum power as a fraction of the open-circuit voltage – [V/U] = battery voltage at Pmax / open-circuit voltage
– Our designs commonly assume [V/U] = 0.8• Allows for moderate power fade, cold-cranking power
• A balance between efficiency & cooling requirements against initial cost
posactpos AQ
CLρε
=
−=
pos
energyEocvcell A
ASICUCNE3,
=
UVUNA
PI
Pocvcellpos
batt
,
( )
−
=
UV
UVUN
PASIA
Pocvcell
battpowerpos
12,
( ) βα+
+=
posLIfASI
Vehicle Technologies Program
27
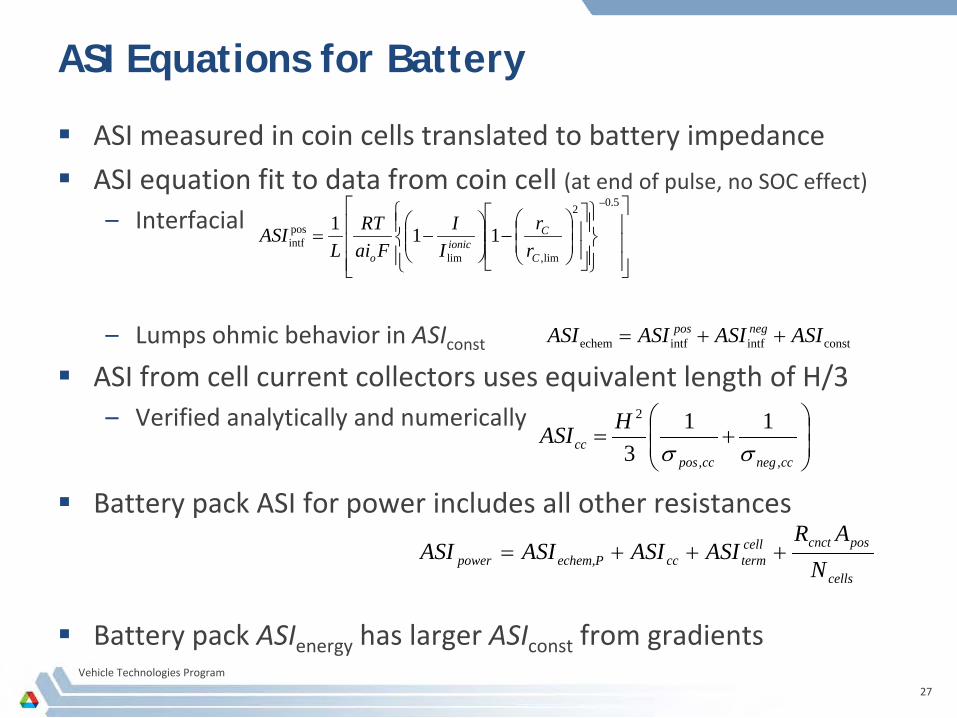
ASI Equations for Battery
ASI measured in coin cells translated to battery impedance
ASI equation fit to data from coin cell (at end of pulse, no SOC effect)
– Interfacial
– Lumps ohmic behavior in ASIconst
ASI from cell current collectors uses equivalent length of H/3– Verified analytically and numerically
Battery pack ASI for power includes all other resistances
Battery pack ASIenergy has larger ASIconst from gradients
−
−=
5.0–2
lim,lim
posintf 111
C
Cionic
o rr
II
FaiRT
LASI
constintfintfechem ASIASIASIASI negpos ++=
cells
poscnctcelltermccechem,Ppower N
ARASIASIASIASI +++=
+=
ccnegccposcc
HASI,,
2 113 σσ

Vehicle Technologies Program
28
Cost Modeling Assumptions
All dollar values are in year 2011 dollars
Manufacturing costs are scaled from the “baseline plant”– PHEV-20 LiNi0.80Co0.15Al0.05O2 vs Graphite (NCA-Gr)
– 8.7 kWhtotal w/ 70% useable, 50 kW at [V/U] = 0.8
– 60 cells connected in series, each 40 Ah in capacity
– 100,000 battery packs produced annually
Each processing step is scaled based on the ratio of the annual processing rates
“p” factors chosen based on perceived sensitivity of process step to changes in required annual rate– Labor factors have low “p” values (0.4-0.5)
– Steps already highly automated tend to have higher “p” values (0.8)• Cell stacking, current collector welding
p
CostCost
=
00 Rate Processing
Rate Processing
Vehicle Technologies Program
29
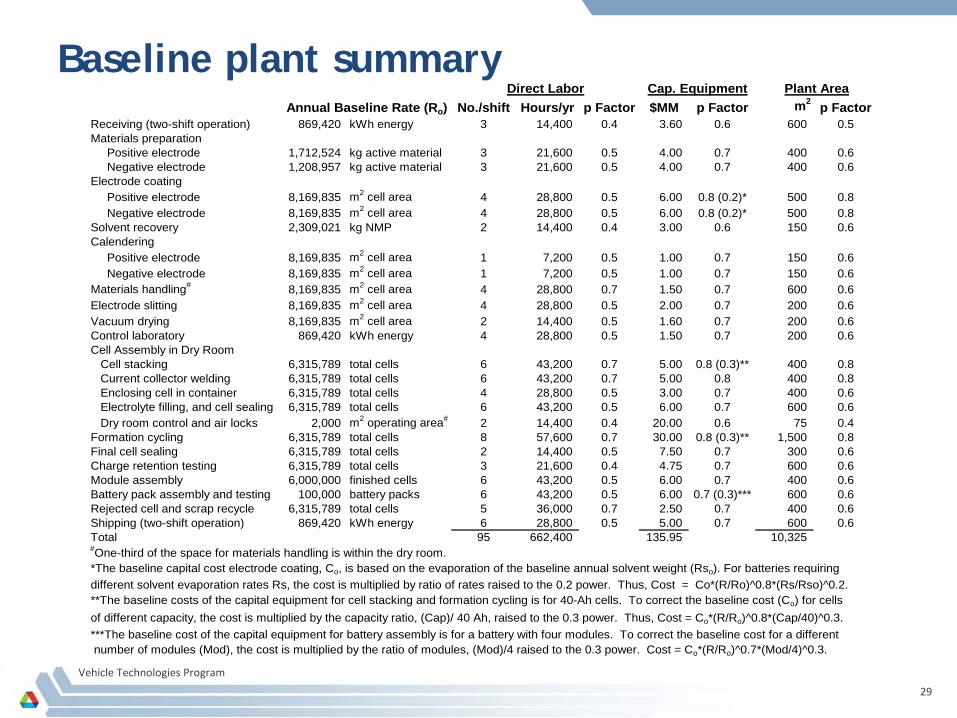
Baseline plant summaryNo./shift Hours/yr p Factor $MM p Factor m2 p Factor
Receiving (two-shift operation) 869,420 kWh energy 3 14,400 0.4 3.60 0.6 600 0.5Materials preparation Positive electrode 1,712,524 kg active material 3 21,600 0.5 4.00 0.7 400 0.6 Negative electrode 1,208,957 kg active material 3 21,600 0.5 4.00 0.7 400 0.6Electrode coating Positive electrode 8,169,835 m2 cell area 4 28,800 0.5 6.00 0.8 (0.2)* 500 0.8 Negative electrode 8,169,835 m2 cell area 4 28,800 0.5 6.00 0.8 (0.2)* 500 0.8Solvent recovery 2,309,021 kg NMP 2 14,400 0.4 3.00 0.6 150 0.6Calendering Positive electrode 8,169,835 m2 cell area 1 7,200 0.5 1.00 0.7 150 0.6 Negative electrode 8,169,835 m2 cell area 1 7,200 0.5 1.00 0.7 150 0.6Materials handling# 8,169,835 m2 cell area 4 28,800 0.7 1.50 0.7 600 0.6Electrode slitting 8,169,835 m2 cell area 4 28,800 0.5 2.00 0.7 200 0.6Vacuum drying 8,169,835 m2 cell area 2 14,400 0.5 1.60 0.7 200 0.6Control laboratory 869,420 kWh energy 4 28,800 0.5 1.50 0.7 200 0.6Cell Assembly in Dry Room Cell stacking 6,315,789 total cells 6 43,200 0.7 5.00 0.8 (0.3)** 400 0.8 Current collector welding 6,315,789 total cells 6 43,200 0.7 5.00 0.8 400 0.8 Enclosing cell in container 6,315,789 total cells 4 28,800 0.5 3.00 0.7 400 0.6 Electrolyte filling, and cell sealing 6,315,789 total cells 6 43,200 0.5 6.00 0.7 600 0.6 Dry room control and air locks 2,000 m2 operating area# 2 14,400 0.4 20.00 0.6 75 0.4Formation cycling 6,315,789 total cells 8 57,600 0.7 30.00 0.8 (0.3)** 1,500 0.8Final cell sealing 6,315,789 total cells 2 14,400 0.5 7.50 0.7 300 0.6Charge retention testing 6,315,789 total cells 3 21,600 0.4 4.75 0.7 600 0.6Module assembly 6,000,000 finished cells 6 43,200 0.5 6.00 0.7 400 0.6Battery pack assembly and testing 100,000 battery packs 6 43,200 0.5 6.00 0.7 (0.3)*** 600 0.6Rejected cell and scrap recycle 6,315,789 total cells 5 36,000 0.7 2.50 0.7 400 0.6Shipping (two-shift operation) 869,420 kWh energy 6 28,800 0.5 5.00 0.7 600 0.6Total 95 662,400 135.95 10,325 #One-third of the space for materials handling is within the dry room.*The baseline capital cost electrode coating, Co, is based on the evaporation of the baseline annual solvent weight (Rso). For batteries requiring different solvent evaporation rates Rs, the cost is multiplied by ratio of rates raised to the 0.2 power. Thus, Cost = Co*(R/Ro)^0.8*(Rs/Rso)^0.2.**The baseline costs of the capital equipment for cell stacking and formation cycling is for 40-Ah cells. To correct the baseline cost (Co) for cells of different capacity, the cost is multiplied by the capacity ratio, (Cap)/ 40 Ah, raised to the 0.3 power. Thus, Cost = Co*(R/Ro)^0.8*(Cap/40)^0.3. ***The baseline cost of the capital equipment for battery assembly is for a battery with four modules. To correct the baseline cost for a different number of modules (Mod), the cost is multiplied by the ratio of modules, (Mod)/4 raised to the 0.3 power. Cost = Co*(R/Ro)^0.7*(Mod/4)^0.3.
Annual Baseline Rate (Ro)Direct Labor Cap. Equipment Plant Area
Vehicle Technologies Program
30
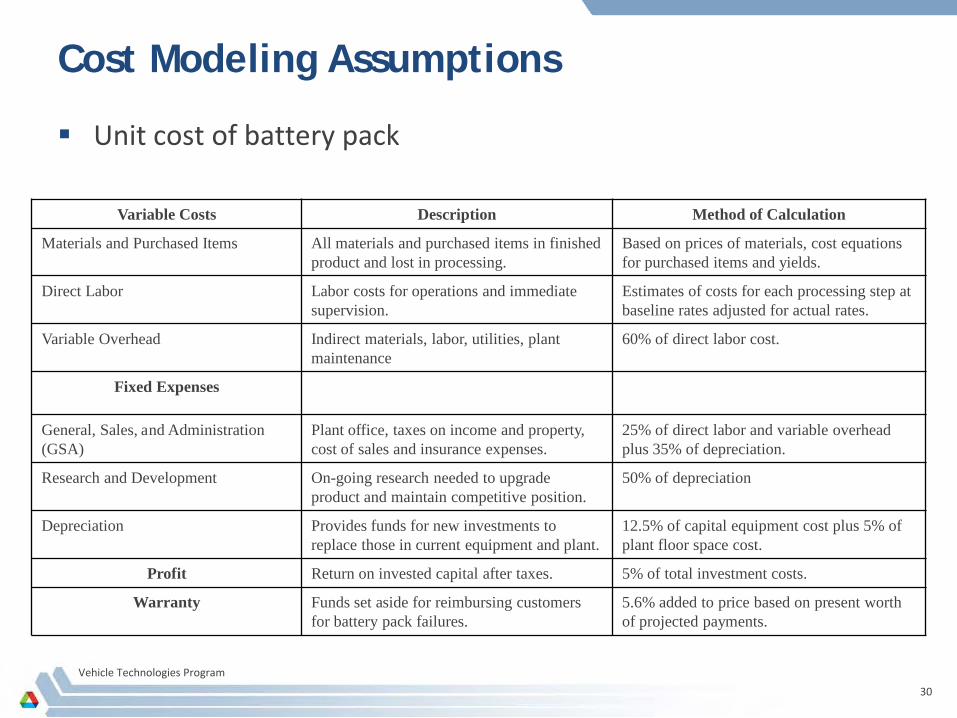
Cost Modeling Assumptions
Unit cost of battery pack
Variable Costs Description Method of Calculation
Materials and Purchased Items All materials and purchased items in finished product and lost in processing.
Based on prices of materials, cost equations for purchased items and yields.
Direct Labor Labor costs for operations and immediate supervision.
Estimates of costs for each processing step at baseline rates adjusted for actual rates.
Variable Overhead Indirect materials, labor, utilities, plant maintenance
60% of direct labor cost.
Fixed Expenses
General, Sales, and Administration (GSA)
Plant office, taxes on income and property, cost of sales and insurance expenses.
25% of direct labor and variable overhead plus 35% of depreciation.
Research and Development On-going research needed to upgrade product and maintain competitive position.
50% of depreciation
Depreciation Provides funds for new investments to replace those in current equipment and plant.
12.5% of capital equipment cost plus 5% of plant floor space cost.
Profit Return on invested capital after taxes. 5% of total investment costs.
Warranty Funds set aside for reimbursing customers for battery pack failures.
5.6% added to price based on present worth of projected payments.

Vehicle Technologies Program
31
Materials costs used in calculations
The cost of Ni, Mn, & Co containing cathode materials based on a correlation to allow calculation for any stoichiometry (cost of metal carbonates in precursor)
[ ]∑+=
iiii MWCx
MWC
kgC 1$
0
ANL TIAXMaterial Chemistry Abbreviation unit 2010 2010Manganese spinel cathode Li1.06Mn1.94O4 LMO $/kg 10 12 - 16 - 205V spinel cathode* LiNi0.5Mn1.5O4 LNMO $/kg 21 -Phospholivine cathode LiFePO4 LFP $/kg 20 15 - 20 -25Layered oxide cathode* LiNi0.80Co0.15Al0.05O2 NCA $/kg 37 34 - 40 - 54Layered oxide cathode* Li1.05(Ni1/3Mn1/3Co1/3)0.95O2 NMC-333 $/kg 39 40 - 45 -53Layered oxide cathode* Li1.05(Ni4/9Mn4/9Co1/9)0.95O2 NMC-441 $/kg 29 -Li & Mn rich layered cathode* xLi2MnO3·(1-x)LiNiyMnzCo1-y-zO2 LMR-NMC $/kg 22-30 24 - 31 - 39Graphite anode C6 Gr $/kg 19 17 - 20 - 23Titanate spinel anode Li4Ti5O12 LTO $/kg 12 9 - 10 - 12Electrolyte 1.2 M LiPF6 in EC:EMC $/kg 19 18.5 - 21.5 -24.5Separator PP/PE/PP $/m2 2 1 - 2.5 -2.9Current collector foil Copper $/m2 3.00 -Current collector foil Aluminum $/m2 0.80 -* The cost of cathode materials using co-precipitation of Ni, Mn, and/or Co are based off of a correlation
Baseline cost, C0 = 16-20 $/kg; CLi2CO3 = $6/kg; CNiSO4 = $5.5/kg; CMnSO4 = $1/kg; CCoSO4 = $32/kg;

Vehicle Technologies Program
32
Model predictions for PHEV40 goals
Battery packs designed to meet PHEV40 goals (200 µm allowed)– 17 kWh, 40 kW at [V/U] = 0.8
– 70 % useable capacity, max power measured at 20% SOC
– Battery pack OCV at 50% SOC = 360 ± 15 V (80-144 cells in series)
– 200 µm maximum electrode thickness
Established chemistries: 188-262 $/kWhtotal & 85-179 Wh/kg
Advanced Li-ion: 169-178 $/kWhtotal & 221 Wh/kg
NMC-333 = Li1.05(Ni1/3Mn1/3Co1/3)0.95O2 / NMC-441 = Li1.05(Ni4/9Mn4/9Co1/9)0.95O2 / NCA = LiNi0.8Co0.15Al0.05O2
LFP = LiFePO4 / LMO = Li1.06Mn1.94O4 / LNMO = LiNi0.5Mn1.5O4 / LMR-NMC = Li2MnO3·LiMO2 / LTO = Li4Ti5O12
NMC-333 / Gr NMC-441 / Gr NCA / Gr LFP / Gr LMO / Gr LMO / LTO LMR-NMC / Gr LNMO / GrPrice to OEM ($) 3970 3407 3812 3921 3204 4448 3025 2867
$/kWhtotal 234 200 224 231 188 262 178 169$/kWhuseable 334 286 320 329 269 349 254 241
kg 102 95 100 128 121 201 77 85L 62 59 61 84 71 117 49 51
Wh/kg 167 179 171 133 140 85 221 201Wh/L 275 290 280 201 238 146 347 336
Related Documents


![A Game Changer PHEV Battery · Drive Session Evaluation with Toyota PHEV Sales price [k-Euro] w/o VAT 12.4-13.4 31.6-37.6 System performance [kW] 40 / 85 (peak) 101 Engine type HICE](https://static.cupdf.com/doc/110x72/6106340ec53e362ab1302e72/a-game-changer-phev-battery-drive-session-evaluation-with-toyota-phev-sales-price.jpg)


